Embed Size (px)
Citation preview
DPRIETI Discussion Paper Series 06-E-014
Employment of MNEs in Japan: New Evidence
KIYOTA KozoRIETI
MATSUURA ToshiyukiRIETI
The Research Institute of Economy, Trade and Industryhttp://www.rieti.go.jp/en/

EMPLOYMENT OF MNEs IN JAPAN: NEW EVIDENCE
RIETI Discussion Paper Series 06-E-014 March 2006
Employment of MNEs in Japan: New Evidence§
Kozo Kiyota†
Yokohama National University and Research Institute of Economy, Trade and Industry (RIETI) Toshiyuki Matsuura‡
Research Institute of Economy, Trade and Industry (RIETI)
Abstract This paper asks two questions. 1) Do multinational enterprises (MNEs) present different patterns of employment from domestic firms? 2) Do workers in MNEs face a higher risk of losing jobs? We distinguish two types of MNEs (i.e., Japanese MNEs and foreign-owned firms) and utilize firm-level data in Japan between 1995 and 2000. It was true that the net job destruction of Japanese MNEs was larger than those of foreign-owned firms and domestic firms. However, this negative employment growth is attributable not to rapid job destruction but to slow job creation. Second, workers in Japanese MNEs and foreign-owned firms did not face a higher risk of losing jobs than did those in domestic firms. This finding contradicts the findings of Barba Navaretti, Turrini, and Checchi (2003) but is consistent with the firm-specific skill hypothesis of Fukao and Otaki (1993). Japanese MNEs and foreign-owned firms might invest heavily in job training, which results in their lower employment volatility. JEL Classification Code: F23 (Multinational Firms), J23 (Job Creation) Keywords: Multinational Firms, Job Creation and Destruction
§ We wish to thank Naohito Abe, Kyouji Fukao, Yuji Hosoya, Keiko Ito, Fukunari Kimura, Hyeog Ug Kwon, Shujiro Urata, Ryuhei Wakasugi, and other seminar participants at Keio University, Hitotsubashi University, and the RIETI for helpful comments on an earlier version of this paper. The usual disclaimer applies. † Faculty of Business Administration, Yokohama National University, 79-4 Tokiwadai, Hodogaya-ku, Yokohama 240-8501, Japan. Tel/Fax: +81-45-339-3770, E-mail: kiyota “at” ynu.ac.jp. ‡ Research Institute of Economy, Trade and Industry (RIETI), 11th floor, Annex, Ministry of Economy, Trade and Industry (METI), 1-3-1, Kasumigaseki Chiyoda-ku, Tokyo, 100-8901, Japan. Tel: +81-3-3501-8412, Fax: +81-3- 3-3501-8415, E-mail: matsuura-toshiyuki “at” rieti.go.jp
EMPLOYMENT OF MNEs IN JAPAN: NEW EVIDENCE
1. Introduction
With the rapid expansion of the activities of multinational enterprises (MNEs), the importance of employment of MNEs is well recognized. There are two major concerns. One is the effect of offshore production on domestic employment, which has often been argued to be negative. This is because offshore production by an MNE replaces domestic production, which shifts its downward-sloping labor demand schedule and so employment offered by the MNE declines in the home country.
Theoretically, however, the effects of offshore production on domestic employment can be both positive and negative. As Barba Navaretti and Venables (2004, pp. 43–44) suggest, domestic employment declines through horizontal foreign direct investment (FDI) but expands through vertical FDI. Therefore, if a firm conducts both horizontal and vertical FDI at the same time, the effects on employment become ambiguous. The same is true at the aggregate level. Net effects are unclear if some firms conduct vertical FDI while others conduct horizontal FDI. The final economy-wide outcome is an empirical matter.
The other concern is job uncertainty, or employment volatility. It is often argued that MNEs are more likely to have a higher degree of employment volatility than domestic firms. 1 However, if MNEs incur higher training costs for workers to accumulate firm-specific skill than domestic firms, exogenous shocks will be absorbed by the adjustment of working hours and real wages rather than the employment level (Fukao and Otaki, 1993). This in turn implies that MNEs would not like to adjust employment rapidly. Again, we need empirical studies to examine the validity of these two different theoretical predictions.
Note that there are two types of MNEs in a country. One is an MNE that has an affiliate in a foreign country and the other is a foreign-owned firm that has a parent firm in its home country. These two types of firms do not always have the same effects on employment. For instance, the entry of foreign-owned firms is mainly through merger and acquisition (M&A), which is a typical mode of entry to developed countries.2 Thus, the job creation of foreign-owned firms does not necessarily mean the creation of “new jobs” but it simply means that jobs are reallocated from domestic to foreign-owned firms through ownership status change. Besides, it is sometimes believed that foreign-owned firms more rapidly destroy jobs than domestic firms and therefore the
1 Barba Navaretti and Venables (2004) give two reasons why the employment of MNEs could be more volatile than that of domestic firms. First, the degree of exposure to international shocks is higher for MNEs than for domestic firms. Second, since MNEs generally operate many more plants than domestic firms, MNEs have lower costs of relocation of production activities than domestic firms. 2 For more detail, see UNCTAD (2004, pp. 111–114).
1
EMPLOYMENT OF MNEs IN JAPAN: NEW EVIDENCE
employment offered by foreign-owned firms entails higher uncertainty. 3
This paper empirically addresses these concerns by asking the following questions. First, do MNEs destroy jobs at home and create jobs abroad? Second, do workers in MNEs face a higher risk of losing their jobs? In order to answer these questions, we use large-scale firm-level panel data in Japan for 1995–2002. Our data consist of firms in manufacturing and wholesale/retail trade industries and the number of firms exceeds 16,000 annually.
This paper brings together and contributes to three literatures. The first literature includes the paper by Brainard and Riker (1997) who examined the effects of offshore production by U.S. MNEs on the U.S. parent employment. Our new contribution is that we examine the employment patterns of the Japanese MNEs that have production sites in foreign countries, foreign-owned firms, and domestic firms at the same time and clarify how the employment patterns of MNEs are different from domestic firms.
The second literature investigated the employment volatility of MNEs. Two different hypotheses exist. One predicts that employment volatility is higher for MNEs than for domestic firms and is found in Barba Navaretti, Turrini, and Checchi (2003). Using firm-level data in 11 European countries, they found that employment adjustment was significantly faster in foreign-owned firms than in domestic firms. The other predicts that employment volatility is lower for MNEs than for domestic firms because of firm-specific skill accumulation, as suggested by Fukao and Otaki (1993). We address this issue in Japan, thus contributing to the literature by adding another national perspective to available evidence.
The third literature is job creation and destruction in Japan and is found in Genda (1998) and Higuchi (2001). Our new contribution is the latest update of these studies and covers the period after 1998. In Japan, job destruction by MNEs is a great concern for policy makers with the expansion of Japanese MNEs’ activities in the 1990s. Figure 1 presents the unemployment rate from 1955 to 2005. It clearly indicates that the unemployment rate was historically low until 1995. Except in 1987, the unemployment rate is less than 3.0 percent from 1955 to 1994. However, after the bubble-burst period, the unemployment rate steadily rose and exceeded 3.0 percent in 1995. Japan faced a severe financial crisis in 1997. Accordingly, the unemployment rate rapidly increased from 3.5 percent in January 1998 to 4.1 percent in July 1998. It continued to rise and exceeded 5.0 percent in July 2001. In June 2002, the unemployment rate reached 5.5 percent, which is the highest rate in the past 50 years.
=== Figure 1 ===
3 “Strictly businesslike. That’s the way Japanese view foreign-affiliated firms when it comes to corporate restructuring,” The Japan Times Online, February 9th, 2002. (Article by Tetsushi Kajimoto, “Foreign firms draw both keen, reluctant Japanese.”)
2
EMPLOYMENT OF MNEs IN JAPAN: NEW EVIDENCE
Several factors raised the unemployment rate. Among them, offshore production by MNEs, especially the production in East Asia, is believed to be one of the most important factors.4 Rapid economic growth of East Asian countries attracts Japanese FDI and, therefore, Japanese MNEs relocate production plants from Japan to East Asian countries such as China. Accordingly, this causes “hollowing out” of industries, which results in the decline of employment in Japan. Note that the concern about “hollowing out” of industries is not limited to Japan, and is often discussed in several developed countries.5 Indeed, the employment response to the expansion of MNEs’ activities is commonly an important issue in developed countries.
The organization of this paper is as follows. The next section discusses the data used for the analysis and provides an overview of the employment patterns for Japanese MNEs, foreign-owned firms, and domestic firms. Section 3 asks whether MNEs destroy jobs in home and host countries and examines the job creation and destruction patterns of Japanese MNEs and foreign-owned firms. Section 4 estimates the speed of employment adjustment in order to answer whether workers in MNEs face a higher risk of losing jobs. Section 5 summarizes the major findings and discusses policy implications.
2. The Data 2.1. Source
We use the micro database of Kigyou Katsudou Kihon Chousa Houkokusho (The Results of the Basic Survey of Japanese Business Structure and Activities) prepared annually by the Research and Statistics Department, METI (1994–2002) (hereafter, referred to as the METI database). This survey was first conducted in 1991, then in 1994, and annually afterwards. The main purpose of the survey is to capture statistically the overall picture of Japanese corporate firms in light of their activity diversification, globalization, and strategies on research and development and information technology. The strength of the survey is its sample coverage and reliability of information. The survey includes all firms with more than 50 employees and with capital of more than 30 million yen.
The survey covers mining, manufacturing, and service industries, although some services industries, such as finance, insurance, and software services, are not included. Our study thus can address the issues of outward FDI by manufacturing firms and the inward FDI by foreign firms in wholesale/retail trade, which are commonly observed FDI patterns in developed countries. The limitation of the survey is that some
4 Fukao and Amano (2004, pp. 80–87) provide a survey on this issue. Cowling and Tomlinson (2000) also discuss the negative effects of offshore production by Japanese MNEs on domestic employment in the 1990s. 5 See, for instance, Feinberg and Keane (2001) for the case of Canada, and Barry (2004) for the case of Ireland.
3
EMPLOYMENT OF MNEs IN JAPAN: NEW EVIDENCE
information on financial and institutional features, such as keiretsu, are not available and small firms with less than 50 workers (or with capital of less than 30 million yen) are excluded.
From these surveys, we constructed a longitudinal (panel) data set for the years from 1995 to 2002. We removed firms from our sample if firm age (questionnaire-level year minus establishment year), total wages, tangible assets, value-added (sales minus purchases), or employment were not positive and responses were incomplete.6 We focus on manufacturing and wholesale and retail industries since the number of firms in other industries is rather small. The number of firms exceeds 16,000 annually.
In our study, we classify multinational firms into two categories. One is the foreign-owned firm, which is defined as a firm with more than 33.3 percent of the equity coming from foreign investors. The other is the Japanese MNE, which is defined as a firm with at least one production affiliate in foreign country.7 All other Japanese firms are classified as domestic firms.
2.2. Employment Growth
Table 1 presents the employment growth of all firms, Japanese MNEs, foreign-owned firms, and domestic firms from 1995 to 2002. The employment growth of all firms indicates similar patterns to the unemployment rate in Figure 1. The negative employment growth is much larger for 1995–1998 than for 1998–2002. The result suggests that the recession became severe after 1998. Note also that the net employment growth rate is different between firm types. Although Japanese MNEs and domestic firms indicate negative growth, foreign-owned firms generally present positive growth throughout the period except for 1995–1996 and 1999–2000.
=== Table 1 ===
Table 2 indicates employment growth by industry.8 There are three messages in this table. First, although overall annual average employment growth is negative (–1.3 percent from 1995 to 2002), there are some differences between manufacturing and wholesale/retail trade. While the manufacturing sector shows negative employment growth (–3.1 percent for 1995–2002), the wholesale/retail trade indicates positive growth (1.3 percent for 1995–2002). Positive employment growth is supported by the growth of retail trade, indicating 3.6 percent of the annual average growth rate for 1995–2002. Second, although manufacturing as a whole indicates negative growth, 6 In the METI database, the employment is defined as the number of regular workers that include part-time workers but exclude day workers. 7 If a firm with more than 33.3 percent equity coming from foreign investors has one production affiliate in foreign countries, we classify such firm into foreign-owned firms. 8 For the sectoral distribution of the number of MNEs, foreign-owned firms, and domestic firms, see Table A1. The industry code is assigned to each firm in 1994 or the time of entry.
4
EMPLOYMENT OF MNEs IN JAPAN: NEW EVIDENCE
employment growth rates differ between industries. For instance, non-metallic mineral products rapidly decline, indicating an annual average growth rate of –5.0 percent for 1995–2002. On the other hand, precision machinery declines slowly, presenting a –0.9 percent average annual growth rate. These results imply that industry could be one factor explaining the difference in employment growth between firms.
=== Table 2 ===
Finally, and most importantly, the employment change is quite different across firm types. While MNEs and domestic firms indicate negative employment growth in almost all industries, foreign-owned firms present positive employment growth in many industries. The remarkable employment growth of foreign-owned firms is confirmed in transportation machinery and retail trade, presenting 20.2 and 21.0 percent annual average growth rates, respectively.
3. Gross and Net Job Flows of MNEs 3.1. Job Creation and Job Destruction 3.1.1. Methodology
This section investigates how patterns of job creation and destruction compare between Japanese MNEs, foreign-owned firms, and domestic firms. The analysis of job creation and destruction is particularly useful for examining gross job flows. Net job flows, which are defined as job creation plus destruction, mask several facts. For instance, if “hollowing out” by Japanese MNEs is proceeding, the difference between Japanese MNEs and domestic firms must be apparent mainly in job destruction: Japanese MNEs must have a higher job destruction rate than domestic firms. In addition, when the net job growth is negative, the job destruction effects cancel out job creation effects. Thus, we may underestimate the contribution of MNEs to job creation without examining job creation and destruction at the same time.
Several studies, such as Dunne, Roberts, and Samuelson (1989) and Davis, Haltiwanger, and Schuh (1996), have confirmed that gross job flows, which are defined as job creation plus destruction, are substantially larger than net job flows, which are defined as job creation minus destruction. Levinsohn (1999) extended this analytical framework to examine the relationship between international trade orientation and gross job flows. Levinsohn (1999) found that, in Chile, trade liberalization promoted job reallocation in the job market. Following Levinsohn (1999), we adopt the analytical framework of Davis, Haltiwanger, and Schuh (1996) and apply the framework to examine job creation and job destruction by multinationals.
Denote as the employment of firm i of firm type sitL Ss∈ in year . Firm type
is classified into three groups: Japanese MNEs JM , foreign-owned firms FF , and
t
5
EMPLOYMENT OF MNEs IN JAPAN: NEW EVIDENCE
domestic firms DF . Denote the symbol Δ as the first-difference operator from year
to year t . Define firm-level growth rate as 1−t sit
sit
sit LLg /Δ= , where s
itL is the average
of employment of firm i between year 1−t and year t : 2/)( 1sit
sit
sit LLL −+= . Similarly,
we denote the average of employment of firm type s from year to year : 1−t t
2/)( st
st LLL +=
=Si
sit
stC
1st− .
Gross job creation and destruction by firm type between year and
year are and
stC s
tD s 1−t
t ∑ +∈ΔL ∑ −∈
Δ=Si
sit
st LD , where superscript + and – mean a
subset of firms of firm type s that create or destroy employment, respectively. Denote gross job creation and destruction rates of firm type s , which are defined as size-
weighted sums of firm-level growth, as and , respectively. stc s
td
sit
Sist
sit
st
sts
t gLL
LC
c ∑+∈
⎟⎟⎠
⎞⎜⎜⎝
⎛== and s
itgSi
st
sit
st
sts
t LL
LC
d ∑−∈
⎟⎟⎠
⎞⎜⎜⎝
⎛== . (1)
The gross job reallocation rate is st
st dc + and the net job creation rate is . s
tst dc +
3.1.2. Results Basic Facts
Table 3 presents the job creation and destruction rates of Japanese firms from 1995 to 2002. The net job flows, which are defined as job creation rates plus job destruction rates, are the same as the net employment growth rates presented in Table 2: the net job flows of Japanese MNEs, foreign-owned firms, and domestic firms are –3.7 percent, 9.4 percent, and –0.5 percent, respectively. In Table 3, however, we can identify job creation and destruction through status change.
=== Table 3 ===
Three findings stand out from this table. First, job creation rates vary widely among firm types. In particular, the job creation rate of Japanese MNEs is small whereas that of foreign-owned firms is large. The job creation rates of Japanese MNEs, foreign-owned firms, and domestic firms are 2.3 percent, 14.9 percent, and 5.4 percent, respectively.
Note that the largest parts of the job creation rates of Japanese MNEs and
6

EMPLOYMENT OF MNEs IN JAPAN: NEW EVIDENCE
foreign-owned firms are attributable to status change. If we focus on newly created jobs (i.e., job creation rate excluding status change), job creation rates by Japanese MNEs, foreign-owned firms, and domestic firms are 0.8 percent, 2.9 percent, and 4.8 percent, respectively. This implies that MNEs create jobs in host countries and the job creation through M&A is a source of job creation by foreign-owned firms in Japan. In this paper, we focus on the newly created/destroyed jobs; hereafter job creation and destruction excludes those occurring through status change, unless otherwise noted.
Second, the job destruction rate of domestic firms is much larger than that of Japanese MNEs and foreign-owned firms. The job destruction rates of Japanese MNEs, foreign-owned firms, and domestic firms for 1995–2002 are –4.0 percent, –2.8 percent, and –4.9 percent, respectively. This result means that MNEs destroy jobs in their home country but the degree of destruction is smaller than that of domestic firms.
Third, Japanese MNEs present the smallest contribution to the net job creation rate. While the net job creation rate is 0.0 percent for domestic firms and 0.2 percent for foreign-owned firms, it is –3.2 percent for Japanese MNEs.9 Note that Japanese MNEs present a smaller job destruction rate than do domestic firms. Negative employment growth of Japanese MNEs is therefore attributable to slow job creation rather than to rapid job destruction, implying that the job destruction by Japanese MNEs is not severe compared with domestic firms. Alternative threshold level
There may be a concern about the specified threshold level of foreign equity ownership. In the baseline analysis, a foreign-owned firm is defined as a firm where more than 33.3 percent of the equity is from foreign investors. However, there are several Japanese firms that have a large part of the equity owned by foreign investors. For instance, the equity share of foreign investors is 48.1 percent for Sony, 48.7 percent for Fujifilm, and 37.9 percent for Nintendo.10 To check the sensitivity of the threshold level, we redefine a foreign-owned firm as a firm where more than 50.0 percent of the equity is from foreign investors (majority-owned firms).
The right hand side of Table 3 indicates the results when we redefine the foreign-owned firms. The results are generally the same as the results when we define a foreign-owned firm as the firm with more than 33.3 percent of foreign ownership except the
9 Note that foreign-owned firms present a positive net job creation rate (0.2 percent) for 1995–2002, although they present negative net job creation (i.e., job destruction) rates in two subperiods: for 1995–1998 (–1.3 percent) and for 1998–2002 (–1.0 percent). This is caused by status change. For instance, suppose that a domestic firm changes its status to a foreign-owned firm between 1995 and 1998 and destroys jobs between 1998 and 2002. This change is regarded as job destruction by foreign-owned incumbent firms for 1998–2002. However, the change is classified into status change for 1995–2002. Thus, the results for the overall period are not always the same as those for subperiods. 10 Nikkei Newspaper, June 28, 2005. (In Japanese.)
7
EMPLOYMENT OF MNEs IN JAPAN: NEW EVIDENCE
status change of foreign-owned firms. The effects of status change decline when we redefine foreign-owned firms. This implies that status changes are mainly occurred between 33.3 and 50.0 percents of equity share and thus our results are not very sensitive to the threshold level once we exclude the effects of status change. Difference between manufacturing and non-manufacturing
Table 2 confirms that there are clear differences in net job growth between manufacturing and wholesale/retail trade. To investigate the differences in more detail, we calculate job creation and destruction rates for manufacturing and wholesale/retail trade, respectively.
=== Table 4 ===
Table 4 presents the results of job creation and destruction rates in manufacturing and wholesale/retail trade for 1995–2002. Two messages are evident in this table. First, the positive net job flows in wholesale/retail trade for all firms are attributable to the large job creation rate in wholesale/retail trade. Table 4 indicates that job creation rates in manufacturing and wholesale/retail trade are 1.8 percent and 5.8 percent, respectively. On the other hand, the differences in job destruction rates are relatively small, indicating –4.9 percent in manufacturing and –4.5 percent in wholesale/retail trade. The results imply that the positive employment growth rate in wholesale/retail trade is supported by the strong job creation rate.
Second, there are notable differences between firm types in job creation and destruction rates. In all firm types, job creation rates in manufacturing are much smaller than those in wholesale/retail trade. For Japanese MNEs, the job creation rate in manufacturing is 0.6 percent, whereas it is 1.8 percent in wholesale/retail trade. The job creation rate of foreign-owned firms in manufacturing is 1.8 percent, which is much smaller than the 7.0 percent in wholesale/retail trade. Similarly, the job creation rate of domestic firms in wholesale/retail trade is 6.2 percent, which is more than twice the job creation rate of domestic firms in manufacturing.
Job destruction rates are much larger in terms of absolute values in wholesale/retail trade than in manufacturing for foreign-owned firms and vice versa for Japanese MNEs and domestic firms. The job destruction rate of Japanese MNEs is –4.0 percent in manufacturing and –3.7 percent in nonmanufacturing. Similarly, the job destruction rate of domestic firms is –5.4 percent, which is –0.9 percent larger than the job destruction rate in wholesale/retail trade. On the other hand, the job destruction rate of foreign-owned firms is –2.1 percent in manufacturing and –5.2 percent in wholesale/retail trade. Job destruction in manufacturing, therefore, is much more severe in Japanese firms (Japanese MNEs and domestic firms) than in foreign-owned firms.
8
EMPLOYMENT OF MNEs IN JAPAN: NEW EVIDENCE
3.1.3. Discussion This subsection provides more detailed examination on the job creation and destruction, focusing on some specific aspects. Because of the page limits, we summarize the major findings of our analysis. The detailed results are reported in the Appendix A. Firm size
One may concern that the difference of job creation and destruction patterns might be attributable to the firm size rather than the status of firms. To examine the difference of firm size, we examine the job creation and destruction rates for large, medium-sized, and small-sized firms, respectively. The large firm is defined as a firm with more than 1,000 workers. The small-sized firm is a firm with less than 300 workers. Other firms are defined as medium-sized firms.11
Table A3 indicates that firm size as well as multinational status might be an important factor to explain the difference of employment patterns between Japanese MNEs and domestic firms. There is a notable difference of job destruction rates in large firms between Japanese MNEs and domestic firms. On the other hand, the job destruction rate of Japanese MNEs indicates almost the same as that of domestic firms for medium- and small-sized firms. The results imply that the arguments of “hollowing out” of Japanese industries might be based on the difference of the employment patterns between large Japanese MNEs and large domestic firms. Period and industry
It is often pointed out that the employment patterns might be largely affected by periods and industries. We thus examine the job creation and destruction rates by period and by industry. The results are presented in Tables A4 and A5. The main conclusions are summarized as follows. First, the severe recession might have strong effects on the employment of firms. Job destruction rates for 1998–2002 are much larger than those for 1995–1998 regardless of the firm types.
Second, multinational status is an important factor in explaining the employment patterns of firms in Japan, even after controlling for industry-specific factor. The results indicate that the job creation and destruction rates slightly different across sectors even in the same status. However, even after we examined the same industry, the multinational status can explain some of the difference of employment across firms. For instance, in electrical machinery, the job destruction rate of domestic firms is –6.5 percent that is significantly larger than that of Japanese MNEs (–4.6 percent).
11 Table A2 summarizes the number of Japanese MNEs, foreign-owned firms, domestic firms, by firm size.
9

EMPLOYMENT OF MNEs IN JAPAN: NEW EVIDENCE
Effects on production workers An important policy question is whether MNEs destroy production workers’ jobs
more rapidly than nonproduction workers’ jobs. The job destruction by MNEs in the manufacturing sector affects production workers more than the rest of the labor force. This is because the shift of production sites from Japan to foreign countries may cause a stronger decline in demand for production workers than for other workers. The analyses above cannot answer this question, although this question is a great concern for policy makers. We thus further decompose job creation and destruction in manufacturing firms into production and nonproduction workers, and examine the differences between firm types.
Table A6 indicates the results. We found that the net job destruction in production workers was confirmed in all types of firms, with Japanese MNEs presenting higher net job destruction rate than domestic firms. However, the gross job destruction rate for MNEs’ production workers is much smaller than that for domestic firms. These results suggest that the higher job destruction rate by Japanese MNEs is because MNEs do not create many jobs for production workers. 3.2. Net Job Growth of MNEs 3.2.1. Methodology
Previous section examined job creation and destruction rates by firm types. However, employment change may possibly depend on various industry and firm characteristics in addition to firm types. We thus examine the net employment growth controlling for various firm characteristics at the same time, based on the following regression analysis:
,/ 111 itiitFFit
JMitititit ZDDLLg μηλγβα +++++=Δ= −−− (2)
where and are MNE and foreign-owned firm dummies that take value one if
firm is a MNE and foreign-owned firm in year
JMitD 1−
JFitD 1−
i 1−t respectively, is a vector of
control variables such as (observable) firm characteristics,
1−itZ
iη is an unobservable firm
specific effect, and itμ is an error term. The coefficient β thus captures the gap of
employment growth rates between MNEs and domestic firms after controlling for various firm characteristics. Similarly, the coefficient γ represents the gap between foreign-owned firms and domestic firms. If MNEs and foreign-owned firms show much faster job destruction rate than domestic firms, the coefficients β and γ indicate significantly negative signs.
There are two strategies to estimate equation (2): fixed-effect and random-effect
10
EMPLOYMENT OF MNEs IN JAPAN: NEW EVIDENCE
models. In estimating (2), however, a fixed-effect model has a problem. The fixed-effect model identifies the effects of MNE (foreign-owned firm) status only when there are changes in the status during the period. In other words, a firm that is an MNE (or a foreign-owned firm) throughout the period does not have any effects on the estimated coefficient β (γ ). To take into account the effects of a firm that has the same status throughout the period, we employ random-effect model.
In the previous section, we confirmed that firm size, period, and industry might be important factors in explaining the employment patter of firms. We use the natural log of firm size (the number of workers), year dummies, and industry dummies as
control variables . In addition to firm size, we include additional firm
characteristics, capital intensity (capital-labor ratio), firm age, research and development (R&D) intensity (R&D-sales ratio), and average wages, in order to control for the various observable firm characteristics. Firms that switch their multinational status are excluded from the samples so that we can remove the effects of status change.
1−itZ
3.2.2. Results
Table 5 presents the regression results of equation (2) with random-effect model. Two findings stand out from this table. First, Japanese MNEs tend to present much faster net job growth rate in manufacturing while much faster negative growth rate in wholesale and retail trade. The coefficients of Japanese MNE dummy indicate positive and significant signs in manufacturing and negative and significant signs in wholesale and retail trade. Once we controlled for the firm-, period-, and industry-characteristics, Japanese manufacturing MNEs contribute to the employment growth of firms between 1995 and 2002.
=== Table 5 ===
Second, the net employment growth of foreign-owned firms is almost the same as that of domestic firms. Most of the coefficients do not indicate statistically significant signs once we controlled for the various firm characteristics. The results imply that the severe restructuring by foreign-owned firms is not necessarily true once we controlled for the various firm characteristics. These findings are robust even when we redefine a foreign-owned firms the firm with more than 50.0 percent of foreign equity share. 4. Employment Volatility of MNEs 4.1. Baseline Model
This section examines the difference in employment volatility between Japanese MNEs, foreign-owned firms, and domestic firms. To examine the differences, following Barba Navaretti, Turrini, and Checchi (2003), we estimate a dynamic labor demand
11
EMPLOYMENT OF MNEs IN JAPAN: NEW EVIDENCE
function.12 The analytical framework is summarized as follows. Suppose that firm i
produces output in year using labor and capital based on a Cobb–Douglas
production function with the constant returns to scale technology. Denote the prices of
labor and capital as and , respectively. Assume that effective employment of
firm in year is not necessarily the same as desired employment . Assume that
the adjustment process is described as , where
itY t itL itK
Litp K
itp
i t itL *itL
λ)/()/( 1*
11 −−− = itititit LLLL λ indicates the
speed of adjustment )10( ≤≤ λ . Thus, in logarithmic form, the firm-level conditional labor demand is:
,1210 ititititit lpyTrendl εγβββα +++++= − (2)
where Trend is time trend to control for Hicks-neutral technological growth, ,
, , and
itit Ll ln=
itit Yy ln= )/ln( Kit
Litit ppp = itε is an error term. The speed of adjustment is
obtained from the estimated equation: γλ −= 1 . To examine the differences in the speeds of employment adjustment, we
introduce dummy variables to a lagged dependent variable:
, 111222
111000
itFF
ititFFJM
ititJM
itFF
ititFFJM
ititJM
it
FFitit
FFJMitit
JMit
FFit
FFJMit
JMit
DlDllDpDpp
DyDyyDDTrendl
εγγγβββ
ββββββα
+++++++
++++++=
−−−
(3)
where and are dummy variables that take the value one if a firm is a
Japanese MNE and a foreign-owned firm, respectively. The coefficients and
indicate significantly negative signs when Japanese MNEs and foreign-owned firms present faster speeds of adjustment than domestic firms.
JMitD FF
itD
JMγ FFγ
13
Note that a lagged dependent variable is correlated with the error term (even if
we assume that itε is not itself autocorrelated). In order to overcome this problem while
12 A detailed description of the labor adjustment function is found in Hamermesh (1993). 13 The speed of adjustment for Japanese MNEs and foreign-owned firms is obtained from
and , respectively. JMJM γγλ −−= 1 FFFF γγλ −−= 1
12
EMPLOYMENT OF MNEs IN JAPAN: NEW EVIDENCE
also taking into account the initial conditions problem, we resort to using the generalized method of moment (GMM) systems estimator (system-GMM) developed by Blundell and Bond (1998). The system GMM estimator consists of the first differenced and level versions of the estimating equation. The lagged level values are used as instruments for the first differenced equation while the lagged differences are used as the instruments for level equation. The validity of these instruments can be tested using a Hansen test.14
The major data source is the METI database. Labor is defined as the number
of workers. Output is defined as the real value added. The average wage is obtained
from total wages divided by the number of workers. The price of capital is computed following Nishimura, Nakajima, and Kiyota (2005). As employment growth equation, firms that switch their multinational status are excluded from the samples so that we can remove the effects of status change.
itL
itY
4.2. Results
Table 6 presents the estimation results of the speed of employment adjustment in equation (3) generated by the system GMM. 15 We also run regressions with year dummies instead of time trends to control for the demand shocks in this period. The summary statistics of dependent and independent variables are presented in Table B1. The test results perform generally well in wholesale trade and retail trade. Although the Hansen test rejects the null hypothesis that the over-identifying restrictions are valid in manufacturing as a whole, the test does not reject the null hypothesis at the each sectoral level. While it is safe to reject the null hypothesis of no first-order serial correlation in the differenced residuals, it is not possible to reject the null hypothesis of no second-order serial correlation in wholesale and retail trade.
=== Table 6 ===
The major findings are summarized as follows. First, in manufacturing as a whole, there is a statistically significant difference in adjustment speed between MNEs and domestic firms. The speed-of-adjustment is the fastest in domestic firms, relatively fast in Japanese MNEs, and the slowest in foreign-owned firms. The coefficients of
14 System GMM yields consistent estimator under the assumption that there is no second order correlation of the residuals of the first-differenced equation. The standard procedure to verify this assumption is to use an AR(2) test on the residuals developed by Arellano and Bond (1991), which we also implement for our estimates. For more detail about system GMM, see Baltagi (2001, pp.142-144). 15 Other coefficients are reported in Table B2.
13
EMPLOYMENT OF MNEs IN JAPAN: NEW EVIDENCE
1−× itJMit lD indicate statistically significant positive signs, implying that the speed-of-
adjustment is slower for MNEs than for domestic firms. Besides, the speed-of-adjustment of foreign-owned firms is slower than domestic firms and Japanese MNEs,
as the coefficients of are positively significant and much larger than those of
.
1−× itFFit lD
1−× itJMit lD
Second, the results of sectoral breakdowns indicate some but not large differences in the speed of adjustment. The speed-of-adjustment of domestic firms is much faster than those of Japanese MNEs and foreign-owned firms except chemicals. In
chemicals, the coefficients of are not significant although they are positive. 1−× itJMit lD
There may be some concern about the specified threshold level of foreign equity ownership. In the baseline model, a foreign-owned firm is defined as a firm where more than 33.3 percent of the equity is from foreign investors. To check the sensitivity of the threshold level, we redefine a foreign-owned firm as a firm where more than 50.0 percent of the equity is from foreign investors (majority-owned firms). Table B3 presents the estimation results of the speed of employment adjustment and it indicates that the results are almost the same as those of Table 6. Thus, our results are not sensitive to the threshold level of foreign equity.
These results suggest that the workers in MNEs and foreign-owned firms do not necessarily face a higher risk of losing jobs compared with those in domestic firms. Rather, our results support the prediction by Fukao and Otaki (1993). Employment volatility is lower for MNEs than for domestic firms because of firm-specific skill accumulation. This result is not the same as the result found in European firms (Barba Navaretti, Checci, and Turrini, 2003) and may indicate differences between European and Japanese MNEs in employment patterns.16
5. Concluding Remarks
In this paper, we ask two questions. 1) Do multinational enterprises (MNEs) present different patterns of employment from domestic firms? 2) Do workers in MNEs face a higher risk of losing jobs? We distinguish two types of MNEs (i.e., Japanese MNEs and foreign-owned firms) and utilize firm-level data in Japan between 1995 and 2002. Our major findings are as follows. First, the net negative employment growth is observed only for Japanese MNEs. However, the negative growth is not attributable to
16 This result may represent the Japanese specific employment pattern as Ito (1992) pointed out “both blue-collar and white-collar workers in typical Japanese firms are trained more extensively than those in typical US firms” (p.214).
14
EMPLOYMENT OF MNEs IN JAPAN: NEW EVIDENCE
rapid job destruction. Rather, the problem is in slow job creation. Moreover, the negative employment growth of the MNEs is mostly explained by the firm-, period-, and industry-specific factors. Once we controlled for these factors, multinational status indicates the positive contribution to the employment growth in manufacturing.
Second, it is sometimes believed that workers for MNEs and foreign-owned firms face a higher job uncertainty than workers for domestic firms but our results do not support this claim. Our results suggest that employment volatility is much larger for domestic firms than for MNEs and foreign-owned firms, implying that workers in Japanese MNEs and foreign-owned firms did not face a higher risk of losing jobs than did workers in domestic firms. Rather, domestic firms present faster employment adjustment in some industries. This finding contradicts the finding of Barba Navaretti, Turrini, and Checchi (2003) but is consistent with the firm-specific skill hypothesis of Fukao and Otaki (1993). Japanese MNEs and foreign-owned firms might invest heavily in job training, which results in lower employment volatility.
Two implications for policy debate can be drawn from our analysis. First, the recent rise in the unemployment rate might not be attributable to offshore production by Japanese MNEs. It is true that the negative employment growth of Japanese MNEs is much faster than that of domestic firms. However, the job destruction rate of Japanese MNEs is smaller than that of domestic firms. The difference between Japanese MNEs and domestic firms is observed in the job creation rate, which is not explained by the relocation of plants by MNEs from Japan to other countries. Besides, once we control for the firm-, period-, and industry-specific factors, Japanese manufacturing MNEs present significantly faster growth than domestic firms. This in turn implies that there are factors other than “hollowing out” of industries that explain the rise in the unemployment rate after 1998.
Second, the inward FDI promotion policy might have some validity. Foreign-owned firms contributed to the creation of jobs in Japan between 1995 and 2002. The foreign-owned firms created jobs not by new entries but by their M&As. Although they were not newly created jobs, we can at least say that the foreign-owned firms helped by propping up employment in the 1990s. Similar arguments can be applied to other developed countries where FDI through M&A is becoming popular. Fukao and Amano (2004) pointed out that Japan still had entry barriers to foreign-owned firms in some industries such as medical services. The removal of such barriers thus might attract foreign investors.17
Our paper presents various avenues for future research. One important direction is firm-level analysis of the relationship between labor demand and international trade. Various studies examined the effects of international trade on labor demand (e.g., Revenga, 1992, and Slaughter, 2001, for the United States; Levinsohn, 1999, for Chile;
17 See, Fukao and Amano (2004, pp.55-57).
15
EMPLOYMENT OF MNEs IN JAPAN: NEW EVIDENCE
Krishna, Mitra, and Chinoy, 2001, for Turkey; Tomiura, 2003, 2004, for Japan). However, little attention has been paid to firm-level study, and this is an interesting question yet to be addressed.
Another important aspect is the difference in the destination of FDI. The study did not take account of the difference in destination markets but simply asked whether a firm has an affiliate in foreign countries. However, as Eaton, Kortum, and Kramarz (2004) argued in their analysis of the differences in export destination by firms, different market penetration causes different firm behaviors, including labor demand. For instance, it is expected that Japanese MNEs that have an affiliate in China present a different labor demand pattern than the pattern from MNEs that have an affiliate in the United States. Such an analysis requires enormous efforts to construct a new database but it may reveal new regularities of MNEs’ behavior.
It is also important to extend our analysis to examine foreign-owned firms in the services sectors in Japan. The coverage of data in this paper is limited to manufacturing, wholesale trade, and retail trade. However, the foreign-owned firms in Japan are notable in other service sectors such as finance. Since most of the previous related literatures focused on the manufacturing sector, the detailed examination on the activities of foreign-owned firms in services sector provides us useful information. These topics are included in our future research agenda. References Arellano, Manuel and Stephen Bond. 1991. “Some Tests of Specification for Panel
Data: Monte Carlo Evidence and an Application to Employment Equations,” Review of Economic Studies, 58(2): 277-297.
Baltagi, Badi H. Econometric Analysis of Panel Data, 2nd edition, Chichester, UK: John Wiley & Sons.
Barba Navaretti, Giorgio, Daniele Checci, and Alessandro Turrini. 2003. “Adjusting Labor Demand: Multinational versus National Firms: A Cross-European Analysis,” Journal of the European Economic Association, 1(2-3): 708-719.
Barba Navaretti, Giorgio and Anthony J. Venables. 2004 Multinational Firms in the World Economy, Princeton, NJ: Princeton University Press.
Barry, Frank. 2004. “Prospects for Ireland in an Enlarged EU,” The World Economy, 27(6): 829-852.
Blundell, Richard and Stephen Bond. 1998. “Initial Conditions and Moment Restrictions in Dynamic Panel Data Models,” Journal of Econometrics, 87(1): 115-143.
Brainard, S. Lael and David A. Riker. 1997. “Are U.S. Multinationals Exporting U.S. Jobs?” NBER Working Paper, No.5958.
Cowling, Keith and Philip R. Tomlinson. 2000. “The Japanese Crisis: A Case of Strategic Failure?” Economic Journal, 110(464): F358-F381.
16
EMPLOYMENT OF MNEs IN JAPAN: NEW EVIDENCE
Davis, Steven J., John C. Haltiwanger, and Scott Schuh. 1996. Job Creation and Destruction, Cambridge, MA: MIT Press.
Dunne, Timothy, Mark J. Roberts, and Larry Samuelson. 1989. “Plant Turnover and Gross Employment Flows in the U.S. Manufacturing Sector,” Journal of Labor Economics, 7(1): 48-71.
Eaton, Jonathan, Samuel Kortum, and Francis Kramarz. 2004. “Dissecting Trade: Firms, Industries and Export Destinations,” American Economic Review, 94(2): 151-154.
Feinberg, Susan E. and Michael P. Keane. 2001. “U.S.-Canada Trade Liberalization and MNC Production Location,” Review of Economics and Statistics, 83(19) 118-132.
Fukao, Kyoji and Masayuki Otaki. 1993. “Accumulation of Human Capital and the Business Cycle,” Journal of Political Economy, 101(1): 73-99.
Fukao, Kyoji and Tomofumi Amano. 2004. Tainichi Chokusetsu Toshi to Nihon Keizai (Foreign Direct Investment and the Japanese Economy), Tokyo: Nikkei Shinbun-sha. (In Japanese)
Genda, Yuji. 1998. “Job Creation and Destruction in Japan, 1991-1995,” Journal of the Japanese and International Economies, 12(1): 1-23.
Hamermesh, Daniel S. 1993. Labor Demand, Princeton: Princeton University Press. Higuchi, Yosiho. 2001. Koyou to Shitsugyou no Keizaigaku (Economics of Employment
and Unemployment), Tokyo: Nikkei Shinbun-sha. (In Japanese) Ito, Takatoshi. 1992. The Japanese Economy, Cambridge, MA: MIT Press. Krishna, Pravin, Devashish Mitra, and Sajjid Chinoy. 2001. “Trade Liberalization and
Labor Demand Elasticities: Evidence from Turkey,” Journal of International Economics, 55(2): 391-409.
Levinsohn, James R. 1999. “Employment Response to International Liberalization in Chile,” Journal of International Economics, 47(2): 321-344.
Ministry of Economy, Trade and Industry (METI). various years. Kigyou Katsudou Kihon Chousa Houkokusho (the Results of the Basic Survey of Japanese Business Structure and Activities), Tokyo: Shadanhoujin Tsuusan Toukei Kyoukai.
Nishimura, Kiyohiko G., Takanobu Nakajima, and Kozo Kiyota. 2005. “Does the Natural Selection Mechanism Still Work in Severe Recessions? Examination of the Japanese Economy in the 1990s,” Journal of Economic Behavior and Organization, 58(1): 53-78.
Revenga, Ana L. 1992. “Exporting Jobs?: The Impact of Import Competition on Employment and Wages in U.S. Manufacturing,” Quarterly Journal of Economics, 107(1): 255-284.
Slaughter, Matthew J. 2001. “International Trade and Labor-Demand Elasticities,” Journal of International Economics, 54(1): 27-56.
17
EMPLOYMENT OF MNEs IN JAPAN: NEW EVIDENCE
Tomiura, Eiichi. 2003. “The Impact of Import Competition on Japanese Manufacturing Employment,” Journal of the Japanese and International Economies, 17(4): 118-133.
Tomiura, Eiichi. 2004. “Import Competition and Employment in Japan: Plant Startup, Shutdown and Product Changes,” Japanese Economic Review, 55(2): 141-152.
United Nations Conference on Trade and Development (UNCTAD). 2004. World Investment Report 2004: The Shift Towards Services, New York: United Nations.
Appendix. Job Creation and Job Destruction: Differences in Firm Size, Periods, and Industries A1. Difference by Firm Size
Table A3 indicates the job creation and destruction rates, by firm size. Firms that changes their size are includes into entry and exit in this table such that the table does not become complex.18 Therefore, we just focus on the results of incumbent.
=== Table A3 ===
The results suggest that firm size as well as multinational status might be an important factor to explain the difference of employment patterns between Japanese MNEs and domestic firms. For instance, the difference of job destruction rate between Japanese MNEs and domestic firms is particularly notable in large firms. The job destruction rates of large Japanese MNEs and large domestic firms are –2.6 percent and –0.8 percent, respectively. On the other hand, the job destruction rates of medium-sized Japanese MNEs and medium-sized domestic firms are –1.3 percent and –1.0 percent respectively and those of small-sized Japanese MNEs and small-sized domestic firms are –1.1 percent and –1.3 percent respectively. Foreign-owned firms do not present much different job creation and destruction patterns among firm size. These results indicate that arguments of “hollowing out” of Japanese industries might be based on the difference of the employment patterns between large Japanese MNEs and large domestic firms. A2. Difference between 1995-1998 and 1998-2002
As we confirmed in Table 1, the negative employment growth is particularly notable after 1998. Are there any differences of employment patterns between before and after 1998? To answer this question, we calculate the job creation and destruction rates for 1995-1998 and 1998-2002 separately.
=== Table A4 ===
18 For instance, if the employment of firm grows from 950 to 1200, it is included as the exit of medium-sized firm and the entry of large firm.
18
EMPLOYMENT OF MNEs IN JAPAN: NEW EVIDENCE
Table A4 presents the results. Regardless of firm types, job destruction rates for 1998–2002 are much larger than those for 1995–1998. The job destruction rate of Japanese MNEs is –3.2 percent for 1995–1998 and –5.2 percent for 1998–2002. Similarly, the job destruction rates of foreign-owned firms and domestic firms for 1998–2002 are –4.8 percent and –7.2 percent, respectively, which are much larger than those for 1995–1998 (–3.6 percent for foreign-owned firms and –4.6 percent for domestic firms). This result implies that the severe recession between 1998 and 2002 strongly affects the employment of firms in Japan, regardless of the firm type. A3. Difference across Industries
Table 5 indicates that the job creation and destruction rates are different between manufacturing and non-manufacturing. If the job creation and destruction rates indicate large differences across the industries, we also should take into account the industry-specific factors. Table A 5 examined the job creation and destruction rates, by industry in manufacturing. Total of net job flows in Table A5 corresponds to the sectoral employment growth in Table 2.
=== Table A5 ===
The results suggest that the industry-specific factor might play an important role in the employment patterns of firms because the job creation and destruction rates slightly different across sectors even in the same status. For instance, foreign-owned firms indicate 1.9 percent of job creation rate in electrical machinery while 7.8 percent in precision machinery. Note, however, that even after we examined the same industry, the multinational status can explain some of the difference of employment across firms. In electrical machinery, the job destruction rate of Japanese MNEs is –4.6 percent that is significantly higher than that of domestic firms (–6.5 percent). This result suggests that multinational status is an important factor in explaining the employment patterns of firms in Japan, even after controlling for industry-specific factor. A4. Difference between production and nonproduction workers
Table A6 presents the results of job creation and destruction rates for production workers and nonproduction workers from 1995 to 2002. Note that this table is slightly different from Tables 3 and 4. Since the decomposition is at the firm level, the sum of the rows and the sum of the columns become equivalent totals.
=== Table A6 ===
Two messages are drawn from this table. First, net job destruction in production workers is confirmed in all types of firms, with Japanese MNEs presenting higher job net destruction rate than domestic firms. Net growth in employment of production
19
EMPLOYMENT OF MNEs IN JAPAN: NEW EVIDENCE
workers is –2.8 percent for MNEs, –0.4 percent for foreign-owned firms, and –1.6 percent for domestic firms. The result clearly indicates that MNEs destroy production workers’ jobs vis-à-vis foreign-owned firms and domestic firms. It is also notable that foreign-owned firms create jobs for nonproduction workers as the net job creation rate is positive (0.1 percent).
Second, the job destruction rate for MNEs’ production workers is much smaller than that for domestic firms, as the job destruction rate of domestic firms is –3.7 percent whereas that of MNEs is –3.0 percent. Combined with the first finding, we can see that the higher job destruction rate by Japanese MNEs is because MNEs do not create many jobs for production workers. The job creation rate of MNEs is only 0.3 percent. Domestic firms not only destroy jobs but also create jobs for production workers at the same time. Therefore, the net employment growth of production workers becomes smaller for MNEs than for domestic firms.
20

Figure 1. Unemployment Rate in Japan, 1955-2005
Note: Unemployment is seasonally adjusted.Source: Ministry of Internal Affairs and Communication website (2005) Labor Force Survey .http://www.stat.go.jp/data/roudou/longtime/zuhyou/lt01-13.xls
0.0
1.0
2.0
3.0
4.0
5.0
6.019
55
1958
1961
1964
1967
1970
1973
1976
1979
1982
1985
1988
1991
1994
1997
2000
2003
Month/Year
Une
mpl
oym
ent r
ate
(%)
3.1% (March 1987)
3.0% (January 1995)
3.5% (January 1998)
4.1% (July 1998)
5.1% (July 2001)
5.5% (June 2002)
21

Table 1. Employment of Japanese Multinational Enterprises (MNEs), Foreign-owned Firms, and Domestic Firms, 1995-2002
All firms Japanese MNEs Foreign-owned firms Domestic firmsEmployment Growth (%) Employment Growth (%) Employment Growth (%) Employment Growth (%)
1995 7,782 3,073 161 4,5481996 7,744 -0.5 3,045 -0.9 148 -8.5 4,552 0.11997 7,936 2.4 2,959 -2.9 181 20.2 4,796 5.21998 7,860 -1.0 2,872 -3.0 273 40.5 4,715 -1.71999 7,690 -2.2 2,712 -5.7 315 14.4 4,662 -1.12000 7,603 -1.1 2,705 -0.3 295 -6.6 4,603 -1.32001 7,337 -3.6 2,452 -9.8 303 2.5 4,582 -0.52002 7,086 -3.5 2,365 -3.6 320 5.5 4,402 -4.0
Notes: Japanese MNE: A firm that has more than one production affiliate in foreign countries.Foreign-owned firm: A firm where more than 33.3 percent of the equity is owned by foreign investors andthat has more than one production plant in Japan.Domestic firm: A firm other than Japanese MNE or foreign-owned firm.The employment growth includes the employment changes through status change.
Source: METI database.
22
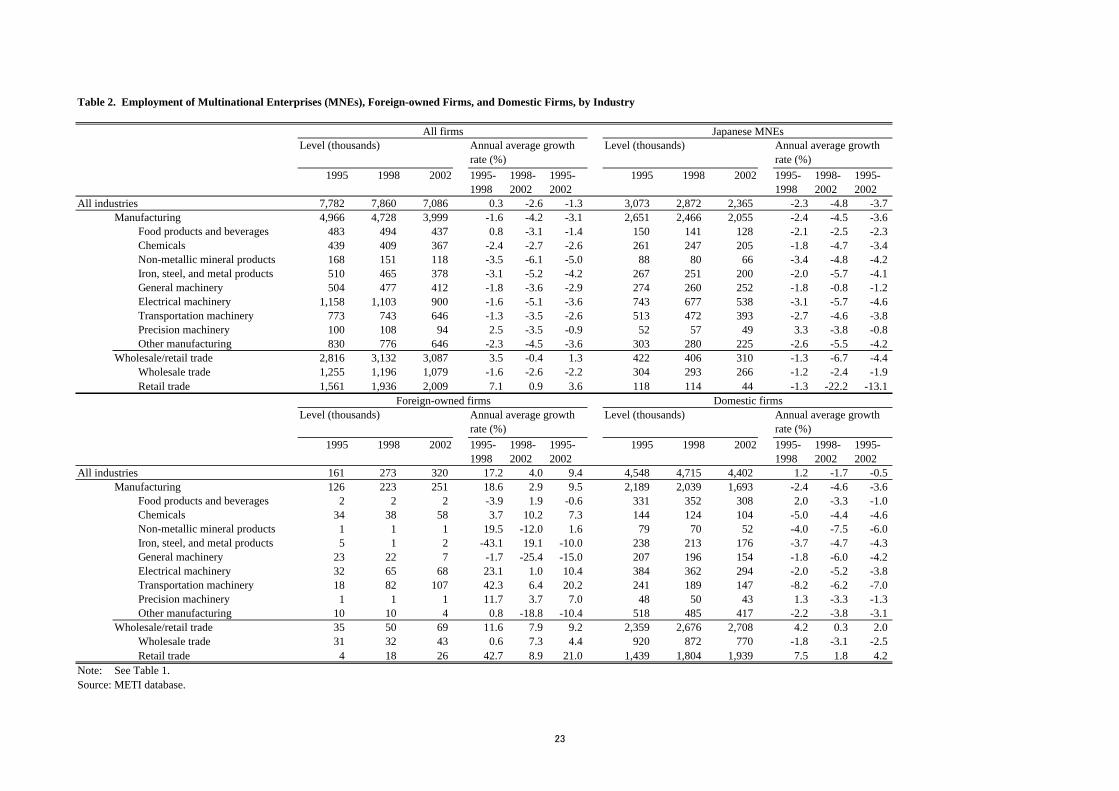
Table 2. Employment of Multinational Enterprises (MNEs), Foreign-owned Firms, and Domestic Firms, by Industry
All firms Japanese MNEsLevel (thousands) Annual average growth
rate (%)Level (thousands) Annual average growth
rate (%)1995 1998 2002 1995-
19981998-2002
1995-2002
1995 1998 2002 1995-1998
1998-2002
1995-2002
All industries 7,782 7,860 7,086 0.3 -2.6 -1.3 3,073 2,872 2,365 -2.3 -4.8 -3.7Manufacturing 4,966 4,728 3,999 -1.6 -4.2 -3.1 2,651 2,466 2,055 -2.4 -4.5 -3.6
Food products and beverages 483 494 437 0.8 -3.1 -1.4 150 141 128 -2.1 -2.5 -2.3Chemicals 439 409 367 -2.4 -2.7 -2.6 261 247 205 -1.8 -4.7 -3.4Non-metallic mineral products 168 151 118 -3.5 -6.1 -5.0 88 80 66 -3.4 -4.8 -4.2Iron, steel, and metal products 510 465 378 -3.1 -5.2 -4.2 267 251 200 -2.0 -5.7 -4.1General machinery 504 477 412 -1.8 -3.6 -2.9 274 260 252 -1.8 -0.8 -1.2Electrical machinery 1,158 1,103 900 -1.6 -5.1 -3.6 743 677 538 -3.1 -5.7 -4.6Transportation machinery 773 743 646 -1.3 -3.5 -2.6 513 472 393 -2.7 -4.6 -3.8Precision machinery 100 108 94 2.5 -3.5 -0.9 52 57 49 3.3 -3.8 -0.8Other manufacturing 830 776 646 -2.3 -4.5 -3.6 303 280 225 -2.6 -5.5 -4.2
Wholesale/retail trade 2,816 3,132 3,087 3.5 -0.4 1.3 422 406 310 -1.3 -6.7 -4.4Wholesale trade 1,255 1,196 1,079 -1.6 -2.6 -2.2 304 293 266 -1.2 -2.4 -1.9Retail trade 1,561 1,936 2,009 7.1 0.9 3.6 118 114 44 -1.3 -22.2 -13.1
Foreign-owned firms Domestic firmsLevel (thousands) Annual average growth
rate (%)Level (thousands) Annual average growth
rate (%)1995 1998 2002 1995-
19981998-2002
1995-2002
1995 1998 2002 1995-1998
1998-2002
1995-2002
All industries 161 273 320 17.2 4.0 9.4 4,548 4,715 4,402 1.2 -1.7 -0.5Manufacturing 126 223 251 18.6 2.9 9.5 2,189 2,039 1,693 -2.4 -4.6 -3.6
Food products and beverages 2 2 2 -3.9 1.9 -0.6 331 352 308 2.0 -3.3 -1.0Chemicals 34 38 58 3.7 10.2 7.3 144 124 104 -5.0 -4.4 -4.6Non-metallic mineral products 1 1 1 19.5 -12.0 1.6 79 70 52 -4.0 -7.5 -6.0Iron, steel, and metal products 5 1 2 -43.1 19.1 -10.0 238 213 176 -3.7 -4.7 -4.3General machinery 23 22 7 -1.7 -25.4 -15.0 207 196 154 -1.8 -6.0 -4.2Electrical machinery 32 65 68 23.1 1.0 10.4 384 362 294 -2.0 -5.2 -3.8Transportation machinery 18 82 107 42.3 6.4 20.2 241 189 147 -8.2 -6.2 -7.0Precision machinery 1 1 1 11.7 3.7 7.0 48 50 43 1.3 -3.3 -1.3Other manufacturing 10 10 4 0.8 -18.8 -10.4 518 485 417 -2.2 -3.8 -3.1
Wholesale/retail trade 35 50 69 11.6 7.9 9.2 2,359 2,676 2,708 4.2 0.3 2.0Wholesale trade 31 32 43 0.6 7.3 4.4 920 872 770 -1.8 -3.1 -2.5Retail trade 4 18 26 42.7 8.9 21.0 1,439 1,804 1,939 7.5 1.8 4.2
Note: See Table 1.Source: METI database.
23
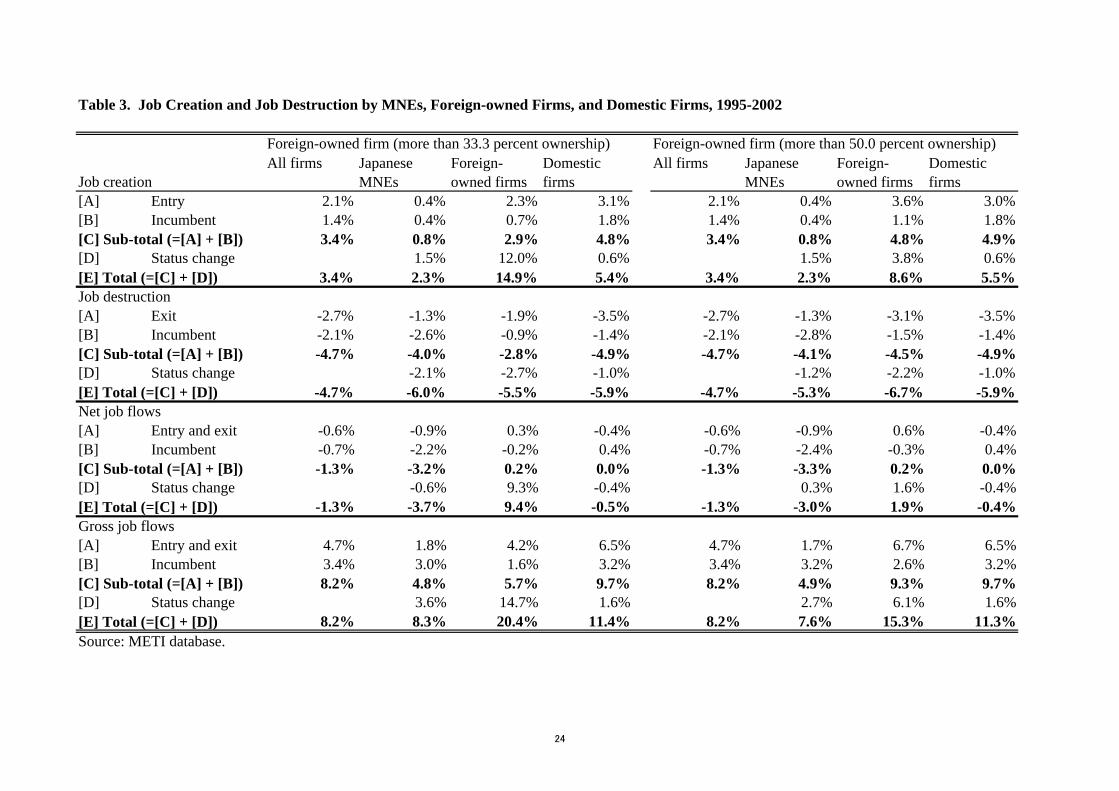
Table 3. Job Creation and Job Destruction by MNEs, Foreign-owned Firms, and Domestic Firms, 1995-2002
Foreign-owned firm (more than 33.3 percent ownership) Foreign-owned firm (more than 50.0 percent ownership)
Job creationAll firms Japanese
MNEsForeign-owned firms
Domesticfirms
All firms JapaneseMNEs
Foreign-owned firms
Domesticfirms
[A] Entry 2.1% 0.4% 2.3% 3.1% 2.1% 0.4% 3.6% 3.0%[B] Incumbent 1.4% 0.4% 0.7% 1.8% 1.4% 0.4% 1.1% 1.8%[C] Sub-total (=[A] + [B]) 3.4% 0.8% 2.9% 4.8% 3.4% 0.8% 4.8% 4.9%[D] Status change 1.5% 12.0% 0.6% 1.5% 3.8% 0.6%[E] Total (=[C] + [D]) 3.4% 2.3% 14.9% 5.4% 3.4% 2.3% 8.6% 5.5%Job destruction[A] Exit -2.7% -1.3% -1.9% -3.5% -2.7% -1.3% -3.1% -3.5%[B] Incumbent -2.1% -2.6% -0.9% -1.4% -2.1% -2.8% -1.5% -1.4%[C] Sub-total (=[A] + [B]) -4.7% -4.0% -2.8% -4.9% -4.7% -4.1% -4.5% -4.9%[D] Status change -2.1% -2.7% -1.0% -1.2% -2.2% -1.0%[E] Total (=[C] + [D]) -4.7% -6.0% -5.5% -5.9% -4.7% -5.3% -6.7% -5.9%Net job flows[A] Entry and exit -0.6% -0.9% 0.3% -0.4% -0.6% -0.9% 0.6% -0.4%[B] Incumbent -0.7% -2.2% -0.2% 0.4% -0.7% -2.4% -0.3% 0.4%[C] Sub-total (=[A] + [B]) -1.3% -3.2% 0.2% 0.0% -1.3% -3.3% 0.2% 0.0%[D] Status change -0.6% 9.3% -0.4% 0.3% 1.6% -0.4%[E] Total (=[C] + [D]) -1.3% -3.7% 9.4% -0.5% -1.3% -3.0% 1.9% -0.4%Gross job flows[A] Entry and exit 4.7% 1.8% 4.2% 6.5% 4.7% 1.7% 6.7% 6.5%[B] Incumbent 3.4% 3.0% 1.6% 3.2% 3.4% 3.2% 2.6% 3.2%[C] Sub-total (=[A] + [B]) 8.2% 4.8% 5.7% 9.7% 8.2% 4.9% 9.3% 9.7%[D] Status change 3.6% 14.7% 1.6% 2.7% 6.1% 1.6%[E] Total (=[C] + [D]) 8.2% 8.3% 20.4% 11.4% 8.2% 7.6% 15.3% 11.3%Source: METI database.
24
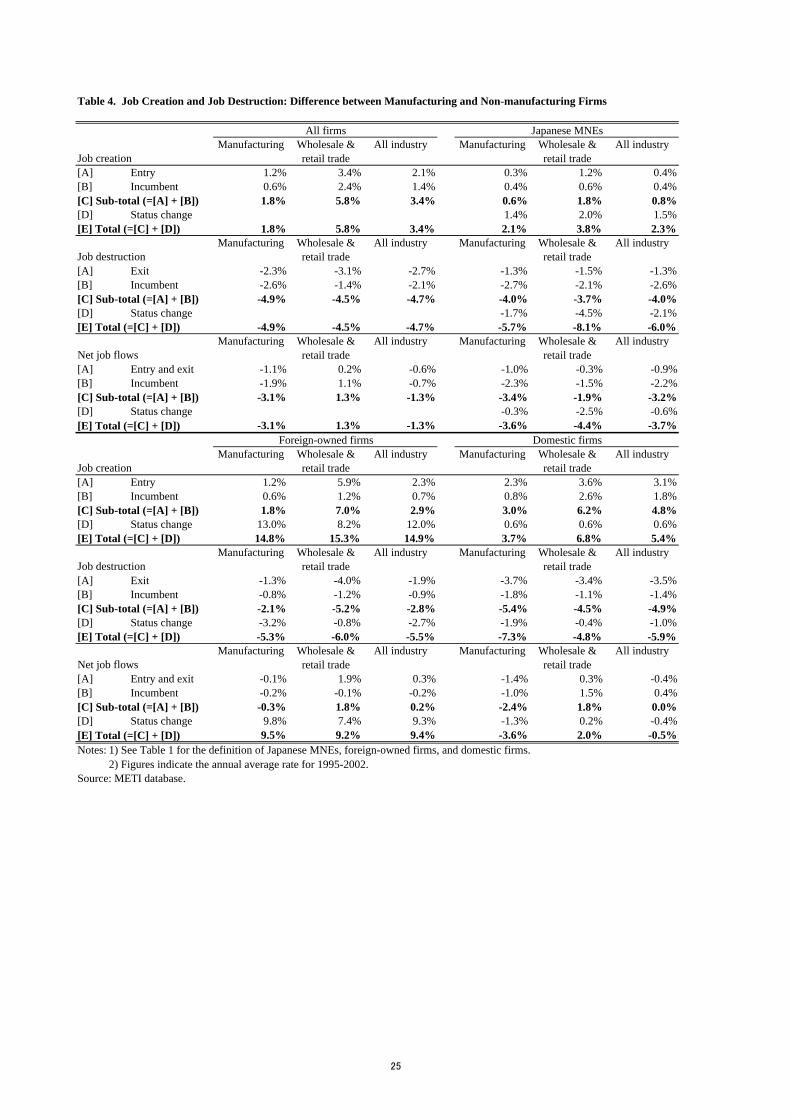
Table 4. Job Creation and Job Destruction: Difference between Manufacturing and Non-manufacturing Firms
All firms Japanese MNEs
Job creationManufacturing Wholesale &
retail tradeAll industry Manufacturing Wholesale &
retail tradeAll industry
[A] Entry 1.2% 3.4% 2.1% 0.3% 1.2% 0.4%[B] Incumbent 0.6% 2.4% 1.4% 0.4% 0.6% 0.4%[C] Sub-total (=[A] + [B]) 1.8% 5.8% 3.4% 0.6% 1.8% 0.8%[D] Status change 1.4% 2.0% 1.5%[E] Total (=[C] + [D]) 1.8% 5.8% 3.4% 2.1% 3.8% 2.3%
Job destructionManufacturing Wholesale &
retail tradeAll industry Manufacturing Wholesale &
retail tradeAll industry
[A] Exit -2.3% -3.1% -2.7% -1.3% -1.5% -1.3%[B] Incumbent -2.6% -1.4% -2.1% -2.7% -2.1% -2.6%[C] Sub-total (=[A] + [B]) -4.9% -4.5% -4.7% -4.0% -3.7% -4.0%[D] Status change -1.7% -4.5% -2.1%[E] Total (=[C] + [D]) -4.9% -4.5% -4.7% -5.7% -8.1% -6.0%
Net job flowsManufacturing Wholesale &
retail tradeAll industry Manufacturing Wholesale &
retail tradeAll industry
[A] Entry and exit -1.1% 0.2% -0.6% -1.0% -0.3% -0.9%[B] Incumbent -1.9% 1.1% -0.7% -2.3% -1.5% -2.2%[C] Sub-total (=[A] + [B]) -3.1% 1.3% -1.3% -3.4% -1.9% -3.2%[D] Status change -0.3% -2.5% -0.6%[E] Total (=[C] + [D]) -3.1% 1.3% -1.3% -3.6% -4.4% -3.7%
Foreign-owned firms Domestic firms
Job creationManufacturing Wholesale &
retail tradeAll industry Manufacturing Wholesale &
retail tradeAll industry
[A] Entry 1.2% 5.9% 2.3% 2.3% 3.6% 3.1%[B] Incumbent 0.6% 1.2% 0.7% 0.8% 2.6% 1.8%[C] Sub-total (=[A] + [B]) 1.8% 7.0% 2.9% 3.0% 6.2% 4.8%[D] Status change 13.0% 8.2% 12.0% 0.6% 0.6% 0.6%[E] Total (=[C] + [D]) 14.8% 15.3% 14.9% 3.7% 6.8% 5.4%
Job destructionManufacturing Wholesale &
retail tradeAll industry Manufacturing Wholesale &
retail tradeAll industry
[A] Exit -1.3% -4.0% -1.9% -3.7% -3.4% -3.5%[B] Incumbent -0.8% -1.2% -0.9% -1.8% -1.1% -1.4%[C] Sub-total (=[A] + [B]) -2.1% -5.2% -2.8% -5.4% -4.5% -4.9%[D] Status change -3.2% -0.8% -2.7% -1.9% -0.4% -1.0%[E] Total (=[C] + [D]) -5.3% -6.0% -5.5% -7.3% -4.8% -5.9%
Net job flowsManufacturing Wholesale &
retail tradeAll industry Manufacturing Wholesale &
retail tradeAll industry
[A] Entry and exit -0.1% 1.9% 0.3% -1.4% 0.3% -0.4%[B] Incumbent -0.2% -0.1% -0.2% -1.0% 1.5% 0.4%[C] Sub-total (=[A] + [B]) -0.3% 1.8% 0.2% -2.4% 1.8% 0.0%[D] Status change 9.8% 7.4% 9.3% -1.3% 0.2% -0.4%[E] Total (=[C] + [D]) 9.5% 9.2% 9.4% -3.6% 2.0% -0.5%Notes: 1) See Table 1 for the definition of Japanese MNEs, foreign-owned firms, and domestic firms.
2) Figures indicate the annual average rate for 1995-2002.Source: METI database.
25
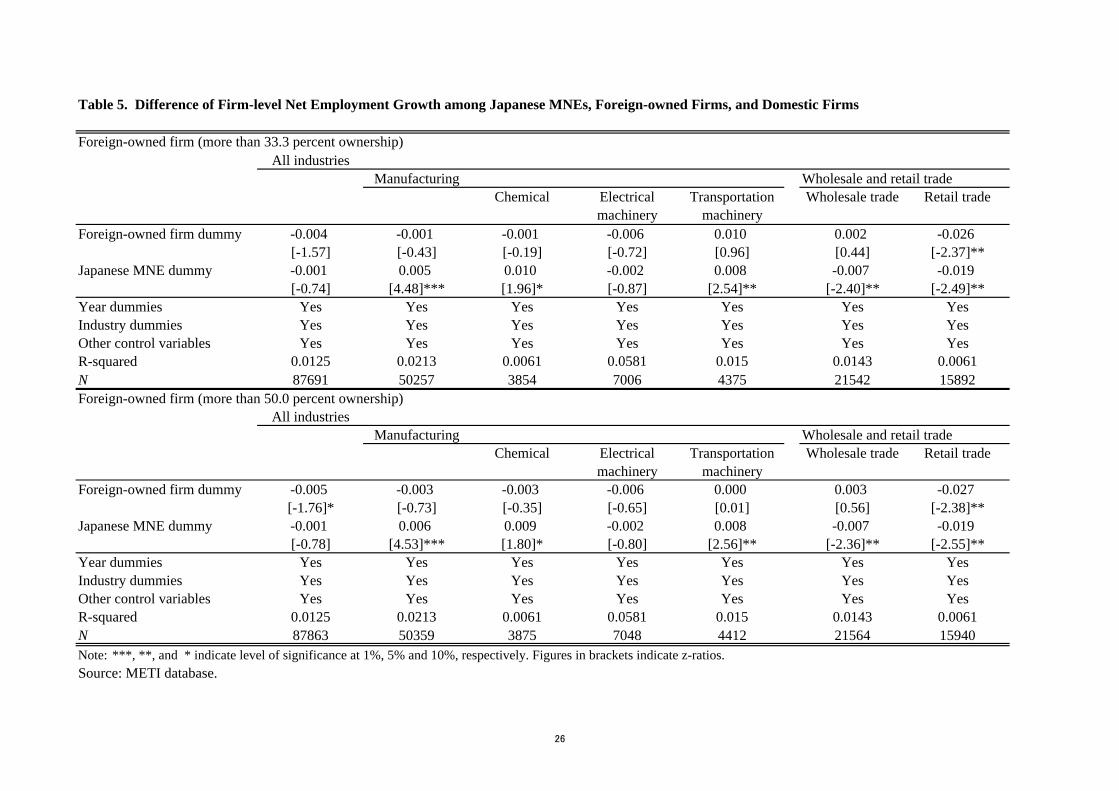
Table 5. Difference of Firm-level Net Employment Growth among Japanese MNEs, Foreign-owned Firms, and Domestic Firms
Foreign-owned firm (more than 33.3 percent ownership)All industries
Manufacturing Wholesale and retail tradeChemical Electrical
machineryTransportation
machineryWholesale trade Retail trade
Foreign-owned firm dummy -0.004 -0.001 -0.001 -0.006 0.010 0.002 -0.026[-1.57] [-0.43] [-0.19] [-0.72] [0.96] [0.44] [-2.37]**
Japanese MNE dummy -0.001 0.005 0.010 -0.002 0.008 -0.007 -0.019[-0.74] [4.48]*** [1.96]* [-0.87] [2.54]** [-2.40]** [-2.49]**
Year dummies Yes Yes Yes Yes Yes Yes YesIndustry dummies Yes Yes Yes Yes Yes Yes YesOther control variables Yes Yes Yes Yes Yes Yes YesR-squared 0.0125 0.0213 0.0061 0.0581 0.015 0.0143 0.0061N 87691 50257 3854 7006 4375 21542 15892Foreign-owned firm (more than 50.0 percent ownership)
All industriesManufacturing Wholesale and retail trade
Chemical Electricalmachinery
Transportationmachinery
Wholesale trade Retail trade
Foreign-owned firm dummy -0.005 -0.003 -0.003 -0.006 0.000 0.003 -0.027[-1.76]* [-0.73] [-0.35] [-0.65] [0.01] [0.56] [-2.38]**
Japanese MNE dummy -0.001 0.006 0.009 -0.002 0.008 -0.007 -0.019[-0.78] [4.53]*** [1.80]* [-0.80] [2.56]** [-2.36]** [-2.55]**
Year dummies Yes Yes Yes Yes Yes Yes YesIndustry dummies Yes Yes Yes Yes Yes Yes YesOther control variables Yes Yes Yes Yes Yes Yes YesR-squared 0.0125 0.0213 0.0061 0.0581 0.015 0.0143 0.0061N 87863 50359 3875 7048 4412 21564 15940Note: ***, **, and * indicate level of significance at 1%, 5% and 10%, respectively. Figures in brackets indicate z-ratios.Source: METI database.
26
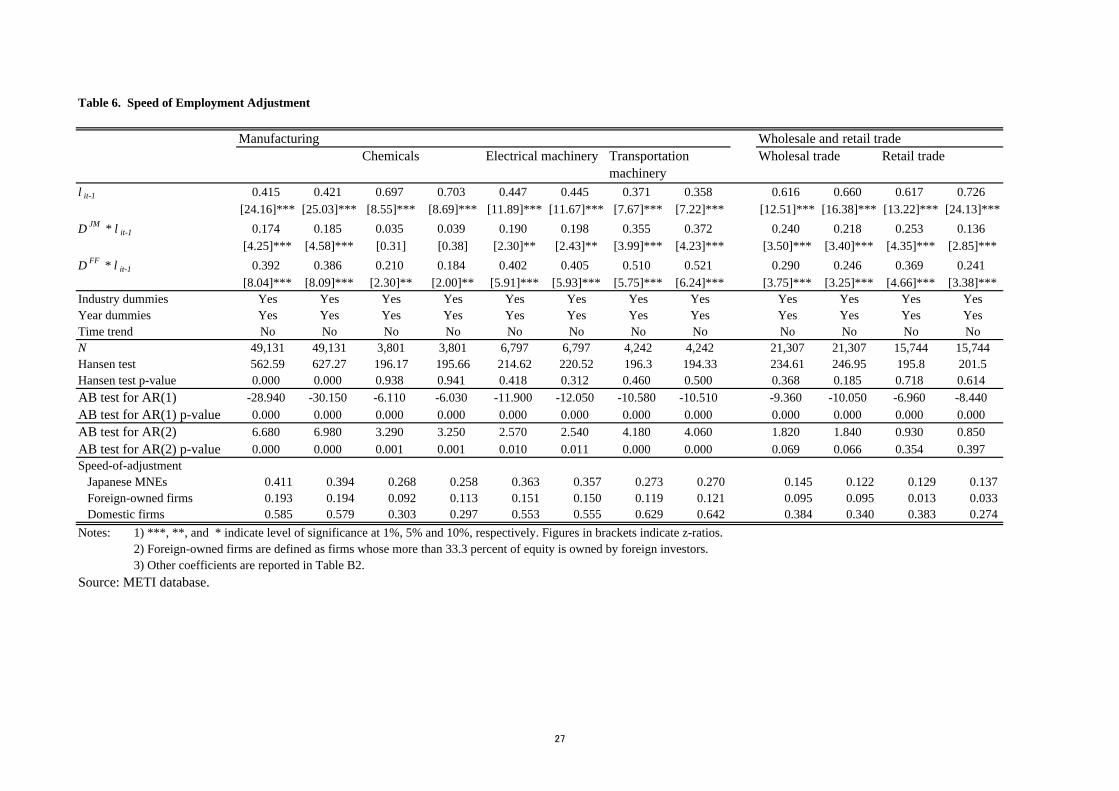
Table 6. Speed of Employment Adjustment
Manufacturing Wholesale and retail tradeChemicals Electrical machinery Transportation
machineryWholesal trade Retail trade
l it-1 0.415 0.421 0.697 0.703 0.447 0.445 0.371 0.358 0.616 0.660 0.617 0.726[24.16]*** [25.03]*** [8.55]*** [8.69]*** [11.89]*** [11.67]*** [7.67]*** [7.22]*** [12.51]*** [16.38]*** [13.22]*** [24.13]***
D JM * l it-1 0.174 0.185 0.035 0.039 0.190 0.198 0.355 0.372 0.240 0.218 0.253 0.136[4.25]*** [4.58]*** [0.31] [0.38] [2.30]** [2.43]** [3.99]*** [4.23]*** [3.50]*** [3.40]*** [4.35]*** [2.85]***
D FF * l it-1 0.392 0.386 0.210 0.184 0.402 0.405 0.510 0.521 0.290 0.246 0.369 0.241[8.04]*** [8.09]*** [2.30]** [2.00]** [5.91]*** [5.93]*** [5.75]*** [6.24]*** [3.75]*** [3.25]*** [4.66]*** [3.38]***
Industry dummies Yes Yes Yes Yes Yes Yes Yes Yes Yes Yes Yes YesYear dummies Yes Yes Yes Yes Yes Yes Yes Yes Yes Yes Yes YesTime trend No No No No No No No No No No No NoN 49,131 49,131 3,801 3,801 6,797 6,797 4,242 4,242 21,307 21,307 15,744 15,744Hansen test 562.59 627.27 196.17 195.66 214.62 220.52 196.3 194.33 234.61 246.95 195.8 201.5Hansen test p-value 0.000 0.000 0.938 0.941 0.418 0.312 0.460 0.500 0.368 0.185 0.718 0.614AB test for AR(1) -28.940 -30.150 -6.110 -6.030 -11.900 -12.050 -10.580 -10.510 -9.360 -10.050 -6.960 -8.440AB test for AR(1) p-value 0.000 0.000 0.000 0.000 0.000 0.000 0.000 0.000 0.000 0.000 0.000 0.000AB test for AR(2) 6.680 6.980 3.290 3.250 2.570 2.540 4.180 4.060 1.820 1.840 0.930 0.850AB test for AR(2) p-value 0.000 0.000 0.001 0.001 0.010 0.011 0.000 0.000 0.069 0.066 0.354 0.397Speed-of-adjustment Japanese MNEs 0.411 0.394 0.268 0.258 0.363 0.357 0.273 0.270 0.145 0.122 0.129 0.137 Foreign-owned firms 0.193 0.194 0.092 0.113 0.151 0.150 0.119 0.121 0.095 0.095 0.013 0.033 Domestic firms 0.585 0.579 0.303 0.297 0.553 0.555 0.629 0.642 0.384 0.340 0.383 0.274Notes: 1) ***, **, and * indicate level of significance at 1%, 5% and 10%, respectively. Figures in brackets indicate z-ratios.
2) Foreign-owned firms are defined as firms whose more than 33.3 percent of equity is owned by foreign investors.3) Other coefficients are reported in Table B2.
Source: METI database.
27

Table A1. Number of Multinational Enterprises (MNEs), Foreign-owned Firms, and Domestic Firms, by Industry
Number of firms All firms Japanese MNEs Foreign-owned firms Domestic firms1995 1998 2002 1995 1998 2002 1995 1998 2002 1995 1998 2002
All industries 19,130 18,968 16,945 1,811 1,986 1,987 202 312 338 17,117 16,670 14,620Manufacturing 10,954 10,763 9,666 1,479 1,638 1,655 112 171 185 9,363 8,954 7,826
Food products and beverages 1,209 1,231 1,155 94 101 89 8 10 11 1,107 1,120 1,055Chemicals 770 758 715 151 163 172 43 57 57 576 538 486Non-metallic mineral products 539 507 389 49 53 47 3 4 3 487 450 339Iron, steel, and metal products 1,459 1,412 1,264 169 198 198 5 9 11 1,285 1,205 1,055General machinery 1,214 1,227 1,114 182 199 221 12 19 19 1,020 1,009 874Electrical machinery 1,545 1,568 1,447 268 307 303 16 25 36 1,261 1,236 1,108Transportation machinery 935 925 834 181 202 209 10 17 24 744 706 601Precision machinery 281 294 294 59 63 65 4 6 8 218 225 221Other manufacturing 3,002 2,841 2,454 326 352 351 11 24 16 2,665 2,465 2,087
Wholesale/retail trade 8,176 8,205 7,279 332 348 332 90 141 153 7,754 7,716 6,794Wholesale trade 4,914 4,674 4,040 276 286 281 77 107 126 4,561 4,281 3,633Retail trade 3,262 3,531 3,239 56 62 51 13 34 27 3,193 3,435 3,161
Share (%, all industries = 100.0) All firms Japanese MNEs Foreign-owned firms Domestic firms1995 1998 2002 1995 1998 2002 1995 1998 2002 1995 1998 2002
All industries 100.0 100.0 100.0 100.0 100.0 100.0 100.0 100.0 100.0 100.0 100.0 100.0Manufacturing 57.3 56.7 57.0 81.7 82.5 83.3 55.4 54.8 54.7 54.7 53.7 53.5
Food products and beverages 6.3 6.5 6.8 5.2 5.1 4.5 4.0 3.2 3.3 6.5 6.7 7.2Chemicals 4.0 4.0 4.2 8.3 8.2 8.7 21.3 18.3 16.9 3.4 3.2 3.3Non-metallic mineral products 2.8 2.7 2.3 2.7 2.7 2.4 1.5 1.3 0.9 2.8 2.7 2.3Iron, steel, and metal products 7.6 7.4 7.5 9.3 10.0 10.0 2.5 2.9 3.3 7.5 7.2 7.2General machinery 6.3 6.5 6.6 10.0 10.0 11.1 5.9 6.1 5.6 6.0 6.1 6.0Electrical machinery 8.1 8.3 8.5 14.8 15.5 15.2 7.9 8.0 10.7 7.4 7.4 7.6Transportation machinery 4.9 4.9 4.9 10.0 10.2 10.5 5.0 5.4 7.1 4.3 4.2 4.1Precision machinery 1.5 1.5 1.7 3.3 3.2 3.3 2.0 1.9 2.4 1.3 1.3 1.5Other manufacturing 15.7 15.0 14.5 18.0 17.7 17.7 5.4 7.7 4.7 15.6 14.8 14.3
Wholesale/retail trade 42.7 43.3 43.0 18.3 17.5 16.7 44.6 45.2 45.3 45.3 46.3 46.5Wholesale trade 25.7 24.6 23.8 15.2 14.4 14.1 38.1 34.3 37.3 26.6 25.7 24.8Retail trade 17.1 18.6 19.1 3.1 3.1 2.6 6.4 10.9 8.0 18.7 20.6 21.6
Note: See Table 1.Source: METI database.
28
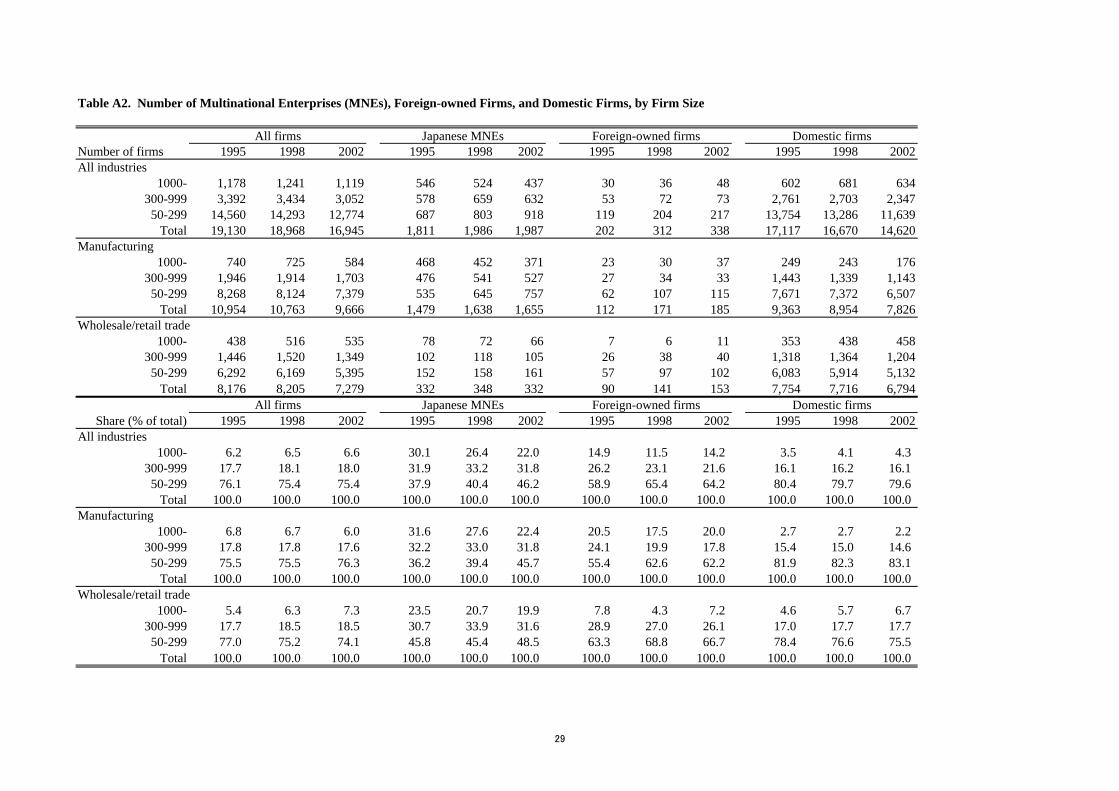
Table A2. Number of Multinational Enterprises (MNEs), Foreign-owned Firms, and Domestic Firms, by Firm Size
All firms Japanese MNEs Foreign-owned firms Domestic firmsNumber of firms 1995 1998 2002 1995 1998 2002 1995 1998 2002 1995 1998 2002All industries
1000- 1,178 1,241 1,119 546 524 437 30 36 48 602 681 634300-999 3,392 3,434 3,052 578 659 632 53 72 73 2,761 2,703 2,347
50-299 14,560 14,293 12,774 687 803 918 119 204 217 13,754 13,286 11,639Total 19,130 18,968 16,945 1,811 1,986 1,987 202 312 338 17,117 16,670 14,620
Manufacturing1000- 740 725 584 468 452 371 23 30 37 249 243 176
300-999 1,946 1,914 1,703 476 541 527 27 34 33 1,443 1,339 1,14350-299 8,268 8,124 7,379 535 645 757 62 107 115 7,671 7,372 6,507
Total 10,954 10,763 9,666 1,479 1,638 1,655 112 171 185 9,363 8,954 7,826Wholesale/retail trade
1000- 438 516 535 78 72 66 7 6 11 353 438 458300-999 1,446 1,520 1,349 102 118 105 26 38 40 1,318 1,364 1,204
50-299 6,292 6,169 5,395 152 158 161 57 97 102 6,083 5,914 5,132Total 8,176 8,205 7,279 332 348 332 90 141 153 7,754 7,716 6,794
All firms Japanese MNEs Foreign-owned firms Domestic firmsShare (% of total) 1995 1998 2002 1995 1998 2002 1995 1998 2002 1995 1998 2002
All industries1000- 6.2 6.5 6.6 30.1 26.4 22.0 14.9 11.5 14.2 3.5 4.1 4.3
300-999 17.7 18.1 18.0 31.9 33.2 31.8 26.2 23.1 21.6 16.1 16.2 16.150-299 76.1 75.4 75.4 37.9 40.4 46.2 58.9 65.4 64.2 80.4 79.7 79.6
Total 100.0 100.0 100.0 100.0 100.0 100.0 100.0 100.0 100.0 100.0 100.0 100.0Manufacturing
1000- 6.8 6.7 6.0 31.6 27.6 22.4 20.5 17.5 20.0 2.7 2.7 2.2300-999 17.8 17.8 17.6 32.2 33.0 31.8 24.1 19.9 17.8 15.4 15.0 14.6
50-299 75.5 75.5 76.3 36.2 39.4 45.7 55.4 62.6 62.2 81.9 82.3 83.1Total 100.0 100.0 100.0 100.0 100.0 100.0 100.0 100.0 100.0 100.0 100.0 100.0
Wholesale/retail trade1000- 5.4 6.3 7.3 23.5 20.7 19.9 7.8 4.3 7.2 4.6 5.7 6.7
300-999 17.7 18.5 18.5 30.7 33.9 31.6 28.9 27.0 26.1 17.0 17.7 17.750-299 77.0 75.2 74.1 45.8 45.4 48.5 63.3 68.8 66.7 78.4 76.6 75.5
Total 100.0 100.0 100.0 100.0 100.0 100.0 100.0 100.0 100.0 100.0 100.0 100.0
29

Table A3. Job Creation and Job Destruction, by Firm Size
All firms Japanese MNEs
Job creationLarge firms Medium-
sized firmsSmall-sized
firmsLarge firms Medium-
sized firmsSmall-sized
firms[A] Entry 2.2% 5.0% 4.5% 0.4% 4.9% 5.2%[B] Incumbent 1.3% 0.6% 0.7% 0.4% 0.3% 0.4%[C] Sub-total (=[A] + [B]) 3.5% 5.6% 5.2% 0.8% 5.2% 5.6%[D] Status change 0.8% 2.7% 5.3%[E] Total (=[C] + [D]) 3.5% 5.6% 5.2% 1.6% 7.9% 10.9%Job destruction[A] Exit -2.3% -6.0% -5.6% -1.9% -4.0% -4.2%[B] Incumbent -2.1% -1.2% -1.4% -2.6% -1.3% -1.1%[C] Sub-total (=[A] + [B]) -4.5% -7.2% -7.0% -4.4% -5.3% -5.3%[D] Status change -2.0% -1.5% -1.7%[E] Total (=[C] + [D]) -1.0% -1.6% -1.8% -4.9% 1.1% 3.9%Net job flows[A] Entry and exit -0.1% -1.0% -1.1% -1.5% 1.0% 1.0%[B] Incumbent -0.9% -0.6% -0.7% -2.2% -1.0% -0.7%[C] Sub-total (=[A] + [B]) -1.0% -1.6% -1.8% -3.7% -0.1% 0.3%[D] Status change -1.2% 1.2% 3.6%[E] Total (=[C] + [D]) 2.5% 4.0% 3.3% -3.3% 9.0% 14.9%
Foreign-owned firms Domestic firms
Job creationLarge firms Medium-
sized firmsSmall-sized
firmsLarge firms Medium-
sized firmsSmall-sized
firms[A] Entry 1.9% 7.8% 8.1% 4.8% 5.0% 4.4%[B] Incumbent 0.4% 0.3% 0.6% 2.4% 0.6% 0.6%[C] Sub-total (=[A] + [B]) 2.3% 8.0% 8.7% 7.2% 5.6% 5.0%[D] Status change 13.6% 5.2% 4.3% 1.2% 0.3% 0.1%[E] Total (=[C] + [D]) 15.9% 13.2% 13.0% 8.4% 5.9% 5.2%Job destruction[A] Exit -1.4% -7.3% -4.8% -3.1% -6.5% -5.7%[B] Incumbent -0.8% -0.7% -1.1% -0.8% -1.0% -1.3%[C] Sub-total (=[A] + [B]) -2.2% -8.1% -5.9% -3.9% -7.5% -7.1%[D] Status change -3.1% -0.4% -0.6% -1.3% -0.8% -0.5%[E] Total (=[C] + [D]) 10.6% 4.7% 6.5% 3.1% -2.5% -2.4%Net job flows[A] Entry and exit 0.5% 0.4% 3.3% 1.7% -1.6% -1.3%[B] Incumbent -0.4% -0.5% -0.5% 1.6% -0.4% -0.7%[C] Sub-total (=[A] + [B]) 0.1% 0.0% 2.8% 3.3% -2.0% -2.0%[D] Status change 10.5% 4.8% 3.7% -0.2% -0.5% -0.4%[E] Total (=[C] + [D]) 26.5% 18.0% 19.5% 11.5% 3.4% 2.8%Note: See Table 1 for the definition of Japanese MNEs, foreign-owned firms, and domestic firms.Source: METI database.
30

m
Table A4. Job Creation and Job Destruction: Difference between 1995-1998 and 1998-2002
All firms Japanese MNEs oreign-owned fir Domestic firms
Job creation1995-1998
1998-2002
1995-1998
1998-2002
1995-1998
1998-2002
1995-1998
1998-2002
[A] Entry 2.6% 2.0% 0.4% 0.4% 1.5% 2.4% 4.1% 3.0%[B] Incumbent 2.0% 2.0% 0.7% 0.8% 0.8% 1.3% 2.6% 2.5%[C] Sub-total (=[A] + [B]) 4.6% 4.1% 1.1% 1.2% 2.3% 3.7% 6.7% 5.4%[D] Status change 2.7% 2.1% 20.3% 8.8% 1.3% 1.2%[E] Total (=[C] + [D]) 4.6% 4.1% 3.7% 3.3% 22.6% 12.5% 8.0% 6.6%
Job destruction1995-1998
1998-2002
1995-1998
1998-2002
1995-1998
1998-2002
1995-1998
1998-2002
[A] Exit -1.9% -3.7% -0.8% -1.7% -1.5% -2.4% -2.6% -5.0%[B] Incumbent -2.4% -2.9% -2.4% -3.5% -2.1% -2.4% -2.0% -2.1%[C] Sub-total (=[A] + [B]) -4.3% -6.7% -3.2% -5.2% -3.6% -4.8% -4.6% -7.2%[D] Status change -2.8% -2.9% -1.7% -3.8% -2.2% -1.2%[E] Total (=[C] + [D]) -4.3% -6.7% -6.0% -8.1% -5.3% -8.6% -6.8% -8.3%
Net job flows1995-1998
1998-2002
1995-1998
1998-2002
1995-1998
1998-2002
1995-1998
1998-2002
[A] Entry and exit 0.7% -1.7% -0.4% -1.3% 0.0% 0.0% 1.5% -2.1%[B] Incumbent -0.4% -0.9% -1.8% -2.8% -1.3% -1.0% 0.6% 0.3%[C] Sub-total (=[A] + [B]) 0.3% -2.6% -2.2% -4.1% -1.3% -1.0% 2.1% -1.7%[D] Status change -0.1% -0.8% 18.5% 5.0% -0.9% 0.0%[E] Total (=[C] + [D]) 0.3% -2.6% -2.3% -4.8% 17.2% 4.0% 1.2% -1.7%Source: METI database.
31

Table A5. Job Creation and Job Destruction: Difference across Industries
All firms Japanese MNEs
Job creationChemical General
machineryElectricalmachinery
Transportationmachinery
Precisionmachinery
Chemical Generalmachinery
Electricalmachinery
Transportationmachinery
Precisionmachinery
[A] Entry 0.7% 1.0% 1.3% 0.6% 1.9% 0.2% 0.4% 0.3% 0.1% 1.0%[B] Incumbent 1.1% 0.6% 0.4% 0.6% 1.1% 0.7% 0.6% 0.2% 0.5% 0.4%[C] Sub-total (=[A] + [B]) 1.7% 1.6% 1.7% 1.2% 3.0% 0.9% 1.0% 0.5% 0.6% 1.4%[D] Status change 1.4% 2.2% 0.7% 1.6% 1.3%[E] Total (=[C] + [D]) 1.7% 1.6% 1.7% 1.2% 3.0% 2.3% 3.1% 1.2% 2.2% 2.7%Job destruction[A] Exit -1.9% -2.3% -2.1% -1.7% -1.9% -1.2% -1.5% -0.9% -1.2% -0.5%[B] Incumbent -2.4% -2.2% -3.2% -2.0% -1.9% -2.9% -2.1% -3.7% -1.0% -2.3%[C] Sub-total (=[A] + [B]) -4.3% -4.5% -5.3% -3.7% -3.9% -4.1% -3.7% -4.6% -2.2% -2.7%[D] Status change -1.7% -0.7% -1.1% -3.7% -0.8%[E] Total (=[C] + [D]) -4.3% -4.5% -5.3% -3.7% -3.9% -5.7% -4.4% -5.7% -5.9% -3.5%Net job flows[A] Entry and exit -1.2% -1.3% -0.8% -1.1% -0.1% -1.0% -1.1% -0.5% -1.1% 0.5%[B] Incumbent -1.3% -1.6% -2.8% -1.5% -0.9% -2.2% -1.6% -3.6% -0.5% -1.9%[C] Sub-total (=[A] + [B]) -2.6% -2.9% -3.6% -2.6% -0.9% -3.2% -2.7% -4.1% -1.6% -1.3%[D] Status change -0.3% 1.5% -0.4% -2.2% 0.6%[E] Total (=[C] + [D]) -2.6% -2.9% -3.6% -2.6% -0.9% -3.4% -1.2% -4.6% -3.8% -0.8%
Foreign-owned firms Domestic firms
Job creationChemical General
machineryElectricalmachinery
Transportationmachinery
Precisionmachinery
Chemical Generalmachinery
Electricalmachinery
Transportationmachinery
Precisionmachinery
[A] Entry 0.6% 1.3% 1.9% 0.8% 4.3% 1.5% 1.8% 2.9% 1.7% 2.8%[B] Incumbent 1.9% 0.1% 0.0% 0.1% 3.5% 0.7% 0.6% 0.8% 0.6% 1.3%[C] Sub-total (=[A] + [B]) 2.5% 1.4% 1.9% 0.9% 7.8% 2.2% 2.4% 3.7% 2.3% 4.1%[D] Status change 9.2% 1.4% 10.2% 23.2% 0.0% 0.7% 0.8% 0.4% 0.5% 0.7%[E] Total (=[C] + [D]) 11.7% 2.8% 12.2% 24.1% 7.8% 3.0% 3.2% 4.1% 2.8% 4.8%Job destruction[A] Exit -2.5% -0.2% -0.4% -0.2% 0.0% -3.0% -3.5% -4.5% -3.3% -3.7%[B] Incumbent -1.2% -1.0% -0.9% 0.0% -0.7% -1.0% -1.9% -1.9% -1.6% -1.4%[C] Sub-total (=[A] + [B]) -3.7% -1.2% -1.4% -0.2% -0.7% -4.0% -5.5% -6.5% -4.9% -5.0%[D] Status change -0.7% -16.7% -0.4% -3.8% 0.0% -3.6% -2.0% -1.5% -4.9% -1.1%[E] Total (=[C] + [D]) -4.4% -17.9% -1.8% -4.0% -0.7% -7.6% -7.4% -7.9% -9.8% -6.2%Net job flows[A] Entry and exit -1.9% 1.1% 1.4% 0.6% 4.3% -1.5% -1.7% -1.6% -1.5% -0.9%[B] Incumbent 0.8% -0.9% -0.9% 0.1% 2.7% -0.3% -1.4% -1.2% -1.0% 0.0%[C] Sub-total (=[A] + [B]) -1.2% 0.2% 0.5% 0.7% 7.0% -1.8% -3.0% -2.7% -2.6% -0.9%[D] Status change 8.5% -15.2% 9.9% 19.5% 0.0% -2.9% -1.2% -1.0% -4.4% -0.4%[E] Total (=[C] + [D]) 7.3% -15.0% 10.4% 20.2% 7.0% -4.6% -4.2% -3.8% -7.0% -1.3%For notes and source, see Table 4.
32
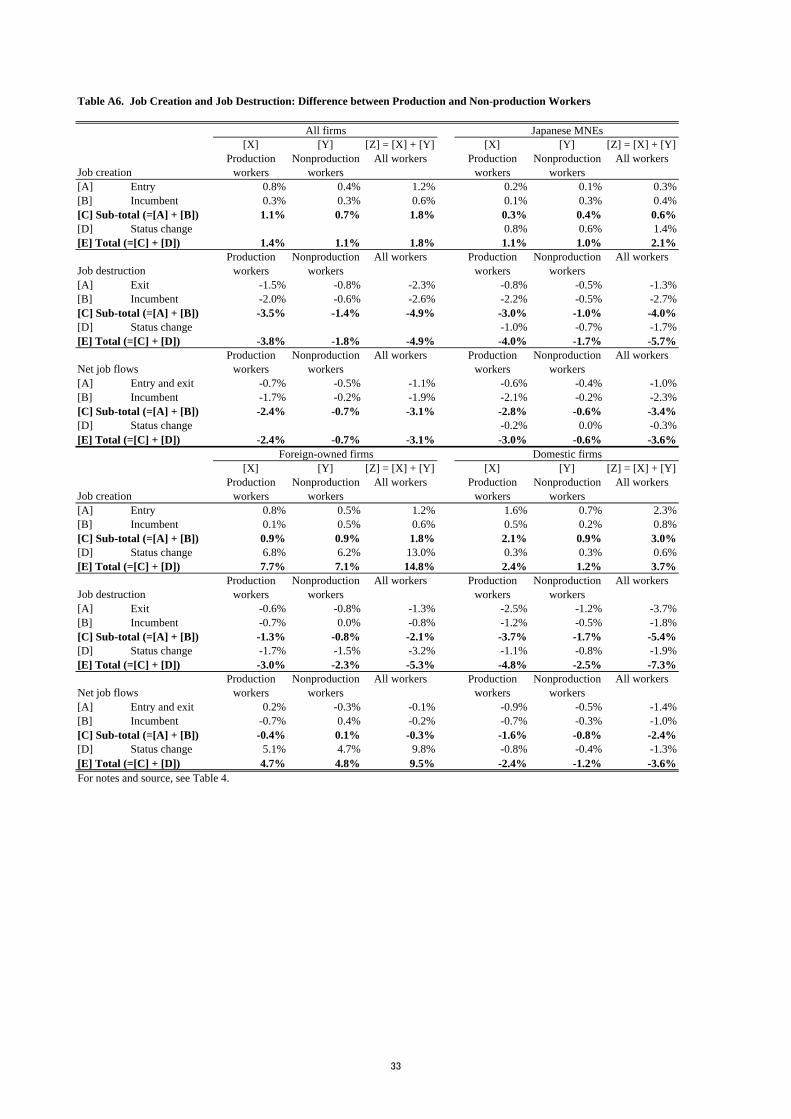
Table A6. Job Creation and Job Destruction: Difference between Production and Non-production Workers
All firms Japanese MNEs[X] [Y] [Z] = [X] + [Y] [X] [Y] [Z] = [X] + [Y]
Job creationProduction
workersNonproduction
workersAll workers Production
workersNonproduction
workersAll workers
[A] Entry 0.8% 0.4% 1.2% 0.2% 0.1% 0.3%[B] Incumbent 0.3% 0.3% 0.6% 0.1% 0.3% 0.4%[C] Sub-total (=[A] + [B]) 1.1% 0.7% 1.8% 0.3% 0.4% 0.6%[D] Status change 0.8% 0.6% 1.4%[E] Total (=[C] + [D]) 1.4% 1.1% 1.8% 1.1% 1.0% 2.1%
Job destructionProduction
workersNonproduction
workersAll workers Production
workersNonproduction
workersAll workers
[A] Exit -1.5% -0.8% -2.3% -0.8% -0.5% -1.3%[B] Incumbent -2.0% -0.6% -2.6% -2.2% -0.5% -2.7%[C] Sub-total (=[A] + [B]) -3.5% -1.4% -4.9% -3.0% -1.0% -4.0%[D] Status change -1.0% -0.7% -1.7%[E] Total (=[C] + [D]) -3.8% -1.8% -4.9% -4.0% -1.7% -5.7%
Net job flowsProduction
workersNonproduction
workersAll workers Production
workersNonproduction
workersAll workers
[A] Entry and exit -0.7% -0.5% -1.1% -0.6% -0.4% -1.0%[B] Incumbent -1.7% -0.2% -1.9% -2.1% -0.2% -2.3%[C] Sub-total (=[A] + [B]) -2.4% -0.7% -3.1% -2.8% -0.6% -3.4%[D] Status change -0.2% 0.0% -0.3%[E] Total (=[C] + [D]) -2.4% -0.7% -3.1% -3.0% -0.6% -3.6%
Foreign-owned firms Domestic firms[X] [Y] [Z] = [X] + [Y] [X] [Y] [Z] = [X] + [Y]
Job creationProduction
workersNonproduction
workersAll workers Production
workersNonproduction
workersAll workers
[A] Entry 0.8% 0.5% 1.2% 1.6% 0.7% 2.3%[B] Incumbent 0.1% 0.5% 0.6% 0.5% 0.2% 0.8%[C] Sub-total (=[A] + [B]) 0.9% 0.9% 1.8% 2.1% 0.9% 3.0%[D] Status change 6.8% 6.2% 13.0% 0.3% 0.3% 0.6%[E] Total (=[C] + [D]) 7.7% 7.1% 14.8% 2.4% 1.2% 3.7%
Job destructionProduction
workersNonproduction
workersAll workers Production
workersNonproduction
workersAll workers
[A] Exit -0.6% -0.8% -1.3% -2.5% -1.2% -3.7%[B] Incumbent -0.7% 0.0% -0.8% -1.2% -0.5% -1.8%[C] Sub-total (=[A] + [B]) -1.3% -0.8% -2.1% -3.7% -1.7% -5.4%[D] Status change -1.7% -1.5% -3.2% -1.1% -0.8% -1.9%[E] Total (=[C] + [D]) -3.0% -2.3% -5.3% -4.8% -2.5% -7.3%
Net job flowsProduction
workersNonproduction
workersAll workers Production
workersNonproduction
workersAll workers
[A] Entry and exit 0.2% -0.3% -0.1% -0.9% -0.5% -1.4%[B] Incumbent -0.7% 0.4% -0.2% -0.7% -0.3% -1.0%[C] Sub-total (=[A] + [B]) -0.4% 0.1% -0.3% -1.6% -0.8% -2.4%[D] Status change 5.1% 4.7% 9.8% -0.8% -0.4% -1.3%[E] Total (=[C] + [D]) 4.7% 4.8% 9.5% -2.4% -1.2% -3.6%For notes and source, see Table 4.
33

Table B1. Summary Statistics of Variables
Summary statisticsl it D JM * l it-1 D FF * l it-1 y it w/r it D JM * y it D FF * y it D JM * w/r it D FF * w/r it
N 50,028 50,028 50,028 50,028 50,028 50,028 50,028 50,028 50,028mean 5.220 0.778 0.061 2.514 3.452 0.486 0.039 0.436 0.040variance 0.973 2.147 0.603 1.220 0.334 1.417 0.407 1.184 0.393Correlation matrix
l it D JM * l it-1 D FF * l it-1 y it w/r it D JM * y it D FF * y it D JM * w/r it D FF * w/r it
Number of workers l it 1Japanese MNE dummy * Number of workers (t-1) D JM * l it-1 0.552 1Foreign-ownership dummy * Number of workers (t-1) D FF * l it-1 0.085 -0.037 1Real output (value-added) y it 0.921 0.537 0.124 1Wage-rental ratio w/r it 0.237 0.212 0.121 0.495 1Japanese MNE dummy * Number of workers (t-1) D JM * y it 0.598 0.981 -0.035 0.591 0.244 1.000Foreign-ownership dummy * Number of workers (t-1) D FF * y it 0.098 -0.035 0.984 0.138 0.126 -0.033 1.000Japanese MNE dummy * Real output (value-added) D JM * w/r it 0.485 0.983 -0.037 0.482 0.216 0.943 -0.036 1.000Foreign-ownership dummy * Real output (value-added) D FF * w/r it 0.061 -0.037 0.978 0.107 0.127 -0.035 0.945 -0.038 1.000Note: For the definition of variables, see main text.
34
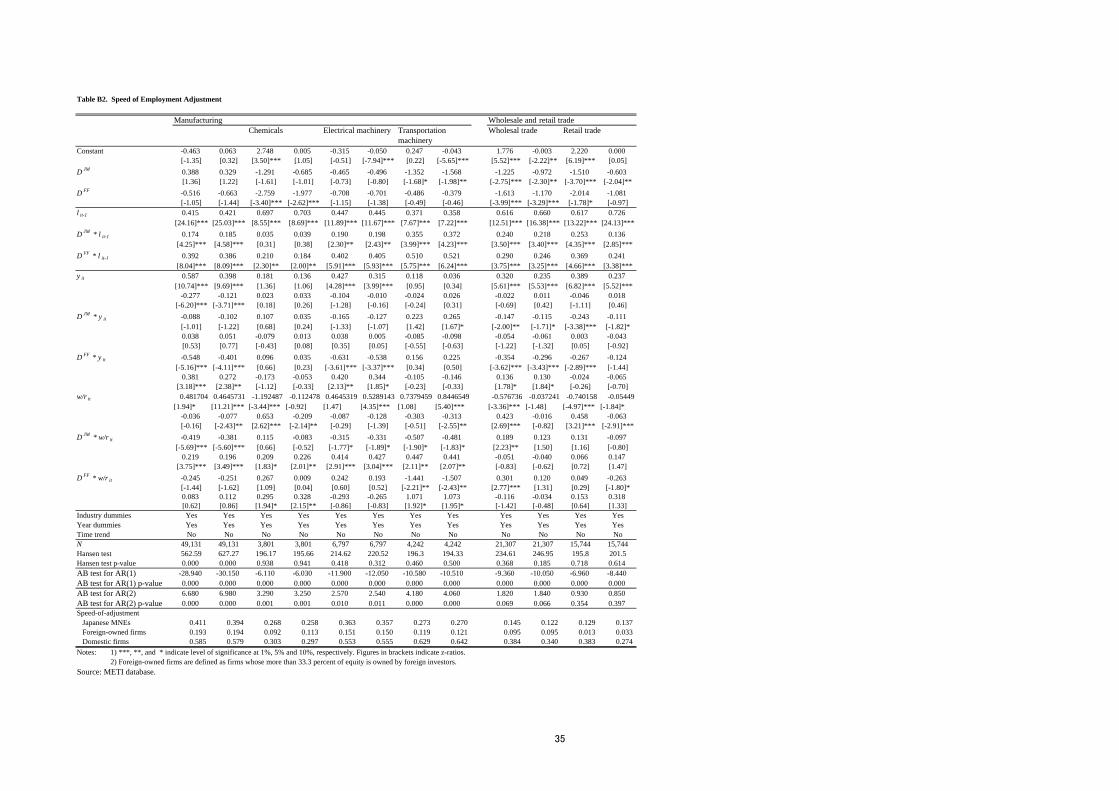
Table B2. Speed of Employment Adjustment
Manufacturing Wholesale and retail tradeChemicals Electrical machinery Transportation
machineryWholesal trade Retail trade
Constant -0.463 0.063 2.748 0.005 -0.315 -0.050 0.247 -0.043 1.776 -0.003 2.220 0.000[-1.35] [0.32] [3.50]*** [1.05] [-0.51] [-7.94]*** [0.22] [-5.65]*** [5.52]*** [-2.22]** [6.19]*** [0.05]
D JM 0.388 0.329 -1.291 -0.685 -0.465 -0.496 -1.352 -1.568 -1.225 -0.972 -1.510 -0.603[1.36] [1.22] [-1.61] [-1.01] [-0.73] [-0.80] [-1.68]* [-1.98]** [-2.75]*** [-2.30]** [-3.70]*** [-2.04]**
D FF -0.516 -0.663 -2.759 -1.977 -0.708 -0.701 -0.486 -0.379 -1.613 -1.170 -2.014 -1.081[-1.05] [-1.44] [-3.40]*** [-2.62]*** [-1.15] [-1.38] [-0.49] [-0.46] [-3.99]*** [-3.29]*** [-1.78]* [-0.97]
l it-1 0.415 0.421 0.697 0.703 0.447 0.445 0.371 0.358 0.616 0.660 0.617 0.726[24.16]*** [25.03]*** [8.55]*** [8.69]*** [11.89]*** [11.67]*** [7.67]*** [7.22]*** [12.51]*** [16.38]*** [13.22]*** [24.13]***
D JM * l it-1 0.174 0.185 0.035 0.039 0.190 0.198 0.355 0.372 0.240 0.218 0.253 0.136[4.25]*** [4.58]*** [0.31] [0.38] [2.30]** [2.43]** [3.99]*** [4.23]*** [3.50]*** [3.40]*** [4.35]*** [2.85]***
D FF * l it-1 0.392 0.386 0.210 0.184 0.402 0.405 0.510 0.521 0.290 0.246 0.369 0.241[8.04]*** [8.09]*** [2.30]** [2.00]** [5.91]*** [5.93]*** [5.75]*** [6.24]*** [3.75]*** [3.25]*** [4.66]*** [3.38]***
y it 0.587 0.398 0.181 0.136 0.427 0.315 0.118 0.036 0.320 0.235 0.389 0.237[10.74]*** [9.69]*** [1.36] [1.06] [4.28]*** [3.99]*** [0.95] [0.34] [5.61]*** [5.53]*** [6.82]*** [5.52]***
-0.277 -0.121 0.023 0.033 -0.104 -0.010 -0.024 0.026 -0.022 0.011 -0.046 0.018[-6.20]*** [-3.71]*** [0.18] [0.26] [-1.28] [-0.16] [-0.24] [0.31] [-0.69] [0.42] [-1.11] [0.46]
D JM * y it -0.088 -0.102 0.107 0.035 -0.165 -0.127 0.223 0.265 -0.147 -0.115 -0.243 -0.111[-1.01] [-1.22] [0.68] [0.24] [-1.33] [-1.07] [1.42] [1.67]* [-2.00]** [-1.71]* [-3.38]*** [-1.82]*0.038 0.051 -0.079 0.013 0.038 0.005 -0.085 -0.098 -0.054 -0.061 0.003 -0.043[0.53] [0.77] [-0.43] [0.08] [0.35] [0.05] [-0.55] [-0.63] [-1.22] [-1.32] [0.05] [-0.92]
D FF * y it -0.548 -0.401 0.096 0.035 -0.631 -0.538 0.156 0.225 -0.354 -0.296 -0.267 -0.124[-5.16]*** [-4.11]*** [0.66] [0.23] [-3.61]*** [-3.37]*** [0.34] [0.50] [-3.62]*** [-3.43]*** [-2.89]*** [-1.44]
0.381 0.272 -0.173 -0.053 0.420 0.344 -0.105 -0.146 0.136 0.130 -0.024 -0.065[3.18]*** [2.38]** [-1.12] [-0.33] [2.13]** [1.85]* [-0.23] [-0.33] [1.78]* [1.84]* [-0.26] [-0.70]
w/r it 0.481704 0.4645731 -1.192487 -0.112478 0.4645319 0.5289143 0.7379459 0.8446549 -0.576736 -0.037241 -0.740158 -0.05449[1.94]* [11.21]*** [-3.44]*** [-0.92] [1.47] [4.35]*** [1.08] [5.40]*** [-3.36]*** [-1.48] [-4.97]*** [-1.84]*
-0.036 -0.077 0.653 -0.209 -0.087 -0.128 -0.303 -0.313 0.423 -0.016 0.458 -0.063[-0.16] [-2.43]** [2.62]*** [-2.14]** [-0.29] [-1.39] [-0.51] [-2.55]** [2.69]*** [-0.82] [3.21]*** [-2.91]***
D JM * w/r it -0.419 -0.381 0.115 -0.083 -0.315 -0.331 -0.507 -0.481 0.189 0.123 0.131 -0.097[-5.69]*** [-5.60]*** [0.66] [-0.52] [-1.77]* [-1.89]* [-1.90]* [-1.83]* [2.23]** [1.50] [1.16] [-0.80]
0.219 0.196 0.209 0.226 0.414 0.427 0.447 0.441 -0.051 -0.040 0.066 0.147[3.75]*** [3.49]*** [1.83]* [2.01]** [2.91]*** [3.04]*** [2.11]** [2.07]** [-0.83] [-0.62] [0.72] [1.47]
D FF * w/r it -0.245 -0.251 0.267 0.009 0.242 0.193 -1.441 -1.507 0.301 0.120 0.049 -0.263[-1.44] [-1.62] [1.09] [0.04] [0.60] [0.52] [-2.21]** [-2.43]** [2.77]*** [1.31] [0.29] [-1.80]*0.083 0.112 0.295 0.328 -0.293 -0.265 1.071 1.073 -0.116 -0.034 0.153 0.318[0.62] [0.86] [1.94]* [2.15]** [-0.86] [-0.83] [1.92]* [1.95]* [-1.42] [-0.48] [0.64] [1.33]
Industry dummies Yes Yes Yes Yes Yes Yes Yes Yes Yes Yes Yes YesYear dummies Yes Yes Yes Yes Yes Yes Yes Yes Yes Yes Yes YesTime trend No No No No No No No No No No No NoN 49,131 49,131 3,801 3,801 6,797 6,797 4,242 4,242 21,307 21,307 15,744 15,744Hansen test 562.59 627.27 196.17 195.66 214.62 220.52 196.3 194.33 234.61 246.95 195.8 201.5Hansen test p-value 0.000 0.000 0.938 0.941 0.418 0.312 0.460 0.500 0.368 0.185 0.718 0.614AB test for AR(1) -28.940 -30.150 -6.110 -6.030 -11.900 -12.050 -10.580 -10.510 -9.360 -10.050 -6.960 -8.440AB test for AR(1) p-value 0.000 0.000 0.000 0.000 0.000 0.000 0.000 0.000 0.000 0.000 0.000 0.000AB test for AR(2) 6.680 6.980 3.290 3.250 2.570 2.540 4.180 4.060 1.820 1.840 0.930 0.850AB test for AR(2) p-value 0.000 0.000 0.001 0.001 0.010 0.011 0.000 0.000 0.069 0.066 0.354 0.397Speed-of-adjustment Japanese MNEs 0.411 0.394 0.268 0.258 0.363 0.357 0.273 0.270 0.145 0.122 0.129 0.137 Foreign-owned firms 0.193 0.194 0.092 0.113 0.151 0.150 0.119 0.121 0.095 0.095 0.013 0.033 Domestic firms 0.585 0.579 0.303 0.297 0.553 0.555 0.629 0.642 0.384 0.340 0.383 0.274Notes: 1) ***, **, and * indicate level of significance at 1%, 5% and 10%, respectively. Figures in brackets indicate z-ratios.
2) Foreign-owned firms are defined as firms whose more than 33.3 percent of equity is owned by foreign investors.Source: METI database.
35
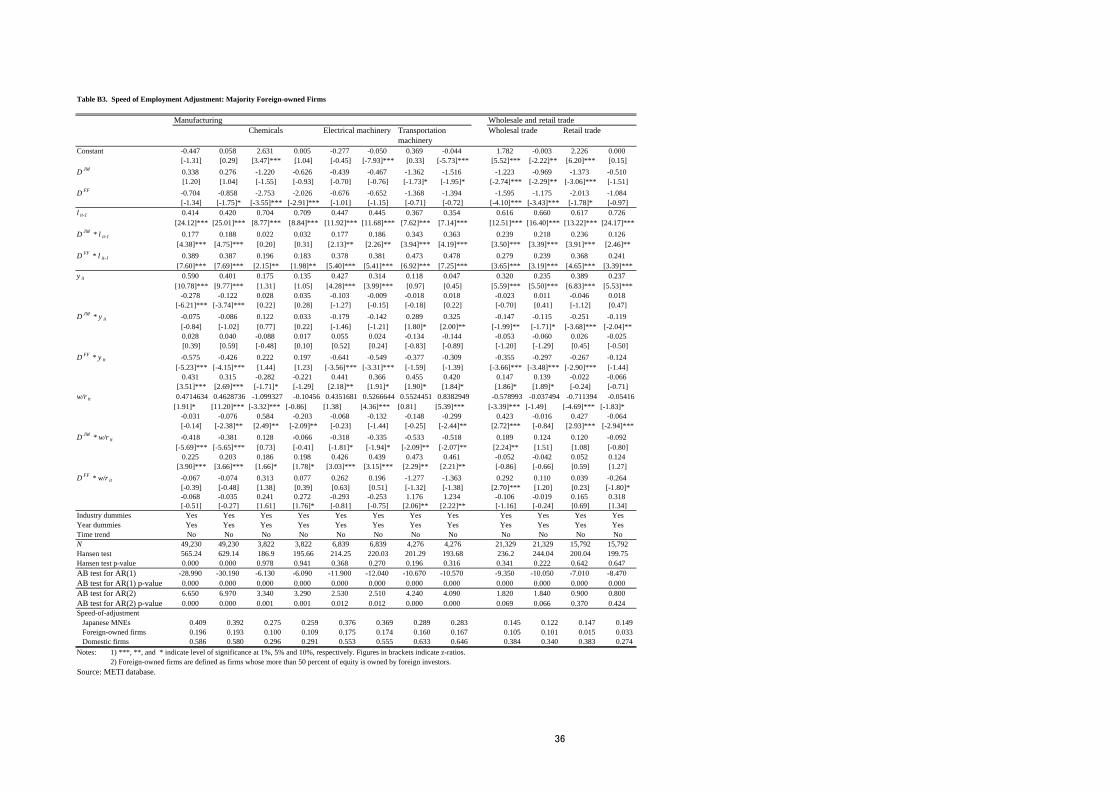
Table B3. Speed of Employment Adjustment: Majority Foreign-owned Firms
Manufacturing Wholesale and retail tradeChemicals Electrical machinery Transportation
machineryWholesal trade Retail trade
Constant -0.447 0.058 2.631 0.005 -0.277 -0.050 0.369 -0.044 1.782 -0.003 2.226 0.000[-1.31] [0.29] [3.47]*** [1.04] [-0.45] [-7.93]*** [0.33] [-5.73]*** [5.52]*** [-2.22]** [6.20]*** [0.15]
D JM 0.338 0.276 -1.220 -0.626 -0.439 -0.467 -1.362 -1.516 -1.223 -0.969 -1.373 -0.510[1.20] [1.04] [-1.55] [-0.93] [-0.70] [-0.76] [-1.73]* [-1.95]* [-2.74]*** [-2.29]** [-3.06]*** [-1.51]
D FF -0.704 -0.858 -2.753 -2.026 -0.676 -0.652 -1.368 -1.394 -1.595 -1.175 -2.013 -1.084[-1.34] [-1.75]* [-3.55]*** [-2.91]*** [-1.01] [-1.15] [-0.71] [-0.72] [-4.10]*** [-3.43]*** [-1.78]* [-0.97]
l it-1 0.414 0.420 0.704 0.709 0.447 0.445 0.367 0.354 0.616 0.660 0.617 0.726[24.12]*** [25.01]*** [8.77]*** [8.84]*** [11.92]*** [11.68]*** [7.62]*** [7.14]*** [12.51]*** [16.40]*** [13.22]*** [24.17]***
D JM * l it-1 0.177 0.188 0.022 0.032 0.177 0.186 0.343 0.363 0.239 0.218 0.236 0.126[4.38]*** [4.75]*** [0.20] [0.31] [2.13]** [2.26]** [3.94]*** [4.19]*** [3.50]*** [3.39]*** [3.91]*** [2.46]**
D FF * l it-1 0.389 0.387 0.196 0.183 0.378 0.381 0.473 0.478 0.279 0.239 0.368 0.241[7.60]*** [7.69]*** [2.15]** [1.98]** [5.40]*** [5.41]*** [6.92]*** [7.25]*** [3.65]*** [3.19]*** [4.65]*** [3.39]***
y it 0.590 0.401 0.175 0.135 0.427 0.314 0.118 0.047 0.320 0.235 0.389 0.237[10.78]*** [9.77]*** [1.31] [1.05] [4.28]*** [3.99]*** [0.97] [0.45] [5.59]*** [5.50]*** [6.83]*** [5.53]***
-0.278 -0.122 0.028 0.035 -0.103 -0.009 -0.018 0.018 -0.023 0.011 -0.046 0.018[-6.21]*** [-3.74]*** [0.22] [0.28] [-1.27] [-0.15] [-0.18] [0.22] [-0.70] [0.41] [-1.12] [0.47]
D JM * y it -0.075 -0.086 0.122 0.033 -0.179 -0.142 0.289 0.325 -0.147 -0.115 -0.251 -0.119[-0.84] [-1.02] [0.77] [0.22] [-1.46] [-1.21] [1.80]* [2.00]** [-1.99]** [-1.71]* [-3.68]*** [-2.04]**0.028 0.040 -0.088 0.017 0.055 0.024 -0.134 -0.144 -0.053 -0.060 0.026 -0.025[0.39] [0.59] [-0.48] [0.10] [0.52] [0.24] [-0.83] [-0.89] [-1.20] [-1.29] [0.45] [-0.50]
D FF * y it -0.575 -0.426 0.222 0.197 -0.641 -0.549 -0.377 -0.309 -0.355 -0.297 -0.267 -0.124[-5.23]*** [-4.15]*** [1.44] [1.23] [-3.56]*** [-3.31]*** [-1.59] [-1.39] [-3.66]*** [-3.48]*** [-2.90]*** [-1.44]
0.431 0.315 -0.282 -0.221 0.441 0.366 0.455 0.420 0.147 0.139 -0.022 -0.066[3.51]*** [2.69]*** [-1.71]* [-1.29] [2.18]** [1.91]* [1.90]* [1.84]* [1.86]* [1.89]* [-0.24] [-0.71]
w/r it 0.4714634 0.4628736 -1.099327 -0.10456 0.4351681 0.5266644 0.5524451 0.8382949 -0.578993 -0.037494 -0.711394 -0.05416[1.91]* [11.20]*** [-3.32]*** [-0.86] [1.38] [4.36]*** [0.81] [5.39]*** [-3.39]*** [-1.49] [-4.69]*** [-1.83]*
-0.031 -0.076 0.584 -0.203 -0.068 -0.132 -0.148 -0.299 0.423 -0.016 0.427 -0.064[-0.14] [-2.38]** [2.49]** [-2.09]** [-0.23] [-1.44] [-0.25] [-2.44]** [2.72]*** [-0.84] [2.93]*** [-2.94]***
D JM * w/r it -0.418 -0.381 0.128 -0.066 -0.318 -0.335 -0.533 -0.518 0.189 0.124 0.120 -0.092[-5.69]*** [-5.65]*** [0.73] [-0.41] [-1.81]* [-1.94]* [-2.09]** [-2.07]** [2.24]** [1.51] [1.08] [-0.80]
0.225 0.203 0.186 0.198 0.426 0.439 0.473 0.461 -0.052 -0.042 0.052 0.124[3.90]*** [3.66]*** [1.66]* [1.78]* [3.03]*** [3.15]*** [2.29]** [2.21]** [-0.86] [-0.66] [0.59] [1.27]
D FF * w/r it -0.067 -0.074 0.313 0.077 0.262 0.196 -1.277 -1.363 0.292 0.110 0.039 -0.264[-0.39] [-0.48] [1.38] [0.39] [0.63] [0.51] [-1.32] [-1.38] [2.70]*** [1.20] [0.23] [-1.80]*-0.068 -0.035 0.241 0.272 -0.293 -0.253 1.176 1.234 -0.106 -0.019 0.165 0.318[-0.51] [-0.27] [1.61] [1.76]* [-0.81] [-0.75] [2.06]** [2.22]** [-1.16] [-0.24] [0.69] [1.34]
Industry dummies Yes Yes Yes Yes Yes Yes Yes Yes Yes Yes Yes YesYear dummies Yes Yes Yes Yes Yes Yes Yes Yes Yes Yes Yes YesTime trend No No No No No No No No No No No NoN 49,230 49,230 3,822 3,822 6,839 6,839 4,276 4,276 21,329 21,329 15,792 15,792Hansen test 565.24 629.14 186.9 195.66 214.25 220.03 201.29 193.68 236.2 244.04 200.04 199.75Hansen test p-value 0.000 0.000 0.978 0.941 0.368 0.270 0.196 0.316 0.341 0.222 0.642 0.647AB test for AR(1) -28.990 -30.190 -6.130 -6.090 -11.900 -12.040 -10.670 -10.570 -9.350 -10.050 -7.010 -8.470AB test for AR(1) p-value 0.000 0.000 0.000 0.000 0.000 0.000 0.000 0.000 0.000 0.000 0.000 0.000AB test for AR(2) 6.650 6.970 3.340 3.290 2.530 2.510 4.240 4.090 1.820 1.840 0.900 0.800AB test for AR(2) p-value 0.000 0.000 0.001 0.001 0.012 0.012 0.000 0.000 0.069 0.066 0.370 0.424Speed-of-adjustment Japanese MNEs 0.409 0.392 0.275 0.259 0.376 0.369 0.289 0.283 0.145 0.122 0.147 0.149 Foreign-owned firms 0.196 0.193 0.100 0.109 0.175 0.174 0.160 0.167 0.105 0.101 0.015 0.033 Domestic firms 0.586 0.580 0.296 0.291 0.553 0.555 0.633 0.646 0.384 0.340 0.383 0.274Notes: 1) ***, **, and * indicate level of significance at 1%, 5% and 10%, respectively. Figures in brackets indicate z-ratios.
2) Foreign-owned firms are defined as firms whose more than 50 percent of equity is owned by foreign investors.Source: METI database.
36