Embed Size (px)
Citation preview
Enbridge Inc. 2014 Annual Information Form
ENBRIDGE INC.
ANNUAL INFORMATION FORM
FOR THE YEAR ENDED DECEMBER 31, 2014
February 19, 2015
Enbridge Inc. 2014 Annual Information Form
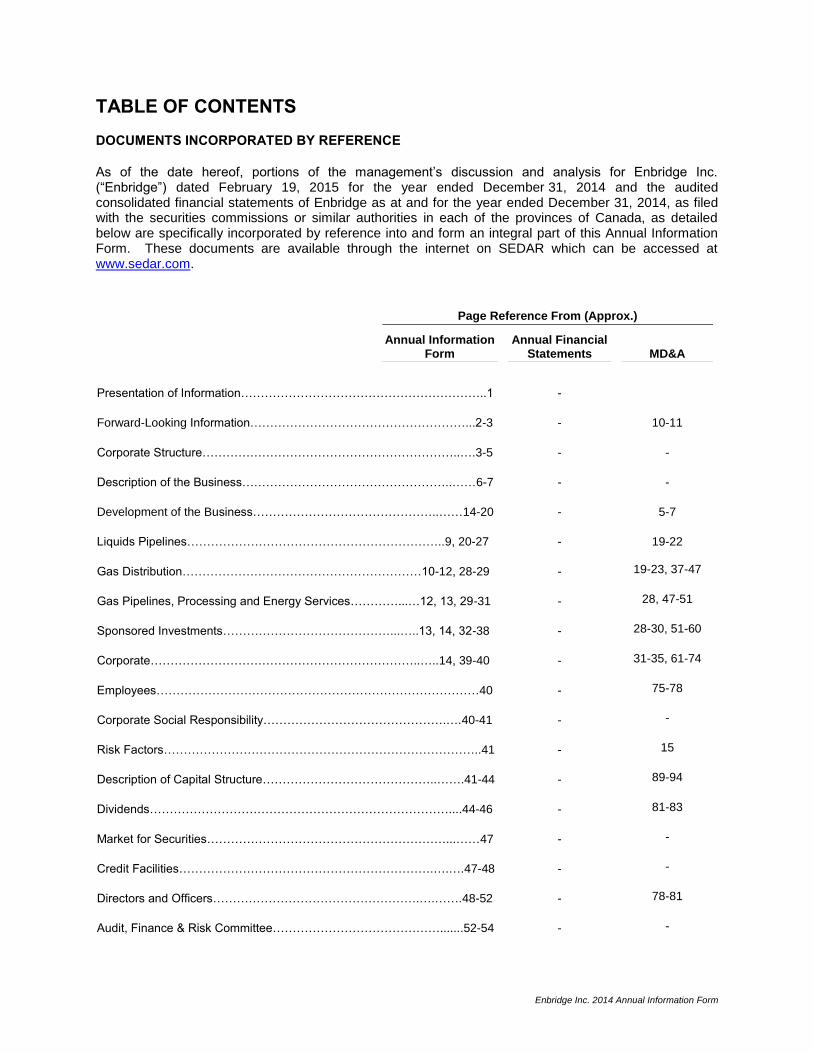
TABLE OF CONTENTS
DOCUMENTS INCORPORATED BY REFERENCE
As of the date hereof, portions of the management’s discussion and analysis for Enbridge Inc. (“Enbridge”) dated February 19, 2015 for the year ended December 31, 2014 and the audited consolidated financial statements of Enbridge as at and for the year ended December 31, 2014, as filed with the securities commissions or similar authorities in each of the provinces of Canada, as detailed below are specifically incorporated by reference into and form an integral part of this Annual Information Form. These documents are available through the internet on SEDAR which can be accessed at www.sedar.com.
Page Reference From (Approx.)
Annual Information Form
Annual Financial Statements MD&A
Presentation of Information……………………………………………………..1
Forward-Looking Information………………………………………………...2-3
Corporate Structure………………………………………………………..….3-5
Description of the Business……………………………………………..……6-7
Development of the Business………………………………………..……14-20
Liquids Pipelines………………………………………………………..9, 20-27
Gas Distribution……………………………………………………10-12, 28-29
Gas Pipelines, Processing and Energy Services…………...…12, 13, 29-31
Sponsored Investments……………………………………...…..13, 14, 32-38
Corporate…………………………………………………………..…..14, 39-40
Employees………………………………………………………………………40
Corporate Social Responsibility……………………………………….….40-41
Risk Factors……………………………………………………………………..41
Description of Capital Structure……………………………………..…….41-44
Dividends…………………………………………………………………....44-46
Market for Securities……………………………………………………...……47
Credit Facilities……………………………………………………….….….47-48
Directors and Officers…………………………………………….….…….48-52
Audit, Finance & Risk Committee…………………………………….......52-54
-
-
-
-
-
-
-
-
-
-
-
-
-
-
-
-
-
-
-
10-11
-
-
5-7
19-22
19-23, 37-47
28, 47-51
28-30, 51-60
31-35, 61-74
75-78
-
15
89-94
81-83
-
-
78-81
-
Enbridge Inc. 2014 Annual Information Form
Page Reference From (Approx.)
Annual Information Form
Annual Financial Statements MD&A
Legal Proceedings…………………………………………………………...…55
Interest of Management and Others in Material Transactions………….....55
Registrar and Transfer Agent………………………………………...............56
Material Contracts…………………………………………………………..….56
Interests of Experts…………………………………………….………………56
Additional Information……………………………………………………...56-57
Appendix A – Terms of Reference for the Audit, Finance & Risk Committee………………………………………………….…….……A-1
Appendix B – Trading Information for the Company’s Publicly Listed Securities………………………………………………….….B-1
Appendix C – Summary of Terms and Conditions of the Company’s Authorized Securities ………………………………………………………...C-1
61
-
-
-
-
-
-
-
-
-
-
-
-
-
-
-
-
-
-
-
Enbridge Inc. 2014 Annual Information Form
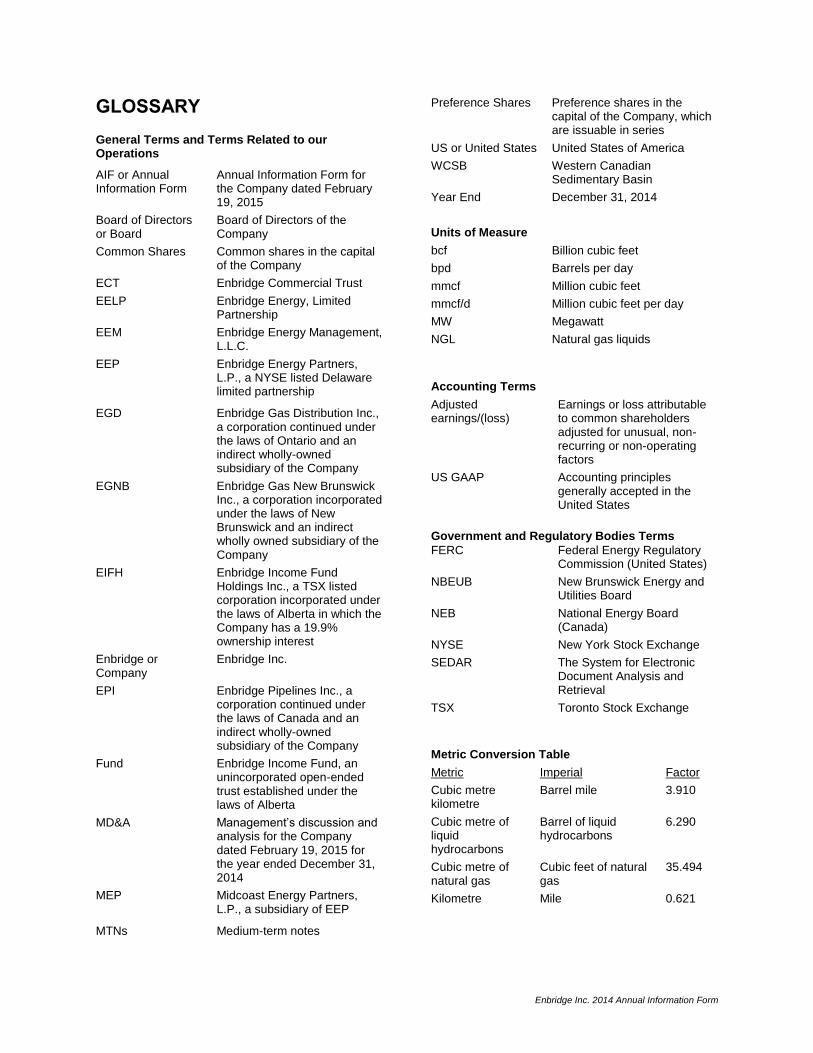
GLOSSARY
General Terms and Terms Related to our Operations
AIF or Annual Information Form
Annual Information Form for the Company dated February 19, 2015
Board of Directors or Board
Board of Directors of the Company
Common Shares Common shares in the capital of the Company
ECT Enbridge Commercial Trust
EELP Enbridge Energy, Limited Partnership
EEM Enbridge Energy Management, L.L.C.
EEP Enbridge Energy Partners, L.P., a NYSE listed Delaware limited partnership
EGD Enbridge Gas Distribution Inc., a corporation continued under the laws of Ontario and an indirect wholly-owned subsidiary of the Company
EGNB Enbridge Gas New Brunswick Inc., a corporation incorporated under the laws of New Brunswick and an indirect wholly owned subsidiary of the Company
EIFH Enbridge Income Fund Holdings Inc., a TSX listed corporation incorporated under the laws of Alberta in which the Company has a 19.9% ownership interest
Enbridge or Company
Enbridge Inc.
EPI Enbridge Pipelines Inc., a corporation continued under the laws of Canada and an indirect wholly-owned subsidiary of the Company
Fund Enbridge Income Fund, an unincorporated open-ended trust established under the laws of Alberta
MD&A Management’s discussion and analysis for the Company dated February 19, 2015 for the year ended December 31, 2014
MEP
Midcoast Energy Partners, L.P., a subsidiary of EEP
MTNs Medium-term notes
Preference Shares Preference shares in the capital of the Company, which are issuable in series
US or United States United States of America
WCSB Western Canadian Sedimentary Basin
Year End December 31, 2014
Units of Measure
bcf Billion cubic feet
bpd Barrels per day
mmcf Million cubic feet
mmcf/d Million cubic feet per day
MW Megawatt
NGL Natural gas liquids
Accounting Terms
Adjusted earnings/(loss)
Earnings or loss attributable to common shareholders adjusted for unusual, non-recurring or non-operating factors
US GAAP Accounting principles generally accepted in the United States
Government and Regulatory Bodies Terms
FERC Federal Energy Regulatory Commission (United States)
NBEUB New Brunswick Energy and Utilities Board
NEB National Energy Board (Canada)
NYSE New York Stock Exchange
SEDAR The System for Electronic Document Analysis and Retrieval
TSX Toronto Stock Exchange
Metric Conversion Table
Metric Imperial Factor
Cubic metre kilometre
Barrel mile 3.910
Cubic metre of liquid hydrocarbons
Barrel of liquid hydrocarbons
6.290
Cubic metre of natural gas
Cubic feet of natural gas
35.494
Kilometre Mile 0.621
1
Enbridge Inc. 2014 Annual Information Form
PRESENTATION OF INFORMATION
Unless otherwise noted, the information contained in this Annual Information Form is given at or for the year ended December 31, 2014. Amounts are expressed in Canadian dollars unless otherwise indicated. Financial information is presented in accordance with US GAAP.
The annual capacities noted throughout this AIF take into account estimated crude receipt and delivery patterns and ongoing pipeline maintenance and reflect achievable pipeline capacity over long periods of time.
NON-GAAP MEASURES
This AIF contains references to adjusted earnings, which represent earnings attributable to common shareholders adjusted for unusual, non-recurring or non-operating factors on both a consolidated and segmented basis. Adjusted earnings and adjusted earnings for each of the segments are not measures that have a standardized meaning prescribed by US GAAP and are not considered GAAP measures; therefore, these measures may not be comparable with similar measures presented by other issuers.
For additional information with respect to non-GAAP measures, please refer to the discussion under the subheading “Performance Overview - Non-GAAP Measures” and the heading “Non-GAAP Reconciliations” of the MD&A.
2
Enbridge Inc. 2014 Annual Information Form
FORWARD-LOOKING INFORMATION
Forward-looking information, or forward-looking statements, have been included in this AIF to provide the Company’s shareholders and potential investors with information about the Company and its subsidiaries and affiliates, including management’s assessment of Enbridge’s and its subsidiaries’ future plans and operations. This information may not be appropriate for other purposes. Forward-looking statements are typically identified by words such as ‘‘anticipate’’, ‘‘expect’’, ‘‘project’’, ‘‘estimate’’, ‘‘forecast’’, ‘‘plan’’, ‘‘intend’’, ‘‘target’’, ‘‘believe’’ and similar words suggesting future outcomes or statements regarding an outlook.
Forward-looking information or statements included or incorporated by reference in this document include statements with respect to the following:
expected earnings/(loss) or adjusted earnings/(loss);
expected earnings/(loss) or adjusted earnings/(loss) per share;
expected future cash flows;
expected costs related to projects under construction;
expected in-service dates for projects under construction;
expected capital expenditures;
estimated future dividends;
the Canadian Restructuring Plan; and
expected costs related to leak remediation and potential insurance recoveries. Although Enbridge believes these forward-looking statements are reasonable based on the information available on the date such statements are made and processes used to prepare the information, such statements are not guarantees of future performance and readers are cautioned against placing undue reliance on forward-looking statements. By their nature, these statements involve a variety of assumptions, known and unknown risks and uncertainties and other factors, which may cause actual results, levels of activity and achievements to differ materially from those expressed or implied by such statements.
Material assumptions include assumptions about the following:
the expected supply of and demand for crude oil, natural gas, NGL and renewable energy;
prices of crude oil, natural gas, NGL and renewable energy;
expected exchange rates;
inflation and interest rates;
the availability and price of labour and pipeline construction materials;
operational reliability;
customer and regulatory approvals;
maintenance of support and regulatory approvals for the Company’s projects;
anticipated in-service dates;
final approval of definitive transfer terms by Enbridge and EIFH and the Fund with respect to the Canadian Restructuring Plan;
receipt of all necessary shareholder and regulatory approvals that may be required for the Canadian Restructuring Plan (as discussed in this AIF); and
weather.
Assumptions regarding the expected supply of and demand for crude oil, natural gas, NGL and renewable energy, and the prices of these commodities, are material to and underlie all forward-looking statements. These factors are relevant to all forward-looking statements as they may impact current and future levels of demand for the Company’s services. Similarly, exchange rates, inflation and interest rates impact the economies and business environments in which the Company operates, and may impact levels of demand for the Company’s services and cost of inputs, and are therefore inherent in all forward-
3
Enbridge Inc. 2014 Annual Information Form
looking statements. Due to the interdependencies and correlation of these macroeconomic factors, the impact of any one assumption on a forward-looking statement cannot be determined with certainty, particularly with respect to expected earnings/(loss) or adjusted earnings/(loss) and associated per share amounts, and the impact of the Canadian Restructuring Plan on Enbridge, including the adjusted dividend payout policy or estimated future dividends.
The most relevant assumptions associated with forward-looking statements on projects under construction, including estimated in-service dates and expected capital expenditures, include the following:
the availability and price of labour and pipeline construction materials;
the effects of inflation and foreign exchange rates on labour and costs;
the effects of interest rates on borrowing costs;
the impact of weather; and
customer and regulatory approvals on construction and in-service schedules. Enbridge’s forward-looking statements are subject to risks and uncertainties pertaining to operating performance, regulatory parameters, project approval and support, weather, economic and competitive conditions, changes in tax law and tax rates, exchange rates, interest rates, commodity prices and supply and demand for commodities, including those risks and uncertainties discussed in this AIF and in the Company’s other filings with Canadian and United States securities regulators. The impact of any one risk, uncertainty or factor on a particular forward-looking statement is not determinable with certainty as these are interdependent and Enbridge’s future course of action depends on management’s assessment of all information available at the relevant time. Except to the extent required by applicable law, Enbridge assumes no obligation to publicly update or revise any forward-looking statements made in this AIF or otherwise, whether as a result of new information, future events or otherwise. All subsequent forward-looking statements, whether written or oral, attributable to Enbridge or persons acting on the Company’s behalf, are expressly qualified in their entirety by these cautionary statements.
CORPORATE STRUCTURE
INCORPORATION
Enbridge was incorporated on April 13, 1970 under the Companies Ordinance of the Northwest Territories (the “NWT Ordinance”) and was continued under the Canada Business Corporations Act (the “CBCA”) on December 15, 1987. The head and registered offices of Enbridge are located at 3000, 425 - 1
st Street SW, Calgary, Alberta, T2P 3L8. Enbridge is a public company trading on both the TSX
and NYSE under the symbol “ENB”. Significant dates and events are set forth below.
Date Event
April 13, 1970 Incorporated under the NWT Ordinance as “Gallery Holdings Ltd.”.
December 15, 1987 Continued under the CBCA under the name “159569 Canada Ltd.”.
April 30, 1992 Amended Articles to (i) change the Company’s name from “159569 Canada Ltd.” to “Interprovincial Pipe Line System Inc.”, and (ii) change the Company’s authorized shares to an unlimited number of Common Shares and an unlimited number of Preference Shares.
December 18, 1992 Amended Articles in accordance with the Plan of Arrangement effected on December 18, 1992 between the Company and EPI (formerly Interprovincial Pipe Line Inc.). Pursuant to the Plan of Arrangement, the Company, previously a wholly-owned subsidiary of EPI, became the parent of EPI.
4
Enbridge Inc. 2014 Annual Information Form
Date Event
May 5, 1994 Amended Articles to (i) change the Company’s name from “Interprovincial Pipe Line System Inc.” to “IPL Energy Inc.”, and (ii) change the place of the registered office of the Company to Calgary, Alberta.
October 7, 1998 Amended Articles to change the Company’s name from “IPL Energy Inc.” to “Enbridge Inc.”.
November 24, 1998 Amended Articles to designate the 5.50% Cumulative Redeemable Preference Shares, Series A in the capital of the Company (the “Series A Preference Shares”).
April 29, 1999 Amended Articles to (i) divide each then issued and outstanding Common Share on a two-for-one basis, effective May 10, 1999; and (ii) provide the Board of Directors with a process to add directors between meetings of the shareholders.
May 5, 2005 Amended Articles to divide each then issued and outstanding Common Share on a two-for-one basis, effective May 21, 2005.
May 11, 2011 Amended Articles to divide each then issued and outstanding Common Share on a two-for-one basis, effective May 26, 2011.
September 28, 2011 Amended Articles to designate the Cumulative Redeemable Preference Shares, Series B in the capital of the Company (the “Series B Preference Shares”) and the Cumulative Redeemable Preference Shares, Series C in the capital of the Company (the “Series C Preference Shares”).
November 21, 2011 Amended Articles to designate the Cumulative Redeemable Preference Shares, Series D in the capital of the Company (the “Series D Preference Shares”) and the Cumulative Redeemable Preference Shares, Series E in the capital of the Company (the “Series E Preference Shares”).
January 16, 2012 Amended Articles to designate the Cumulative Redeemable Preference Shares, Series F in the capital of the Company (the “Series F Preference Shares”) and the Cumulative Redeemable Preference Shares, Series G in the capital of the Company (the “Series G Preference Shares”).
March 27, 2012 Amended Articles to designate the Cumulative Redeemable Preference Shares, Series H in the capital of the Company (the “Series H Preference Shares”) and the Cumulative Redeemable Preference Shares, Series I in the capital of the Company (the “Series I Preference Shares”).
April 16, 2012 Amended Articles to designate the Cumulative Redeemable Preference Shares, Series J in the capital of the Company (the “Series J Preference Shares”) and the Cumulative Redeemable Preference Shares, Series K in the capital of the Company (the “Series K Preference Shares”).
May 17, 2012 Amended Articles to designate the Cumulative Redeemable Preference Shares, Series L in the capital of the Company (the “Series L Preference Shares”) and the Cumulative Redeemable Preference Shares, Series M in the capital of the Company (the “Series M Preference Shares”).
July 12, 2012 Amended Articles to designate the Cumulative Redeemable Preference Shares, Series N in the capital of the Company (the “Series N Preference Shares”) and the Cumulative Redeemable Preference Shares, Series O in the capital of the Company (the “Series O Preference Shares”).
September 11, 2012 Amended Articles to designate the Cumulative Redeemable Preference Shares, Series P in the capital of the Company (the “Series P Preference Shares”) and the Cumulative Redeemable Preference Shares, Series Q in the capital of the Company (the “Series Q Preference Shares”).
December 3, 2012 Amended Articles to designate the Cumulative Redeemable Preference Shares, Series R in the capital of the Company (the “Series R Preference Shares”) and the Cumulative Redeemable Preference Shares, Series S in the capital of the Company (the “Series S Preference Shares”).
5
Enbridge Inc. 2014 Annual Information Form
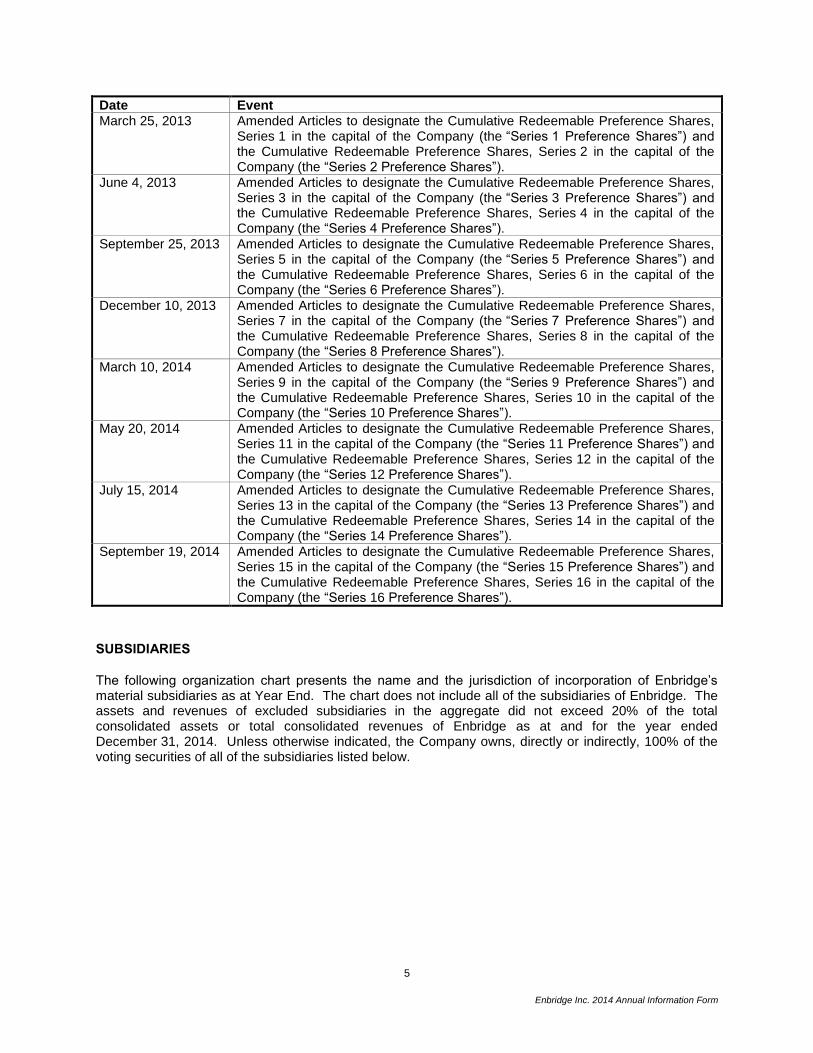
Date Event
March 25, 2013 Amended Articles to designate the Cumulative Redeemable Preference Shares, Series 1 in the capital of the Company (the “Series 1 Preference Shares”) and the Cumulative Redeemable Preference Shares, Series 2 in the capital of the Company (the “Series 2 Preference Shares”).
June 4, 2013 Amended Articles to designate the Cumulative Redeemable Preference Shares, Series 3 in the capital of the Company (the “Series 3 Preference Shares”) and the Cumulative Redeemable Preference Shares, Series 4 in the capital of the Company (the “Series 4 Preference Shares”).
September 25, 2013 Amended Articles to designate the Cumulative Redeemable Preference Shares, Series 5 in the capital of the Company (the “Series 5 Preference Shares”) and the Cumulative Redeemable Preference Shares, Series 6 in the capital of the Company (the “Series 6 Preference Shares”).
December 10, 2013 Amended Articles to designate the Cumulative Redeemable Preference Shares, Series 7 in the capital of the Company (the “Series 7 Preference Shares”) and the Cumulative Redeemable Preference Shares, Series 8 in the capital of the Company (the “Series 8 Preference Shares”).
March 10, 2014 Amended Articles to designate the Cumulative Redeemable Preference Shares, Series 9 in the capital of the Company (the “Series 9 Preference Shares”) and the Cumulative Redeemable Preference Shares, Series 10 in the capital of the Company (the “Series 10 Preference Shares”).
May 20, 2014 Amended Articles to designate the Cumulative Redeemable Preference Shares, Series 11 in the capital of the Company (the “Series 11 Preference Shares”) and the Cumulative Redeemable Preference Shares, Series 12 in the capital of the Company (the “Series 12 Preference Shares”).
July 15, 2014 Amended Articles to designate the Cumulative Redeemable Preference Shares, Series 13 in the capital of the Company (the “Series 13 Preference Shares”) and the Cumulative Redeemable Preference Shares, Series 14 in the capital of the Company (the “Series 14 Preference Shares”).
September 19, 2014 Amended Articles to designate the Cumulative Redeemable Preference Shares, Series 15 in the capital of the Company (the “Series 15 Preference Shares”) and the Cumulative Redeemable Preference Shares, Series 16 in the capital of the Company (the “Series 16 Preference Shares”).
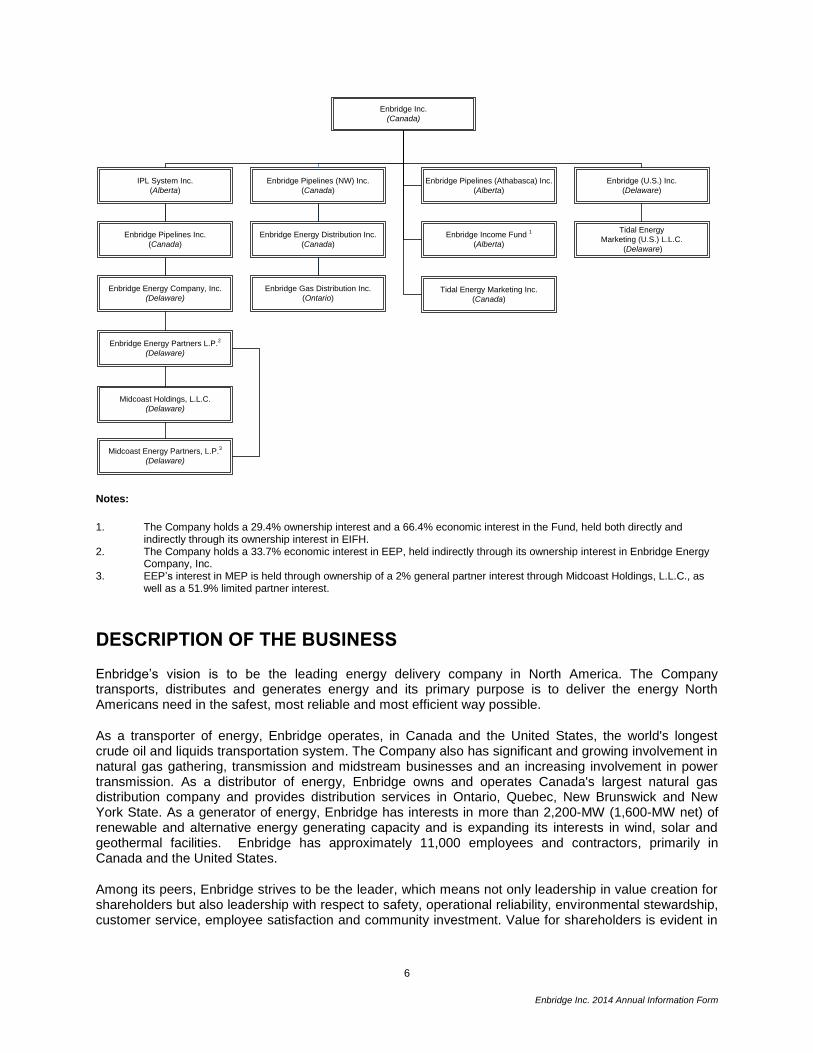
SUBSIDIARIES
The following organization chart presents the name and the jurisdiction of incorporation of Enbridge’s material subsidiaries as at Year End. The chart does not include all of the subsidiaries of Enbridge. The assets and revenues of excluded subsidiaries in the aggregate did not exceed 20% of the total consolidated assets or total consolidated revenues of Enbridge as at and for the year ended December 31, 2014. Unless otherwise indicated, the Company owns, directly or indirectly, 100% of the voting securities of all of the subsidiaries listed below.
6
Enbridge Inc. 2014 Annual Information Form
Enbridge Inc.
(Canada)
Enbridge Pipelines (NW) Inc.
(Canada)
IPL System Inc.
(Alberta)
Enbridge Pipelines Inc.
(Canada)
Enbridge Energy Company, Inc.
(Delaware)
Enbridge Pipelines (Athabasca) Inc.
(Alberta)
Enbridge Income Fund 1
(Alberta)
Tidal Energy Marketing Inc.
(Canada)
Enbridge (U.S.) Inc.
(Delaware)
Tidal Energy
Marketing (U.S.) L.L.C.
(Delaware)
Enbridge Energy Distribution Inc.
(Canada)
Enbridge Gas Distribution Inc.
(Ontario)
Enbridge Energy Partners L.P.2
(Delaware)
Midcoast Holdings, L.L.C.
(Delaware)
Midcoast Energy Partners, L.P.3
(Delaware)
Notes:
1. The Company holds a 29.4% ownership interest and a 66.4% economic interest in the Fund, held both directly and indirectly through its ownership interest in EIFH.
2. The Company holds a 33.7% economic interest in EEP, held indirectly through its ownership interest in Enbridge Energy Company, Inc.
3. EEP’s interest in MEP is held through ownership of a 2% general partner interest through Midcoast Holdings, L.L.C., as well as a 51.9% limited partner interest.
DESCRIPTION OF THE BUSINESS
Enbridge’s vision is to be the leading energy delivery company in North America. The Company transports, distributes and generates energy and its primary purpose is to deliver the energy North Americans need in the safest, most reliable and most efficient way possible.
As a transporter of energy, Enbridge operates, in Canada and the United States, the world's longest crude oil and liquids transportation system. The Company also has significant and growing involvement in natural gas gathering, transmission and midstream businesses and an increasing involvement in power transmission. As a distributor of energy, Enbridge owns and operates Canada's largest natural gas distribution company and provides distribution services in Ontario, Quebec, New Brunswick and New York State. As a generator of energy, Enbridge has interests in more than 2,200-MW (1,600-MW net) of renewable and alternative energy generating capacity and is expanding its interests in wind, solar and geothermal facilities. Enbridge has approximately 11,000 employees and contractors, primarily in Canada and the United States.
Among its peers, Enbridge strives to be the leader, which means not only leadership in value creation for shareholders but also leadership with respect to safety, operational reliability, environmental stewardship, customer service, employee satisfaction and community investment. Value for shareholders is evident in
7
Enbridge Inc. 2014 Annual Information Form
the Company’s investment value proposition which combines visible growth, a reliable business model and a growing income stream.
The Company’s initiatives center around the following eight areas of strategic emphasis:
committing to operational safety and reliability;
focusing on project management;
preserving financing strength and flexibility;
strengthening of core businesses;
developing new platforms for growth and diversification;
upholding Enbridge values;
maintaining the Company’s social license to operate; and
attracting, retaining and developing highly capable people.
Strategies are reviewed at least annually with direction from the Board of Directors and provide guidance for the Company’s operations and future growth. While each area plays an important role in the execution of Enbridge’s broader long range plan, the most significant developments in the business over the past three years have been in the areas of operations management and the pursuit of growth projects, both in the Company’s core businesses as well as new ventures.
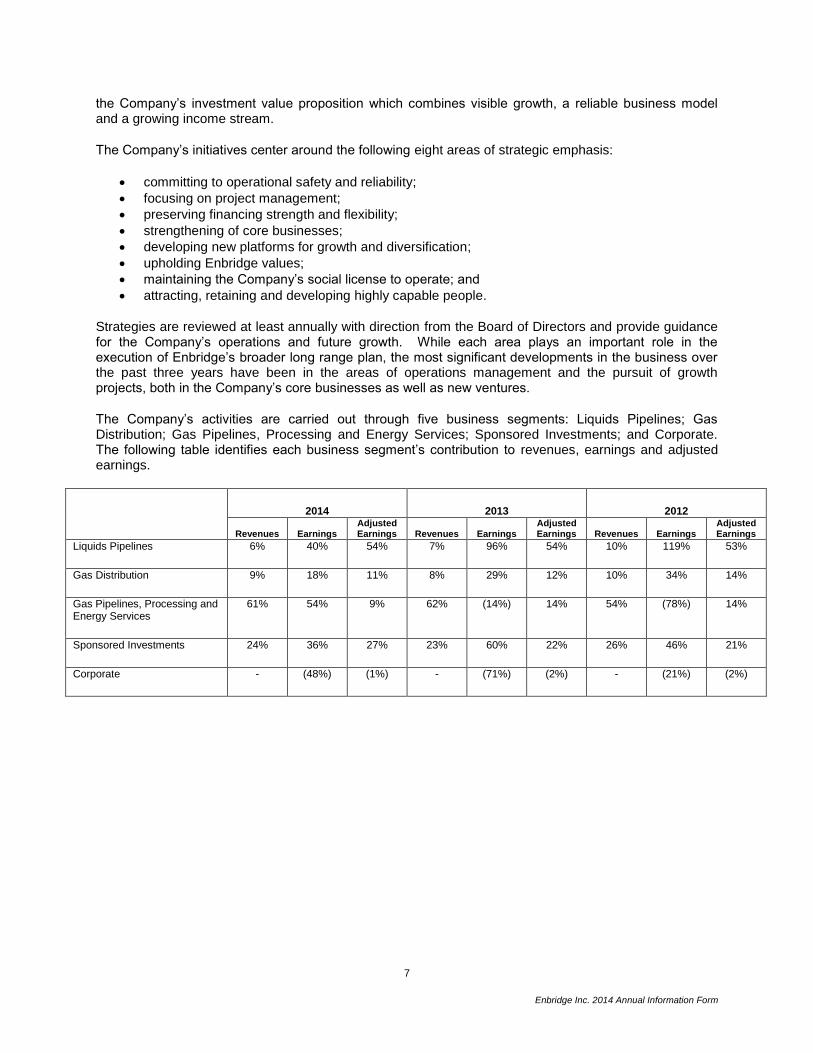
The Company’s activities are carried out through five business segments: Liquids Pipelines; Gas Distribution; Gas Pipelines, Processing and Energy Services; Sponsored Investments; and Corporate. The following table identifies each business segment’s contribution to revenues, earnings and adjusted earnings.
2014 2013 2012
Revenues Earnings Adjusted Earnings Revenues Earnings
Adjusted Earnings Revenues Earnings
Adjusted Earnings
Liquids Pipelines 6% 40% 54% 7% 96% 54% 10% 119% 53%
Gas Distribution 9% 18% 11% 8% 29% 12% 10% 34% 14%
Gas Pipelines, Processing and Energy Services
61% 54% 9% 62% (14%) 14% 54% (78%) 14%
Sponsored Investments 24% 36% 27% 23% 60% 22% 26% 46% 21%
Corporate - (48%) (1%) - (71%) (2%) - (21%) (2%)
8
Enbridge Inc. 2014 Annual Information Form
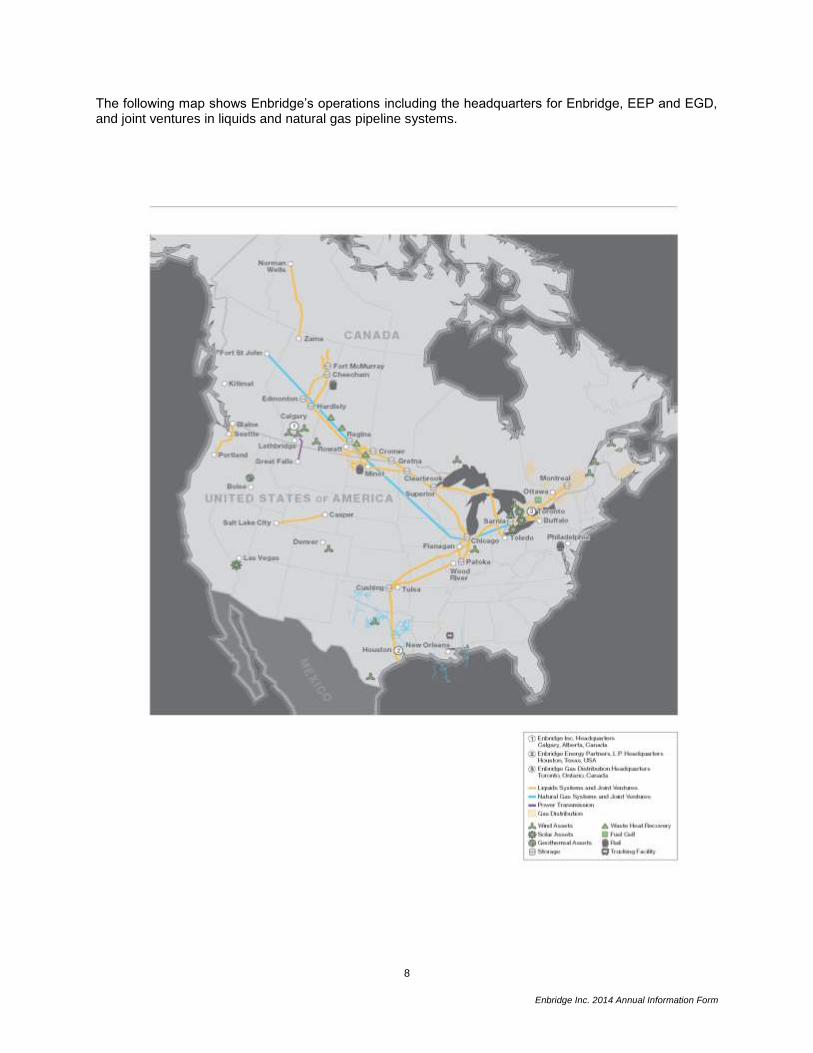
The following map shows Enbridge’s operations including the headquarters for Enbridge, EEP and EGD, and joint ventures in liquids and natural gas pipeline systems.
9
Enbridge Inc. 2014 Annual Information Form
LIQUIDS PIPELINES
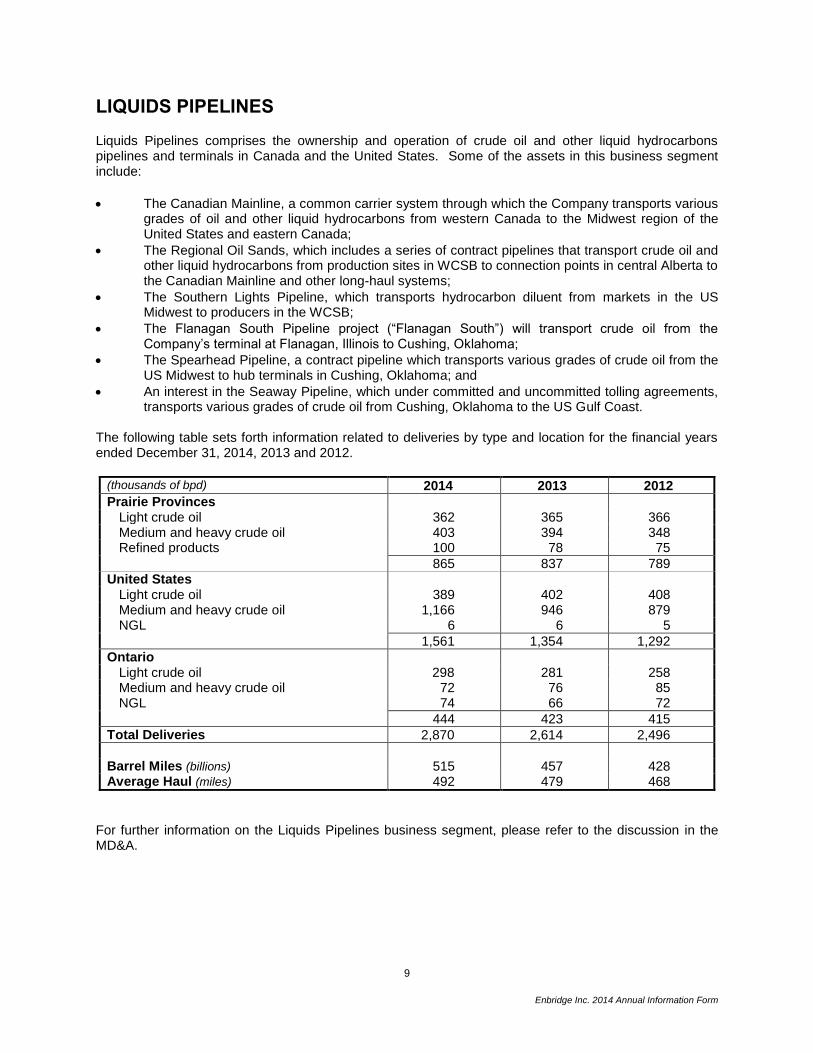
Liquids Pipelines comprises the ownership and operation of crude oil and other liquid hydrocarbons pipelines and terminals in Canada and the United States. Some of the assets in this business segment include:
The Canadian Mainline, a common carrier system through which the Company transports various grades of oil and other liquid hydrocarbons from western Canada to the Midwest region of the United States and eastern Canada;
The Regional Oil Sands, which includes a series of contract pipelines that transport crude oil and other liquid hydrocarbons from production sites in WCSB to connection points in central Alberta to the Canadian Mainline and other long-haul systems;
The Southern Lights Pipeline, which transports hydrocarbon diluent from markets in the US Midwest to producers in the WCSB;
The Flanagan South Pipeline project (“Flanagan South”) will transport crude oil from the Company’s terminal at Flanagan, Illinois to Cushing, Oklahoma;
The Spearhead Pipeline, a contract pipeline which transports various grades of crude oil from the US Midwest to hub terminals in Cushing, Oklahoma; and
An interest in the Seaway Pipeline, which under committed and uncommitted tolling agreements, transports various grades of crude oil from Cushing, Oklahoma to the US Gulf Coast.
The following table sets forth information related to deliveries by type and location for the financial years ended December 31, 2014, 2013 and 2012.
(thousands of bpd) 2014 2013 2012
Prairie Provinces Light crude oil 362 365 366 Medium and heavy crude oil 403 394 348 Refined products 100 78 75
865 837 789 United States
Light crude oil 389 402 408 Medium and heavy crude oil 1,166 946 879 NGL 6 6 5
1,561 1,354 1,292
Ontario Light crude oil 298 281 258 Medium and heavy crude oil 72 76 85 NGL 74 66 72
444 423 415
Total Deliveries 2,870 2,614 2,496
Barrel Miles (billions) 515 457 428 Average Haul (miles) 492 479 468
For further information on the Liquids Pipelines business segment, please refer to the discussion in the MD&A.
10
Enbridge Inc. 2014 Annual Information Form
GAS DISTRIBUTION
Gas Distribution consists of the Company’s natural gas utility operations, the core of which is EGD, which serves residential, commercial and industrial customers, primarily in central and eastern Ontario as well as northern New York State. This business segment also includes natural gas distribution activities in Quebec and New Brunswick, primarily through EGNB.
ENBRIDGE GAS DISTRIBUTION
EGD is Canada’s largest natural gas distribution company and has been in operation for more than 160 years. It serves over two million customers in central and eastern Ontario and parts of northern New York State. EGD’s utility operations are regulated by the Ontario Energy Board and by the New York State Public Service Commission. EGD is a reporting issuer in each of the provinces of Canada.
EGD is subject to seasonal demand as a significant portion of gas distribution customers use natural gas for space heating. As a result, volumes delivered and resulting revenues and earnings typically increase during the winter months of the first and fourth quarters of any given year. Revenues generated by EGD also vary from quarter-to-quarter with fluctuations in the price of natural gas, although the impact on earnings is neutral due to the pass through nature of these costs. Further, as a result of continued changes in customer billing to increase the fixed charge portion and decrease the per unit volumetric charge, revenues and earnings will shift from the colder winter quarters progressively to the warmer summer quarters, with no material impact on full year revenue and earnings. This change will also have an impact upon the comparability of a given quarter from year to year.
There are four principal interrelated aspects of the natural gas distribution business in which EGD is directly involved: Distribution Service, Gas Supply, Transportation and Storage.
Distribution Service
EGD’s principal source of revenue arises from distribution of natural gas to customers. The services provided to residential, small commercial and industrial heating customers are primarily on a general service basis (without a specific fixed term or fixed price contract). The services provided to larger commercial and industrial customers are usually on an annual contract basis under firm or interruptible service contracts.
Gas Supply
To acquire the necessary volume of gas to serve its customers, EGD maintains a diversified gas supply portfolio. During the year ended December 31, 2014, EGD acquired approximately 321 bcf of natural gas, of which 58% was acquired from western Canadian producers, 17% was acquired from suppliers in Chicago and 25% was acquired on a delivered basis in Ontario. EGD also transported 166 bcf of natural gas on behalf of direct purchase customers operating under a transportation service arrangement.
EGD’s system supply natural gas contracts have pricing structures responsive to supply and demand conditions in the North American natural gas market. The prices in these contracts may be indexed to Alberta, Chicago or New York based prices.
Transportation
TransCanada PipeLines Limited (“TransCanada”) transports approximately 69% or 321 bcf of the annual natural gas supply requirements of EGD’s customers. EGD has firm transportation service contracts with TransCanada for a portion of this requirement.
EGD relies on its long-term contracts with Union Gas Limited (“Union”) for transportation of natural gas from Dawn, Ontario to EGD’s major market in the Greater Toronto Area. These contracts effectively
11
Enbridge Inc. 2014 Annual Information Form
provide EGD with access to the United States sourced natural gas delivered to Dawn. These contracts also provide transportation for natural gas received at Dawn via the Vector Pipeline (“Vector”) as well as natural gas stored at EGD’s and Union’s storage pools in the Sarnia, Ontario area to EGD’s market areas.
Storage
The business of EGD is highly seasonal as daily market demand for gas fluctuates with changes in weather, with peak consumption occurring in the winter months. Utilization of storage facilities permits EGD to take delivery of gas on favourable terms during off-peak summer periods for subsequent use during the winter heating season. This practice permits EGD to minimize the annual cost of transportation of natural gas from its supply basins, assists in reducing its overall cost of natural gas supply and adds a measure of security in the event of any short-term interruption of transportation of natural gas to EGD’s franchise area.
EGD’s principal storage facilities are located in southwestern Ontario, near Dawn, and have a total working capacity of approximately 113 bcf. Approximately 92 bcf of the total working capacity is available to EGD for utility operations. EGD also has storage contracts with third parties for 21 bcf of storage capacity.
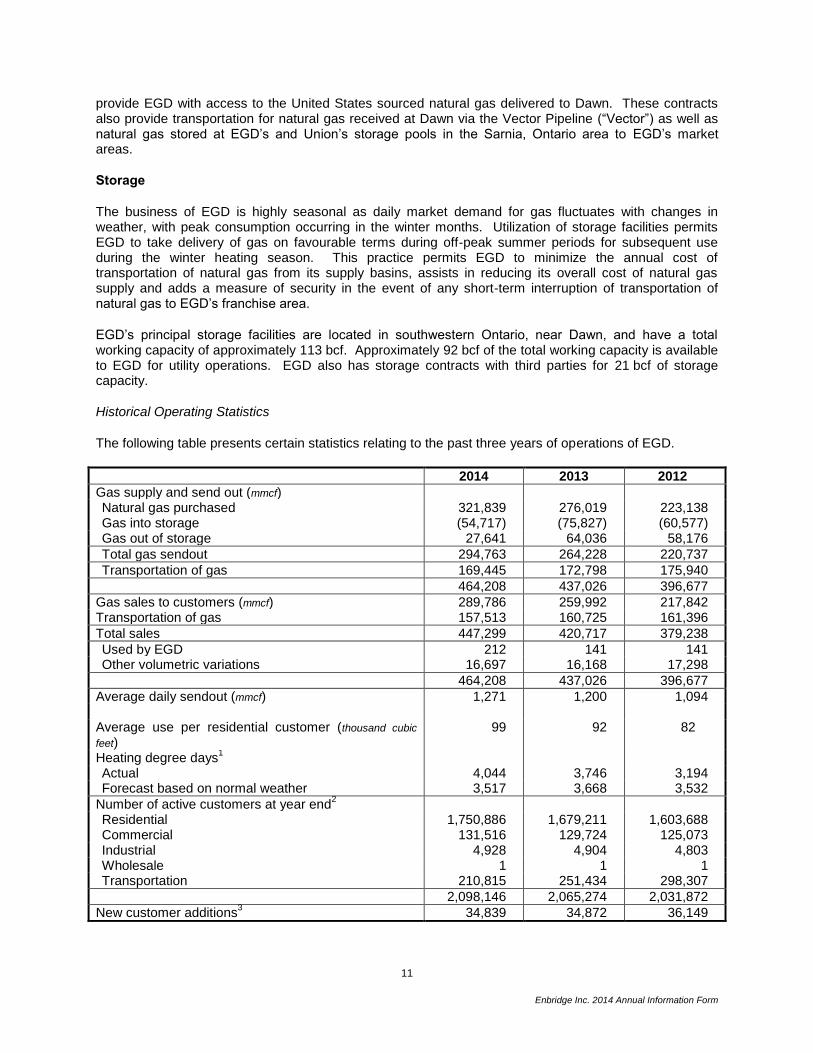
Historical Operating Statistics
The following table presents certain statistics relating to the past three years of operations of EGD.
2014 2013 2012
Gas supply and send out (mmcf) Natural gas purchased 321,839 276,019 223,138 Gas into storage (54,717) (75,827) (60,577) Gas out of storage 27,641 64,036 58,176
Total gas sendout 294,763 264,228 220,737
Transportation of gas 169,445 172,798 175,940
464,208 437,026 396,677
Gas sales to customers (mmcf) 289,786 259,992 217,842 Transportation of gas 157,513 160,725 161,396
Total sales 447,299 420,717 379,238
Used by EGD 212 141 141 Other volumetric variations 16,697 16,168 17,298
464,208 437,026 396,677
Average daily sendout (mmcf) 1,271 1,200 1,094 Average use per residential customer (thousand cubic
feet) 99 92 82
Heating degree days1
Actual 4,044 3,746 3,194 Forecast based on normal weather 3,517 3,668 3,532
Number of active customers at year end2
Residential 1,750,886 1,679,211 1,603,688 Commercial 131,516 129,724 125,073 Industrial 4,928 4,904 4,803 Wholesale 1 1 1 Transportation 210,815 251,434 298,307
2,098,146 2,065,274 2,031,872
New customer additions3 34,839 34,872 36,149
12
Enbridge Inc. 2014 Annual Information Form
Notes: 1. Heating degree days is a measure of coldness that is indicative of volumetric requirements for natural gas utilized for heating
purposes in EGD’s distribution franchise area. It is calculated by accumulating, for the fiscal year, the total number of degrees each day by which the daily mean temperature falls below 18 degrees Celsius. A daily mean temperature of zero degrees Celsius on any day equals 18 heating degree days for that day. The figures given are those accumulated in the Greater Toronto Area.
2. Number of active customers is the number of natural gas consuming customers at the end of the year and includes gas sales and transportation service customers. As the commodity cost of gas is flowed through to natural gas sales customers with no mark up, the composition of customers between natural gas sales and transportation service has no material impact on EGD’s earnings.
3. New customer additions is the number of new service lines installed during the year.
OTHER GAS DISTRIBUTION AND STORAGE Other gas distribution operations include natural gas distribution utility operations in Quebec and New Brunswick, the most significant being EGNB which is wholly-owned and operated by the Company. EGNB owns the natural gas distribution franchise in the province of New Brunswick and has approximately 11,000 customers. EGNB is regulated by the NBEUB. For further information on the Gas Distribution business segment, please refer to the discussion in the MD&A.
GAS PIPELINES, PROCESSING AND ENERGY SERVICES
Gas Pipelines, Processing and Energy Services consists of investments in natural gas pipelines, gathering and processing facilities and the Company’s energy services businesses, along with renewable energy and transmission facilities. Investments in natural gas processing include the Company’s 50% interest in Aux Sable Canada and 42.7% interest in Aux Sable US (collectively, “Aux Sable”). Aux Sable Canada is comprised of a natural gas fractionation and extraction business located near the terminus of the Alliance Pipeline (“Alliance”) and Canadian Midstream assets located in northwest Alberta. Aux Sable US owns and operates a NGL extraction and fractionation plant outside of Chicago, Illinois near the terminus of Alliance. Investments in natural gas pipelines include the Company’s interests in the Vector Pipeline (“Vector”) and transmission and gathering pipelines in the Gulf of Mexico. The energy services businesses undertake physical commodity marketing activity and logistical services, oversee refinery supply services and manage the Company’s volume commitments on Alliance, Vector and other pipeline systems. Canadian Midstream consists of the Company’s 71% investment in Cabin located 60-kilometres (37-miles) northeast of Fort Nelson, British Columbia in the Horn River Basin, as well as its 100% interest in Pipestone and varying interests (55% to 100%) in Sexsmith and its related sour gas gathering, compression and NGL handling facilities, located in the Peace River Arch (“PRA”) region of northwest Alberta. The Company is the operator of Cabin. The Canadian Midstream investments are underpinned by 20-year take-or-pay contracts with producers. Return on and of capital is based on the actual costs to purchase or construct the facilities. The Company is not impacted by throughput volumes; however, the Company shares in revenues obtained from available capacity sold to third parties or on volumes that exceed producer take-or-pay levels. Operating costs are passed through to producers. Phase 1 of Cabin is currently 98% completed. Cabin producers are expected to request the Company to commission and start-up Phase 1, once natural gas prices recover to a more economic level to support the Horn River Basin’s dry gas production. Phase 2 construction is approximately 40% complete and is in preservation mode awaiting producer’s requests for completion. In December 2012, the Company started earning fees on its total investment made to date on both Phases 1 and 2. Construction of the Pipestone and Sexsmith and related facilities were completed in 2014.
13
Enbridge Inc. 2014 Annual Information Form
Energy services provides energy supply and marketing services to North American refiners, producers and other customers. Crude oil and NGL marketing services are provided by Tidal Energy Marketing Inc. (“Tidal Energy”). This business transacts at many North American market hubs and provides its customers with various services, including transportation, storage, supply management, hedging programs and product exchanges. Tidal Energy is primarily a physical barrel marketing company focused on capturing value from quality, time and location differentials when opportunities arise. To execute these strategies, Energy services may lease storage or rail cars, as well as hold nomination or contractual rights on both third party and Enbridge-owned pipelines and storage facilities. Tidal Energy also provides natural gas marketing services, including marketing natural gas to optimize commitments on certain natural gas pipelines. Additionally, Tidal Energy provides natural gas supply, transportation, balancing and storage for third parties, leveraging its natural gas marketing expertise and access to transportation capacity. Any commodity price exposure created from Tidal Energy’s physical business is closely monitored and must comply with the Company’s formal risk management policies. To the extent transportation costs and other fees exceed the basis (location) differential, earnings will be negatively affected. The Company’s offshore activities include handling approximately 35% of total offshore gas production and 45% of deep water gas production. The Company has interests in 11 transmission and gathering pipelines and one oil pipeline. These pipelines include 2,100-kilometres (1,300-miles) of underwater pipe and offshore facilities, and transport approximately 6.5 billion cubic feet per day. For further information on the Gas Pipelines, Processing and Energy Services business segment, please refer to the discussion in the MD&A.
SPONSORED INVESTMENTS
Sponsored Investments includes the Company’s 33.7% economic interest in EEP, and Enbridge’s interests in both the Eastern Access and Lakehead System Mainline expansion projects held through EELP. Also within Sponsored Investments is the Company’s overall 66.4% economic interest in the Fund, held both directly and indirectly through EIFH.
EEP transports crude oil and other liquid hydrocarbons through common carrier and feeder pipelines, including the Lakehead Pipeline System (the “Lakehead System”), which is the United States portion of the Enbridge mainline system, and transports, gathers, processes and markets natural gas and NGL. The primary operations of the Fund include renewable power generation, natural gas transmission (through its 50% interest in Alliance), and crude oil and liquids pipelines transportation, which includes feeder pipelines and storage facilities in western Canada and an interest in the Southern Lights Pipeline.
The Fund is also involved in the generation, transportation and storage of energy. The Fund conducts its business through three operating segments:
Green Power, which has a combined renewable and alternative power generation capacity of 592-MW (530-MW net capacity) from a portfolio that consists of 100% interests in the Sarnia Solar Facility, the Amherstburg Solar Facility, the Tilbury Solar Facility, the Greenwich Wind Facility, the Talbot Wind Facility and the Ontario Wind Facility, a 50% interest in each of NRGreen Power Limited Partnership (which owns waste heat generating facilities) and the Sunbridge Wind Facility, and a 33% interest in each of the Magrath Wind Facility and Chin Chute Facility;
Liquids Transportation and Storage, which consists of the South Prairie Region and Crude Storage. The South Prairie Region owns and operates crude oil and liquids pipelines systems and storage assets in western Canada. The South Prairie Region connects producing fields in south-eastern Saskatchewan, south-western Manitoba and North Dakota with Enbridge’s Mainline System for transportation to the US and eastern Canada and includes the Bakken Expansion. Crude Storage is comprised of: (a) the Hardisty Contract Terminal and the Hardisty
14
Enbridge Inc. 2014 Annual Information Form
Storage Caverns, both situated in Hardisty, Alberta, which have a combined crude oil storage capacity of approximately 11 million barrels; and (b) tankage facilities in Saskatchewan which have a total capacity of approximately 450,000 barrels; and
Natural Gas Transmission, which includes the Fund’s 50% interest in Alliance, a natural gas pipeline system which transports natural gas from supply areas in north-western Alberta, north-eastern British Columbia and North Dakota to delivery points near Chicago, Illinois.
The Fund is a reporting issuer in each of the provinces of Canada.
For further information on the Sponsored Investments business segment, please refer to the discussion in the MD&A.
CORPORATE
The Corporate segment consists of a number of functions which support Enbridge as a whole, including Finance, Human Resources, Information Technology, Legal, Public and Government Affairs and other back-office functions. The majority of the costs for these functions are fully allocated to Enbridge’s operating business segments, although some of these costs, particularly financing costs, are retained within the Corporate segment.
Corporate also includes an investment in 38.9% of the common shares and an investment in the preferred shares of Noverco Inc. (“Noverco”), a holding company that owns approximately 71% of Gaz Metro Limited Partnership (“Gaz Metro”), a natural gas distribution company operating in the Province of Quebec with interests in subsidiary companies operating gas transmission, gas distribution and power distribution businesses in the Province of Quebec and the State of Vermont. Noverco also holds, directly and indirectly, an investment in Enbridge Common Shares.
Corporate also consists of new business development activities, general corporate investments and financing costs not allocated to the business segments. Other corporate costs include dividends on Enbridge preference shares as such dividends are a deduction in determining earnings attributable to common shareholders.
For further information on the Corporate business segment, please refer to the discussion in the MD&A.
DEVELOPMENT OF THE BUSINESS
A key focus in Enbridge’s corporate strategy is the successful execution of its growth capital program. In 2014, Enbridge successfully placed into service approximately $10 billion of growth projects across several business units. Enbridge also expanded its portfolio of commercially secured growth projects to $34 billion. All of these projects are expected to come into service by 2018; with more than $9 billion during 2015.
Enbridge’s growth capital program is anchored by three major market access initiatives, supported by several mainline system expansion and regional infrastructure projects that are designed to ensure that there is sufficient capacity to support these new extensions. The three major market initiatives are:
● the Gulf Coast Access Program; ● the Eastern Access Program; and ● the Light Oil Market Access Program.
In 2014, the Company made significant strides in its market access initiatives. In December 2014, Enbridge placed into service Flanagan South and Seaway Pipeline Twin, two key components of its Gulf Coast Access Program. Significant progress was also made in the Company’s Eastern Access Program with the completion of the Line 6B replacement and expansion project in September 2014.
15
Enbridge Inc. 2014 Annual Information Form
The $5.4 billion Gulf Coast Access Program includes the Seaway Pipeline, the Seaway Pipeline Twin, the Flanagan South and elements of the Canadian Mainline and the Lakehead System Mainline expansions, and will increase access to refinery markets in the Gulf Coast. The $2.7 billion Eastern Access Program is expected to allow for greater access for crude oil into Chicago, Illinois further east into Toledo, Ohio and ultimately into Ontario and Quebec. The Eastern Access Program includes the Company’s Toledo pipeline expansion, the Line 9 reversal, the existing Spearhead North pipeline expansion, the Line 6B replacement and the Line 5 expansion. Finally, the $6 billion Light Oil Market Access Program brings together a group of projects to support the increasing supply of light oil from Canada and the Bakken and also supplements the Eastern Access Program through the Line 9B and Line 6B capacity expansions. The Light Oil Market Access Program also includes the Southern Access Extension Project, the Sandpiper project, the Canadian Mainline System Terminal Flexibility and Connectivity, the twinning of the Spearhead North pipeline (“Spearhead North Twin”) and the Southern Access expansion included within the Lakehead System Mainline Expansion.
In 2014, Enbridge announced the $7.5 billion Line 3 Replacement (“L3R”) Program, the largest capital project in the Company’s history. The L3R Program will support the safety and operational reliability of the Company’s mainline system as well as enhance flexibility and optimize throughput. The Company also has approximately $6 billion in regional infrastructure projects under development, solidifying its position as the largest pipeline operator in the oil sands region of Alberta.
In keeping with the Company’s strategic priority to develop new platforms to diversify and sustain long-term growth, Enbridge continued to expand its renewable energy generation capacity in 2014. With the purchase of additional interests in the Lac Alfred and Massif du Sud wind farms, along with the acquisition of interests in two producing wind farms in the United States, Enbridge increased its net generating capacity to approximately 1,600-MW.
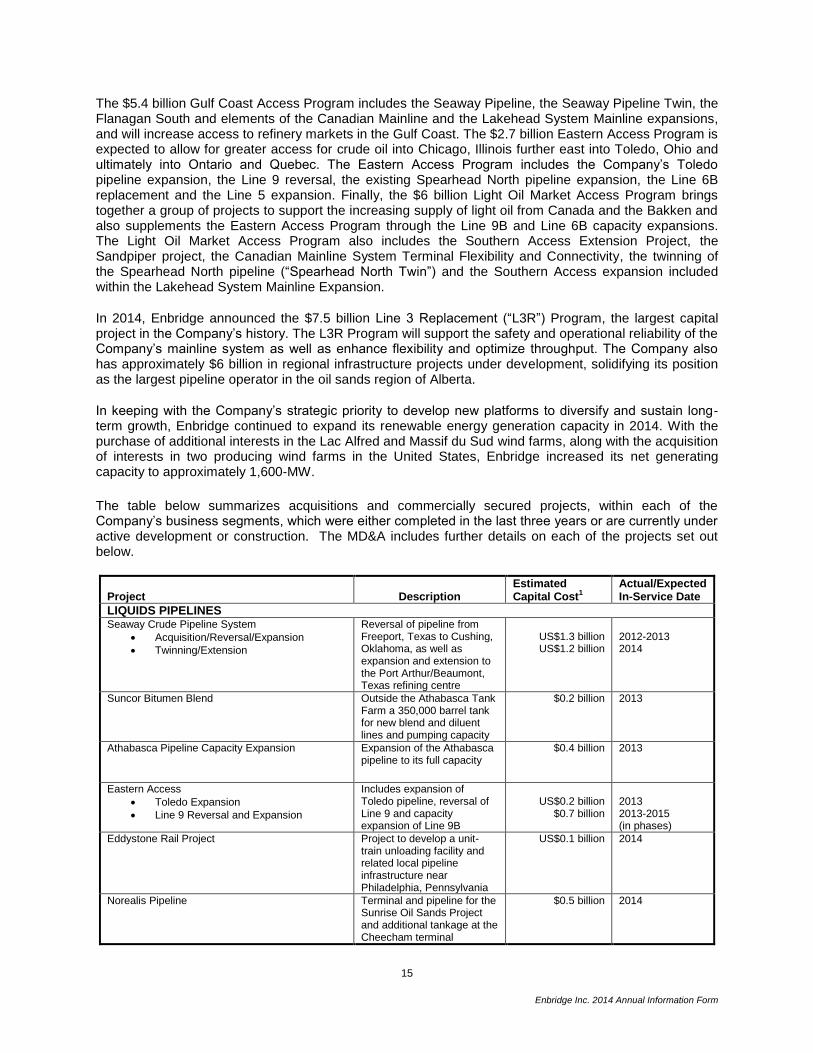
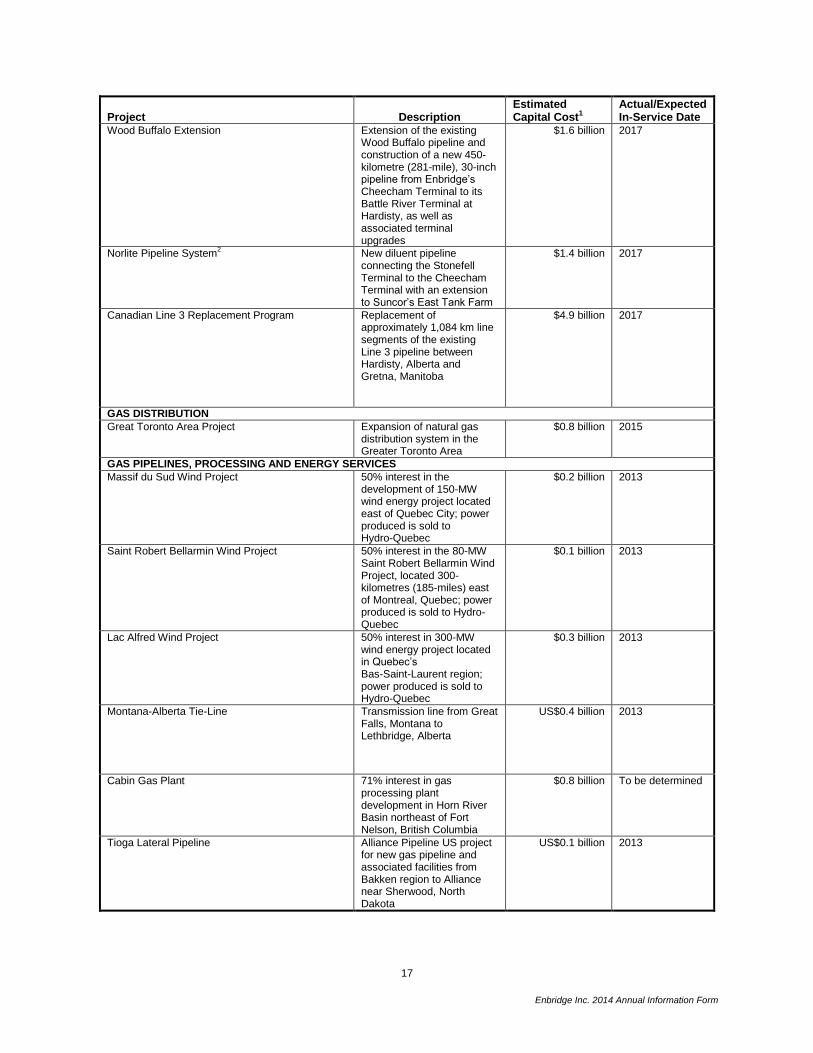
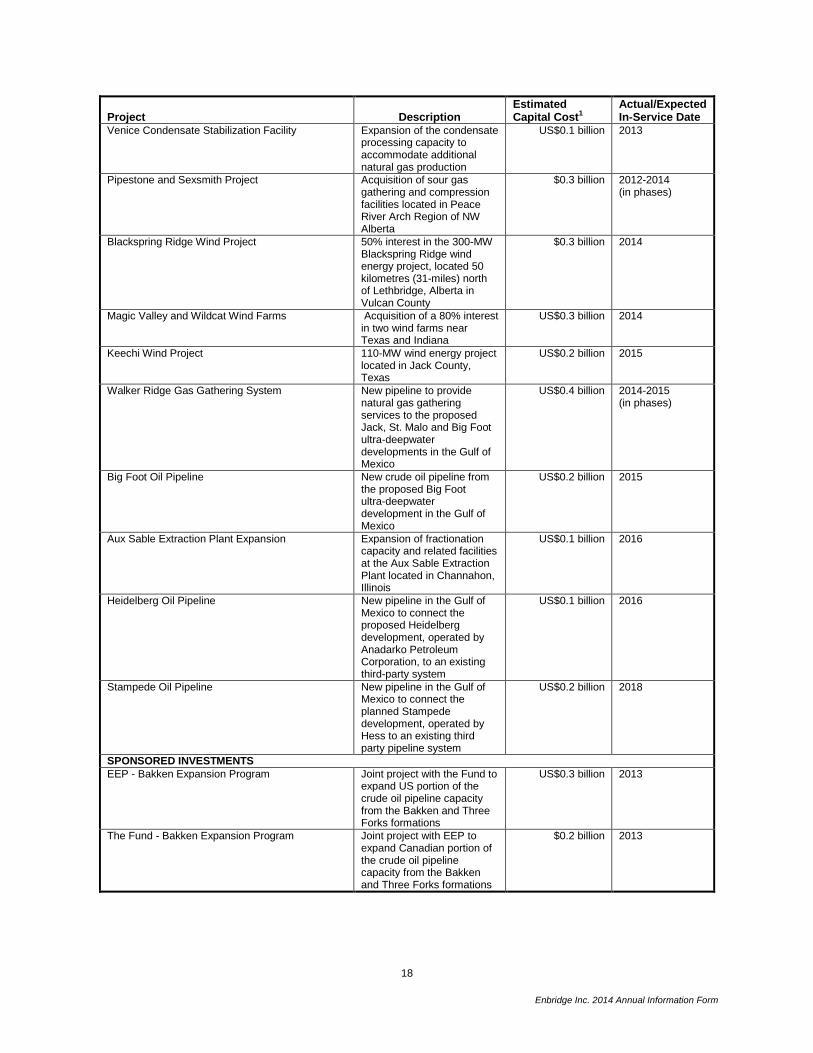
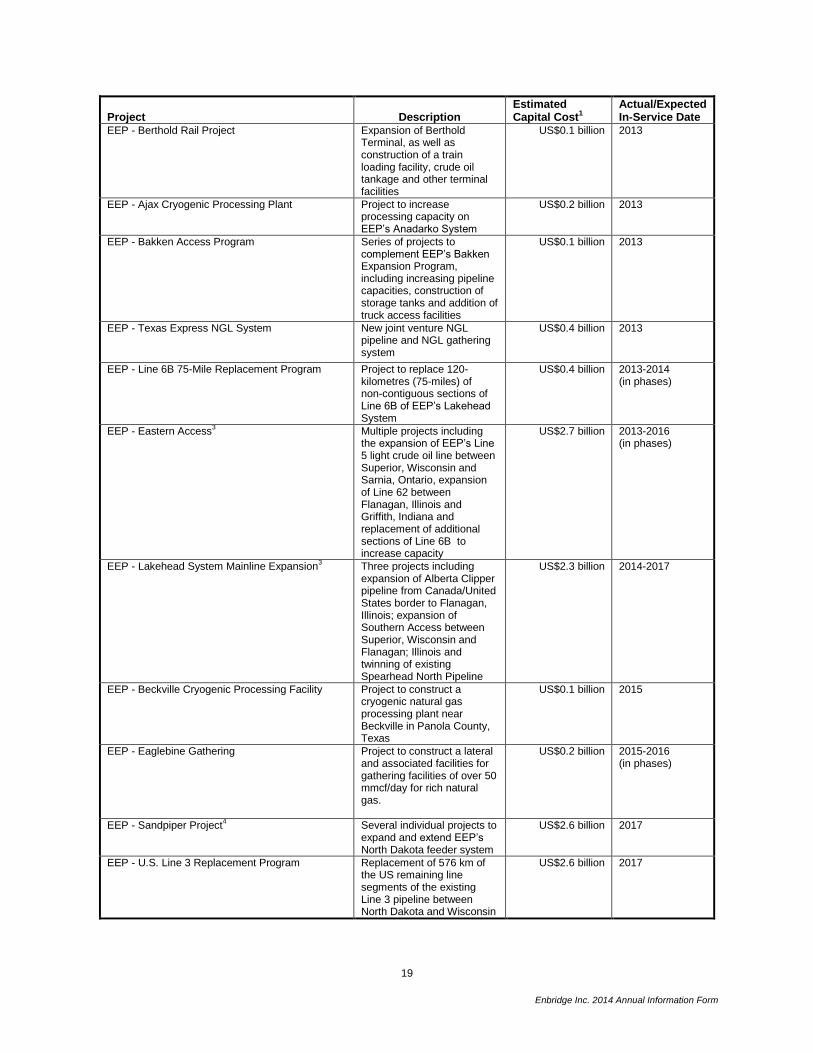
The table below summarizes acquisitions and commercially secured projects, within each of the Company’s business segments, which were either completed in the last three years or are currently under active development or construction. The MD&A includes further details on each of the projects set out below.
Project Description Estimated Capital Cost1
Actual/Expected In-Service Date
LIQUIDS PIPELINES Seaway Crude Pipeline System
Acquisition/Reversal/Expansion
Twinning/Extension
Reversal of pipeline from Freeport, Texas to Cushing, Oklahoma, as well as expansion and extension to the Port Arthur/Beaumont, Texas refining centre
US$1.3 billion US$1.2 billion
2012-2013 2014
Suncor Bitumen Blend Outside the Athabasca Tank Farm a 350,000 barrel tank for new blend and diluent lines and pumping capacity
$0.2 billion 2013
Athabasca Pipeline Capacity Expansion Expansion of the Athabasca pipeline to its full capacity
$0.4 billion
2013
Eastern Access
Toledo Expansion
Line 9 Reversal and Expansion
Includes expansion of Toledo pipeline, reversal of Line 9 and capacity expansion of Line 9B
US$0.2 billion
$0.7 billion
2013 2013-2015
(in phases)
Eddystone Rail Project Project to develop a unit-train unloading facility and related local pipeline infrastructure near Philadelphia, Pennsylvania
US$0.1 billion 2014
Norealis Pipeline Terminal and pipeline for the Sunrise Oil Sands Project and additional tankage at the Cheecham terminal
$0.5 billion 2014
16
Enbridge Inc. 2014 Annual Information Form
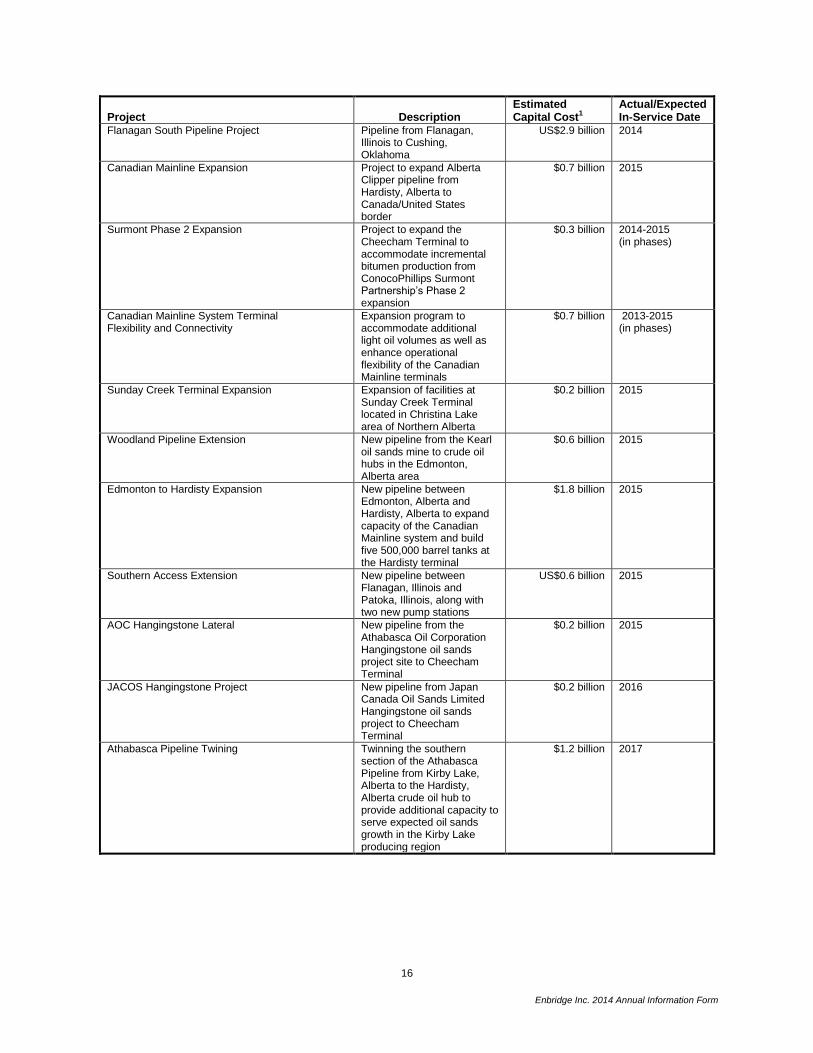
Project Description Estimated Capital Cost1
Actual/Expected In-Service Date
Flanagan South Pipeline Project Pipeline from Flanagan, Illinois to Cushing, Oklahoma
US$2.9 billion 2014
Canadian Mainline Expansion Project to expand Alberta Clipper pipeline from Hardisty, Alberta to Canada/United States border
$0.7 billion 2015
Surmont Phase 2 Expansion Project to expand the Cheecham Terminal to accommodate incremental bitumen production from ConocoPhillips Surmont Partnership’s Phase 2 expansion
$0.3 billion 2014-2015 (in phases)
Canadian Mainline System Terminal Flexibility and Connectivity
Expansion program to accommodate additional light oil volumes as well as enhance operational flexibility of the Canadian Mainline terminals
$0.7 billion 2013-2015 (in phases)
Sunday Creek Terminal Expansion Expansion of facilities at Sunday Creek Terminal located in Christina Lake area of Northern Alberta
$0.2 billion 2015
Woodland Pipeline Extension New pipeline from the Kearl oil sands mine to crude oil hubs in the Edmonton, Alberta area
$0.6 billion 2015
Edmonton to Hardisty Expansion New pipeline between Edmonton, Alberta and Hardisty, Alberta to expand capacity of the Canadian Mainline system and build five 500,000 barrel tanks at the Hardisty terminal
$1.8 billion 2015
Southern Access Extension New pipeline between Flanagan, Illinois and Patoka, Illinois, along with two new pump stations
US$0.6 billion 2015
AOC Hangingstone Lateral New pipeline from the Athabasca Oil Corporation Hangingstone oil sands project site to Cheecham Terminal
$0.2 billion 2015
JACOS Hangingstone Project New pipeline from Japan Canada Oil Sands Limited Hangingstone oil sands project to Cheecham Terminal
$0.2 billion 2016
Athabasca Pipeline Twining Twinning the southern section of the Athabasca Pipeline from Kirby Lake, Alberta to the Hardisty, Alberta crude oil hub to provide additional capacity to serve expected oil sands growth in the Kirby Lake producing region
$1.2 billion 2017
17
Enbridge Inc. 2014 Annual Information Form
Project Description Estimated Capital Cost1
Actual/Expected In-Service Date
Wood Buffalo Extension Extension of the existing Wood Buffalo pipeline and construction of a new 450-kilometre (281-mile), 30-inch pipeline from Enbridge’s Cheecham Terminal to its Battle River Terminal at Hardisty, as well as associated terminal upgrades
$1.6 billion 2017
Norlite Pipeline System2 New diluent pipeline
connecting the Stonefell Terminal to the Cheecham Terminal with an extension to Suncor’s East Tank Farm
$1.4 billion 2017
Canadian Line 3 Replacement Program Replacement of approximately 1,084 km line segments of the existing Line 3 pipeline between Hardisty, Alberta and Gretna, Manitoba
$4.9 billion 2017
GAS DISTRIBUTION
Great Toronto Area Project Expansion of natural gas distribution system in the Greater Toronto Area
$0.8 billion 2015
GAS PIPELINES, PROCESSING AND ENERGY SERVICES
Massif du Sud Wind Project 50% interest in the development of 150-MW wind energy project located east of Quebec City; power produced is sold to Hydro-Quebec
$0.2 billion 2013
Saint Robert Bellarmin Wind Project 50% interest in the 80-MW Saint Robert Bellarmin Wind Project, located 300-kilometres (185-miles) east of Montreal, Quebec; power produced is sold to Hydro-Quebec
$0.1 billion 2013
Lac Alfred Wind Project 50% interest in 300-MW wind energy project located in Quebec’s Bas-Saint-Laurent region; power produced is sold to Hydro-Quebec
$0.3 billion 2013
Montana-Alberta Tie-Line Transmission line from Great Falls, Montana to Lethbridge, Alberta
US$0.4 billion
2013
Cabin Gas Plant 71% interest in gas processing plant development in Horn River Basin northeast of Fort Nelson, British Columbia
$0.8 billion To be determined
Tioga Lateral Pipeline Alliance Pipeline US project for new gas pipeline and associated facilities from Bakken region to Alliance near Sherwood, North Dakota
US$0.1 billion 2013
18
Enbridge Inc. 2014 Annual Information Form
Project Description Estimated Capital Cost1
Actual/Expected In-Service Date
Venice Condensate Stabilization Facility Expansion of the condensate processing capacity to accommodate additional natural gas production
US$0.1 billion 2013
Pipestone and Sexsmith Project Acquisition of sour gas gathering and compression facilities located in Peace River Arch Region of NW Alberta
$0.3 billion 2012-2014 (in phases)
Blackspring Ridge Wind Project 50% interest in the 300-MW Blackspring Ridge wind energy project, located 50 kilometres (31-miles) north of Lethbridge, Alberta in Vulcan County
$0.3 billion 2014
Magic Valley and Wildcat Wind Farms Acquisition of a 80% interest in two wind farms near Texas and Indiana
US$0.3 billion 2014
Keechi Wind Project 110-MW wind energy project located in Jack County, Texas
US$0.2 billion 2015
Walker Ridge Gas Gathering System New pipeline to provide natural gas gathering services to the proposed Jack, St. Malo and Big Foot ultra-deepwater developments in the Gulf of Mexico
US$0.4 billion 2014-2015 (in phases)
Big Foot Oil Pipeline New crude oil pipeline from the proposed Big Foot ultra-deepwater development in the Gulf of Mexico
US$0.2 billion 2015
Aux Sable Extraction Plant Expansion Expansion of fractionation capacity and related facilities at the Aux Sable Extraction Plant located in Channahon, Illinois
US$0.1 billion 2016
Heidelberg Oil Pipeline New pipeline in the Gulf of Mexico to connect the proposed Heidelberg development, operated by Anadarko Petroleum Corporation, to an existing third-party system
US$0.1 billion 2016
Stampede Oil Pipeline New pipeline in the Gulf of Mexico to connect the planned Stampede development, operated by Hess to an existing third party pipeline system
US$0.2 billion 2018
SPONSORED INVESTMENTS
EEP - Bakken Expansion Program Joint project with the Fund to expand US portion of the crude oil pipeline capacity from the Bakken and Three Forks formations
US$0.3 billion
2013
The Fund - Bakken Expansion Program Joint project with EEP to expand Canadian portion of the crude oil pipeline capacity from the Bakken and Three Forks formations
$0.2 billion 2013
19
Enbridge Inc. 2014 Annual Information Form
Project Description Estimated Capital Cost1
Actual/Expected In-Service Date
EEP - Berthold Rail Project Expansion of Berthold Terminal, as well as construction of a train loading facility, crude oil tankage and other terminal facilities
US$0.1 billion
2013
EEP - Ajax Cryogenic Processing Plant Project to increase processing capacity on EEP’s Anadarko System
US$0.2 billion 2013
EEP - Bakken Access Program Series of projects to complement EEP’s Bakken Expansion Program, including increasing pipeline capacities, construction of storage tanks and addition of truck access facilities
US$0.1 billion
2013
EEP - Texas Express NGL System New joint venture NGL pipeline and NGL gathering system
US$0.4 billion
2013
EEP - Line 6B 75-Mile Replacement Program Project to replace 120-kilometres (75-miles) of non-contiguous sections of Line 6B of EEP’s Lakehead System
US$0.4 billion 2013-2014 (in phases)
EEP - Eastern Access3
Multiple projects including the expansion of EEP’s Line 5 light crude oil line between Superior, Wisconsin and Sarnia, Ontario, expansion of Line 62 between Flanagan, Illinois and Griffith, Indiana and replacement of additional sections of Line 6B to increase capacity
US$2.7 billion
2013-2016 (in phases)
EEP - Lakehead System Mainline Expansion3 Three projects including
expansion of Alberta Clipper pipeline from Canada/United States border to Flanagan, Illinois; expansion of Southern Access between Superior, Wisconsin and Flanagan; Illinois and twinning of existing Spearhead North Pipeline
US$2.3 billion 2014-2017
EEP - Beckville Cryogenic Processing Facility Project to construct a cryogenic natural gas processing plant near Beckville in Panola County, Texas
US$0.1 billion 2015
EEP - Eaglebine Gathering Project to construct a lateral and associated facilities for gathering facilities of over 50 mmcf/day for rich natural gas.
US$0.2 billion 2015-2016 (in phases)
EEP - Sandpiper Project4 Several individual projects to
expand and extend EEP’s North Dakota feeder system
US$2.6 billion 2017
EEP - U.S. Line 3 Replacement Program Replacement of 576 km of the US remaining line segments of the existing Line 3 pipeline between North Dakota and Wisconsin
US$2.6 billion 2017
20
Enbridge Inc. 2014 Annual Information Form
Notes:
1. These amounts are estimates and subject to upward or downward adjustment based on various factors. Where appropriate, the amounts reflect Enbridge’s share of joint venture projects.
2. Enbridge will construct and operate the Norlite Pipeline System. Keyera Corp. will fund 30% of the project. 3. The Eastern Access and Lakehead System Mainline Expansion projects are funded 75% by Enbridge and 25% by EEP. 4. Enbridge will construct and operate the Sandpiper Project. Marathon Petroleum Corporation will fund 37.5% of the project.
LIQUIDS PIPELINES - NEW PROJECTS
Seaway Pipeline - Reversal and Expansion Enbridge holds a 50% interest in the Seaway Pipeline which includes an 805-kilometre (500-mile) 30-inch diameter long-haul system between Cushing, Oklahoma and Freeport, Texas. The flow direction of the Seaway Pipeline was reversed in 2012, enabling it to transport crude oil from the oversupplied hub in Cushing, Oklahoma to the Gulf Coast. Further pump station additions and modifications were completed in January 2013, increasing capacity available to shippers from 150,000 bpd to up to approximately 400,000 bpd, depending on crude oil slate. Seaway Pipeline - Twinning and Extension The Seaway Pipeline Twin was constructed in order to more than double the existing capacity of the Seaway Pipeline to approximately 850,000 bpd and was mechanically completed in July 2014. Seaway Pipeline Twin was placed into service in December 2014 following the completion of Flanagan South. This 30-inch diameter pipeline follows the same route as the existing Seaway Pipeline and was constructed to meet additional capacity commitments from shippers. Included in the project scope is the 105-kilometre (65-mile), 36-inch diameter pipeline lateral from the Seaway Jones Creek facility southwest of Houston, Texas to Enterprise Product Partners L.P.’s ECHO crude oil terminal (“ECHO Terminal”) in Houston, Texas. The lateral was placed into service in January 2014. In addition, a 161-kilometre (100-mile) pipeline was constructed from the ECHO Terminal to the Port Arthur/Beaumont, Texas refining centre to provide shippers access to the region’s heavy oil refining capabilities. This extension provides capacity of 750,000 bpd and was mechanically completed in August 2014 and placed into service in January 2015. Including the acquisition of the initial 50% interest, Enbridge’s total cost for Seaway Pipeline is approximately US$2.5 billion. The acquisition, reversal and expansion were completed at an approximate cost of US$1.3 billion, with the twinning, extension and lateral components of the project completed at an approximate cost of US$1.2 billion. Eastern Access The Eastern Access initiative includes a series of Enbridge and EEP crude oil pipeline projects to provide increased access to refineries in the upper midwest United States and eastern Canada. Projects being undertaken by Enbridge include a reversal of Line 9A, a reversal of Line 9B and expansion of Line 9 (together, “Line 9”) and expansion of the Toledo Pipeline. In 2013, Enbridge completed the 80,000 bpd expansion of its Toledo Pipeline (“Line 17”), which connects with the EEP mainline at Stockbridge, Michigan and serves refineries at Toledo, Ohio and Detroit, Michigan. The project was completed at an approximate cost of US$0.2 billion. In 2013, Enbridge also completed the reversal of Line 9A in western Ontario to permit crude oil movements eastbound from Sarnia, Ontario as far as Westover, Ontario. Enbridge is also undertaking a reversal of its 240,000 bpd Line 9B from Westover, Ontario to Montreal, Quebec to serve refineries in that province. The Line 9B reversal was initially expected to be completed at an estimated cost of approximately $0.3 billion. Following an open season held on the Line 9B reversal project, further commitments were received that required additional delivery capacity within Ontario and Quebec, resulting in the Line 9 capacity expansion
21
Enbridge Inc. 2014 Annual Information Form
project. The Line 9 capacity expansion will increase the annual capacity of Line 9 from 240,000 bpd to 300,000 bpd at an estimated cost of approximately $0.1 billion. The Line 9B Reversal and Line 9 Capacity Expansion Project was approved by the NEB in March 2014 subject to 30 conditions. In October 2014, the NEB requested additional information regarding one of the conditions imposed on the Line 9B Reversal and Line 9 Capacity Expansion Project. On October 23, 2014, Enbridge responded to the NEB describing the Company’s rigorous approach to risk management and isolation valve placement. On February 6, 2015, the NEB approved Conditions 16 and 18, the two conditions in the NEB’s order requiring approval, and the Company filed for a Leave to Open, which is a prerequisite to allowing the operation of the project. Subject to NEB approval for the Leave to Open application, Enbridge expects to place the Line 9B Reversal and Line 9 Capacity Expansion Project into service in the second quarter of 2015. In its February approval, the NEB also imposed additional obligations on Enbridge that direct the Company to take a “life-cycle” approach to water crossings and valves, requiring the Company performs ongoing analysis and rationale to ensure optimal protection of the area’s water resources.
The conditions previously imposed by the NEB, including costs associated with additional NEB mandated integrity testing, increased the total expected cost of the projects to $0.7 billion, inclusive of costs related to the previously discussed Line 9A reversal. Enbridge has recently reached an agreement with shippers to recover a portion of the incremental cost of additional valves ordered by the NEB through a toll surcharge. Total expenditures to date on the Line 9A and Line 9B projects are approximately $0.6 billion.
On July 31, 2014, Enbridge filed an application for tolls for Line 9. After objections from shippers on Line 9 were filed with the NEB with respect to the inclusion of mainline surcharges in the Line 9 toll, Enbridge requested that the NEB approve the tolls on an interim basis to allow for time to engage shippers in further discussions to attempt to resolve the outstanding issues. The NEB established interim tolls, which remain in effect and in late 2014, Enbridge and shippers filed letters with the NEB requesting that it establish a process to consider the issues. The NEB has set a written hearing with oral reply argument to be heard on May 28, 2015.
Eddystone Rail Project In April 2014, under a joint venture agreement with Canopy Prospecting Inc., the Company completed the development of a unit-train unloading facility and related local pipeline infrastructure near Philadelphia, Pennsylvania to deliver Bakken and other light sweet crude oil to Philadelphia area refineries. The Eddystone Rail Project is capable of receiving and delivering an initial capacity of 80,000 bpd, and could be expanded to 160,000 bpd. Based on its 75% joint venture interest, Enbridge’s investment in the project was approximately US$0.1 billion. Norealis Pipeline In order to provide pipeline and terminalling services to the Husky Energy Inc. operated Sunrise Energy Project that is currently under development, Enbridge constructed a new originating terminal (“Norealis Terminal”), a 112-kilometre (66-mile) 24-inch diameter pipeline from the Norealis Terminal to Enbridge’s Cheecham Terminal and additional tankage at Cheecham. The Norealis Pipeline project was completed in April 2014 at a total cost of approximately $0.5 billion. Enbridge transferred diluent into the Norealis Terminal in the fourth quarter of 2014 and receipt of blend product is expected in the second quarter of 2015. Flanagan South Pipeline Project The 950-kilometre (590- mile) pipeline has an initial design capacity of approximately 600,000 bpd; however, in the initial years, it is not expected to operate at its full design capacity. Flanagan South will transport crude oil from the Company’s terminal at Flanagan, Illinois to Cushing, Oklahoma. The 36-inch diameter pipeline is installed adjacent to the Company’s Spearhead Pipeline for the majority of the route. Flanagan South was placed in-service on December 1, 2014 and the total cost of the project is US$2.9
22
Enbridge Inc. 2014 Annual Information Form
billion. Final expenditures will be incurred into 2015, with expenditures to date of approximately US$2.8 billion. The Sierra Club and National Wildlife Federation (the “Plaintiff”) filed a complaint (the “Complaint”) for Declaratory and Injunctive Relief with the United States District Court for the District of Columbia (the “Court”) in August 2013. The Complaint was filed against multiple federal agencies (the “Defendants”) and included a request that the Court issue a preliminary injunction suspending previously granted federal permits and ordering Enbridge to discontinue construction of the project on the basis that the Defendants failed to comply with environmental review standards of the United States’ National Environmental Policy Act (“NEPA”). Enbridge obtained intervenor status and joined the Defendants in filing a response in opposition to the motion for preliminary injunction in September 2013. The Plaintiff’s request for preliminary injunction was denied by the Court in November 2013. A court hearing was held on February 21, 2014 concerning the merits of the Complaint against the Defendants, and on August 18, 2014, the Court ruled to dismiss all claims in favour of Enbridge and the Defendants. The Sierra Club filed an appeal to the United States Court of Appeals for the District of Columbia Circuit in mid-August 2014 and filed its opening brief on December 23, 2014. Enbridge and the Defendants filed their briefs on January 22, 2015. The Sierra Club’s reply brief was filed on February 8, 2015 and an oral argument will be subsequently scheduled. Canadian Mainline Expansion Enbridge is undertaking an expansion of the Alberta Clipper line between Hardisty, Alberta and the Canada/United States border near Gretna, Manitoba. The scope of the project consists of two phases that involve the addition of pumping horsepower to raise the capacity of the Alberta Clipper line from 450,000 bpd to 800,000 bpd. The initial phase to increase capacity from 450,000 bpd to 570,000 bpd was mechanically completed in the third quarter of 2014 at an estimated capital cost of approximately $0.2 billion. Delays in receipt of the applicable regulatory approvals on EEP’s portion of the US mainline system expansion are expected to delay the full operation of the first phase of the Canadian Mainline Expansion. However, a number of temporary system optimization actions are being undertaken to substantially mitigate any impact on throughput associated with the initial 120,000 bpd capacity increase. The second phase to increase capacity from 570,000 bpd to 800,000 bpd is expected to be placed into service in 2015. The second phase is expected to cost approximately $0.5 billion, following the completion of a detailed engineering review conducted in the first quarter of 2014. The revised estimate reflected enhanced tanking, terminalling and connectivity to optimize pipeline operation at the full 800,000 bpd design capacity. The estimated cost of the entire expansion is approximately $0.7 billion, with expenditures to date of approximately $0.5 billion. Surmont Phase 2 Expansion In 2013, the Company entered into a terminal services agreement with ConocoPhillips Canada Resources Corp. (“ConocoPhillips”) and Total E&P Canada Ltd. to expand the Cheecham Terminal to accommodate incremental bitumen production from the Surmont Project’s Phase 2 expansion. The Company is constructing two new 450,000 barrel blend tanks and converting an existing tank from blend to diluent service. The expansion is planned in two phases with the blended product system placed into service in November 2014 and the diluent system expected to be completed in the first quarter of 2015. The estimated cost of the project is approximately $0.3 billion with expenditures to date of approximately $0.2 billion. Canadian Mainline System Terminal Flexibility and Connectivity As part of the Light Oil Market Access Program initiative, the Company is undertaking the Canadian Mainline System Terminal Flexibility and Connectivity project in order to accommodate additional light oil volumes and enhance the operational flexibility of the Canadian mainline terminals. The modifications are comprised of upgrading existing booster pumps, additional booster pumps and new tank line connections. These projects have varying completion dates from 2013 through the second quarter of 2015. The cost of
23
Enbridge Inc. 2014 Annual Information Form
the project is expected to be approximately $0.7 billion following the completion of a detailed engineering review. The revised estimate reflects enhanced tankage, terminalling and connectivity in conjunction with the Company’s Canadian Mainline Expansion project.
Sunday Creek Terminal Expansion
In January 2014, the Company announced it will construct additional facilities at its existing Sunday Creek Terminal, located in the Christina Lake area of northern Alberta, to support production growth from the Christina Lake oil sands project operated by Cenovus Energy Inc. and jointly owned with ConocoPhillips. The expansion includes development of a new site adjacent to the existing terminal, construction of a new 350,000 barrel tank with associated piping, pumps and measurement equipment, as well as civil construction work for a future tank. The estimated cost for the expansion is approximately $0.2 billion, with expenditures to date of approximately $0.2 billion and a targeted in-service date in the third quarter of 2015.
Woodland Pipeline Extension
The joint venture Woodland Pipeline Extension Project will extend the Woodland Pipeline south from Enbridge’s Cheecham Terminal to its Edmonton Terminal. The extension is a proposed 388-kilometre (241-mile) 36-inch diameter pipeline with an initial capacity of 400,000 bpd, expandable to 800,000 bpd. After finalization of scope and a definitive cost estimate, Enbridge’s share of the estimated capital cost of the project is approximately $0.6 billion, with expenditures incurred to date of approximately $0.5 billion. The project has a target in-service date of the third quarter of 2015.
Edmonton to Hardisty Expansion The Company is undertaking an expansion of the Canadian Mainline system between Edmonton, Alberta and Hardisty, Alberta. The expansion project will include 181-kilometres (112-miles) of new 36-inch diameter pipeline and will provide an initial capacity of approximately 570,000 bpd, expandable to 800,000 bpd. The new line is expected to generally follow the same route as Enbridge’s existing Line 4 pipeline. Also included in the project scope are connections into existing infrastructure at the Hardisty Terminal and new terminal facilities in Edmonton which include five new 500,000 barrel tanks. The new pipeline is expected to be placed into service in the first quarter of 2015, with additional tankage requirements expected to be completed in the fourth quarter of 2015, all at an expected total cost of approximately $1.8 billion. Expenditures incurred to date are approximately $1.1 billion. Southern Access Extension Southern Access Extension involves the construction of a new 265-kilometre (165-mile), 24-inch diameter crude oil pipeline from Flanagan, Illinois to Patoka, Illinois, for an initial capacity of approximately 300,000 bpd, as well as additional tankage and two new pump stations. Effective July 1, 2014, the Company entered into an agreement with Lincoln Pipeline LLC (“Lincoln”), an affiliate of Marathon Petroleum Corporation (“MPC”), to, among other things, admit Lincoln as a partner and allow it to participate in Southern Access Extension. Lincoln has purchased a 35% equity interest in the project and will make additional cash contributions in accordance with the Southern Access Extension spend profile in proportion to its 35% interest. Subject to regulatory and other approvals, the project is expected to be placed into service in the fourth quarter of 2015. Southern Access Extension is expected to cost approximately US$0.9 billion, with Enbridge’s share of the estimated capital cost expected to be approximately US$0.6 billion. Enbridge’s expenditures to date on the project are approximately US$0.2 billion. AOC Hangingstone Lateral
In 2013, the Company entered into an agreement with Athabasca Oil Corporation (“AOC”) to provide pipeline and terminalling services to the proposed AOC Hangingstone Oil Sands Project (“AOC Hangingstone”) in Alberta. Phase I of the project will involve the construction of a new 49-kilometre (31-
24
Enbridge Inc. 2014 Annual Information Form
mile), 16-inch diameter pipeline from the AOC Hangingstone project site to Enbridge’s existing Cheecham Terminal and related facility modifications at Cheecham. Phase I of the project will provide an initial capacity of 16,000 bpd and is expected to be placed into service in the fourth quarter of 2015, to align with shipper volume availability, at an estimated cost of approximately $0.2 billion. Phase 2 of the project, which is subject to commercial approval, would provide up to an additional 60,000 bpd for a total capacity of 76,000 bpd.
JACOS Hangingstone Project
Enbridge will undertake the construction of facilities and provide transportation services to the Japan Canada Oil Sands Limited (“JACOS”) Hangingstone Oil Sands Project (“JACOS Hangingstone”). JACOS and Nexen Energy ULC, a wholly-owned subsidiary of China National Offshore Oil Corporation Limited, are partners in the project which is operated by JACOS. Subject to regulatory approvals, Enbridge plans to construct a new 53-kilometre (33-mile), 12-inch lateral pipeline to connect the JACOS Hangingstone project site to Enbridge’s existing Cheecham Terminal. The project, which will provide capacity of 40,000 bpd and is expected to enter service in 2016, is estimated to cost approximately $0.2 billion.
Athabasca Pipeline Twinning
This project involves twinning the southern section of the Athabasca Pipeline from Kirby Lake, Alberta to the Hardisty, Alberta crude oil hub to provide additional capacity to serve expected oil sands growth in the Kirby Lake producing region. The expansion project, with an estimated cost of approximately $1.2 billion, and expenditures to date of approximately $1.1 billion, will include 346-kilometres (215-miles) of 36-inch diameter pipeline adjacent to the existing Athabasca Pipeline right-of-way. The line is expected to be delayed beyond its original in-service date and is now expected to be completed in 2017 due to a change in the construction schedule to align with shipper volume availability.
Wood Buffalo Extension In 2013, Enbridge was selected by Suncor Energy Inc., Total E&P Canada Ltd. and Teck Resources Limited (the “Fort Hills Partners”), as well as the Suncor Energy Oil Sands Limited Partnership (“Suncor Partnership”), to develop a new pipeline to transport crude oil production to Enbridge’s mainline hub at Hardisty, Alberta. The proposed Wood Buffalo Extension will extend Enbridge’s existing Wood Buffalo Pipeline and includes construction of a new 450-kilometre (281-mile), 30-inch pipeline from Enbridge’s Cheecham Terminal to its Battle River Terminal at Hardisty, as well as associated terminal upgrades. The completed project will provide capacity of 490,000 bpd of diluted bitumen to be transported for the proposed Fort Hills Partners’ oil sands project (“Fort Hills Project”) in northeastern Alberta and Suncor Partnership’s oil sands production in the Athabasca region. Subject to regulatory approvals, the project is expected to be completed in 2017 at an estimated cost of approximately $1.6 billion, with expenditures incurred to date of approximately $0.1 billion.
Norlite Pipeline System
Enbridge is undertaking the development of Norlite, a new industry diluent pipeline originating from Edmonton to meet the needs of multiple producers in the Athabasca oil sands region. The scope of the project was increased to a 24-inch diameter pipeline, which will provide an initial capacity of approximately 224,000 bpd of diluent, with the potential to be further expanded to approximately 400,000 bpd of capacity with the addition of pump stations. Norlite will be anchored by throughput commitments from both the Fort Hills Partners for production from the proposed Fort Hills Project and from Suncor Partnership’s proprietary oil sands production. Norlite will involve the construction of a new 449-kilometre (278-mile) pipeline from Enbridge’s Stonefell Terminal to its Cheecham Terminal with an extension to Suncor Partnership’s East Tank Farm, which is adjacent to Enbridge’s existing Athabasca Terminal. Under an agreement with Keyera Corp. (“Keyera”), Norlite has the right to access certain existing capacity on Keyera’s pipelines between Edmonton and Stonefell and, in exchange, Keyera has elected to participate in the new pipeline infrastructure project as a 30% non-operating owner. Subject to regulatory
25
Enbridge Inc. 2014 Annual Information Form
and other approvals as well as finalization of scope, Norlite is expected to be completed in 2017 at an estimated cost of approximately $1.4 billion.
Canadian Line 3 Replacement Program
In March 2014, Enbridge and EEP jointly announced that shipper support was received for investment in the L3R Program. The Canadian portion of the Line 3 Replacement Program (“Canadian L3R Program”) will complement existing integrity programs by replacing approximately 1,084-kilometres (673-miles) of the remaining line segments of the existing Line 3 pipeline between Hardisty, Alberta and Gretna, Manitoba. While the L3R Program will not provide an increase in the overall capacity of the mainline system, it will support the safety and operational reliability of the overall system, enhance flexibility and allow the Company to optimize throughput. The L3R Program is expected to achieve an equivalent 34-inch diameter pipeline capacity of approximately 760,000 bpd, which will enhance the flexibility and reliability of the Enbridge mainline system’s overall Western Canada export capacity.
Subject to regulatory and other approvals, the Canadian L3R Program is targeted to be completed in late 2017. Following the completion of a definitive cost estimate in the second quarter of 2014, the estimated capital cost of the Canadian L3R Program is approximately $4.9 billion, with expenditures to date of approximately $0.3 billion. Costs of the Canadian L3R Program will be recovered through a 15-year toll surcharge mechanism under the Company’s Competitive Toll Settlement.
Northern Gateway Project
Northern Gateway involves constructing a twin 1,177-kilometre (731-mile) pipeline system from near Edmonton, Alberta to a new marine terminal in Kitimat, British Columbia. One pipeline would transport crude oil for export from the Edmonton area to Kitimat and is proposed to be a 36-inch diameter line with an initial capacity of 525,000 bpd. The other pipeline would be used to transport imported condensate from Kitimat to the Edmonton area and is proposed to be a 20-inch diameter line with an initial capacity of 193,000 bpd. In 2010, Northern Gateway submitted an application to the NEB and a Joint Review Panel (“JRP”) was established to review the proposed project, pursuant to the NEB Act and the Canadian Environmental Assessment Act. The JRP had a broad mandate to assess the potential environmental effects of the project and to determine if development of Northern Gateway was in the public interest.
On December 19, 2013, the JRP issued its report on Northern Gateway. The report found that the petroleum industry is a significant driver of the Canadian economy and an important contributor to the Canadian standard of living and noted that the benefits of Northern Gateway outweigh its burdens and that “Canadians would be better off with the Enbridge Northern Gateway Project than without it.” The JRP recommended to the Governor in Council that Certificates of Public Convenience and Necessity (“Certificates”) for the oil and condensate pipelines, incorporating the terms and conditions in their report, be issued to Northern Gateway pursuant to Part III of the NEB Act. The Government of Canada consulted with Aboriginal groups on the JRP report and its recommendations prior to making its decision on whether to direct the NEB to issue the Certificates for the pipelines. On June 17, 2014, the Governor in Council issued an Order in Council approving the JRP recommendation, including all 209 recommended conditions. The NEB issued the Certificates for the oil and condensate pipelines on June 18, 2014. Nine applications for leave for judicial review of the Order in Council have been filed pursuant to section 55 of the NEB Act. The applicants make two basic arguments in seeking leave. First, they argue that the report and the Order in Council contain evidentiary gaps or gaps in reasoning. Second, they allege that the Crown has failed to discharge its constitutional duty to consult and, if appropriate, accommodate the Aboriginal applicants.
26
Enbridge Inc. 2014 Annual Information Form
On September 26, 2014, the Federal Court of Appeal (“Federal Court”) granted leave to all nine applications and on December 17, 2014, the Federal Court issued a decision accepting the request by all parties to consolidate the nine applications into a single proceeding (the “Application”) and stated that delays in the hearing of the Application should be minimized. The Federal Court then set a schedule which would culminate with the filing of the Appellants’ Memoranda of Fact and Law by May 22, 2015 and the Respondents’ Memoranda by June 5, 2015. Based on this schedule, Northern Gateway expects that the hearing on the Application will occur in the fall of 2015. Depending on the outcome of these proceedings, which is anticipated for late 2015, an application for Leave to Appeal to the Supreme Court of Canada is a possibility. In October 2014, the Company reviewed an updated cost estimate of Northern Gateway based on full engineering analysis of the pipeline route and terminal location. Based on this comprehensive review, the Company expects that the final cost of the project will be substantially higher than the preliminary cost figures included in the Northern Gateway filing with the JRP, which reflected a preliminary estimate prepared in 2004 and escalated to 2010. The drivers behind this substantial increase include the significant costs associated with escalation of labour and construction costs, satisfying the 209 conditions imposed in the Governor in Council approval, a larger portion of high cost pipeline terrain, more extensive terminal site rock excavations and a delayed anticipated in-service date. The updated cost estimate is currently being refined by Northern Gateway and the potential shippers. Subject to continued commercial support, regulatory and other approvals and adequately addressing landowner and local community concerns (including those of Aboriginal communities), the Company now estimates that Northern Gateway could be in service in 2019 at the earliest. The timing and outcome of judicial reviews could also impact the start of construction or other project activities, which may lead to a delay in the start of operations beyond the current forecast. Of the 45 Aboriginal groups eligible to participate as equity owners, 26 have signed up to do so. Expenditures to date, which relate primarily to the regulatory process, are approximately $0.5 billion, of which approximately half is being funded by potential shippers on Northern Gateway. Given the many uncertainties surrounding Northern Gateway, including final ownership structure, the potential financial impact of the project cannot be determined at this time. The JRP posts public filings related to Northern Gateway on its website at http://gatewaypanel.review-examen.gc.ca/clf-nsi/hm-eng.html and Northern Gateway also maintains a website at www.northerngateway.ca where the full regulatory application submitted to the NEB, the 2010 Enbridge Northern Gateway Community Social Responsibility Report and the December 19, 2013 Report of the JRP on the Northern Gateway Application are available. None of the information contained on, or connected to, the JRP website or the Northern Gateway website is incorporated in or otherwise part of this AIF.
For further information on the Company’s Liquids Pipelines projects, please refer to the discussion in the MD&A.
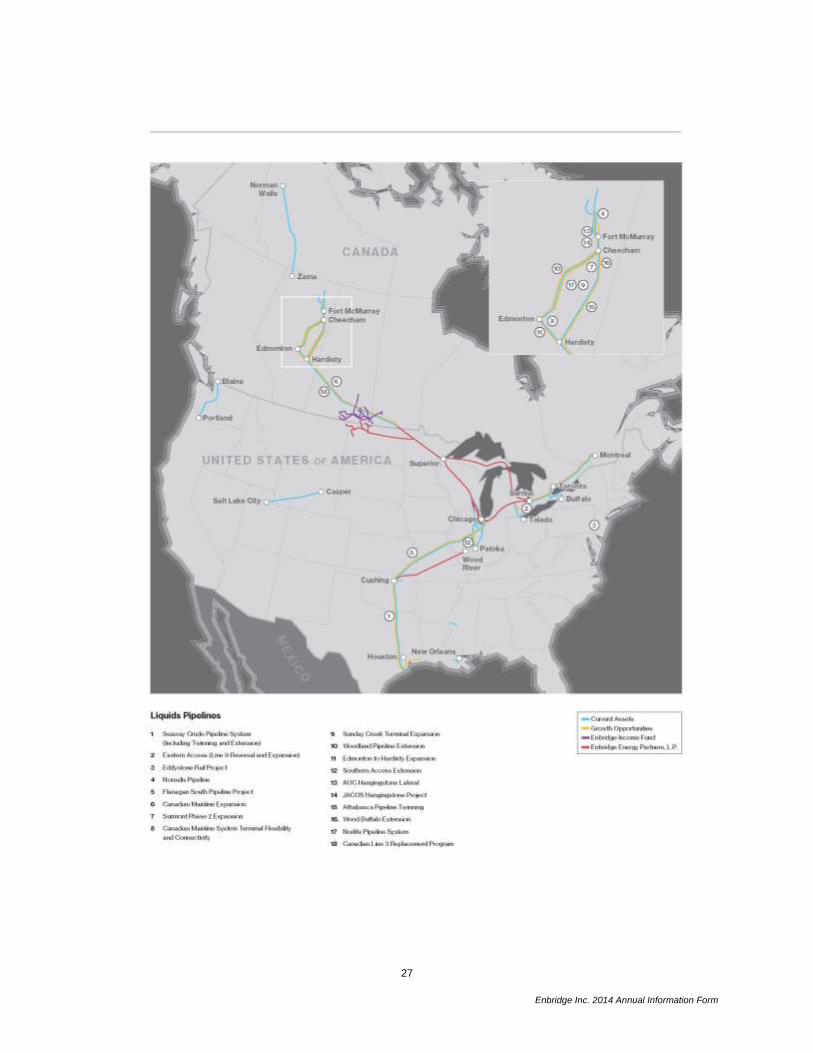
27
Enbridge Inc. 2014 Annual Information Form
28
Enbridge Inc. 2014 Annual Information Form
ENBRIDGE GAS DISTRIBUTION – NEW PROJECTS
Greater Toronto Area Project
EGD will undertake the expansion of its natural gas distribution system in the Greater Toronto Area (“GTA”) to meet the demands of growth and to continue the safe and reliable delivery of natural gas to current and future customers. The GTA project will involve the construction of two new segments of pipeline, a 27-kilometre (17-mile), 42-inch diameter pipeline and a 23-kilometre (14-mile), 36-inch diameter pipeline in Toronto, Ontario, as well as related facilities to upgrade the existing distribution system that delivers natural gas to several municipalities in Ontario. With the Ontario Energy Board approval received in January 2014, construction began in January 2015 and completion of the project is expected in the fourth quarter of 2015 at an estimated cost of approximately $0.8 billion, with expenditures to date of approximately $0.2 billion.
Other Developments
EGNB – Regulatory Matters
On December 9, 2011, the Government of New Brunswick tabled and then subsequently passed legislation related to the regulatory process for setting rates for gas distribution within the province. The legislation permitted the government to implement new regulations that could affect the franchise agreement between EGNB and the province, impact prior decisions by the province’s independent regulator and influence the regulator’s future decisions.
A final rates and tariffs regulation was subsequently enacted by the Government of New Brunswick on April 16, 2012. Based on the amended rate setting methodology and specific conditions outlined therein, EGNB no longer met the criteria for the continuation of rate-regulated accounting. As a result, the Company eliminated from its Consolidated Statements of Financial Position a deferred regulatory asset of $180 million and a regulatory asset with respect to capitalized operating costs of $103 million, net of an income tax recovery of $21 million. As the final rates and tariffs regulation published on April 16, 2012 provided further evidence of a condition that existed on December 31, 2011, the charge totaling $262 million, after-tax, was reflected as a subsequent event in the Company’s Consolidated Financial Statements for the year ended December 31, 2011 presented in accordance with US GAAP and filed in May 2012. The Company commenced legal proceedings against the Government of New Brunswick, seeking damages for breach of contract, in April 2012. The Company also commenced a separate application to the New Brunswick Court of Queen’s Bench to quash the Government’s rates and tariffs regulation in May 2012. The Company’s application was initially dismissed, but on appeal it was ultimately successful, in part. The Court of Appeal ruled that the part of the rates and tariffs regulation that caps rates according to a maximum revenue-to-cost ratio was beyond the regulation-making authority of the New Brunswick Lieutenant Governor-in-Council. The Court of Appeal upheld the portion of the regulation that requires EGNB to charge customers the lower of market or cost-based rates. As a result of this outcome, EGNB applied on June 14, 2013 to the NBEUB for new rates, effective July 1, 2013, for commercial and industrial customers. On July 26, 2013, the NBEUB granted EGNB’s application for new rates, but with an effective date of August 1, 2013. The NBEUB’s decision enabled EGNB to fully recover its revenue requirement from August 1, 2013 until the next rate period. EGNB’s 2014 rate application was approved in April 2014 by the NBEUB and its application for 2015 rates was approved in December 2014.
On February 4, 2014, EGNB commenced a further legal proceeding against the Government of New Brunswick. The action seeks damages for improper extinguishment of the deferred regulatory asset that was previously eliminated from EGNB’s Consolidated Statements of Financial Position, as discussed above.
There is no assurance that any of EGNB’s legal proceedings against the Province of New Brunswick will be successful or will result in any recovery.
29
Enbridge Inc. 2014 Annual Information Form
For further information on Company’s Gas Distribution projects, please refer to the discussion in the MD&A.
GAS PIPELINES, PROCESSING AND ENERGY SERVICES – NEW PROJECTS
Pipestone and Sexsmith Project
In 2012, the Company acquired from EnCana Corporation (“EnCana”) Pipestone and Sexsmith, which consist of certain sour gas gathering and compression facilities in the Peace River Arch (“PRA”) region of northwest Alberta. These facilities were either in service (“Sexsmith”) or under construction (“Pipestone”) at the time of acquisition. Construction of new gathering lines and NGL handling facilities was completed in June 2014. Enbridge’s investment in Pipestone and Sexsmith is approximately $0.3 billion. Enbridge also retains an exclusive right to work with EnCana on facility scoping for development of additional major midstream facilities in the liquids-rich PRA region.
Blackspring Ridge Wind Project
In 2013, Enbridge secured a 50% interest in the development of the 300-MW Blackspring Ridge wind project, located 50-kilometres (31-miles) north of Lethbridge, Alberta in Vulcan County. The project was constructed under a fixed price engineering, procurement and construction contract and commercial operations commenced in May 2014. Renewable energy credits generated from the project are contracted to Pacific Gas and Electric Company under a 20-year purchase agreement. The electricity is being sold into the Alberta power pool with pricing fixed on 75% of production through long-term price swap arrangements. The Company’s total investment in the project is approximately $0.3 billion.
Magic Valley and Wildcat Wind Farms
In November 2014, Enbridge announced it had entered into an agreement with E.ON (an investor-owned energy supplier) to purchase an 80% interest in a wind farm portfolio which included the 203-MW Magic Valley 1 wind farm located near Harligen, Texas and the 202-MW Wildcat 1 wind farm near Elwood, Indiana for approximately US$0.3 billion. Both wind farms are operational and were placed into service in 2012. The transaction closed on December 31, 2014 and E.ON continues to retain a 20% interest and remains the operator.
Keechi Wind Project
In January 2014, Enbridge announced it had entered into an agreement with Renewable Energy Systems Americas Inc. (“RES Americas”) to own and operate the 110-MW Keechi wind project (“Keechi”), located in Jack County, Texas. The project was constructed by RES Americas under a fixed price, engineering, procurement and construction agreement at a total cost of US$0.2 billion, and it entered into service in 2015. Keechi will deliver 100% of the electricity generated into the Electric Reliability Council of Texas, Inc. market under a 20-year power purchase agreement with Microsoft Corporation.
Walker Ridge Gas Gathering System
The Company has agreements with Chevron USA Inc. (“Chevron”) and Union Oil Company of California to expand its central Gulf of Mexico offshore pipeline system. Under the terms of the agreements, Enbridge is constructing and will own and operate the Walker Ridge Gas Gathering System (“WRGGS”) to provide natural gas gathering services to the Jack St. Malo and Big Foot ultra-deep water developments. The WRGGS includes 274-kilometres (170-miles) of 8-inch or 10-inch diameter pipeline at depths of up to approximately 2,150 metres (7,000 feet), with capacity of 100 mmcf/d. The Jack St. Malo portion of the WRGGS was placed into service in December 2014 and the Big Foot Pipeline portion is expected to be placed into service in the third quarter of 2015. The total WRGGS project is expected to cost approximately US$0.4 billion, with expenditures to date of approximately US$0.3 billion.
30
Enbridge Inc. 2014 Annual Information Form
Big Foot Oil Pipeline
Under agreements with Chevron, Statoil Gulf of Mexico LLC and Marubeni Oil & Gas (USA) Inc., Enbridge is constructing a 64-kilometre (40-mile) 20-inch oil pipeline with capacity of 100,000 bpd from the Big Foot ultra-deep water development in the Gulf of Mexico. This crude oil pipeline project is complementary to Enbridge’s undertaking of the WRGGS construction discussed above. Upon completion of the project, Enbridge will operate the Big Foot Pipeline, located approximately 274-kilometres (170-miles) south of the coast of Louisiana. The estimated capital cost of the project is approximately US$0.2 billion, with expenditures to date of approximately US$0.2 billion. As noted above, the Big Foot Pipeline is expected to enter service in the third quarter of 2015.
Aux Sable Extraction Plant Expansion
In October 2014, the Company approved the expansion of fractionation capacity and related facilities at its Aux Sable Extraction Plant located in Channahon, Illinois. The expansion will facilitate the growing NGL-rich gas stream on the Alliance Pipeline, allow for effective management of Alliance Pipeline’s downstream natural gas heat content and support additional production and sale of NGL products. The expansion is expected to be placed into service in 2016, with Enbridge’s share of the project cost being approximately US$0.1 billion.
Heidelberg Oil Pipeline
The Company will construct, own and operate a crude oil pipeline in the Gulf of Mexico to connect the proposed Heidelberg development, operated by Anadarko Petroleum Corporation, to an existing third-party system. Heidelberg Pipeline, a 58-kilometre (36-mile), 20-inch diameter pipeline with capacity of 100,000 bpd, will originate in Green Canyon Block 860, approximately 320-kilometres (200-miles) southwest of New Orleans, Louisiana and in an estimated 1,600-metres (5,300-feet) of water. Heidelberg Pipeline is expected to be operational in 2016 at an approximate cost of US$0.1 billion, with expenditures to date of approximately US$0.1 billion.
Stampede Oil Pipeline
In January 2015, Enbridge announced that it will build, own and operate a crude oil pipeline in the Gulf of Mexico to connect the planned Stampede Pipeline development, which is operated by Hess Corporation, to an existing third-party pipeline system. The Stampede Oil Pipeline (“Stampede”), a 26-kilometre (16-mile), 18-inch diameter pipeline with capacity of approximately 100,000 bpd will originate in Green Canyon Block 468, approximately 350-kilometres (220-miles) southwest of New Orleans, Louisiana at an estimated depth of 1,200-metres (3,500-feet). After finalization of scope and a definitive cost estimate, Stampede Pipeline is expected to be completed at an approximate cost of US$0.2 billion and is expected to be placed into service in 2018.
For further information on the Company’s Gas Pipelines, Processing and Energy Services projects, please refer to the discussion in the MD&A.
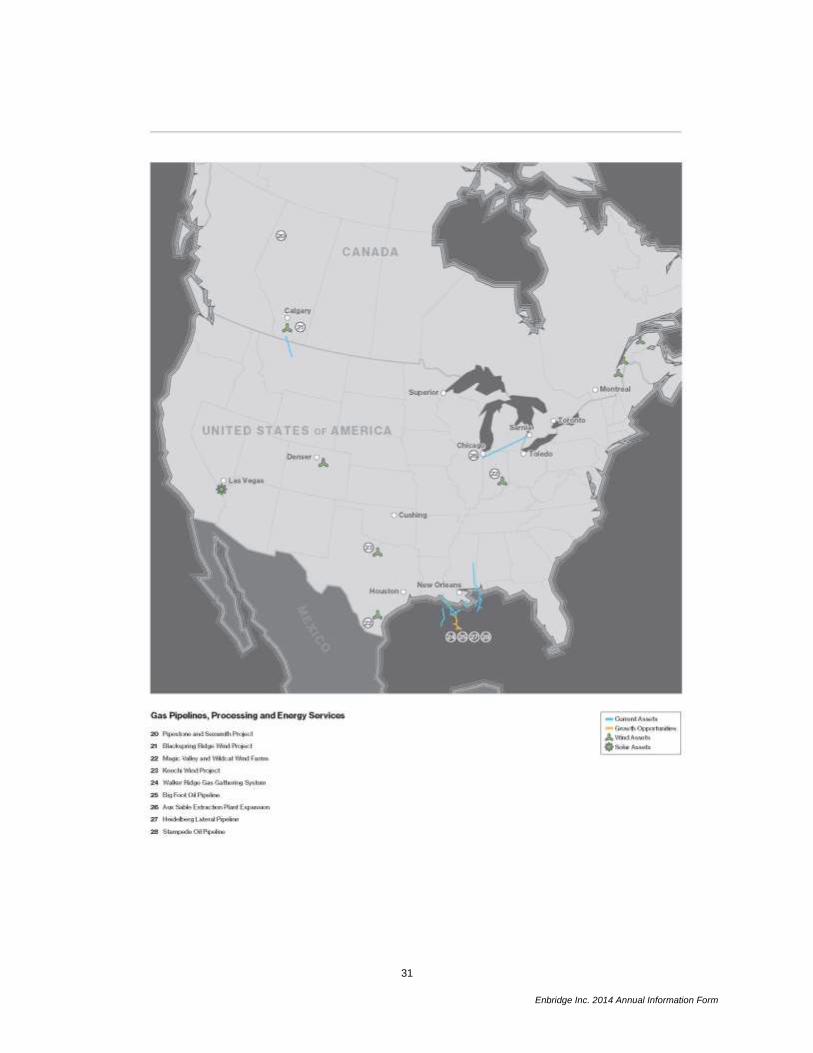
31
Enbridge Inc. 2014 Annual Information Form
32
Enbridge Inc. 2014 Annual Information Form
SPONSORED INVESTMENTS – NEW PROJECTS
Line 6B 75-Mile Replacement Program
The Line 6B 75-Mile Replacement Program included the replacement of 120-kilometres (75-miles) of non-contiguous sections of Line 6B of EEP’s Lakehead System. The Line 6B pipeline runs from Griffith, Indiana through Michigan to the international border at the St. Clair River. The new segments were completed in components, with approximately 104-kilometres (65-miles) of segments placed in service in 2013. The two remaining 8-kilometre (5-mile) segments in Indiana were placed in service in March 2014. The total cost of the replacement program was approximately US$0.4 billion and EEP is recovering these costs through a tariff surcharge that is part of the system-wide rates for the Lakehead System.
Eastern Access
The Eastern Access initiative includes a series of Enbridge and EEP crude oil pipeline projects to provide increased access to refineries in the upper midwest United States and eastern Canada. Projects being undertaken by EEP include an expansion of its Line 5 and expansions of the United States mainline involving the Spearhead North Pipeline (“Line 62”) and further segments of Line 6B.
In 2013, EEP completed and placed into service the expansion of its Line 5 light crude oil line between Superior, Wisconsin and the international border at the St. Clair River. The Line 5 expansion increased capacity by 50,000 bpd at an approximate cost of US$0.1 billion. Also in 2013, EEP completed and placed into service the expansion of Line 62 between Flanagan, Illinois and Griffith, Indiana, which increased capacity by 105,000 bpd.
EEP also replaced additional sections of Line 6B in Indiana and Michigan, which included the addition of new pumps and terminal upgrades at Hartsdale, Griffith and Stockbridge, as well as tanks at Flanagan, Stockbridge and Hartsdale, to increase capacity from 240,000 bpd to 500,000 bpd. Portions of the existing 30-inch diameter pipeline were also replaced with 36-inch diameter pipe. The Line 6B project is split into two phases. The segment between Griffith and Stockbridge was completed in May 2014 and the segment from Ortonville, Michigan to the international border at the St. Clair River was completed in September 2014. The replacement of the Line 6B sections is in addition to the Line 6B 75-mile Replacement Program discussed previously. Following detailed engineering estimates completed in the first quarter of 2014 which reflect issues with local ground terrain conditions including tie-ins, the expected cost of the United States mainline expansions is approximately US$2.4 billion and includes the US$0.1 billion cost of the previously discussed Line 5 expansion.
The Eastern Access initiative also includes a further upsizing of EEP’s Line 6B. The Line 6B capacity expansion from Griffith, Indiana to Stockbridge, Michigan will increase capacity from 500,000 bpd to 570,000 bpd and will include pump station modifications at Griffith, Niles and Mendon stations, additional modifications at the Griffith and Stockbridge terminals and breakout tankage at Stockbridge. Following the completion, in the first quarter of 2014, of a detailed engineering estimate and a scope revision that removed a proposed tank, the total cost of the project is approximately US$0.3 billion. The project is expected to be placed into service in early 2016.
The total estimated cost of the projects being undertaken by EEP as part of the Eastern Access initiative, including the United States mainline expansions, the Line 5 expansion and the Line 6B capacity expansion project, is approximately US$2.7 billion, with expenditures to date of approximately US$2.1 billion. The Eastern Access projects undertaken by EEP are being funded 75% by Enbridge and 25% by EEP. Within one year of the final in-service date of the collective projects, EEP will have the option to increase its economic interest held at that time by up to an additional 15%.
33
Enbridge Inc. 2014 Annual Information Form
Lakehead System Mainline Expansion
The Lakehead System Mainline Expansion includes several projects to expand capacity of the Lakehead System mainline between its origin at the Canada/United States border, near Neche, North Dakota, to Flanagan, Illinois. These projects are in addition to expansions of the Lakehead System mainline being undertaken as part of the Eastern Access initiative and include the expansion of Alberta Clipper (“Line 67”) and Southern Access (“Line 61”) and the construction of the Spearhead North Twin (“Line 78”).
The current scope of the Alberta Clipper expansion between the border and Superior, Wisconsin consists of two phases. The initial phase included increasing capacity from 450,000 bpd to 570,000 bpd at an estimated capital cost of approximately US$0.2 billion. The second phase of the expansion will increase capacity from 570,000 bpd to 800,000 bpd at an estimated capital cost of approximately US$0.2 billion. Both phases of the Alberta Clipper expansion require only the addition of pumping horsepower and no pipeline construction. Subject to regulatory and other approvals, including an amendment to the current Presidential border crossing permit to allow for operation of Line 67 at its currently planned operating capacity of 800,000 bpd, the initial phase was mechanically completed in the third quarter of 2014 and the second phase is expected to be in-service in 2015. It is anticipated that obtaining Federal regulatory approval will take longer than originally planned though approval is expected in the second half of 2015. A number of temporary system optimization actions are being undertaken to substantially mitigate any impact on throughput associated with the initial 120,000 bpd capacity increase.
In November 2014, several environmental and Native American groups filed a complaint in the United States District Court in Minnesota against the United States Department of State (“DOS”). The Complaint alleges, among other things, that the DOS is in violation of the NEPA by acquiescing in Enbridge’s use of permitted cross border capacity on other pipelines to achieve the transportation of amounts in excess of Alberta Clipper’s current permitted capacity while the review and approval of Enbridge’s application to the DOS to increase Alberta Clipper’s permitted cross border capacity is still pending. Enbridge has moved to intervene in the case and a decision at the trial level is not expected before the third quarter of 2015.
The current scope of the Southern Access expansion between Superior, Wisconsin and Flanagan, Illinois also consists of two phases. Both phases of the Southern Access expansion require only the addition of pumping horsepower with no pipeline construction. The initial phase to increase the capacity from 400,000 bpd to 560,000 bpd was completed in August 2014 at an estimated capital cost of approximately US$0.2 billion. EEP also plans to undertake a further expansion of the Southern Access line between Superior and Flanagan to increase capacity from 560,000 bpd to 1,200,000 bpd and add crude oil tankage at new and existing sites. The pipeline expansion will be split into two tranches. The first tranche will expand the pipeline capacity to 800,000 bpd at an estimated capital cost of approximately US$0.4 billion and is expected to be in service in the second quarter of 2015. Additional tankage is expected to cost approximately US$0.4 billion and will be completed on various dates beginning in the second quarter of 2015 through early 2016. The second tranche, which remains subject to regulatory and other approvals, will expand the pipeline capacity to 1,200,000 bpd at an estimated capital cost of approximately US$0.4 billion. The Company is exploring with shippers the potential to delay the in-service date of the final tranche of the Line 61 expansion to align more closely with the currently anticipated in-service date for Sandpiper, which will drive the need for additional downstream capacity on the Lakehead System.
As part of the Light Oil Market Access Program, EEP also plans to expand the capacity of the Lakehead System between Flanagan, Illinois and Griffith, Indiana. This section of the Lakehead System will be expanded by constructing a 127-kilometre (79-mile), 36-inch diameter twin of the existing Spearhead North Pipeline (“Line 62”). The project is expected to be completed at an estimated cost of approximately US$0.5 billion. Subject to regulatory and other approvals, the new line will have an initial capacity of 570,000 bpd and is expected to be placed into service in the third quarter of 2015.
The projects collectively referred to as the Lakehead System Mainline Expansion are expected to cost approximately US$2.3 billion, with expenditures incurred to date of approximately US$1.1 billion. EEP will operate the project on a cost-of-service basis. The Lakehead System Mainline Expansion is funded 75%
34
Enbridge Inc. 2014 Annual Information Form
by Enbridge and 25% by EEP. Within one year of the final in-service date of the collective projects, EEP will have the option to increase its economic interest held at that time by up to an additional 15%.
Beckville Cryogenic Processing Facility
EEP and its partially-owned subsidiary, MEP, are constructing a cryogenic natural gas processing plant near Beckville (the “Beckville Plant”) in Panola County, Texas. The Beckville Plant will offer incremental processing capacity for existing and future customers in the 10-county Cotton Valley shale region, where the East Texas system is located. The Beckville Plant has a planned natural gas processing capability of 150 mmcf/d and is also expected to produce 8,500 bpd of NGL. The Beckville Plant is now expected to be placed into service in the second quarter of 2015 at an estimated cost of approximately US$0.1 billion. Expenditures incurred to date are approximately US$0.1 billion.
Eaglebine Gathering In February 2015, EEP and MEP announced they are entering into the emerging Eaglebine shale play in East Texas through two transactions totaling approximately US$0.2 billion. EEP and MEP have commenced construction of a lateral and associated facilities that will create gathering capacity of over 50 mmcf/d for rich natural gas to be delivered from Eaglebine production areas to their complex of cryogenic processing facilities in East Texas. The initial facilities are projected to be placed into service by late 2015, with the lateral expected to be in service by mid-2016. MEP also executed an agreement with New Gulf Resources, LLC (“NGR”) to purchase NGR's midstream business in Leon, Madison and Grimes Counties, Texas. The acquisition consists of a natural gas gathering system that is currently in operation.
Sandpiper Project
As part of the Light Oil Market Access Program initiative, EEP plans to undertake Sandpiper, which will expand and extend EEP's North Dakota feeder system. The Bakken takeaway capacity of the North Dakota System will be expanded by 225,000 bpd to a total of 580,000 bpd. The proposed expansion will involve construction of a 965-kilometre (600-mile) line from Beaver Lodge Station near Tioga, North Dakota to the Superior, Wisconsin mainline system terminal. The new line will twin EEP’s existing 210,000 bpd North Dakota System mainline, which now terminates at Clearbrook Terminal in Minnesota, by adding 250,000 bpd of capacity between Tioga and Berthold, North Dakota and 225,000 bpd of capacity between Berthold and Clearbrook, both with new 24-inch diameter pipelines, as well as adding 375,000 bpd of capacity between Clearbrook and Superior with a new 30-inch diameter pipeline. Sandpiper is expected to cost approximately US$2.6 billion, with expenditures incurred to date of approximately US$0.4 billion.
MPC has been secured as an anchor shipper for Sandpiper. As part of the arrangement, EEP, through its subsidiary, North Dakota Pipeline Company LLC (“NDPC”) (formerly known as Enbridge Pipelines (North Dakota) LLC), and Williston Basin Pipeline LLC (“Williston”), an affiliate of MPC, entered into an agreement to, among other things, admit Williston as a member of NDPC. Williston will fund 37.5% of Sandpiper construction and will have the option to participate in other growth projects within NDPC, unless specifically excluded by the agreement; this investment is not to exceed US$1.2 billion in aggregate. In return for funding part of Sandpiper’s construction, Williston will obtain an approximate 27% equity interest in NDPC at the in-service date of Sandpiper, targeted for 2017 due to a longer than expected permitting process in the State of Minnesota.
A petition was filed with FERC to approve recovery of Sandpiper's costs through a surcharge to the NDPC rates between Beaver Lodge and Clearbrook and a cost of service structure for rates between Clearbrook and Superior. In March 2013, the FERC denied the petition on procedural grounds. In late 2013, EEP held an open season to solicit commitments from shippers for capacity created by Sandpiper. The open season closed in late January 2014 with the receipt of a further capacity commitment which can be accommodated within the planned incremental capacity identified above. EEP re-filed its petition with FERC on February 12, 2014 and received a FERC declaratory order in May 2014 approving the tariffs
35
Enbridge Inc. 2014 Annual Information Form
structure for the project. The pipeline is now expected to begin service in 2017, subject to obtaining regulatory and other approvals.
United States Line 3 Replacement Program
In March 2014, Enbridge and EEP jointly announced that shipper support was received for investment in the L3R Program. EEP will undertake the United States portion of the L3R Program (“US L3R Program”) which will complement existing integrity programs by replacing approximately 576-kilometres (358-miles) of the remaining line segments of the existing Line 3 pipeline between Neche, North Dakota and Superior, Wisconsin. While the L3R Program will not provide an increase in the overall capacity of the mainline system, it will support the safety and operational reliability of the overall system, enhance flexibility and allow the Company to optimize throughput. The L3R Program is expected to achieve an equivalent 34-inch diameter pipeline capacity of approximately 760,000 bpd, which will enhance the flexibility and reliability of the Enbridge mainline system’s overall western Canada export capacity.
Subject to regulatory and other approvals, the US L3R Program is targeted to be completed in late 2017 at an estimated capital cost of approximately US$2.6 billion, with expenditures to date of approximately US$0.2 billion. The US L3R Program will be jointly funded by Enbridge and EEP at participation levels that are subject to finalization. EEP will recover the costs based on its existing Facilities Surcharge Mechanism with the initial term of the agreement being 15 years. For the purpose of the toll surcharge, the agreement specifies a 30-year recovery of the capital based on a cost of service methodology.
Midcoast Energy Partners, L.P. – Initial Public Offering and Drop Down of Additional Interests
EEP holds its natural gas and NGL midstream assets through a combination of direct holding and indirect holdings through MEP, a publicly listed limited partnership trading on the NYSE. In May 2013, EEP formed MEP as its wholly-owned subsidiary. Subsequently, on November 13, 2013, MEP completed its initial public offering of 18.5 million Class A common units representing limited partner interests and subsequently issued an additional 2.8 million Class A common units pursuant to an underwriters’ over allotment option. MEP received proceeds of approximately US$355 million. Upon finalization of the offering, MEP’s initial assets consisted of an approximate 39% ownership interest in EEP’s natural gas and NGL midstream business. EEP retained a 2% GP interest, an approximate 51.9% limited partner interest and all incentive distribution rights in MEP, in addition to its 61% direct interest in the natural gas and NGL midstream assets.
On July 1, 2014, EEP completed the sale of an additional 12.6% limited partnership interest in its natural gas and NGL midstream business to MEP for cash proceeds of US$350 million. Upon finalization of this transaction, EEP continued to retain a 2% GP interest, an approximate 51.9% limited partner interest and all incentive distribution rights in MEP. However, EEP’s direct interest in entities or partnerships holding the natural gas and NGL midstream operations reduced from 61% to 48%, with the remaining ownership held by MEP. The completion of these transactions resulted in a partial monetization of EEP’s natural gas and NGL midstream business through sale to noncontrolling interests (being MEP’s public unitholders). The proceeds from the drop down provided EEP a cost-effective funding alternative to execute its current liquids pipelines organic growth program.
Enbridge Energy Management, L.L.C. Share Issuance
Enbridge’s ownership in EEP is held through a combination of direct interest, including a 2% GP interest, and indirect interest through EEM. In 2013, EEM completed two separate issuances of listed shares. In March 2013, EEM completed the issuance of 10.4 million listed shares for net proceeds of approximately US$273 million and in September 2013, EEM completed a further issuance of 8.4 million listed shares for net proceeds of approximately US$236 million. Enbridge did not purchase any of the offered shares. EEM subsequently used the net proceeds from each of the offerings to invest in an equal number of i-units of EEP.
36
Enbridge Inc. 2014 Annual Information Form
Enbridge Income Fund Drop Down Transactions In November 2014, the Fund completed the acquisition of Enbridge’s 50% interest in Alliance Pipeline US and the subscription for and purchase of Class A units of Enbridge’s subsidiaries that indirectly own the Canadian and United States segments of the Southern Lights Pipeline. The Class A units, which are non-voting and do not confer any governance or ownership rights in Southern Lights Pipeline, will provide a defined cash flow stream to the Fund. Total consideration for the transaction was approximately $1.8 billion. Enbridge received on closing approximately $421 million in cash and $461 million in the form of preferred units of ECT, a subsidiary of the Fund. Under the agreement, Enbridge provided bridge debt financing (“Bridge Financing”) to the Fund in the form of an $878 million long-term note payable by the Fund and bearing interest of 5.5% per annum. In November 2014, the Fund issued $1,080 million of medium-term notes with a portion of these proceeds being used to fully repay the Bridge Financing to Enbridge. The Fund also issued $421 million of trust units to EIFH to fund the cash component of the consideration. Enbridge applied approximately $84 million of cash to acquire additional Common Shares of EIFH, thereby maintaining its 19.9% interest in EIFH. Enbridge’s overall economic interest in the Fund was reduced from approximately 67.3% to 66.4% upon completion of the transaction.
In December 2012, the Fund acquired the Hardisty Storage Caverns, Hardisty Contract Terminals and the Greenwich, Amherstburg and Tilbury projects from Enbridge and its wholly-owned subsidiaries for an aggregate purchase price of approximately $1.2 billion, financed in part by the issuance of additional ordinary trust units of the Fund to EIFH and ECT preferred units to Enbridge. EIFH in turn issued additional Common Shares to the public and to Enbridge. Enbridge also provided bridge financing to the Fund for the balance of the purchase price, which was repaid in December 2012. Enbridge’s overall economic interest in the Fund was reduced from 69.2% to 67.7% upon completion of the transaction. Canadian Restructuring Plan
In December 2014, Enbridge announced its plan to transfer the majority of its Canadian Liquids Pipelines business comprising EPI and Enbridge Pipelines (Athabasca) Inc. (“EP Athabasca”), and certain Canadian renewable energy assets with a combined carrying value of approximately $17 billion, with an associated secured growth capital program of approximately $15 billion, to the Fund (collectively, the “Canadian Restructuring Plan”). The transfer of the assets is expected to be completed in mid-2015. The Canadian Restructuring Plan was announced along with a 33% increase to the Company’s next quarterly common share dividend effective on March 1, 2015 along with a corresponding new dividend payout policy range.
The Canadian Restructuring Plan is intended to enhance the value to Enbridge’s investors while the Company executes its $44 billion growth capital program and to enhance the competitiveness of its funding costs for new organic growth opportunities and asset acquisitions. Transferring the assets to the Fund is expected to allow the majority of the growth capital program to be funded at advantageous cost, while reducing the funding requirement at Enbridge. It also allows Enbridge to monetize a portion of its existing assets on favourable terms, releasing capital from the business for redeployment into future growth opportunities.
Pursuant to the plan, EIFH is expected to acquire an increasing interest in the assets through investments in the equity of the Fund over a period of several years in amounts consistent with its equity funding capability. The Canadian Restructuring Plan has been approved in principle by the Board of Directors, but it remains subject to finalization of preliminary internal reorganization steps and a number of internal and external consents and approvals, including final approval of definitive transfer terms by the Board and by the boards of EIFH and the Fund, following a recommendation by an independent committee of EIFH and the Fund and the receipt of all necessary shareholder and regulatory approvals that may be required. Assuming all necessary consents and approvals are obtained, the transfer and initial investment by EIFH are targeted for completion by mid-2015. However, there can be no assurance that the planned restructuring will be completed in the manner contemplated, or at all, or that the current market conditions and the Company’s future forecast, based on such market conditions, will not materially change.
37
Enbridge Inc. 2014 Annual Information Form
Enbridge's Canadian Liquids Pipelines business includes its Canadian Mainline system held through EPI and its Regional Oil Sands System held through EP Athabasca. Both entities would be transferred from direct ownership by Enbridge to ownership by the Fund. Enbridge will retain operating responsibility for the Liquids Pipelines business, as it does for the assets currently held through the Fund and for those held through EEP, as well as responsibility for business development and project construction. In particular, Enbridge's enterprise-wide priority on the safety and reliability of its operations, including protection of employees, the public and the environment, will continue to apply to the Canadian Liquids Pipelines.
The Fund currently already holds a number of Enbridge's enterprise-wide renewable energy assets. The remainder of the existing Canadian renewable energy assets are held through EPI. Under the Canadian Restructuring Plan, the intention is to leave these renewable assets in EPI and include them with the transfer of the Canadian Liquids Pipelines business to the Fund. These renewable assets consist of Enbridge's interests in the Massif du Sud Wind Project, the Lac Alfred Wind Project and the Saint Robert Bellarmin Wind Projects, all located in Quebec and the Blackspring Ridge Wind Project in Alberta.
To fund the transaction, the Canadian Restructuring Plan contemplates the issuance by EIFH of $600 million to $800 million of public equity per year from 2015 through 2018 in one or more tranches to fund its increasing investment in the Canadian Liquids Pipelines business through the Fund. Enbridge will retain an obligation to ensure the Fund has sufficient equity funding to undertake the growth capital program associated with the transferred assets and the amount of public equity to be issued by EIFH would be adjusted as necessary to match its capacity to raise equity funding on favourable terms. Enbridge will contribute additional equity to EIFH to maintain its current 19.9% interest. Enbridge would also take back a significant portion of the consideration for the assets transferred to the Fund in the form of additional equity in a subsidiary of the Fund.
As a result, Enbridge's aggregate economic interest in the Fund is expected to increase from its current level of 66.4% to approximately 90% initially, and then decline to approximately 80% by 2018 as EIFH increases its investment in the Fund.
Enbridge also has under review a potential United States restructuring plan which would involve the transfer of its directly held United States liquids pipelines assets to EEP. This review has not yet progressed to a conclusion. The proposed United States liquids pipelines restructuring plan is separate from the agreement to drop down Enbridge’s 66.7% interest in the United States segment of the Alberta Clipper pipeline to EEP, which closed on January 2, 2015.
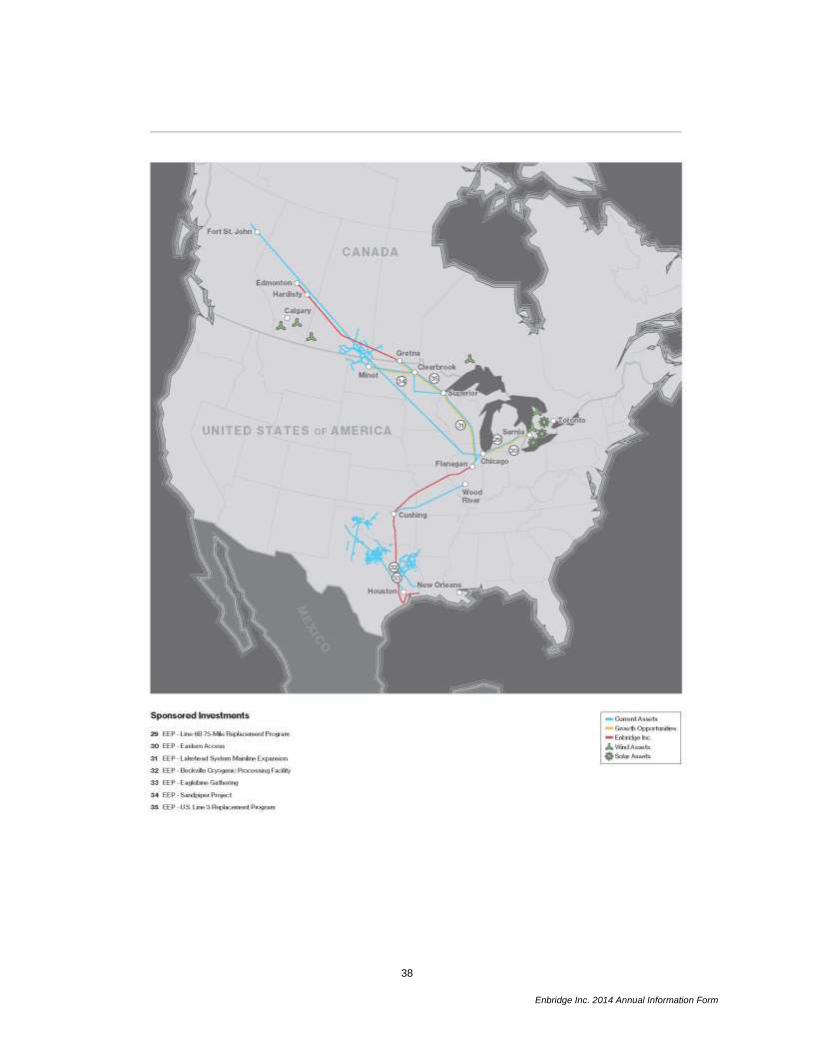
38
Enbridge Inc. 2014 Annual Information Form
39
Enbridge Inc. 2014 Annual Information Form
CORPORATE
Noverco Enbridge owns an equity interest in Noverco through ownership of 38.9% of its common shares and an investment in preferred shares. Noverco is a holding company that owns approximately 71% of Gaz Metro, a natural gas distribution company operating in the province of Quebec with interests in subsidiary companies operating gas transmission, gas distribution and power distribution businesses in the province of Quebec and the state of Vermont. Noverco also holds, directly and indirectly, an investment in Enbridge common shares. In 2014, 2013 and 2012, the board of directors of Noverco authorized the sale of a portion of its Enbridge common share holding to rebalance Noverco’s asset mix. In 2014, Noverco sold 1.3 million Enbridge common shares through a secondary offering. Unlike the 2013 and 2012 transactions discussed below, Enbridge did not receive a dividend from Noverco for its share of the net after-tax proceeds. On May 28, 2013, Noverco sold 15 million Enbridge common shares through a secondary offering. Enbridge’s share of the net after-tax proceeds of approximately $248 million was received as dividends from Noverco on June 4, 2013 and was used to pay a portion of the Company’s quarterly dividend on September 1, 2013. A portion of this dividend did not qualify for the enhanced dividend tax credit in Canada and, accordingly, was not designated as an “eligible dividend”. The dividend was a “qualified dividend” for United States tax purposes. On March 22, 2012, Noverco sold 22.5 million Enbridge common shares through a secondary offering. Enbridge’s share of the proceeds of approximately $317 million was received as a dividend from Noverco on May 18, 2012 and was used to pay a portion of the Company’s quarterly dividend on June 1, 2012. This portion of the quarterly dividend did not qualify for the enhanced dividend tax credit in Canada and, accordingly, was not designated as an “eligible dividend”. The dividend was a “qualified dividend” for United States tax purposes. A significant portion of the Company’s earnings from Noverco is in the form of dividends on its preferred share investments which are based on the yield of 10-year Government of Canada bonds plus a margin of 4.3% to 4.4%. Other Corporate
Corporate also consists of the new business development activities, general corporate investments and financing costs not allocated to the business segments. Other corporate costs include dividends on preference shares as such dividends are a deduction in determining earnings attributable to common shareholders.
For further information on the Company’s Corporate Structure, please refer to the discussion in the MD&A.
Impact of the Recent Decline in Commodity Prices
Enbridge’s value proposition is built on the foundation of its reliable business model. The majority of its earnings and cash flow are generated from tolls and fees charged for the energy delivery services that it provides to its customers. Business arrangements are structured to minimize exposure to commodity price movements and any residual exposure is closely monitored and managed through disciplined hedging programs. Commercial structures are typically designed to provide a measure of protection against the risk of a scenario where falling commodity prices indirectly impacts the utilization of the Company’s facilities. Protection against volume risk is achieved through regulated cost of service tolling arrangements, long term take-or-pay contract structures and fee for service arrangements with specific features to mitigate exposure to falling throughput.
40
Enbridge Inc. 2014 Annual Information Form
Smaller components of Enbridge’s earnings are more exposed to the impacts of commodity price volatility. This includes Energy Services, where opportunities to benefit from location, time and quality differentials can be affected by commodity market conditions. They also include the Company’s interest in Aux Sable’s natural gas fractionation facilities and EEP’s natural gas gathering and processing businesses, however, the impact on Enbridge’s overall financial performance is small and mitigated by hedging programs within these businesses and Enbridge’s partial ownership interest.
The latter half of 2014 saw a dramatic decline in the price of crude oil, natural gas and NGL and other commodities whose prices are highly correlated to crude oil. Benchmark prices for crude which had been trading over US$100 per barrel in June 2014, fell to as low as US$55 per barrel by end of the year as a result of significant increases in production both inside and outside of North America in the face of relatively tepid growth in world-wide demand. Entering 2015, prices continue to be weak and are expected to remain volatile in the near-term as the market seeks to re-balance supply and demand. The current commodity price environment has had an impact on shippers on Enbridge’s pipelines who have responded to price declines by reducing investment in exploration and development programs for 2015. However, this is not expected to materially impact the financial performance of the Company. Notwithstanding the price decline, it is expected that existing conventional and oil sands production should be more than sufficient to support continued high utilization of the Liquids Pipelines mainline. Entering 2015, nominations for service on the Company’s pipelines have continued to exceed available capacity on the system, resulting in apportionment of nominated volumes. Due to the nature of the commercial structures described above Enbridge’s earnings and cash flow are not expected to be materially affected by the current low price environment.
The decline in oil prices is also causing some sponsors of oil sands development programs to re-consider the timing of previously announced upstream development projects. Cancellation or deferral of these projects would affect longer term supply growth from the WCSB. Enbridge’s existing growth capital program described in detail herein has been commercially secured and is expected to generate reliable and predictable earnings growth through 2018 and beyond. Importantly, after taking into account the potential for some of the less profitable projects to be cancelled or deferred in an environment where low prices persist, Enbridge’s most recent near-term supply forecast re-affirms that the expansions and extensions of its liquids pipelines system currently in progress will provide very cost-effective transportation services to key markets in North America.
In the current low-price environment, Enbridge is working closely with producers to find ways to enhance capacity and provide enhanced access to markets in order to alleviate locational pricing discounts. Examples include the Company’s recently completed Flanagan South and Seaway Pipeline Twin projects, which increase access to the United States Gulf Coast refining hub.
EMPLOYEES
At Year End, Enbridge employed 8,882 employees as set forth in the following table.
Business Segment No. of Employees
Liquids Pipelines 3,027 Gas Distribution 2,429 Gas Pipelines, Processing and Energy Services 826 Sponsored Investments 1,913
Corporate 687
8,882
CORPORATE SOCIAL RESPONSIBILITY
Enbridge is committed to integrating Corporate Social Responsibility (“CSR”) into every aspect of its business. The Company defines CSR as conducting business in an ethical and responsible manner,
41
Enbridge Inc. 2014 Annual Information Form
protecting the environment and the safety of people, providing economic and other benefits to the communities in which the Company operates, supporting universal human rights and employing a variety of policies, programs and practices to manage corporate governance and ensure fair, full and timely disclosure. The Company provides its stakeholders with open, transparent disclosure of its CSR performance.
Each year Enbridge prepares a CSR Report using the Global Reporting Initiative Sustainability Reporting Guidelines, which serve as a generally accepted framework for reporting on an organization’s economic, environmental and social performance. A copy of this report is available on the Company’s website at www.enbridge.com. None of the information contained on, or connected to the Company’s website nor any of the contents of the CSR Report are incorporated by reference herein.
For further information on the Company’s Corporate Social Responsibility, please refer to the discussion in the MD&A.
RISK FACTORS
A discussion of the Company’s risk factors can be found in the MD&A under the subheading “Business Risks” for each of the Liquids Pipelines, Gas Distribution, Gas Pipelines, Processing and Energy Services and Sponsored Investments operating segments as well as under the heading “Risk Management and Financial Instruments.”
DESCRIPTION OF CAPITAL STRUCTURE
SHARE CAPITAL
Enbridge’s authorized share capital consists of an unlimited number of Common Shares and an unlimited number of Preference Shares, issuable in series. At Year End, the Company had 851,644,421 Common Shares, 5,000,000 Series A Preference Shares, 20,000,000 Series B Preference Shares, 18,000,000 Series D Preference Shares, 20,000,000 Series F Preference Shares, 14,000,000 Series H Preference Shares, 8,000,000 Series J Preference Shares, 16,000,000 Series L Preference Shares, 18,000,000 Series N Preference Shares, 16,000,000 Series P Preference Shares, 16,000,000 Series R Preference Shares, 16,000,000 Series 1 Preference Shares, 24,000,000 Series 3 Preference Shares, 8,000,000 Series 5 Preference Shares, 10,000,000 Series 7 Preference Shares, 11,000,000 Series 9 Preference Shares, 20,000,000 Series 11 Preference Shares, 14,000,000 Series 13 Preference Shares and 11,000,000 Series 15 Preference Shares issued and outstanding.
Please see attached Appendices B and C for further information on the capital structure of the Company.
RATINGS
The Company’s objectives when managing capital are to maintain flexibility among: enabling its businesses to operate at the highest efficiency while maintaining safety and reliability; providing liquidity for growth opportunities; and providing acceptable returns to shareholders. These objectives are primarily met through maintenance of an investment grade credit rating, which provides access to lower cost capital. A ratings downgrade could potentially increase the Company’s financing costs and reduce its access to capital markets. The following table sets forth the ratings assigned to the Company’s Preference Shares, MTNs and unsecured debt and commercial paper by DBRS Limited (“DBRS”), Moody’s Investor Services, Inc. (“Moody’s”) and Standard & Poor’s Ratings Services (“S&P”).
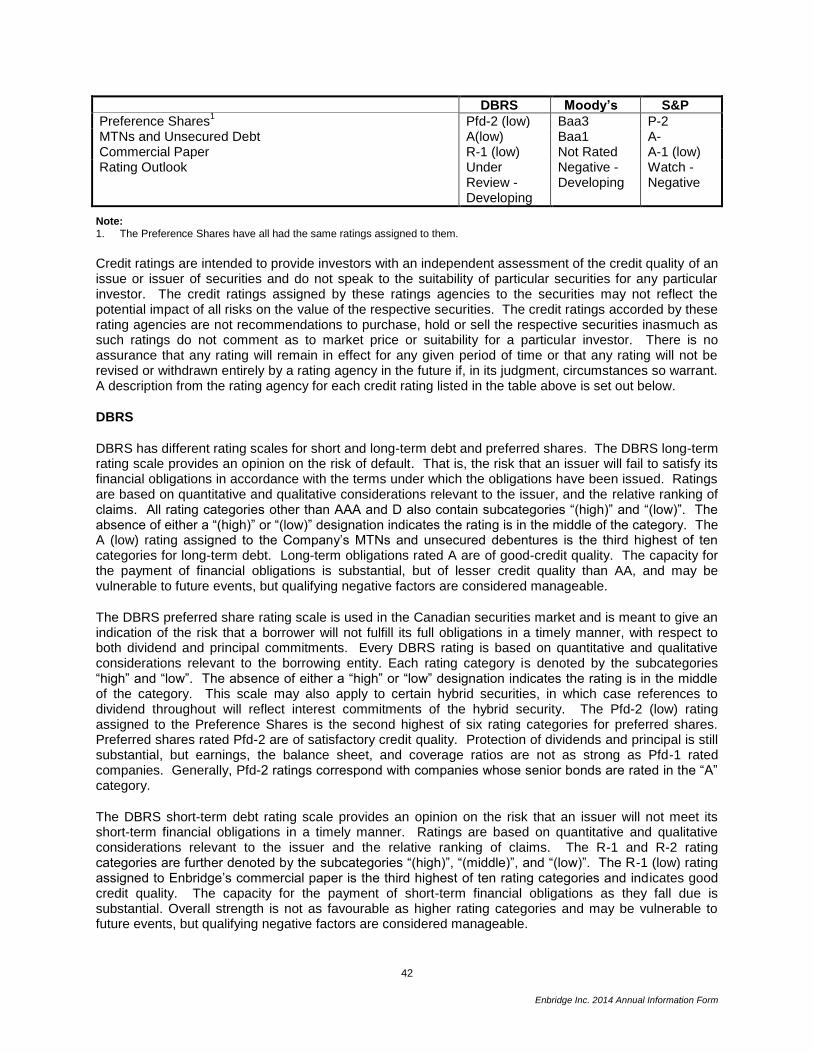
42
Enbridge Inc. 2014 Annual Information Form
DBRS Moody’s S&P
Preference Shares1 Pfd-2 (low) Baa3 P-2
MTNs and Unsecured Debt A(low) Baa1 A- Commercial Paper R-1 (low) Not Rated A-1 (low) Rating Outlook Under
Review -Developing
Negative -Developing
Watch -Negative
Note: 1. The Preference Shares have all had the same ratings assigned to them.
Credit ratings are intended to provide investors with an independent assessment of the credit quality of an issue or issuer of securities and do not speak to the suitability of particular securities for any particular investor. The credit ratings assigned by these ratings agencies to the securities may not reflect the potential impact of all risks on the value of the respective securities. The credit ratings accorded by these rating agencies are not recommendations to purchase, hold or sell the respective securities inasmuch as such ratings do not comment as to market price or suitability for a particular investor. There is no assurance that any rating will remain in effect for any given period of time or that any rating will not be revised or withdrawn entirely by a rating agency in the future if, in its judgment, circumstances so warrant. A description from the rating agency for each credit rating listed in the table above is set out below.
DBRS
DBRS has different rating scales for short and long-term debt and preferred shares. The DBRS long-term rating scale provides an opinion on the risk of default. That is, the risk that an issuer will fail to satisfy its financial obligations in accordance with the terms under which the obligations have been issued. Ratings are based on quantitative and qualitative considerations relevant to the issuer, and the relative ranking of claims. All rating categories other than AAA and D also contain subcategories “(high)” and “(low)”. The absence of either a “(high)” or “(low)” designation indicates the rating is in the middle of the category. The A (low) rating assigned to the Company’s MTNs and unsecured debentures is the third highest of ten categories for long-term debt. Long-term obligations rated A are of good-credit quality. The capacity for the payment of financial obligations is substantial, but of lesser credit quality than AA, and may be vulnerable to future events, but qualifying negative factors are considered manageable.
The DBRS preferred share rating scale is used in the Canadian securities market and is meant to give an indication of the risk that a borrower will not fulfill its full obligations in a timely manner, with respect to both dividend and principal commitments. Every DBRS rating is based on quantitative and qualitative considerations relevant to the borrowing entity. Each rating category is denoted by the subcategories “high” and “low”. The absence of either a “high” or “low” designation indicates the rating is in the middle of the category. This scale may also apply to certain hybrid securities, in which case references to dividend throughout will reflect interest commitments of the hybrid security. The Pfd-2 (low) rating assigned to the Preference Shares is the second highest of six rating categories for preferred shares. Preferred shares rated Pfd-2 are of satisfactory credit quality. Protection of dividends and principal is still substantial, but earnings, the balance sheet, and coverage ratios are not as strong as Pfd-1 rated companies. Generally, Pfd-2 ratings correspond with companies whose senior bonds are rated in the “A” category.
The DBRS short-term debt rating scale provides an opinion on the risk that an issuer will not meet its short-term financial obligations in a timely manner. Ratings are based on quantitative and qualitative considerations relevant to the issuer and the relative ranking of claims. The R-1 and R-2 rating categories are further denoted by the subcategories “(high)”, “(middle)”, and “(low)”. The R-1 (low) rating assigned to Enbridge’s commercial paper is the third highest of ten rating categories and indicates good credit quality. The capacity for the payment of short-term financial obligations as they fall due is substantial. Overall strength is not as favourable as higher rating categories and may be vulnerable to future events, but qualifying negative factors are considered manageable.
43
Enbridge Inc. 2014 Annual Information Form
Moody’s
Moody’s long-term ratings are assigned to issuers or obligations with an original maturity of one year or more and reflect both on the likelihood of a default on contractually promised payments and the expected financial loss suffered in the event of default. The Baa1 rating assigned to the Company’s MTNs, and unsecured debentures and the Baa3 rating assigned to the Company’s Preference Shares are the fourth highest of nine categories for long-term obligations. Obligations rated Baa are judged to be medium grade and subject to moderate credit risk and, as such, may possess certain speculative characteristics. Moody’s appends numerical modifiers 1, 2, and 3 to each generic rating classification from Aa through Caa. The modifier 1 indicates that the obligation ranks in the higher end of its generic rating category; the modifier 2 indicates a mid-range ranking; and the modifier 3 indicates a ranking in the lower end of that generic rating category.
Moody’s assigns provisional ratings to MTN programs and definitive ratings to the individual debt securities issued from them (referred to as drawdowns or notes). MTN program ratings are intended to reflect the ratings likely to be assigned to drawdowns issued from the program with the specified priority of claim (e.g. senior or subordinated). To capture the contingent nature of a program rating, Moody’s assigns provisional ratings to MTN programs. A provisional rating is denoted by a (P) in front of the rating.
S&P
S&P has different rating scales for short and long-term obligations. Ratings for long-term obligations may be modified by the addition of a plus (“+”) or a minus (“-“) sign to show the relative standing within a particular rating category. The S&P Canadian preferred share rating scale serves issuers, investors, and intermediaries in the Canadian financial markets by expressing preferred share ratings (determined in accordance with global rating criteria) in terms of rating symbols that have been actively used in the Canadian market over a number of years. A S&P preferred share rating on the Canadian scale is a forward-looking opinion about the creditworthiness of an obligor with respect to a specific preferred share obligation issued in the Canadian market, relative to preferred shares issued by other issuers in the Canadian market. There is a direct correspondence between the specific ratings assigned on the Canadian preferred share scale and the various rating levels on the global debt rating scale of S&P. The P-2 rating assigned to the Company’s Preference Shares is the second highest of eight categories for Canadian preferred shares. P-2 corresponds to BBB. An obligor rated BBB has adequate capacity to meet its financial commitments; however, adverse economic conditions or changing circumstances are more likely to lead to a weakened capacity of the obligor to meet its financial commitments.
The A- rating assigned to Enbridge’s MTNs and unsecured debentures is the third highest of 11 rating categories. An A rating indicates the obligor has strong capacity to meet its financial commitments but is somewhat more susceptible to the adverse effects of changes in circumstances and economic conditions than obligors in higher-rated categories.
A S&P Canadian commercial paper rating is a forward-looking opinion about the capacity of an obligor to meet the financial commitments associated with a specific commercial paper program or other short-term financial instrument ("obligation") relative to the debt servicing and repayment capacity of other obligors active in the Canadian domestic financial markets with respect to their own financial obligations. The A-1(Low) rating assigned to Enbridge’s commercial paper program is the third highest of 8 rating categories with a (low) designation after the rating indicating a slightly higher susceptibility to the adverse effects of changes in circumstances and economic conditions than obligations in higher rating categories, although the obligor’s capacity to meet its financial commitment on the obligation is satisfactory. Obligations rated A-1 (low) on the Canadian commercial paper rating scale qualify for a rating of A-2 on the S&P global short-term rating scale. A rating of A-2 by S&P means the obligor is somewhat more susceptible to the adverse effects of changes in circumstances and economic conditions than obligations in the highest rating category, but the obligor’s capacity to meet its financial commitment is satisfactory.
44
Enbridge Inc. 2014 Annual Information Form
The Company made payments to DBRS, Moody’s and S&P in connection with the assignment of ratings on the long-term debt, preference shares and commercial paper of the Company and will make payments to these rating agencies in connection with the confirmation of such ratings for purposes of any future offerings of such securities. Other than those payments made in respect of credit ratings, no additional payments have been made to any of these rating agencies for any other services provided to the Company during the past two years.
Rating Outlook
In December 2014, following the Company’s announcement of a change to the dividend policy as well as the Canadian Restructuring Plan the rating outlook was updated to “Under Review – Developing” by DBRS, “Negative – Developing” by Moody’s and “Watch – Negative” by S&P. None of the rating agencies have changed their ratings at this time.
DIVIDENDS AND DIVIDEND POLICY
Common Shares
The declaration and payment of dividends on the Common Shares are at the discretion of the Board. Dividends on the Common Shares are paid quarterly, on the first day of March, June, September and December of each year. The Board supports a stable and consistent dividend policy for these shares. On December 3, 2014 Enbridge announced a 33% increase to its next quarterly Common Share dividend as well as a corresponding new dividend payout policy range. The Company’s quarterly Common Share dividend will increase 33% to $0.465 per share with the dividend payable March 1, 2015 to shareholders of record on February 16, 2015. Enbridge’s Board of Directors also approved a revised dividend payout policy range of 75% to 85% of adjusted earnings. The previous payout was 60% to 70%. The payout range is expected to rise from the lower end of the new range in 2015 to the higher end by 2018 as the funding of Enbridge’s current organic growth capital program progresses.
Special dividends may also be declared from time to time to implement corporate strategic initiatives.
The Company has a Dividend Reinvestment Plan (“DRIP”) which enables registered holders of Commons Shares to receive their dividends in the form of newly issued Common Shares. See Appendix C for more information on the DRIP. Preference Shares The declaration and payment of dividends on the Company’s Preference Shares are at the discretion of the Board. Dividends on the Company’s Preference Shares, Series A are fixed and are paid quarterly. Dividends on the Company’s Preference Shares, Series B, D, F, H, J, L, N, P, R, 1, 3, 5, 7, 9, 11, 13 and 15, are fixed for the initial term (the period from and including the date of issue of such shares to but excluding the applicable initial period end date) and are paid quarterly. At the end of the initial term, the fixed dividend rate for the respective series of Preference Shares will be reset for a subsequent five-year term, or the holders may elect to convert to a floating rate dividend which will be reset quarterly thereafter.
DIVIDENDS
The following table summarizes the dividends paid per share for each of the three years ended December 31, 2012, 2013 and 2014, on each class and series of securities of the Company that was outstanding at December 31, 2014, all expressed in Canadian dollars unless otherwise noted.
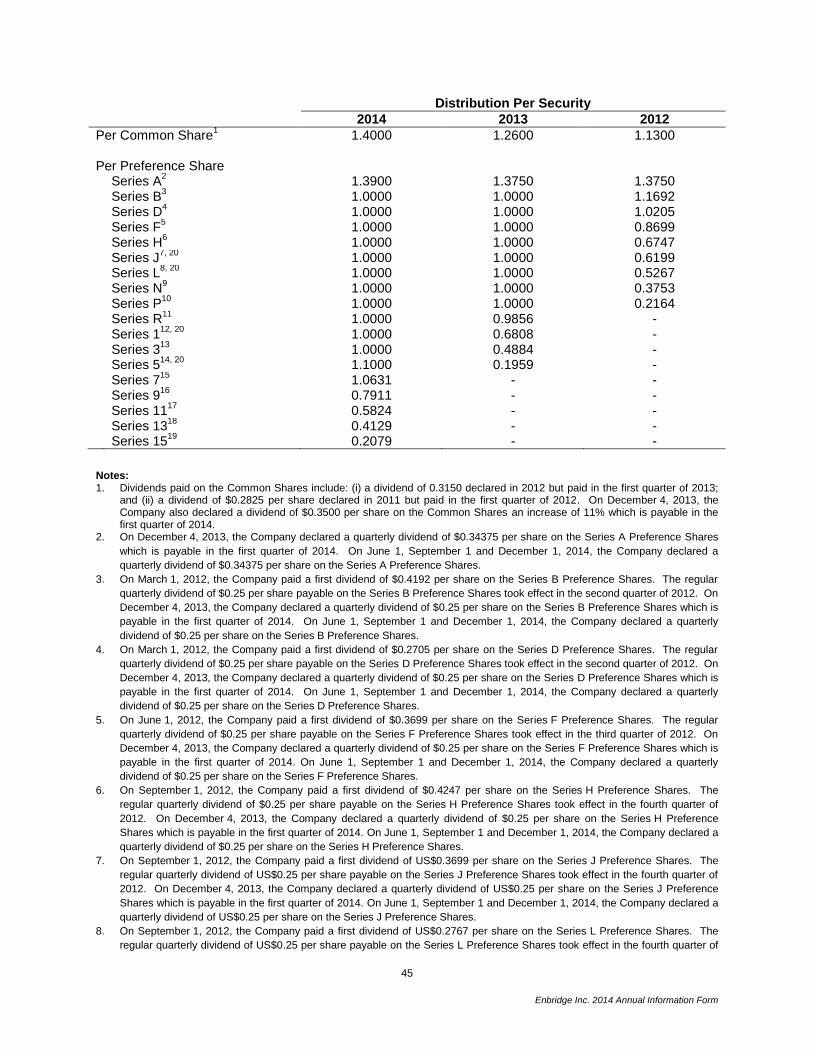
45
Enbridge Inc. 2014 Annual Information Form
Distribution Per Security
2014 2013 2012
Per Common Share1 1.4000 1.2600 1.1300
Per Preference Share Series A
2 1.3900 1.3750 1.3750
Series B3 1.0000 1.0000 1.1692
Series D4 1.0000 1.0000 1.0205
Series F5 1.0000 1.0000 0.8699
Series H6 1.0000 1.0000 0.6747
Series J7, 20
1.0000 1.0000 0.6199 Series L
8, 20 1.0000 1.0000 0.5267
Series N9 1.0000 1.0000 0.3753
Series P10
1.0000 1.0000 0.2164 Series R
11 1.0000 0.9856 -
Series 112, 20
1.0000 0.6808 - Series 3
13 1.0000 0.4884 -
Series 514, 20
1.1000 0.1959 - Series 7
15 1.0631 - -
Series 916
0.7911 - - Series 11
17 0.5824 - -
Series 1318
0.4129 - - Series 15
19 0.2079 - -
Notes: 1. Dividends paid on the Common Shares include: (i) a dividend of 0.3150 declared in 2012 but paid in the first quarter of 2013;
and (ii) a dividend of $0.2825 per share declared in 2011 but paid in the first quarter of 2012. On December 4, 2013, the Company also declared a dividend of $0.3500 per share on the Common Shares an increase of 11% which is payable in the first quarter of 2014.
2. On December 4, 2013, the Company declared a quarterly dividend of $0.34375 per share on the Series A Preference Shares
which is payable in the first quarter of 2014. On June 1, September 1 and December 1, 2014, the Company declared a
quarterly dividend of $0.34375 per share on the Series A Preference Shares.
3. On March 1, 2012, the Company paid a first dividend of $0.4192 per share on the Series B Preference Shares. The regular
quarterly dividend of $0.25 per share payable on the Series B Preference Shares took effect in the second quarter of 2012. On
December 4, 2013, the Company declared a quarterly dividend of $0.25 per share on the Series B Preference Shares which is
payable in the first quarter of 2014. On June 1, September 1 and December 1, 2014, the Company declared a quarterly
dividend of $0.25 per share on the Series B Preference Shares.
4. On March 1, 2012, the Company paid a first dividend of $0.2705 per share on the Series D Preference Shares. The regular
quarterly dividend of $0.25 per share payable on the Series D Preference Shares took effect in the second quarter of 2012. On
December 4, 2013, the Company declared a quarterly dividend of $0.25 per share on the Series D Preference Shares which is
payable in the first quarter of 2014. On June 1, September 1 and December 1, 2014, the Company declared a quarterly
dividend of $0.25 per share on the Series D Preference Shares.
5. On June 1, 2012, the Company paid a first dividend of $0.3699 per share on the Series F Preference Shares. The regular
quarterly dividend of $0.25 per share payable on the Series F Preference Shares took effect in the third quarter of 2012. On
December 4, 2013, the Company declared a quarterly dividend of $0.25 per share on the Series F Preference Shares which is
payable in the first quarter of 2014. On June 1, September 1 and December 1, 2014, the Company declared a quarterly
dividend of $0.25 per share on the Series F Preference Shares.
6. On September 1, 2012, the Company paid a first dividend of $0.4247 per share on the Series H Preference Shares. The
regular quarterly dividend of $0.25 per share payable on the Series H Preference Shares took effect in the fourth quarter of
2012. On December 4, 2013, the Company declared a quarterly dividend of $0.25 per share on the Series H Preference
Shares which is payable in the first quarter of 2014. On June 1, September 1 and December 1, 2014, the Company declared a
quarterly dividend of $0.25 per share on the Series H Preference Shares.
7. On September 1, 2012, the Company paid a first dividend of US$0.3699 per share on the Series J Preference Shares. The
regular quarterly dividend of US$0.25 per share payable on the Series J Preference Shares took effect in the fourth quarter of
2012. On December 4, 2013, the Company declared a quarterly dividend of US$0.25 per share on the Series J Preference
Shares which is payable in the first quarter of 2014. On June 1, September 1 and December 1, 2014, the Company declared a
quarterly dividend of US$0.25 per share on the Series J Preference Shares.
8. On September 1, 2012, the Company paid a first dividend of US$0.2767 per share on the Series L Preference Shares. The
regular quarterly dividend of US$0.25 per share payable on the Series L Preference Shares took effect in the fourth quarter of
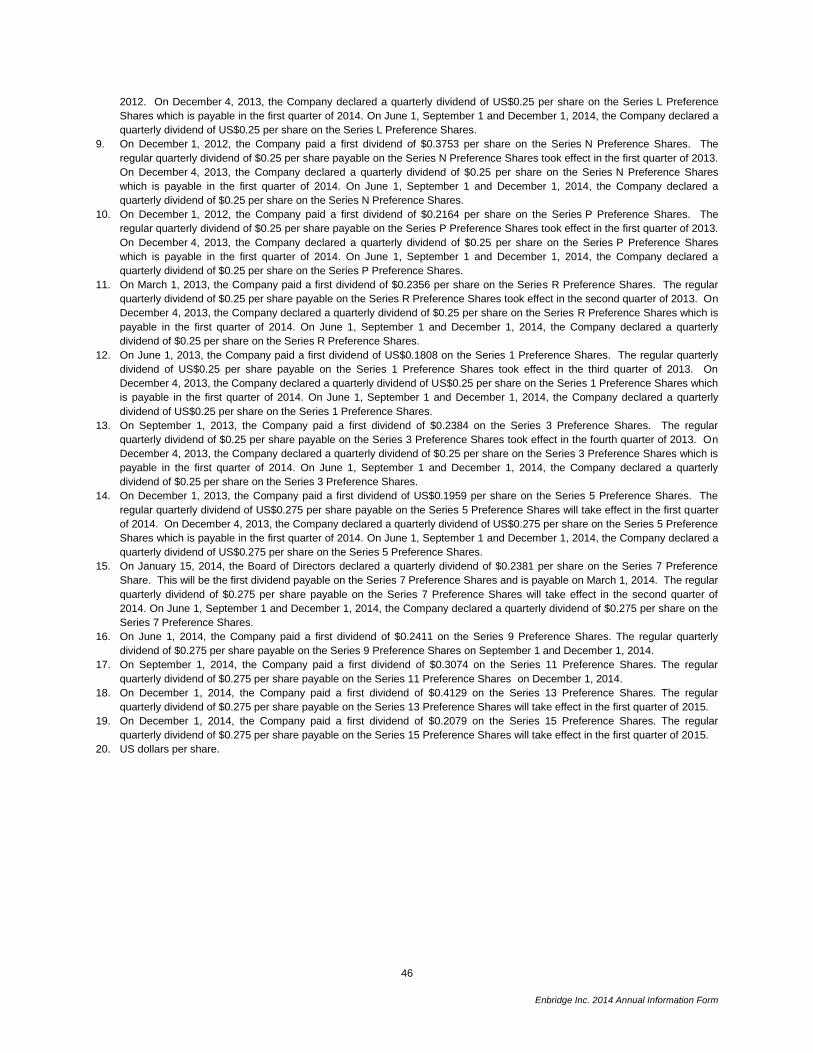
46
Enbridge Inc. 2014 Annual Information Form
2012. On December 4, 2013, the Company declared a quarterly dividend of US$0.25 per share on the Series L Preference
Shares which is payable in the first quarter of 2014. On June 1, September 1 and December 1, 2014, the Company declared a
quarterly dividend of US$0.25 per share on the Series L Preference Shares.
9. On December 1, 2012, the Company paid a first dividend of $0.3753 per share on the Series N Preference Shares. The
regular quarterly dividend of $0.25 per share payable on the Series N Preference Shares took effect in the first quarter of 2013.
On December 4, 2013, the Company declared a quarterly dividend of $0.25 per share on the Series N Preference Shares
which is payable in the first quarter of 2014. On June 1, September 1 and December 1, 2014, the Company declared a
quarterly dividend of $0.25 per share on the Series N Preference Shares.
10. On December 1, 2012, the Company paid a first dividend of $0.2164 per share on the Series P Preference Shares. The
regular quarterly dividend of $0.25 per share payable on the Series P Preference Shares took effect in the first quarter of 2013.
On December 4, 2013, the Company declared a quarterly dividend of $0.25 per share on the Series P Preference Shares
which is payable in the first quarter of 2014. On June 1, September 1 and December 1, 2014, the Company declared a
quarterly dividend of $0.25 per share on the Series P Preference Shares.
11. On March 1, 2013, the Company paid a first dividend of $0.2356 per share on the Series R Preference Shares. The regular
quarterly dividend of $0.25 per share payable on the Series R Preference Shares took effect in the second quarter of 2013. On
December 4, 2013, the Company declared a quarterly dividend of $0.25 per share on the Series R Preference Shares which is
payable in the first quarter of 2014. On June 1, September 1 and December 1, 2014, the Company declared a quarterly
dividend of $0.25 per share on the Series R Preference Shares.
12. On June 1, 2013, the Company paid a first dividend of US$0.1808 on the Series 1 Preference Shares. The regular quarterly
dividend of US$0.25 per share payable on the Series 1 Preference Shares took effect in the third quarter of 2013. On
December 4, 2013, the Company declared a quarterly dividend of US$0.25 per share on the Series 1 Preference Shares which
is payable in the first quarter of 2014. On June 1, September 1 and December 1, 2014, the Company declared a quarterly
dividend of US$0.25 per share on the Series 1 Preference Shares.
13. On September 1, 2013, the Company paid a first dividend of $0.2384 on the Series 3 Preference Shares. The regular
quarterly dividend of $0.25 per share payable on the Series 3 Preference Shares took effect in the fourth quarter of 2013. On
December 4, 2013, the Company declared a quarterly dividend of $0.25 per share on the Series 3 Preference Shares which is
payable in the first quarter of 2014. On June 1, September 1 and December 1, 2014, the Company declared a quarterly
dividend of $0.25 per share on the Series 3 Preference Shares.
14. On December 1, 2013, the Company paid a first dividend of US$0.1959 per share on the Series 5 Preference Shares. The
regular quarterly dividend of US$0.275 per share payable on the Series 5 Preference Shares will take effect in the first quarter
of 2014. On December 4, 2013, the Company declared a quarterly dividend of US$0.275 per share on the Series 5 Preference
Shares which is payable in the first quarter of 2014. On June 1, September 1 and December 1, 2014, the Company declared a
quarterly dividend of US$0.275 per share on the Series 5 Preference Shares.
15. On January 15, 2014, the Board of Directors declared a quarterly dividend of $0.2381 per share on the Series 7 Preference
Share. This will be the first dividend payable on the Series 7 Preference Shares and is payable on March 1, 2014. The regular
quarterly dividend of $0.275 per share payable on the Series 7 Preference Shares will take effect in the second quarter of
2014. On June 1, September 1 and December 1, 2014, the Company declared a quarterly dividend of $0.275 per share on the
Series 7 Preference Shares.
16. On June 1, 2014, the Company paid a first dividend of $0.2411 on the Series 9 Preference Shares. The regular quarterly
dividend of $0.275 per share payable on the Series 9 Preference Shares on September 1 and December 1, 2014.
17. On September 1, 2014, the Company paid a first dividend of $0.3074 on the Series 11 Preference Shares. The regular
quarterly dividend of $0.275 per share payable on the Series 11 Preference Shares on December 1, 2014.
18. On December 1, 2014, the Company paid a first dividend of $0.4129 on the Series 13 Preference Shares. The regular
quarterly dividend of $0.275 per share payable on the Series 13 Preference Shares will take effect in the first quarter of 2015.
19. On December 1, 2014, the Company paid a first dividend of $0.2079 on the Series 15 Preference Shares. The regular
quarterly dividend of $0.275 per share payable on the Series 15 Preference Shares will take effect in the first quarter of 2015.
20. US dollars per share.
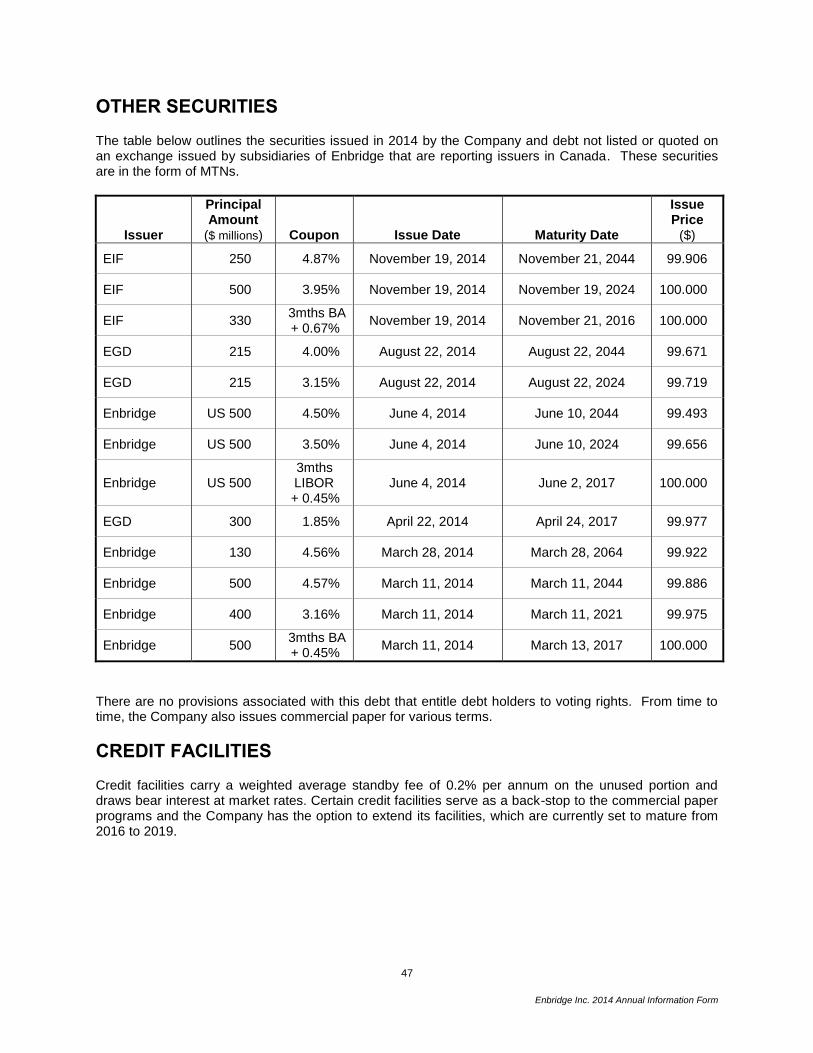
47
Enbridge Inc. 2014 Annual Information Form
OTHER SECURITIES
The table below outlines the securities issued in 2014 by the Company and debt not listed or quoted on an exchange issued by subsidiaries of Enbridge that are reporting issuers in Canada. These securities are in the form of MTNs.
Issuer
Principal Amount
($ millions) Coupon Issue Date Maturity Date
Issue Price
($)
EIF 250 4.87% November 19, 2014 November 21, 2044 99.906
EIF 500 3.95% November 19, 2014 November 19, 2024 100.000
EIF 330 3mths BA + 0.67%
November 19, 2014 November 21, 2016 100.000
EGD 215 4.00% August 22, 2014 August 22, 2044 99.671
EGD 215 3.15% August 22, 2014 August 22, 2024 99.719
Enbridge US 500 4.50% June 4, 2014 June 10, 2044 99.493
Enbridge US 500 3.50% June 4, 2014 June 10, 2024 99.656
Enbridge US 500 3mths LIBOR + 0.45%
June 4, 2014 June 2, 2017 100.000
EGD 300 1.85% April 22, 2014 April 24, 2017 99.977
Enbridge 130 4.56% March 28, 2014 March 28, 2064 99.922
Enbridge 500 4.57% March 11, 2014 March 11, 2044 99.886
Enbridge 400 3.16% March 11, 2014 March 11, 2021 99.975
Enbridge 500 3mths BA + 0.45%
March 11, 2014 March 13, 2017 100.000
There are no provisions associated with this debt that entitle debt holders to voting rights. From time to time, the Company also issues commercial paper for various terms.
CREDIT FACILITIES
Credit facilities carry a weighted average standby fee of 0.2% per annum on the unused portion and draws bear interest at market rates. Certain credit facilities serve as a back-stop to the commercial paper programs and the Company has the option to extend its facilities, which are currently set to mature from 2016 to 2019.
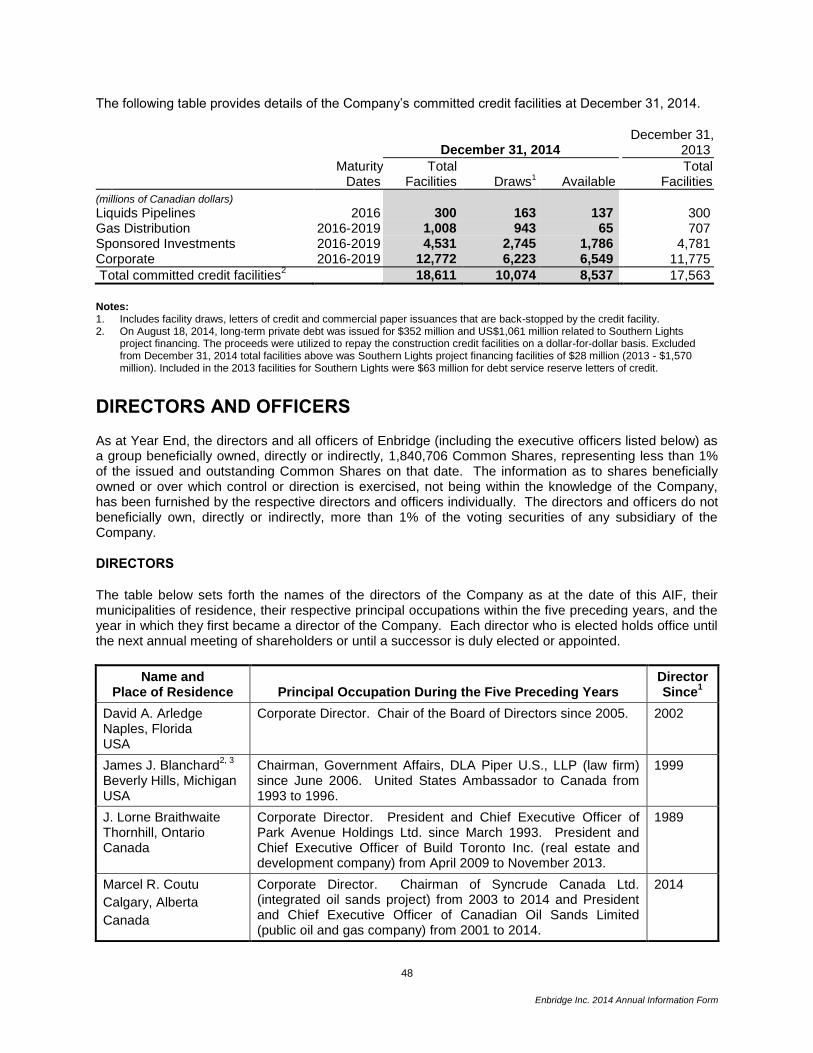
48
Enbridge Inc. 2014 Annual Information Form
The following table provides details of the Company’s committed credit facilities at December 31, 2014.
December 31, 2014 December 31,
2013
Maturity
Dates
Total Facilities Draws1 Available
Total
Facilities
(millions of Canadian dollars)
Liquids Pipelines
2016 300 163 137 300 Gas Distribution
2016-2019 1,008 943 65 707
Sponsored Investments
2016-2019 4,531 2,745 1,786 4,781 Corporate
2016-2019 12,772 6,223 6,549 11,775
Total committed credit facilities2 18,611 10,074 8,537 17,563
Notes: 1. Includes facility draws, letters of credit and commercial paper issuances that are back-stopped by the credit facility. 2. On August 18, 2014, long-term private debt was issued for $352 million and US$1,061 million related to Southern Lights
project financing. The proceeds were utilized to repay the construction credit facilities on a dollar-for-dollar basis. Excluded from December 31, 2014 total facilities above was Southern Lights project financing facilities of $28 million (2013 - $1,570 million). Included in the 2013 facilities for Southern Lights were $63 million for debt service reserve letters of credit.
DIRECTORS AND OFFICERS
As at Year End, the directors and all officers of Enbridge (including the executive officers listed below) as a group beneficially owned, directly or indirectly, 1,840,706 Common Shares, representing less than 1% of the issued and outstanding Common Shares on that date. The information as to shares beneficially owned or over which control or direction is exercised, not being within the knowledge of the Company, has been furnished by the respective directors and officers individually. The directors and officers do not beneficially own, directly or indirectly, more than 1% of the voting securities of any subsidiary of the Company.
DIRECTORS
The table below sets forth the names of the directors of the Company as at the date of this AIF, their municipalities of residence, their respective principal occupations within the five preceding years, and the year in which they first became a director of the Company. Each director who is elected holds office until the next annual meeting of shareholders or until a successor is duly elected or appointed.
Name and Place of Residence Principal Occupation During the Five Preceding Years
Director Since
1
David A. Arledge Naples, Florida USA
Corporate Director. Chair of the Board of Directors since 2005. 2002
James J. Blanchard2, 3
Beverly Hills, Michigan USA
Chairman, Government Affairs, DLA Piper U.S., LLP (law firm) since June 2006. United States Ambassador to Canada from 1993 to 1996.
1999
J. Lorne Braithwaite Thornhill, Ontario Canada
Corporate Director. President and Chief Executive Officer of Park Avenue Holdings Ltd. since March 1993. President and Chief Executive Officer of Build Toronto Inc. (real estate and development company) from April 2009 to November 2013.
1989
Marcel R. Coutu
Calgary, Alberta
Canada
Corporate Director. Chairman of Syncrude Canada Ltd. (integrated oil sands project) from 2003 to 2014 and President and Chief Executive Officer of Canadian Oil Sands Limited (public oil and gas company) from 2001 to 2014.
2014
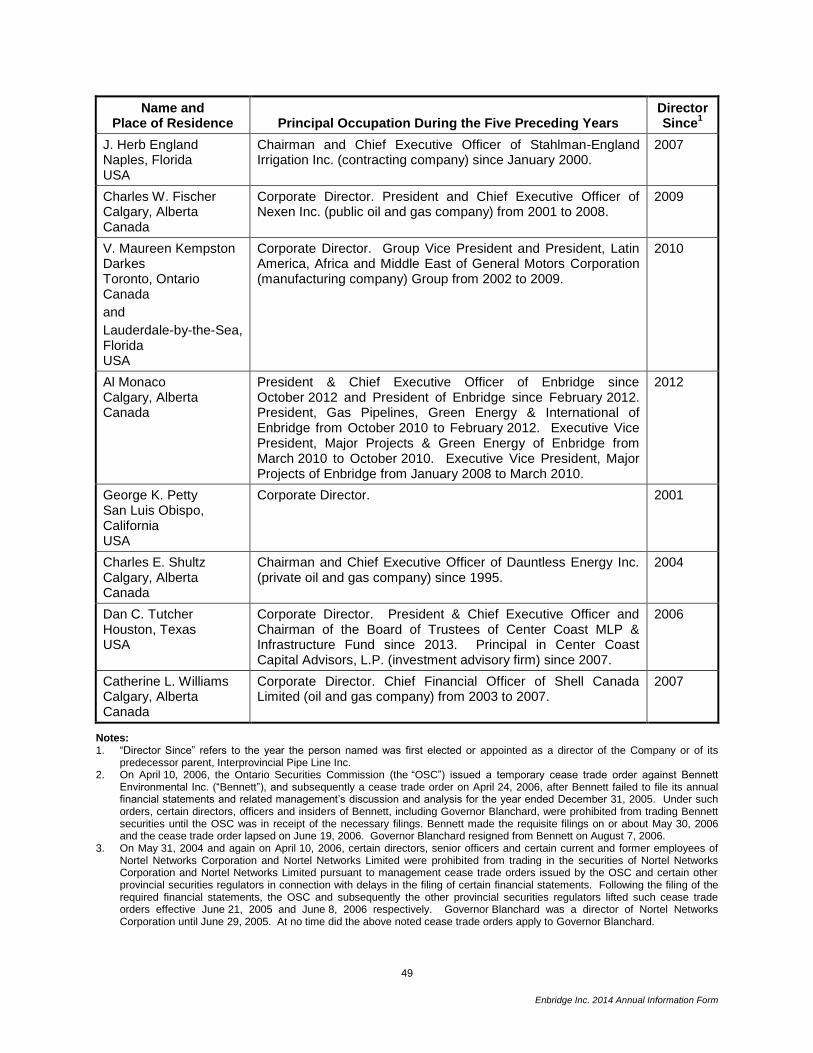
49
Enbridge Inc. 2014 Annual Information Form
Name and Place of Residence Principal Occupation During the Five Preceding Years
Director Since
1
J. Herb England Naples, Florida USA
Chairman and Chief Executive Officer of Stahlman-England Irrigation Inc. (contracting company) since January 2000.
2007
Charles W. Fischer Calgary, Alberta Canada
Corporate Director. President and Chief Executive Officer of Nexen Inc. (public oil and gas company) from 2001 to 2008.
2009
V. Maureen Kempston Darkes Toronto, Ontario Canada
and
Lauderdale-by-the-Sea, Florida USA
Corporate Director. Group Vice President and President, Latin America, Africa and Middle East of General Motors Corporation (manufacturing company) Group from 2002 to 2009.
2010
Al Monaco Calgary, Alberta Canada
President & Chief Executive Officer of Enbridge since October 2012 and President of Enbridge since February 2012. President, Gas Pipelines, Green Energy & International of Enbridge from October 2010 to February 2012. Executive Vice President, Major Projects & Green Energy of Enbridge from March 2010 to October 2010. Executive Vice President, Major Projects of Enbridge from January 2008 to March 2010.
2012
George K. Petty San Luis Obispo, California USA
Corporate Director. 2001
Charles E. Shultz Calgary, Alberta Canada
Chairman and Chief Executive Officer of Dauntless Energy Inc. (private oil and gas company) since 1995.
2004
Dan C. Tutcher Houston, Texas USA
Corporate Director. President & Chief Executive Officer and Chairman of the Board of Trustees of Center Coast MLP & Infrastructure Fund since 2013. Principal in Center Coast Capital Advisors, L.P. (investment advisory firm) since 2007.
2006
Catherine L. Williams Calgary, Alberta Canada
Corporate Director. Chief Financial Officer of Shell Canada Limited (oil and gas company) from 2003 to 2007.
2007
Notes: 1. “Director Since” refers to the year the person named was first elected or appointed as a director of the Company or of its
predecessor parent, Interprovincial Pipe Line Inc. 2. On April 10, 2006, the Ontario Securities Commission (the “OSC”) issued a temporary cease trade order against Bennett
Environmental Inc. (“Bennett”), and subsequently a cease trade order on April 24, 2006, after Bennett failed to file its annual financial statements and related management’s discussion and analysis for the year ended December 31, 2005. Under such orders, certain directors, officers and insiders of Bennett, including Governor Blanchard, were prohibited from trading Bennett securities until the OSC was in receipt of the necessary filings. Bennett made the requisite filings on or about May 30, 2006 and the cease trade order lapsed on June 19, 2006. Governor Blanchard resigned from Bennett on August 7, 2006.
3. On May 31, 2004 and again on April 10, 2006, certain directors, senior officers and certain current and former employees of Nortel Networks Corporation and Nortel Networks Limited were prohibited from trading in the securities of Nortel Networks Corporation and Nortel Networks Limited pursuant to management cease trade orders issued by the OSC and certain other provincial securities regulators in connection with delays in the filing of certain financial statements. Following the filing of the required financial statements, the OSC and subsequently the other provincial securities regulators lifted such cease trade orders effective June 21, 2005 and June 8, 2006 respectively. Governor Blanchard was a director of Nortel Networks Corporation until June 29, 2005. At no time did the above noted cease trade orders apply to Governor Blanchard.
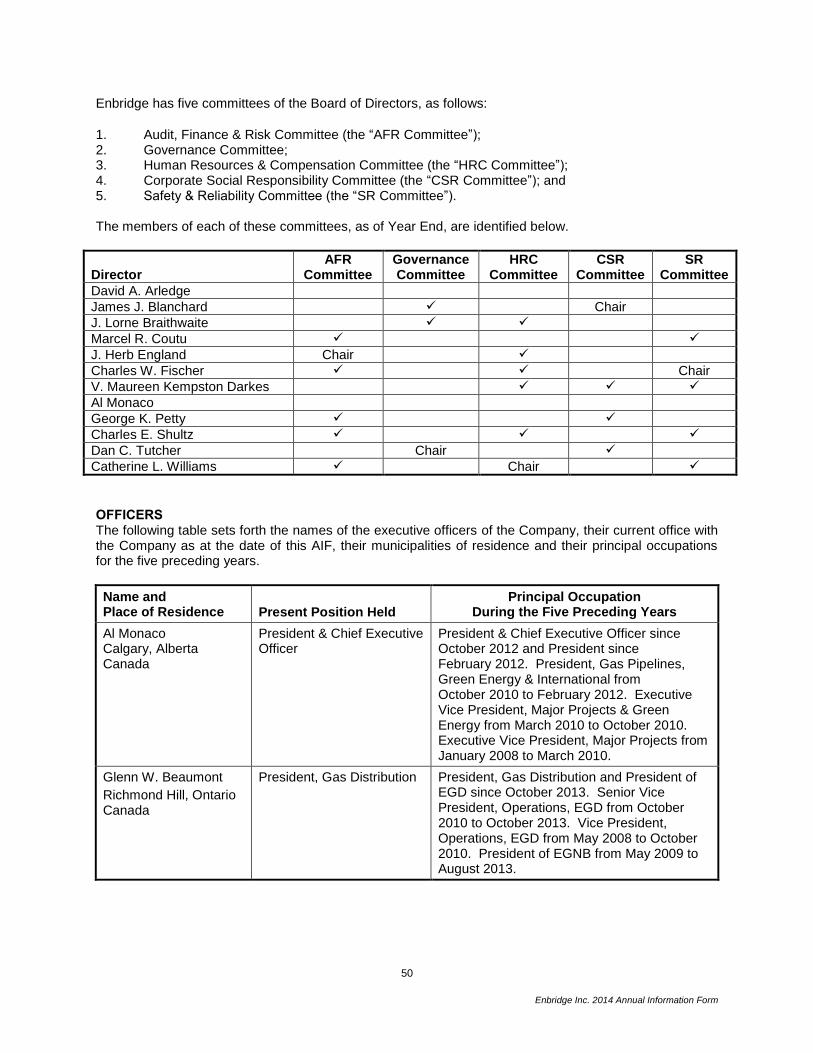
50
Enbridge Inc. 2014 Annual Information Form
Enbridge has five committees of the Board of Directors, as follows:
1. Audit, Finance & Risk Committee (the “AFR Committee”); 2. Governance Committee; 3. Human Resources & Compensation Committee (the “HRC Committee”); 4. Corporate Social Responsibility Committee (the “CSR Committee”); and 5. Safety & Reliability Committee (the “SR Committee”). The members of each of these committees, as of Year End, are identified below.
Director AFR
Committee Governance Committee
HRC Committee
CSR Committee
SR Committee
David A. Arledge
James J. Blanchard Chair
J. Lorne Braithwaite
Marcel R. Coutu
J. Herb England Chair
Charles W. Fischer Chair
V. Maureen Kempston Darkes
Al Monaco
George K. Petty
Charles E. Shultz
Dan C. Tutcher Chair
Catherine L. Williams Chair
OFFICERS The following table sets forth the names of the executive officers of the Company, their current office with the Company as at the date of this AIF, their municipalities of residence and their principal occupations for the five preceding years.
Name and Place of Residence Present Position Held
Principal Occupation During the Five Preceding Years
Al Monaco Calgary, Alberta Canada
President & Chief Executive Officer
President & Chief Executive Officer since October 2012 and President since February 2012. President, Gas Pipelines, Green Energy & International from October 2010 to February 2012. Executive Vice President, Major Projects & Green Energy from March 2010 to October 2010. Executive Vice President, Major Projects from January 2008 to March 2010.
Glenn W. Beaumont
Richmond Hill, Ontario Canada
President, Gas Distribution President, Gas Distribution and President of EGD since October 2013. Senior Vice President, Operations, EGD from October 2010 to October 2013. Vice President, Operations, EGD from May 2008 to October 2010. President of EGNB from May 2009 to August 2013.
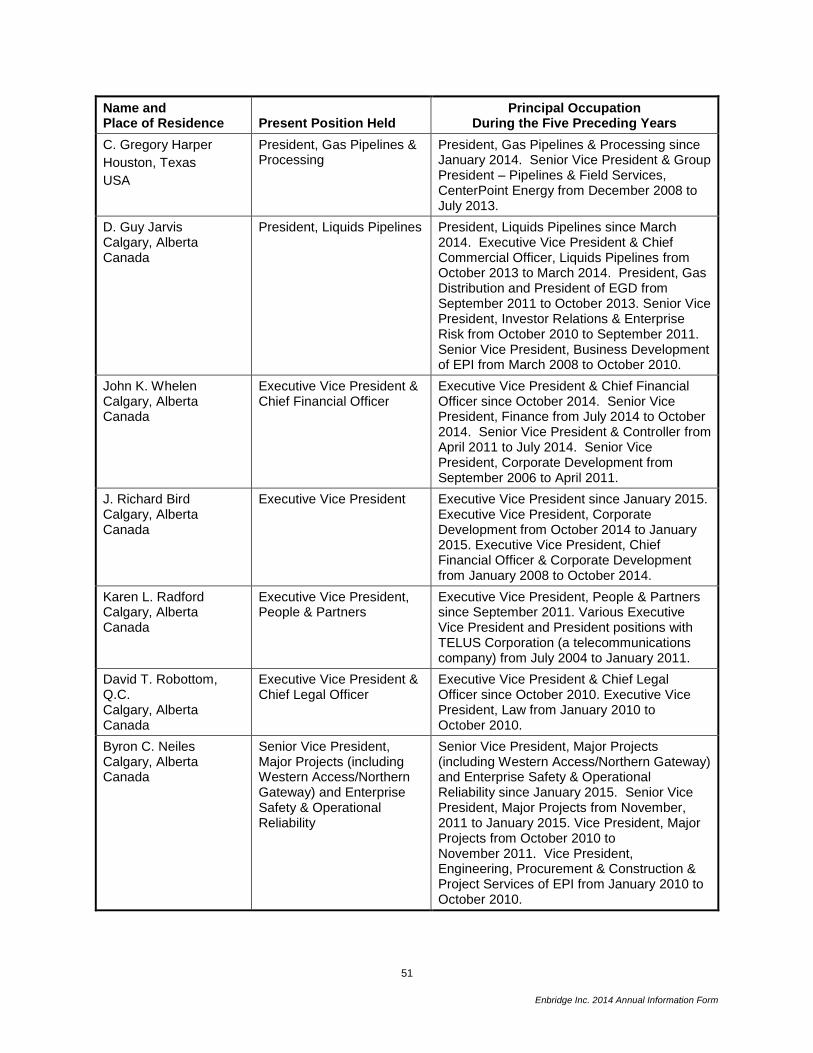
51
Enbridge Inc. 2014 Annual Information Form
Name and Place of Residence Present Position Held
Principal Occupation During the Five Preceding Years
C. Gregory Harper
Houston, Texas
USA
President, Gas Pipelines & Processing
President, Gas Pipelines & Processing since January 2014. Senior Vice President & Group President – Pipelines & Field Services, CenterPoint Energy from December 2008 to July 2013.
D. Guy Jarvis Calgary, Alberta Canada
President, Liquids Pipelines President, Liquids Pipelines since March 2014. Executive Vice President & Chief Commercial Officer, Liquids Pipelines from October 2013 to March 2014. President, Gas Distribution and President of EGD from September 2011 to October 2013. Senior Vice President, Investor Relations & Enterprise Risk from October 2010 to September 2011. Senior Vice President, Business Development of EPI from March 2008 to October 2010.
John K. Whelen Calgary, Alberta Canada
Executive Vice President & Chief Financial Officer
Executive Vice President & Chief Financial Officer since October 2014. Senior Vice President, Finance from July 2014 to October 2014. Senior Vice President & Controller from April 2011 to July 2014. Senior Vice President, Corporate Development from September 2006 to April 2011.
J. Richard Bird Calgary, Alberta Canada
Executive Vice President Executive Vice President since January 2015. Executive Vice President, Corporate Development from October 2014 to January 2015. Executive Vice President, Chief Financial Officer & Corporate Development from January 2008 to October 2014.
Karen L. Radford Calgary, Alberta Canada
Executive Vice President, People & Partners
Executive Vice President, People & Partners since September 2011. Various Executive Vice President and President positions with TELUS Corporation (a telecommunications company) from July 2004 to January 2011.
David T. Robottom, Q.C. Calgary, Alberta Canada
Executive Vice President & Chief Legal Officer
Executive Vice President & Chief Legal Officer since October 2010. Executive Vice President, Law from January 2010 to October 2010.
Byron C. Neiles Calgary, Alberta Canada
Senior Vice President, Major Projects (including Western Access/Northern Gateway) and Enterprise Safety & Operational Reliability
Senior Vice President, Major Projects (including Western Access/Northern Gateway) and Enterprise Safety & Operational Reliability since January 2015. Senior Vice President, Major Projects from November, 2011 to January 2015. Vice President, Major Projects from October 2010 to November 2011. Vice President, Engineering, Procurement & Construction & Project Services of EPI from January 2010 to October 2010.
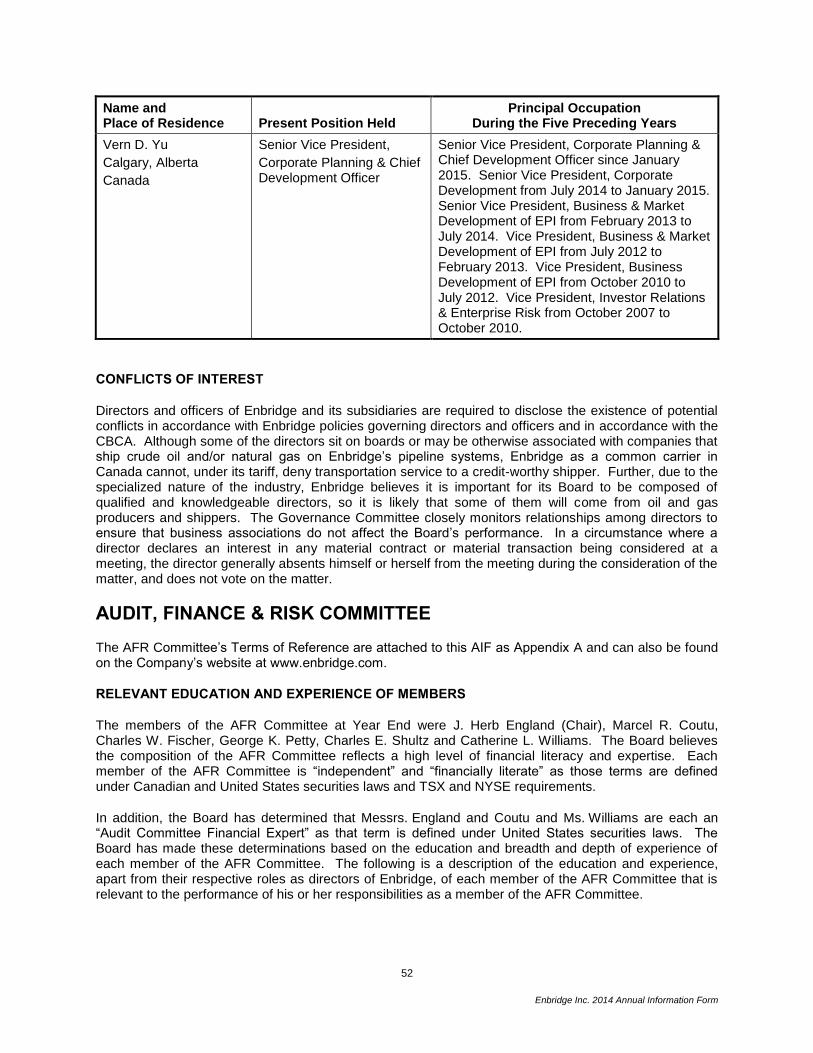
52
Enbridge Inc. 2014 Annual Information Form
Name and Place of Residence Present Position Held
Principal Occupation During the Five Preceding Years
Vern D. Yu
Calgary, Alberta
Canada
Senior Vice President,
Corporate Planning & Chief Development Officer
Senior Vice President, Corporate Planning & Chief Development Officer since January 2015. Senior Vice President, Corporate Development from July 2014 to January 2015. Senior Vice President, Business & Market Development of EPI from February 2013 to July 2014. Vice President, Business & Market Development of EPI from July 2012 to February 2013. Vice President, Business Development of EPI from October 2010 to July 2012. Vice President, Investor Relations & Enterprise Risk from October 2007 to October 2010.
CONFLICTS OF INTEREST
Directors and officers of Enbridge and its subsidiaries are required to disclose the existence of potential conflicts in accordance with Enbridge policies governing directors and officers and in accordance with the CBCA. Although some of the directors sit on boards or may be otherwise associated with companies that ship crude oil and/or natural gas on Enbridge’s pipeline systems, Enbridge as a common carrier in Canada cannot, under its tariff, deny transportation service to a credit-worthy shipper. Further, due to the specialized nature of the industry, Enbridge believes it is important for its Board to be composed of qualified and knowledgeable directors, so it is likely that some of them will come from oil and gas producers and shippers. The Governance Committee closely monitors relationships among directors to ensure that business associations do not affect the Board’s performance. In a circumstance where a director declares an interest in any material contract or material transaction being considered at a meeting, the director generally absents himself or herself from the meeting during the consideration of the matter, and does not vote on the matter.
AUDIT, FINANCE & RISK COMMITTEE
The AFR Committee’s Terms of Reference are attached to this AIF as Appendix A and can also be found on the Company’s website at www.enbridge.com.
RELEVANT EDUCATION AND EXPERIENCE OF MEMBERS
The members of the AFR Committee at Year End were J. Herb England (Chair), Marcel R. Coutu, Charles W. Fischer, George K. Petty, Charles E. Shultz and Catherine L. Williams. The Board believes the composition of the AFR Committee reflects a high level of financial literacy and expertise. Each member of the AFR Committee is “independent” and “financially literate” as those terms are defined under Canadian and United States securities laws and TSX and NYSE requirements.
In addition, the Board has determined that Messrs. England and Coutu and Ms. Williams are each an “Audit Committee Financial Expert” as that term is defined under United States securities laws. The Board has made these determinations based on the education and breadth and depth of experience of each member of the AFR Committee. The following is a description of the education and experience, apart from their respective roles as directors of Enbridge, of each member of the AFR Committee that is relevant to the performance of his or her responsibilities as a member of the AFR Committee.
53
Enbridge Inc. 2014 Annual Information Form
J. Herb England
Mr. England acquired significant financial experience and exposure to accounting and financial issues during a lengthy career with the John Labatt Limited group of companies, including as Chief Financial Officer of John Labatt Limited. He is currently Chairman and Chief Executive Officer of Stahlman-England Irrigation Inc., a contracting company in Florida. Mr. England also currently serves as a director and Chair of the audit committees of Enbridge Gas Distribution Inc., Enbridge Management L.L.C., Enbridge Energy Company Inc. and Midcoast Holdings L.L.C. and a member of the audit committee of Fuel Cell Energy Inc.
Marcel R. Coutu
Mr. Coutu acquired significant financial experience and exposure to accounting and financial issues during a lengthy business career which included Chairman of Syncrude Canada Ltd. and former President & Chief Executive Officer of Canadian Oil Sands Limited from 2001 until January 2014. Mr. Coutu was also Senior Vice President & Chief Financial Officer of Gulf Canada Resources Limited from 1999 to 2001 and held various executive positions with TransCanada PipeLines Limited. He currently also serves as director and a member of the audit committee of Brookfield Asset Management Inc. and Power Corporation of Canada.
Charles W. Fischer
Mr. Fischer acquired significant financial experience and exposure to accounting and financial issues during a lengthy business career, which included serving as President and Chief Executive Officer of Nexen Inc. from 2001 to 2008, and holding various executive positions with Nexen Inc. from 1994 to 2001. He currently also serves as director and a member of the audit committee of Pure Technologies Ltd.
George K. Petty
Mr. Petty acquired significant financial experience and exposure to accounting and financial issues during his lengthy business career, which included serving as President and Chief Executive Officer of Telus Corporation from 1994 to 1999. He has acted as a member of other United States and Canadian audit committees.
Charles E. Shultz
Mr. Shultz acquired significant financial experience as a business executive, board member and audit committee member of several large Canadian and US public companies. He served as President and Chief Executive Officer of Gulf Canada Resources Limited from 1990 to 1995 and has served as a director of Newfield Exploration and of Canadian Oil Sands Limited since its inception and was Chairman until 2009. He is currently Chair & Chief Executive Officer of Dauntless Energy Inc., a private oil and gas company.
Catherine L. Williams
Ms. Williams held senior finance positions during a 30-year career in business which included international experience. She worked for 20 years in the Shell group of companies, including as Chief Financial Officer of Shell Canada Limited from 2003 to 2007 and as Controller of Shell Europe Oil Products from 2001 to 2003.
54
Enbridge Inc. 2014 Annual Information Form
PRE-APPROVAL POLICIES AND PROCEDURES
The AFR Committee has adopted a policy that requires pre-approval by the AFR Committee of any services to be provided by the Company’s external auditors, PricewaterhouseCoopers LLP, whether audit or non-audit services. The policy prohibits the Company from engaging the auditors to provide the following non-audit services:
bookkeeping or other services related to accounting records and financial statements;
financial information systems design and implementation;
appraisal or valuation services, fairness opinions or contribution-in-kind reports;
actuarial services;
internal audit outsourcing services;
management functions or human resources;
broker or dealer, investment adviser or investment banking services;
legal services; and
expert services unrelated to the audit. The AFR Committee believes that the policy will protect the Company from the potential loss of independence of the external auditors. The AFR Committee has also adopted a policy which prohibits the Company from hiring (as a full-time employee, contractor or otherwise) into a financial reporting oversight role any current or former employee or partner of its external auditor who provided audit, review or attest service in respect of the Company’s financial statements (including such financial statements of its reporting issuer subsidiaries and significant investees) during the 12 month period preceding the date of the initiation of the current annual audit. The policy further prohibits the hiring of a former partner of the Company’s external auditor who receives pension benefits from the firm, unless such pension benefits are of a fixed amount, not dependent upon firm earnings and fully funded. In all cases, the hiring of any partner or employee or former partner or employee of the independent auditor is subject to joint approval by the lead engagement partner and the Company’s Senior Vice President and Controller.
A copy of the policies and procedures applicable to the pre-approval of non-audit services by the Company’s external auditors may be obtained from the Corporate Secretary of the Company by sending a request to:
Enbridge Inc. 3000, 425 - 1
st Street S.W.
Calgary, Alberta T2P 3L8 Attention: Corporate Secretary Telephone: 403-231-3900 Fax: 403-231-5929 Email: [email protected]
55
Enbridge Inc. 2014 Annual Information Form
EXTERNAL AUDITOR SERVICES – FEES The following table sets forth all services rendered by the Company’s auditors, PricewaterhouseCoopers LLP, by category, together with the corresponding fees billed by the auditors for each category of service for the financial years ended December 31, 2014 and 2013.
2014 2013 Description of Fee Category
Audit Fees $13,489,584 $13,946,567 Represents the aggregate fees for audit services.
Audit-Related Fees
$823,989 $1,554,412 Represents the aggregate fees for assurance and related services by the Company’s auditors that are reasonably related to the performance of the audit or review of the Company’s financial statements and are not included under “Audit Fees”. During fiscal 2014 and 2013, the services provided in this category included due diligence related to prospectus offerings and other items.
Tax Fees $1,757,558 $1,907,253 Represents the aggregate fees for professional services rendered by the Company’s auditors for tax compliance, tax advice and tax planning.
All Other Fees $887,326 $933,761 Represents the aggregate fees for products and services provided by the Company’s auditors other than those services reported under “Audit Fees”, “Audit-Related Fees” and “Tax Fees”. These fees include those related to Canadian Public Accountability Board fees, French translation work and process reviews.
Total Fees $16,958,457 $18,341,993
LEGAL PROCEEDINGS
Information related to Enbridge’s legal proceedings can be found in Note 29, “Commitments and Contingencies”, to the Company’s audited consolidated financial statements as at and for the year ended December 31, 2014.
INTEREST OF MANAGEMENT AND OTHERS IN MATERIAL TRANSACTIONS
No director, executive officer or principal shareholder of Enbridge, or associate or affiliate of these persons, has any material interest, direct or indirect, in any transaction within the last three years that has materially affected or is reasonably expected to materially affect Enbridge.
56
Enbridge Inc. 2014 Annual Information Form
REGISTRAR AND TRANSFER AGENT
The registrar and transfer agent for the Common Shares is CST Trust Company in Canada and Computershare in the United States:
In Canada: CST Trust Company P.O. Box 700, Station B Montreal, Quebec H3B 3K3 Telephone: 1-800-387-0825 or 416-682-3860 outside of North America Website: www.canstockta.com
In the United States: Computershare 480 Washington Blvd. Jersey City, New Jersey United States of America 07310 Telephone: 1-800-942-5909 Website: www.computerhsare.com
The registrar and transfer agent for all the Preference Shares is CST Trust Company:
CST Trust Company P.O. Box 700, Station B Montreal, Quebec H3B 3K3 Telephone: 1-800-387-0825 or 416-682-3860 outside of North America Website: www.canstockta.com
MATERIAL CONTRACTS
Enbridge did not enter into any material contracts outside the ordinary course of business during the year ended December 31, 2014, nor has it entered into any material contracts outside the ordinary course of business prior to the year ended December 31, 2014 which are still in effect as at the date of this AIF.
INTERESTS OF EXPERTS
The Company’s independent auditors are PricewaterhouseCoopers LLP, Chartered Accountants, who have issued an independent auditor’s report dated February 19, 2015 stating they had completed integrated audits of the Company’s 2014 and 2013 consolidated financial statements and its internal control over financial reporting as at December 31, 2014 and an audit of the Company's 2012 consolidated financial statements. PricewaterhouseCoopers LLP has advised that they are independent with respect to the Company within the meaning of the Rules of Professional Conduct of the Institute of Chartered Accountants of Alberta and the Rules of the US Securities and Exchange Commission
ADDITIONAL INFORMATION
Additional information about Enbridge is available on our website at www.enbridge.com and on SEDAR at www.sedar.com in Canada, and on the US Securities and Exchange Commission’s website (EDGAR) at www.sec.gov. The aforementioned information is made available in accordance with legal requirements and is not incorporated by reference into this AIF.
Additional information, including directors’ and officers’ remuneration and indebtedness, principal holders of our securities and securities authorized for issuance under equity compensation plans, where applicable, is contained in the Management Information Circular for Enbridge’s most recent annual meeting of shareholders at which directors were elected.
57
Enbridge Inc. 2014 Annual Information Form
Additional financial information is provided in Enbridge’s audited consolidated financial statements as at and for the year ended December 31, 2014 and MD&A.
ENBRIDGE GAS DISTRIBUTION INC.
Additional information about EGD can be found in its annual information form, financial statements and management’s discussion & analysis which have been filed with the securities commissions or similar authorities in each of the provinces of Canada and are publicly available at www.sedar.com. These documents are not incorporated by reference into this AIF.
ENBRIDGE ENERGY PARTNERS, L.P. AND ENBRIDGE ENERGY MANAGEMENT, L.L.C.
Additional information about EEP and EEM can be found in their respective Annual Reports on Form 10-Ks that have been filed with the US Securities and Exchange Commission. These documents contain detailed disclosure with respect to EEP and EEM, respectively and are publicly available at www.sec.gov. No part of the Form 10-Ks filed by EEP and EEM are incorporated by reference into this AIF.
ENBRIDGE INCOME FUND
Additional information about the Fund can be found in its annual information form, financial statements and management’s discussion & analysis which have been filed with the securities commissions or similar authorities in each of the provinces of Canada. These documents contain detailed disclosure with respect to the Fund and are publicly available at www.sedar.com. These documents are not incorporated by reference into this AIF.
ENBRIDGE INCOME FUND HOLDINGS INC.
Additional information about EIFH can be found in its annual information form, financial statements and management’s discussion & analysis which have been filed with the securities commissions or similar authorities in each of the provinces of Canada. These documents contain detailed disclosure with respect to EIFH and are publicly available at www.sedar.com. These documents are not incorporated by reference into this AIF.
ENBRIDGE PIPELINES INC.
Additional information about EPI can be found in its annual information form, financial statements and management’s discussion & analysis which have been filed with the securities commissions or similar authorities in each of the provinces of Canada and are publicly available at www.sedar.com. These documents are not incorporated by reference into this AIF.
A-1
Enbridge Inc. 2014 Annual Information Form
APPENDIX A
TERMS OF REFERENCE FOR THE
AUDIT, FINANCE & RISK COMMITTEE
I. CONSTITUTION
There shall be a committee, to be known as the Audit, Finance & Risk Committee (the “Committee”), of the Board of Directors of Enbridge Inc. (the “Company”).
II. MEMBERSHIP
Following each annual meeting of shareholders of the Company, the Board shall elect from its members, not less than three (3) Directors to serve on the Committee (the “Members”). The Members and the Chair of the Committee are elected by the Board following the nomination of Directors by the Governance Committee. No Member of the Committee shall be an officer or employee of the Company or any of the Company's affiliates. All members of the Committee shall, in the judgment of the Board, be unrelated and independent and shall satisfy applicable stock exchange and legal requirements. Determinations on whether a Director meets the requirements for membership on the Committee shall be made by the Board. At least one member of the Committee shall be a "financial expert" as determined by the Board and as defined by American legal or regulatory requirements. No Director may serve as a member of the Committee if such Director also serves on the audit committees of more than two other public entities unless the Board determines that such simultaneous service would not impair the ability of such Director to effectively serve on the Committee.
Any Member may be removed or replaced at any time by the Board and shall cease to be a Member upon ceasing to be a Director of the Company. Each Member shall hold office until the close of the next annual meeting of Shareholders of the Company or until the Member ceases to be a Director, resigns or is replaced, whichever first occurs. Vacancies may be filled by the Board with nominees approved by the Governance Committee.
III. MEETINGS
The Committee shall convene at such times and places designated by its Chair or whenever a meeting is requested by a Member, the Board, an officer, the internal auditor or the external auditors of the Company. A minimum of twenty-four (24) hours notice of each meeting shall be given to each Member and to the internal and external auditors.
A majority of the committee shall be duly convened if all Members are present, or at least a majority of the Members are present. A quorum at a meeting shall consist of at least a majority of Members. Where the Members consent, and proper notice has been given or waived, Members of the Committee may participate in a meeting of the Committee by means of such telephonic, electronic or other communication facilities as permit all persons participating in the meeting to communicate adequately with each other, and a Member participating in such a meeting by any such means is deemed to be present at that meeting.
In the absence of the Chair of the Committee, the Members may choose one (1) of the Members to be the Chair of the meeting.
At the invitation of a Member, other Board members, officers or employees of the Company, the external auditors, external counsel and other experts or consultants may attend any meeting of the Committee.
Members of the Committee may meet separately with any member of management, the external auditors, the internal auditor, internal or external counsel or any other expert or consultant.
Minutes shall be kept of all meetings of the Committee.
A-2
Enbridge Inc. 2014 Annual Information Form
IV. FUNDING
The Company shall provide appropriate funding, as determined by the Committee, for the payment of compensation to the external auditors and any independent counsel, experts or advisors employed by the Committee and administrative expenses of the Committee.
V. REVIEW OF CHARTER
The Committee shall review and reassess the adequacy of its Terms of Reference at least annually and propose recommended changes to the Board.
VI. DUTIES AND RESPONSIBILITIES OF THE CHAIR
The Chair is responsible for:
A. convening Committee meetings and designating the times and places of those meetings;
B. ensuring Committee meetings are duly convened and that quorum is present when required;
C. working with Management on the development of agendas and related materials for the Committee meetings;
D. ensuring Committee meetings are conducted in an efficient, effective and focused manner;
E. ensuring the Committee has sufficient information to permit it to properly make decisions when decisions are required;
F. advising the Committee of any finance, accounting or misappropriation matters brought to the Chair’s attention through the Company’s Ethics and Conduct hotline procedures;
G. reviewing the CEO’s expense reports;
H. providing leadership to the Committee and to assist the Committee in reviewing and monitoring its responsibilities; and
I. reporting to the Board on the recommendations and decisions of the Committee.
VII. DUTIES AND RESPONSIBILITIES
The Committee provides assistance to the Board in fulfilling its oversight responsibility to the shareholders, the investment community and others, relating to the integrity of the Company’s financial statements and the financial reporting process, the management information systems and financial controls, the internal audit function, the external auditors’ qualifications, independence, performance and reports, the Company’s compliance with legal and regulatory requirements and the risk identification, assessment and management program. In so doing, it is the Committee’s responsibility to maintain an open avenue of communication between the Committee, the external auditors, the internal auditors and management of the Company.
Management is responsible for preparing the interim and annual financial statements and financial disclosure of the Company and for maintaining a system of internal controls to provide reasonable assurance that assets are safeguarded and that transactions are authorized, executed, recorded and reported properly. The Committee’s role is to provide meaningful and effective oversight and counsel to management without assuming responsibility for management’s day-to-day duties.
A-3
Enbridge Inc. 2014 Annual Information Form
In performance of its duties and responsibilities, the Committee shall have the right as it determines necessary to carry out its duties to engage independent counsel, experts and other advisors, to inspect any and all of the books and records of the Company, its subsidiaries and affiliates, and to discuss with the officers of the Company, its subsidiaries and affiliates, the internal auditor and the external auditors, such accounts, records and other matters as any Member considers appropriate.
The Committee shall have the following specific duties and responsibilities:
A. DUTIES AND RESPONSIBILITIES RELATED TO THE EXTERNAL AUDITORS.
The Committee shall:
(i) (a) be responsible for the appointment, compensation, oversight, retention and termination of the external auditors who shall report directly to the Committee, provided that the appointment of the auditor shall be subject to shareholder approval; and
(b) be responsible for the appointment, compensation, oversight, retention and termination of any other registered public accounting firm for audit, review or attestation services;
(ii) review and approve the terms of the external auditors’ annual engagement letter, including the proposed audit fees;
(iii) review and approve all engagements for audit services and non-audit services to be provided by the external auditors and, as necessary, consider the potential impact of such services on the independence of the external auditors;
(iv) review and discuss with the external auditors all relationships that the external auditors and their affiliates have with the Company and its affiliates in order to determine the external auditors’ independence;
(v) at least annually, obtain and review a report by the external auditors describing the firm’s internal quality-control procedures, any material issues raised by the most recent internal quality-control review or peer review of the firm or by any inquiry or investigation by governmental or professional authorities within the preceding five years respecting one or more independent audits carried out by the external auditors and any steps taken to deal with any such issues and all relationships between the external auditors and the Company;
(vi) resolve disagreements, if any, between management and the external auditors regarding financial reporting;
(vii) inform the external auditors and management that the external auditors shall have access directly to the Committee at all times, as well as the Committee to the external auditors and that the external auditors are ultimately accountable to the Committee as representatives of the shareholders of the Company;
(viii) discuss with management and the external auditors any correspondence from or with regulators or governmental agencies, any employee complaints or any published reports that raise material issues regarding the Company’s financial statements or accounting policies; and
(ix) establish hiring policies for employees or former employees of the external auditors.
A-4
Enbridge Inc. 2014 Annual Information Form
B. DUTIES AND RESPONSIBILITIES RELATED TO AUDITS AND FINANCIAL REPORTING.
The Committee shall:
(i) review the engagement terms and the audit plan with the external auditors and with the Company’s management;
(ii) review with management and the Company’s external auditors the Company’s financial reporting in connection with the annual audit and the preparation of the financial statements, including, without limitation, the judgment of the external auditors as to the quality, not just the acceptability of, and the appropriateness of the Company’s accounting principles as applied in its financial reporting and the degree of aggressiveness or conservatism of the Company’s accounting principles and underlying estimates;
(iii) review with management any anticipated changes in reporting standards, the preparedness of management and potential outcomes and impacts;
(iv) review with management and the external auditors and make recommendations to the Board on all financial statements and financial disclosure which require approval by the Board including:
(a) the Company’s annual financial statements including the notes thereto and “Management’s Discussion and Analysis”;
(b) any report or opinion to be rendered in connection therewith;
(c) any change or initial adoption in accounting policies and their applicability to the business;
d) any audit problems or difficulties and management’s response;
(e) all significant adjustments proposed by the external auditors; and
(f) satisfying itself that there are no unresolved issues between management and the external auditors that could reasonably be expected to materially affect the financial statements.
(v) review the Company’s interim financial results, including the notes thereto and “Management’s Discussion and Analysis” with management and the external auditors and approve the release thereof by management or recommend approval thereof to the Board for release by the Board;
(vi) review annually the approach taken by management in the preparation of earnings press releases, as well as financial information and earnings guidance provided to analysts and rating agencies;
(vii) discuss with the external auditors their perception of the Company’s internal audit and accounting personnel, and any recommendations which the external auditors may have;
(viii) review with management, the external auditors and, as necessary, internal and external legal counsel, any litigation, claim or contingency, including tax assessments, that could have a material effect upon the financial position of the Company, and the manner in which these matters may be, or have been, disclosed in the financial statements;
(ix) review with management and monitor the funding exposure of the Company under the
A-5
Enbridge Inc. 2014 Annual Information Form
Company’s pension plans, annually review the Annual Pension Report and review and approve the financial statements applicable to each of the pension plans;
(x) annually or more frequently as deemed necessary, meet separately with management and the external auditors, and at least annually with the internal auditors, to review issues and matters of concern respecting audits and financial reporting processes;
(xi) review with the Company’s management and, as deemed necessary, review with the external auditors, any proposed changes in or initial adoption of accounting policies, the presentation and impact of significant risks and uncertainties, and key estimates and judgments of the Company’s management that may be material to financial reporting;
(xii) review with the Company’s management and, as deemed necessary, with the external auditors, significant financial reporting issues arising during the fiscal period, including the methods of resolution;
(xiii) review any problems experienced by the external auditors in performing an audit, including any restrictions imposed by the Company’s management or significant accounting issues on which there was a disagreement with the Company’s management;
(xiv) review the post-audit or management letter containing the recommendations of the external auditors and the response of the Company’s management, if any, including an evaluation of the adequacy and effectiveness of the internal financial controls of the Company (in respect of the scope of review of internal controls by the external auditors, the review is carried out to enable the external auditors to express an opinion on the Company's financial statements);
(xv) review before release relevant public disclosure documents containing audited or unaudited financial information, including annual and interim earnings press releases, prospectuses, the Annual Information Form, and Management's Discussion and Analysis;
(xvi) review, in conjunction with the Human Resources & Compensation Committee, the appointment of the chief financial officer;
(xvii) inquire into and determine the appropriate resolution of conflicts of interest in respect of audit, finance or risk matters between or among an officer, Director, shareholder, the internal auditors, or the external auditors, which are properly directed to the Committee by the Chair of the Board, the Board, a shareholder, the internal auditors, the external auditors, or the Company’s management; and
(xviii) as deemed necessary by the Committee, inquire into and examine matters relating to the financial affairs of the Company, its subsidiaries or affiliates, or any of them, including the review of subsidiary or affiliate Audit Committee reports.
C. DUTIES AND RESPONSIBILITIES RELATED TO FINANCIAL REPORTING PROCESSES AND INTERNAL CONTROLS
The Committee shall:
(i) review the adequacy and effectiveness of the accounting and internal control policies of the Company and procedures through inquiry and discussions with the external auditors, management, and the internal auditor;
(ii) review with management the Company’s administrative, operational and accounting internal controls, including controls and security of the computerized information systems, and
A-6
Enbridge Inc. 2014 Annual Information Form
evaluate whether the Company is operating in accordance with prescribed policies, procedures and the Statement on Business Conduct;
(iii) annually or more frequently if deemed necessary, meet separately with the external auditor, the head of the internal audit group and management, to review issues and matters of concern respecting financial reporting processes and internal controls;
(iv) review with management and the external auditors any reportable conditions, material weaknesses and significant deficiencies affecting internal control;
(v) establish and maintain free and open means of communication between and among the Committee, the external auditors, the internal auditor and management;
(vi) review at least annually with the internal auditor the Company’s internal control procedures, and the scope and plans for the work of the internal audit group; and
(vii) review the adequacy of resources of the internal auditor and ensure that the internal auditor has unrestricted access to all functions, records, property and personnel of the Company and inform the internal auditors and management that the internal auditors shall have unfettered access directly to the Committee at all times, as well as the Committee to the internal auditors.
D. DUTIES AND RESPONSIBILITIES RELATED TO FINANCE.
The Committee shall:
(i) review and as required, approve or recommend for approval to the Board, prospectuses and documents, where practicable, which may be incorporated by reference into a prospectus;
(ii) review the issuance of equity or debt securities by the Company, and if deemed appropriate, authorize the filing with securities regulatory authorities of any prospectus, prospectus supplement or other documentation relating thereto; and
(iii) review and recommend for approval to the Board the annual management information circular with respect to matters related to the auditor, affecting the capital of the Company or principal risks to be managed by the Company.
E. DUTIES AND RESPONSIBILITIES RELATED TO RISK MANAGEMENT
The Committee shall:
(i) review at least annually with senior management, internal counsel and, as necessary, external counsel and the Company’s internal and external auditors:
(i) the Company's method of reviewing major risks inherent in the Company’s businesses, facilities, and strategic directions, including the Company's risk management and evaluation process (in respect of risk management evaluations and guidelines relating to environment, health and safety matters, the Committee shall consult with and, as deemed necessary, review the recommendations of the Corporate Social Responsibility Committee or the Safety & Reliability Committee, as applicable);
(ii) the strategies, policies and practices applicable to the Company's assessment, management, prevention and mitigation of risks (including the foreign currency and interest rate risk strategies, counterparty credit exposure, cash management, credit
A-7
Enbridge Inc. 2014 Annual Information Form
and financing, the use of derivative instruments, insurance and adequacy of tax provisions);
(iii) the Corporate Risk Assessment and updates thereto and report to the Board thereon;
(iv) the major financial risk exposures and steps management has taken to monitor and manage such exposures;
(v) the Company’s annual insurance report including the risk retention philosophy and resulting uninsured exposure, if any; and
(vi) the loss prevention policies, risk management programs, disaster response and recovery programs, corporate liability protection programs for Directors and officers, and standards and accountabilities of the Company in the context of competitive and operational considerations; and
(ii) consider other risk management matters from time to time as the Committee may consider appropriate or the Board may specifically direct.
F. OTHER DUTIES OF AUDIT, FINANCE & RISK COMMITTEE
The Committee shall, as required, or as deemed necessary by the Committee:
(i) meet separately with senior management, the internal auditors, the external auditors and, as is appropriate, internal and external legal counsel and independent advisors in respect of issues not elsewhere listed concerning any other audit, finance and risk matters;
(ii) review incidents or alleged incidents as reported by senior management, internal audit, the external auditor, the Chief Compliance Officer, the law department, or otherwise of fraud, illegal acts or conflicts of interest;
(iii) establish procedures for the receipt, retention and treatment of complaints received by the Company regarding accounting, internal accounting controls or auditing matters and the confidential, anonymous submission by employees of concerns regarding questionable accounting or auditing matters;
(iv) report to the Board after each Committee meeting, as required during the year, with respect to the Committee’s activities and recommendations;
(v) address any other matter properly referred to the Committee by the Chair of the Board, the Board, a Director, the internal auditors, the external auditors, the CEO, or the management of the Company or any other matter as may be required under stock exchange rules or by law;
(vi) in conjunction with the Governance Committee, conduct an annual performance evaluation of the Committee; and
(vii) the Committee shall, in conjunction with Management, coordinate the performance of its duties with any audit committee of a subsidiary Company, respecting the independence of such subsidiary directors and managing to ensure efficiency, effectiveness and consistency of approach with such subsidiary, concerning:
(a) the external auditor;
A-8
Enbridge Inc. 2014 Annual Information Form
(b) audits and financial reporting;
(c) financial reporting processes and internal controls;
(d) finance; and
(e) risk management
VIII. COMMITTEE TIMETABLE
The major annual activities of the Committee shall be outlined in an annual schedule.
IX. DELEGATION TO SUBCOMMITTEE
The Committee may, in its discretion, delegate all or a portion of its duties and responsibilities to a subcommittee of the Committee. The Committee may, in its discretion, delegate to one or more of its members the authority to pre-approve any audit or non-audit services to be performed by the external auditors, provided that any such approvals are presented to the Committee at its next scheduled meeting.
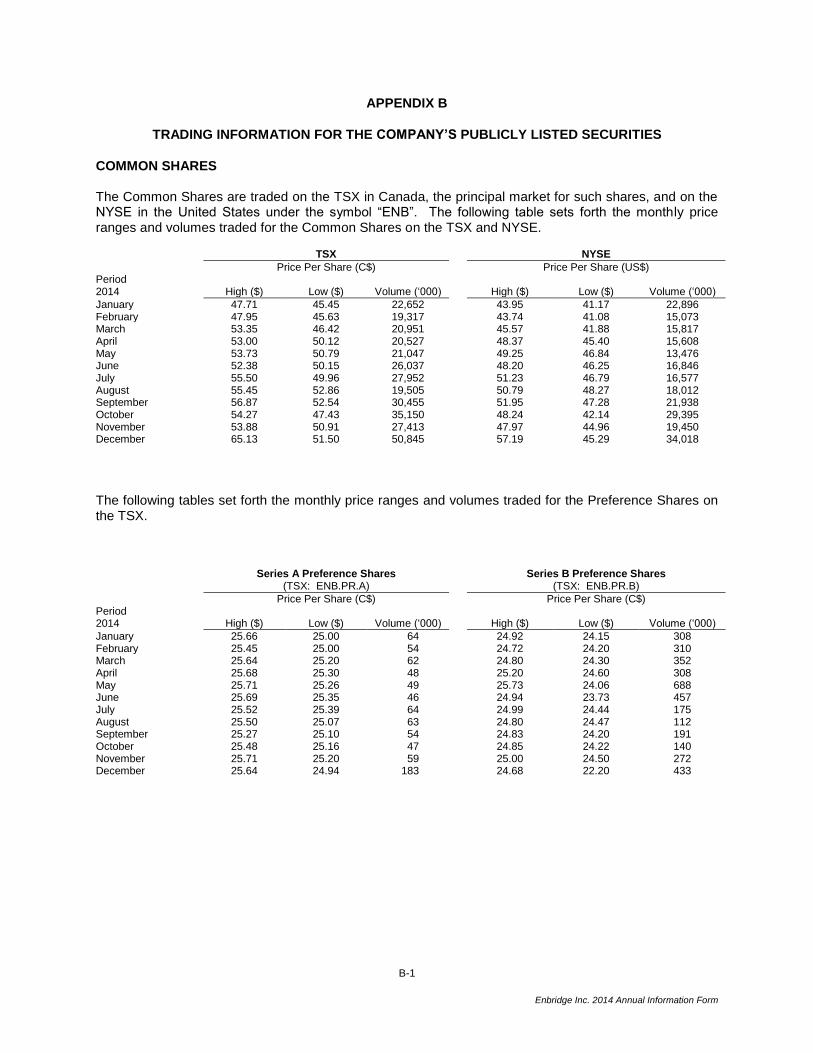
B-1
Enbridge Inc. 2014 Annual Information Form
APPENDIX B
TRADING INFORMATION FOR THE COMPANY’S PUBLICLY LISTED SECURITIES
COMMON SHARES
The Common Shares are traded on the TSX in Canada, the principal market for such shares, and on the NYSE in the United States under the symbol “ENB”. The following table sets forth the monthly price ranges and volumes traded for the Common Shares on the TSX and NYSE.
TSX NYSE
Price Per Share (C$) Price Per Share (US$) Period 2014 High ($) Low ($) Volume (‘000) High ($) Low ($) Volume (‘000)
January 47.71 45.45 22,652 43.95 41.17 22,896 February 47.95 45.63 19,317 43.74 41.08 15,073 March 53.35 46.42 20,951 45.57 41.88 15,817 April 53.00 50.12 20,527 48.37 45.40 15,608 May 53.73 50.79 21,047 49.25 46.84 13,476 June 52.38 50.15 26,037 48.20 46.25 16,846 July 55.50 49.96 27,952 51.23 46.79 16,577 August 55.45 52.86 19,505 50.79 48.27 18,012 September 56.87 52.54 30,455 51.95 47.28 21,938 October 54.27 47.43 35,150 48.24 42.14 29,395 November 53.88 50.91 27,413 47.97 44.96 19,450 December 65.13 51.50 50,845 57.19 45.29 34,018
The following tables set forth the monthly price ranges and volumes traded for the Preference Shares on the TSX.
Series A Preference Shares (TSX: ENB.PR.A)
Series B Preference Shares (TSX: ENB.PR.B)
Price Per Share (C$) Price Per Share (C$) Period 2014 High ($) Low ($) Volume (‘000) High ($) Low ($) Volume (‘000)
January 25.66 25.00 64 24.92 24.15 308 February 25.45 25.00 54 24.72 24.20 310 March 25.64 25.20 62 24.80 24.30 352 April 25.68 25.30 48 25.20 24.60 308 May 25.71 25.26 49 25.73 24.06 688 June 25.69 25.35 46 24.94 23.73 457 July 25.52 25.39 64 24.99 24.44 175 August 25.50 25.07 63 24.80 24.47 112 September 25.27 25.10 54 24.83 24.20 191 October 25.48 25.16 47 24.85 24.22 140 November 25.71 25.20 59 25.00 24.50 272 December 25.64 24.94 183 24.68 22.20 433
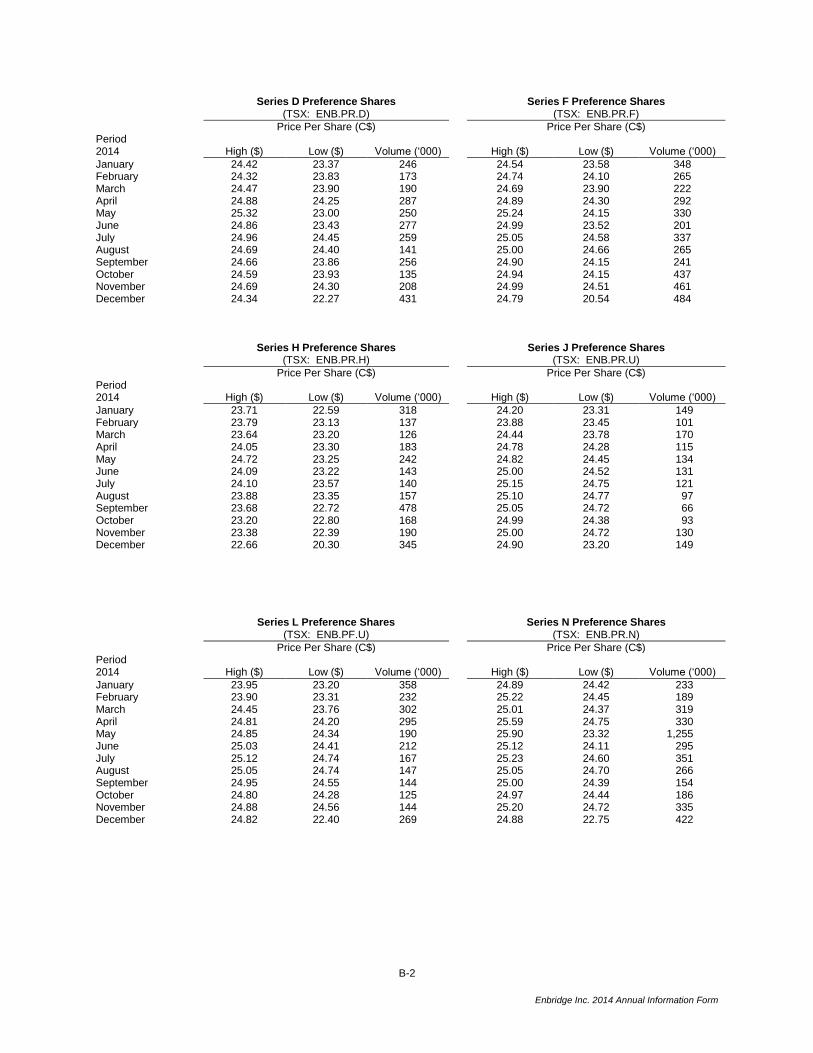
B-2
Enbridge Inc. 2014 Annual Information Form
Series D Preference Shares (TSX: ENB.PR.D)
Series F Preference Shares (TSX: ENB.PR.F)
Price Per Share (C$) Price Per Share (C$) Period 2014 High ($) Low ($) Volume (‘000) High ($) Low ($) Volume (‘000)
January 24.42 23.37 246 24.54 23.58 348 February 24.32 23.83 173 24.74 24.10 265 March 24.47 23.90 190 24.69 23.90 222 April 24.88 24.25 287 24.89 24.30 292 May 25.32 23.00 250 25.24 24.15 330 June 24.86 23.43 277 24.99 23.52 201 July 24.96 24.45 259 25.05 24.58 337 August 24.69 24.40 141 25.00 24.66 265 September 24.66 23.86 256 24.90 24.15 241 October 24.59 23.93 135 24.94 24.15 437 November 24.69 24.30 208 24.99 24.51 461 December 24.34 22.27 431 24.79 20.54 484
Series H Preference Shares (TSX: ENB.PR.H)
Series J Preference Shares (TSX: ENB.PR.U)
Price Per Share (C$) Price Per Share (C$) Period 2014 High ($) Low ($) Volume (‘000) High ($) Low ($) Volume (‘000)
January 23.71 22.59 318 24.20 23.31 149 February 23.79 23.13 137 23.88 23.45 101 March 23.64 23.20 126 24.44 23.78 170 April 24.05 23.30 183 24.78 24.28 115 May 24.72 23.25 242 24.82 24.45 134 June 24.09 23.22 143 25.00 24.52 131 July 24.10 23.57 140 25.15 24.75 121 August 23.88 23.35 157 25.10 24.77 97 September 23.68 22.72 478 25.05 24.72 66 October 23.20 22.80 168 24.99 24.38 93 November 23.38 22.39 190 25.00 24.72 130 December 22.66 20.30 345 24.90 23.20 149
Series L Preference Shares (TSX: ENB.PF.U)
Series N Preference Shares (TSX: ENB.PR.N)
Price Per Share (C$) Price Per Share (C$) Period 2014 High ($) Low ($) Volume (‘000) High ($) Low ($) Volume (‘000)
January 23.95 23.20 358 24.89 24.42 233 February 23.90 23.31 232 25.22 24.45 189 March 24.45 23.76 302 25.01 24.37 319 April 24.81 24.20 295 25.59 24.75 330 May 24.85 24.34 190 25.90 23.32 1,255 June 25.03 24.41 212 25.12 24.11 295 July 25.12 24.74 167 25.23 24.60 351 August 25.05 24.74 147 25.05 24.70 266 September 24.95 24.55 144 25.00 24.39 154 October 24.80 24.28 125 24.97 24.44 186 November 24.88 24.56 144 25.20 24.72 335 December 24.82 22.40 269 24.88 22.75 422
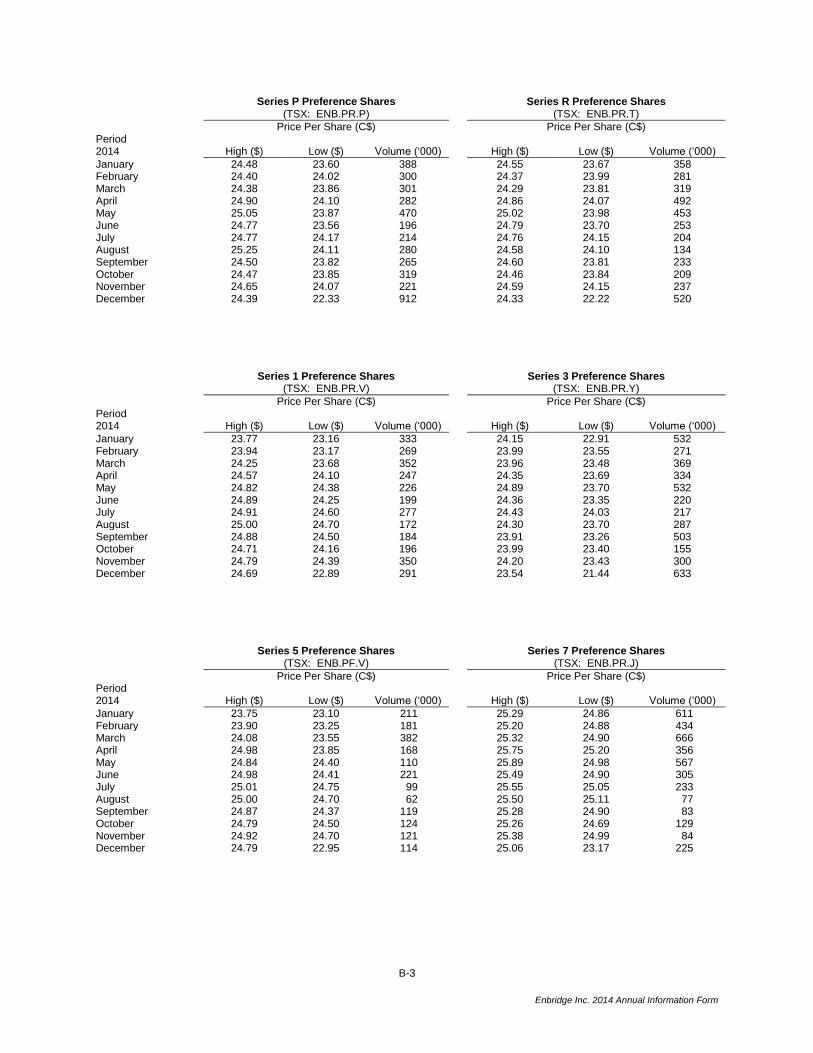
B-3
Enbridge Inc. 2014 Annual Information Form
Series P Preference Shares (TSX: ENB.PR.P)
Series R Preference Shares (TSX: ENB.PR.T)
Price Per Share (C$) Price Per Share (C$) Period 2014 High ($) Low ($) Volume (‘000) High ($) Low ($) Volume (‘000)
January 24.48 23.60 388 24.55 23.67 358 February 24.40 24.02 300 24.37 23.99 281 March 24.38 23.86 301 24.29 23.81 319 April 24.90 24.10 282 24.86 24.07 492 May 25.05 23.87 470 25.02 23.98 453 June 24.77 23.56 196 24.79 23.70 253 July 24.77 24.17 214 24.76 24.15 204 August 25.25 24.11 280 24.58 24.10 134 September 24.50 23.82 265 24.60 23.81 233 October 24.47 23.85 319 24.46 23.84 209 November 24.65 24.07 221 24.59 24.15 237 December 24.39 22.33 912 24.33 22.22 520
Series 1 Preference Shares (TSX: ENB.PR.V)
Series 3 Preference Shares (TSX: ENB.PR.Y)
Price Per Share (C$) Price Per Share (C$) Period 2014 High ($) Low ($) Volume (‘000) High ($) Low ($) Volume (‘000)
January 23.77 23.16 333 24.15 22.91 532 February 23.94 23.17 269 23.99 23.55 271 March 24.25 23.68 352 23.96 23.48 369 April 24.57 24.10 247 24.35 23.69 334 May 24.82 24.38 226 24.89 23.70 532 June 24.89 24.25 199 24.36 23.35 220 July 24.91 24.60 277 24.43 24.03 217 August 25.00 24.70 172 24.30 23.70 287 September 24.88 24.50 184 23.91 23.26 503 October 24.71 24.16 196 23.99 23.40 155 November 24.79 24.39 350 24.20 23.43 300 December 24.69 22.89 291 23.54 21.44 633
Series 5 Preference Shares (TSX: ENB.PF.V)
Series 7 Preference Shares (TSX: ENB.PR.J)
Price Per Share (C$) Price Per Share (C$) Period 2014 High ($) Low ($) Volume (‘000) High ($) Low ($) Volume (‘000)
January 23.75 23.10 211 25.29 24.86 611 February 23.90 23.25 181 25.20 24.88 434 March 24.08 23.55 382 25.32 24.90 666 April 24.98 23.85 168 25.75 25.20 356 May 24.84 24.40 110 25.89 24.98 567 June 24.98 24.41 221 25.49 24.90 305 July 25.01 24.75 99 25.55 25.05 233 August 25.00 24.70 62 25.50 25.11 77 September 24.87 24.37 119 25.28 24.90 83 October 24.79 24.50 124 25.26 24.69 129 November 24.92 24.70 121 25.38 24.99 84 December 24.79 22.95 114 25.06 23.17 225
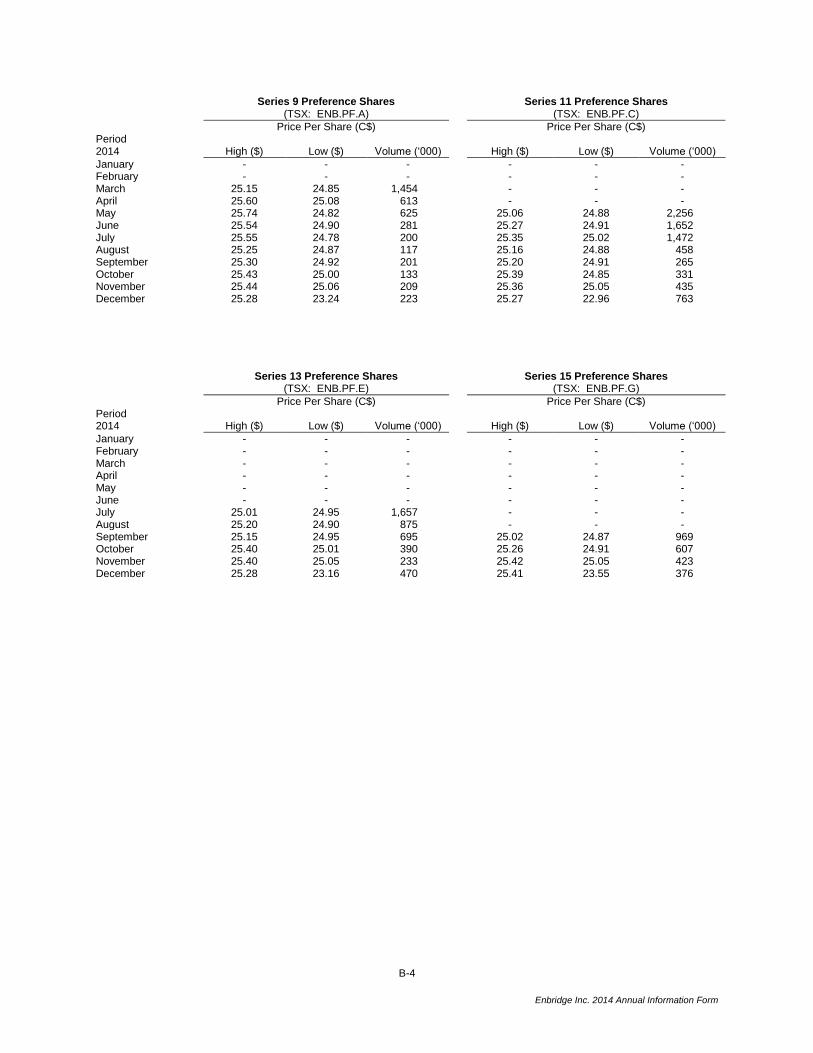
B-4
Enbridge Inc. 2014 Annual Information Form
Series 9 Preference Shares (TSX: ENB.PF.A)
Series 11 Preference Shares (TSX: ENB.PF.C)
Price Per Share (C$) Price Per Share (C$) Period 2014 High ($) Low ($) Volume (‘000) High ($) Low ($) Volume (‘000)
January - - - - - - February - - - - - - March 25.15 24.85 1,454 - - - April 25.60 25.08 613 - - - May 25.74 24.82 625 25.06 24.88 2,256 June 25.54 24.90 281 25.27 24.91 1,652 July 25.55 24.78 200 25.35 25.02 1,472 August 25.25 24.87 117 25.16 24.88 458 September 25.30 24.92 201 25.20 24.91 265 October 25.43 25.00 133 25.39 24.85 331 November 25.44 25.06 209 25.36 25.05 435 December 25.28 23.24 223 25.27 22.96 763
Series 13 Preference Shares (TSX: ENB.PF.E)
Series 15 Preference Shares (TSX: ENB.PF.G)
Price Per Share (C$) Price Per Share (C$) Period 2014 High ($) Low ($) Volume (‘000) High ($) Low ($) Volume (‘000)
January - - - - - - February - - - - - - March - - - - - - April - - - - - - May - - - - - - June - - - - - - July 25.01 24.95 1,657 - - - August 25.20 24.90 875 - - - September 25.15 24.95 695 25.02 24.87 969 October 25.40 25.01 390 25.26 24.91 607 November 25.40 25.05 233 25.42 25.05 423 December 25.28 23.16 470 25.41 23.55 376
C-1
Enbridge Inc. 2014 Annual Information Form
APPENDIX C
SUMMARY OF TERMS AND CONDITIONS OF THE COMPANY’S AUTHORIZED SECURITIES
Common Shares
Holders of Common Shares are entitled to receive dividends if, as and when declared by the Board of Directors. Holders of Common Shares are entitled to receive notice of and to attend all meetings of the holders of Common Shares and are entitled to one vote per Common Share held at all such meetings. In the event of any liquidation, dissolution or winding up of the Company or other distribution of assets of the Company among its shareholders for the purpose of winding-up its affairs, holders of Common Shares will be entitled to participate ratably in any distribution of assets of the Company.
The Company has a Shareholder Rights Plan that is designed to encourage the fair treatment of shareholders in connection with any takeover offer for the Company. Rights issued under the plan become exercisable when a person, including any related parties, acquires or announces the intention to acquire 20% or more of the outstanding Common Shares without complying with certain provisions set out in the plan, or without approval of the Board of Directors. Should such an acquisition occur, each rights holder, other than the acquiring person and its related parties, will have the right to purchase Common Shares at a 50% discount to the market price at that time. The plan was reconfirmed at the 2005, 2008, 2011 and 2014 annual meetings of shareholders and must be reconfirmed at every third annual meeting thereafter.
Enbridge’s Dividend Reinvestment and Share Purchase Plan enables registered shareholders of the Company to purchase additional Common Shares by reinvesting all of the cash dividends paid on the Common Shares and also by making optional cash payments of up to $5,000 per quarter, in both cases without incurring brokerage or other transaction expenses. Effective with dividends payable on March 1, 2008, participants in the Company’s Dividend Reinvestment and Share Purchase Plan receive a 2% discount on the purchase of Common Shares with reinvested dividends.
Enbridge also has stock based compensation plans that allow employees to purchase Common Shares, including incentive and performance stock option plans. Option exercise prices are determined based on the weighted average market prices of the Common Shares for the five days preceding the date of issuance. Options granted under the incentive stock option plan vest at 25% per year over four years, starting on the first anniversary of the grant date, and expire ten years after the grant date. Options granted under the performance stock option plan vest at 20% per year over five years and expire eight years after the grant date.
Preference Shares
The Preference Shares may be issued in one or more series. The Board of Directors may determine the designation, rights, privileges, restrictions and conditions attached to each series of Preference Shares before the issue of such series. Holders of the Preference Shares are not entitled to receive notice of or to attend or vote at any meeting of the shareholders of the Company, except as required by law. The Preference Shares of each series rank on parity with the Preference Shares of every other series with respect to priority in the payment of dividends and priority on the return of capital or any other distribution of assets of the Company in the event of any liquidation, dissolution or winding up of the Company, whether voluntary or involuntary (a “Liquidation Distribution”). The Preference Shares of each series are entitled to priority over the Common Shares and any other shares of the Company ranking junior to the Preference Shares with respect to the payment of dividends and on a Liquidation Distribution.
The Board of the Company will fix the number of shares in each series and the provisions attached to each series before issue. The following chart summarizes the series of Preference Shares issued and outstanding at year end.
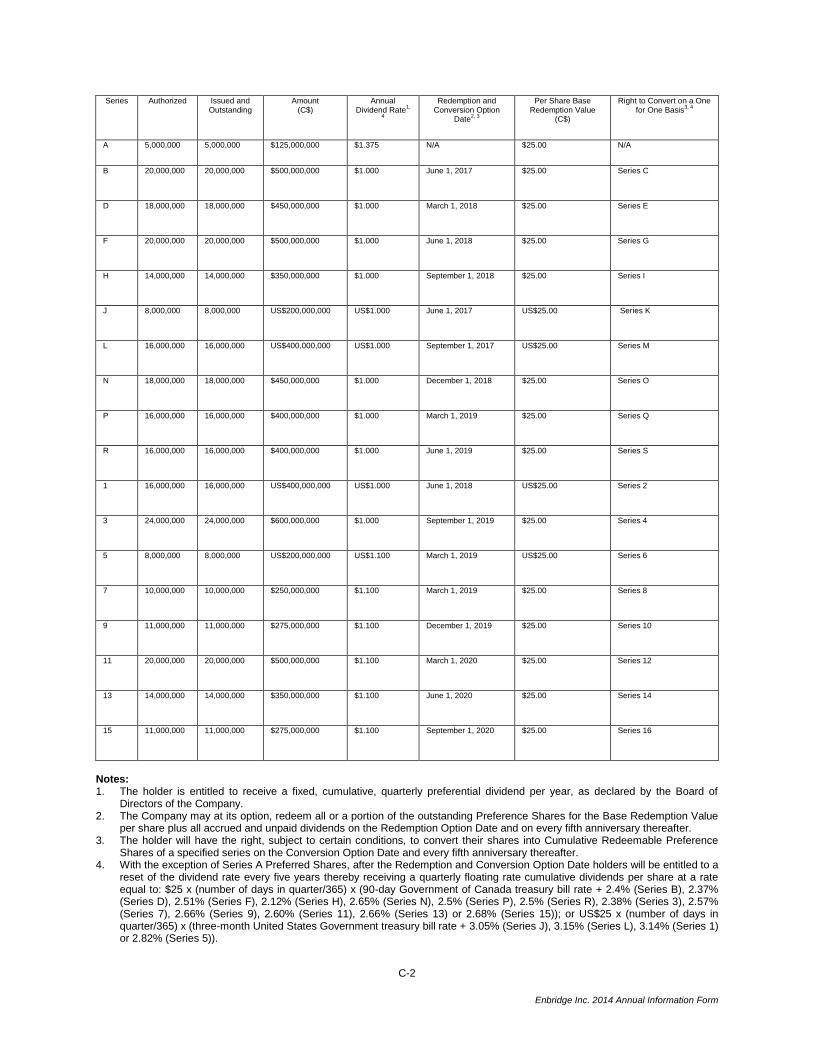
C-2
Enbridge Inc. 2014 Annual Information Form
Series Authorized Issued and Outstanding
Amount (C$)
Annual Dividend Rate
1,
4
Redemption and Conversion Option
Date2, 3
Per Share Base Redemption Value
(C$)
Right to Convert on a One for One Basis
3, 4
A 5,000,000 5,000,000 $125,000,000 $1.375 N/A $25.00 N/A
B 20,000,000 20,000,000 $500,000,000 $1.000
June 1, 2017 $25.00 Series C
D 18,000,000 18,000,000 $450,000,000 $1.000
March 1, 2018 $25.00 Series E
F 20,000,000 20,000,000 $500,000,000 $1.000
June 1, 2018 $25.00 Series G
H 14,000,000 14,000,000 $350,000,000 $1.000
September 1, 2018 $25.00 Series I
J 8,000,000 8,000,000 US$200,000,000 US$1.000
June 1, 2017 US$25.00 Series K
L 16,000,000 16,000,000 US$400,000,000 US$1.000
September 1, 2017 US$25.00 Series M
N 18,000,000 18,000,000 $450,000,000 $1.000
December 1, 2018 $25.00 Series O
P 16,000,000 16,000,000 $400,000,000 $1.000
March 1, 2019 $25.00 Series Q
R 16,000,000 16,000,000 $400,000,000 $1.000
June 1, 2019 $25.00 Series S
1 16,000,000 16,000,000 US$400,000,000 US$1.000
June 1, 2018 US$25.00 Series 2
3 24,000,000 24,000,000 $600,000,000 $1.000
September 1, 2019 $25.00 Series 4
5 8,000,000 8,000,000 US$200,000,000 US$1.100
March 1, 2019 US$25.00 Series 6
7 10,000,000 10,000,000 $250,000,000 $1.100
March 1, 2019 $25.00 Series 8
9 11,000,000 11,000,000 $275,000,000 $1.100
December 1, 2019 $25.00 Series 10
11 20,000,000 20,000,000 $500,000,000 $1.100
March 1, 2020 $25.00 Series 12
13 14,000,000 14,000,000 $350,000,000 $1.100
June 1, 2020 $25.00 Series 14
15 11,000,000 11,000,000 $275,000,000 $1.100
September 1, 2020 $25.00 Series 16
Notes: 1. The holder is entitled to receive a fixed, cumulative, quarterly preferential dividend per year, as declared by the Board of
Directors of the Company. 2. The Company may at its option, redeem all or a portion of the outstanding Preference Shares for the Base Redemption Value
per share plus all accrued and unpaid dividends on the Redemption Option Date and on every fifth anniversary thereafter. 3. The holder will have the right, subject to certain conditions, to convert their shares into Cumulative Redeemable Preference
Shares of a specified series on the Conversion Option Date and every fifth anniversary thereafter. 4. With the exception of Series A Preferred Shares, after the Redemption and Conversion Option Date holders will be entitled to a
reset of the dividend rate every five years thereby receiving a quarterly floating rate cumulative dividends per share at a rate equal to: $25 x (number of days in quarter/365) x (90-day Government of Canada treasury bill rate + 2.4% (Series B), 2.37% (Series D), 2.51% (Series F), 2.12% (Series H), 2.65% (Series N), 2.5% (Series P), 2.5% (Series R), 2.38% (Series 3), 2.57% (Series 7), 2.66% (Series 9), 2.60% (Series 11), 2.66% (Series 13) or 2.68% (Series 15)); or US$25 x (number of days in quarter/365) x (three-month United States Government treasury bill rate + 3.05% (Series J), 3.15% (Series L), 3.14% (Series 1) or 2.82% (Series 5)).