Embed Size (px)
Citation preview
ENCUESTA SABE Principales Resultados JUNIO 2018
Principales Resultados
Junio 2018
SALUD, BIENESTAR Y ENVEJECIMIENTO ASUNCIÓN, PARAGUAY
ENCUESTA SABE
1

ENCUESTA SABE Principales Resultados JUNIO 2018SALUD, BIENESTAR Y ENVEJECIMIENTO ASUNCIÓN, PARAGUAY
2 3
INDICE.PRESENTACIÓN INTRODUCCIÓN CAPÍTULO 1. Justificación, métodos y organización de la encuesta Salud, Bienestar
Justificación
Objetivos
Ámbito poblacional
Diseño de la Muestra
Cuestionarios y manuales
Trabajo de campo
Rendimiento de la Muestra
CAPÍTULO 2. Cambio demográfico y envejecimiento Aspectos geográficos
Aspectos demográficos en el Paraguay
Rumbo al envejecimiento
CAPÍTULO 3. Características demográficas y socioeconómicas de los adultos mayores Estructura por edad y sexo
Estado marital actual
Historia de uniones
Hijos
Padres
Escolaridad
Pertenencia a un culto religioso
Participación laboral
Ingresos CAPÍTULO 4. Composición del hogar, relaciones familiares y características de las transferencias intergeneracionales
Composición del hogar
Arreglos familiares por sexo y estado matrimonial
Arreglos familiares según sexo y educación
Características demográficas y socioeconómicas de los hijos
Hijos corresidentes
Apoyo recibido según tipo y procedencia
Apoyo otorgado según tipo y destino
CAPÍTULO 5. Estado de salud Autoevaluación de salud
Comportamientos y hábitos relacionados con la salud
Consumo de tabaco
Consumo de alcohol
Consumo de proteínas, vegetales y frutas
Actividad física
Actividades sociales
Salud mental
Depresión
Deterioro cognitivo
Incontinencia urinaria
Pérdida sensorial
Visión
Audición
Malnutrición
Caídas
Osteoporosis
Enfermedades crónicas
Enfermedades específicas de género
Desigualdades socioeconómicas en salud
Autopercepción de salud por nivel de instrucción, suficiencia de ingresos percibida y quintil de ingresos
Estado cognoscitivo y trastornos crónicos por nivel de instrucción, suficiencia de ingresos percibida y
quintil de ingresos
Afecciones crónicas y degenerativas
Sintomatología depresiva por nivel de instrucción, suficiencia de ingresos percibida y quintil de ingresos
Dificultad en actividades de la vida diaria (AVD) por nivel de instrucción, suficiencia de ingresos percibida y
quintil de ingresos
INDICE.

ENCUESTA SABE Principales Resultados JUNIO 2018SALUD, BIENESTAR Y ENVEJECIMIENTO ASUNCIÓN, PARAGUAY
4 5
INDICE. PRESENTACIÓN .En el marco del proyecto “Establecimiento del Complejo Santo Domingo para cuidados y servicios sociales y asistencia técnica para
el desarrollo de políticas para Adultos Mayores en Paraguay”, que tiene como objetivo la edificación de un Complejo de los Adultos
Mayores, el fortalecimiento de las capacidades de administración de los centros de atención a largo plazo y el desarrollo de políticas
de salud y bienestar social para los Adultos Mayores, se tiene la necesidad de disponer de datos fidedignos que puedan ser utilizados
de guía en la realización de políticas, leyes y reglamentaciones en favor de los Adultos Mayores.
La Encuesta de Salud, Bienestar y Envejecimiento (SABE), se realizó mediante la firma de un memorándum de entendimiento suscrito
entre la Agencia de Cooperación Internacional de Corea (KOICA), a través de su Oficina en Paraguay y la Secretaría Técnica de Planifi-
cación del Desarrollo Económico y Social (STP). La unidad responsable de la planificación, supervisión y seguimiento de la Encuesta
fue la Dirección General de Información Social (DGIS) de la STP.
La Encuesta SABE, tiene como objetivo brindar información sobre las condiciones de salud de los Adultos Mayores y sus determi-
nantes sociales para analizarlos e identificar las necesidades de servicios sociales, a fin de aportar para el desarrollo nacional de políti-
cas para los Adultos Mayores en Paraguay.
El presente documento presenta un resumen de los principales resultados de la encuesta, que servirá para el análisis de las condi-
ciones de salud de los Adultos Mayores y los determinantes sociales, fuertemente vinculados al entorno económico y social; y que
puedan ser utilizados de guía en la realización de políticas, leyes y reglamentaciones en favor de los Adultos Mayores.
CAPÍTULO 6. Limitaciones funcionales Actividades de la vida diaria
Actividades instrumentales de la vida diaria
Movilidad CAPÍTULO 7. Uso y acceso a servicios sociales y de salud
Uso de servicios de salud ambulatorios
Consultas de salud consultas ambulatorias
Vacunas
Acceso a servicios de salud ambulatorios
Tiempo, costo y hospitalización
Uso de medicamentos y acceso a ellos
Cobertura de seguro de salud y servicios sociales
Servicios sociales en la comunidad
CAPITULO 8. Conclusiones y perspectivas

ENCUESTA SABE Principales Resultados JUNIO 2018SALUD, BIENESTAR Y ENVEJECIMIENTO ASUNCIÓN, PARAGUAY
6 7
INTRODUCCIÓN.La Encuesta de Salud, Bienestar y Envejecimiento (SABE) recogió información de una muestra de 600 personas de 60 años y más, que
reside habitual o permanentemente en viviendas particulares de las zonas de Asunción y el Departamento Central entre los meses
de noviembre a diciembre del año 2017.
El presente documento detalla los resultados descriptivos de esta encuesta. Las páginas que siguen a continuación buscan analizar
las principales variables e indicadores para llevar a cabo una radiografía general en torno a las dimensiones que aborda este instru-
mento.
El documento se ha organizado en siete capítulos. El primer capítulo presenta la descripción de los aspectos metodológicos y organi-
zación de la encuesta. En el segundo capítulo se describen los cambios demográficos y envejecimiento. En el tercer capítulo se de-
scriben las características demográficas y socioeconómicas de los adultos mayores. En el cuarto capítulo se detallan la composición
del hogar, relaciones familiares y características de las transferencias intergeneracionales. En el quinto capítulo se analiza el estado
de salud de los adultos mayores. En el sexto capítulo se describe las limitaciones funcionales y en el séptimo capítulo se describe
los servicios sociales en la comunidad. Se complementa el documento con dos capítulos más, las conclusiones y perspectivas y un
conjunto de tablas que permiten profundizar en algunos resultados.
CAPÍTULO 1. Justificación, métodos y organización
de la encuesta Salud, Bienestar
Justificación
Objetivos
Ámbito poblacional
Diseño de la Muestra
Cuestionarios y manuales
Trabajo de campo
Rendimiento de la Muestra
ENCUESTA SABE Principales Resultados JUNIO 2018SALUD, BIENESTAR Y ENVEJECIMIENTO ASUNCIÓN, PARAGUAY
8 9
CAPÍTULO 1. Justificación, métodos y organización de la encuesta Salud, Bienestar
Justificación El Paraguay es un país que se caracteriza por su población eminentemente joven. Sin embargo, el número de personas Adultas
Mayores constituye aproximadamente el 10% de su población actual y ha ido en aumento. El creciente número de Adultos Mayores
plantea nuevos desafíos para la sociedad paraguaya a nivel individual, familiar, comunitario y nacional. Estos retos requieren de múl-
tiples acciones preventivas, receptivas y adaptables en los sectores público y privado por igual.
En este contexto, la Agencia de Cooperación Internacional de Corea (KOICA) y el Ministerio de Salud Pública y Bienestar Social de
Paraguay (MSPyBS) acordaron en octubre de 2016 llevar a cabo el Proyecto “Establecimiento del Complejo ´Santo Domingo´ para
cuidados y servicios sociales y asistencia técnica para el desarrollo de políticas para Adultos Mayores en Paraguay” (en lo sucesivo, “el
Proyecto”), que tiene como objetivo la edificación de un Complejo de los Adultos Mayores y el fortalecimiento de las capacidades de
administración de los centros de atención a largo plazo.
Otro objetivo importante del Proyecto es el desarrollo de políticas de salud y bienestar social para los Adultos Mayores. Para efectuar
adecuadamente este objetivo es necesario analizar las condiciones de salud de los Adultos Mayores y los determinantes sociales,
fuertemente vinculados al entorno económico y social y a sus variaciones. Sin embargo, no hay información suficiente para hacer
referencia a estos temas.
Por este motivo, la realización de la encuesta sobre el envejecimiento de la población, fue primordial para disponer de datos fidedi-
gnos que puedan ser utilizados de guía en la realización de políticas, leyes y reglamentaciones en favor de los Adultos Mayores.
Firma de Memorando de Entendimiento entre KOICA y STP
CAPÍTULO 1. ObjetivosLa Encuesta SABE, tuvo por objetivo analizar las condiciones de salud de los Adultos Mayores y sus determinantes sociales, a fin de
aportar para el desarrollo nacional de políticas para los Adultos Mayores en Paraguay, dentro del marco del Proyecto de KOICA “Esta-
blecimiento del Complejo Santo Domingo, para cuidados, servicios sociales y asistencia técnica para el desarrollo de políticas para
Adultos Mayores en Paraguay”.
Ámbito poblacional La población objetivo de la Encuesta de Salud, Bienestar y Envejecimiento (SABE) está constituida por las personas de 60 y más años
de edad de Asunción y 8 distritos del departamento Central (Mariano Roque Alonso, Lambaré, Fernando de la Mora, Luque, Limpio,
San Lorenzo, Villa Elisa y Ñemby).
Diseño de la MuestraEl diseño muestral es trietápico y probabilístico. Las unidades primarias de muestreo fueron seleccionadas con probabilidad propor-
cional aproximada al tamaño, de acuerdo al número de viviendas registradas en el censo. Las unidades secundarias fueron seleccio-
nadas con igual probabilidad. Al interior de la vivienda fueron identificadas las personas elegibles. La entrevista se realizó a la persona
de 60 años y más de edad seleccionadas con igual probabilidad en esta última etapa de muestreo.
El tamaño muestral definido fue de 500 hogares en los que residen adultos mayores. Se previó una sobredimensión de la muestra
de un 20%, de manera de enfrentar los problemas de No respuesta y la mayor dificultad que implica realizar el seguimiento a una
persona individualizada dentro del hogar.
Distribución de la muestra por departamentos y distritos.
Departamentos y distritos Muestra
TOTAL 600
Asunción 168
Central 432
Fernando de la Mora 72
Lambaré 48
Limpio 48
Luque 84
Mariano R. Alonso 24
Ñemby 48
San Lorenzo 84
Villa Elisa 24
ENCUESTA SABE Principales Resultados JUNIO 2018SALUD, BIENESTAR Y ENVEJECIMIENTO ASUNCIÓN, PARAGUAY
10 11
CAPÍTULO 1. Cuestionarios y manualesLa herramienta de recolección de datos fue la Ficha Social, a través de la cual se obtuvieron los estados de pobreza de los adultos
mayores encuestados, además del cuestionario SABE (Salud, Bienestar y Envejecimiento) estandarizado aprobado y sugerido por la
Organización Panamericana de la Salud.
La Ficha Social, dirigida a todos los miembros del hogar, consta de 9 secciones bien diferenciadas y son las siguientes:
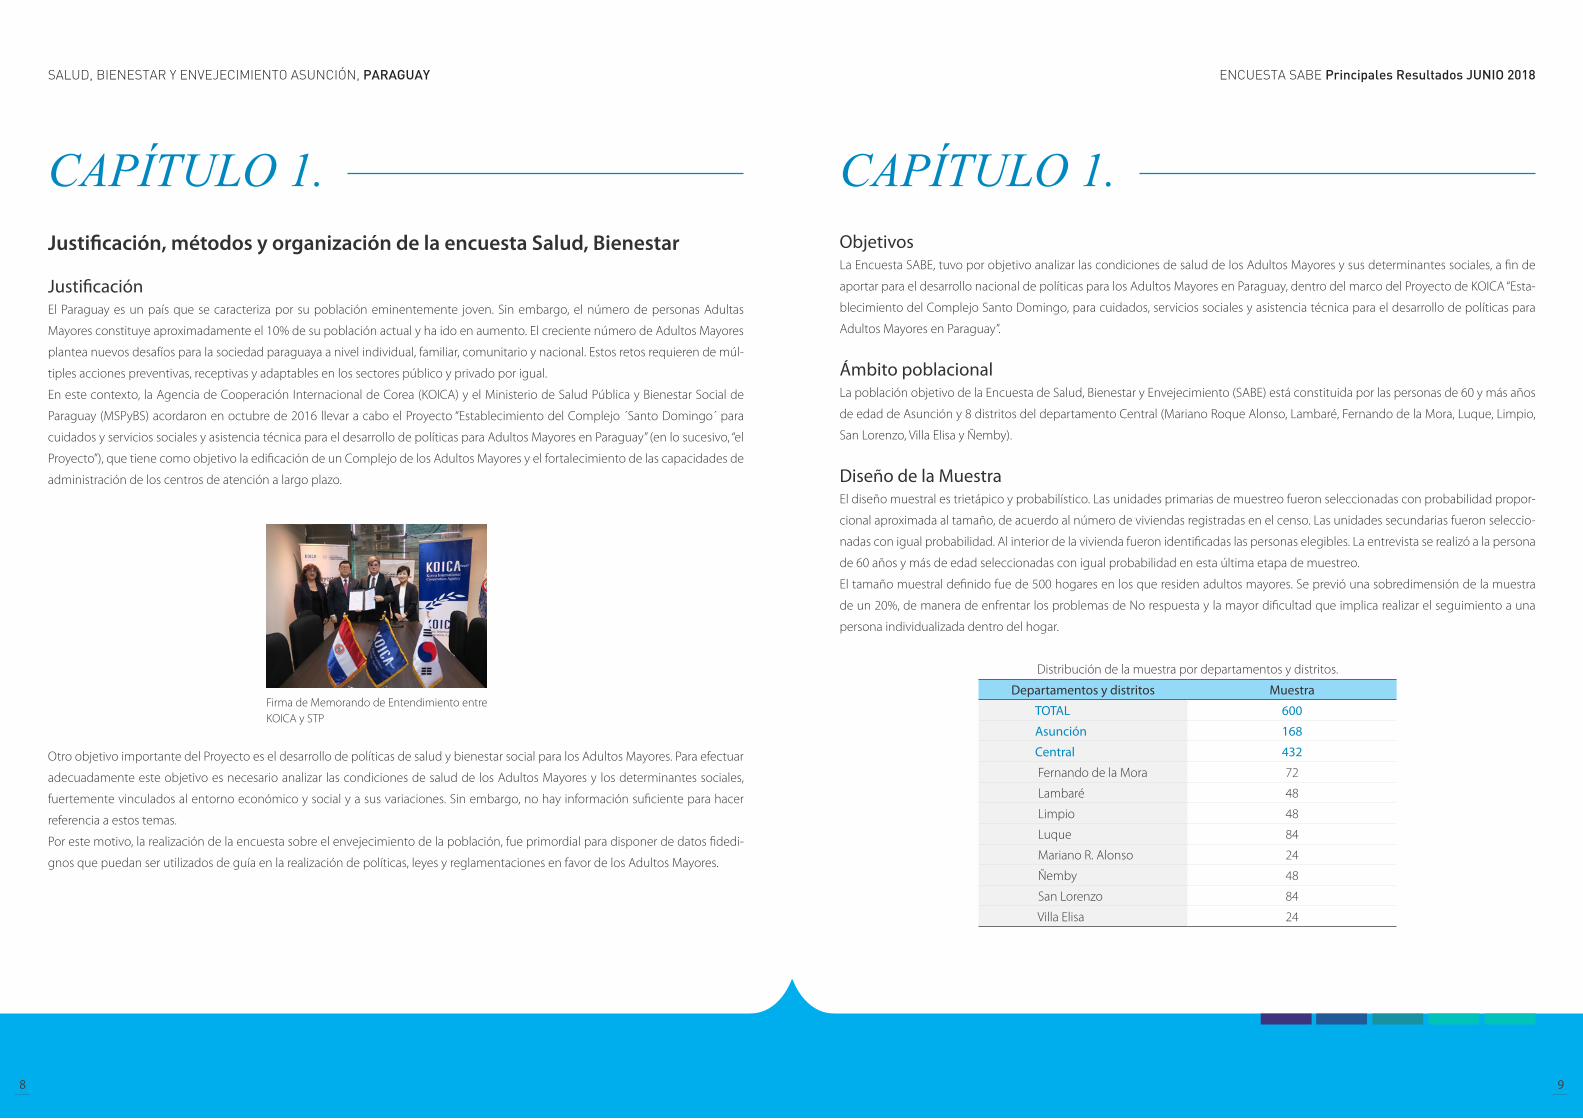
Jornada de capacitación para encuestadores SABE Asunción
Identificación Geográfica: en esta parte se registra los datos de localización geográfica, dirección de la vivienda.
Equipo de trabajo: se recoge información del equipo de trabajo.
Condición de ocupación de la vivienda: se investiga el resultado final de la entrevista, así como los datos de las visitas, de
los informantes auxiliares o sustitutos y observaciones.
Características de la vivienda y bienes duraderos: se recoge información sobre el tipo de vivienda, tipo de material que
predomina en su construcción, los servicios básicos con que cuenta, así como los bienes duraderos que tiene el hogar.
Sociodemográfica: en esta parte se investiga las características sociodemográficas de las personas, es decir, edad, sexo,
relación de parentesco, si es miembro del hogar, cédula de identidad policía o partida de nacimiento, fecha de nacimiento,
estado civil, etc. Esta parte permite identificar a los “miembros del hogar” que residen en la vivienda.
Educación: en esta sección interesa conocer los aspectos relacionados con el nivel educativo, asistencia a centros educa-
tivos de todas las personas de 5 años y más.
Salud: contiene pregunta sobre tenencia de seguro médico y discapacidad.
Empleo: determina si los miembros del hogar de 10 años y más de edad realizan o no actividades económicas, (investiga
trabajo dependiente, independiente no agropecuario y agropecuario).
Actividad Agropecuaria, Animales y Cultivos Agrícolas: Investiga la tenencia de tierras y maquinarias del hogar, produc-
ción agrícola, pecuaria y forestal, así como los ingresos que derivan de éstos.
1.
2.
3.
4.
5.
6.
7.
8.
9.
CAPÍTULO 1. El cuestionario SABE, dirigida al Adulto Mayor seleccionado del hogar, consta de 10 secciones bien diferenciadas y son las siguientes:
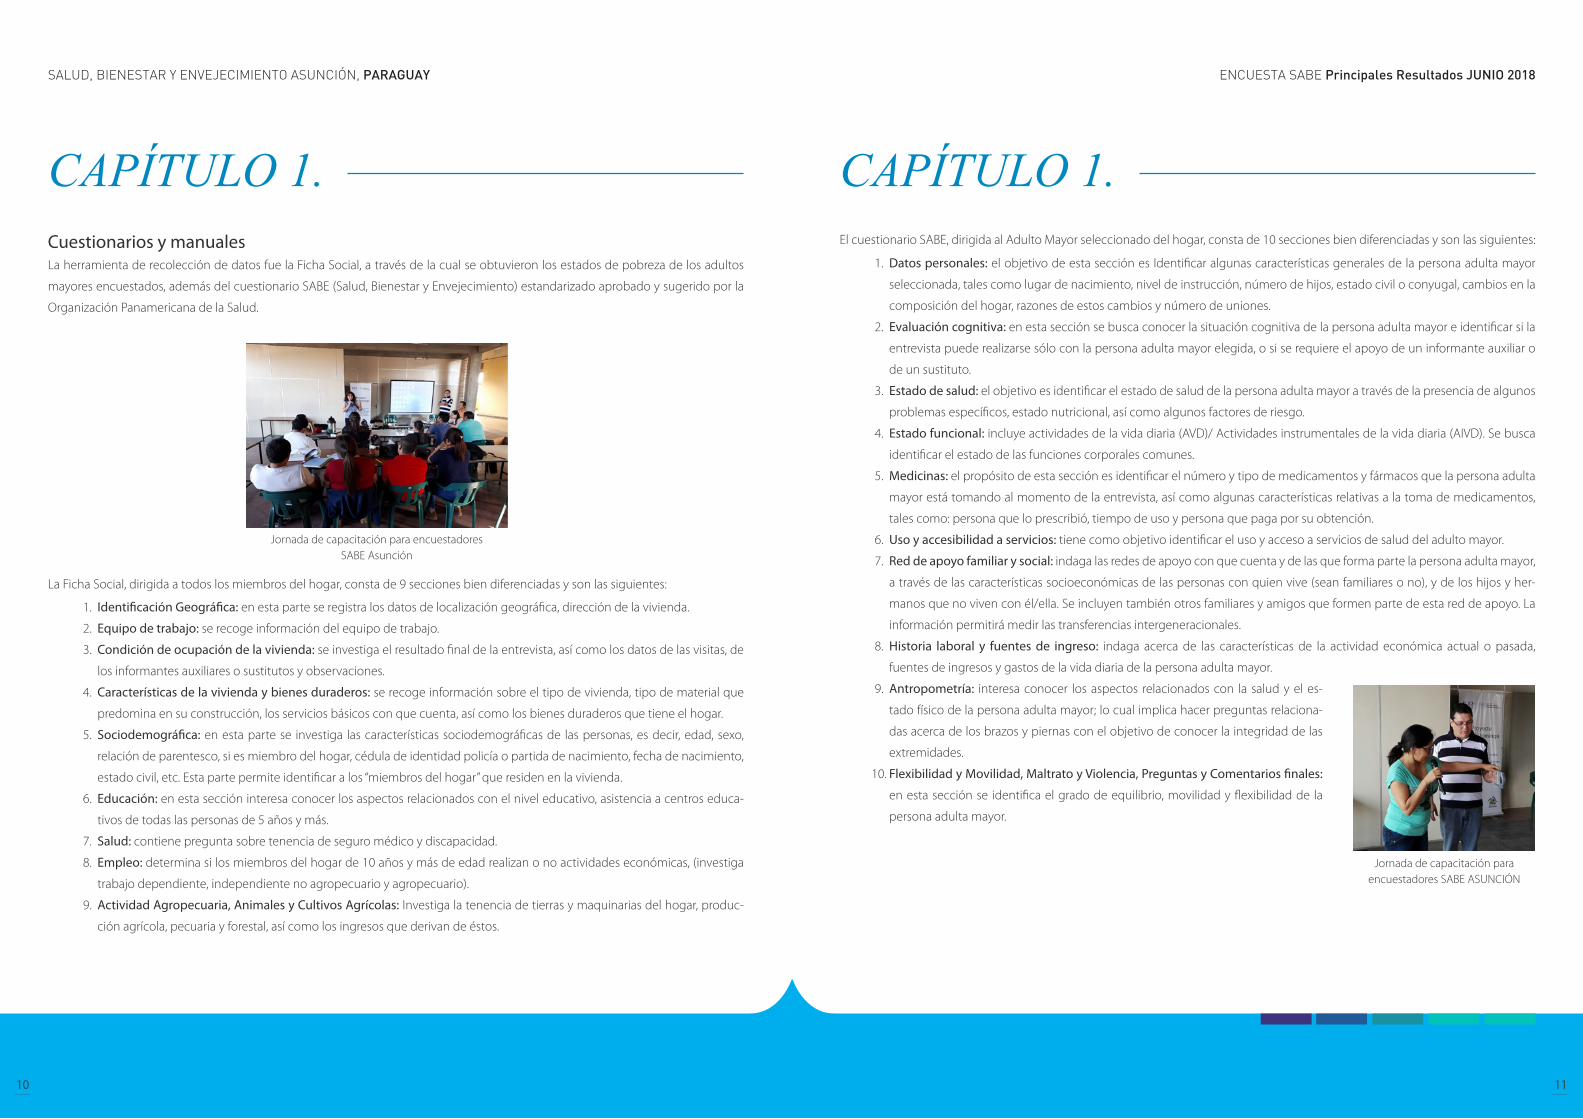
Jornada de capacitación para encuestadores SABE ASUNCIÓN
Datos personales: el objetivo de esta sección es Identificar algunas características generales de la persona adulta mayor
seleccionada, tales como lugar de nacimiento, nivel de instrucción, número de hijos, estado civil o conyugal, cambios en la
composición del hogar, razones de estos cambios y número de uniones.
Evaluación cognitiva: en esta sección se busca conocer la situación cognitiva de la persona adulta mayor e identificar si la
entrevista puede realizarse sólo con la persona adulta mayor elegida, o si se requiere el apoyo de un informante auxiliar o
de un sustituto.
Estado de salud: el objetivo es identificar el estado de salud de la persona adulta mayor a través de la presencia de algunos
problemas específicos, estado nutricional, así como algunos factores de riesgo.
Estado funcional: incluye actividades de la vida diaria (AVD)/ Actividades instrumentales de la vida diaria (AIVD). Se busca
identificar el estado de las funciones corporales comunes.
Medicinas: el propósito de esta sección es identificar el número y tipo de medicamentos y fármacos que la persona adulta
mayor está tomando al momento de la entrevista, así como algunas características relativas a la toma de medicamentos,
tales como: persona que lo prescribió, tiempo de uso y persona que paga por su obtención.
Uso y accesibilidad a servicios: tiene como objetivo identificar el uso y acceso a servicios de salud del adulto mayor.
Red de apoyo familiar y social: indaga las redes de apoyo con que cuenta y de las que forma parte la persona adulta mayor,
a través de las características socioeconómicas de las personas con quien vive (sean familiares o no), y de los hijos y her-
manos que no viven con él/ella. Se incluyen también otros familiares y amigos que formen parte de esta red de apoyo. La
información permitirá medir las transferencias intergeneracionales.
Historia laboral y fuentes de ingreso: indaga acerca de las características de la actividad económica actual o pasada,
fuentes de ingresos y gastos de la vida diaria de la persona adulta mayor.
Antropometría: interesa conocer los aspectos relacionados con la salud y el es-
tado físico de la persona adulta mayor; lo cual implica hacer preguntas relaciona-
das acerca de los brazos y piernas con el objetivo de conocer la integridad de las
extremidades.
Flexibilidad y Movilidad, Maltrato y Violencia, Preguntas y Comentarios finales:
en esta sección se identifica el grado de equilibrio, movilidad y flexibilidad de la
persona adulta mayor.
1.
2.
3.
4.
5.
6.
7.
8.
9.
10.
ENCUESTA SABE Principales Resultados JUNIO 2018SALUD, BIENESTAR Y ENVEJECIMIENTO ASUNCIÓN, PARAGUAY
12 13
CAPÍTULO 1. Trabajo de campoLos datos fueron recolectados por 2 equipos, cada equipo de trabajo de campo estuvo conformado por un supervisor, tres encuesta-
dores y un técnico con vehículo. A fin de asegurar la calidad de los datos, la supervisión de los equipos durante la recolección de la
información en campo, estuvo a cargo del Coordinador de Campo, responsable coordinar y supervisar a los equipos en forma directa.
Los encuestadores entrevistaron a las personas seleccionada al interior del hogar. El periodo de relevamiento de los datos fue de
noviembre a diciembre del año 2017. Las entrevistas tuvieron una duración promedio de 2 horas por hogar.
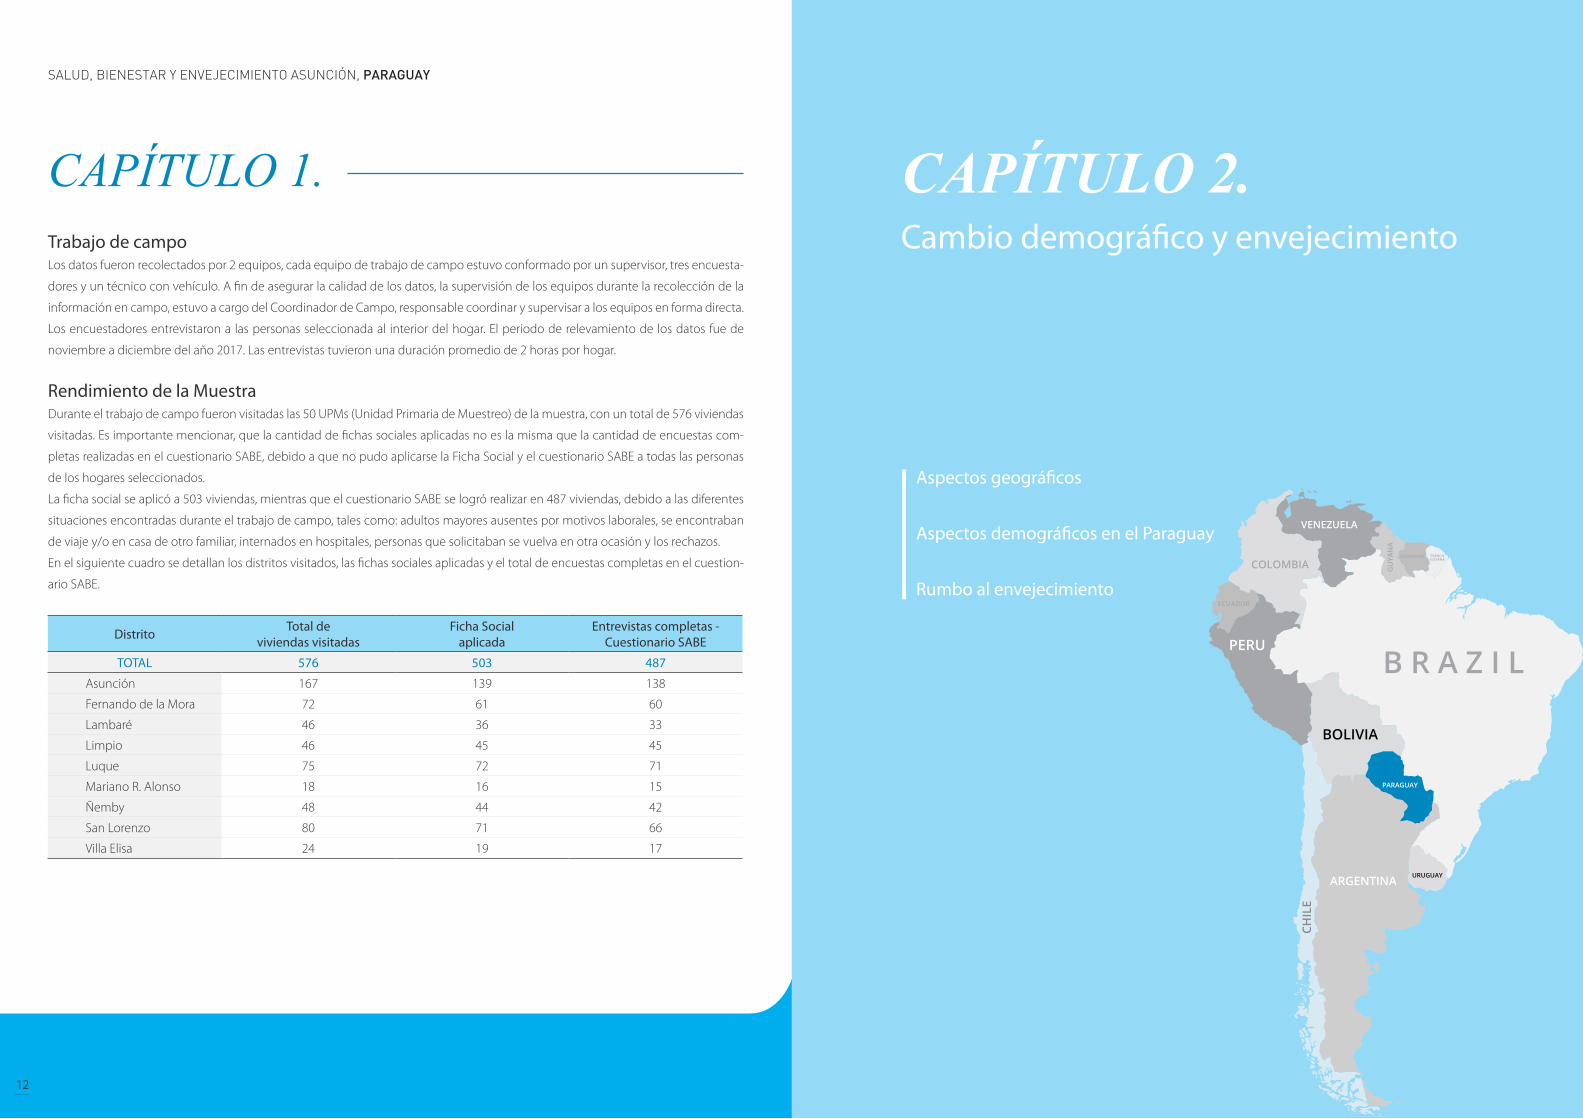
Rendimiento de la Muestra Durante el trabajo de campo fueron visitadas las 50 UPMs (Unidad Primaria de Muestreo) de la muestra, con un total de 576 viviendas
visitadas. Es importante mencionar, que la cantidad de fichas sociales aplicadas no es la misma que la cantidad de encuestas com-
pletas realizadas en el cuestionario SABE, debido a que no pudo aplicarse la Ficha Social y el cuestionario SABE a todas las personas
de los hogares seleccionados.
La ficha social se aplicó a 503 viviendas, mientras que el cuestionario SABE se logró realizar en 487 viviendas, debido a las diferentes
situaciones encontradas durante el trabajo de campo, tales como: adultos mayores ausentes por motivos laborales, se encontraban
de viaje y/o en casa de otro familiar, internados en hospitales, personas que solicitaban se vuelva en otra ocasión y los rechazos.
En el siguiente cuadro se detallan los distritos visitados, las fichas sociales aplicadas y el total de encuestas completas en el cuestion-
ario SABE.
Distrito Total de viviendas visitadas
Ficha Social aplicada
Entrevistas completas -Cuestionario SABE
TOTAL 576 503 487
Asunción 167 139 138
Fernando de la Mora 72 61 60
Lambaré 46 36 33
Limpio 46 45 45
Luque 75 72 71
Mariano R. Alonso 18 16 15
Ñemby 48 44 42
San Lorenzo 80 71 66
Villa Elisa 24 19 17
CAPÍTULO 2. Cambio demográfico y envejecimiento
Aspectos geográficos
Aspectos demográficos en el Paraguay
Rumbo al envejecimiento
ENCUESTA SABE Principales Resultados JUNIO 2018SALUD, BIENESTAR Y ENVEJECIMIENTO ASUNCIÓN, PARAGUAY
14 15
CAPÍTULO 2. Cambio demográfico y envejecimiento
Aspectos geográficos El territorio de Paraguay está ubicado en centro de América del Sur, y se encuentra entre los paralelos 19º 10’ y 27º 50’ de latitud sur
y los meridianos 54º 10’ y 62º 50’ de longitud oeste y su superficie totaliza 406 752 km, y no tiene costa sobre el mar, ya que es un
país mediterráneo que limita al norte con Brasil y Bolivia, al este con Brasil y Argentina, al sur con Argentina y al oeste con Bolivia y
Argentina. Paraguay se halla dividido políticamente en 17 departamentos, 14 en la Región Oriental y 3 en la Región Occidental. La
ciudad de Asunción es su capital.
El Río Paraguay divide al país en dos grandes regiones geográficas con diferente geología y topografía. La Región Oriental tiene el
39% del territorio nacional, y consta de suelos ferralíticos y mayormente ácidos, en cambio, la Región Occidental o Chaco, con el 61%
del territorio nacional, presenta suelos neutros a alcalinos, constituye una planicie aluvial extensiva semiárida a subhúmeda, y cuyas
temperaturas máximas extremas en el verano pueden superar los 40 °C. La Región Oriental, a su vez, está subdividida en dos sub-
regiones, la mayor corresponde a la cuenca del Río Paraguay y una de menor para la cuenca del Río Paraná. En ella predominan los
bosques tropicales y subtropicales, y las precipitaciones frecuentes. En esta región la temperatura media anual varía entre 20 y 23°C.
Las estaciones no están bien definidas debido gran parte del año presenta clima muy caluroso. La diferencia de temperatura entre el
mes más cálido y el más frío es de 10 °C. El otoño y la primavera son estaciones de transición e inestables, con grandes variaciones en
la temperatura, entre lo fresco y caluroso, en el que pueden darse hasta severas tormentas. Normalmente al inicio del otoño y final de
la primavera, el clima es similar al veraniego.
Como promedio, las heladas en el centro-norte de la región oriental y occidental se dan una a dos veces por año y hacia el sur de la
región oriental el promedio aumenta a 3 veces al año. La aparición de las heladas en la estación invernal es lo que diferencia al país del
clima tropical, y se dan en conjunto con los frentes fríos polares, que se suelen dar entre los meses invernales de junio, julio y agosto.
Sus dos principales ríos son; Paraguay y Paraná, el territorio posee además de humedales y lagos. El conjunto de humedales del Lago
Ypoá, conformado por cuatro lagos, y el Lago Ypacaraí, son los lagos más grandes de Paraguay. Paraguay además cuenta con una
considerable cantidad de esteros como el Pantanal Paraguayo cuyas superficies suman un total de 793.910 hectáreas.
CAPÍTULO 2. Aspectos demográficos en el Paraguay La Dirección General de Estadísticas, Encuestas y Censos (DGEEC) estimó en 6.953.646 habitantes la población de Paraguay en 2017
(revisión 2015). La densidad de población, de 17,1 habitantes/km², cifra menor que la mayoría de los otros países de América Latina,
y su distribución a lo largo del territorio es muy irregular: la gran mayoría de la gente vive en la Región Oriental, donde se asientan las
mayores ciudades como Asunción y Gran Asunción o Ciudad del Este. El Chaco o Región Occidental, que abarca aproximadamente
el 60,7 % del territorio, tiene menos del 5% de la población nacional.
Entre 1864 y 1870, se produjo la Guerra de la Triple Alianza en la que Argentina, Brasil y Uruguay lucharon contra el Paraguay, ocasion-
ando una mortandad masiva de la población paraguaya, en especial de los varones. Poco más de la mitad de la población paraguaya
murió en esta guerra (aproximadamente el 90% de los varones fueron muertos). Recién iniciado el siglo XX, durante las primeras
décadas, el Paraguay alcanzó la población que tenía de antes de la Guerra.
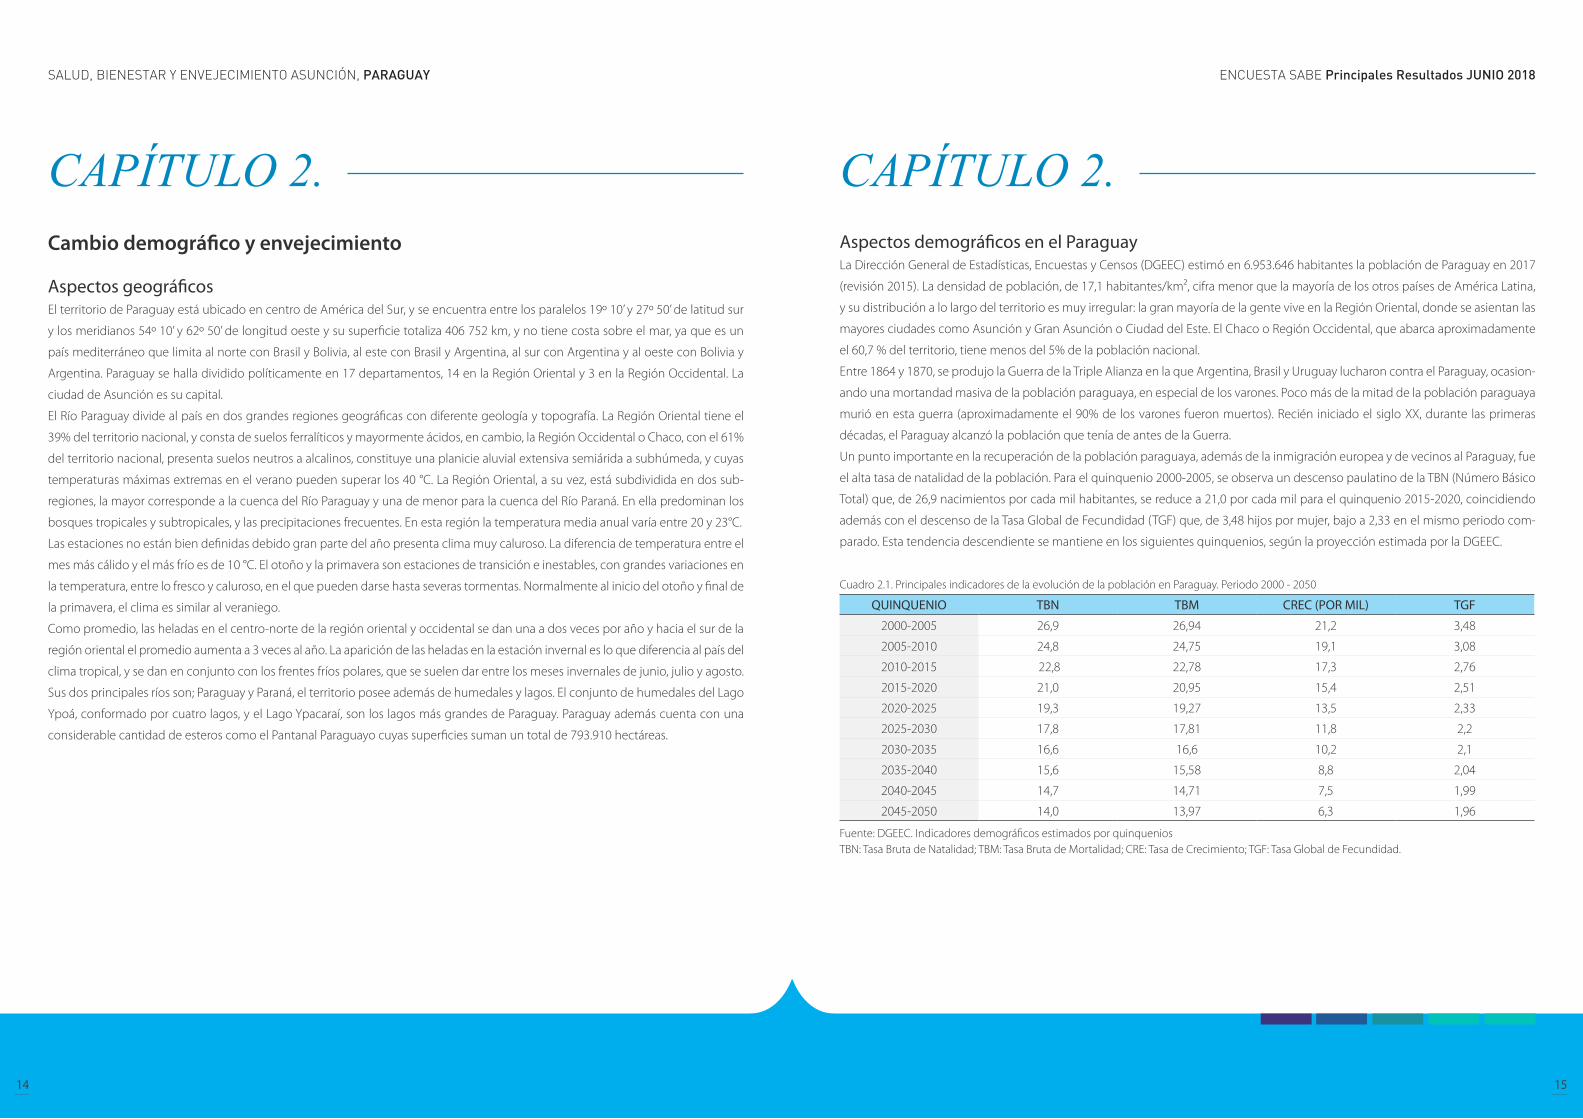
Un punto importante en la recuperación de la población paraguaya, además de la inmigración europea y de vecinos al Paraguay, fue
el alta tasa de natalidad de la población. Para el quinquenio 2000-2005, se observa un descenso paulatino de la TBN (Número Básico
Total) que, de 26,9 nacimientos por cada mil habitantes, se reduce a 21,0 por cada mil para el quinquenio 2015-2020, coincidiendo
además con el descenso de la Tasa Global de Fecundidad (TGF) que, de 3,48 hijos por mujer, bajo a 2,33 en el mismo periodo com-
parado. Esta tendencia descendiente se mantiene en los siguientes quinquenios, según la proyección estimada por la DGEEC.
Cuadro 2.1. Principales indicadores de la evolución de la población en Paraguay. Periodo 2000 - 2050
QUINQUENIO TBN TBM CREC (POR MIL) TGF
2000-2005 26,9 26,94 21,2 3,48
2005-2010 24,8 24,75 19,1 3,08
2010-2015 22,8 22,78 17,3 2,76
2015-2020 21,0 20,95 15,4 2,51
2020-2025 19,3 19,27 13,5 2,33
2025-2030 17,8 17,81 11,8 2,2
2030-2035 16,6 16,6 10,2 2,1
2035-2040 15,6 15,58 8,8 2,04
2040-2045 14,7 14,71 7,5 1,99
2045-2050 14,0 13,97 6,3 1,96
Fuente: DGEEC. Indicadores demográficos estimados por quinquenios TBN: Tasa Bruta de Natalidad; TBM: Tasa Bruta de Mortalidad; CRE: Tasa de Crecimiento; TGF: Tasa Global de Fecundidad.
ENCUESTA SABE Principales Resultados JUNIO 2018SALUD, BIENESTAR Y ENVEJECIMIENTO ASUNCIÓN, PARAGUAY
16 17
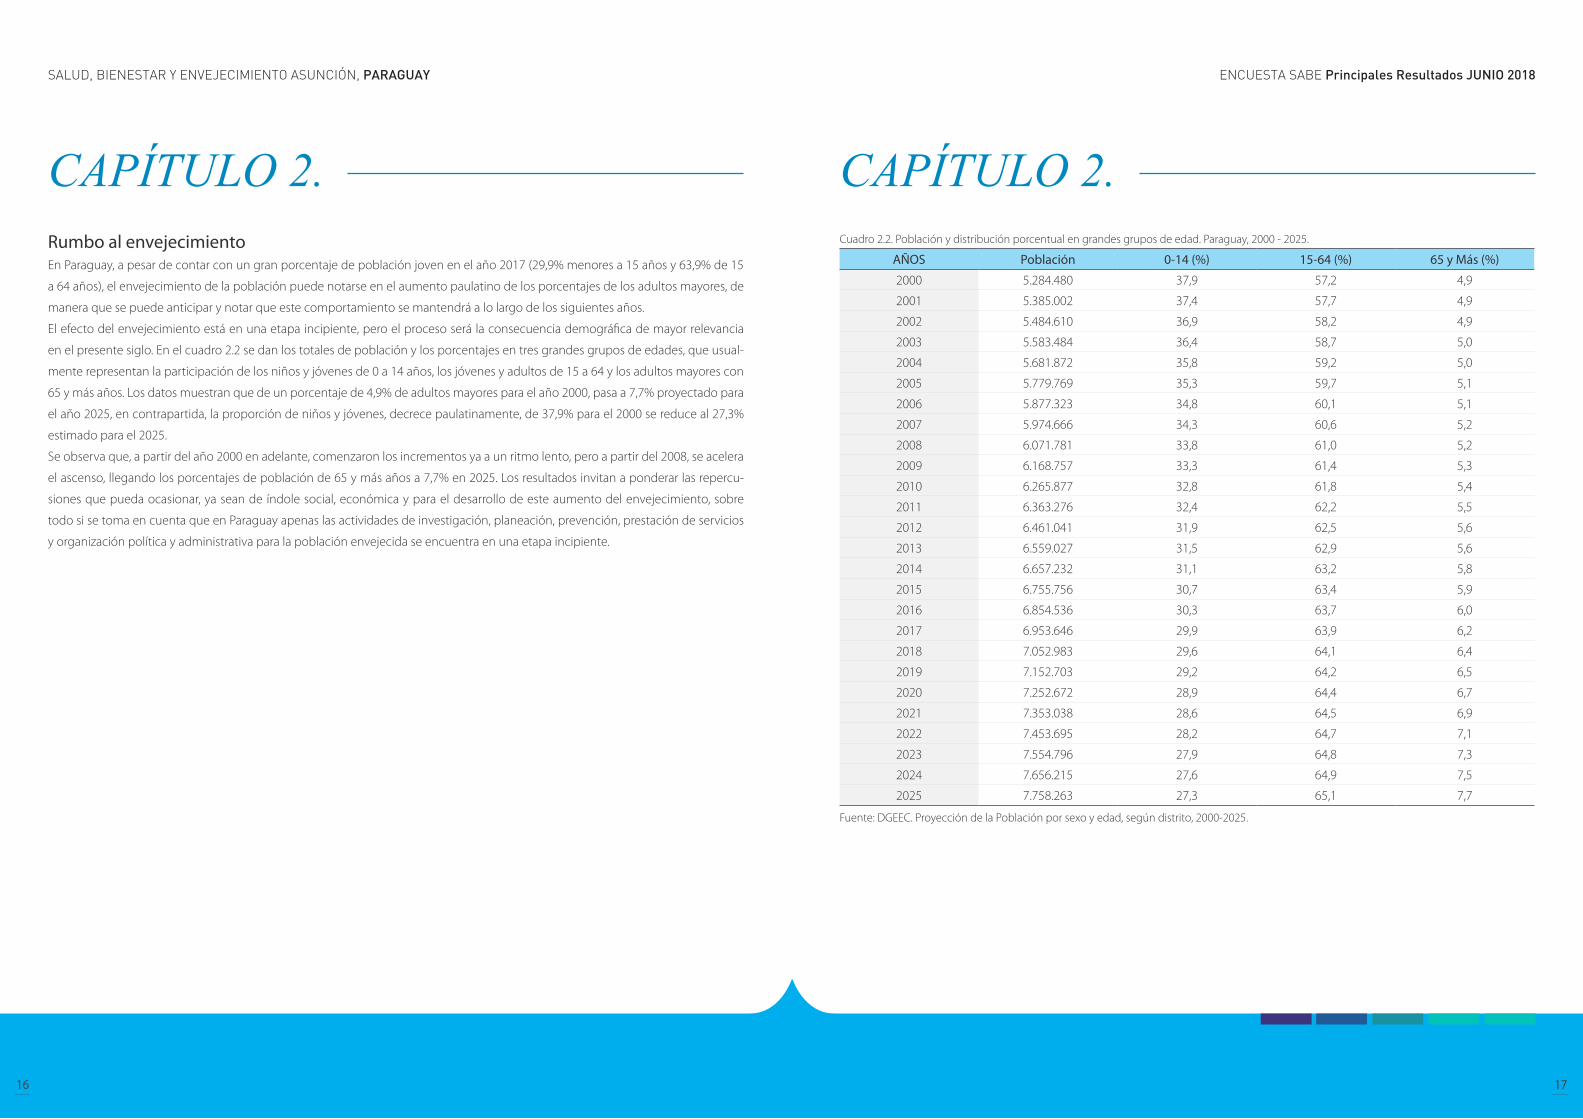
Rumbo al envejecimiento En Paraguay, a pesar de contar con un gran porcentaje de población joven en el año 2017 (29,9% menores a 15 años y 63,9% de 15
a 64 años), el envejecimiento de la población puede notarse en el aumento paulatino de los porcentajes de los adultos mayores, de
manera que se puede anticipar y notar que este comportamiento se mantendrá a lo largo de los siguientes años.
El efecto del envejecimiento está en una etapa incipiente, pero el proceso será la consecuencia demográfica de mayor relevancia
en el presente siglo. En el cuadro 2.2 se dan los totales de población y los porcentajes en tres grandes grupos de edades, que usual-
mente representan la participación de los niños y jóvenes de 0 a 14 años, los jóvenes y adultos de 15 a 64 y los adultos mayores con
65 y más años. Los datos muestran que de un porcentaje de 4,9% de adultos mayores para el año 2000, pasa a 7,7% proyectado para
el año 2025, en contrapartida, la proporción de niños y jóvenes, decrece paulatinamente, de 37,9% para el 2000 se reduce al 27,3%
estimado para el 2025.
Se observa que, a partir del año 2000 en adelante, comenzaron los incrementos ya a un ritmo lento, pero a partir del 2008, se acelera
el ascenso, llegando los porcentajes de población de 65 y más años a 7,7% en 2025. Los resultados invitan a ponderar las repercu-
siones que pueda ocasionar, ya sean de índole social, económica y para el desarrollo de este aumento del envejecimiento, sobre
todo si se toma en cuenta que en Paraguay apenas las actividades de investigación, planeación, prevención, prestación de servicios
y organización política y administrativa para la población envejecida se encuentra en una etapa incipiente.
CAPÍTULO 2. CAPÍTULO 2. Cuadro 2.2. Población y distribución porcentual en grandes grupos de edad. Paraguay, 2000 - 2025.
AÑOS Población 0-14 (%) 15-64 (%) 65 y Más (%)
2000 5.284.480 37,9 57,2 4,9
2001 5.385.002 37,4 57,7 4,9
2002 5.484.610 36,9 58,2 4,9
2003 5.583.484 36,4 58,7 5,0
2004 5.681.872 35,8 59,2 5,0
2005 5.779.769 35,3 59,7 5,1
2006 5.877.323 34,8 60,1 5,1
2007 5.974.666 34,3 60,6 5,2
2008 6.071.781 33,8 61,0 5,2
2009 6.168.757 33,3 61,4 5,3
2010 6.265.877 32,8 61,8 5,4
2011 6.363.276 32,4 62,2 5,5
2012 6.461.041 31,9 62,5 5,6
2013 6.559.027 31,5 62,9 5,6
2014 6.657.232 31,1 63,2 5,8
2015 6.755.756 30,7 63,4 5,9
2016 6.854.536 30,3 63,7 6,0
2017 6.953.646 29,9 63,9 6,2
2018 7.052.983 29,6 64,1 6,4
2019 7.152.703 29,2 64,2 6,5
2020 7.252.672 28,9 64,4 6,7
2021 7.353.038 28,6 64,5 6,9
2022 7.453.695 28,2 64,7 7,1
2023 7.554.796 27,9 64,8 7,3
2024 7.656.215 27,6 64,9 7,5
2025 7.758.263 27,3 65,1 7,7
Fuente: DGEEC. Proyección de la Población por sexo y edad, según distrito, 2000-2025.
ENCUESTA SABE Principales Resultados JUNIO 2018SALUD, BIENESTAR Y ENVEJECIMIENTO ASUNCIÓN, PARAGUAY
18 19
Características demográficas y socioeconómicas de los adultos mayores.
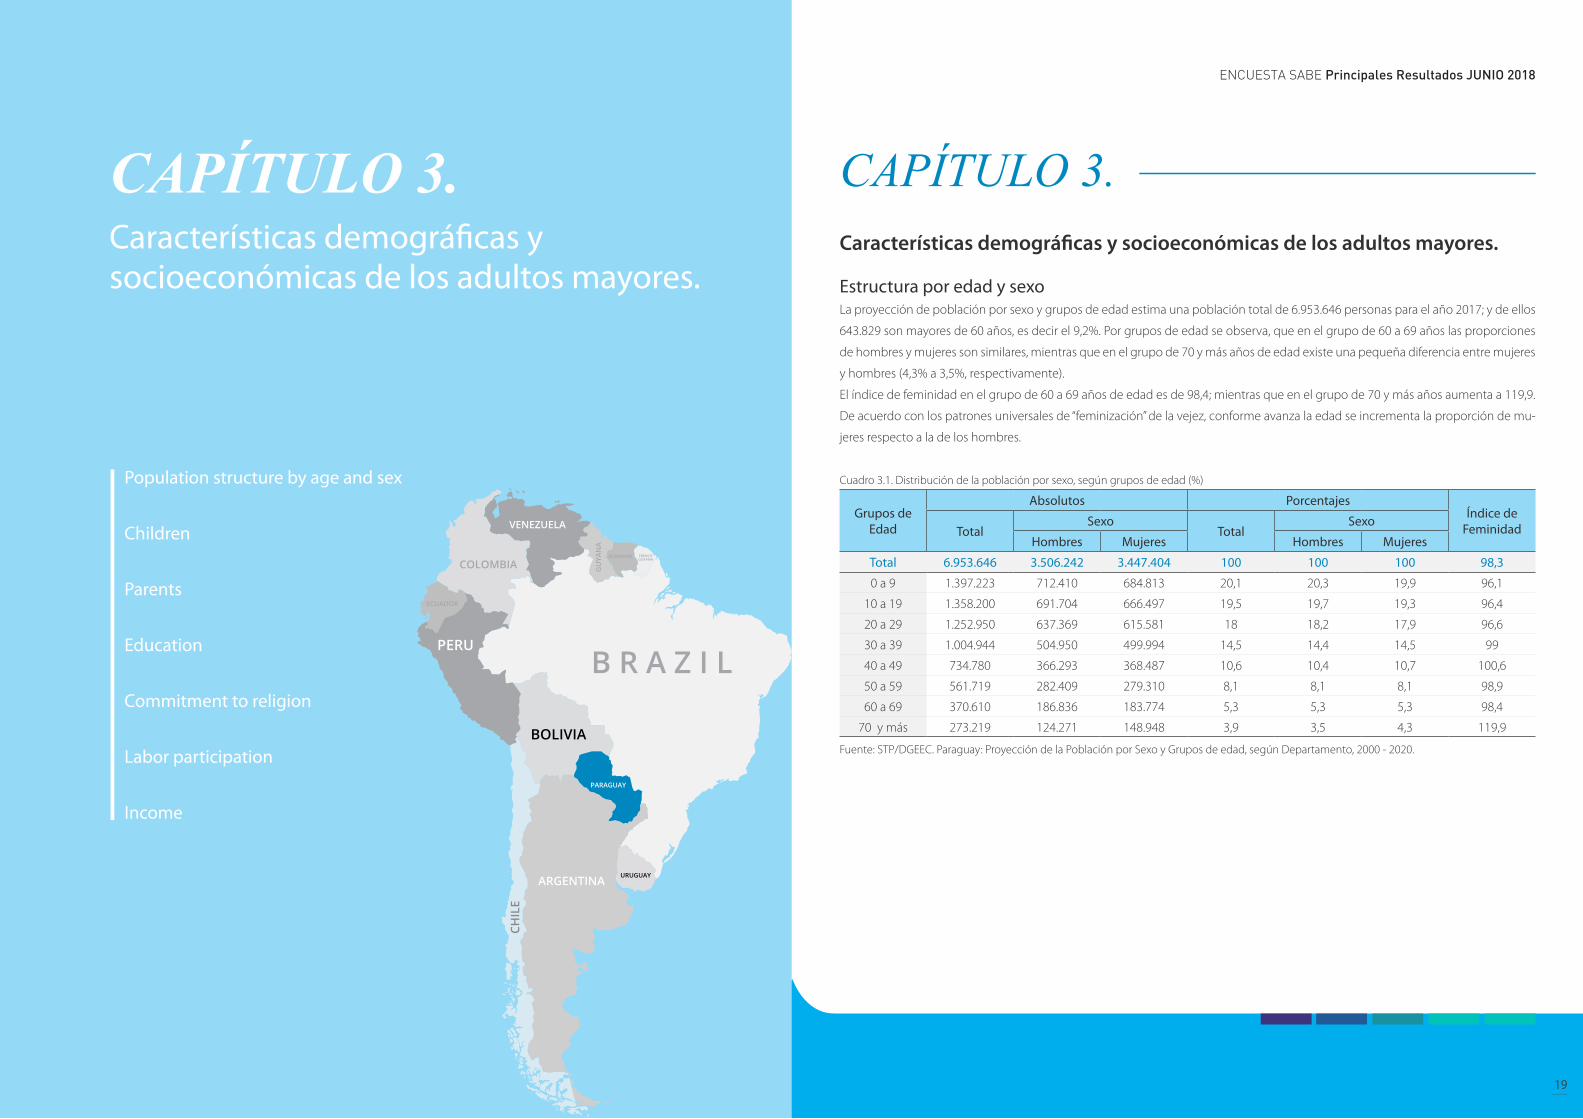
Estructura por edad y sexoLa proyección de población por sexo y grupos de edad estima una población total de 6.953.646 personas para el año 2017; y de ellos
643.829 son mayores de 60 años, es decir el 9,2%. Por grupos de edad se observa, que en el grupo de 60 a 69 años las proporciones
de hombres y mujeres son similares, mientras que en el grupo de 70 y más años de edad existe una pequeña diferencia entre mujeres
y hombres (4,3% a 3,5%, respectivamente).
El índice de feminidad en el grupo de 60 a 69 años de edad es de 98,4; mientras que en el grupo de 70 y más años aumenta a 119,9.
De acuerdo con los patrones universales de “feminización” de la vejez, conforme avanza la edad se incrementa la proporción de mu-
jeres respecto a la de los hombres.
Cuadro 3.1. Distribución de la población por sexo, según grupos de edad (%)
Grupos de Edad
Absolutos PorcentajesÍndice de
FeminidadTotalSexo
TotalSexo
Hombres Mujeres Hombres Mujeres
Total 6.953.646 3.506.242 3.447.404 100 100 100 98,3
0 a 9 1.397.223 712.410 684.813 20,1 20,3 19,9 96,1
10 a 19 1.358.200 691.704 666.497 19,5 19,7 19,3 96,4
20 a 29 1.252.950 637.369 615.581 18 18,2 17,9 96,6
30 a 39 1.004.944 504.950 499.994 14,5 14,4 14,5 99
40 a 49 734.780 366.293 368.487 10,6 10,4 10,7 100,6
50 a 59 561.719 282.409 279.310 8,1 8,1 8,1 98,9
60 a 69 370.610 186.836 183.774 5,3 5,3 5,3 98,4
70 y más 273.219 124.271 148.948 3,9 3,5 4,3 119,9
Fuente: STP/DGEEC. Paraguay: Proyección de la Población por Sexo y Grupos de edad, según Departamento, 2000 - 2020.
CAPÍTULO 3. CAPÍTULO 3. Características demográficas y socioeconómicas de los adultos mayores.
Population structure by age and sex
Children
Parents
Education
Commitment to religion
Labor participation
Income
ENCUESTA SABE Principales Resultados JUNIO 2018SALUD, BIENESTAR Y ENVEJECIMIENTO ASUNCIÓN, PARAGUAY
20 21
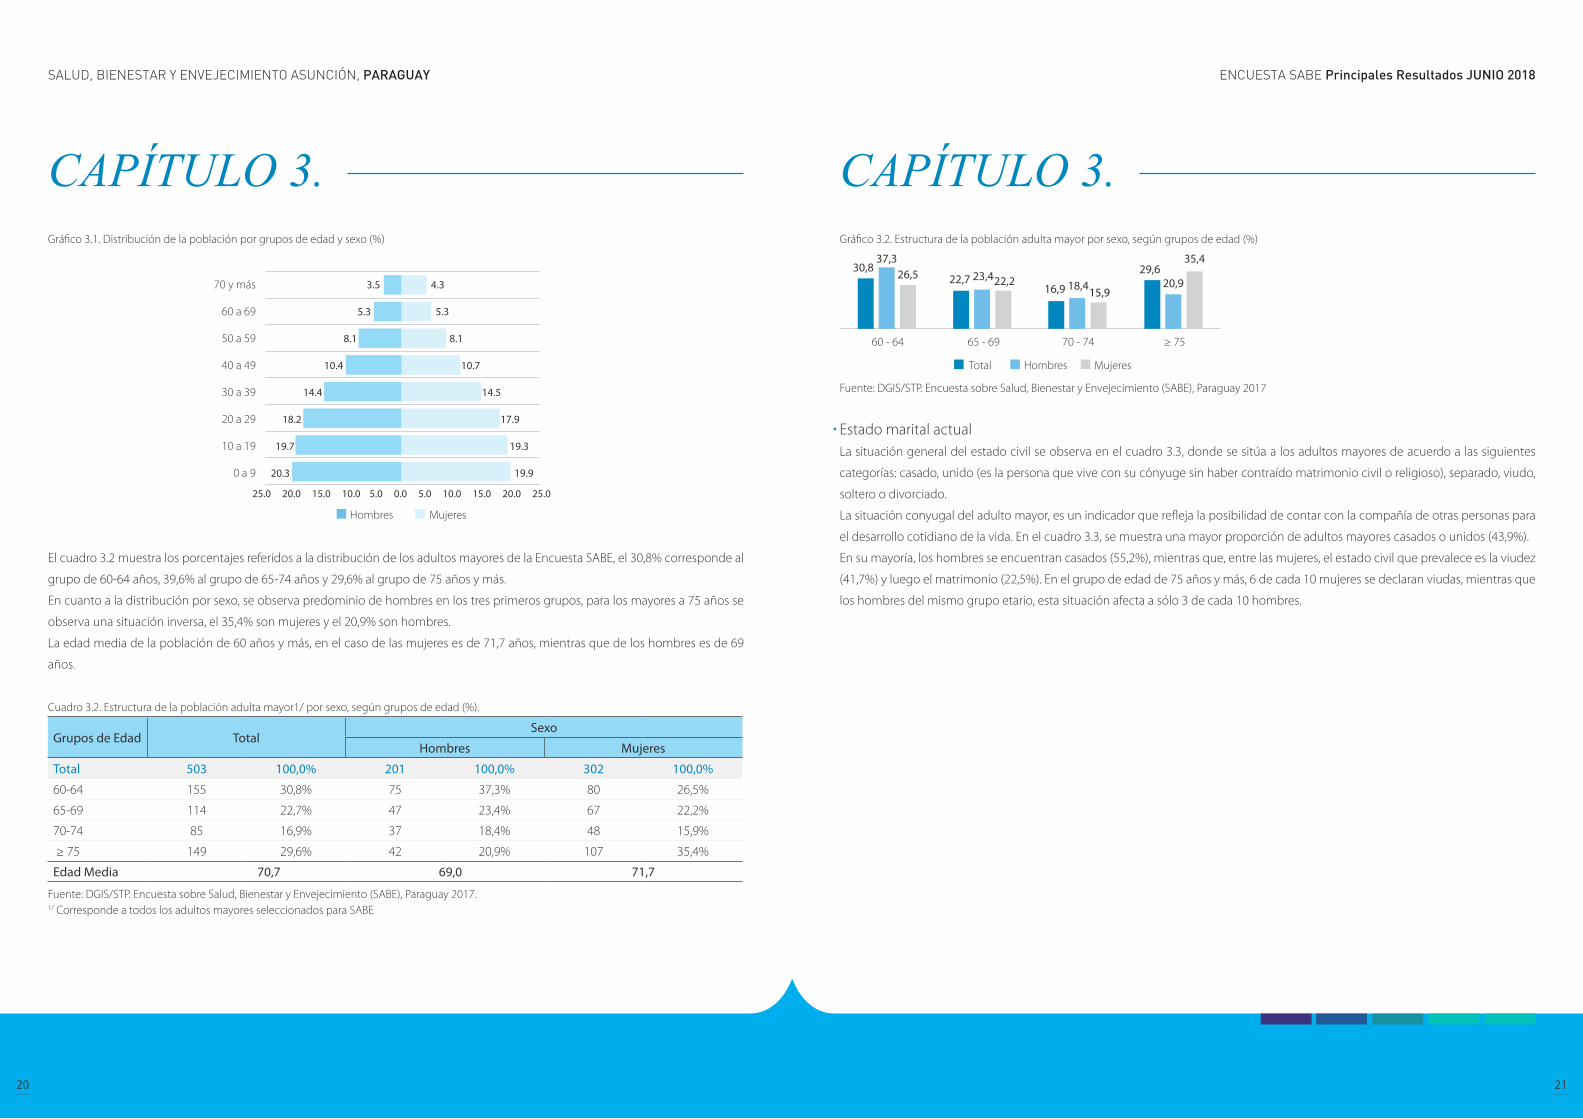
Gráfico 3.1. Distribución de la población por grupos de edad y sexo (%)
El cuadro 3.2 muestra los porcentajes referidos a la distribución de los adultos mayores de la Encuesta SABE, el 30,8% corresponde al
grupo de 60-64 años, 39,6% al grupo de 65-74 años y 29,6% al grupo de 75 años y más.
En cuanto a la distribución por sexo, se observa predominio de hombres en los tres primeros grupos, para los mayores a 75 años se
observa una situación inversa, el 35,4% son mujeres y el 20,9% son hombres.
La edad media de la población de 60 años y más, en el caso de las mujeres es de 71,7 años, mientras que de los hombres es de 69
años.
Cuadro 3.2. Estructura de la población adulta mayor1/ por sexo, según grupos de edad (%).
Grupos de Edad TotalSexo
Hombres Mujeres
Total 503 100,0% 201 100,0% 302 100,0%
60-64 155 30,8% 75 37,3% 80 26,5%
65-69 114 22,7% 47 23,4% 67 22,2%
70-74 85 16,9% 37 18,4% 48 15,9%
≥ 75 149 29,6% 42 20,9% 107 35,4%
Edad Media 70,7 69,0 71,7
Fuente: DGIS/STP. Encuesta sobre Salud, Bienestar y Envejecimiento (SABE), Paraguay 2017.1/ Corresponde a todos los adultos mayores seleccionados para SABE
Gráfico 3.2. Estructura de la población adulta mayor por sexo, según grupos de edad (%)
Fuente: DGIS/STP. Encuesta sobre Salud, Bienestar y Envejecimiento (SABE), Paraguay 2017
Estado marital actual La situación general del estado civil se observa en el cuadro 3.3, donde se sitúa a los adultos mayores de acuerdo a las siguientes
categorías: casado, unido (es la persona que vive con su cónyuge sin haber contraído matrimonio civil o religioso), separado, viudo,
soltero o divorciado.
La situación conyugal del adulto mayor, es un indicador que refleja la posibilidad de contar con la compañía de otras personas para
el desarrollo cotidiano de la vida. En el cuadro 3.3, se muestra una mayor proporción de adultos mayores casados o unidos (43,9%).
En su mayoría, los hombres se encuentran casados (55,2%), mientras que, entre las mujeres, el estado civil que prevalece es la viudez
(41,7%) y luego el matrimonio (22,5%). En el grupo de edad de 75 años y más, 6 de cada 10 mujeres se declaran viudas, mientras que
los hombres del mismo grupo etario, esta situación afecta a sólo 3 de cada 10 hombres.
CAPÍTULO 3. CAPÍTULO 3.

ENCUESTA SABE Principales Resultados JUNIO 2018SALUD, BIENESTAR Y ENVEJECIMIENTO ASUNCIÓN, PARAGUAY
22 23
Cuadro 3.3. Distribución de la población adulta mayor1/ por grupos de edad, según sexo y estado civil (%)
Estado Civil o Conyugal Total
Grupos de Edad
60-64 65-69 70-74 ≥75
Total 503 100,0% 155 100,0% 114 100,0% 85 100,0% 149 100,0%
Casado 179 35,6% 70 45,2% 45 39,5% 33 38,8% 31 20,8%
Unido 42 8,3% 21 13,5% 9 7,9% 10 11,8% 2 1,3%
Separado 69 13,7% 25 16,1% 21 18,4% 9 10,6% 14 9,4%
Viudo 155 30,8% 20 12,9% 28 24,6% 23 27,1% 84 56,4%
Soltero 54 10,7% 17 11,0% 10 8,8% 10 11,8% 17 11,4%
Divorciado 4 0,8% 2 1,3% 1 0,9% - - 1 0,7%
Hombre 201 100,0% 75 100,0% 47 100,0% 37 100,0% 42 100,0%
Casado 111 55,2% 42 56,0% 30 63,8% 22 59,5% 17 40,5%
Unido 17 8,5% 8 10,7% 3 6,4% 4 10,8% 2 4,8%
Separado 30 14,9% 14 18,7% 8 17,0% 4 10,8% 4 9,5%
Viudo 29 14,4% 4 5,3% 5 10,6% 4 10,8% 16 38,1%
Soltero 13 6,5% 6 8,0% 1 2,1% 3 8,1% 3 7,1%
Divorciado 1 0,5% 1 1,3% - - - - - -
Mujer 302 100,0% 80 100,0% 67 100,0% 48 100,0% 107 100,0%
Casado 68 22,5% 28 35,0% 15 22,4% 11 22,9% 14 13,1%
Unido 25 8,3% 13 16,3% 6 9,0% 6 12,5% 0 0,0%
Separado 39 12,9% 11 13,8% 13 19,4% 5 10,4% 10 9,3%
Viudo 126 41,7% 16 20,0% 23 34,3% 19 39,6% 68 63,6%
Soltero 41 13,6% 11 13,8% 9 13,4% 7 14,6% 14 13,1%
Divorciado 3 1,0% 1 1,3% 1 1,5% - - 1 0,9%
Fuente: DGIS/STP. Encuesta sobre Salud, Bienestar y Envejecimiento (SABE), Paraguay 2017.1/ Corresponde a todos los adultos mayores seleccionados para SABE
Gráfico 3.3. Distribución de la población adulta mayor1/ por sexo, según estado civil (%).
Fuente: DGIS/STP. Encuesta sobre Salud, Bienestar y Envejecimiento (SABE), Paraguay 2017.
En lo referente a la historia de uniones, se observa que la proporción de quienes han estado casados o unidos es mayor con respecto
aquellos no han estado en esa situación (94,3% vs 5,7%), esta situación se observa tanto para hombres como para mujeres.
Por otra parte, al analizar por grupos de edad se observan porcentajes similares entre las personas que han estado casados o en unión
libre (cuadro 3.4).
Historia de uniones Cuadro 3.4. Distribución de la población adulta mayor por grupos de edad, según situación conyugal (%).
Situación conyugal TotalGrupos de Edad
60-64 65-69 70-74 ≥75
Total 487 100,0% 147 100,0% 110 100,0% 84 100,0% 146 100,0%
Sí ha estado casado/a o en unión libre
459 94,3% 141 95,9% 103 93,6% 79 94,0% 136 93,2%
No ha estado casado/a o en unión libre
28 5,7% 6 4,1% 7 6,4% 5 6,0% 10 6,8%
Hombre 190 100,0% 69 100,0% 44 100,0% 37 100,0% 40 100,0%
Sí ha estado casado/a o en unión libre
182 95,8% 68 98,6% 43 97,7% 34 91,9% 37 92,5%
No ha estado casado/a o en unión libre
8 4,2% 1 1,4% 1 2,3% 3 8,1% 3 7,5%
Mujer 297 100,0% 78 100,0% 66 100,0% 47 100,0% 106 100,0%
Sí ha estado casado/a o en unión libre
277 93,3% 73 93,6% 60 90,9% 45 95,7% 99 93,4%
No ha estado casado/a o en unión libre
20 6,7% 5 6,4% 6 9,1% 2 4,3% 7 6,6%
Fuente: DGIS/STP. Encuesta sobre Salud, Bienestar y Envejecimiento (SABE), Paraguay 2017.
Gráfico 3.4. Distribución de la población adulta mayor por sexo, según situación conyugal (%).
Fuente: DGIS/STP. Encuesta sobre Salud, Bienestar y Envejecimiento (SABE), Paraguay 2017
CAPÍTULO 3. CAPÍTULO 3.

ENCUESTA SABE Principales Resultados JUNIO 2018SALUD, BIENESTAR Y ENVEJECIMIENTO ASUNCIÓN, PARAGUAY
24 25
Los hijos forman parte principal de apoyo en el desarrollo de la vida cotidiana de los adultos mayores, y en ocasiones es el único recurso
con el que cuentan.
En el cuadro 3.5 se observa que el 49,3% de la población adulta mayor (60 años y más) tiene de dos a cuatro hijos vivos y el 35,5% cuenta
con cinco o más hijos vivos.
Existen pequeñas diferencias al comparar los porcentajes entre hombre y mujeres que tienen un solo hijo (9,5% y 12,5%, respectivamente).
Por otra parte, el porcentaje es un poco mayor para las mujeres con 5 o más hijos (36,4%), con respecto a los hombres que tienen la misma
cantidad de hijos (34,2%).
HijosCuadro 3.5. Distribución de la población adulta mayor por grupos de edad, según sexo y número de hijos vivos (%)
Número de hijos vivos Total
Grupos de Edad
60-64 65-69 70-74 ≥75
Total 487 100,0% 147 100,0% 110 100,0% 84 100,0% 146 100,0%
No tienen 2 0,4% 0 0,0% 0 0,0% 0 0,0% 2 1,4%
Uno 55 11,3% 16 10,9% 8 7,3% 6 7,1% 25 17,1%
2 a 4 240 49,3% 79 53,7% 63 57,3% 42 50,0% 56 38,4%
5 o más 173 35,5% 46 31,3% 34 30,9% 33 39,3% 60 41,1%
No sabe 1 ,2% 1 0,7% - - - - - -
No tuvo hijos 16 3,3% 5 3,4% 5 4,5% 3 3,6% 3 2,1%
Hombre 190 100,0% 69 100,0% 44 100,0% 37 100,0% 40 100,0%
No tienen 1 0,5% - - - - - - 1 2,5%
Uno 18 9,5% 7 10,1% 1 2,3% 2 5,4% 8 20,0%
2 a 4 100 52,6% 38 55,1% 29 65,9% 17 45,9% 16 40,0%
5 o más 65 34,2% 22 31,9% 14 31,8% 15 40,5% 14 35,0%
No sabe - - - - - - - - - -
No tuvo hijos 6 3,2% 2 2,9% - - 3 8,1% 1 2,5%
Mujer 297 100,0% 78 100,0% 66 100,0% 47 100,0% 106 100,0%
No tienen 1 0,3% - - - - - - 1 0,9%
Uno 37 12,5% 9 11,5% 7 10,6% 4 8,5% 17 16,0%
2 a 4 140 47,1% 41 52,6% 34 51,5% 25 53,2% 40 37,7%
5 o más 108 36,4% 24 30,8% 20 30,3% 18 38,3% 46 43,4%
No sabe 1 0,3% 1 1,3% - - - - - -
No tuvo hijos 10 3,4% 3 3,8% 5 7,6% - - 2 1,9%
Fuente: DGIS/STP. Encuesta sobre Salud, Bienestar y Envejecimiento (SABE), Paraguay 2017.
Gráfico 3.5. Distribución de la población adulta mayor, según número de hijos vivos (%).
Fuente: DGIS/STP. Encuesta sobre Salud, Bienestar y Envejecimiento (SABE), Paraguay 2017.
PadresA los adultos mayores se les consultó, si alguno o ambos de sus padres todavía están vivos; 1 de cada 10 adultos mayores mencionó
que al menos uno de sus padres se mantiene vivo. Por grupos de edad, se observa que este porcentaje va disminuyendo conforme
avanza la edad, pasa a ser 24,5% para el grupo de 60-64 años a 1,4% para el grupo de 75 años y más de edad. Este mismo compor-
tamiento se nota tanto para hombres como para mujeres.
CAPÍTULO 3. CAPÍTULO 3.
ENCUESTA SABE Principales Resultados JUNIO 2018SALUD, BIENESTAR Y ENVEJECIMIENTO ASUNCIÓN, PARAGUAY
26 27
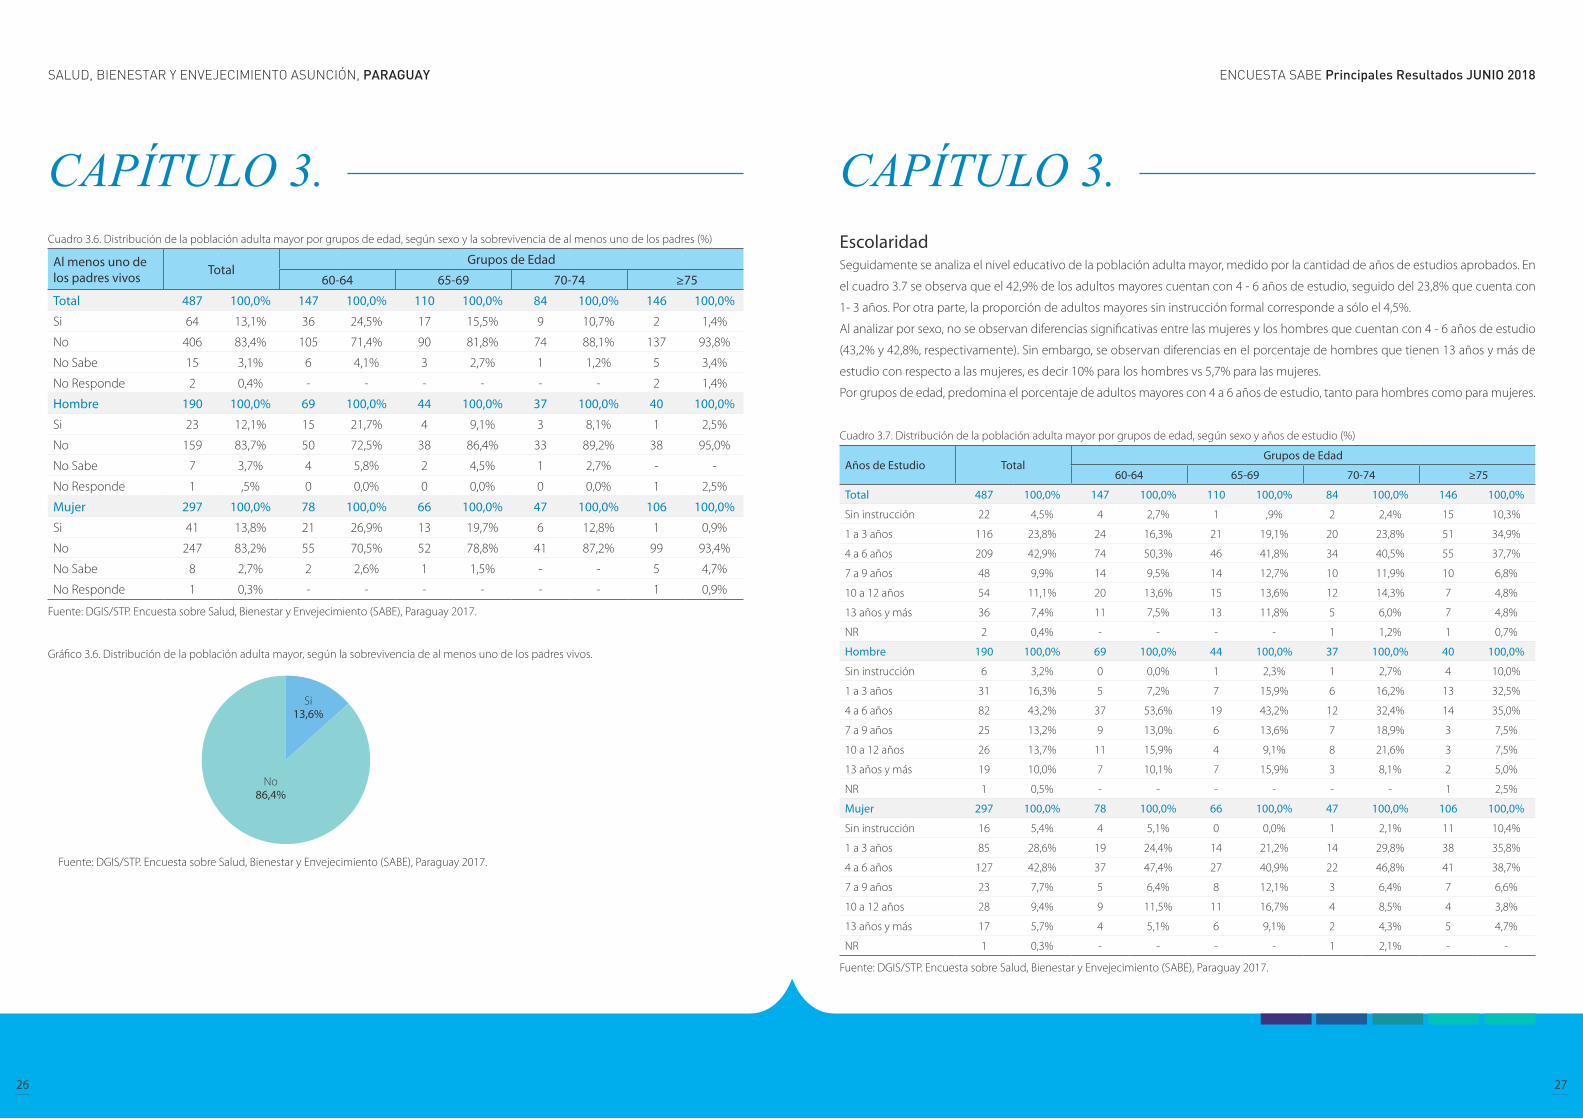
Cuadro 3.6. Distribución de la población adulta mayor por grupos de edad, según sexo y la sobrevivencia de al menos uno de los padres (%)
Al menos uno de los padres vivos Total
Grupos de Edad
60-64 65-69 70-74 ≥75
Total 487 100,0% 147 100,0% 110 100,0% 84 100,0% 146 100,0%
Si 64 13,1% 36 24,5% 17 15,5% 9 10,7% 2 1,4%
No 406 83,4% 105 71,4% 90 81,8% 74 88,1% 137 93,8%
No Sabe 15 3,1% 6 4,1% 3 2,7% 1 1,2% 5 3,4%
No Responde 2 0,4% - - - - - - 2 1,4%
Hombre 190 100,0% 69 100,0% 44 100,0% 37 100,0% 40 100,0%
Si 23 12,1% 15 21,7% 4 9,1% 3 8,1% 1 2,5%
No 159 83,7% 50 72,5% 38 86,4% 33 89,2% 38 95,0%
No Sabe 7 3,7% 4 5,8% 2 4,5% 1 2,7% - -
No Responde 1 ,5% 0 0,0% 0 0,0% 0 0,0% 1 2,5%
Mujer 297 100,0% 78 100,0% 66 100,0% 47 100,0% 106 100,0%
Si 41 13,8% 21 26,9% 13 19,7% 6 12,8% 1 0,9%
No 247 83,2% 55 70,5% 52 78,8% 41 87,2% 99 93,4%
No Sabe 8 2,7% 2 2,6% 1 1,5% - - 5 4,7%
No Responde 1 0,3% - - - - - - 1 0,9%
Fuente: DGIS/STP. Encuesta sobre Salud, Bienestar y Envejecimiento (SABE), Paraguay 2017.
Gráfico 3.6. Distribución de la población adulta mayor, según la sobrevivencia de al menos uno de los padres vivos.
Fuente: DGIS/STP. Encuesta sobre Salud, Bienestar y Envejecimiento (SABE), Paraguay 2017.
Escolaridad Seguidamente se analiza el nivel educativo de la población adulta mayor, medido por la cantidad de años de estudios aprobados. En
el cuadro 3.7 se observa que el 42,9% de los adultos mayores cuentan con 4 - 6 años de estudio, seguido del 23,8% que cuenta con
1- 3 años. Por otra parte, la proporción de adultos mayores sin instrucción formal corresponde a sólo el 4,5%.
Al analizar por sexo, no se observan diferencias significativas entre las mujeres y los hombres que cuentan con 4 - 6 años de estudio
(43,2% y 42,8%, respectivamente). Sin embargo, se observan diferencias en el porcentaje de hombres que tienen 13 años y más de
estudio con respecto a las mujeres, es decir 10% para los hombres vs 5,7% para las mujeres.
Por grupos de edad, predomina el porcentaje de adultos mayores con 4 a 6 años de estudio, tanto para hombres como para mujeres.
Cuadro 3.7. Distribución de la población adulta mayor por grupos de edad, según sexo y años de estudio (%)
Años de Estudio TotalGrupos de Edad
60-64 65-69 70-74 ≥75
Total 487 100,0% 147 100,0% 110 100,0% 84 100,0% 146 100,0%
Sin instrucción 22 4,5% 4 2,7% 1 ,9% 2 2,4% 15 10,3%
1 a 3 años 116 23,8% 24 16,3% 21 19,1% 20 23,8% 51 34,9%
4 a 6 años 209 42,9% 74 50,3% 46 41,8% 34 40,5% 55 37,7%
7 a 9 años 48 9,9% 14 9,5% 14 12,7% 10 11,9% 10 6,8%
10 a 12 años 54 11,1% 20 13,6% 15 13,6% 12 14,3% 7 4,8%
13 años y más 36 7,4% 11 7,5% 13 11,8% 5 6,0% 7 4,8%
NR 2 0,4% - - - - 1 1,2% 1 0,7%
Hombre 190 100,0% 69 100,0% 44 100,0% 37 100,0% 40 100,0%
Sin instrucción 6 3,2% 0 0,0% 1 2,3% 1 2,7% 4 10,0%
1 a 3 años 31 16,3% 5 7,2% 7 15,9% 6 16,2% 13 32,5%
4 a 6 años 82 43,2% 37 53,6% 19 43,2% 12 32,4% 14 35,0%
7 a 9 años 25 13,2% 9 13,0% 6 13,6% 7 18,9% 3 7,5%
10 a 12 años 26 13,7% 11 15,9% 4 9,1% 8 21,6% 3 7,5%
13 años y más 19 10,0% 7 10,1% 7 15,9% 3 8,1% 2 5,0%
NR 1 0,5% - - - - - - 1 2,5%
Mujer 297 100,0% 78 100,0% 66 100,0% 47 100,0% 106 100,0%
Sin instrucción 16 5,4% 4 5,1% 0 0,0% 1 2,1% 11 10,4%
1 a 3 años 85 28,6% 19 24,4% 14 21,2% 14 29,8% 38 35,8%
4 a 6 años 127 42,8% 37 47,4% 27 40,9% 22 46,8% 41 38,7%
7 a 9 años 23 7,7% 5 6,4% 8 12,1% 3 6,4% 7 6,6%
10 a 12 años 28 9,4% 9 11,5% 11 16,7% 4 8,5% 4 3,8%
13 años y más 17 5,7% 4 5,1% 6 9,1% 2 4,3% 5 4,7%
NR 1 0,3% - - - - 1 2,1% - -
Fuente: DGIS/STP. Encuesta sobre Salud, Bienestar y Envejecimiento (SABE), Paraguay 2017.
CAPÍTULO 3. CAPÍTULO 3.
ENCUESTA SABE Principales Resultados JUNIO 2018SALUD, BIENESTAR Y ENVEJECIMIENTO ASUNCIÓN, PARAGUAY
28 29
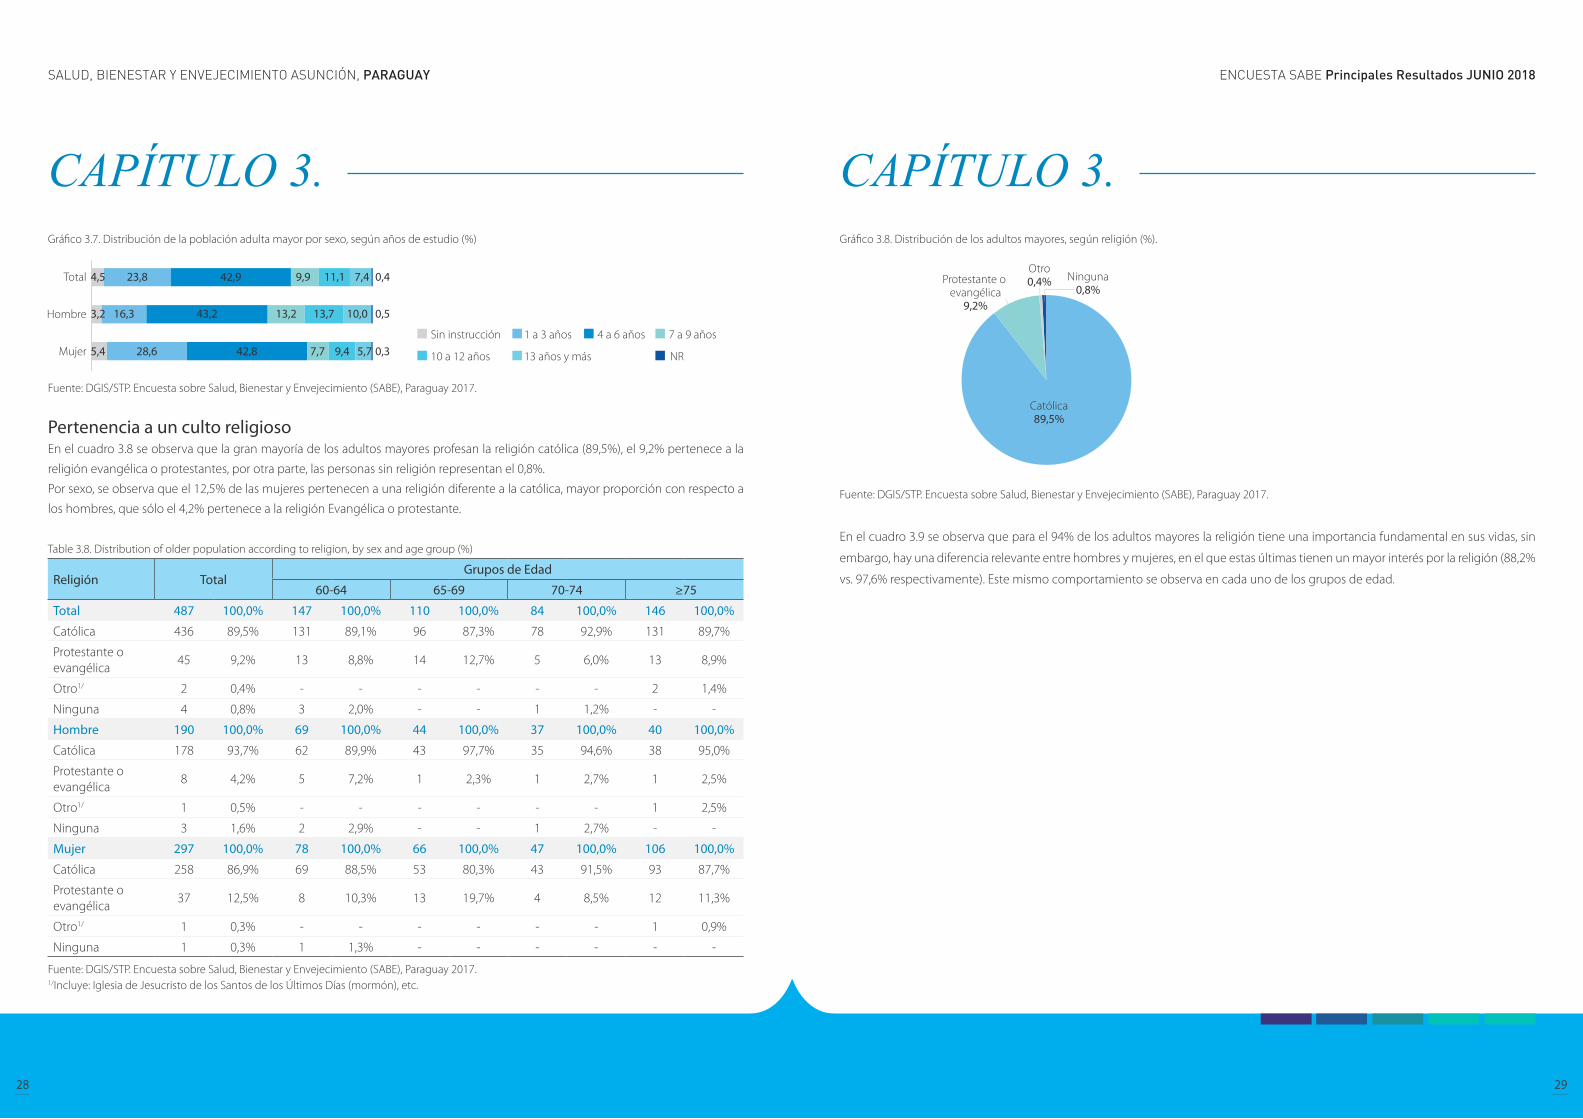
Gráfico 3.7. Distribución de la población adulta mayor por sexo, según años de estudio (%)
Fuente: DGIS/STP. Encuesta sobre Salud, Bienestar y Envejecimiento (SABE), Paraguay 2017.
Pertenencia a un culto religioso En el cuadro 3.8 se observa que la gran mayoría de los adultos mayores profesan la religión católica (89,5%), el 9,2% pertenece a la
religión evangélica o protestantes, por otra parte, las personas sin religión representan el 0,8%.
Por sexo, se observa que el 12,5% de las mujeres pertenecen a una religión diferente a la católica, mayor proporción con respecto a
los hombres, que sólo el 4,2% pertenece a la religión Evangélica o protestante.
Table 3.8. Distribution of older population according to religion, by sex and age group (%)
Religión TotalGrupos de Edad
60-64 65-69 70-74 ≥75
Total 487 100,0% 147 100,0% 110 100,0% 84 100,0% 146 100,0%
Católica 436 89,5% 131 89,1% 96 87,3% 78 92,9% 131 89,7%
Protestante o evangélica
45 9,2% 13 8,8% 14 12,7% 5 6,0% 13 8,9%
Otro1/ 2 0,4% - - - - - - 2 1,4%
Ninguna 4 0,8% 3 2,0% - - 1 1,2% - -
Hombre 190 100,0% 69 100,0% 44 100,0% 37 100,0% 40 100,0%
Católica 178 93,7% 62 89,9% 43 97,7% 35 94,6% 38 95,0%
Protestante o evangélica
8 4,2% 5 7,2% 1 2,3% 1 2,7% 1 2,5%
Otro1/ 1 0,5% - - - - - - 1 2,5%
Ninguna 3 1,6% 2 2,9% - - 1 2,7% - -
Mujer 297 100,0% 78 100,0% 66 100,0% 47 100,0% 106 100,0%
Católica 258 86,9% 69 88,5% 53 80,3% 43 91,5% 93 87,7%
Protestante o evangélica
37 12,5% 8 10,3% 13 19,7% 4 8,5% 12 11,3%
Otro1/ 1 0,3% - - - - - - 1 0,9%
Ninguna 1 0,3% 1 1,3% - - - - - -
Fuente: DGIS/STP. Encuesta sobre Salud, Bienestar y Envejecimiento (SABE), Paraguay 2017.1/Incluye: Iglesia de Jesucristo de los Santos de los Últimos Días (mormón), etc.
Gráfico 3.8. Distribución de los adultos mayores, según religión (%).
Fuente: DGIS/STP. Encuesta sobre Salud, Bienestar y Envejecimiento (SABE), Paraguay 2017.
En el cuadro 3.9 se observa que para el 94% de los adultos mayores la religión tiene una importancia fundamental en sus vidas, sin
embargo, hay una diferencia relevante entre hombres y mujeres, en el que estas últimas tienen un mayor interés por la religión (88,2%
vs. 97,6% respectivamente). Este mismo comportamiento se observa en cada uno de los grupos de edad.
CAPÍTULO 3. CAPÍTULO 3.
ENCUESTA SABE Principales Resultados JUNIO 2018SALUD, BIENESTAR Y ENVEJECIMIENTO ASUNCIÓN, PARAGUAY
30 31
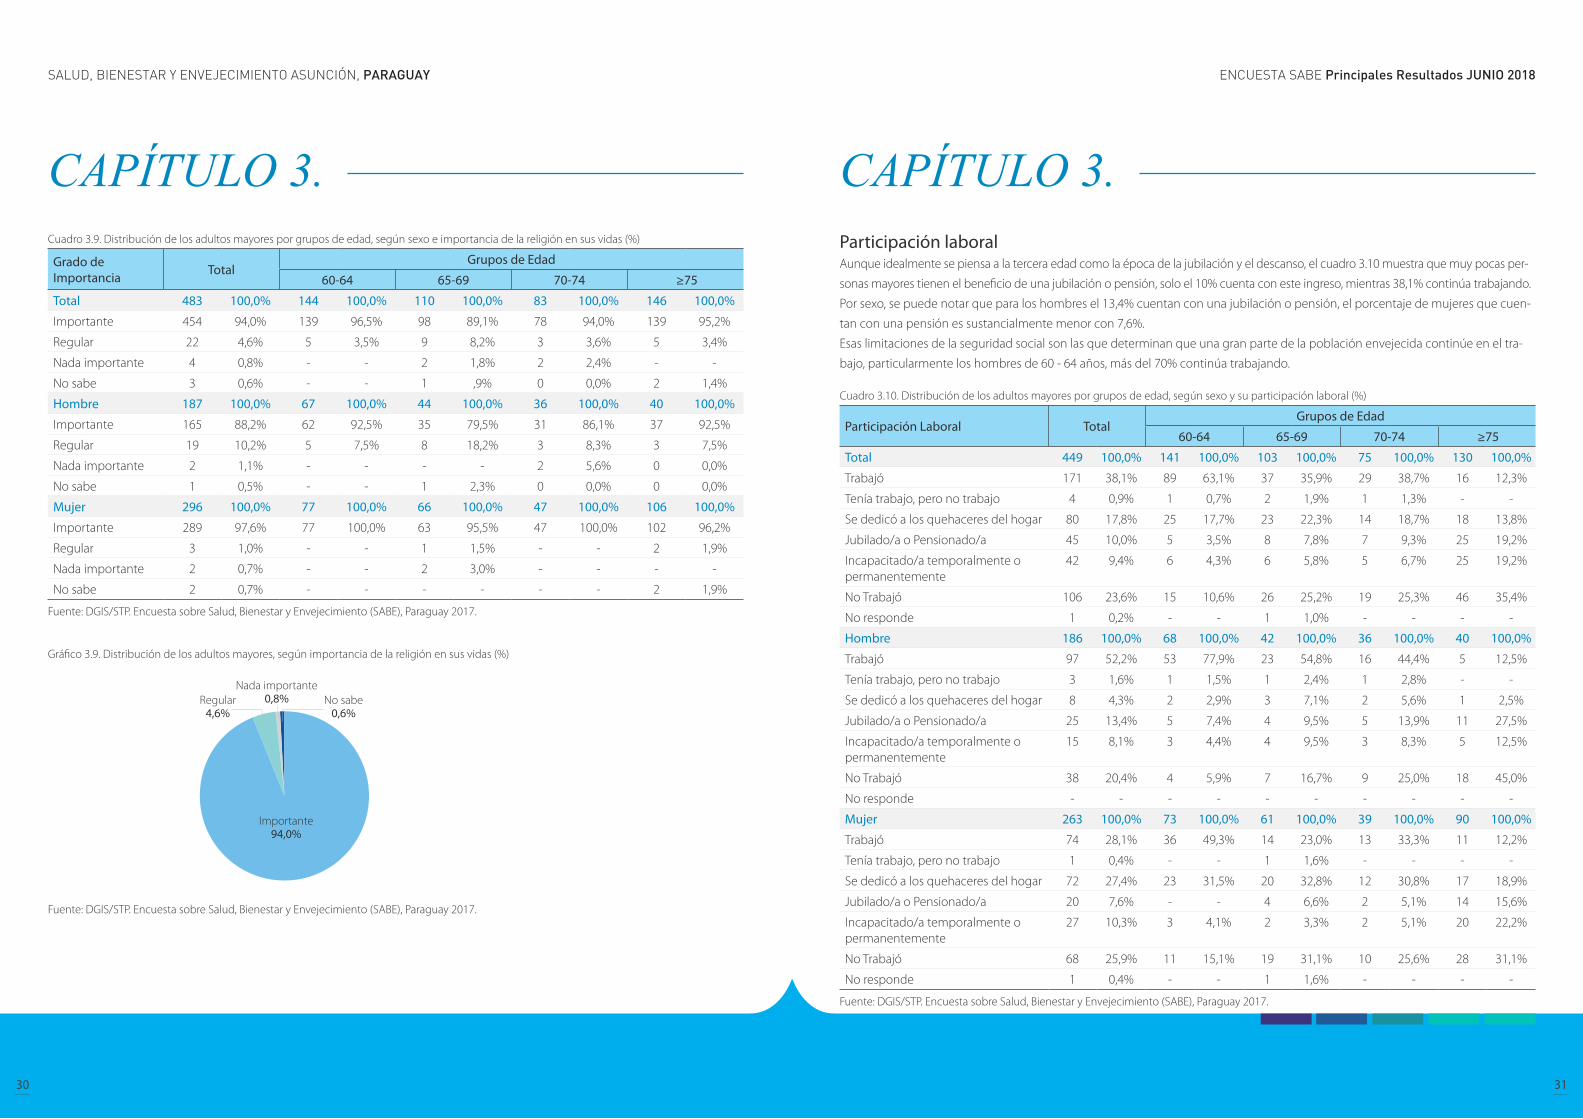
Cuadro 3.9. Distribución de los adultos mayores por grupos de edad, según sexo e importancia de la religión en sus vidas (%)
Grado de Importancia Total
Grupos de Edad
60-64 65-69 70-74 ≥75
Total 483 100,0% 144 100,0% 110 100,0% 83 100,0% 146 100,0%
Importante 454 94,0% 139 96,5% 98 89,1% 78 94,0% 139 95,2%
Regular 22 4,6% 5 3,5% 9 8,2% 3 3,6% 5 3,4%
Nada importante 4 0,8% - - 2 1,8% 2 2,4% - -
No sabe 3 0,6% - - 1 ,9% 0 0,0% 2 1,4%
Hombre 187 100,0% 67 100,0% 44 100,0% 36 100,0% 40 100,0%
Importante 165 88,2% 62 92,5% 35 79,5% 31 86,1% 37 92,5%
Regular 19 10,2% 5 7,5% 8 18,2% 3 8,3% 3 7,5%
Nada importante 2 1,1% - - - - 2 5,6% 0 0,0%
No sabe 1 0,5% - - 1 2,3% 0 0,0% 0 0,0%
Mujer 296 100,0% 77 100,0% 66 100,0% 47 100,0% 106 100,0%
Importante 289 97,6% 77 100,0% 63 95,5% 47 100,0% 102 96,2%
Regular 3 1,0% - - 1 1,5% - - 2 1,9%
Nada importante 2 0,7% - - 2 3,0% - - - -
No sabe 2 0,7% - - - - - - 2 1,9%
Fuente: DGIS/STP. Encuesta sobre Salud, Bienestar y Envejecimiento (SABE), Paraguay 2017.
Gráfico 3.9. Distribución de los adultos mayores, según importancia de la religión en sus vidas (%)
Fuente: DGIS/STP. Encuesta sobre Salud, Bienestar y Envejecimiento (SABE), Paraguay 2017.
Participación laboral Aunque idealmente se piensa a la tercera edad como la época de la jubilación y el descanso, el cuadro 3.10 muestra que muy pocas per-
sonas mayores tienen el beneficio de una jubilación o pensión, solo el 10% cuenta con este ingreso, mientras 38,1% continúa trabajando.
Por sexo, se puede notar que para los hombres el 13,4% cuentan con una jubilación o pensión, el porcentaje de mujeres que cuen-
tan con una pensión es sustancialmente menor con 7,6%.
Esas limitaciones de la seguridad social son las que determinan que una gran parte de la población envejecida continúe en el tra-
bajo, particularmente los hombres de 60 - 64 años, más del 70% continúa trabajando.
Cuadro 3.10. Distribución de los adultos mayores por grupos de edad, según sexo y su participación laboral (%)
Participación Laboral TotalGrupos de Edad
60-64 65-69 70-74 ≥75
Total 449 100,0% 141 100,0% 103 100,0% 75 100,0% 130 100,0%
Trabajó 171 38,1% 89 63,1% 37 35,9% 29 38,7% 16 12,3%
Tenía trabajo, pero no trabajo 4 0,9% 1 0,7% 2 1,9% 1 1,3% - -
Se dedicó a los quehaceres del hogar 80 17,8% 25 17,7% 23 22,3% 14 18,7% 18 13,8%
Jubilado/a o Pensionado/a 45 10,0% 5 3,5% 8 7,8% 7 9,3% 25 19,2%
Incapacitado/a temporalmente o permanentemente
42 9,4% 6 4,3% 6 5,8% 5 6,7% 25 19,2%
No Trabajó 106 23,6% 15 10,6% 26 25,2% 19 25,3% 46 35,4%
No responde 1 0,2% - - 1 1,0% - - - -
Hombre 186 100,0% 68 100,0% 42 100,0% 36 100,0% 40 100,0%
Trabajó 97 52,2% 53 77,9% 23 54,8% 16 44,4% 5 12,5%
Tenía trabajo, pero no trabajo 3 1,6% 1 1,5% 1 2,4% 1 2,8% - -
Se dedicó a los quehaceres del hogar 8 4,3% 2 2,9% 3 7,1% 2 5,6% 1 2,5%
Jubilado/a o Pensionado/a 25 13,4% 5 7,4% 4 9,5% 5 13,9% 11 27,5%
Incapacitado/a temporalmente o permanentemente
15 8,1% 3 4,4% 4 9,5% 3 8,3% 5 12,5%
No Trabajó 38 20,4% 4 5,9% 7 16,7% 9 25,0% 18 45,0%
No responde - - - - - - - - - -
Mujer 263 100,0% 73 100,0% 61 100,0% 39 100,0% 90 100,0%
Trabajó 74 28,1% 36 49,3% 14 23,0% 13 33,3% 11 12,2%
Tenía trabajo, pero no trabajo 1 0,4% - - 1 1,6% - - - -
Se dedicó a los quehaceres del hogar 72 27,4% 23 31,5% 20 32,8% 12 30,8% 17 18,9%
Jubilado/a o Pensionado/a 20 7,6% - - 4 6,6% 2 5,1% 14 15,6%
Incapacitado/a temporalmente o permanentemente
27 10,3% 3 4,1% 2 3,3% 2 5,1% 20 22,2%
No Trabajó 68 25,9% 11 15,1% 19 31,1% 10 25,6% 28 31,1%
No responde 1 0,4% - - 1 1,6% - - - -
Fuente: DGIS/STP. Encuesta sobre Salud, Bienestar y Envejecimiento (SABE), Paraguay 2017.
CAPÍTULO 3. CAPÍTULO 3.
ENCUESTA SABE Principales Resultados JUNIO 2018SALUD, BIENESTAR Y ENVEJECIMIENTO ASUNCIÓN, PARAGUAY
32 33
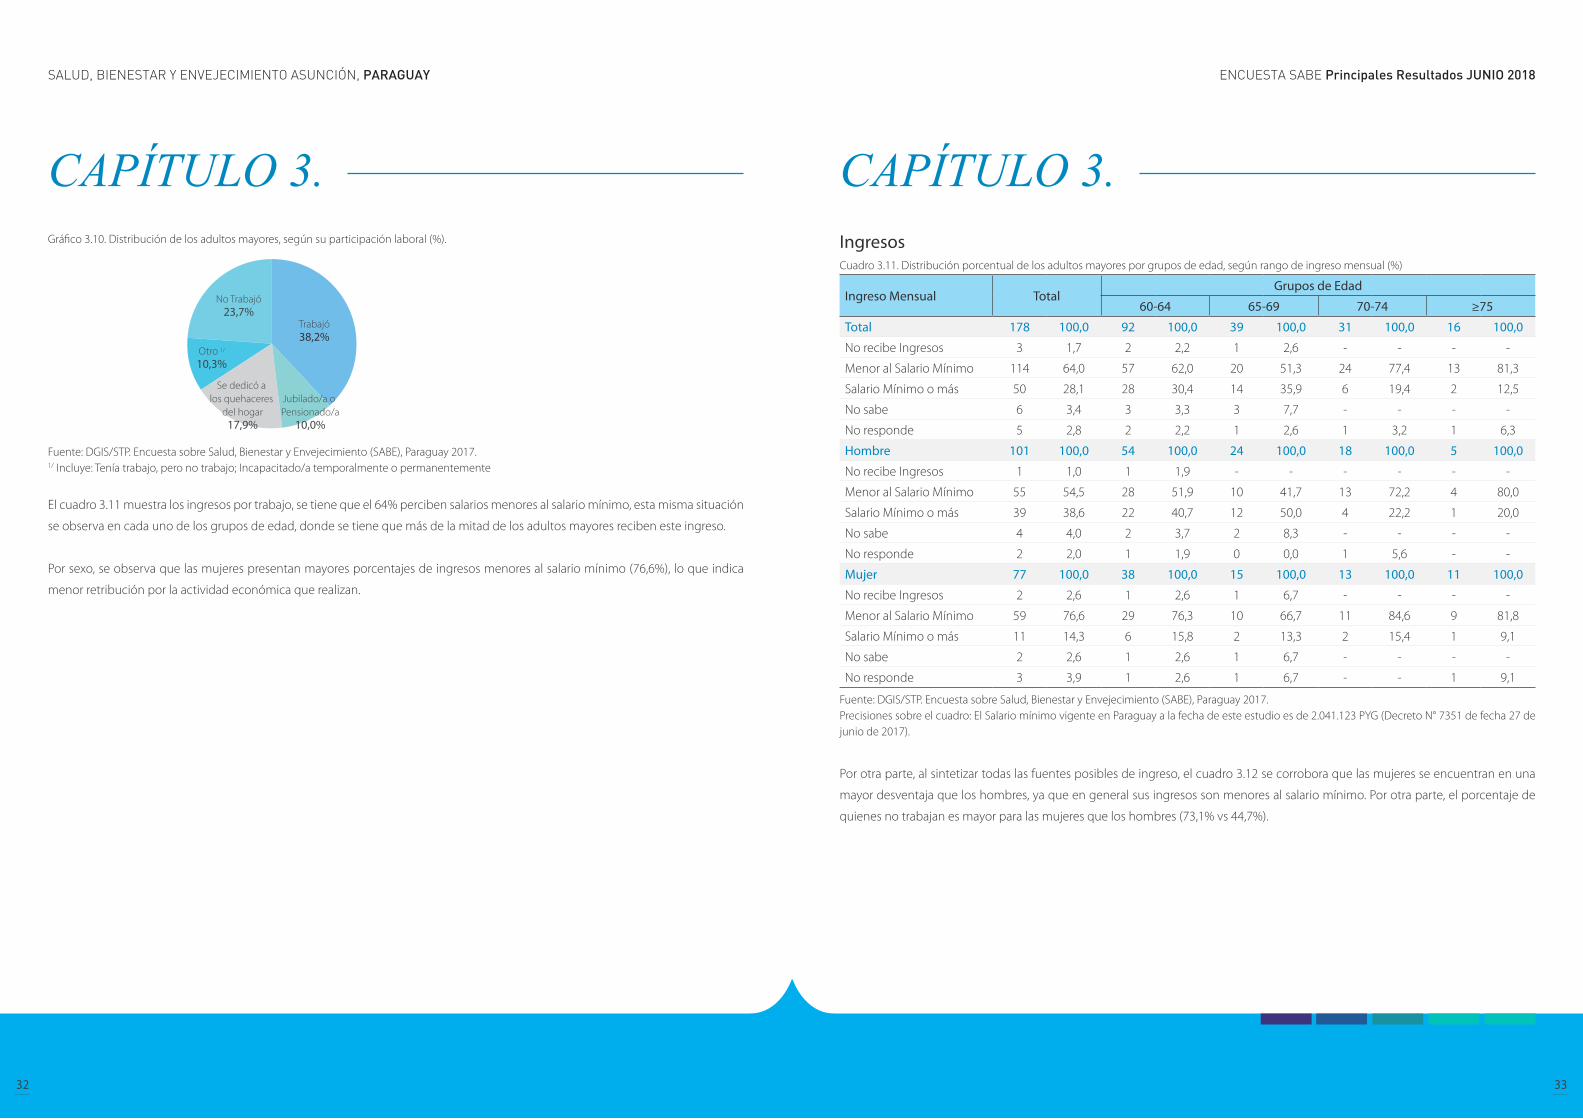
Gráfico 3.10. Distribución de los adultos mayores, según su participación laboral (%).
Fuente: DGIS/STP. Encuesta sobre Salud, Bienestar y Envejecimiento (SABE), Paraguay 2017.1/ Incluye: Tenía trabajo, pero no trabajo; Incapacitado/a temporalmente o permanentemente
El cuadro 3.11 muestra los ingresos por trabajo, se tiene que el 64% perciben salarios menores al salario mínimo, esta misma situación
se observa en cada uno de los grupos de edad, donde se tiene que más de la mitad de los adultos mayores reciben este ingreso.
Por sexo, se observa que las mujeres presentan mayores porcentajes de ingresos menores al salario mínimo (76,6%), lo que indica
menor retribución por la actividad económica que realizan.
IngresosCuadro 3.11. Distribución porcentual de los adultos mayores por grupos de edad, según rango de ingreso mensual (%)
Ingreso Mensual TotalGrupos de Edad
60-64 65-69 70-74 ≥75
Total 178 100,0 92 100,0 39 100,0 31 100,0 16 100,0
No recibe Ingresos 3 1,7 2 2,2 1 2,6 - - - -
Menor al Salario Mínimo 114 64,0 57 62,0 20 51,3 24 77,4 13 81,3
Salario Mínimo o más 50 28,1 28 30,4 14 35,9 6 19,4 2 12,5
No sabe 6 3,4 3 3,3 3 7,7 - - - -
No responde 5 2,8 2 2,2 1 2,6 1 3,2 1 6,3
Hombre 101 100,0 54 100,0 24 100,0 18 100,0 5 100,0
No recibe Ingresos 1 1,0 1 1,9 - - - - - -
Menor al Salario Mínimo 55 54,5 28 51,9 10 41,7 13 72,2 4 80,0
Salario Mínimo o más 39 38,6 22 40,7 12 50,0 4 22,2 1 20,0
No sabe 4 4,0 2 3,7 2 8,3 - - - -
No responde 2 2,0 1 1,9 0 0,0 1 5,6 - -
Mujer 77 100,0 38 100,0 15 100,0 13 100,0 11 100,0
No recibe Ingresos 2 2,6 1 2,6 1 6,7 - - - -
Menor al Salario Mínimo 59 76,6 29 76,3 10 66,7 11 84,6 9 81,8
Salario Mínimo o más 11 14,3 6 15,8 2 13,3 2 15,4 1 9,1
No sabe 2 2,6 1 2,6 1 6,7 - - - -
No responde 3 3,9 1 2,6 1 6,7 - - 1 9,1
Fuente: DGIS/STP. Encuesta sobre Salud, Bienestar y Envejecimiento (SABE), Paraguay 2017.Precisiones sobre el cuadro: El Salario mínimo vigente en Paraguay a la fecha de este estudio es de 2.041.123 PYG (Decreto N° 7351 de fecha 27 de junio de 2017).
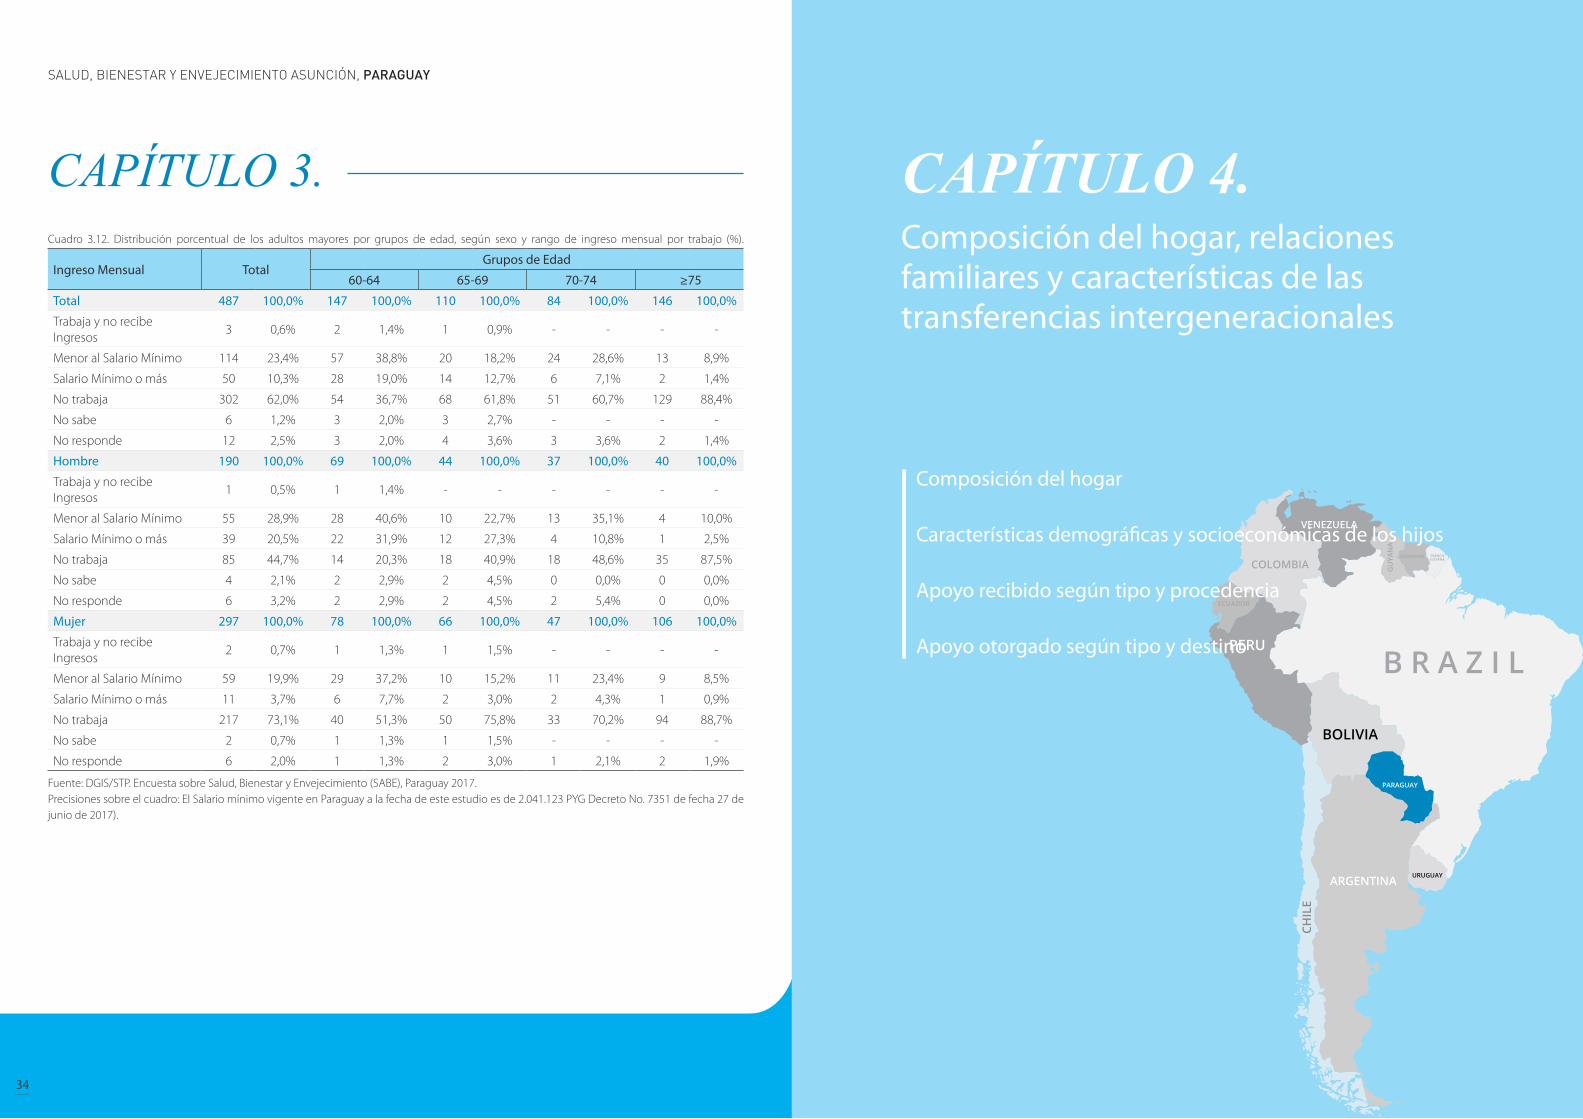
Por otra parte, al sintetizar todas las fuentes posibles de ingreso, el cuadro 3.12 se corrobora que las mujeres se encuentran en una
mayor desventaja que los hombres, ya que en general sus ingresos son menores al salario mínimo. Por otra parte, el porcentaje de
quienes no trabajan es mayor para las mujeres que los hombres (73,1% vs 44,7%).
CAPÍTULO 3. CAPÍTULO 3.
ENCUESTA SABE Principales Resultados JUNIO 2018SALUD, BIENESTAR Y ENVEJECIMIENTO ASUNCIÓN, PARAGUAY
34 35
CAPÍTULO 3. Cuadro 3.12. Distribución porcentual de los adultos mayores por grupos de edad, según sexo y rango de ingreso mensual por trabajo (%).
Ingreso Mensual TotalGrupos de Edad
60-64 65-69 70-74 ≥75
Total 487 100,0% 147 100,0% 110 100,0% 84 100,0% 146 100,0%
Trabaja y no recibe Ingresos
3 0,6% 2 1,4% 1 0,9% - - - -
Menor al Salario Mínimo 114 23,4% 57 38,8% 20 18,2% 24 28,6% 13 8,9%
Salario Mínimo o más 50 10,3% 28 19,0% 14 12,7% 6 7,1% 2 1,4%
No trabaja 302 62,0% 54 36,7% 68 61,8% 51 60,7% 129 88,4%
No sabe 6 1,2% 3 2,0% 3 2,7% - - - -
No responde 12 2,5% 3 2,0% 4 3,6% 3 3,6% 2 1,4%
Hombre 190 100,0% 69 100,0% 44 100,0% 37 100,0% 40 100,0%
Trabaja y no recibe Ingresos
1 0,5% 1 1,4% - - - - - -
Menor al Salario Mínimo 55 28,9% 28 40,6% 10 22,7% 13 35,1% 4 10,0%
Salario Mínimo o más 39 20,5% 22 31,9% 12 27,3% 4 10,8% 1 2,5%
No trabaja 85 44,7% 14 20,3% 18 40,9% 18 48,6% 35 87,5%
No sabe 4 2,1% 2 2,9% 2 4,5% 0 0,0% 0 0,0%
No responde 6 3,2% 2 2,9% 2 4,5% 2 5,4% 0 0,0%
Mujer 297 100,0% 78 100,0% 66 100,0% 47 100,0% 106 100,0%
Trabaja y no recibe Ingresos
2 0,7% 1 1,3% 1 1,5% - - - -
Menor al Salario Mínimo 59 19,9% 29 37,2% 10 15,2% 11 23,4% 9 8,5%
Salario Mínimo o más 11 3,7% 6 7,7% 2 3,0% 2 4,3% 1 0,9%
No trabaja 217 73,1% 40 51,3% 50 75,8% 33 70,2% 94 88,7%
No sabe 2 0,7% 1 1,3% 1 1,5% - - - -
No responde 6 2,0% 1 1,3% 2 3,0% 1 2,1% 2 1,9%
Fuente: DGIS/STP. Encuesta sobre Salud, Bienestar y Envejecimiento (SABE), Paraguay 2017.Precisiones sobre el cuadro: El Salario mínimo vigente en Paraguay a la fecha de este estudio es de 2.041.123 PYG Decreto No. 7351 de fecha 27 de junio de 2017).
CAPÍTULO 4. Composición del hogar, relaciones familiares y características de las transferencias intergeneracionales
Composición del hogar
Características demográficas y socioeconómicas de los hijos
Apoyo recibido según tipo y procedencia
Apoyo otorgado según tipo y destino

ENCUESTA SABE Principales Resultados JUNIO 2018SALUD, BIENESTAR Y ENVEJECIMIENTO ASUNCIÓN, PARAGUAY
36 37
CAPÍTULO 4. Composición del hogar, relaciones familiares y características de las transferencias intergeneracionales
Composición del hogar La composición del hogar es un factor importante a la hora de analizar la situación en que se encuentra la persona adulta mayor. El
cuadro 4.1 muestra la composición actual de los hogares donde viven los adultos mayores; el 36,3% vive con sus Hijos no casados,
seguido de los que viven con sus “Hijos casados” (21,6%), y en tercer lugar, los que viven con otras personas (17,2%) que incluye; otros
parientes, no parientes, hijos separados e hijos viudos. Además, el 14,7% declaró que vive solo, y uno de cada 10 que vive “solo con
su pareja”.
Los hombres que viven con los “Hijos no casados” tienen mayor proporción en los grupos de 60-64, 65-69 y 70-74, pero el porcentaje
es menor para el grupo de 75 años y más. De igual manera, para el grupo de mujeres, la categoría “Hijos no casados” es la que presenta
la mayor proporción en cada grupo de edad, siendo menor el porcentaje para el grupo de 75 años y más.
Para los hombres, la proporción de adultos mayores que viven “solo con su pareja” es variable, ya que de 9,0% para el grupo de 60-64
años, pasa a 15,9% para 65-69 años, descendiendo nuevamente a 13,9% para el grupo de 70-74 años y 13,2% para 75 y más años de
edad. Para el caso de las mujeres, muestra una tendencia descendente; de 11,5% para el grupo de 60-64 se redujo a solo el 4,7% para
los de 75 años y más.
CAPÍTULO 4. Cuadro 4.1. Distribución de la población adulta mayor de acuerdo a la composición actual del hogar por grupos de edad, según sexo (%)
Composición actual del hogar Total
Grupos de edad
60-64 65-69 70-74 ≥75
Total 482 100,0% 145 100,0% 110 100,0% 83 100,0% 144 100,0%
Solo 71 14,7% 17 11,7% 19 17,3% 12 14,5% 23 16,0%
Solo con su pareja 49 10,2% 15 10,3% 14 12,7% 10 12,0% 10 6,9%
Hijos no casados 175 36,3% 69 47,6% 44 40,0% 28 33,7% 34 23,6%
Hijos casados 104 21,6% 28 19,3% 22 20,0% 19 22,9% 35 24,3%
Otros 1/ 83 17,2% 16 11,0% 11 10,0% 14 16,9% 42 29,2%
Hombre 185 100,0% 67 100,0% 44 100,0% 36 100,0% 38 100,0%
Solo 29 15,7% 11 16,4% 4 9,1% 7 19,4% 7 18,4%
Solo con su pareja 23 12,4% 6 9,0% 7 15,9% 5 13,9% 5 13,2%
Hijos no casados 74 40,0% 34 50,7% 22 50,0% 12 33,3% 6 15,8%
Hijos casados 37 20,0% 10 14,9% 9 20,5% 8 22,2% 10 26,3%
Otros 1/ 22 11,9% 6 9,0% 2 4,5% 4 11,1% 10 26,3%
Mujer 297 100,0% 78 100,0% 66 100,0% 47 100,0% 106 100,0%
Solo 42 14,1% 6 7,7% 15 22,7% 5 10,6% 16 15,1%
Solo con su pareja 26 8,8% 9 11,5% 7 10,6% 5 10,6% 5 4,7%
Hijos no casados 101 34,0% 35 44,9% 22 33,3% 16 34,0% 28 26,4%
Hijos casados 67 22,6% 18 23,1% 13 19,7% 11 23,4% 25 23,6%
Otros 1/ 61 20,5% 10 12,8% 9 13,6% 10 21,3% 32 30,2%
Fuente: DGIS/STP. Encuesta sobre Salud, Bienestar y Envejecimiento (SABE). Paraguay 2017.1/ Incluye: Otros parientes, no parientes, hijos separados, viudos.
Gráfico 4.1. Población adulta mayor por sexo, según la composición actual del hogar (%)
Fuente: DGIS/STP. Encuesta sobre Salud, Bienestar y Envejecimiento (SABE), Paraguay 2017.1/ Incluye: Otros parientes, no parientes, hijos separados, viudos.
ENCUESTA SABE Principales Resultados JUNIO 2018SALUD, BIENESTAR Y ENVEJECIMIENTO ASUNCIÓN, PARAGUAY
38 39
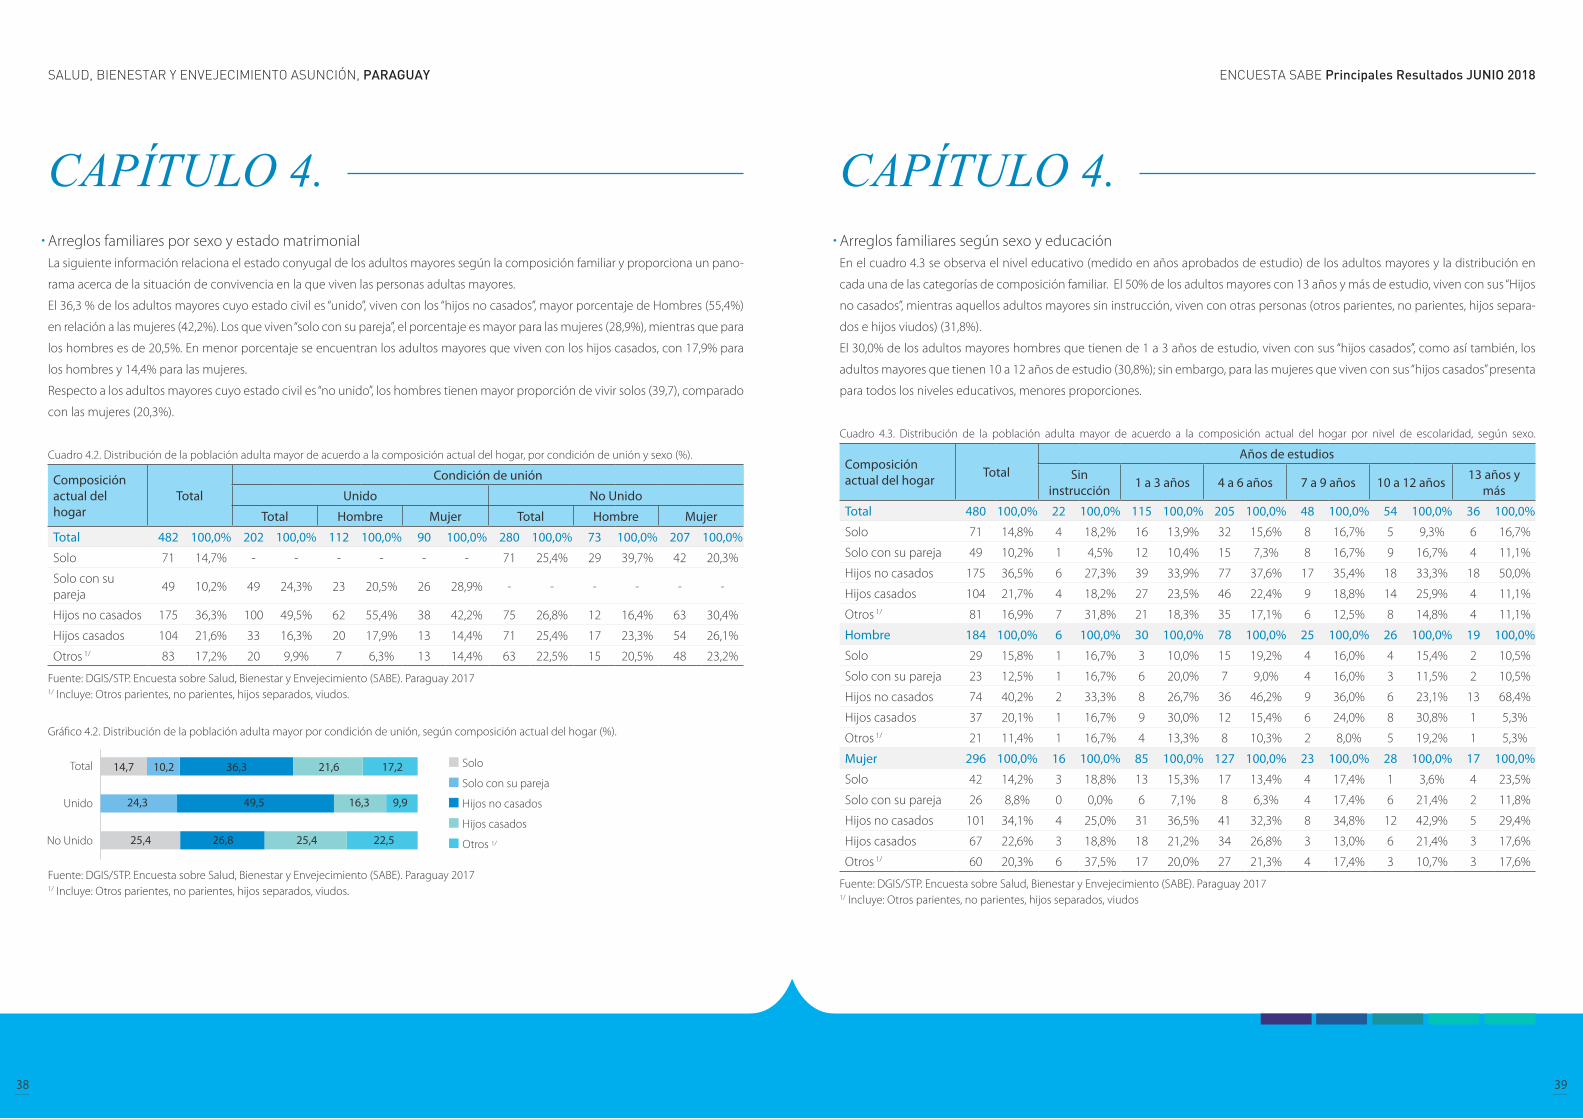
CAPÍTULO 4. Arreglos familiares por sexo y estado matrimonialLa siguiente información relaciona el estado conyugal de los adultos mayores según la composición familiar y proporciona un pano-
rama acerca de la situación de convivencia en la que viven las personas adultas mayores.
El 36,3 % de los adultos mayores cuyo estado civil es “unido”, viven con los “hijos no casados”, mayor porcentaje de Hombres (55,4%)
en relación a las mujeres (42,2%). Los que viven “solo con su pareja”, el porcentaje es mayor para las mujeres (28,9%), mientras que para
los hombres es de 20,5%. En menor porcentaje se encuentran los adultos mayores que viven con los hijos casados, con 17,9% para
los hombres y 14,4% para las mujeres.
Respecto a los adultos mayores cuyo estado civil es “no unido”, los hombres tienen mayor proporción de vivir solos (39,7), comparado
con las mujeres (20,3%).
Cuadro 4.2. Distribución de la población adulta mayor de acuerdo a la composición actual del hogar, por condición de unión y sexo (%).
Composición actual del hogar
Total
Condición de unión
Unido No Unido
Total Hombre Mujer Total Hombre Mujer
Total 482 100,0% 202 100,0% 112 100,0% 90 100,0% 280 100,0% 73 100,0% 207 100,0%
Solo 71 14,7% - - - - - - 71 25,4% 29 39,7% 42 20,3%
Solo con su pareja
49 10,2% 49 24,3% 23 20,5% 26 28,9% - - - - - -
Hijos no casados 175 36,3% 100 49,5% 62 55,4% 38 42,2% 75 26,8% 12 16,4% 63 30,4%
Hijos casados 104 21,6% 33 16,3% 20 17,9% 13 14,4% 71 25,4% 17 23,3% 54 26,1%
Otros 1/ 83 17,2% 20 9,9% 7 6,3% 13 14,4% 63 22,5% 15 20,5% 48 23,2%
Fuente: DGIS/STP. Encuesta sobre Salud, Bienestar y Envejecimiento (SABE). Paraguay 20171/ Incluye: Otros parientes, no parientes, hijos separados, viudos.
Gráfico 4.2. Distribución de la población adulta mayor por condición de unión, según composición actual del hogar (%).
Fuente: DGIS/STP. Encuesta sobre Salud, Bienestar y Envejecimiento (SABE). Paraguay 20171/ Incluye: Otros parientes, no parientes, hijos separados, viudos.
CAPÍTULO 4. Arreglos familiares según sexo y educación En el cuadro 4.3 se observa el nivel educativo (medido en años aprobados de estudio) de los adultos mayores y la distribución en
cada una de las categorías de composición familiar. El 50% de los adultos mayores con 13 años y más de estudio, viven con sus “Hijos
no casados”, mientras aquellos adultos mayores sin instrucción, viven con otras personas (otros parientes, no parientes, hijos separa-
dos e hijos viudos) (31,8%).
El 30,0% de los adultos mayores hombres que tienen de 1 a 3 años de estudio, viven con sus “hijos casados”, como así también, los
adultos mayores que tienen 10 a 12 años de estudio (30,8%); sin embargo, para las mujeres que viven con sus “hijos casados” presenta
para todos los niveles educativos, menores proporciones.
Cuadro 4.3. Distribución de la población adulta mayor de acuerdo a la composición actual del hogar por nivel de escolaridad, según sexo.
Composición actual del hogar Total
Años de estudios
Sin instrucción 1 a 3 años 4 a 6 años 7 a 9 años 10 a 12 años 13 años y
más
Total 480 100,0% 22 100,0% 115 100,0% 205 100,0% 48 100,0% 54 100,0% 36 100,0%
Solo 71 14,8% 4 18,2% 16 13,9% 32 15,6% 8 16,7% 5 9,3% 6 16,7%
Solo con su pareja 49 10,2% 1 4,5% 12 10,4% 15 7,3% 8 16,7% 9 16,7% 4 11,1%
Hijos no casados 175 36,5% 6 27,3% 39 33,9% 77 37,6% 17 35,4% 18 33,3% 18 50,0%
Hijos casados 104 21,7% 4 18,2% 27 23,5% 46 22,4% 9 18,8% 14 25,9% 4 11,1%
Otros 1/ 81 16,9% 7 31,8% 21 18,3% 35 17,1% 6 12,5% 8 14,8% 4 11,1%
Hombre 184 100,0% 6 100,0% 30 100,0% 78 100,0% 25 100,0% 26 100,0% 19 100,0%
Solo 29 15,8% 1 16,7% 3 10,0% 15 19,2% 4 16,0% 4 15,4% 2 10,5%
Solo con su pareja 23 12,5% 1 16,7% 6 20,0% 7 9,0% 4 16,0% 3 11,5% 2 10,5%
Hijos no casados 74 40,2% 2 33,3% 8 26,7% 36 46,2% 9 36,0% 6 23,1% 13 68,4%
Hijos casados 37 20,1% 1 16,7% 9 30,0% 12 15,4% 6 24,0% 8 30,8% 1 5,3%
Otros 1/ 21 11,4% 1 16,7% 4 13,3% 8 10,3% 2 8,0% 5 19,2% 1 5,3%
Mujer 296 100,0% 16 100,0% 85 100,0% 127 100,0% 23 100,0% 28 100,0% 17 100,0%
Solo 42 14,2% 3 18,8% 13 15,3% 17 13,4% 4 17,4% 1 3,6% 4 23,5%
Solo con su pareja 26 8,8% 0 0,0% 6 7,1% 8 6,3% 4 17,4% 6 21,4% 2 11,8%
Hijos no casados 101 34,1% 4 25,0% 31 36,5% 41 32,3% 8 34,8% 12 42,9% 5 29,4%
Hijos casados 67 22,6% 3 18,8% 18 21,2% 34 26,8% 3 13,0% 6 21,4% 3 17,6%
Otros 1/ 60 20,3% 6 37,5% 17 20,0% 27 21,3% 4 17,4% 3 10,7% 3 17,6%
Fuente: DGIS/STP. Encuesta sobre Salud, Bienestar y Envejecimiento (SABE). Paraguay 20171/ Incluye: Otros parientes, no parientes, hijos separados, viudos
ENCUESTA SABE Principales Resultados JUNIO 2018SALUD, BIENESTAR Y ENVEJECIMIENTO ASUNCIÓN, PARAGUAY
40 41
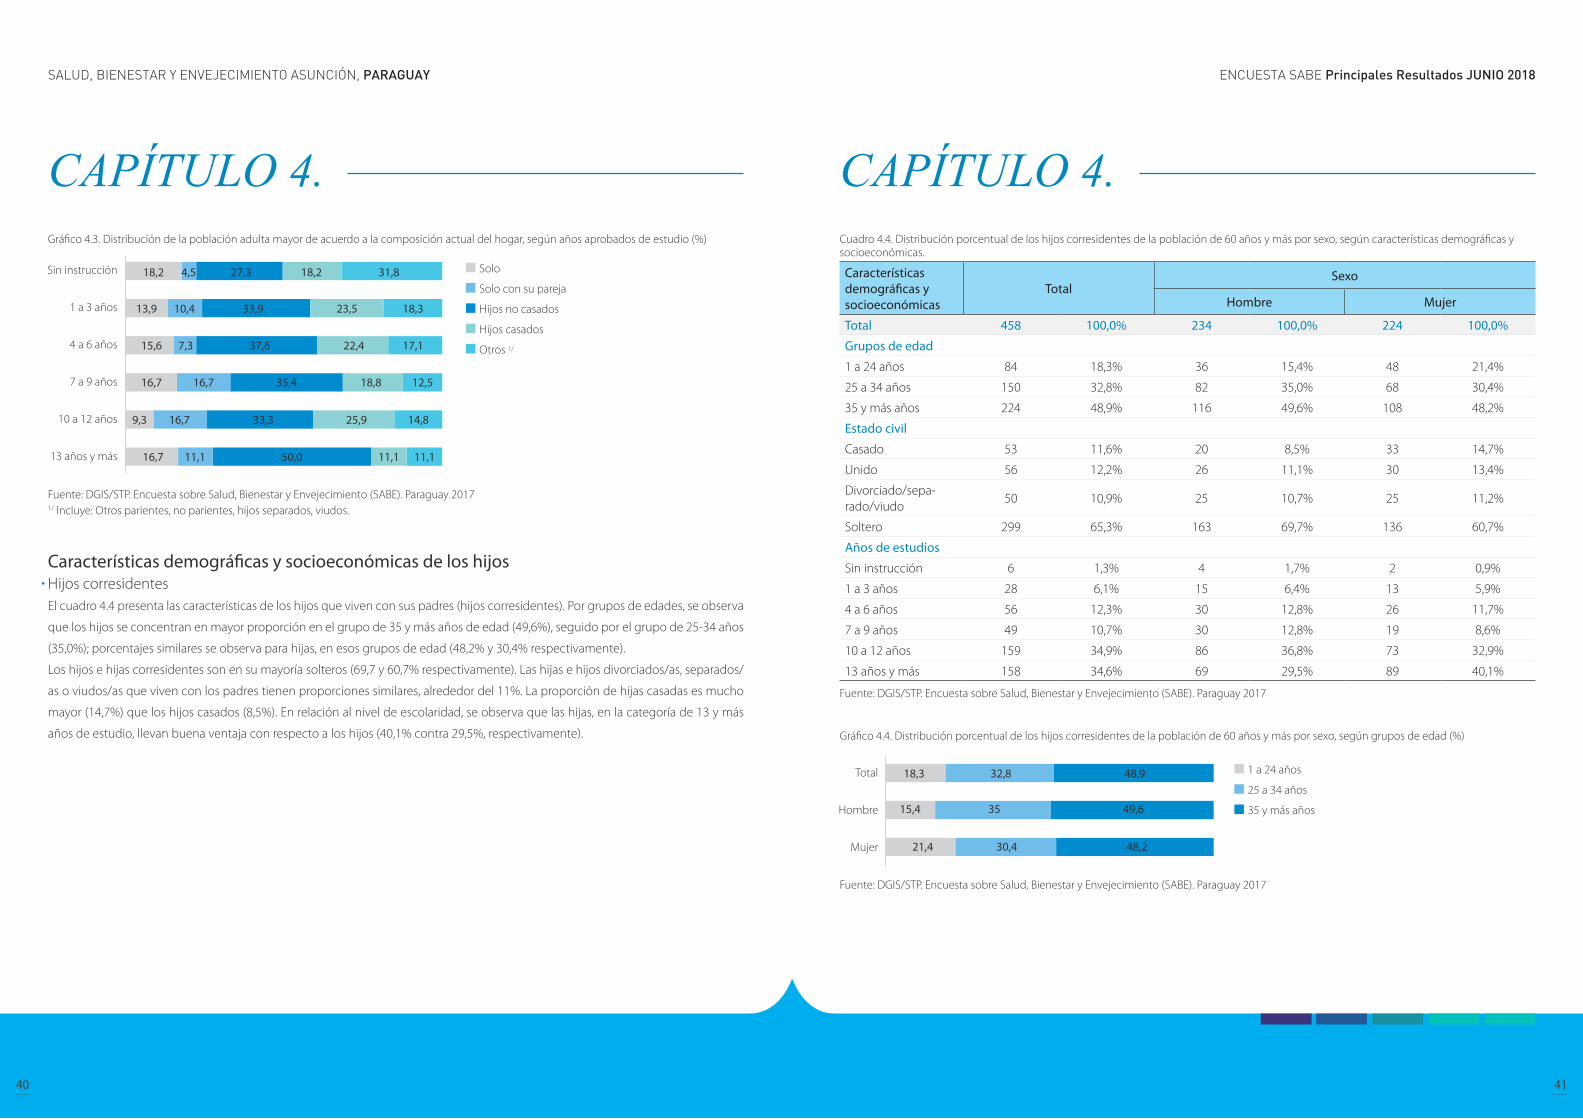
CAPÍTULO 4. Gráfico 4.3. Distribución de la población adulta mayor de acuerdo a la composición actual del hogar, según años aprobados de estudio (%)
Fuente: DGIS/STP. Encuesta sobre Salud, Bienestar y Envejecimiento (SABE). Paraguay 20171/ Incluye: Otros parientes, no parientes, hijos separados, viudos.
Características demográficas y socioeconómicas de los hijos Hijos corresidentes El cuadro 4.4 presenta las características de los hijos que viven con sus padres (hijos corresidentes). Por grupos de edades, se observa
que los hijos se concentran en mayor proporción en el grupo de 35 y más años de edad (49,6%), seguido por el grupo de 25-34 años
(35,0%); porcentajes similares se observa para hijas, en esos grupos de edad (48,2% y 30,4% respectivamente).
Los hijos e hijas corresidentes son en su mayoría solteros (69,7 y 60,7% respectivamente). Las hijas e hijos divorciados/as, separados/
as o viudos/as que viven con los padres tienen proporciones similares, alrededor del 11%. La proporción de hijas casadas es mucho
mayor (14,7%) que los hijos casados (8,5%). En relación al nivel de escolaridad, se observa que las hijas, en la categoría de 13 y más
años de estudio, llevan buena ventaja con respecto a los hijos (40,1% contra 29,5%, respectivamente).
CAPÍTULO 4. Cuadro 4.4. Distribución porcentual de los hijos corresidentes de la población de 60 años y más por sexo, según características demográficas y socioeconómicas.
Características demográficas y socioeconómicas
TotalSexo
Hombre Mujer
Total 458 100,0% 234 100,0% 224 100,0%
Grupos de edad
1 a 24 años 84 18,3% 36 15,4% 48 21,4%
25 a 34 años 150 32,8% 82 35,0% 68 30,4%
35 y más años 224 48,9% 116 49,6% 108 48,2%
Estado civil
Casado 53 11,6% 20 8,5% 33 14,7%
Unido 56 12,2% 26 11,1% 30 13,4%
Divorciado/sepa-rado/viudo
50 10,9% 25 10,7% 25 11,2%
Soltero 299 65,3% 163 69,7% 136 60,7%
Años de estudios
Sin instrucción 6 1,3% 4 1,7% 2 0,9%
1 a 3 años 28 6,1% 15 6,4% 13 5,9%
4 a 6 años 56 12,3% 30 12,8% 26 11,7%
7 a 9 años 49 10,7% 30 12,8% 19 8,6%
10 a 12 años 159 34,9% 86 36,8% 73 32,9%
13 años y más 158 34,6% 69 29,5% 89 40,1%
Fuente: DGIS/STP. Encuesta sobre Salud, Bienestar y Envejecimiento (SABE). Paraguay 2017
Gráfico 4.4. Distribución porcentual de los hijos corresidentes de la población de 60 años y más por sexo, según grupos de edad (%)
Fuente: DGIS/STP. Encuesta sobre Salud, Bienestar y Envejecimiento (SABE). Paraguay 2017
ENCUESTA SABE Principales Resultados JUNIO 2018SALUD, BIENESTAR Y ENVEJECIMIENTO ASUNCIÓN, PARAGUAY
42 43
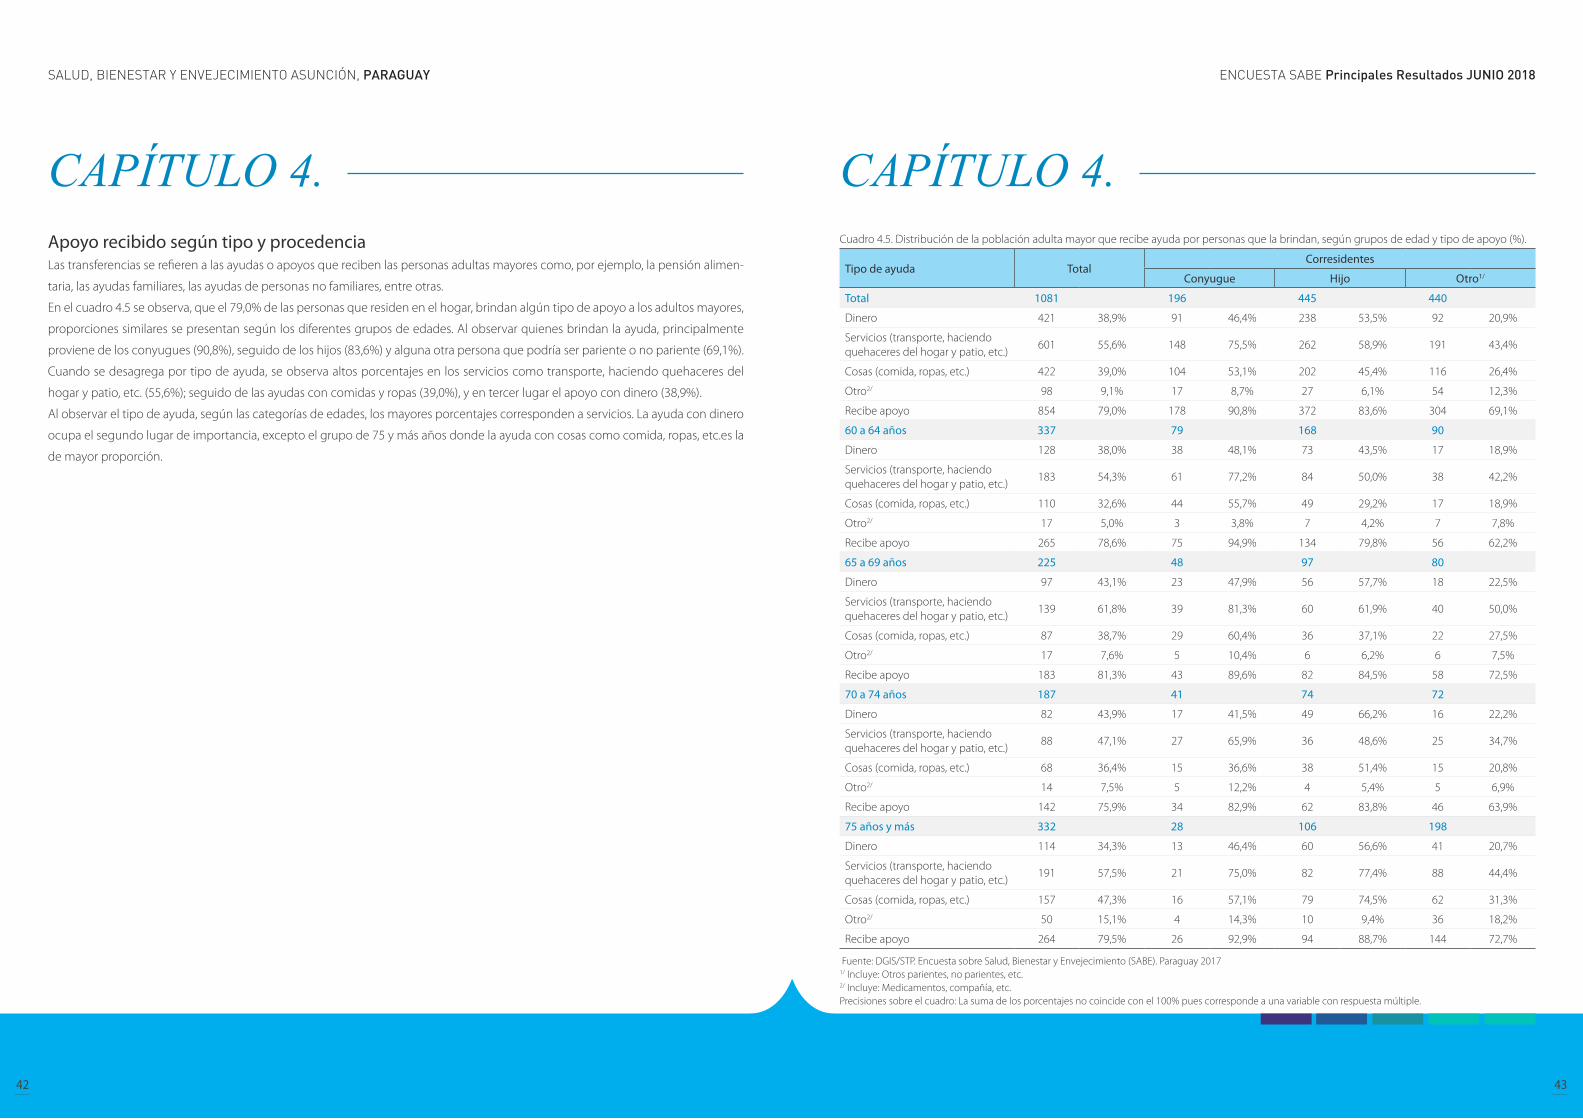
CAPÍTULO 4. Apoyo recibido según tipo y procedencia Las transferencias se refieren a las ayudas o apoyos que reciben las personas adultas mayores como, por ejemplo, la pensión alimen-
taria, las ayudas familiares, las ayudas de personas no familiares, entre otras.
En el cuadro 4.5 se observa, que el 79,0% de las personas que residen en el hogar, brindan algún tipo de apoyo a los adultos mayores,
proporciones similares se presentan según los diferentes grupos de edades. Al observar quienes brindan la ayuda, principalmente
proviene de los conyugues (90,8%), seguido de los hijos (83,6%) y alguna otra persona que podría ser pariente o no pariente (69,1%).
Cuando se desagrega por tipo de ayuda, se observa altos porcentajes en los servicios como transporte, haciendo quehaceres del
hogar y patio, etc. (55,6%); seguido de las ayudas con comidas y ropas (39,0%), y en tercer lugar el apoyo con dinero (38,9%).
Al observar el tipo de ayuda, según las categorías de edades, los mayores porcentajes corresponden a servicios. La ayuda con dinero
ocupa el segundo lugar de importancia, excepto el grupo de 75 y más años donde la ayuda con cosas como comida, ropas, etc.es la
de mayor proporción.
CAPÍTULO 4. Cuadro 4.5. Distribución de la población adulta mayor que recibe ayuda por personas que la brindan, según grupos de edad y tipo de apoyo (%).
Tipo de ayuda TotalCorresidentes
Conyugue Hijo Otro1/
Total 1081 196 445 440
Dinero 421 38,9% 91 46,4% 238 53,5% 92 20,9%
Servicios (transporte, haciendo quehaceres del hogar y patio, etc.)
601 55,6% 148 75,5% 262 58,9% 191 43,4%
Cosas (comida, ropas, etc.) 422 39,0% 104 53,1% 202 45,4% 116 26,4%
Otro2/ 98 9,1% 17 8,7% 27 6,1% 54 12,3%
Recibe apoyo 854 79,0% 178 90,8% 372 83,6% 304 69,1%
60 a 64 años 337 79 168 90
Dinero 128 38,0% 38 48,1% 73 43,5% 17 18,9%
Servicios (transporte, haciendo quehaceres del hogar y patio, etc.)
183 54,3% 61 77,2% 84 50,0% 38 42,2%
Cosas (comida, ropas, etc.) 110 32,6% 44 55,7% 49 29,2% 17 18,9%
Otro2/ 17 5,0% 3 3,8% 7 4,2% 7 7,8%
Recibe apoyo 265 78,6% 75 94,9% 134 79,8% 56 62,2%
65 a 69 años 225 48 97 80
Dinero 97 43,1% 23 47,9% 56 57,7% 18 22,5%
Servicios (transporte, haciendo quehaceres del hogar y patio, etc.)
139 61,8% 39 81,3% 60 61,9% 40 50,0%
Cosas (comida, ropas, etc.) 87 38,7% 29 60,4% 36 37,1% 22 27,5%
Otro2/ 17 7,6% 5 10,4% 6 6,2% 6 7,5%
Recibe apoyo 183 81,3% 43 89,6% 82 84,5% 58 72,5%
70 a 74 años 187 41 74 72
Dinero 82 43,9% 17 41,5% 49 66,2% 16 22,2%
Servicios (transporte, haciendo quehaceres del hogar y patio, etc.)
88 47,1% 27 65,9% 36 48,6% 25 34,7%
Cosas (comida, ropas, etc.) 68 36,4% 15 36,6% 38 51,4% 15 20,8%
Otro2/ 14 7,5% 5 12,2% 4 5,4% 5 6,9%
Recibe apoyo 142 75,9% 34 82,9% 62 83,8% 46 63,9%
75 años y más 332 28 106 198
Dinero 114 34,3% 13 46,4% 60 56,6% 41 20,7%
Servicios (transporte, haciendo quehaceres del hogar y patio, etc.)
191 57,5% 21 75,0% 82 77,4% 88 44,4%
Cosas (comida, ropas, etc.) 157 47,3% 16 57,1% 79 74,5% 62 31,3%
Otro2/ 50 15,1% 4 14,3% 10 9,4% 36 18,2%
Recibe apoyo 264 79,5% 26 92,9% 94 88,7% 144 72,7%
Fuente: DGIS/STP. Encuesta sobre Salud, Bienestar y Envejecimiento (SABE). Paraguay 20171/ Incluye: Otros parientes, no parientes, etc.2/ Incluye: Medicamentos, compañía, etc.Precisiones sobre el cuadro: La suma de los porcentajes no coincide con el 100% pues corresponde a una variable con respuesta múltiple.
ENCUESTA SABE Principales Resultados JUNIO 2018SALUD, BIENESTAR Y ENVEJECIMIENTO ASUNCIÓN, PARAGUAY
44 45
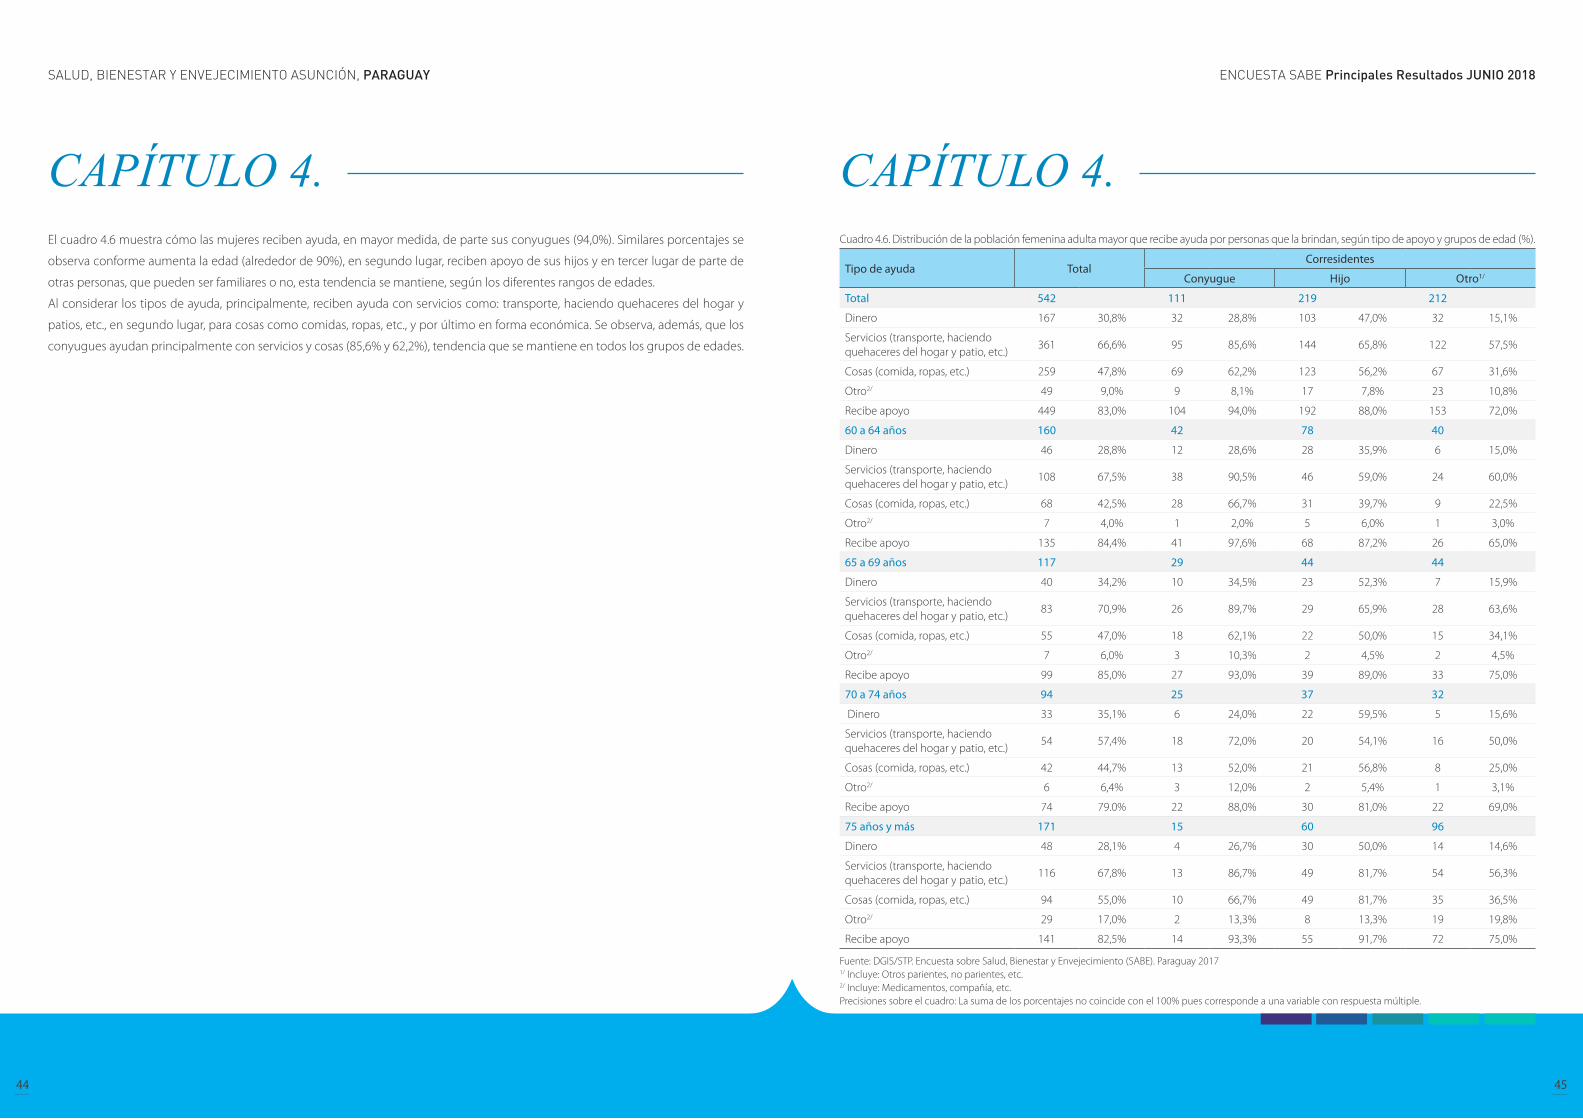
CAPÍTULO 4. El cuadro 4.6 muestra cómo las mujeres reciben ayuda, en mayor medida, de parte sus conyugues (94,0%). Similares porcentajes se
observa conforme aumenta la edad (alrededor de 90%), en segundo lugar, reciben apoyo de sus hijos y en tercer lugar de parte de
otras personas, que pueden ser familiares o no, esta tendencia se mantiene, según los diferentes rangos de edades.
Al considerar los tipos de ayuda, principalmente, reciben ayuda con servicios como: transporte, haciendo quehaceres del hogar y
patios, etc., en segundo lugar, para cosas como comidas, ropas, etc., y por último en forma económica. Se observa, además, que los
conyugues ayudan principalmente con servicios y cosas (85,6% y 62,2%), tendencia que se mantiene en todos los grupos de edades.
CAPÍTULO 4. Cuadro 4.6. Distribución de la población femenina adulta mayor que recibe ayuda por personas que la brindan, según tipo de apoyo y grupos de edad (%).
Tipo de ayuda TotalCorresidentes
Conyugue Hijo Otro1/
Total 542 111 219 212
Dinero 167 30,8% 32 28,8% 103 47,0% 32 15,1%
Servicios (transporte, haciendo quehaceres del hogar y patio, etc.)
361 66,6% 95 85,6% 144 65,8% 122 57,5%
Cosas (comida, ropas, etc.) 259 47,8% 69 62,2% 123 56,2% 67 31,6%
Otro2/ 49 9,0% 9 8,1% 17 7,8% 23 10,8%
Recibe apoyo 449 83,0% 104 94,0% 192 88,0% 153 72,0%
60 a 64 años 160 42 78 40
Dinero 46 28,8% 12 28,6% 28 35,9% 6 15,0%
Servicios (transporte, haciendo quehaceres del hogar y patio, etc.)
108 67,5% 38 90,5% 46 59,0% 24 60,0%
Cosas (comida, ropas, etc.) 68 42,5% 28 66,7% 31 39,7% 9 22,5%
Otro2/ 7 4,0% 1 2,0% 5 6,0% 1 3,0%
Recibe apoyo 135 84,4% 41 97,6% 68 87,2% 26 65,0%
65 a 69 años 117 29 44 44
Dinero 40 34,2% 10 34,5% 23 52,3% 7 15,9%
Servicios (transporte, haciendo quehaceres del hogar y patio, etc.)
83 70,9% 26 89,7% 29 65,9% 28 63,6%
Cosas (comida, ropas, etc.) 55 47,0% 18 62,1% 22 50,0% 15 34,1%
Otro2/ 7 6,0% 3 10,3% 2 4,5% 2 4,5%
Recibe apoyo 99 85,0% 27 93,0% 39 89,0% 33 75,0%
70 a 74 años 94 25 37 32
Dinero 33 35,1% 6 24,0% 22 59,5% 5 15,6%
Servicios (transporte, haciendo quehaceres del hogar y patio, etc.)
54 57,4% 18 72,0% 20 54,1% 16 50,0%
Cosas (comida, ropas, etc.) 42 44,7% 13 52,0% 21 56,8% 8 25,0%
Otro2/ 6 6,4% 3 12,0% 2 5,4% 1 3,1%
Recibe apoyo 74 79.0% 22 88,0% 30 81,0% 22 69,0%
75 años y más 171 15 60 96
Dinero 48 28,1% 4 26,7% 30 50,0% 14 14,6%
Servicios (transporte, haciendo quehaceres del hogar y patio, etc.)
116 67,8% 13 86,7% 49 81,7% 54 56,3%
Cosas (comida, ropas, etc.) 94 55,0% 10 66,7% 49 81,7% 35 36,5%
Otro2/ 29 17,0% 2 13,3% 8 13,3% 19 19,8%
Recibe apoyo 141 82,5% 14 93,3% 55 91,7% 72 75,0%
Fuente: DGIS/STP. Encuesta sobre Salud, Bienestar y Envejecimiento (SABE). Paraguay 20171/ Incluye: Otros parientes, no parientes, etc.2/ Incluye: Medicamentos, compañía, etc.Precisiones sobre el cuadro: La suma de los porcentajes no coincide con el 100% pues corresponde a una variable con respuesta múltiple.

ENCUESTA SABE Principales Resultados JUNIO 2018SALUD, BIENESTAR Y ENVEJECIMIENTO ASUNCIÓN, PARAGUAY
46 47
CAPÍTULO 4. El cuadro 4.7 muestra un comportamiento muy similar al de las mujeres (cuadro 4.6), ya que los hombres también reciben ayuda en
mayor medida de parte de sus conyugues (87,1%), en segundo lugar, reciben apoyo de sus hijos (79,6%) y en tercer lugar de parte de
otras personas (66,2%), que pueden ser familiares o no. Así mismo, se observa que estos apoyos son similares, conforme aumenta la
edad, a excepción del grupo de 70-74 años, donde son los hijos los que brindan mayor apoyo (86,5%).
Al considerar los tipos de ayuda, la población adulta mayor masculina recibe principalmente ayuda monetaria (47,1%), seguido de
la ayuda con servicios (44,5%) y por último con cosas como comidas, ropas, etc. (30,2%). Esta tendencia se mantiene considerando
cada uno de los rangos de edades. Por otra parte, se observa que los conyugues presentan los mayores porcentajes en ayuda con
dinero principalmente (69,4%), seguido de servicios (62,4%) y cosas (comida, ropas, etc.) (41,2%), manteniéndose este patrón en los
diferentes grupos de edades, exceptuando el grupo de 75 años y más, donde el mayor porcentaje corresponde a los hijos que ayudan
con servicios, probablemente por viudez o por la incapacidad del conyugue de brindar estos tipos de ayuda.
CAPÍTULO 4. Cuadro 4.7. Distribución de la población masculina adulta mayor que recibe ayuda por personas que la brindan, según grupos de edad y tipo de apoyo (%).
Tipo de ayuda TotalCorresidentes
Conyugue Hijo Otro1/
Total 539 85 226 228
Dinero 254 47,1% 59 69,4% 135 59,7% 60 26,3%
Servicios (transporte, haciendo quehaceres del hogar y patio, etc.)
240 44,5% 53 62,4% 118 52,2% 69 30,3%
Cosas (comida, ropas, etc.) 163 30,2% 35 41,2% 79 35,0% 49 21,5%
Otro2/ 49 9,1% 8 9,4% 10 4,4% 31 13,6%
Recibe apoyo 405 75,1% 74 87,1% 180 79,6% 151 66,2%
60 a 64 años 177 37 90 50
Dinero 82 46,3% 26 70,3% 45 50,0% 11 22,0%
Servicios (transporte, haciendo quehaceres del hogar y patio, etc.)
75 42,4% 23 62,2% 38 42,2% 14 28,0%
Cosas (comida, ropas, etc.) 42 23,7% 16 43,2% 18 20,0% 8 16,0%
Otro2/ 10 5,6% 2 5,4% 2 2,2% 6 12,0%
Recibe apoyo 130 73,4% 34 91,9% 66 73,3% 30 60,0%
65 a 69 años 108 19 53 36
Dinero 57 52,8% 13 68,4% 33 62,3% 11 30,6%
Servicios (transporte, haciendo quehaceres del hogar y patio, etc.)
56 51,9% 13 68,4% 31 58,5% 12 33,3%
Cosas (comida, ropas, etc.) 32 29,6% 11 57,9% 14 26,4% 7 19,4%
Otro2/ 10 9,3% 2 10,5% 4 7,5% 4 11,1%
Recibe apoyo 84 77,8% 16 84,2% 43 81,1% 25 69,4%
70 a 74 años 93 16 37 40
Dinero 49 52,7% 11 68,8% 27 73,0% 11 27,5%
Servicios (transporte, haciendo quehaceres del hogar y patio, etc.)
34 36,6% 9 56,3% 16 43,2% 9 22,5%
Cosas (comida, ropas, etc.) 26 28,0% 2 12,5% 17 45,9% 7 17,5%
Otro2/ 8 8,6% 2 12,5% 2 5,4% 4 10,0%
Recibe apoyo 68 73,1% 12 75,0% 32 86,5% 24 60,0%
75 años y más 161 13 46 102
Dinero 66 41,0% 9 69,2% 30 65,2% 27 26,5%
Servicios (transporte, haciendo quehaceres del hogar y patio, etc.)
75 46,6% 8 61,5% 33 71,7% 34 33,3%
Cosas (comida, ropas, etc.) 63 39,1% 6 46,2% 30 65,2% 27 26,5%
Otro2/ 21 13,0% 2 15,4% 2 4,3% 17 16,7%
Recibe apoyo 123 76,4% 12 92,3% 39 84,8% 72 70,6%
Fuente: DGIS/STP. Encuesta sobre Salud, Bienestar y Envejecimiento (SABE). Paraguay 20171/ Incluye: Otros parientes, no parientes, etc.2/ Incluye: Medicamentos, compañía, etc.Precisiones sobre el cuadro: La suma de los porcentajes no coincide con el 100% pues corresponde a una variable con respuesta múltiple.
ENCUESTA SABE Principales Resultados JUNIO 2018SALUD, BIENESTAR Y ENVEJECIMIENTO ASUNCIÓN, PARAGUAY
48 49
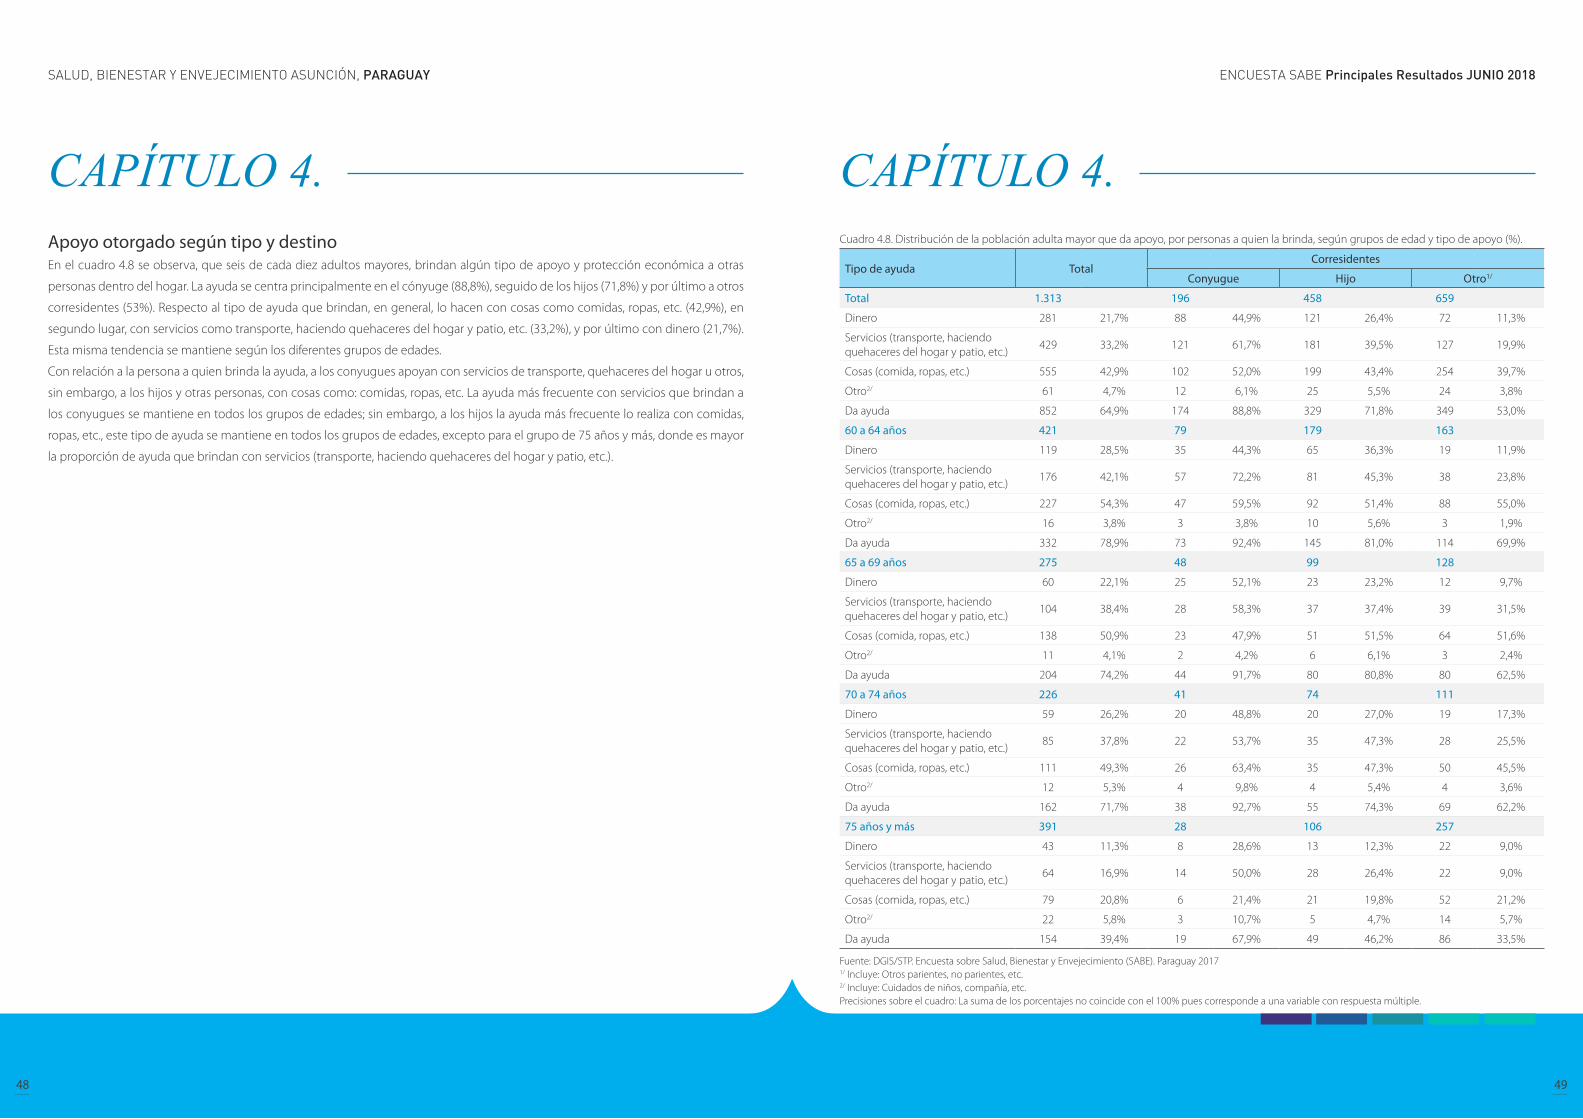
CAPÍTULO 4. Apoyo otorgado según tipo y destino En el cuadro 4.8 se observa, que seis de cada diez adultos mayores, brindan algún tipo de apoyo y protección económica a otras
personas dentro del hogar. La ayuda se centra principalmente en el cónyuge (88,8%), seguido de los hijos (71,8%) y por último a otros
corresidentes (53%). Respecto al tipo de ayuda que brindan, en general, lo hacen con cosas como comidas, ropas, etc. (42,9%), en
segundo lugar, con servicios como transporte, haciendo quehaceres del hogar y patio, etc. (33,2%), y por último con dinero (21,7%).
Esta misma tendencia se mantiene según los diferentes grupos de edades.
Con relación a la persona a quien brinda la ayuda, a los conyugues apoyan con servicios de transporte, quehaceres del hogar u otros,
sin embargo, a los hijos y otras personas, con cosas como: comidas, ropas, etc. La ayuda más frecuente con servicios que brindan a
los conyugues se mantiene en todos los grupos de edades; sin embargo, a los hijos la ayuda más frecuente lo realiza con comidas,
ropas, etc., este tipo de ayuda se mantiene en todos los grupos de edades, excepto para el grupo de 75 años y más, donde es mayor
la proporción de ayuda que brindan con servicios (transporte, haciendo quehaceres del hogar y patio, etc.).
CAPÍTULO 4. Cuadro 4.8. Distribución de la población adulta mayor que da apoyo, por personas a quien la brinda, según grupos de edad y tipo de apoyo (%).
Tipo de ayuda TotalCorresidentes
Conyugue Hijo Otro1/
Total 1.313 196 458 659
Dinero 281 21,7% 88 44,9% 121 26,4% 72 11,3%
Servicios (transporte, haciendo quehaceres del hogar y patio, etc.)
429 33,2% 121 61,7% 181 39,5% 127 19,9%
Cosas (comida, ropas, etc.) 555 42,9% 102 52,0% 199 43,4% 254 39,7%
Otro2/ 61 4,7% 12 6,1% 25 5,5% 24 3,8%
Da ayuda 852 64,9% 174 88,8% 329 71,8% 349 53,0%
60 a 64 años 421 79 179 163
Dinero 119 28,5% 35 44,3% 65 36,3% 19 11,9%
Servicios (transporte, haciendo quehaceres del hogar y patio, etc.)
176 42,1% 57 72,2% 81 45,3% 38 23,8%
Cosas (comida, ropas, etc.) 227 54,3% 47 59,5% 92 51,4% 88 55,0%
Otro2/ 16 3,8% 3 3,8% 10 5,6% 3 1,9%
Da ayuda 332 78,9% 73 92,4% 145 81,0% 114 69,9%
65 a 69 años 275 48 99 128
Dinero 60 22,1% 25 52,1% 23 23,2% 12 9,7%
Servicios (transporte, haciendo quehaceres del hogar y patio, etc.)
104 38,4% 28 58,3% 37 37,4% 39 31,5%
Cosas (comida, ropas, etc.) 138 50,9% 23 47,9% 51 51,5% 64 51,6%
Otro2/ 11 4,1% 2 4,2% 6 6,1% 3 2,4%
Da ayuda 204 74,2% 44 91,7% 80 80,8% 80 62,5%
70 a 74 años 226 41 74 111
Dinero 59 26,2% 20 48,8% 20 27,0% 19 17,3%
Servicios (transporte, haciendo quehaceres del hogar y patio, etc.)
85 37,8% 22 53,7% 35 47,3% 28 25,5%
Cosas (comida, ropas, etc.) 111 49,3% 26 63,4% 35 47,3% 50 45,5%
Otro2/ 12 5,3% 4 9,8% 4 5,4% 4 3,6%
Da ayuda 162 71,7% 38 92,7% 55 74,3% 69 62,2%
75 años y más 391 28 106 257
Dinero 43 11,3% 8 28,6% 13 12,3% 22 9,0%
Servicios (transporte, haciendo quehaceres del hogar y patio, etc.)
64 16,9% 14 50,0% 28 26,4% 22 9,0%
Cosas (comida, ropas, etc.) 79 20,8% 6 21,4% 21 19,8% 52 21,2%
Otro2/ 22 5,8% 3 10,7% 5 4,7% 14 5,7%
Da ayuda 154 39,4% 19 67,9% 49 46,2% 86 33,5%
Fuente: DGIS/STP. Encuesta sobre Salud, Bienestar y Envejecimiento (SABE). Paraguay 20171/ Incluye: Otros parientes, no parientes, etc.2/ Incluye: Cuidados de niños, compañía, etc.Precisiones sobre el cuadro: La suma de los porcentajes no coincide con el 100% pues corresponde a una variable con respuesta múltiple.
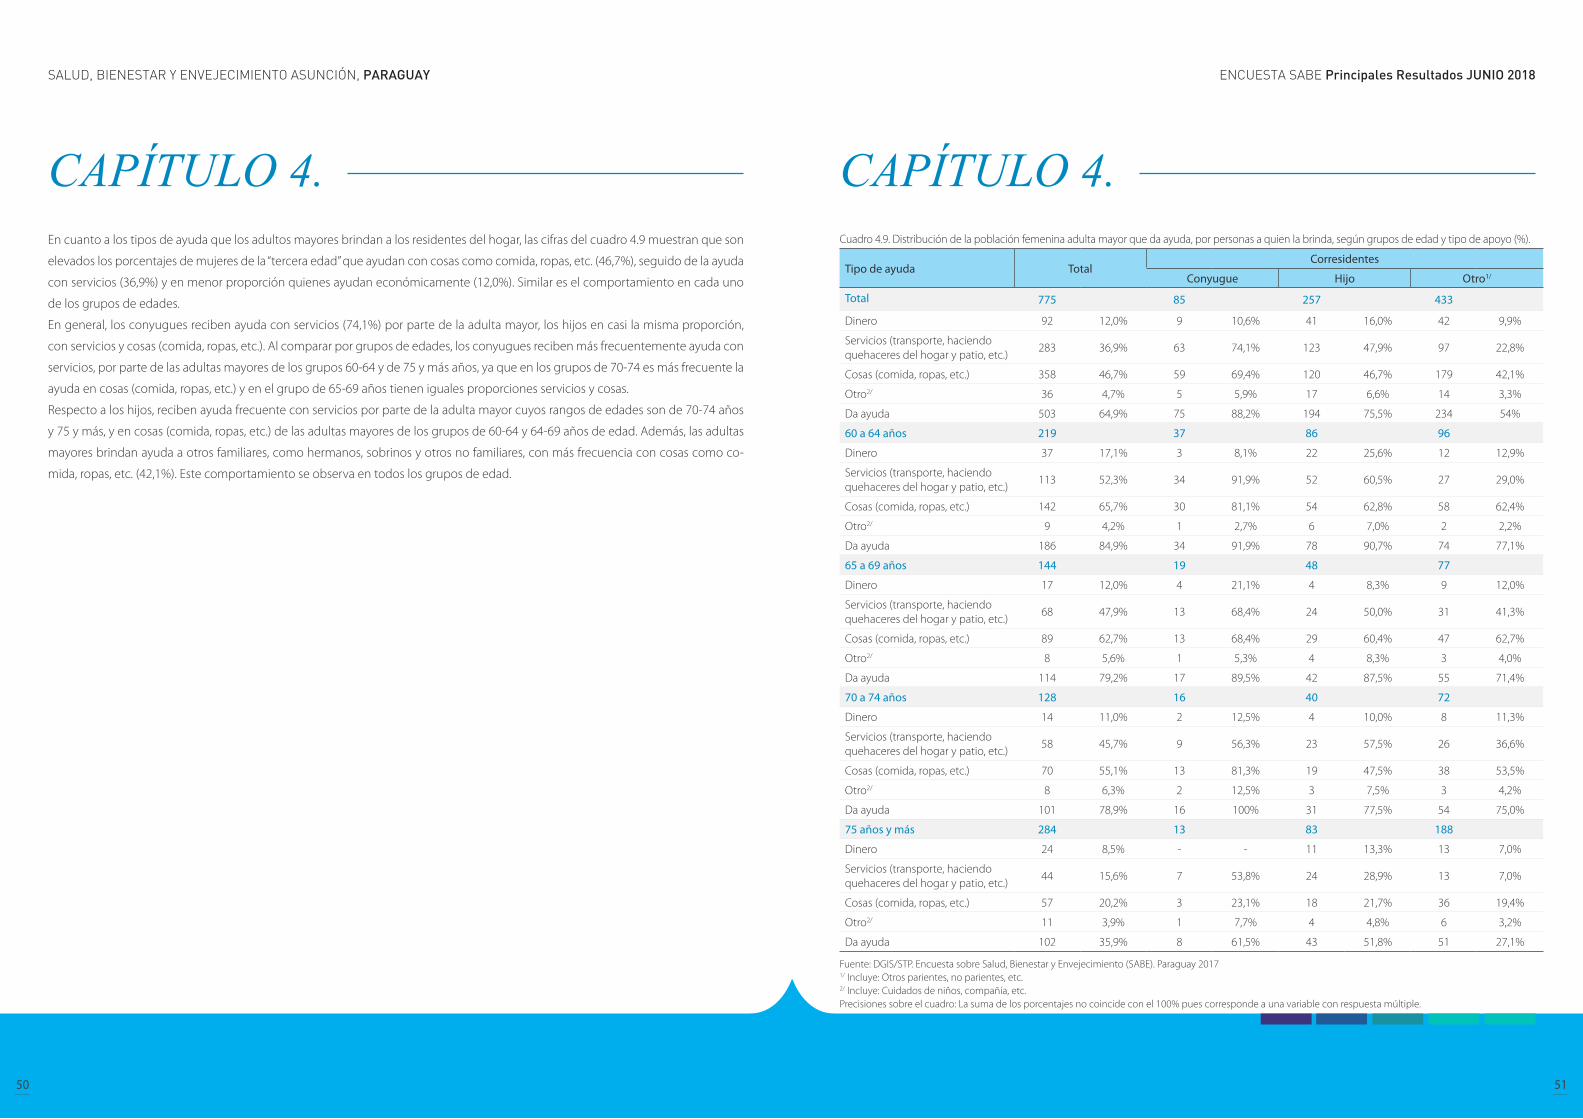
ENCUESTA SABE Principales Resultados JUNIO 2018SALUD, BIENESTAR Y ENVEJECIMIENTO ASUNCIÓN, PARAGUAY
50 51
CAPÍTULO 4. En cuanto a los tipos de ayuda que los adultos mayores brindan a los residentes del hogar, las cifras del cuadro 4.9 muestran que son
elevados los porcentajes de mujeres de la “tercera edad” que ayudan con cosas como comida, ropas, etc. (46,7%), seguido de la ayuda
con servicios (36,9%) y en menor proporción quienes ayudan económicamente (12,0%). Similar es el comportamiento en cada uno
de los grupos de edades.
En general, los conyugues reciben ayuda con servicios (74,1%) por parte de la adulta mayor, los hijos en casi la misma proporción,
con servicios y cosas (comida, ropas, etc.). Al comparar por grupos de edades, los conyugues reciben más frecuentemente ayuda con
servicios, por parte de las adultas mayores de los grupos 60-64 y de 75 y más años, ya que en los grupos de 70-74 es más frecuente la
ayuda en cosas (comida, ropas, etc.) y en el grupo de 65-69 años tienen iguales proporciones servicios y cosas.
Respecto a los hijos, reciben ayuda frecuente con servicios por parte de la adulta mayor cuyos rangos de edades son de 70-74 años
y 75 y más, y en cosas (comida, ropas, etc.) de las adultas mayores de los grupos de 60-64 y 64-69 años de edad. Además, las adultas
mayores brindan ayuda a otros familiares, como hermanos, sobrinos y otros no familiares, con más frecuencia con cosas como co-
mida, ropas, etc. (42,1%). Este comportamiento se observa en todos los grupos de edad.
CAPÍTULO 4. Cuadro 4.9. Distribución de la población femenina adulta mayor que da ayuda, por personas a quien la brinda, según grupos de edad y tipo de apoyo (%).
Tipo de ayuda TotalCorresidentes
Conyugue Hijo Otro1/
Total 775 85 257 433
Dinero 92 12,0% 9 10,6% 41 16,0% 42 9,9%
Servicios (transporte, haciendo quehaceres del hogar y patio, etc.)
283 36,9% 63 74,1% 123 47,9% 97 22,8%
Cosas (comida, ropas, etc.) 358 46,7% 59 69,4% 120 46,7% 179 42,1%
Otro2/ 36 4,7% 5 5,9% 17 6,6% 14 3,3%
Da ayuda 503 64,9% 75 88,2% 194 75,5% 234 54%
60 a 64 años 219 37 86 96
Dinero 37 17,1% 3 8,1% 22 25,6% 12 12,9%
Servicios (transporte, haciendo quehaceres del hogar y patio, etc.)
113 52,3% 34 91,9% 52 60,5% 27 29,0%
Cosas (comida, ropas, etc.) 142 65,7% 30 81,1% 54 62,8% 58 62,4%
Otro2/ 9 4,2% 1 2,7% 6 7,0% 2 2,2%
Da ayuda 186 84,9% 34 91,9% 78 90,7% 74 77,1%
65 a 69 años 144 19 48 77
Dinero 17 12,0% 4 21,1% 4 8,3% 9 12,0%
Servicios (transporte, haciendo quehaceres del hogar y patio, etc.)
68 47,9% 13 68,4% 24 50,0% 31 41,3%
Cosas (comida, ropas, etc.) 89 62,7% 13 68,4% 29 60,4% 47 62,7%
Otro2/ 8 5,6% 1 5,3% 4 8,3% 3 4,0%
Da ayuda 114 79,2% 17 89,5% 42 87,5% 55 71,4%
70 a 74 años 128 16 40 72
Dinero 14 11,0% 2 12,5% 4 10,0% 8 11,3%
Servicios (transporte, haciendo quehaceres del hogar y patio, etc.)
58 45,7% 9 56,3% 23 57,5% 26 36,6%
Cosas (comida, ropas, etc.) 70 55,1% 13 81,3% 19 47,5% 38 53,5%
Otro2/ 8 6,3% 2 12,5% 3 7,5% 3 4,2%
Da ayuda 101 78,9% 16 100% 31 77,5% 54 75,0%
75 años y más 284 13 83 188
Dinero 24 8,5% - - 11 13,3% 13 7,0%
Servicios (transporte, haciendo quehaceres del hogar y patio, etc.)
44 15,6% 7 53,8% 24 28,9% 13 7,0%
Cosas (comida, ropas, etc.) 57 20,2% 3 23,1% 18 21,7% 36 19,4%
Otro2/ 11 3,9% 1 7,7% 4 4,8% 6 3,2%
Da ayuda 102 35,9% 8 61,5% 43 51,8% 51 27,1%
Fuente: DGIS/STP. Encuesta sobre Salud, Bienestar y Envejecimiento (SABE). Paraguay 20171/ Incluye: Otros parientes, no parientes, etc.2/ Incluye: Cuidados de niños, compañía, etc.Precisiones sobre el cuadro: La suma de los porcentajes no coincide con el 100% pues corresponde a una variable con respuesta múltiple.
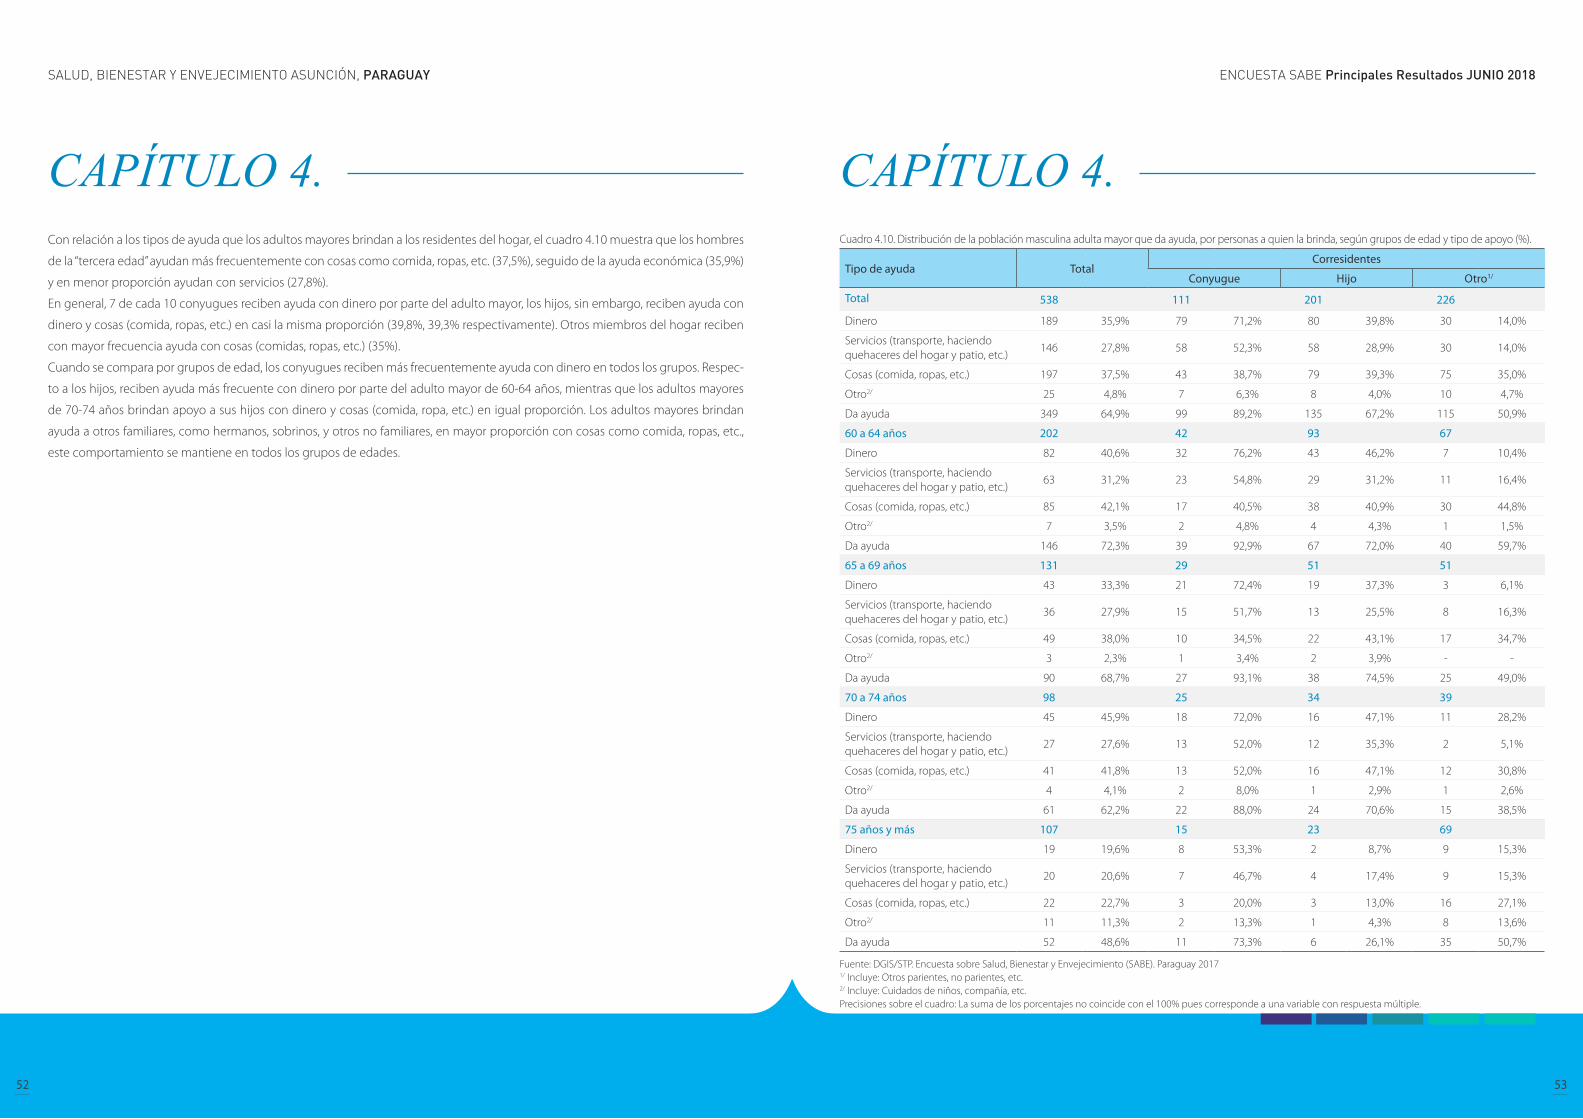
ENCUESTA SABE Principales Resultados JUNIO 2018SALUD, BIENESTAR Y ENVEJECIMIENTO ASUNCIÓN, PARAGUAY
52 53
CAPÍTULO 4. Con relación a los tipos de ayuda que los adultos mayores brindan a los residentes del hogar, el cuadro 4.10 muestra que los hombres
de la “tercera edad” ayudan más frecuentemente con cosas como comida, ropas, etc. (37,5%), seguido de la ayuda económica (35,9%)
y en menor proporción ayudan con servicios (27,8%).
En general, 7 de cada 10 conyugues reciben ayuda con dinero por parte del adulto mayor, los hijos, sin embargo, reciben ayuda con
dinero y cosas (comida, ropas, etc.) en casi la misma proporción (39,8%, 39,3% respectivamente). Otros miembros del hogar reciben
con mayor frecuencia ayuda con cosas (comidas, ropas, etc.) (35%).
Cuando se compara por grupos de edad, los conyugues reciben más frecuentemente ayuda con dinero en todos los grupos. Respec-
to a los hijos, reciben ayuda más frecuente con dinero por parte del adulto mayor de 60-64 años, mientras que los adultos mayores
de 70-74 años brindan apoyo a sus hijos con dinero y cosas (comida, ropa, etc.) en igual proporción. Los adultos mayores brindan
ayuda a otros familiares, como hermanos, sobrinos, y otros no familiares, en mayor proporción con cosas como comida, ropas, etc.,
este comportamiento se mantiene en todos los grupos de edades.
CAPÍTULO 4. Cuadro 4.10. Distribución de la población masculina adulta mayor que da ayuda, por personas a quien la brinda, según grupos de edad y tipo de apoyo (%).
Tipo de ayuda TotalCorresidentes
Conyugue Hijo Otro1/
Total 538 111 201 226
Dinero 189 35,9% 79 71,2% 80 39,8% 30 14,0%
Servicios (transporte, haciendo quehaceres del hogar y patio, etc.)
146 27,8% 58 52,3% 58 28,9% 30 14,0%
Cosas (comida, ropas, etc.) 197 37,5% 43 38,7% 79 39,3% 75 35,0%
Otro2/ 25 4,8% 7 6,3% 8 4,0% 10 4,7%
Da ayuda 349 64,9% 99 89,2% 135 67,2% 115 50,9%
60 a 64 años 202 42 93 67
Dinero 82 40,6% 32 76,2% 43 46,2% 7 10,4%
Servicios (transporte, haciendo quehaceres del hogar y patio, etc.)
63 31,2% 23 54,8% 29 31,2% 11 16,4%
Cosas (comida, ropas, etc.) 85 42,1% 17 40,5% 38 40,9% 30 44,8%
Otro2/ 7 3,5% 2 4,8% 4 4,3% 1 1,5%
Da ayuda 146 72,3% 39 92,9% 67 72,0% 40 59,7%
65 a 69 años 131 29 51 51
Dinero 43 33,3% 21 72,4% 19 37,3% 3 6,1%
Servicios (transporte, haciendo quehaceres del hogar y patio, etc.)
36 27,9% 15 51,7% 13 25,5% 8 16,3%
Cosas (comida, ropas, etc.) 49 38,0% 10 34,5% 22 43,1% 17 34,7%
Otro2/ 3 2,3% 1 3,4% 2 3,9% - -
Da ayuda 90 68,7% 27 93,1% 38 74,5% 25 49,0%
70 a 74 años 98 25 34 39
Dinero 45 45,9% 18 72,0% 16 47,1% 11 28,2%
Servicios (transporte, haciendo quehaceres del hogar y patio, etc.)
27 27,6% 13 52,0% 12 35,3% 2 5,1%
Cosas (comida, ropas, etc.) 41 41,8% 13 52,0% 16 47,1% 12 30,8%
Otro2/ 4 4,1% 2 8,0% 1 2,9% 1 2,6%
Da ayuda 61 62,2% 22 88,0% 24 70,6% 15 38,5%
75 años y más 107 15 23 69
Dinero 19 19,6% 8 53,3% 2 8,7% 9 15,3%
Servicios (transporte, haciendo quehaceres del hogar y patio, etc.)
20 20,6% 7 46,7% 4 17,4% 9 15,3%
Cosas (comida, ropas, etc.) 22 22,7% 3 20,0% 3 13,0% 16 27,1%
Otro2/ 11 11,3% 2 13,3% 1 4,3% 8 13,6%
Da ayuda 52 48,6% 11 73,3% 6 26,1% 35 50,7%
Fuente: DGIS/STP. Encuesta sobre Salud, Bienestar y Envejecimiento (SABE). Paraguay 20171/ Incluye: Otros parientes, no parientes, etc.2/ Incluye: Cuidados de niños, compañía, etc.Precisiones sobre el cuadro: La suma de los porcentajes no coincide con el 100% pues corresponde a una variable con respuesta múltiple.
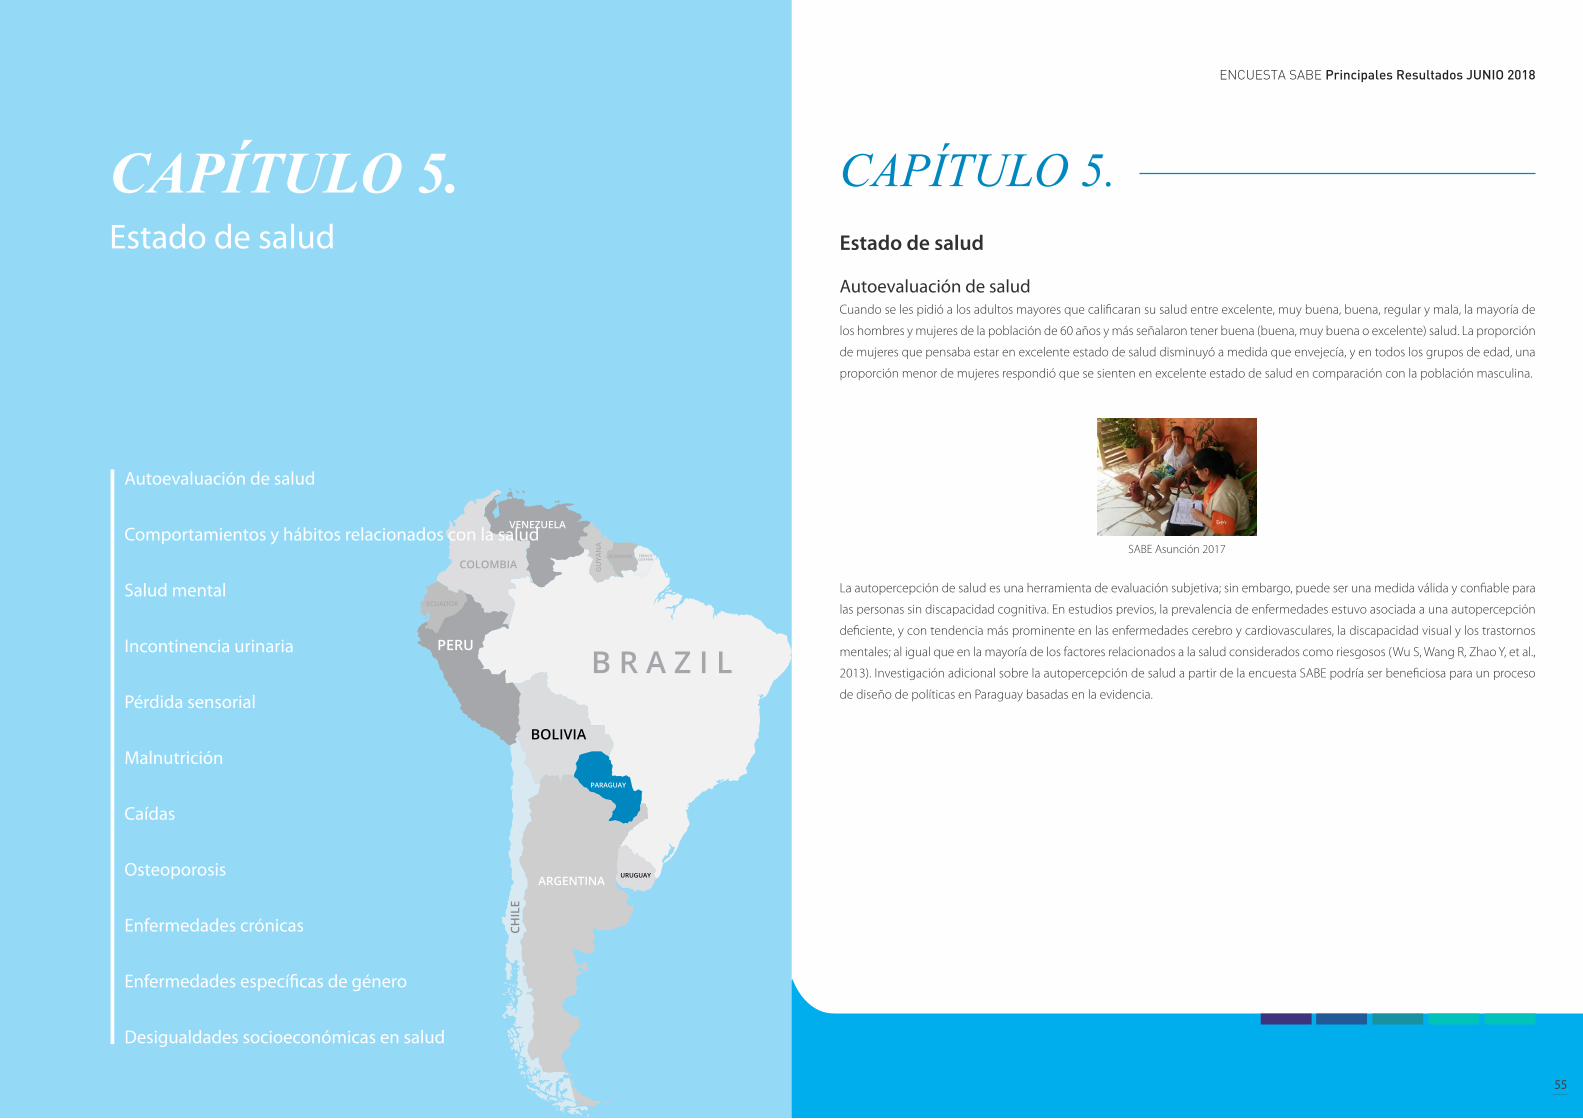
ENCUESTA SABE Principales Resultados JUNIO 2018SALUD, BIENESTAR Y ENVEJECIMIENTO ASUNCIÓN, PARAGUAY
54 55
CAPÍTULO 5. Estado de salud
Autoevaluación de salud Cuando se les pidió a los adultos mayores que calificaran su salud entre excelente, muy buena, buena, regular y mala, la mayoría de
los hombres y mujeres de la población de 60 años y más señalaron tener buena (buena, muy buena o excelente) salud. La proporción
de mujeres que pensaba estar en excelente estado de salud disminuyó a medida que envejecía, y en todos los grupos de edad, una
proporción menor de mujeres respondió que se sienten en excelente estado de salud en comparación con la población masculina.
La autopercepción de salud es una herramienta de evaluación subjetiva; sin embargo, puede ser una medida válida y confiable para
las personas sin discapacidad cognitiva. En estudios previos, la prevalencia de enfermedades estuvo asociada a una autopercepción
deficiente, y con tendencia más prominente en las enfermedades cerebro y cardiovasculares, la discapacidad visual y los trastornos
mentales; al igual que en la mayoría de los factores relacionados a la salud considerados como riesgosos (Wu S, Wang R, Zhao Y, et al.,
2013). Investigación adicional sobre la autopercepción de salud a partir de la encuesta SABE podría ser beneficiosa para un proceso
de diseño de políticas en Paraguay basadas en la evidencia.
SABE Asunción 2017
CAPÍTULO 5. Estado de salud
Autoevaluación de salud
Comportamientos y hábitos relacionados con la salud
Salud mental
Incontinencia urinaria
Pérdida sensorial
Malnutrición
Caídas
Osteoporosis
Enfermedades crónicas
Enfermedades específicas de género
Desigualdades socioeconómicas en salud
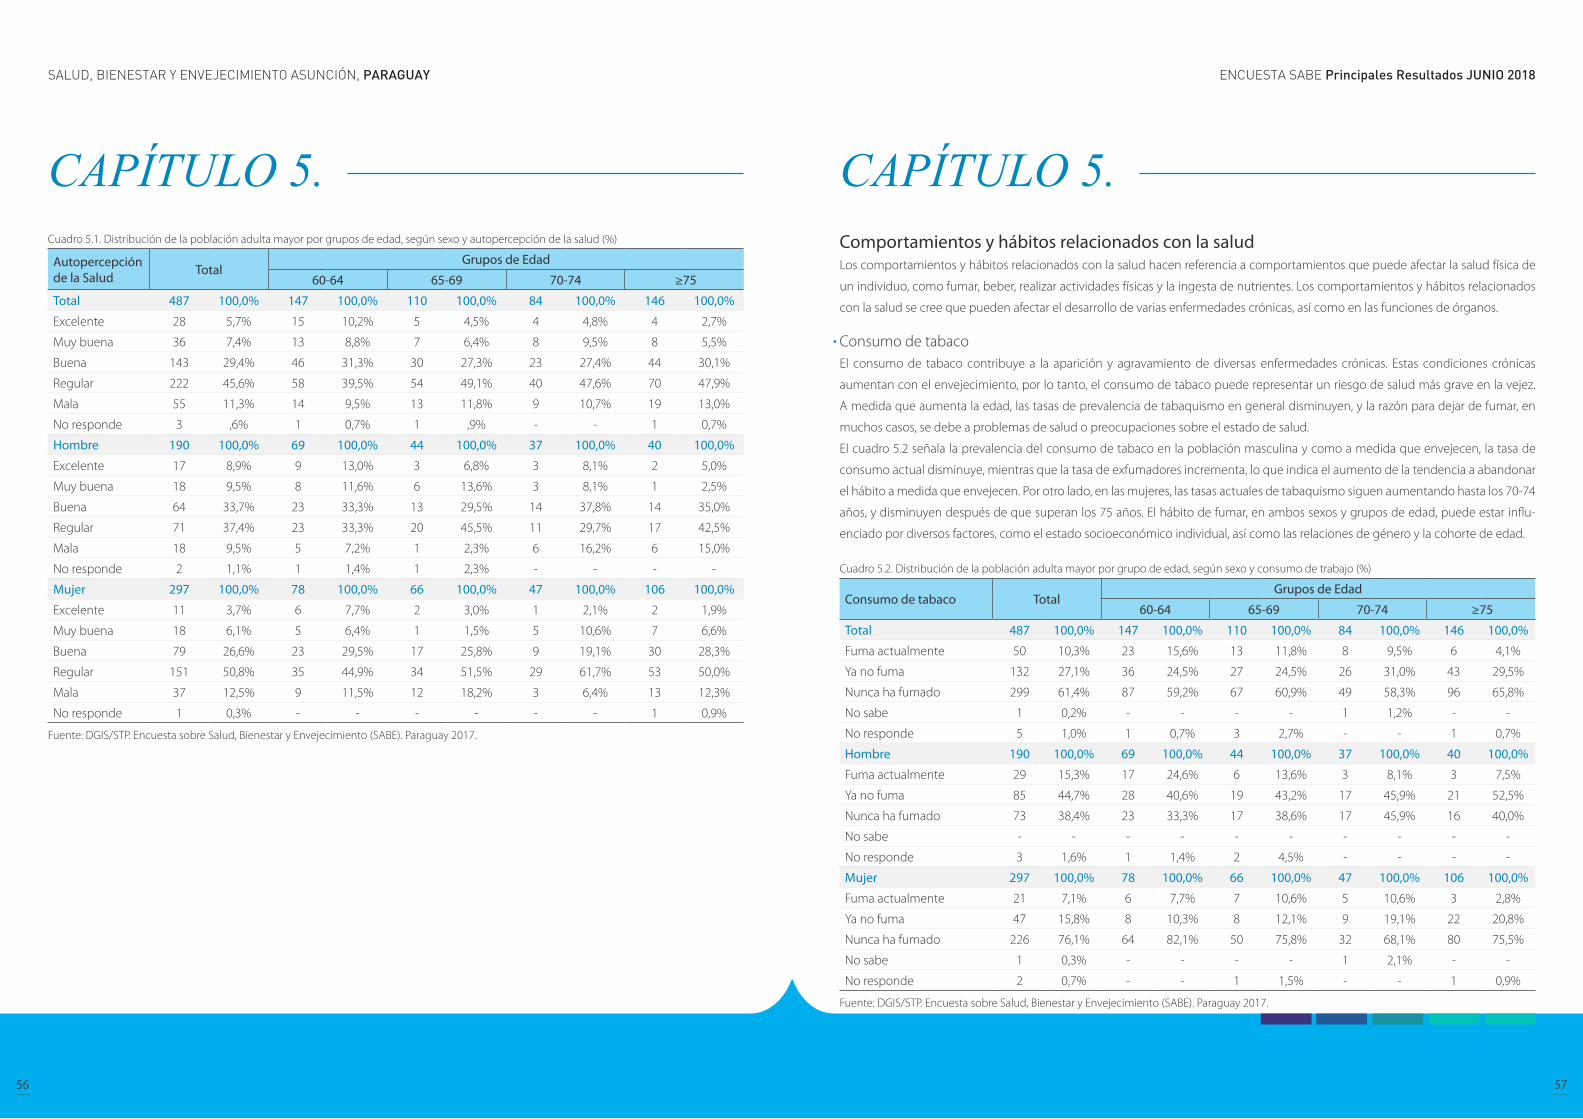
ENCUESTA SABE Principales Resultados JUNIO 2018SALUD, BIENESTAR Y ENVEJECIMIENTO ASUNCIÓN, PARAGUAY
56 57
CAPÍTULO 5. Cuadro 5.1. Distribución de la población adulta mayor por grupos de edad, según sexo y autopercepción de la salud (%)
Autopercepción de la Salud Total
Grupos de Edad
60-64 65-69 70-74 ≥75
Total 487 100,0% 147 100,0% 110 100,0% 84 100,0% 146 100,0%
Excelente 28 5,7% 15 10,2% 5 4,5% 4 4,8% 4 2,7%
Muy buena 36 7,4% 13 8,8% 7 6,4% 8 9,5% 8 5,5%
Buena 143 29,4% 46 31,3% 30 27,3% 23 27,4% 44 30,1%
Regular 222 45,6% 58 39,5% 54 49,1% 40 47,6% 70 47,9%
Mala 55 11,3% 14 9,5% 13 11,8% 9 10,7% 19 13,0%
No responde 3 ,6% 1 0,7% 1 ,9% - - 1 0,7%
Hombre 190 100,0% 69 100,0% 44 100,0% 37 100,0% 40 100,0%
Excelente 17 8,9% 9 13,0% 3 6,8% 3 8,1% 2 5,0%
Muy buena 18 9,5% 8 11,6% 6 13,6% 3 8,1% 1 2,5%
Buena 64 33,7% 23 33,3% 13 29,5% 14 37,8% 14 35,0%
Regular 71 37,4% 23 33,3% 20 45,5% 11 29,7% 17 42,5%
Mala 18 9,5% 5 7,2% 1 2,3% 6 16,2% 6 15,0%
No responde 2 1,1% 1 1,4% 1 2,3% - - - -
Mujer 297 100,0% 78 100,0% 66 100,0% 47 100,0% 106 100,0%
Excelente 11 3,7% 6 7,7% 2 3,0% 1 2,1% 2 1,9%
Muy buena 18 6,1% 5 6,4% 1 1,5% 5 10,6% 7 6,6%
Buena 79 26,6% 23 29,5% 17 25,8% 9 19,1% 30 28,3%
Regular 151 50,8% 35 44,9% 34 51,5% 29 61,7% 53 50,0%
Mala 37 12,5% 9 11,5% 12 18,2% 3 6,4% 13 12,3%
No responde 1 0,3% - - - - - - 1 0,9%
Fuente: DGIS/STP. Encuesta sobre Salud, Bienestar y Envejecimiento (SABE). Paraguay 2017.
CAPÍTULO 5. Comportamientos y hábitos relacionados con la salud Los comportamientos y hábitos relacionados con la salud hacen referencia a comportamientos que puede afectar la salud física de
un individuo, como fumar, beber, realizar actividades físicas y la ingesta de nutrientes. Los comportamientos y hábitos relacionados
con la salud se cree que pueden afectar el desarrollo de varias enfermedades crónicas, así como en las funciones de órganos.
Consumo de tabaco El consumo de tabaco contribuye a la aparición y agravamiento de diversas enfermedades crónicas. Estas condiciones crónicas
aumentan con el envejecimiento, por lo tanto, el consumo de tabaco puede representar un riesgo de salud más grave en la vejez.
A medida que aumenta la edad, las tasas de prevalencia de tabaquismo en general disminuyen, y la razón para dejar de fumar, en
muchos casos, se debe a problemas de salud o preocupaciones sobre el estado de salud.
El cuadro 5.2 señala la prevalencia del consumo de tabaco en la población masculina y como a medida que envejecen, la tasa de
consumo actual disminuye, mientras que la tasa de exfumadores incrementa, lo que indica el aumento de la tendencia a abandonar
el hábito a medida que envejecen. Por otro lado, en las mujeres, las tasas actuales de tabaquismo siguen aumentando hasta los 70-74
años, y disminuyen después de que superan los 75 años. El hábito de fumar, en ambos sexos y grupos de edad, puede estar influ-
enciado por diversos factores, como el estado socioeconómico individual, así como las relaciones de género y la cohorte de edad.
Cuadro 5.2. Distribución de la población adulta mayor por grupo de edad, según sexo y consumo de trabajo (%)
Consumo de tabaco TotalGrupos de Edad
60-64 65-69 70-74 ≥75
Total 487 100,0% 147 100,0% 110 100,0% 84 100,0% 146 100,0%
Fuma actualmente 50 10,3% 23 15,6% 13 11,8% 8 9,5% 6 4,1%
Ya no fuma 132 27,1% 36 24,5% 27 24,5% 26 31,0% 43 29,5%
Nunca ha fumado 299 61,4% 87 59,2% 67 60,9% 49 58,3% 96 65,8%
No sabe 1 0,2% - - - - 1 1,2% - -
No responde 5 1,0% 1 0,7% 3 2,7% - - 1 0,7%
Hombre 190 100,0% 69 100,0% 44 100,0% 37 100,0% 40 100,0%
Fuma actualmente 29 15,3% 17 24,6% 6 13,6% 3 8,1% 3 7,5%
Ya no fuma 85 44,7% 28 40,6% 19 43,2% 17 45,9% 21 52,5%
Nunca ha fumado 73 38,4% 23 33,3% 17 38,6% 17 45,9% 16 40,0%
No sabe - - - - - - - - - -
No responde 3 1,6% 1 1,4% 2 4,5% - - - -
Mujer 297 100,0% 78 100,0% 66 100,0% 47 100,0% 106 100,0%
Fuma actualmente 21 7,1% 6 7,7% 7 10,6% 5 10,6% 3 2,8%
Ya no fuma 47 15,8% 8 10,3% 8 12,1% 9 19,1% 22 20,8%
Nunca ha fumado 226 76,1% 64 82,1% 50 75,8% 32 68,1% 80 75,5%
No sabe 1 0,3% - - - - 1 2,1% - -
No responde 2 0,7% - - 1 1,5% - - 1 0,9%
Fuente: DGIS/STP. Encuesta sobre Salud, Bienestar y Envejecimiento (SABE). Paraguay 2017.
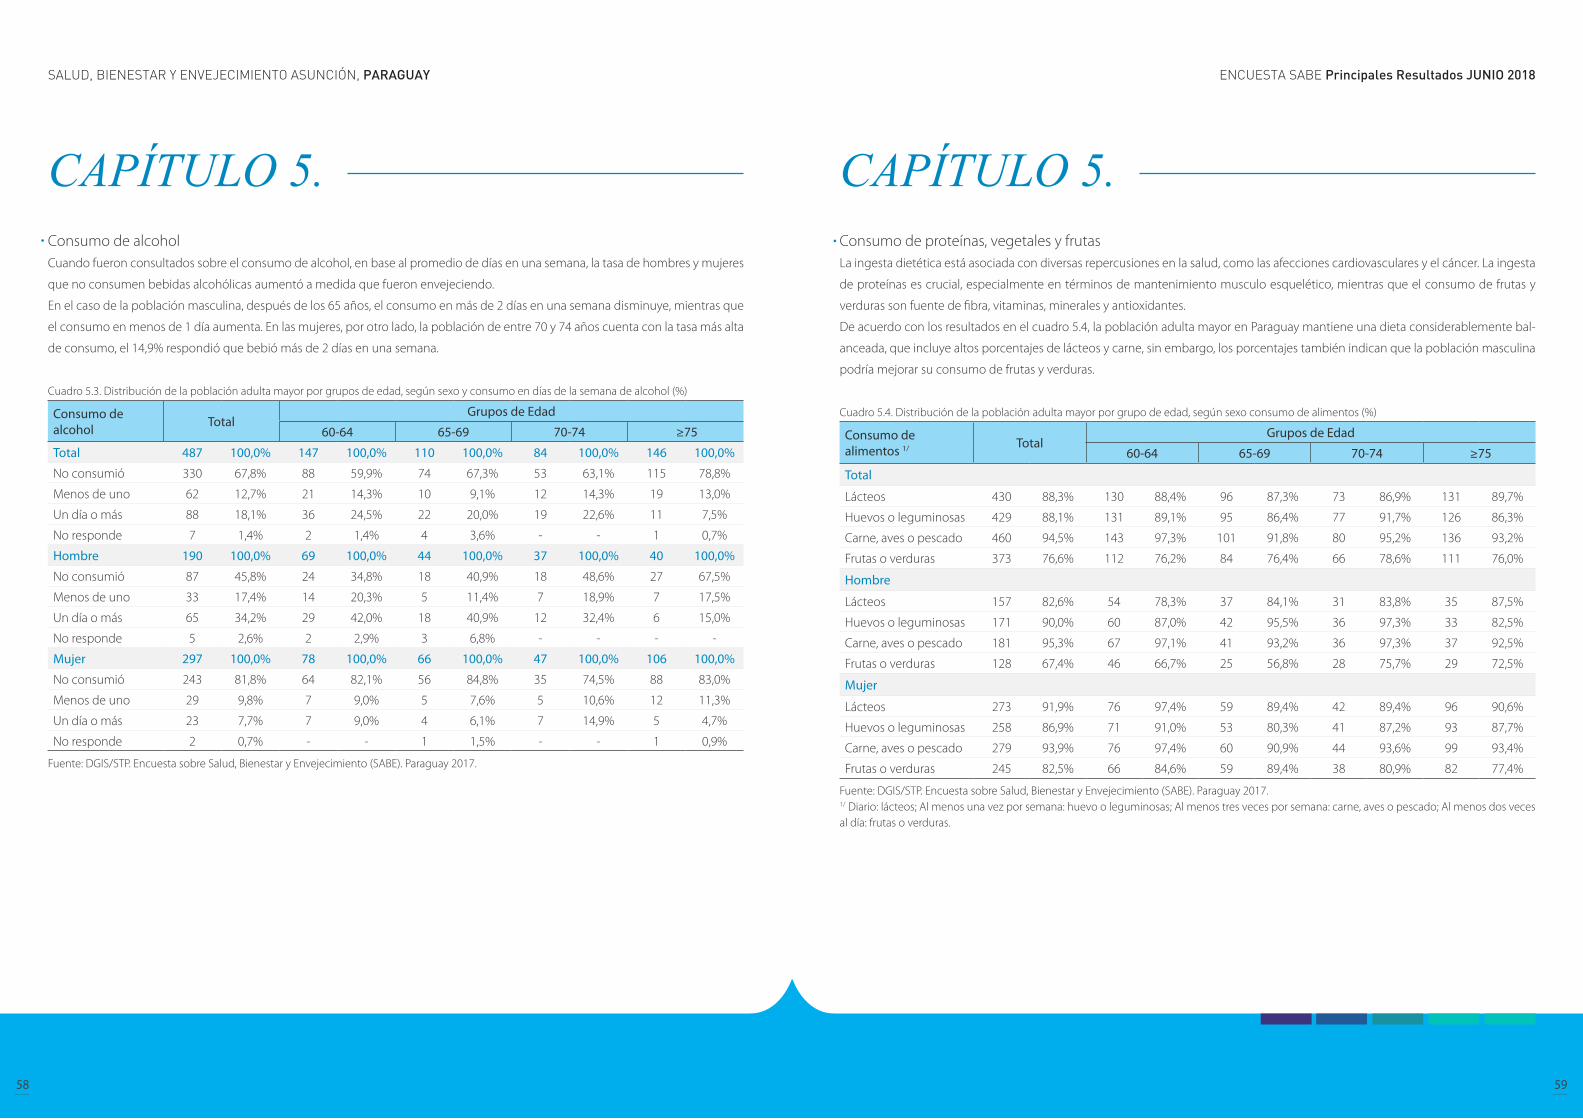
ENCUESTA SABE Principales Resultados JUNIO 2018SALUD, BIENESTAR Y ENVEJECIMIENTO ASUNCIÓN, PARAGUAY
58 59
CAPÍTULO 5. Consumo de alcohol Cuando fueron consultados sobre el consumo de alcohol, en base al promedio de días en una semana, la tasa de hombres y mujeres
que no consumen bebidas alcohólicas aumentó a medida que fueron envejeciendo.
En el caso de la población masculina, después de los 65 años, el consumo en más de 2 días en una semana disminuye, mientras que
el consumo en menos de 1 día aumenta. En las mujeres, por otro lado, la población de entre 70 y 74 años cuenta con la tasa más alta
de consumo, el 14,9% respondió que bebió más de 2 días en una semana.
Cuadro 5.3. Distribución de la población adulta mayor por grupos de edad, según sexo y consumo en días de la semana de alcohol (%)
Consumo de alcohol Total
Grupos de Edad
60-64 65-69 70-74 ≥75
Total 487 100,0% 147 100,0% 110 100,0% 84 100,0% 146 100,0%
No consumió 330 67,8% 88 59,9% 74 67,3% 53 63,1% 115 78,8%
Menos de uno 62 12,7% 21 14,3% 10 9,1% 12 14,3% 19 13,0%
Un día o más 88 18,1% 36 24,5% 22 20,0% 19 22,6% 11 7,5%
No responde 7 1,4% 2 1,4% 4 3,6% - - 1 0,7%
Hombre 190 100,0% 69 100,0% 44 100,0% 37 100,0% 40 100,0%
No consumió 87 45,8% 24 34,8% 18 40,9% 18 48,6% 27 67,5%
Menos de uno 33 17,4% 14 20,3% 5 11,4% 7 18,9% 7 17,5%
Un día o más 65 34,2% 29 42,0% 18 40,9% 12 32,4% 6 15,0%
No responde 5 2,6% 2 2,9% 3 6,8% - - - -
Mujer 297 100,0% 78 100,0% 66 100,0% 47 100,0% 106 100,0%
No consumió 243 81,8% 64 82,1% 56 84,8% 35 74,5% 88 83,0%
Menos de uno 29 9,8% 7 9,0% 5 7,6% 5 10,6% 12 11,3%
Un día o más 23 7,7% 7 9,0% 4 6,1% 7 14,9% 5 4,7%
No responde 2 0,7% - - 1 1,5% - - 1 0,9%
Fuente: DGIS/STP. Encuesta sobre Salud, Bienestar y Envejecimiento (SABE). Paraguay 2017.
CAPÍTULO 5. Consumo de proteínas, vegetales y frutasLa ingesta dietética está asociada con diversas repercusiones en la salud, como las afecciones cardiovasculares y el cáncer. La ingesta
de proteínas es crucial, especialmente en términos de mantenimiento musculo esquelético, mientras que el consumo de frutas y
verduras son fuente de fibra, vitaminas, minerales y antioxidantes.
De acuerdo con los resultados en el cuadro 5.4, la población adulta mayor en Paraguay mantiene una dieta considerablemente bal-
anceada, que incluye altos porcentajes de lácteos y carne, sin embargo, los porcentajes también indican que la población masculina
podría mejorar su consumo de frutas y verduras.
Cuadro 5.4. Distribución de la población adulta mayor por grupo de edad, según sexo consumo de alimentos (%)
Consumo de alimentos 1/ Total
Grupos de Edad
60-64 65-69 70-74 ≥75
Total
Lácteos 430 88,3% 130 88,4% 96 87,3% 73 86,9% 131 89,7%
Huevos o leguminosas 429 88,1% 131 89,1% 95 86,4% 77 91,7% 126 86,3%
Carne, aves o pescado 460 94,5% 143 97,3% 101 91,8% 80 95,2% 136 93,2%
Frutas o verduras 373 76,6% 112 76,2% 84 76,4% 66 78,6% 111 76,0%
Hombre
Lácteos 157 82,6% 54 78,3% 37 84,1% 31 83,8% 35 87,5%
Huevos o leguminosas 171 90,0% 60 87,0% 42 95,5% 36 97,3% 33 82,5%
Carne, aves o pescado 181 95,3% 67 97,1% 41 93,2% 36 97,3% 37 92,5%
Frutas o verduras 128 67,4% 46 66,7% 25 56,8% 28 75,7% 29 72,5%
Mujer
Lácteos 273 91,9% 76 97,4% 59 89,4% 42 89,4% 96 90,6%
Huevos o leguminosas 258 86,9% 71 91,0% 53 80,3% 41 87,2% 93 87,7%
Carne, aves o pescado 279 93,9% 76 97,4% 60 90,9% 44 93,6% 99 93,4%
Frutas o verduras 245 82,5% 66 84,6% 59 89,4% 38 80,9% 82 77,4%
Fuente: DGIS/STP. Encuesta sobre Salud, Bienestar y Envejecimiento (SABE). Paraguay 2017.1/ Diario: lácteos; Al menos una vez por semana: huevo o leguminosas; Al menos tres veces por semana: carne, aves o pescado; Al menos dos veces al día: frutas o verduras.
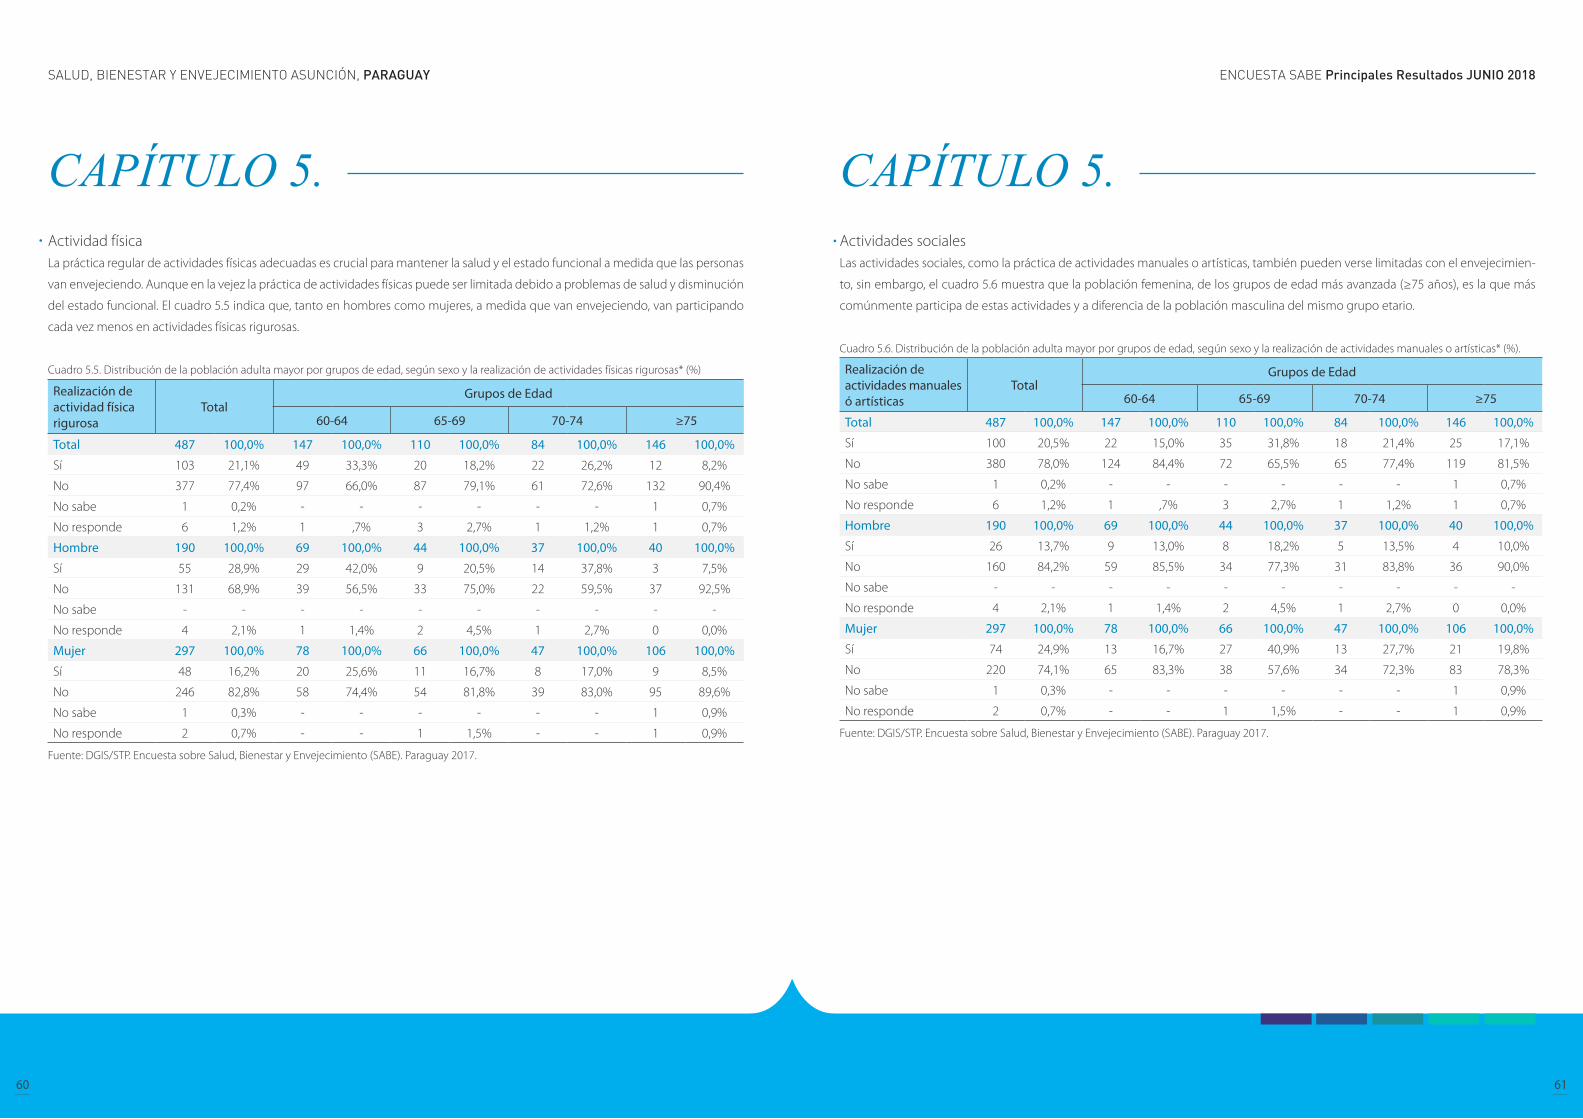
ENCUESTA SABE Principales Resultados JUNIO 2018SALUD, BIENESTAR Y ENVEJECIMIENTO ASUNCIÓN, PARAGUAY
60 61
CAPÍTULO 5. Actividad física La práctica regular de actividades físicas adecuadas es crucial para mantener la salud y el estado funcional a medida que las personas
van envejeciendo. Aunque en la vejez la práctica de actividades físicas puede ser limitada debido a problemas de salud y disminución
del estado funcional. El cuadro 5.5 indica que, tanto en hombres como mujeres, a medida que van envejeciendo, van participando
cada vez menos en actividades físicas rigurosas.
Cuadro 5.5. Distribución de la población adulta mayor por grupos de edad, según sexo y la realización de actividades físicas rigurosas* (%)
Realización de actividad física rigurosa
TotalGrupos de Edad
60-64 65-69 70-74 ≥75
Total 487 100,0% 147 100,0% 110 100,0% 84 100,0% 146 100,0%
Sí 103 21,1% 49 33,3% 20 18,2% 22 26,2% 12 8,2%
No 377 77,4% 97 66,0% 87 79,1% 61 72,6% 132 90,4%
No sabe 1 0,2% - - - - - - 1 0,7%
No responde 6 1,2% 1 ,7% 3 2,7% 1 1,2% 1 0,7%
Hombre 190 100,0% 69 100,0% 44 100,0% 37 100,0% 40 100,0%
Sí 55 28,9% 29 42,0% 9 20,5% 14 37,8% 3 7,5%
No 131 68,9% 39 56,5% 33 75,0% 22 59,5% 37 92,5%
No sabe - - - - - - - - - -
No responde 4 2,1% 1 1,4% 2 4,5% 1 2,7% 0 0,0%
Mujer 297 100,0% 78 100,0% 66 100,0% 47 100,0% 106 100,0%
Sí 48 16,2% 20 25,6% 11 16,7% 8 17,0% 9 8,5%
No 246 82,8% 58 74,4% 54 81,8% 39 83,0% 95 89,6%
No sabe 1 0,3% - - - - - - 1 0,9%
No responde 2 0,7% - - 1 1,5% - - 1 0,9%
Fuente: DGIS/STP. Encuesta sobre Salud, Bienestar y Envejecimiento (SABE). Paraguay 2017.
CAPÍTULO 5. Actividades sociales Las actividades sociales, como la práctica de actividades manuales o artísticas, también pueden verse limitadas con el envejecimien-
to, sin embargo, el cuadro 5.6 muestra que la población femenina, de los grupos de edad más avanzada (≥75 años), es la que más
comúnmente participa de estas actividades y a diferencia de la población masculina del mismo grupo etario.
Cuadro 5.6. Distribución de la población adulta mayor por grupos de edad, según sexo y la realización de actividades manuales o artísticas* (%).
Realización de actividades manuales ó artísticas
TotalGrupos de Edad
60-64 65-69 70-74 ≥75
Total 487 100,0% 147 100,0% 110 100,0% 84 100,0% 146 100,0%
Sí 100 20,5% 22 15,0% 35 31,8% 18 21,4% 25 17,1%
No 380 78,0% 124 84,4% 72 65,5% 65 77,4% 119 81,5%
No sabe 1 0,2% - - - - - - 1 0,7%
No responde 6 1,2% 1 ,7% 3 2,7% 1 1,2% 1 0,7%
Hombre 190 100,0% 69 100,0% 44 100,0% 37 100,0% 40 100,0%
Sí 26 13,7% 9 13,0% 8 18,2% 5 13,5% 4 10,0%
No 160 84,2% 59 85,5% 34 77,3% 31 83,8% 36 90,0%
No sabe - - - - - - - - - -
No responde 4 2,1% 1 1,4% 2 4,5% 1 2,7% 0 0,0%
Mujer 297 100,0% 78 100,0% 66 100,0% 47 100,0% 106 100,0%
Sí 74 24,9% 13 16,7% 27 40,9% 13 27,7% 21 19,8%
No 220 74,1% 65 83,3% 38 57,6% 34 72,3% 83 78,3%
No sabe 1 0,3% - - - - - - 1 0,9%
No responde 2 0,7% - - 1 1,5% - - 1 0,9%
Fuente: DGIS/STP. Encuesta sobre Salud, Bienestar y Envejecimiento (SABE). Paraguay 2017.
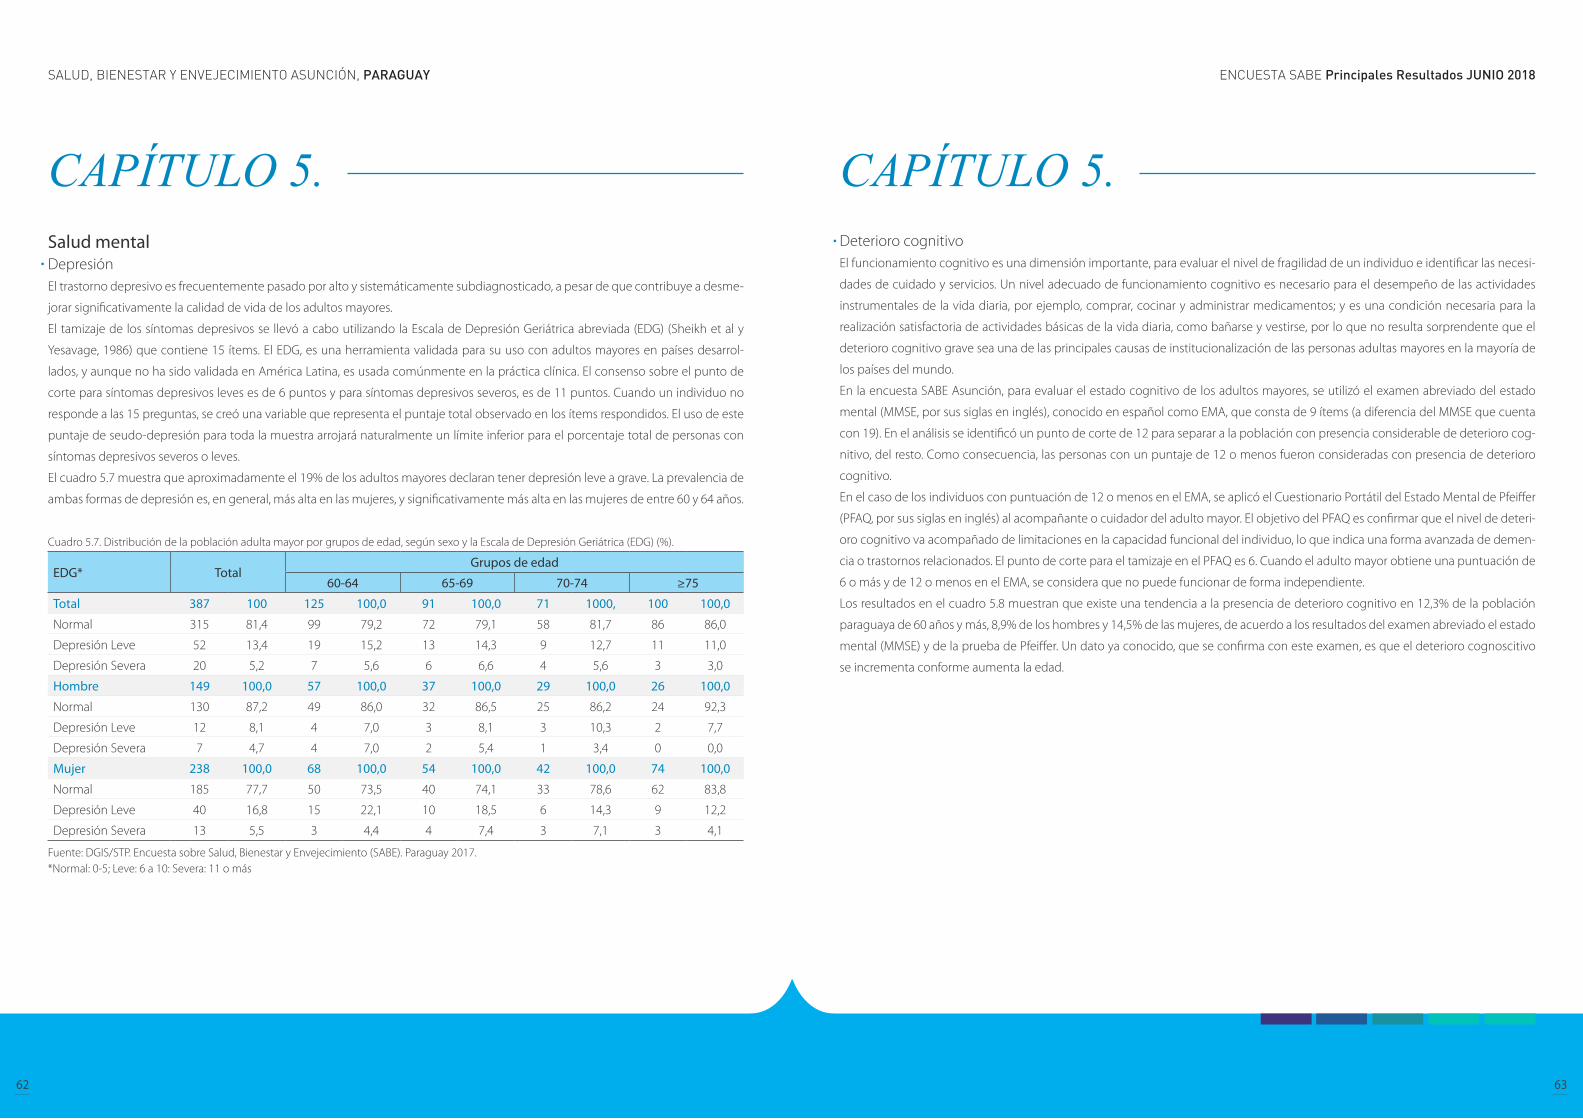
ENCUESTA SABE Principales Resultados JUNIO 2018SALUD, BIENESTAR Y ENVEJECIMIENTO ASUNCIÓN, PARAGUAY
62 63
CAPÍTULO 5. Salud mental Depresión El trastorno depresivo es frecuentemente pasado por alto y sistemáticamente subdiagnosticado, a pesar de que contribuye a desme-
jorar significativamente la calidad de vida de los adultos mayores.
El tamizaje de los síntomas depresivos se llevó a cabo utilizando la Escala de Depresión Geriátrica abreviada (EDG) (Sheikh et al y
Yesavage, 1986) que contiene 15 ítems. El EDG, es una herramienta validada para su uso con adultos mayores en países desarrol-
lados, y aunque no ha sido validada en América Latina, es usada comúnmente en la práctica clínica. El consenso sobre el punto de
corte para síntomas depresivos leves es de 6 puntos y para síntomas depresivos severos, es de 11 puntos. Cuando un individuo no
responde a las 15 preguntas, se creó una variable que representa el puntaje total observado en los ítems respondidos. El uso de este
puntaje de seudo-depresión para toda la muestra arrojará naturalmente un límite inferior para el porcentaje total de personas con
síntomas depresivos severos o leves.
El cuadro 5.7 muestra que aproximadamente el 19% de los adultos mayores declaran tener depresión leve a grave. La prevalencia de
ambas formas de depresión es, en general, más alta en las mujeres, y significativamente más alta en las mujeres de entre 60 y 64 años.
Cuadro 5.7. Distribución de la población adulta mayor por grupos de edad, según sexo y la Escala de Depresión Geriátrica (EDG) (%).
EDG* TotalGrupos de edad
60-64 65-69 70-74 ≥75
Total 387 100 125 100,0 91 100,0 71 1000, 100 100,0
Normal 315 81,4 99 79,2 72 79,1 58 81,7 86 86,0
Depresión Leve 52 13,4 19 15,2 13 14,3 9 12,7 11 11,0
Depresión Severa 20 5,2 7 5,6 6 6,6 4 5,6 3 3,0
Hombre 149 100,0 57 100,0 37 100,0 29 100,0 26 100,0
Normal 130 87,2 49 86,0 32 86,5 25 86,2 24 92,3
Depresión Leve 12 8,1 4 7,0 3 8,1 3 10,3 2 7,7
Depresión Severa 7 4,7 4 7,0 2 5,4 1 3,4 0 0,0
Mujer 238 100,0 68 100,0 54 100,0 42 100,0 74 100,0
Normal 185 77,7 50 73,5 40 74,1 33 78,6 62 83,8
Depresión Leve 40 16,8 15 22,1 10 18,5 6 14,3 9 12,2
Depresión Severa 13 5,5 3 4,4 4 7,4 3 7,1 3 4,1
Fuente: DGIS/STP. Encuesta sobre Salud, Bienestar y Envejecimiento (SABE). Paraguay 2017.*Normal: 0-5; Leve: 6 a 10: Severa: 11 o más
CAPÍTULO 5. Deterioro cognitivo El funcionamiento cognitivo es una dimensión importante, para evaluar el nivel de fragilidad de un individuo e identificar las necesi-
dades de cuidado y servicios. Un nivel adecuado de funcionamiento cognitivo es necesario para el desempeño de las actividades
instrumentales de la vida diaria, por ejemplo, comprar, cocinar y administrar medicamentos; y es una condición necesaria para la
realización satisfactoria de actividades básicas de la vida diaria, como bañarse y vestirse, por lo que no resulta sorprendente que el
deterioro cognitivo grave sea una de las principales causas de institucionalización de las personas adultas mayores en la mayoría de
los países del mundo.
En la encuesta SABE Asunción, para evaluar el estado cognitivo de los adultos mayores, se utilizó el examen abreviado del estado
mental (MMSE, por sus siglas en inglés), conocido en español como EMA, que consta de 9 ítems (a diferencia del MMSE que cuenta
con 19). En el análisis se identificó un punto de corte de 12 para separar a la población con presencia considerable de deterioro cog-
nitivo, del resto. Como consecuencia, las personas con un puntaje de 12 o menos fueron consideradas con presencia de deterioro
cognitivo.
En el caso de los individuos con puntuación de 12 o menos en el EMA, se aplicó el Cuestionario Portátil del Estado Mental de Pfeiffer
(PFAQ, por sus siglas en inglés) al acompañante o cuidador del adulto mayor. El objetivo del PFAQ es confirmar que el nivel de deteri-
oro cognitivo va acompañado de limitaciones en la capacidad funcional del individuo, lo que indica una forma avanzada de demen-
cia o trastornos relacionados. El punto de corte para el tamizaje en el PFAQ es 6. Cuando el adulto mayor obtiene una puntuación de
6 o más y de 12 o menos en el EMA, se considera que no puede funcionar de forma independiente.
Los resultados en el cuadro 5.8 muestran que existe una tendencia a la presencia de deterioro cognitivo en 12,3% de la población
paraguaya de 60 años y más, 8,9% de los hombres y 14,5% de las mujeres, de acuerdo a los resultados del examen abreviado el estado
mental (MMSE) y de la prueba de Pfeiffer. Un dato ya conocido, que se confirma con este examen, es que el deterioro cognoscitivo
se incrementa conforme aumenta la edad.
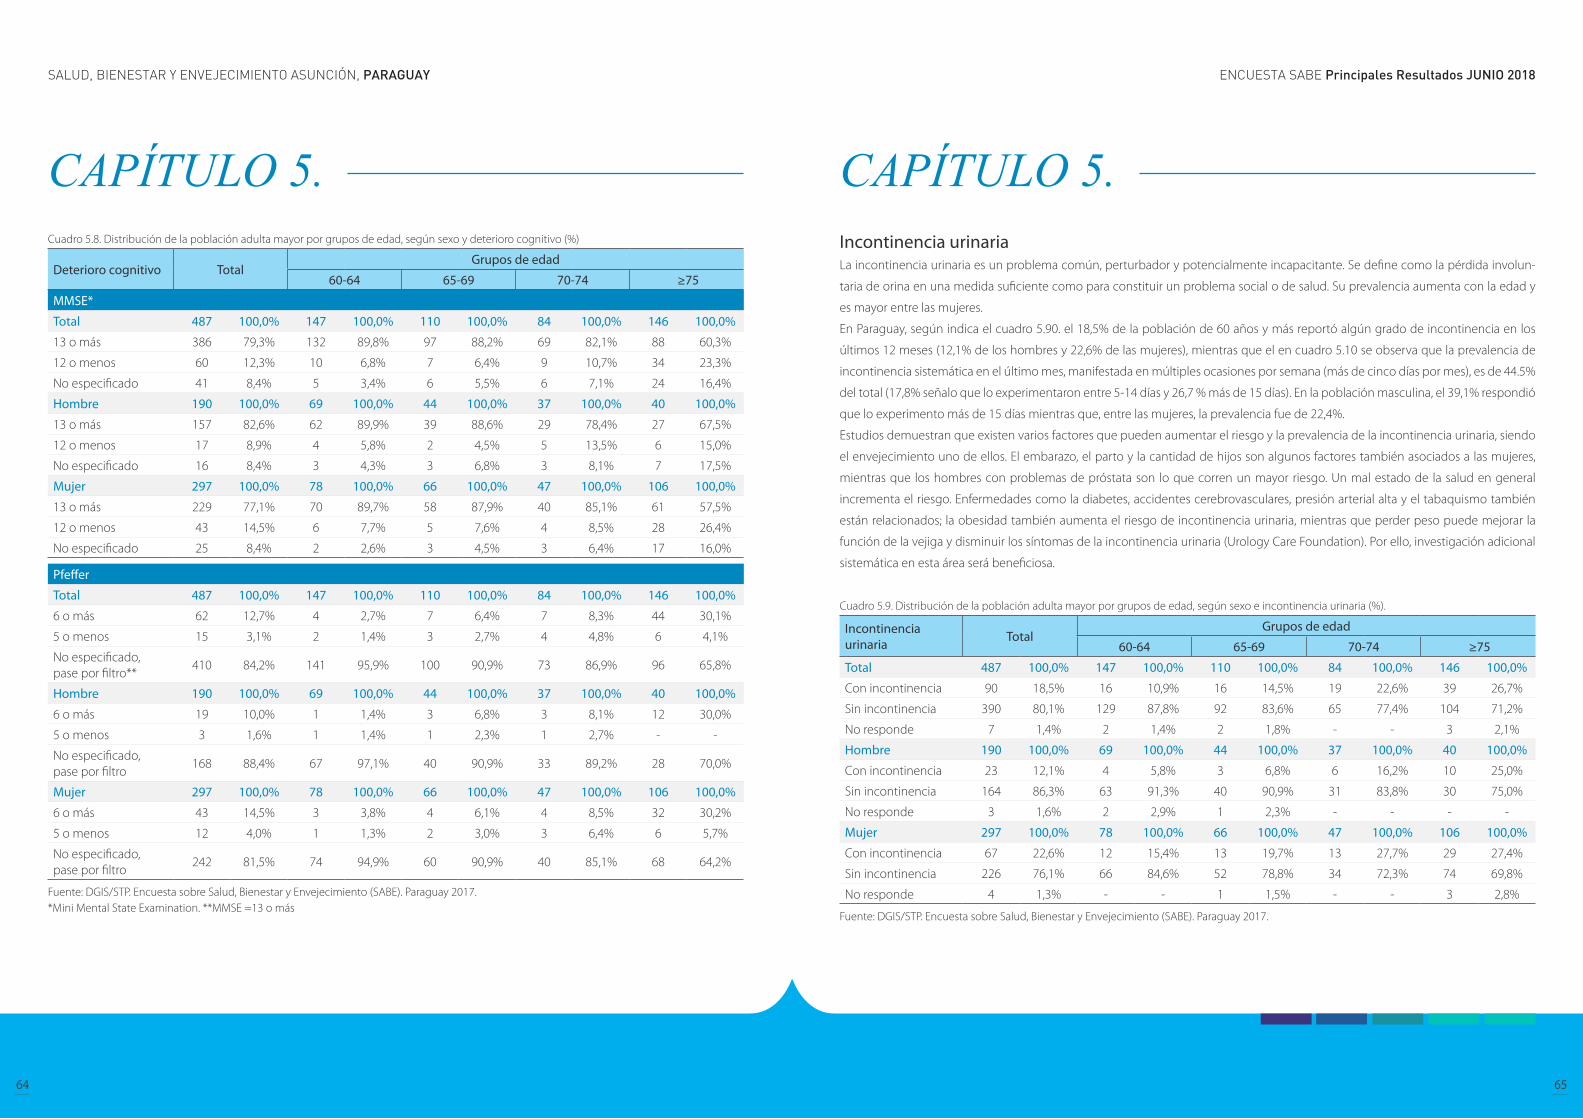
ENCUESTA SABE Principales Resultados JUNIO 2018SALUD, BIENESTAR Y ENVEJECIMIENTO ASUNCIÓN, PARAGUAY
64 65
CAPÍTULO 5. Cuadro 5.8. Distribución de la población adulta mayor por grupos de edad, según sexo y deterioro cognitivo (%)
Deterioro cognitivo TotalGrupos de edad
60-64 65-69 70-74 ≥75
MMSE*
Total 487 100,0% 147 100,0% 110 100,0% 84 100,0% 146 100,0%
13 o más 386 79,3% 132 89,8% 97 88,2% 69 82,1% 88 60,3%
12 o menos 60 12,3% 10 6,8% 7 6,4% 9 10,7% 34 23,3%
No especificado 41 8,4% 5 3,4% 6 5,5% 6 7,1% 24 16,4%
Hombre 190 100,0% 69 100,0% 44 100,0% 37 100,0% 40 100,0%
13 o más 157 82,6% 62 89,9% 39 88,6% 29 78,4% 27 67,5%
12 o menos 17 8,9% 4 5,8% 2 4,5% 5 13,5% 6 15,0%
No especificado 16 8,4% 3 4,3% 3 6,8% 3 8,1% 7 17,5%
Mujer 297 100,0% 78 100,0% 66 100,0% 47 100,0% 106 100,0%
13 o más 229 77,1% 70 89,7% 58 87,9% 40 85,1% 61 57,5%
12 o menos 43 14,5% 6 7,7% 5 7,6% 4 8,5% 28 26,4%
No especificado 25 8,4% 2 2,6% 3 4,5% 3 6,4% 17 16,0%
Pfeffer
Total 487 100,0% 147 100,0% 110 100,0% 84 100,0% 146 100,0%
6 o más 62 12,7% 4 2,7% 7 6,4% 7 8,3% 44 30,1%
5 o menos 15 3,1% 2 1,4% 3 2,7% 4 4,8% 6 4,1%
No especificado, pase por filtro**
410 84,2% 141 95,9% 100 90,9% 73 86,9% 96 65,8%
Hombre 190 100,0% 69 100,0% 44 100,0% 37 100,0% 40 100,0%
6 o más 19 10,0% 1 1,4% 3 6,8% 3 8,1% 12 30,0%
5 o menos 3 1,6% 1 1,4% 1 2,3% 1 2,7% - -
No especificado, pase por filtro
168 88,4% 67 97,1% 40 90,9% 33 89,2% 28 70,0%
Mujer 297 100,0% 78 100,0% 66 100,0% 47 100,0% 106 100,0%
6 o más 43 14,5% 3 3,8% 4 6,1% 4 8,5% 32 30,2%
5 o menos 12 4,0% 1 1,3% 2 3,0% 3 6,4% 6 5,7%
No especificado, pase por filtro
242 81,5% 74 94,9% 60 90,9% 40 85,1% 68 64,2%
Fuente: DGIS/STP. Encuesta sobre Salud, Bienestar y Envejecimiento (SABE). Paraguay 2017.*Mini Mental State Examination. **MMSE =13 o más
CAPÍTULO 5. Incontinencia urinaria La incontinencia urinaria es un problema común, perturbador y potencialmente incapacitante. Se define como la pérdida involun-
taria de orina en una medida suficiente como para constituir un problema social o de salud. Su prevalencia aumenta con la edad y
es mayor entre las mujeres.
En Paraguay, según indica el cuadro 5.90. el 18,5% de la población de 60 años y más reportó algún grado de incontinencia en los
últimos 12 meses (12,1% de los hombres y 22,6% de las mujeres), mientras que el en cuadro 5.10 se observa que la prevalencia de
incontinencia sistemática en el último mes, manifestada en múltiples ocasiones por semana (más de cinco días por mes), es de 44.5%
del total (17,8% señalo que lo experimentaron entre 5-14 días y 26,7 % más de 15 días). En la población masculina, el 39,1% respondió
que lo experimento más de 15 días mientras que, entre las mujeres, la prevalencia fue de 22,4%.
Estudios demuestran que existen varios factores que pueden aumentar el riesgo y la prevalencia de la incontinencia urinaria, siendo
el envejecimiento uno de ellos. El embarazo, el parto y la cantidad de hijos son algunos factores también asociados a las mujeres,
mientras que los hombres con problemas de próstata son lo que corren un mayor riesgo. Un mal estado de la salud en general
incrementa el riesgo. Enfermedades como la diabetes, accidentes cerebrovasculares, presión arterial alta y el tabaquismo también
están relacionados; la obesidad también aumenta el riesgo de incontinencia urinaria, mientras que perder peso puede mejorar la
función de la vejiga y disminuir los síntomas de la incontinencia urinaria (Urology Care Foundation). Por ello, investigación adicional
sistemática en esta área será beneficiosa.
Cuadro 5.9. Distribución de la población adulta mayor por grupos de edad, según sexo e incontinencia urinaria (%).
Incontinencia urinaria Total
Grupos de edad
60-64 65-69 70-74 ≥75
Total 487 100,0% 147 100,0% 110 100,0% 84 100,0% 146 100,0%
Con incontinencia 90 18,5% 16 10,9% 16 14,5% 19 22,6% 39 26,7%
Sin incontinencia 390 80,1% 129 87,8% 92 83,6% 65 77,4% 104 71,2%
No responde 7 1,4% 2 1,4% 2 1,8% - - 3 2,1%
Hombre 190 100,0% 69 100,0% 44 100,0% 37 100,0% 40 100,0%
Con incontinencia 23 12,1% 4 5,8% 3 6,8% 6 16,2% 10 25,0%
Sin incontinencia 164 86,3% 63 91,3% 40 90,9% 31 83,8% 30 75,0%
No responde 3 1,6% 2 2,9% 1 2,3% - - - -
Mujer 297 100,0% 78 100,0% 66 100,0% 47 100,0% 106 100,0%
Con incontinencia 67 22,6% 12 15,4% 13 19,7% 13 27,7% 29 27,4%
Sin incontinencia 226 76,1% 66 84,6% 52 78,8% 34 72,3% 74 69,8%
No responde 4 1,3% - - 1 1,5% - - 3 2,8%
Fuente: DGIS/STP. Encuesta sobre Salud, Bienestar y Envejecimiento (SABE). Paraguay 2017.
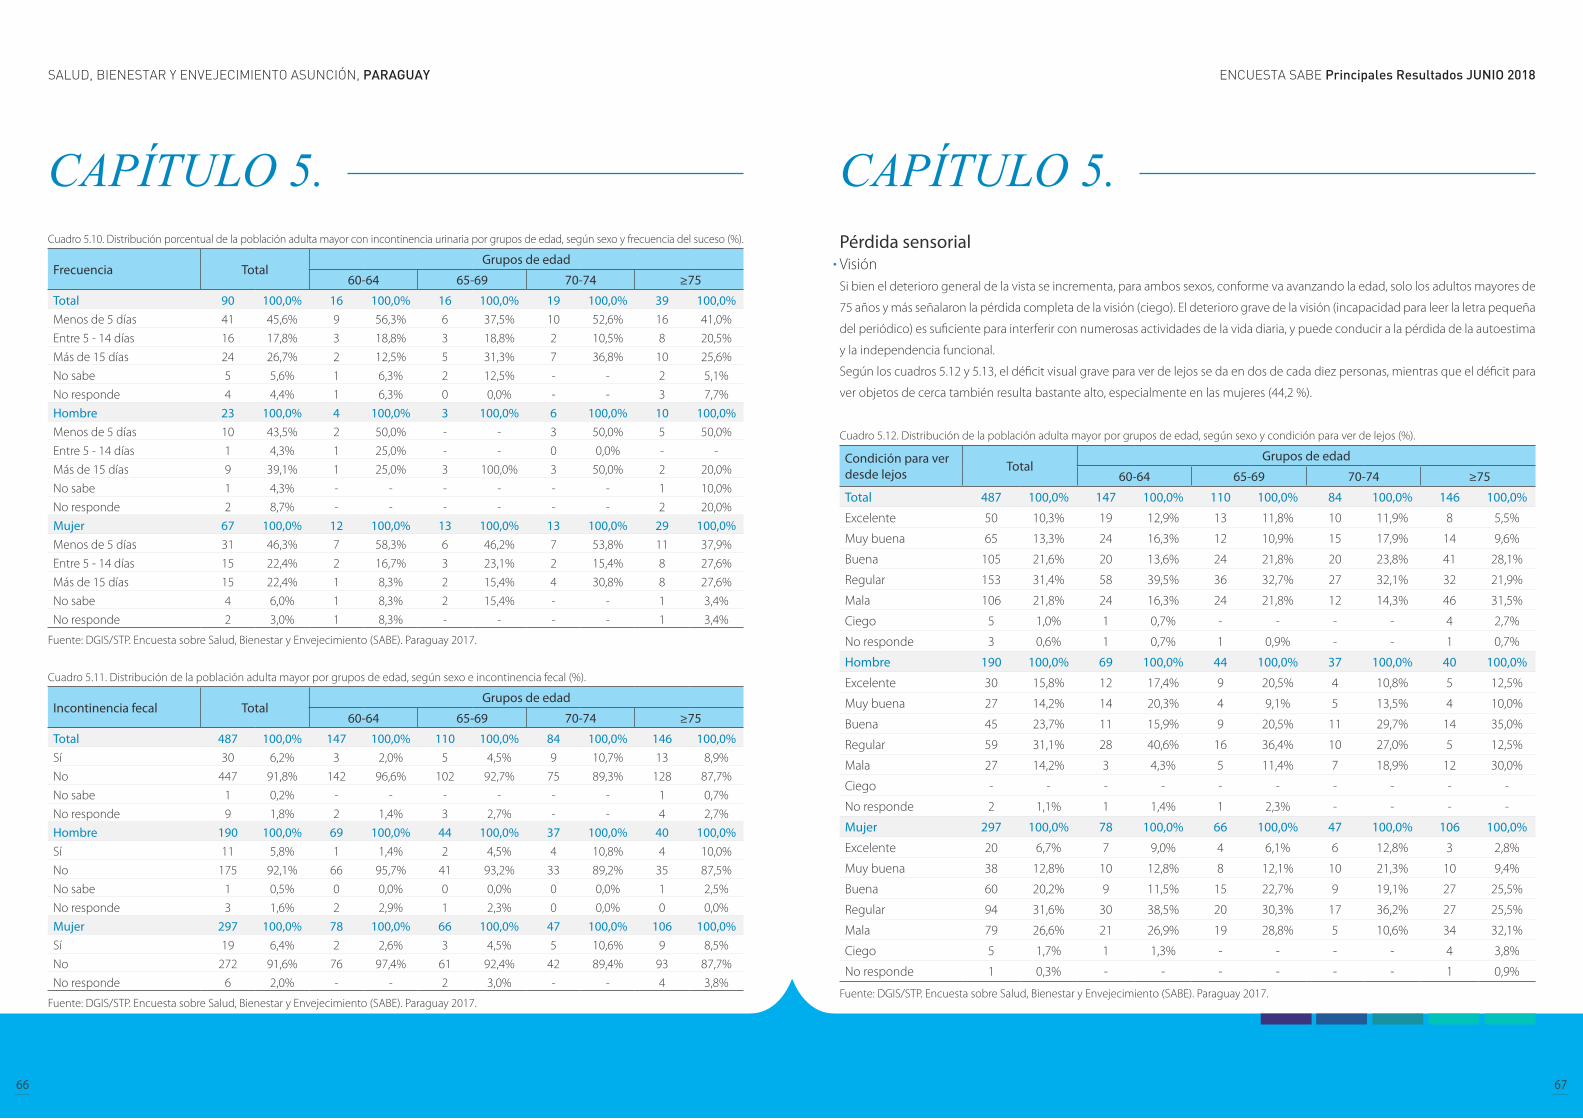
ENCUESTA SABE Principales Resultados JUNIO 2018SALUD, BIENESTAR Y ENVEJECIMIENTO ASUNCIÓN, PARAGUAY
66 67
CAPÍTULO 5. Cuadro 5.10. Distribución porcentual de la población adulta mayor con incontinencia urinaria por grupos de edad, según sexo y frecuencia del suceso (%).
Frecuencia TotalGrupos de edad
60-64 65-69 70-74 ≥75
Total 90 100,0% 16 100,0% 16 100,0% 19 100,0% 39 100,0%Menos de 5 días 41 45,6% 9 56,3% 6 37,5% 10 52,6% 16 41,0%
Entre 5 - 14 días 16 17,8% 3 18,8% 3 18,8% 2 10,5% 8 20,5%
Más de 15 días 24 26,7% 2 12,5% 5 31,3% 7 36,8% 10 25,6%
No sabe 5 5,6% 1 6,3% 2 12,5% - - 2 5,1%
No responde 4 4,4% 1 6,3% 0 0,0% - - 3 7,7%
Hombre 23 100,0% 4 100,0% 3 100,0% 6 100,0% 10 100,0%Menos de 5 días 10 43,5% 2 50,0% - - 3 50,0% 5 50,0%
Entre 5 - 14 días 1 4,3% 1 25,0% - - 0 0,0% - -
Más de 15 días 9 39,1% 1 25,0% 3 100,0% 3 50,0% 2 20,0%
No sabe 1 4,3% - - - - - - 1 10,0%
No responde 2 8,7% - - - - - - 2 20,0%
Mujer 67 100,0% 12 100,0% 13 100,0% 13 100,0% 29 100,0%Menos de 5 días 31 46,3% 7 58,3% 6 46,2% 7 53,8% 11 37,9%
Entre 5 - 14 días 15 22,4% 2 16,7% 3 23,1% 2 15,4% 8 27,6%
Más de 15 días 15 22,4% 1 8,3% 2 15,4% 4 30,8% 8 27,6%
No sabe 4 6,0% 1 8,3% 2 15,4% - - 1 3,4%
No responde 2 3,0% 1 8,3% - - - - 1 3,4%
Fuente: DGIS/STP. Encuesta sobre Salud, Bienestar y Envejecimiento (SABE). Paraguay 2017.
Cuadro 5.11. Distribución de la población adulta mayor por grupos de edad, según sexo e incontinencia fecal (%).
Incontinencia fecal TotalGrupos de edad
60-64 65-69 70-74 ≥75
Total 487 100,0% 147 100,0% 110 100,0% 84 100,0% 146 100,0%Sí 30 6,2% 3 2,0% 5 4,5% 9 10,7% 13 8,9%
No 447 91,8% 142 96,6% 102 92,7% 75 89,3% 128 87,7%
No sabe 1 0,2% - - - - - - 1 0,7%
No responde 9 1,8% 2 1,4% 3 2,7% - - 4 2,7%
Hombre 190 100,0% 69 100,0% 44 100,0% 37 100,0% 40 100,0%Sí 11 5,8% 1 1,4% 2 4,5% 4 10,8% 4 10,0%
No 175 92,1% 66 95,7% 41 93,2% 33 89,2% 35 87,5%
No sabe 1 0,5% 0 0,0% 0 0,0% 0 0,0% 1 2,5%
No responde 3 1,6% 2 2,9% 1 2,3% 0 0,0% 0 0,0%
Mujer 297 100,0% 78 100,0% 66 100,0% 47 100,0% 106 100,0%Sí 19 6,4% 2 2,6% 3 4,5% 5 10,6% 9 8,5%
No 272 91,6% 76 97,4% 61 92,4% 42 89,4% 93 87,7%
No responde 6 2,0% - - 2 3,0% - - 4 3,8%
Fuente: DGIS/STP. Encuesta sobre Salud, Bienestar y Envejecimiento (SABE). Paraguay 2017.
CAPÍTULO 5. Pérdida sensorialVisiónSi bien el deterioro general de la vista se incrementa, para ambos sexos, conforme va avanzando la edad, solo los adultos mayores de
75 años y más señalaron la pérdida completa de la visión (ciego). El deterioro grave de la visión (incapacidad para leer la letra pequeña
del periódico) es suficiente para interferir con numerosas actividades de la vida diaria, y puede conducir a la pérdida de la autoestima
y la independencia funcional.
Según los cuadros 5.12 y 5.13, el déficit visual grave para ver de lejos se da en dos de cada diez personas, mientras que el déficit para
ver objetos de cerca también resulta bastante alto, especialmente en las mujeres (44,2 %).
Cuadro 5.12. Distribución de la población adulta mayor por grupos de edad, según sexo y condición para ver de lejos (%).
Condición para ver desde lejos Total
Grupos de edad
60-64 65-69 70-74 ≥75
Total 487 100,0% 147 100,0% 110 100,0% 84 100,0% 146 100,0%
Excelente 50 10,3% 19 12,9% 13 11,8% 10 11,9% 8 5,5%
Muy buena 65 13,3% 24 16,3% 12 10,9% 15 17,9% 14 9,6%
Buena 105 21,6% 20 13,6% 24 21,8% 20 23,8% 41 28,1%
Regular 153 31,4% 58 39,5% 36 32,7% 27 32,1% 32 21,9%
Mala 106 21,8% 24 16,3% 24 21,8% 12 14,3% 46 31,5%
Ciego 5 1,0% 1 0,7% - - - - 4 2,7%
No responde 3 0,6% 1 0,7% 1 0,9% - - 1 0,7%
Hombre 190 100,0% 69 100,0% 44 100,0% 37 100,0% 40 100,0%
Excelente 30 15,8% 12 17,4% 9 20,5% 4 10,8% 5 12,5%
Muy buena 27 14,2% 14 20,3% 4 9,1% 5 13,5% 4 10,0%
Buena 45 23,7% 11 15,9% 9 20,5% 11 29,7% 14 35,0%
Regular 59 31,1% 28 40,6% 16 36,4% 10 27,0% 5 12,5%
Mala 27 14,2% 3 4,3% 5 11,4% 7 18,9% 12 30,0%
Ciego - - - - - - - - - -
No responde 2 1,1% 1 1,4% 1 2,3% - - - -
Mujer 297 100,0% 78 100,0% 66 100,0% 47 100,0% 106 100,0%
Excelente 20 6,7% 7 9,0% 4 6,1% 6 12,8% 3 2,8%
Muy buena 38 12,8% 10 12,8% 8 12,1% 10 21,3% 10 9,4%
Buena 60 20,2% 9 11,5% 15 22,7% 9 19,1% 27 25,5%
Regular 94 31,6% 30 38,5% 20 30,3% 17 36,2% 27 25,5%
Mala 79 26,6% 21 26,9% 19 28,8% 5 10,6% 34 32,1%
Ciego 5 1,7% 1 1,3% - - - - 4 3,8%
No responde 1 0,3% - - - - - - 1 0,9%
Fuente: DGIS/STP. Encuesta sobre Salud, Bienestar y Envejecimiento (SABE). Paraguay 2017.

ENCUESTA SABE Principales Resultados JUNIO 2018SALUD, BIENESTAR Y ENVEJECIMIENTO ASUNCIÓN, PARAGUAY
68 69
CAPÍTULO 5. Cuadro 5.13. Distribución de la población adulta mayor por grupos de edad, según sexo y condición para ver de cerca (%).
Condición para ver de cerca Total
Grupos de edad
60-64 65-69 70-74 ≥75
Total 482 100,0% 146 100,0% 110 100,0% 84 100,0% 142 100,0%
Excelente 17 3,5% 1 0,7% 4 3,6% 4 4,8% 8 5,6%
Muy buena 24 5,0% 9 6,2% 4 3,6% 2 2,4% 9 6,3%
Buena 78 16,2% 20 13,7% 13 11,8% 21 25,0% 24 16,9%
Regular 166 34,4% 55 37,7% 42 38,2% 23 27,4% 46 32,4%
Mala 192 39,8% 59 40,4% 46 41,8% 33 39,3% 54 38,0%
No sabe 2 0,4% 1 0,7% - - 1 1,2% - -
No responde 3 0,6% 1 0,7% 1 0,9% - - 1 0,7%
Hombre 190 100,0% 69 100,0% 44 100,0% 37 100,0% 40 100,0%
Excelente 11 5,8% 1 1,4% 3 6,8% 2 5,4% 5 12,5%
Muy buena 14 7,4% 7 10,1% 3 6,8% 1 2,7% 3 7,5%
Buena 28 14,7% 12 17,4% 4 9,1% 8 21,6% 4 10,0%
Regular 70 36,8% 29 42,0% 18 40,9% 10 27,0% 13 32,5%
Mala 63 33,2% 18 26,1% 15 34,1% 15 40,5% 15 37,5%
No sabe 2 1,1% 1 1,4% - - 1 2,7% - -
No responde 2 1,1% 1 1,4% 1 2,3% 0 0,0% - -
Mujer 292 100,0% 77 100,0% 66 100,0% 47 100,0% 102 100,0%
Excelente 6 2,1% 0 0,0% 1 1,5% 2 4,3% 3 2,9%
Muy buena 10 3,4% 2 2,6% 1 1,5% 1 2,1% 6 5,9%
Buena 50 17,1% 8 10,4% 9 13,6% 13 27,7% 20 19,6%
Regular 96 32,9% 26 33,8% 24 36,4% 13 27,7% 33 32,4%
Mala 129 44,2% 41 53,2% 31 47,0% 18 38,3% 39 38,2%
No sabe - - - - - - - - - -
No responde 1 0,3% - - - - - - 1 1,0%
Fuente: DGIS/STP. Encuesta sobre Salud, Bienestar y Envejecimiento (SABE). Paraguay 2017.
CAPÍTULO 5. Audición La pérdida de audición también ocurre gradualmente en la mayoría de las personas a medida que avanza la edad y es una de las
afecciones sensoriales más comunes que afectan a los adultos mayores. El deterioro de la audición limita la funcionalidad y conduce
al aislamiento. En EE. UU, no más del 1% de los jóvenes padecen esta afección, mientras que su prevalencia es del 24% entre los 65 a
74 años y del 39% por encima de los 75 años.
En el cuadro 5.14 se muestra que el 21,2% de la población de 60 años y más reportó tener audición normal o mala y la frecuencia del
déficit aumenta a medida que la edad aumenta. El déficit auditivo también puede ser un factor de riesgo para otras discapacidades
y merece reconocimiento, abordaje terapéutico y seguimiento.
Cuadro 5.14. Distribución de la población adulta mayor por grupos de edad, según sexo y condición de audición (%).
Condición de audición Total
Grupos de edad
60-64 65-69 70-74 ≥75
Total 487 100,0% 147 100,0% 110 100,0% 84 100,0% 146 100,0%
Excelente 84 17,2% 34 23,1% 22 20,0% 12 14,3% 16 11,0%
Muy buena 134 27,5% 48 32,7% 28 25,5% 25 29,8% 33 22,6%
Buena 161 33,1% 38 25,9% 41 37,3% 29 34,5% 53 36,3%
Regular 88 18,1% 24 16,3% 14 12,7% 16 19,0% 34 23,3%
Mala 15 3,1% 1 0,7% 3 2,7% 2 2,4% 9 6,2%
No responde 5 1,0% 2 1,4% 2 1,8% - - 1 0,7%
Hombre 190 100,0% 69 100,0% 44 100,0% 37 100,0% 40 100,0%
Excelente 25 13,2% 9 13,0% 10 22,7% 3 8,1% 3 7,5%
Muy buena 55 28,9% 26 37,7% 8 18,2% 13 35,1% 8 20,0%
Buena 63 33,2% 19 27,5% 15 34,1% 13 35,1% 16 40,0%
Regular 39 20,5% 13 18,8% 9 20,5% 7 18,9% 10 25,0%
Mala 5 2,6% - - 1 2,3% 1 2,7% 3 7,5%
No responde 3 1,6% 2 2,9% 1 2,3% - - - -
Mujer 297 100,0% 78 100,0% 66 100,0% 47 100,0% 106 100,0%
Excelente 59 19,9% 25 32,1% 12 18,2% 9 19,1% 13 12,3%
Muy buena 79 26,6% 22 28,2% 20 30,3% 12 25,5% 25 23,6%
Buena 98 33,0% 19 24,4% 26 39,4% 16 34,0% 37 34,9%
Regular 49 16,5% 11 14,1% 5 7,6% 9 19,1% 24 22,6%
Mala 10 3,4% 1 1,3% 2 3,0% 1 2,1% 6 5,7%
No responde 2 0,7% - - 1 1,5% - - 1 0,9%
Fuente: DGIS/STP. Encuesta sobre Salud, Bienestar y Envejecimiento (SABE). Paraguay 2017.
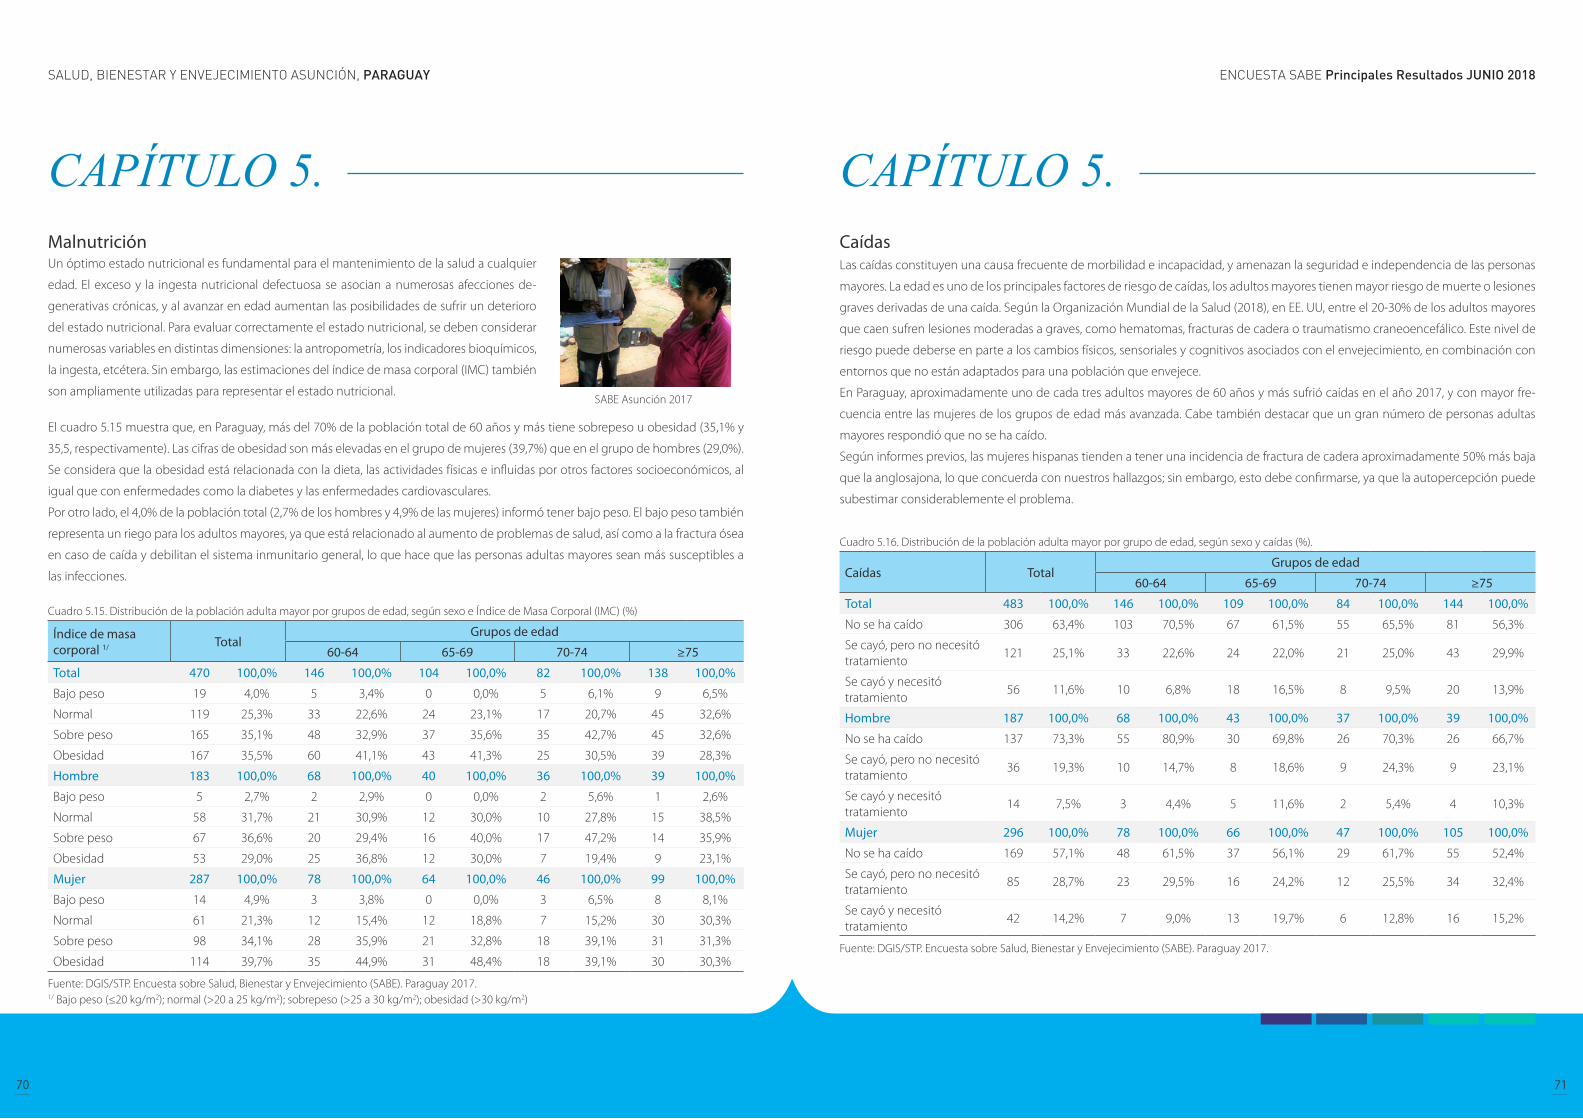
ENCUESTA SABE Principales Resultados JUNIO 2018SALUD, BIENESTAR Y ENVEJECIMIENTO ASUNCIÓN, PARAGUAY
70 71
CAPÍTULO 5. Malnutrición
El cuadro 5.15 muestra que, en Paraguay, más del 70% de la población total de 60 años y más tiene sobrepeso u obesidad (35,1% y
35,5, respectivamente). Las cifras de obesidad son más elevadas en el grupo de mujeres (39,7%) que en el grupo de hombres (29,0%).
Se considera que la obesidad está relacionada con la dieta, las actividades físicas e influidas por otros factores socioeconómicos, al
igual que con enfermedades como la diabetes y las enfermedades cardiovasculares.
Por otro lado, el 4,0% de la población total (2,7% de los hombres y 4,9% de las mujeres) informó tener bajo peso. El bajo peso también
representa un riego para los adultos mayores, ya que está relacionado al aumento de problemas de salud, así como a la fractura ósea
en caso de caída y debilitan el sistema inmunitario general, lo que hace que las personas adultas mayores sean más susceptibles a
las infecciones.
Cuadro 5.15. Distribución de la población adulta mayor por grupos de edad, según sexo e Índice de Masa Corporal (IMC) (%)
Índice de masa corporal 1/ Total
Grupos de edad
60-64 65-69 70-74 ≥75
Total 470 100,0% 146 100,0% 104 100,0% 82 100,0% 138 100,0%
Bajo peso 19 4,0% 5 3,4% 0 0,0% 5 6,1% 9 6,5%
Normal 119 25,3% 33 22,6% 24 23,1% 17 20,7% 45 32,6%
Sobre peso 165 35,1% 48 32,9% 37 35,6% 35 42,7% 45 32,6%
Obesidad 167 35,5% 60 41,1% 43 41,3% 25 30,5% 39 28,3%
Hombre 183 100,0% 68 100,0% 40 100,0% 36 100,0% 39 100,0%
Bajo peso 5 2,7% 2 2,9% 0 0,0% 2 5,6% 1 2,6%
Normal 58 31,7% 21 30,9% 12 30,0% 10 27,8% 15 38,5%
Sobre peso 67 36,6% 20 29,4% 16 40,0% 17 47,2% 14 35,9%
Obesidad 53 29,0% 25 36,8% 12 30,0% 7 19,4% 9 23,1%
Mujer 287 100,0% 78 100,0% 64 100,0% 46 100,0% 99 100,0%
Bajo peso 14 4,9% 3 3,8% 0 0,0% 3 6,5% 8 8,1%
Normal 61 21,3% 12 15,4% 12 18,8% 7 15,2% 30 30,3%
Sobre peso 98 34,1% 28 35,9% 21 32,8% 18 39,1% 31 31,3%
Obesidad 114 39,7% 35 44,9% 31 48,4% 18 39,1% 30 30,3%
Fuente: DGIS/STP. Encuesta sobre Salud, Bienestar y Envejecimiento (SABE). Paraguay 2017.1/ Bajo peso (≤20 kg/m2); normal (>20 a 25 kg/m2); sobrepeso (>25 a 30 kg/m2); obesidad (>30 kg/m2)
Un óptimo estado nutricional es fundamental para el mantenimiento de la salud a cualquier
edad. El exceso y la ingesta nutricional defectuosa se asocian a numerosas afecciones de-
generativas crónicas, y al avanzar en edad aumentan las posibilidades de sufrir un deterioro
del estado nutricional. Para evaluar correctamente el estado nutricional, se deben considerar
numerosas variables en distintas dimensiones: la antropometría, los indicadores bioquímicos,
la ingesta, etcétera. Sin embargo, las estimaciones del índice de masa corporal (IMC) también
son ampliamente utilizadas para representar el estado nutricional.SABE Asunción 2017
CAPÍTULO 5. Caídas Las caídas constituyen una causa frecuente de morbilidad e incapacidad, y amenazan la seguridad e independencia de las personas
mayores. La edad es uno de los principales factores de riesgo de caídas, los adultos mayores tienen mayor riesgo de muerte o lesiones
graves derivadas de una caída. Según la Organización Mundial de la Salud (2018), en EE. UU, entre el 20-30% de los adultos mayores
que caen sufren lesiones moderadas a graves, como hematomas, fracturas de cadera o traumatismo craneoencefálico. Este nivel de
riesgo puede deberse en parte a los cambios físicos, sensoriales y cognitivos asociados con el envejecimiento, en combinación con
entornos que no están adaptados para una población que envejece.
En Paraguay, aproximadamente uno de cada tres adultos mayores de 60 años y más sufrió caídas en el año 2017, y con mayor fre-
cuencia entre las mujeres de los grupos de edad más avanzada. Cabe también destacar que un gran número de personas adultas
mayores respondió que no se ha caído.
Según informes previos, las mujeres hispanas tienden a tener una incidencia de fractura de cadera aproximadamente 50% más baja
que la anglosajona, lo que concuerda con nuestros hallazgos; sin embargo, esto debe confirmarse, ya que la autopercepción puede
subestimar considerablemente el problema.
Cuadro 5.16. Distribución de la población adulta mayor por grupo de edad, según sexo y caídas (%).
Caídas TotalGrupos de edad
60-64 65-69 70-74 ≥75
Total 483 100,0% 146 100,0% 109 100,0% 84 100,0% 144 100,0%
No se ha caído 306 63,4% 103 70,5% 67 61,5% 55 65,5% 81 56,3%
Se cayó, pero no necesitó tratamiento
121 25,1% 33 22,6% 24 22,0% 21 25,0% 43 29,9%
Se cayó y necesitó tratamiento
56 11,6% 10 6,8% 18 16,5% 8 9,5% 20 13,9%
Hombre 187 100,0% 68 100,0% 43 100,0% 37 100,0% 39 100,0%
No se ha caído 137 73,3% 55 80,9% 30 69,8% 26 70,3% 26 66,7%
Se cayó, pero no necesitó tratamiento
36 19,3% 10 14,7% 8 18,6% 9 24,3% 9 23,1%
Se cayó y necesitó tratamiento
14 7,5% 3 4,4% 5 11,6% 2 5,4% 4 10,3%
Mujer 296 100,0% 78 100,0% 66 100,0% 47 100,0% 105 100,0%
No se ha caído 169 57,1% 48 61,5% 37 56,1% 29 61,7% 55 52,4%
Se cayó, pero no necesitó tratamiento
85 28,7% 23 29,5% 16 24,2% 12 25,5% 34 32,4%
Se cayó y necesitó tratamiento
42 14,2% 7 9,0% 13 19,7% 6 12,8% 16 15,2%
Fuente: DGIS/STP. Encuesta sobre Salud, Bienestar y Envejecimiento (SABE). Paraguay 2017.

ENCUESTA SABE Principales Resultados JUNIO 2018SALUD, BIENESTAR Y ENVEJECIMIENTO ASUNCIÓN, PARAGUAY
72 73
CAPÍTULO 5. OsteoporosisLa osteoporosis, que literalmente significa hueso poroso, es una enfermedad en la que se reduce la densidad y la calidad del hueso. A
medida que los huesos se vuelven más porosos y frágiles, el riesgo de fractura aumenta considerablemente. Algunos de los factores
de riesgo incluyen la edad y el sexo femenino, así como el consumo de alcohol y el tabaquismo.
Se estima que la osteoporosis afecta a 200 millones de mujeres en todo el mundo, aproximadamente una décima parte de las mu-
jeres de 60 años, una quinta parte de las mujeres de 70 años, dos quintos de las mujeres de 80 y dos tercios de las mujeres de 90 (Inter-
national Osteoporosis Foundation, 2018). En esta encuesta, la frecuencia de la osteoporosis se midió mediante autopercepción, y el
13,1% de las mujeres respondieron que se les habían diagnosticado osteoporosis, las cifras son similares en todos los grupos de edad.
Cuadro 5.17. Distribución de la población adulta mayor por grupos de edad, según sexo y diagnóstico positivo de osteoporosis (%)
Diagnostico positivo de osteoporosis
TotalGrupos de edad
60-64 65-69 70-74 ≥75
Total 487 100,0% 147 100,0% 110 100,0% 84 100,0% 146 100,0%
Sí 40 8,2% 10 6,8% 9 8,2% 7 8,3% 14 9,6%
No 439 90,1% 134 91,2% 99 90,0% 76 90,5% 130 89,0%
No sabe 1 0,2% - - - - - - 1 0,7%
No responde 7 1,4% 3 2,0% 2 1,8% 1 1,2% 1 0,7%
Hombre 190 100,0% 69 100,0% 44 100,0% 37 100,0% 40 100,0%
Sí 1 0,5% - - - - 1 2,7% - -
No 185 97,4% 67 97,1% 42 95,5% 36 97,3% 40 100,0%
No sabe - - - - - - - - - -
No responde 4 2,1% 2 2,9% 2 4,5% - - - -
Mujer 297 100,0% 78 100,0% 66 100,0% 47 100,0% 106 100,0%
Sí 39 13,1% 10 12,8% 9 13,6% 6 12,8% 14 13,2%
No 254 85,5% 67 85,9% 57 86,4% 40 85,1% 90 84,9%
No sabe 1 0,3% - - - - - - 1 0,9%
No responde 3 1,0% 1 1,3% - - 1 2,1% 1 0,9%
Fuente: DGIS/STP. Encuesta sobre Salud, Bienestar y Envejecimiento (SABE). Paraguay 2017.
CAPÍTULO 5. Enfermedades crónicas Los adultos mayores se ven desproporcionadamente afectados por afecciones crónicas como la diabetes, la artritis y las enferme-
dades cardíacas. En los EUA las principales causas de muerte en los adultos mayores son las enfermedades crónicas, como enferme-
dades cardíacas, cáncer, ACV, enfermedades crónicas de las vías respiratorias inferiores, Alzheimer y diabetes (Consejo Nacional sobre
el Envejecimiento). Las enfermedades crónicas pueden limitar la capacidad de una persona para realizar actividades diarias, lo que
hace que pierda independencia y necesite apoyo y cuidado.
En Paraguay, según se expresa en el cuadro 5.18, la hipertensión, la artritis y la diabetes son las enfermedades crónicas más preva-
lentes en los adultos mayores y en las tres afecciones, la población femenina es la que padece con mayor frecuencia en comparación
a la población masculina. También, como se puede observar en el cuadro 5.79 más del 50% de la población total reportó tener una
o dos afecciones crónicas, siendo las mujeres las que más padecen condiciones comórbidas. Cabe destacar que como estas cifras se
basan en condiciones autopercibidas no se puede determinar si las altas tasas de prevalencia entre las mujeres, en comparación a los
hombres, corresponden a diferencias reales de prevalencia o a otros factores, como por ejemplo, las mujeres tienen más probabili-
dades de ser diagnosticadas porque visitan los establecimientos de salud con mayor frecuencia, mientras que los hombres son más
propensos a evitar las consultas médicas, o al menos hasta que la enfermedad haya progresado.

ENCUESTA SABE Principales Resultados JUNIO 2018SALUD, BIENESTAR Y ENVEJECIMIENTO ASUNCIÓN, PARAGUAY
74 75
CAPÍTULO 5. Cuadro 5.18. Distribución de la población adulta mayor por grupos de edad, según sexo y tipo de padecimiento crónico (%).
Padecimiento crónico TotalGrupos de edad
60-64 65-69 70-74 ≥75
Total
Hipertensión 312 64,1% 82 55,8% 79 71,8% 52 61,9% 99 67,8%
Diabetes 134 27,5% 30 20,4% 34 30,9% 22 26,2% 48 32,9%
Cáncer 19 3,9% 3 2,0% 5 4,5% 3 3,6% 8 5,5%
Enfermedad pulmonar 63 12,9% 15 10,2% 15 13,6% 9 10,7% 24 16,4%
Enfermedad del corazón
71 14,6% 18 12,2% 18 16,4% 11 13,1% 24 16,4%
Padecimiento cerebral 43 8,8% 13 8,8% 10 9,1% 4 4,8% 16 11,0%
Artritis/artrosis/reumatismo
193 39,6% 47 32,0% 55 50,0% 32 38,1% 59 40,4%
Hombre
Hipertensión 107 56,3% 39 56,5% 25 56,8% 18 48,6% 25 62,5%
Diabetes 38 20,0% 12 17,4% 9 20,5% 4 10,8% 13 32,5%
Cáncer 3 1,6% 0 0,0% 0 0,0% 2 5,4% 1 2,5%
Enfermedad pulmonar 23 12,1% 7 10,1% 5 11,4% 4 10,8% 7 17,5%
Enfermedad del corazón
23 12,1% 8 11,6% 6 13,6% 3 8,1% 6 15,0%
Padecimiento cerebral 16 8,4% 6 8,7% 4 9,1% 1 2,7% 5 12,5%
Artritis/artrosis/reumatismo
41 21,6% 9 13,0% 13 29,5% 9 24,3% 10 25,0%
Mujer
Hipertensión 205 69,0% 43 55,1% 54 81,8% 34 72,3% 74 69,8%
Diabetes 96 32,3% 18 23,1% 25 37,9% 18 38,3% 35 33,0%
Cáncer 16 5,4% 3 3,8% 5 7,6% 1 2,1% 7 6,6%
Enfermedad pulmonar 40 13,5% 8 10,3% 10 15,2% 5 10,6% 17 16,0%
Enfermedad del corazón
48 16,2% 10 12,8% 12 18,2% 8 17,0% 18 17,0%
Padecimiento cerebral 27 9,1% 7 9,0% 6 9,1% 3 6,4% 11 10,4%
Artritis/artrosis/reumatismo
152 51,2% 38 48,7% 42 63,6% 23 48,9% 49 46,2%
Fuente: DGIS/STP. Encuesta sobre Salud, Bienestar y Envejecimiento (SABE). Paraguay 2017.
CAPÍTULO 5. Cuadro 5.19. Distribución de la población adulta mayor por grupos de edad, según sexo y número de padecimientos crónicos (%).
Número de padecimientos crónicos
TotalGrupos de edad
60-64 65-69 70-74 ≥75
Total 487 100,0% 147 100,0% 110 100,0% 84 100,0% 146 100,0%
0 88 18,1% 37 25,2% 12 10,9% 20 23,8% 19 13,0%
1 131 26,9% 45 30,6% 24 21,8% 20 23,8% 42 28,8%
2 144 29,6% 38 25,9% 42 38,2% 26 31,0% 38 26,0%
3 87 17,9% 22 15,0% 21 19,1% 12 14,3% 32 21,9%
4 30 6,2% 4 2,7% 10 9,1% 5 6,0% 11 7,5%
5 7 1,4% 1 0,7% 1 0,9% 1 1,2% 4 2,7%
Hombre 190 100,0% 69 100,0% 44 100,0% 37 100,0% 40 100,0%
0 59 31,1% 23 33,3% 11 25,0% 16 43,2% 9 22,5%
1 50 26,3% 22 31,9% 10 22,7% 7 18,9% 11 27,5%
2 50 26,3% 15 21,7% 18 40,9% 9 24,3% 8 20,0%
3 24 12,6% 7 10,1% 4 9,1% 4 10,8% 9 22,5%
4 6 3,2% 2 2,9% 1 2,3% 1 2,7% 2 5,0%
5 1 0,5% - - - - - - 1 2,5%
Mujer 297 100,0% 78 100,0% 66 100,0% 47 100,0% 106 100,0%
0 29 9,8% 14 17,9% 1 1,5% 4 8,5% 10 9,4%
1 81 27,3% 23 29,5% 14 21,2% 13 27,7% 31 29,2%
2 94 31,6% 23 29,5% 24 36,4% 17 36,2% 30 28,3%
3 63 21,2% 15 19,2% 17 25,8% 8 17,0% 23 21,7%
4 24 8,1% 2 2,6% 9 13,6% 4 8,5% 9 8,5%
5 6 2,0% 1 1,3% 1 1,5% 1 2,1% 3 2,8%
Fuente: DGIS/STP. Encuesta sobre Salud, Bienestar y Envejecimiento (SABE). Paraguay 2017.
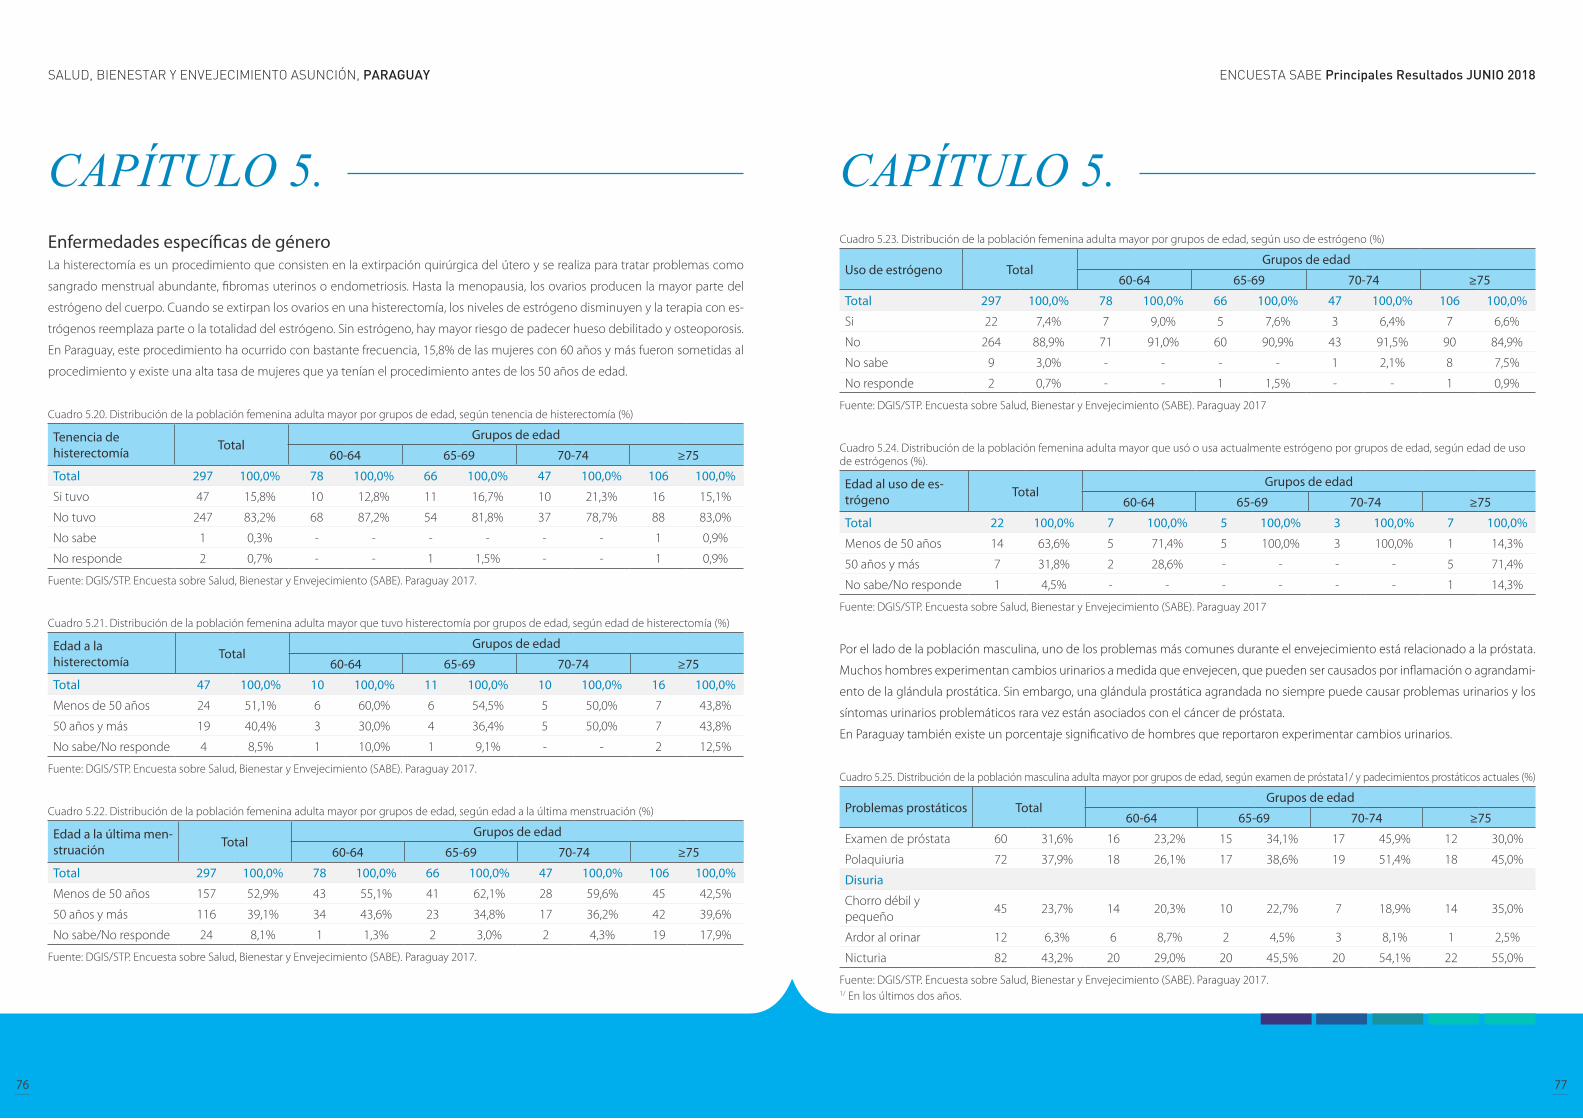
ENCUESTA SABE Principales Resultados JUNIO 2018SALUD, BIENESTAR Y ENVEJECIMIENTO ASUNCIÓN, PARAGUAY
76 77
CAPÍTULO 5. Enfermedades específicas de género La histerectomía es un procedimiento que consisten en la extirpación quirúrgica del útero y se realiza para tratar problemas como
sangrado menstrual abundante, fibromas uterinos o endometriosis. Hasta la menopausia, los ovarios producen la mayor parte del
estrógeno del cuerpo. Cuando se extirpan los ovarios en una histerectomía, los niveles de estrógeno disminuyen y la terapia con es-
trógenos reemplaza parte o la totalidad del estrógeno. Sin estrógeno, hay mayor riesgo de padecer hueso debilitado y osteoporosis.
En Paraguay, este procedimiento ha ocurrido con bastante frecuencia, 15,8% de las mujeres con 60 años y más fueron sometidas al
procedimiento y existe una alta tasa de mujeres que ya tenían el procedimiento antes de los 50 años de edad.
Cuadro 5.20. Distribución de la población femenina adulta mayor por grupos de edad, según tenencia de histerectomía (%)
Tenencia de histerectomía Total
Grupos de edad
60-64 65-69 70-74 ≥75
Total 297 100,0% 78 100,0% 66 100,0% 47 100,0% 106 100,0%
Si tuvo 47 15,8% 10 12,8% 11 16,7% 10 21,3% 16 15,1%
No tuvo 247 83,2% 68 87,2% 54 81,8% 37 78,7% 88 83,0%
No sabe 1 0,3% - - - - - - 1 0,9%
No responde 2 0,7% - - 1 1,5% - - 1 0,9%
Fuente: DGIS/STP. Encuesta sobre Salud, Bienestar y Envejecimiento (SABE). Paraguay 2017.
Cuadro 5.21. Distribución de la población femenina adulta mayor que tuvo histerectomía por grupos de edad, según edad de histerectomía (%)
Edad a la histerectomía Total
Grupos de edad
60-64 65-69 70-74 ≥75
Total 47 100,0% 10 100,0% 11 100,0% 10 100,0% 16 100,0%
Menos de 50 años 24 51,1% 6 60,0% 6 54,5% 5 50,0% 7 43,8%
50 años y más 19 40,4% 3 30,0% 4 36,4% 5 50,0% 7 43,8%
No sabe/No responde 4 8,5% 1 10,0% 1 9,1% - - 2 12,5%
Fuente: DGIS/STP. Encuesta sobre Salud, Bienestar y Envejecimiento (SABE). Paraguay 2017.
Cuadro 5.22. Distribución de la población femenina adulta mayor por grupos de edad, según edad a la última menstruación (%)
Edad a la última men-struación Total
Grupos de edad
60-64 65-69 70-74 ≥75
Total 297 100,0% 78 100,0% 66 100,0% 47 100,0% 106 100,0%
Menos de 50 años 157 52,9% 43 55,1% 41 62,1% 28 59,6% 45 42,5%
50 años y más 116 39,1% 34 43,6% 23 34,8% 17 36,2% 42 39,6%
No sabe/No responde 24 8,1% 1 1,3% 2 3,0% 2 4,3% 19 17,9%
Fuente: DGIS/STP. Encuesta sobre Salud, Bienestar y Envejecimiento (SABE). Paraguay 2017.
CAPÍTULO 5. Cuadro 5.23. Distribución de la población femenina adulta mayor por grupos de edad, según uso de estrógeno (%)
Uso de estrógeno TotalGrupos de edad
60-64 65-69 70-74 ≥75
Total 297 100,0% 78 100,0% 66 100,0% 47 100,0% 106 100,0%
Si 22 7,4% 7 9,0% 5 7,6% 3 6,4% 7 6,6%
No 264 88,9% 71 91,0% 60 90,9% 43 91,5% 90 84,9%
No sabe 9 3,0% - - - - 1 2,1% 8 7,5%
No responde 2 0,7% - - 1 1,5% - - 1 0,9%
Fuente: DGIS/STP. Encuesta sobre Salud, Bienestar y Envejecimiento (SABE). Paraguay 2017
Cuadro 5.24. Distribución de la población femenina adulta mayor que usó o usa actualmente estrógeno por grupos de edad, según edad de uso de estrógenos (%).
Edad al uso de es-trógeno Total
Grupos de edad
60-64 65-69 70-74 ≥75
Total 22 100,0% 7 100,0% 5 100,0% 3 100,0% 7 100,0%
Menos de 50 años 14 63,6% 5 71,4% 5 100,0% 3 100,0% 1 14,3%
50 años y más 7 31,8% 2 28,6% - - - - 5 71,4%
No sabe/No responde 1 4,5% - - - - - - 1 14,3%
Fuente: DGIS/STP. Encuesta sobre Salud, Bienestar y Envejecimiento (SABE). Paraguay 2017
Por el lado de la población masculina, uno de los problemas más comunes durante el envejecimiento está relacionado a la próstata.
Muchos hombres experimentan cambios urinarios a medida que envejecen, que pueden ser causados por inflamación o agrandami-
ento de la glándula prostática. Sin embargo, una glándula prostática agrandada no siempre puede causar problemas urinarios y los
síntomas urinarios problemáticos rara vez están asociados con el cáncer de próstata.
En Paraguay también existe un porcentaje significativo de hombres que reportaron experimentar cambios urinarios.
Cuadro 5.25. Distribución de la población masculina adulta mayor por grupos de edad, según examen de próstata1/ y padecimientos prostáticos actuales (%)
Problemas prostáticos TotalGrupos de edad
60-64 65-69 70-74 ≥75
Examen de próstata 60 31,6% 16 23,2% 15 34,1% 17 45,9% 12 30,0%
Polaquiuria 72 37,9% 18 26,1% 17 38,6% 19 51,4% 18 45,0%
Disuria
Chorro débil y pequeño
45 23,7% 14 20,3% 10 22,7% 7 18,9% 14 35,0%
Ardor al orinar 12 6,3% 6 8,7% 2 4,5% 3 8,1% 1 2,5%
Nicturia 82 43,2% 20 29,0% 20 45,5% 20 54,1% 22 55,0%
Fuente: DGIS/STP. Encuesta sobre Salud, Bienestar y Envejecimiento (SABE). Paraguay 2017.1/ En los últimos dos años.
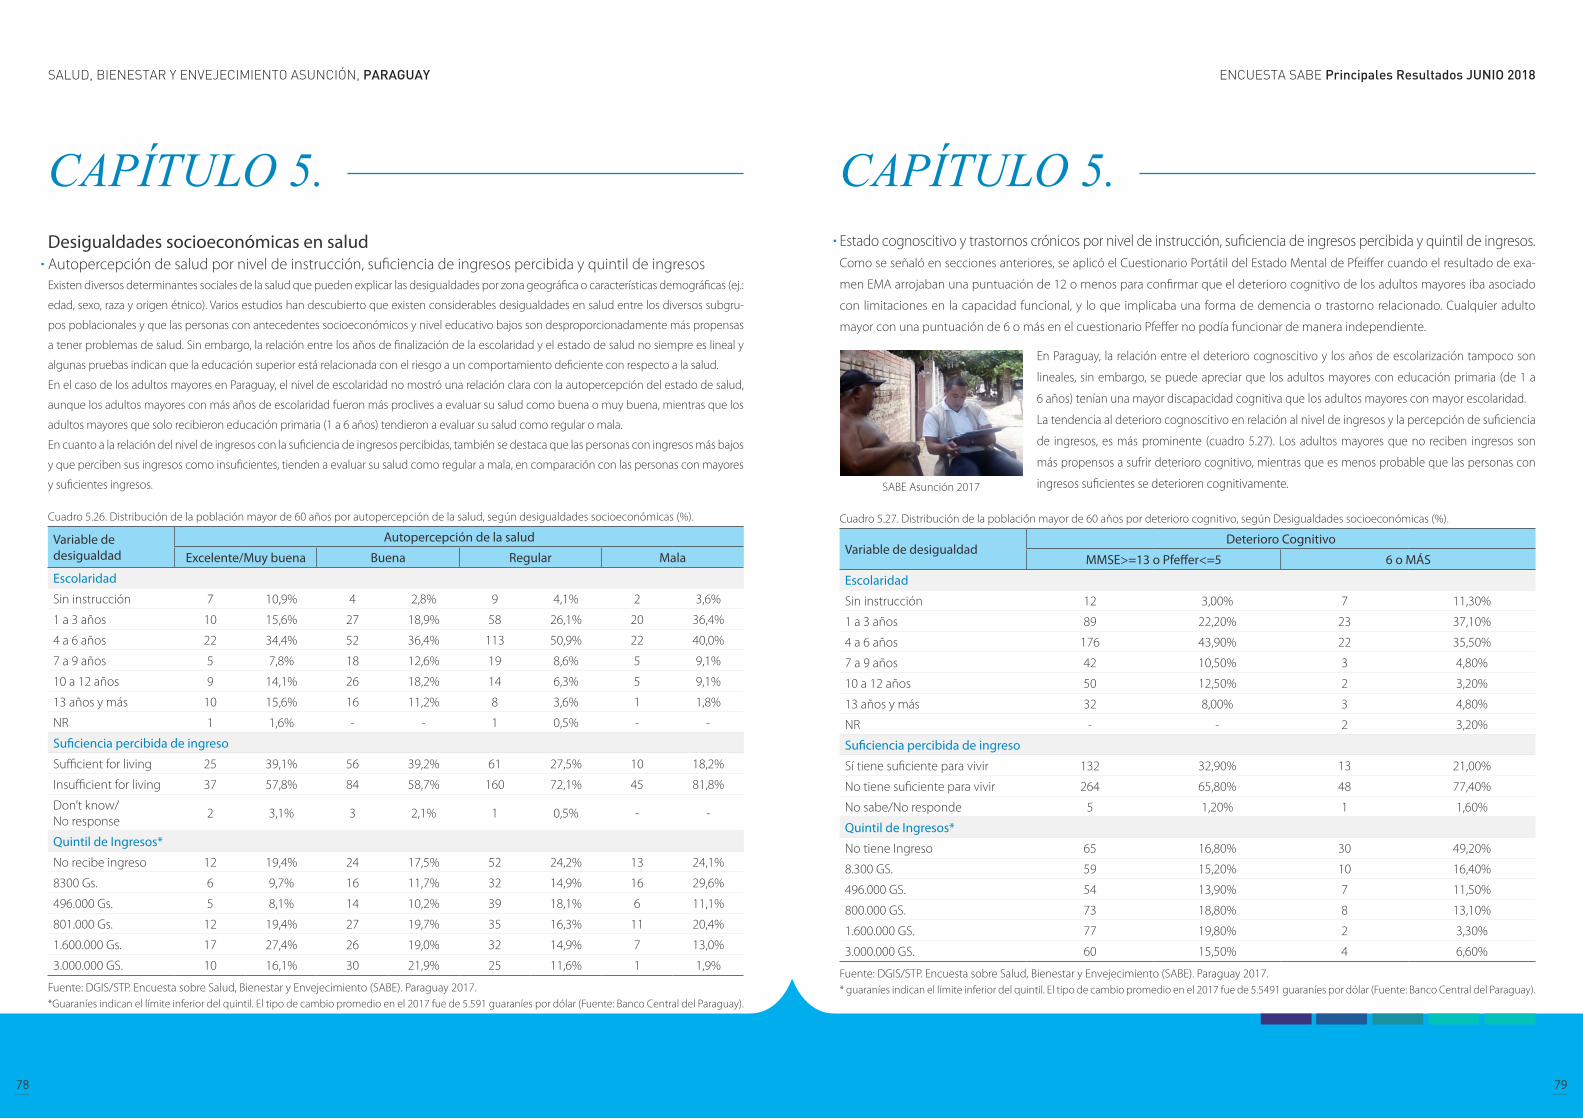
ENCUESTA SABE Principales Resultados JUNIO 2018SALUD, BIENESTAR Y ENVEJECIMIENTO ASUNCIÓN, PARAGUAY
78 79
CAPÍTULO 5. Desigualdades socioeconómicas en salud Autopercepción de salud por nivel de instrucción, suficiencia de ingresos percibida y quintil de ingresosExisten diversos determinantes sociales de la salud que pueden explicar las desigualdades por zona geográfica o características demográficas (ej.:
edad, sexo, raza y origen étnico). Varios estudios han descubierto que existen considerables desigualdades en salud entre los diversos subgru-
pos poblacionales y que las personas con antecedentes socioeconómicos y nivel educativo bajos son desproporcionadamente más propensas
a tener problemas de salud. Sin embargo, la relación entre los años de finalización de la escolaridad y el estado de salud no siempre es lineal y
algunas pruebas indican que la educación superior está relacionada con el riesgo a un comportamiento deficiente con respecto a la salud.
En el caso de los adultos mayores en Paraguay, el nivel de escolaridad no mostró una relación clara con la autopercepción del estado de salud,
aunque los adultos mayores con más años de escolaridad fueron más proclives a evaluar su salud como buena o muy buena, mientras que los
adultos mayores que solo recibieron educación primaria (1 a 6 años) tendieron a evaluar su salud como regular o mala.
En cuanto a la relación del nivel de ingresos con la suficiencia de ingresos percibidas, también se destaca que las personas con ingresos más bajos
y que perciben sus ingresos como insuficientes, tienden a evaluar su salud como regular a mala, en comparación con las personas con mayores
y suficientes ingresos.
Cuadro 5.26. Distribución de la población mayor de 60 años por autopercepción de la salud, según desigualdades socioeconómicas (%).
Variable de desigualdad
Autopercepción de la salud
Excelente/Muy buena Buena Regular Mala
Escolaridad
Sin instrucción 7 10,9% 4 2,8% 9 4,1% 2 3,6%
1 a 3 años 10 15,6% 27 18,9% 58 26,1% 20 36,4%
4 a 6 años 22 34,4% 52 36,4% 113 50,9% 22 40,0%
7 a 9 años 5 7,8% 18 12,6% 19 8,6% 5 9,1%
10 a 12 años 9 14,1% 26 18,2% 14 6,3% 5 9,1%
13 años y más 10 15,6% 16 11,2% 8 3,6% 1 1,8%
NR 1 1,6% - - 1 0,5% - -
Suficiencia percibida de ingreso
Sufficient for living 25 39,1% 56 39,2% 61 27,5% 10 18,2%
Insufficient for living 37 57,8% 84 58,7% 160 72,1% 45 81,8%
Don’t know/No response
2 3,1% 3 2,1% 1 0,5% - -
Quintil de Ingresos*
No recibe ingreso 12 19,4% 24 17,5% 52 24,2% 13 24,1%
8300 Gs. 6 9,7% 16 11,7% 32 14,9% 16 29,6%
496.000 Gs. 5 8,1% 14 10,2% 39 18,1% 6 11,1%
801.000 Gs. 12 19,4% 27 19,7% 35 16,3% 11 20,4%
1.600.000 Gs. 17 27,4% 26 19,0% 32 14,9% 7 13,0%
3.000.000 GS. 10 16,1% 30 21,9% 25 11,6% 1 1,9%
Fuente: DGIS/STP. Encuesta sobre Salud, Bienestar y Envejecimiento (SABE). Paraguay 2017.*Guaraníes indican el límite inferior del quintil. El tipo de cambio promedio en el 2017 fue de 5.591 guaraníes por dólar (Fuente: Banco Central del Paraguay).
CAPÍTULO 5. Estado cognoscitivo y trastornos crónicos por nivel de instrucción, suficiencia de ingresos percibida y quintil de ingresos.Como se señaló en secciones anteriores, se aplicó el Cuestionario Portátil del Estado Mental de Pfeiffer cuando el resultado de exa-
men EMA arrojaban una puntuación de 12 o menos para confirmar que el deterioro cognitivo de los adultos mayores iba asociado
con limitaciones en la capacidad funcional, y lo que implicaba una forma de demencia o trastorno relacionado. Cualquier adulto
mayor con una puntuación de 6 o más en el cuestionario Pfeffer no podía funcionar de manera independiente.
Cuadro 5.27. Distribución de la población mayor de 60 años por deterioro cognitivo, según Desigualdades socioeconómicas (%).
Variable de desigualdadDeterioro Cognitivo
MMSE>=13 o Pfeffer<=5 6 o MÁS
Escolaridad
Sin instrucción 12 3,00% 7 11,30%
1 a 3 años 89 22,20% 23 37,10%
4 a 6 años 176 43,90% 22 35,50%
7 a 9 años 42 10,50% 3 4,80%
10 a 12 años 50 12,50% 2 3,20%
13 años y más 32 8,00% 3 4,80%
NR - - 2 3,20%
Suficiencia percibida de ingreso
Sí tiene suficiente para vivir 132 32,90% 13 21,00%
No tiene suficiente para vivir 264 65,80% 48 77,40%
No sabe/No responde 5 1,20% 1 1,60%
Quintil de Ingresos*
No tiene Ingreso 65 16,80% 30 49,20%
8.300 GS. 59 15,20% 10 16,40%
496.000 GS. 54 13,90% 7 11,50%
800.000 GS. 73 18,80% 8 13,10%
1.600.000 GS. 77 19,80% 2 3,30%
3.000.000 GS. 60 15,50% 4 6,60%
Fuente: DGIS/STP. Encuesta sobre Salud, Bienestar y Envejecimiento (SABE). Paraguay 2017.* guaraníes indican el límite inferior del quintil. El tipo de cambio promedio en el 2017 fue de 5.5491 guaraníes por dólar (Fuente: Banco Central del Paraguay).
En Paraguay, la relación entre el deterioro cognoscitivo y los años de escolarización tampoco son
lineales, sin embargo, se puede apreciar que los adultos mayores con educación primaria (de 1 a
6 años) tenían una mayor discapacidad cognitiva que los adultos mayores con mayor escolaridad.
La tendencia al deterioro cognoscitivo en relación al nivel de ingresos y la percepción de suficiencia
de ingresos, es más prominente (cuadro 5.27). Los adultos mayores que no reciben ingresos son
más propensos a sufrir deterioro cognitivo, mientras que es menos probable que las personas con
ingresos suficientes se deterioren cognitivamente.SABE Asunción 2017
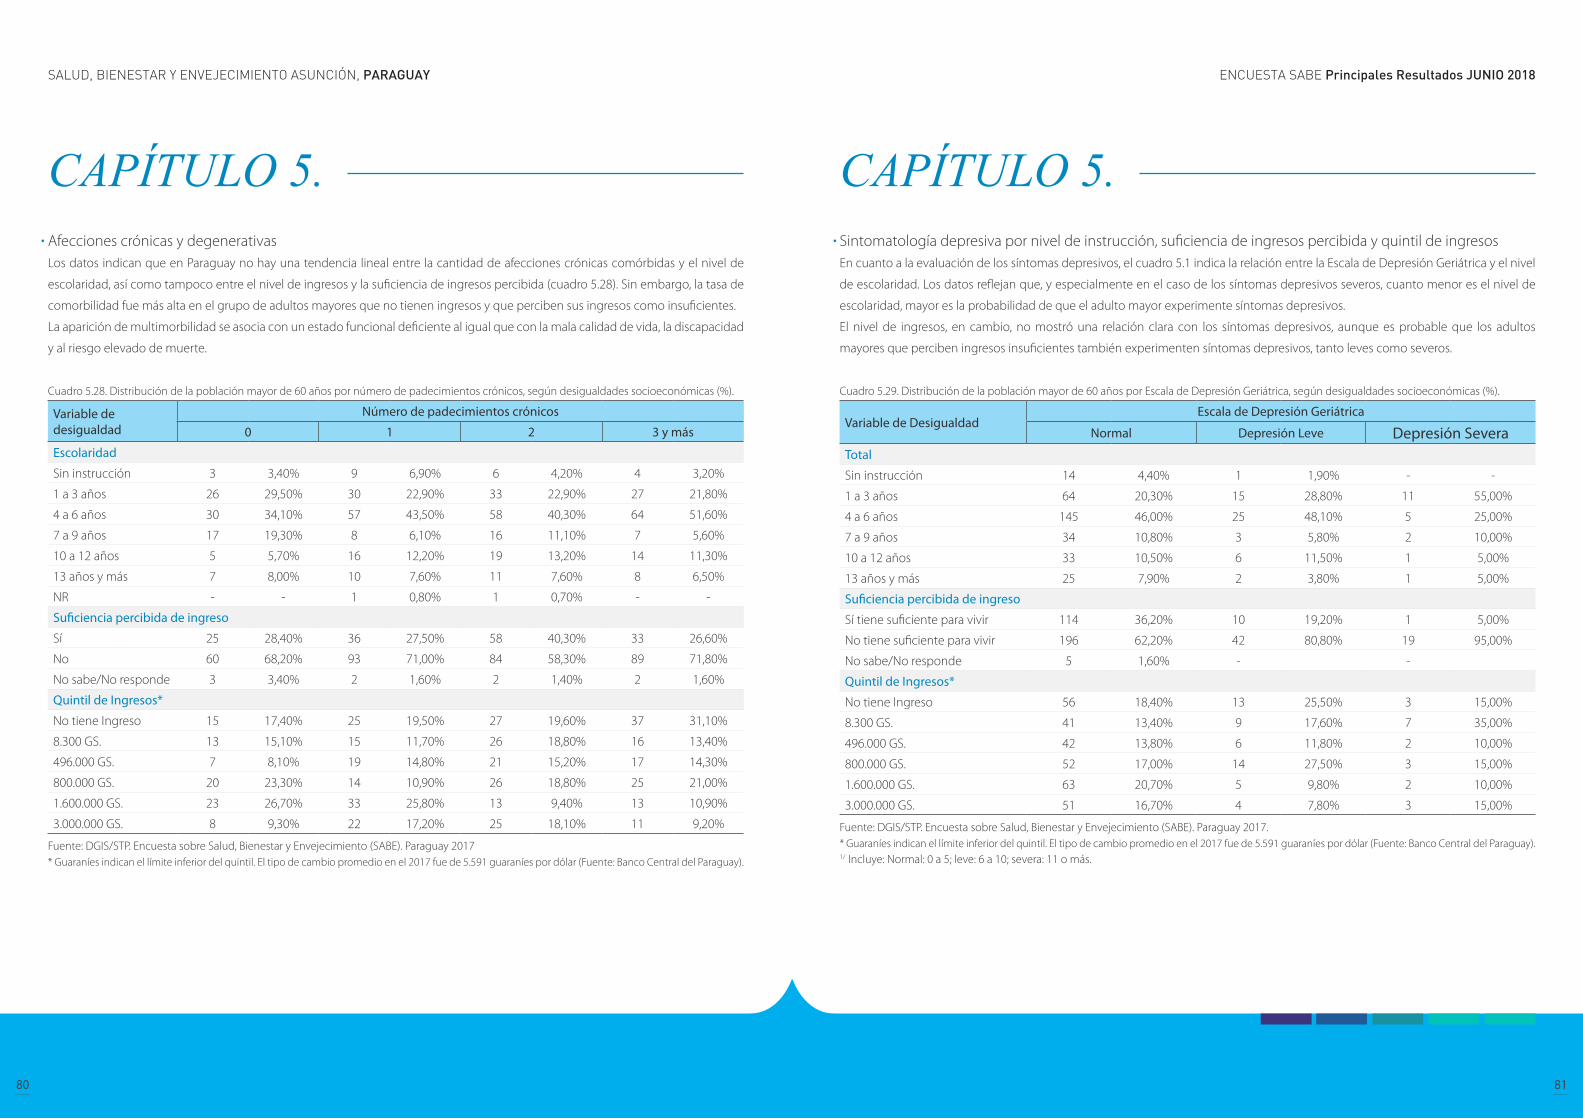
ENCUESTA SABE Principales Resultados JUNIO 2018SALUD, BIENESTAR Y ENVEJECIMIENTO ASUNCIÓN, PARAGUAY
80 81
CAPÍTULO 5. Afecciones crónicas y degenerativas Los datos indican que en Paraguay no hay una tendencia lineal entre la cantidad de afecciones crónicas comórbidas y el nivel de
escolaridad, así como tampoco entre el nivel de ingresos y la suficiencia de ingresos percibida (cuadro 5.28). Sin embargo, la tasa de
comorbilidad fue más alta en el grupo de adultos mayores que no tienen ingresos y que perciben sus ingresos como insuficientes.
La aparición de multimorbilidad se asocia con un estado funcional deficiente al igual que con la mala calidad de vida, la discapacidad
y al riesgo elevado de muerte.
Cuadro 5.28. Distribución de la población mayor de 60 años por número de padecimientos crónicos, según desigualdades socioeconómicas (%).
Variable de desigualdad
Número de padecimientos crónicos
0 1 2 3 y más
Escolaridad
Sin instrucción 3 3,40% 9 6,90% 6 4,20% 4 3,20%
1 a 3 años 26 29,50% 30 22,90% 33 22,90% 27 21,80%
4 a 6 años 30 34,10% 57 43,50% 58 40,30% 64 51,60%
7 a 9 años 17 19,30% 8 6,10% 16 11,10% 7 5,60%
10 a 12 años 5 5,70% 16 12,20% 19 13,20% 14 11,30%
13 años y más 7 8,00% 10 7,60% 11 7,60% 8 6,50%
NR - - 1 0,80% 1 0,70% - -
Suficiencia percibida de ingreso
Sí 25 28,40% 36 27,50% 58 40,30% 33 26,60%
No 60 68,20% 93 71,00% 84 58,30% 89 71,80%
No sabe/No responde 3 3,40% 2 1,60% 2 1,40% 2 1,60%
Quintil de Ingresos*
No tiene Ingreso 15 17,40% 25 19,50% 27 19,60% 37 31,10%
8.300 GS. 13 15,10% 15 11,70% 26 18,80% 16 13,40%
496.000 GS. 7 8,10% 19 14,80% 21 15,20% 17 14,30%
800.000 GS. 20 23,30% 14 10,90% 26 18,80% 25 21,00%
1.600.000 GS. 23 26,70% 33 25,80% 13 9,40% 13 10,90%
3.000.000 GS. 8 9,30% 22 17,20% 25 18,10% 11 9,20%
Fuente: DGIS/STP. Encuesta sobre Salud, Bienestar y Envejecimiento (SABE). Paraguay 2017* Guaraníes indican el límite inferior del quintil. El tipo de cambio promedio en el 2017 fue de 5.591 guaraníes por dólar (Fuente: Banco Central del Paraguay).
CAPÍTULO 5. Sintomatología depresiva por nivel de instrucción, suficiencia de ingresos percibida y quintil de ingresosEn cuanto a la evaluación de los síntomas depresivos, el cuadro 5.1 indica la relación entre la Escala de Depresión Geriátrica y el nivel
de escolaridad. Los datos reflejan que, y especialmente en el caso de los síntomas depresivos severos, cuanto menor es el nivel de
escolaridad, mayor es la probabilidad de que el adulto mayor experimente síntomas depresivos.
El nivel de ingresos, en cambio, no mostró una relación clara con los síntomas depresivos, aunque es probable que los adultos
mayores que perciben ingresos insuficientes también experimenten síntomas depresivos, tanto leves como severos.
Cuadro 5.29. Distribución de la población mayor de 60 años por Escala de Depresión Geriátrica, según desigualdades socioeconómicas (%).
Variable de DesigualdadEscala de Depresión Geriátrica
Normal Depresión Leve Depresión SeveraTotal
Sin instrucción 14 4,40% 1 1,90% - -
1 a 3 años 64 20,30% 15 28,80% 11 55,00%
4 a 6 años 145 46,00% 25 48,10% 5 25,00%
7 a 9 años 34 10,80% 3 5,80% 2 10,00%
10 a 12 años 33 10,50% 6 11,50% 1 5,00%
13 años y más 25 7,90% 2 3,80% 1 5,00%
Suficiencia percibida de ingreso
Sí tiene suficiente para vivir 114 36,20% 10 19,20% 1 5,00%
No tiene suficiente para vivir 196 62,20% 42 80,80% 19 95,00%
No sabe/No responde 5 1,60% - -
Quintil de Ingresos*
No tiene Ingreso 56 18,40% 13 25,50% 3 15,00%
8.300 GS. 41 13,40% 9 17,60% 7 35,00%
496.000 GS. 42 13,80% 6 11,80% 2 10,00%
800.000 GS. 52 17,00% 14 27,50% 3 15,00%
1.600.000 GS. 63 20,70% 5 9,80% 2 10,00%
3.000.000 GS. 51 16,70% 4 7,80% 3 15,00%
Fuente: DGIS/STP. Encuesta sobre Salud, Bienestar y Envejecimiento (SABE). Paraguay 2017.* Guaraníes indican el límite inferior del quintil. El tipo de cambio promedio en el 2017 fue de 5.591 guaraníes por dólar (Fuente: Banco Central del Paraguay).1/ Incluye: Normal: 0 a 5; leve: 6 a 10; severa: 11 o más.

ENCUESTA SABE Principales Resultados JUNIO 2018SALUD, BIENESTAR Y ENVEJECIMIENTO ASUNCIÓN, PARAGUAY
82 83
CAPÍTULO 5. Dificultad en actividades de la vida diaria (AVD) por nivel de instrucción, suficiencia de ingresos percibida y quintil de ingresos Los datos indican que los adultos mayores que recibieron únicamente educación de nivel primario (1 a 6 años) tienen más probabili-
dades de tener dificultades para realizar actividades de la vida cotidiana en comparación a los adultos mayores con mayor escolaridad
(7 o más años), mientras que los adultos mayores sin instrucción parecen tener menos dificultades que las personas que completaron
el nivel de educación más bajo (cuadro 5.30).
El nivel de ingresos y la suficiencia de ingresos percibida, según pueden apreciarse, están más relacionadas con las dificultades que
los adultos mayores experimentan para realizar actividades de la vida diaria. La dificultad en las AVD se vuelve significativamente
menor cuando el adulto mayore cuenta con ingresos de más de 1.600.000 guaraníes.
Cuadro 5.30. Distribución de la población mayor de 60 años por dificultad con al menos una AVD*, según desigualdades socioeconómicas (%).
Variable de Desigualdad
Dificultad con AVD*
Si No
Escolaridad
Sin instrucción 6 4,5% 16 4,6%
1 a 3 años 40 30,3% 75 21,5%
4 a 6 años 61 46,2% 146 41,8%
7 a 9 años 9 6,8% 38 10,9%
10 a 12 años 10 7,6% 43 12,3%
13 años y más 4 3,0% 31 8,9%
NR 2 1,5% - -
Suficiencia percibida de ingreso
Sí tiene suficiente para vivir 31 23,5% 120 34,4%
No tiene suficiente para vivir 100 75,8% 226 64,8%
No sabe/No responde 1 0,8% 3 0,9%
Quintil de Ingresos*
No tiene Ingreso 40 31,3% 59 17,5%
8.300 GS. 26 20,3% 44 13,0%
496.000 GS. 26 20,3% 38 11,2%
800.000 GS. 24 18,8% 61 18,0%
1.600.000 GS. 4 3,1% 78 23,1%
3.000.000 GS. 8 6,3% 58 17,2%
Fuente: DGIS/STP. Encuesta sobre Salud, Bienestar y Envejecimiento (SABE). Paraguay 2017.1/ Actividades básicas de la vida diaria: cruzar un cuarto caminando, bañarse, ir al baño, vestirse, alimentarse y acostarse o pararse de la cama.2/ Guaraníes indican el límite inferior del quintil. El tipo de cambio promedio en el 2017 fue de 5.591 guaraníes por dólar (Fuente: Banco Central del Paraguay).
CAPÍTULO 6. Limitaciones funcionales
Actividades de la vida diaria
Actividades instrumentales de la vida diaria
Movilidad
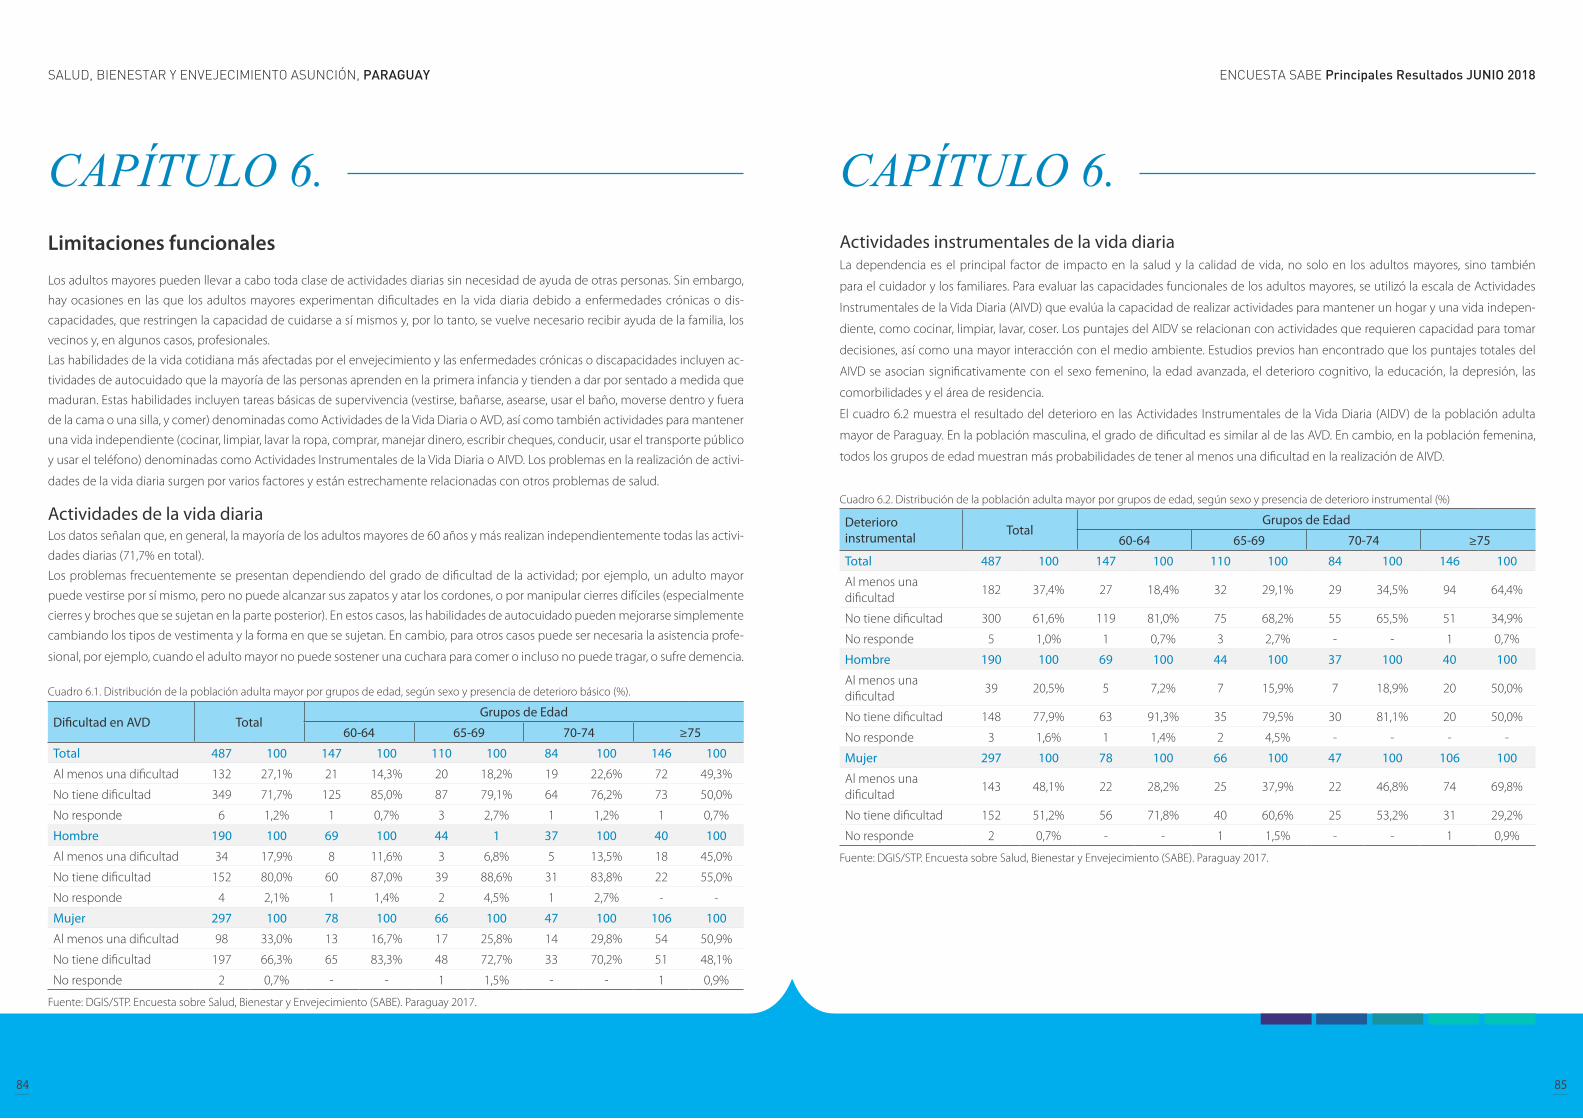
ENCUESTA SABE Principales Resultados JUNIO 2018SALUD, BIENESTAR Y ENVEJECIMIENTO ASUNCIÓN, PARAGUAY
84 85
CAPÍTULO 6. Limitaciones funcionales
Los adultos mayores pueden llevar a cabo toda clase de actividades diarias sin necesidad de ayuda de otras personas. Sin embargo,
hay ocasiones en las que los adultos mayores experimentan dificultades en la vida diaria debido a enfermedades crónicas o dis-
capacidades, que restringen la capacidad de cuidarse a sí mismos y, por lo tanto, se vuelve necesario recibir ayuda de la familia, los
vecinos y, en algunos casos, profesionales.
Las habilidades de la vida cotidiana más afectadas por el envejecimiento y las enfermedades crónicas o discapacidades incluyen ac-
tividades de autocuidado que la mayoría de las personas aprenden en la primera infancia y tienden a dar por sentado a medida que
maduran. Estas habilidades incluyen tareas básicas de supervivencia (vestirse, bañarse, asearse, usar el baño, moverse dentro y fuera
de la cama o una silla, y comer) denominadas como Actividades de la Vida Diaria o AVD, así como también actividades para mantener
una vida independiente (cocinar, limpiar, lavar la ropa, comprar, manejar dinero, escribir cheques, conducir, usar el transporte público
y usar el teléfono) denominadas como Actividades Instrumentales de la Vida Diaria o AIVD. Los problemas en la realización de activi-
dades de la vida diaria surgen por varios factores y están estrechamente relacionadas con otros problemas de salud.
Actividades de la vida diaria Los datos señalan que, en general, la mayoría de los adultos mayores de 60 años y más realizan independientemente todas las activi-
dades diarias (71,7% en total).
Los problemas frecuentemente se presentan dependiendo del grado de dificultad de la actividad; por ejemplo, un adulto mayor
puede vestirse por sí mismo, pero no puede alcanzar sus zapatos y atar los cordones, o por manipular cierres difíciles (especialmente
cierres y broches que se sujetan en la parte posterior). En estos casos, las habilidades de autocuidado pueden mejorarse simplemente
cambiando los tipos de vestimenta y la forma en que se sujetan. En cambio, para otros casos puede ser necesaria la asistencia profe-
sional, por ejemplo, cuando el adulto mayor no puede sostener una cuchara para comer o incluso no puede tragar, o sufre demencia.
Cuadro 6.1. Distribución de la población adulta mayor por grupos de edad, según sexo y presencia de deterioro básico (%).
Dificultad en AVD TotalGrupos de Edad
60-64 65-69 70-74 ≥75
Total 487 100 147 100 110 100 84 100 146 100
Al menos una dificultad 132 27,1% 21 14,3% 20 18,2% 19 22,6% 72 49,3%
No tiene dificultad 349 71,7% 125 85,0% 87 79,1% 64 76,2% 73 50,0%
No responde 6 1,2% 1 0,7% 3 2,7% 1 1,2% 1 0,7%
Hombre 190 100 69 100 44 1 37 100 40 100
Al menos una dificultad 34 17,9% 8 11,6% 3 6,8% 5 13,5% 18 45,0%
No tiene dificultad 152 80,0% 60 87,0% 39 88,6% 31 83,8% 22 55,0%
No responde 4 2,1% 1 1,4% 2 4,5% 1 2,7% - -
Mujer 297 100 78 100 66 100 47 100 106 100
Al menos una dificultad 98 33,0% 13 16,7% 17 25,8% 14 29,8% 54 50,9%
No tiene dificultad 197 66,3% 65 83,3% 48 72,7% 33 70,2% 51 48,1%
No responde 2 0,7% - - 1 1,5% - - 1 0,9%
Fuente: DGIS/STP. Encuesta sobre Salud, Bienestar y Envejecimiento (SABE). Paraguay 2017.
CAPÍTULO 6. Actividades instrumentales de la vida diaria La dependencia es el principal factor de impacto en la salud y la calidad de vida, no solo en los adultos mayores, sino también
para el cuidador y los familiares. Para evaluar las capacidades funcionales de los adultos mayores, se utilizó la escala de Actividades
Instrumentales de la Vida Diaria (AIVD) que evalúa la capacidad de realizar actividades para mantener un hogar y una vida indepen-
diente, como cocinar, limpiar, lavar, coser. Los puntajes del AIDV se relacionan con actividades que requieren capacidad para tomar
decisiones, así como una mayor interacción con el medio ambiente. Estudios previos han encontrado que los puntajes totales del
AIVD se asocian significativamente con el sexo femenino, la edad avanzada, el deterioro cognitivo, la educación, la depresión, las
comorbilidades y el área de residencia.
El cuadro 6.2 muestra el resultado del deterioro en las Actividades Instrumentales de la Vida Diaria (AIDV) de la población adulta
mayor de Paraguay. En la población masculina, el grado de dificultad es similar al de las AVD. En cambio, en la población femenina,
todos los grupos de edad muestran más probabilidades de tener al menos una dificultad en la realización de AIVD.
Cuadro 6.2. Distribución de la población adulta mayor por grupos de edad, según sexo y presencia de deterioro instrumental (%)
Deterioro instrumental Total
Grupos de Edad
60-64 65-69 70-74 ≥75
Total 487 100 147 100 110 100 84 100 146 100
Al menos una dificultad
182 37,4% 27 18,4% 32 29,1% 29 34,5% 94 64,4%
No tiene dificultad 300 61,6% 119 81,0% 75 68,2% 55 65,5% 51 34,9%
No responde 5 1,0% 1 0,7% 3 2,7% - - 1 0,7%
Hombre 190 100 69 100 44 100 37 100 40 100
Al menos una dificultad
39 20,5% 5 7,2% 7 15,9% 7 18,9% 20 50,0%
No tiene dificultad 148 77,9% 63 91,3% 35 79,5% 30 81,1% 20 50,0%
No responde 3 1,6% 1 1,4% 2 4,5% - - - -
Mujer 297 100 78 100 66 100 47 100 106 100
Al menos una dificultad
143 48,1% 22 28,2% 25 37,9% 22 46,8% 74 69,8%
No tiene dificultad 152 51,2% 56 71,8% 40 60,6% 25 53,2% 31 29,2%
No responde 2 0,7% - - 1 1,5% - - 1 0,9%
Fuente: DGIS/STP. Encuesta sobre Salud, Bienestar y Envejecimiento (SABE). Paraguay 2017.
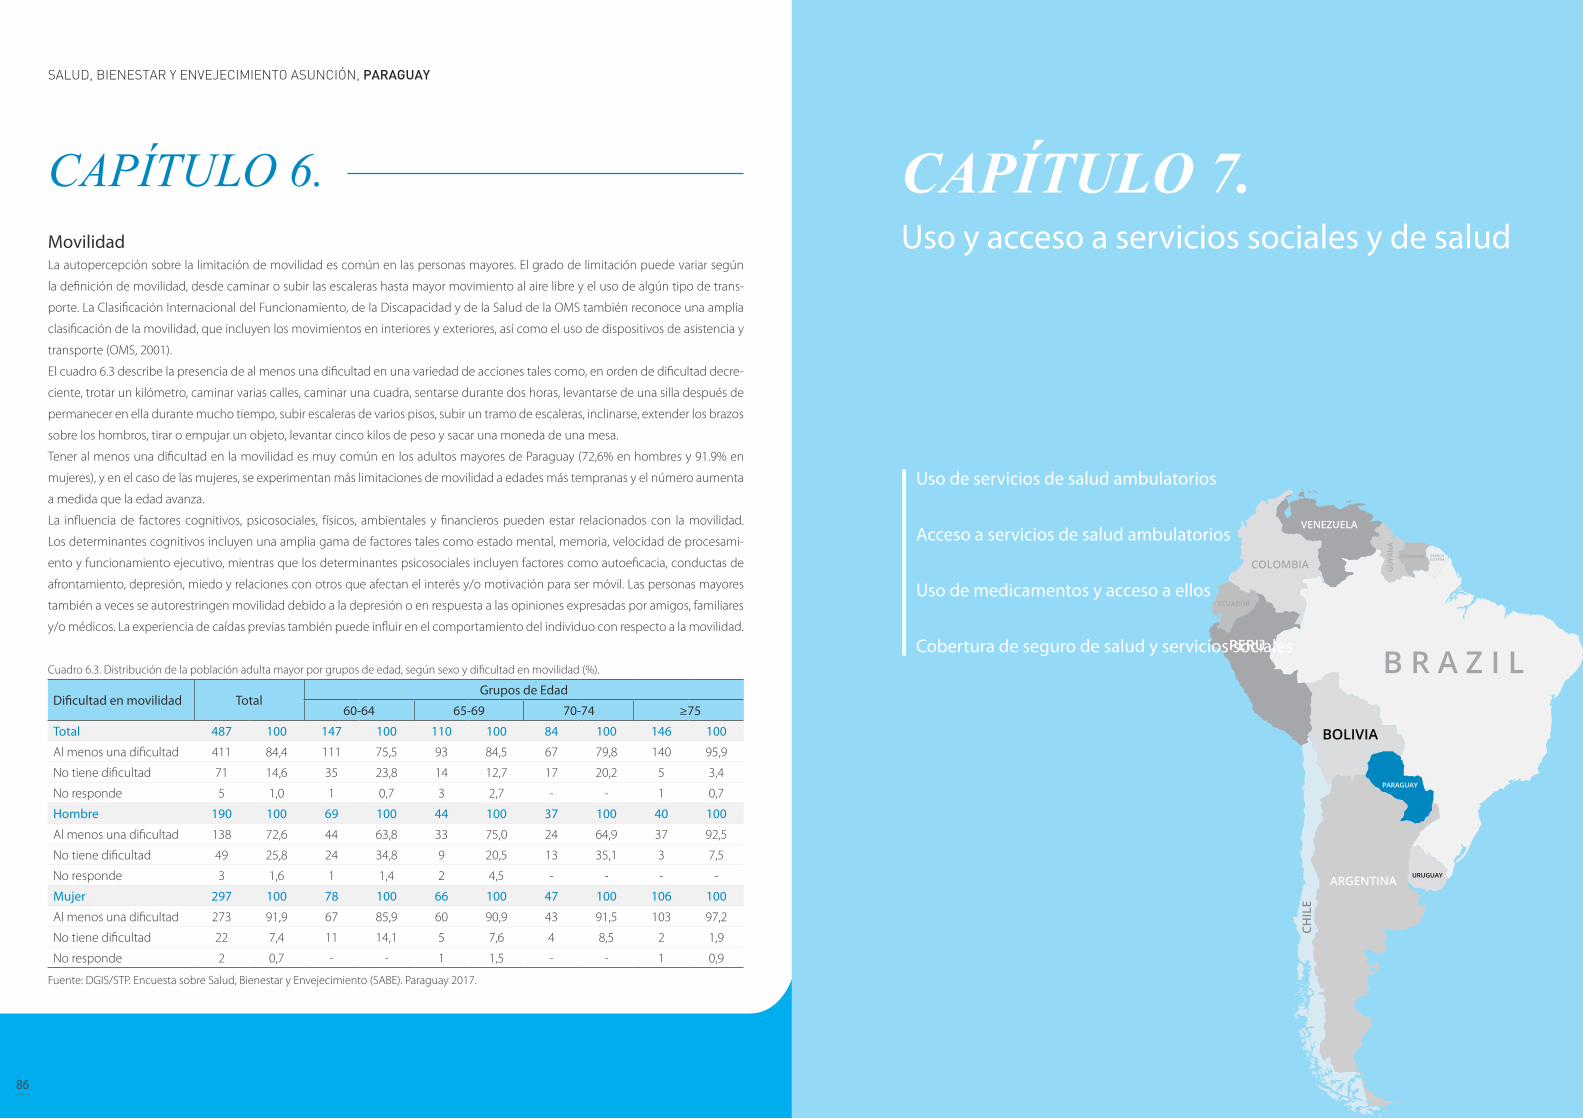
ENCUESTA SABE Principales Resultados JUNIO 2018SALUD, BIENESTAR Y ENVEJECIMIENTO ASUNCIÓN, PARAGUAY
86 87
CAPÍTULO 6. Movilidad La autopercepción sobre la limitación de movilidad es común en las personas mayores. El grado de limitación puede variar según
la definición de movilidad, desde caminar o subir las escaleras hasta mayor movimiento al aire libre y el uso de algún tipo de trans-
porte. La Clasificación Internacional del Funcionamiento, de la Discapacidad y de la Salud de la OMS también reconoce una amplia
clasificación de la movilidad, que incluyen los movimientos en interiores y exteriores, así como el uso de dispositivos de asistencia y
transporte (OMS, 2001).
El cuadro 6.3 describe la presencia de al menos una dificultad en una variedad de acciones tales como, en orden de dificultad decre-
ciente, trotar un kilómetro, caminar varias calles, caminar una cuadra, sentarse durante dos horas, levantarse de una silla después de
permanecer en ella durante mucho tiempo, subir escaleras de varios pisos, subir un tramo de escaleras, inclinarse, extender los brazos
sobre los hombros, tirar o empujar un objeto, levantar cinco kilos de peso y sacar una moneda de una mesa.
Tener al menos una dificultad en la movilidad es muy común en los adultos mayores de Paraguay (72,6% en hombres y 91.9% en
mujeres), y en el caso de las mujeres, se experimentan más limitaciones de movilidad a edades más tempranas y el número aumenta
a medida que la edad avanza.
La influencia de factores cognitivos, psicosociales, físicos, ambientales y financieros pueden estar relacionados con la movilidad.
Los determinantes cognitivos incluyen una amplia gama de factores tales como estado mental, memoria, velocidad de procesami-
ento y funcionamiento ejecutivo, mientras que los determinantes psicosociales incluyen factores como autoeficacia, conductas de
afrontamiento, depresión, miedo y relaciones con otros que afectan el interés y/o motivación para ser móvil. Las personas mayores
también a veces se autorestringen movilidad debido a la depresión o en respuesta a las opiniones expresadas por amigos, familiares
y/o médicos. La experiencia de caídas previas también puede influir en el comportamiento del individuo con respecto a la movilidad.
Cuadro 6.3. Distribución de la población adulta mayor por grupos de edad, según sexo y dificultad en movilidad (%).
Dificultad en movilidad TotalGrupos de Edad
60-64 65-69 70-74 ≥75
Total 487 100 147 100 110 100 84 100 146 100
Al menos una dificultad 411 84,4 111 75,5 93 84,5 67 79,8 140 95,9
No tiene dificultad 71 14,6 35 23,8 14 12,7 17 20,2 5 3,4
No responde 5 1,0 1 0,7 3 2,7 - - 1 0,7
Hombre 190 100 69 100 44 100 37 100 40 100
Al menos una dificultad 138 72,6 44 63,8 33 75,0 24 64,9 37 92,5
No tiene dificultad 49 25,8 24 34,8 9 20,5 13 35,1 3 7,5
No responde 3 1,6 1 1,4 2 4,5 - - - -
Mujer 297 100 78 100 66 100 47 100 106 100
Al menos una dificultad 273 91,9 67 85,9 60 90,9 43 91,5 103 97,2
No tiene dificultad 22 7,4 11 14,1 5 7,6 4 8,5 2 1,9
No responde 2 0,7 - - 1 1,5 - - 1 0,9
Fuente: DGIS/STP. Encuesta sobre Salud, Bienestar y Envejecimiento (SABE). Paraguay 2017.
CAPÍTULO 7. Uso y acceso a servicios sociales y de salud
Uso de servicios de salud ambulatorios
Acceso a servicios de salud ambulatorios
Uso de medicamentos y acceso a ellos
Cobertura de seguro de salud y servicios sociales
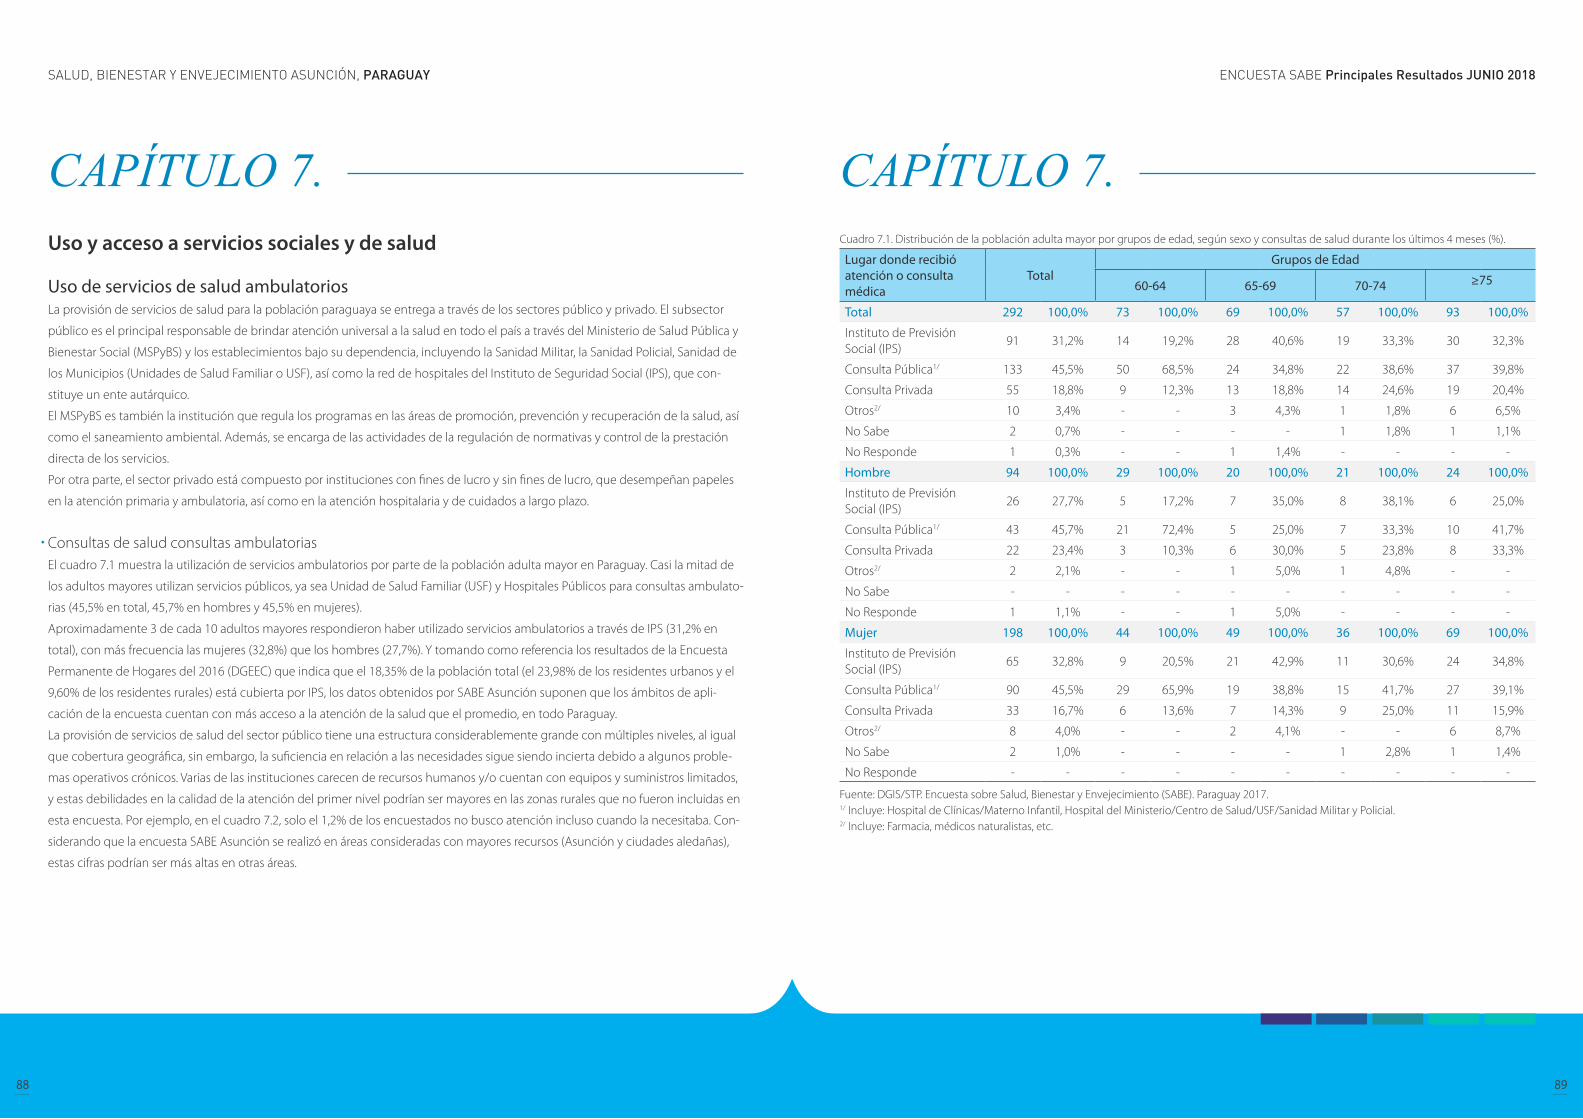
ENCUESTA SABE Principales Resultados JUNIO 2018SALUD, BIENESTAR Y ENVEJECIMIENTO ASUNCIÓN, PARAGUAY
88 89
CAPÍTULO 7. Uso y acceso a servicios sociales y de salud
Uso de servicios de salud ambulatorios La provisión de servicios de salud para la población paraguaya se entrega a través de los sectores público y privado. El subsector
público es el principal responsable de brindar atención universal a la salud en todo el país a través del Ministerio de Salud Pública y
Bienestar Social (MSPyBS) y los establecimientos bajo su dependencia, incluyendo la Sanidad Militar, la Sanidad Policial, Sanidad de
los Municipios (Unidades de Salud Familiar o USF), así como la red de hospitales del Instituto de Seguridad Social (IPS), que con-
stituye un ente autárquico.
El MSPyBS es también la institución que regula los programas en las áreas de promoción, prevención y recuperación de la salud, así
como el saneamiento ambiental. Además, se encarga de las actividades de la regulación de normativas y control de la prestación
directa de los servicios.
Por otra parte, el sector privado está compuesto por instituciones con fines de lucro y sin fines de lucro, que desempeñan papeles
en la atención primaria y ambulatoria, así como en la atención hospitalaria y de cuidados a largo plazo.
Consultas de salud consultas ambulatoriasEl cuadro 7.1 muestra la utilización de servicios ambulatorios por parte de la población adulta mayor en Paraguay. Casi la mitad de
los adultos mayores utilizan servicios públicos, ya sea Unidad de Salud Familiar (USF) y Hospitales Públicos para consultas ambulato-
rias (45,5% en total, 45,7% en hombres y 45,5% en mujeres).
Aproximadamente 3 de cada 10 adultos mayores respondieron haber utilizado servicios ambulatorios a través de IPS (31,2% en
total), con más frecuencia las mujeres (32,8%) que los hombres (27,7%). Y tomando como referencia los resultados de la Encuesta
Permanente de Hogares del 2016 (DGEEC) que indica que el 18,35% de la población total (el 23,98% de los residentes urbanos y el
9,60% de los residentes rurales) está cubierta por IPS, los datos obtenidos por SABE Asunción suponen que los ámbitos de apli-
cación de la encuesta cuentan con más acceso a la atención de la salud que el promedio, en todo Paraguay.
La provisión de servicios de salud del sector público tiene una estructura considerablemente grande con múltiples niveles, al igual
que cobertura geográfica, sin embargo, la suficiencia en relación a las necesidades sigue siendo incierta debido a algunos proble-
mas operativos crónicos. Varias de las instituciones carecen de recursos humanos y/o cuentan con equipos y suministros limitados,
y estas debilidades en la calidad de la atención del primer nivel podrían ser mayores en las zonas rurales que no fueron incluidas en
esta encuesta. Por ejemplo, en el cuadro 7.2, solo el 1,2% de los encuestados no busco atención incluso cuando la necesitaba. Con-
siderando que la encuesta SABE Asunción se realizó en áreas consideradas con mayores recursos (Asunción y ciudades aledañas),
estas cifras podrían ser más altas en otras áreas.
CAPÍTULO 7. Cuadro 7.1. Distribución de la población adulta mayor por grupos de edad, según sexo y consultas de salud durante los últimos 4 meses (%).
Lugar donde recibió atención o consulta médica
TotalGrupos de Edad
60-64 65-69 70-74 ≥75
Total 292 100,0% 73 100,0% 69 100,0% 57 100,0% 93 100,0%
Instituto de Previsión Social (IPS)
91 31,2% 14 19,2% 28 40,6% 19 33,3% 30 32,3%
Consulta Pública1/ 133 45,5% 50 68,5% 24 34,8% 22 38,6% 37 39,8%
Consulta Privada 55 18,8% 9 12,3% 13 18,8% 14 24,6% 19 20,4%
Otros2/ 10 3,4% - - 3 4,3% 1 1,8% 6 6,5%
No Sabe 2 0,7% - - - - 1 1,8% 1 1,1%
No Responde 1 0,3% - - 1 1,4% - - - -
Hombre 94 100,0% 29 100,0% 20 100,0% 21 100,0% 24 100,0%
Instituto de Previsión Social (IPS)
26 27,7% 5 17,2% 7 35,0% 8 38,1% 6 25,0%
Consulta Pública1/ 43 45,7% 21 72,4% 5 25,0% 7 33,3% 10 41,7%
Consulta Privada 22 23,4% 3 10,3% 6 30,0% 5 23,8% 8 33,3%
Otros2/ 2 2,1% - - 1 5,0% 1 4,8% - -
No Sabe - - - - - - - - - -
No Responde 1 1,1% - - 1 5,0% - - - -
Mujer 198 100,0% 44 100,0% 49 100,0% 36 100,0% 69 100,0%
Instituto de Previsión Social (IPS)
65 32,8% 9 20,5% 21 42,9% 11 30,6% 24 34,8%
Consulta Pública1/ 90 45,5% 29 65,9% 19 38,8% 15 41,7% 27 39,1%
Consulta Privada 33 16,7% 6 13,6% 7 14,3% 9 25,0% 11 15,9%
Otros2/ 8 4,0% - - 2 4,1% - - 6 8,7%
No Sabe 2 1,0% - - - - 1 2,8% 1 1,4%
No Responde - - - - - - - - - -
Fuente: DGIS/STP. Encuesta sobre Salud, Bienestar y Envejecimiento (SABE). Paraguay 2017.1/ Incluye: Hospital de Clínicas/Materno Infantil, Hospital del Ministerio/Centro de Salud/USF/Sanidad Militar y Policial.2/ Incluye: Farmacia, médicos naturalistas, etc.

ENCUESTA SABE Principales Resultados JUNIO 2018SALUD, BIENESTAR Y ENVEJECIMIENTO ASUNCIÓN, PARAGUAY
90 91
CAPÍTULO 7. Cuadro 7.2. Distribución de la población adulta mayor por grupos de edad según consultas de salud durante los últimos 12 meses (%).
Consultas de salud TotalGrupos de Edad
60-64 65-69 70-74 ≥75
No hizo la consulta, aunque la necesito
6 1,2% 2 1,4% 1 - - - 3 2,1%
No necesitó consulta 66 13,6% 29 19,7% 14 12,7% 9 10,7% 14 9,6%
Instituto de Previsión Social IPS
132 27,1% 25 17,0% 36 32,7% 26 31% 45 30,8%
Uso de servicio Publico 251 51,5% 92 62,6% 50 45,5% 43 51,2% 66 45,2%
Uso de servicio privado 88 18,1% 17 11,6% 19 17,3% 16 19% 36 24,7%
Otros1/ 16 3,3% 2 1,4% 5 4,5% 1 1,2% 8 5,5%
No sabe 2 0,4% 1 0,7% 1 0,9% 0 - - -
No responde 8 1,6% 2 1,4% 4 3,6% 1 1,2% 1 0,7%
Fuente: DGIS/STP. Encuesta sobre Salud, Bienestar y Envejecimiento (SABE). Paraguay 20171/ Incluye: Farmacia, médicos naturalistas, etc.Precisiones sobre el cuadro: La suma de los porcentajes no coincide con el 100% pues corresponde a una variable con respuesta múltiple.
CAPÍTULO 7. Vacunas Las vacunas son especialmente importantes para los adultos mayores. A medida que envejecemos, el sistema inmunitario humano
se debilita y combatir las infecciones se vuelve más difícil. Por lo tanto, los adultos mayores son más propensos a contraer enferme-
dades como la gripe, la neumonía, el herpes zóster, que al presentar complicaciones pueden provocar enfermedades a largo plazo,
hospitalización e incluso la muerte.
El Programa Ampliado de Inmunización (PAI) dependiente del Ministerio de Salud Pública y Bienestar Social de Paraguay recomienda
la vacunación rutinaria contra la gripe, el neumococo y la DPT (difteria, tétanos y tos ferina) en adultos mayores de 60 años. En gen-
eral, se encontró que la tasa de vacunación para los adultos mayores en Paraguay era insuficiente, como se muestra en el cuadro 7.3,
menos de la mitad de la población recibió las vacunas necesarias en la mayoría de los grupos de edad.
Cuadro 7.3. Distribución de la población adulta mayor por grupos de edad, según sexo y vacunas (%)
Vacunas TotalGrupos de Edad
60-64 65-69 70-74 ≥75
Total 487 100% 147 100% 110 100% 84 100% 146 100%
Gripe 51 10,5% 9 6,1% 11 10,0% 7 8,3% 24 16,4%
Tétanos 108 22,2% 44 29,9% 26 23,6% 13 15,5% 25 17,1%
Tétanos y gripe 192 39,4% 53 36,1% 49 44,5% 41 48,8% 49 33,6%
Ninguna 122 25,1% 39 26,5% 19 17,3% 22 26,2% 42 28,8%
No sabe 8 1,6% 1 0,7% 2 1,8% - - 5 3,4%
No responde 6 1,2% 1 0,7% 3 2,7% 1 1,2% 1 0,7
Hombre 190 100% 69 100% 44 100% 37 100% 40 100%
Gripe 20 10,5% 3 4,3% 2 4,5% 5 13,5% 10 25,0%
Tétanos 40 21,1% 19 27,5% 8 18,2% 7 18,9% 6 15,0%
Tétanos y gripe 73 38,4% 23 33,3% 22 50,0% 16 43,2% 12 30,0%
Ninguna 51 26,8% 23 33,3% 9 20,5% 9 24,3% 10 25,0%
No sabe 3 1,6% - - 1 2,3% - - 2 5,0%
No responde 3 1,6% 1 1,4% 2 4,5% - - - -
Mujer 297 100% 78 100% 66 100% 47 100% 106 100%
Solo Gripe 31 10,4% 6 7,7% 9 13,6% 2 4,3% 14 13,2%
Solo Tétanos 68 22,9% 25 32,1% 18 27,3% 6 12,8% 19 17,9%
Tétanos y gripe 119 40,1% 30 38,5% 27 40,9% 25 53,2% 37 34,9%
Ninguna 71 23,9% 16 20,5% 10 15,2% 13 27,7% 32 30,2%
No sabe 5 1,7% 1 1,3% 1 1,5% - - 3 2,8%
No responde 3 1,0% - - 1 1,5% 1 2,1% 1 0,9%
Fuente: DGIS/STP. Encuesta sobre Salud, Bienestar y Envejecimiento (SABE). Paraguay 2017.
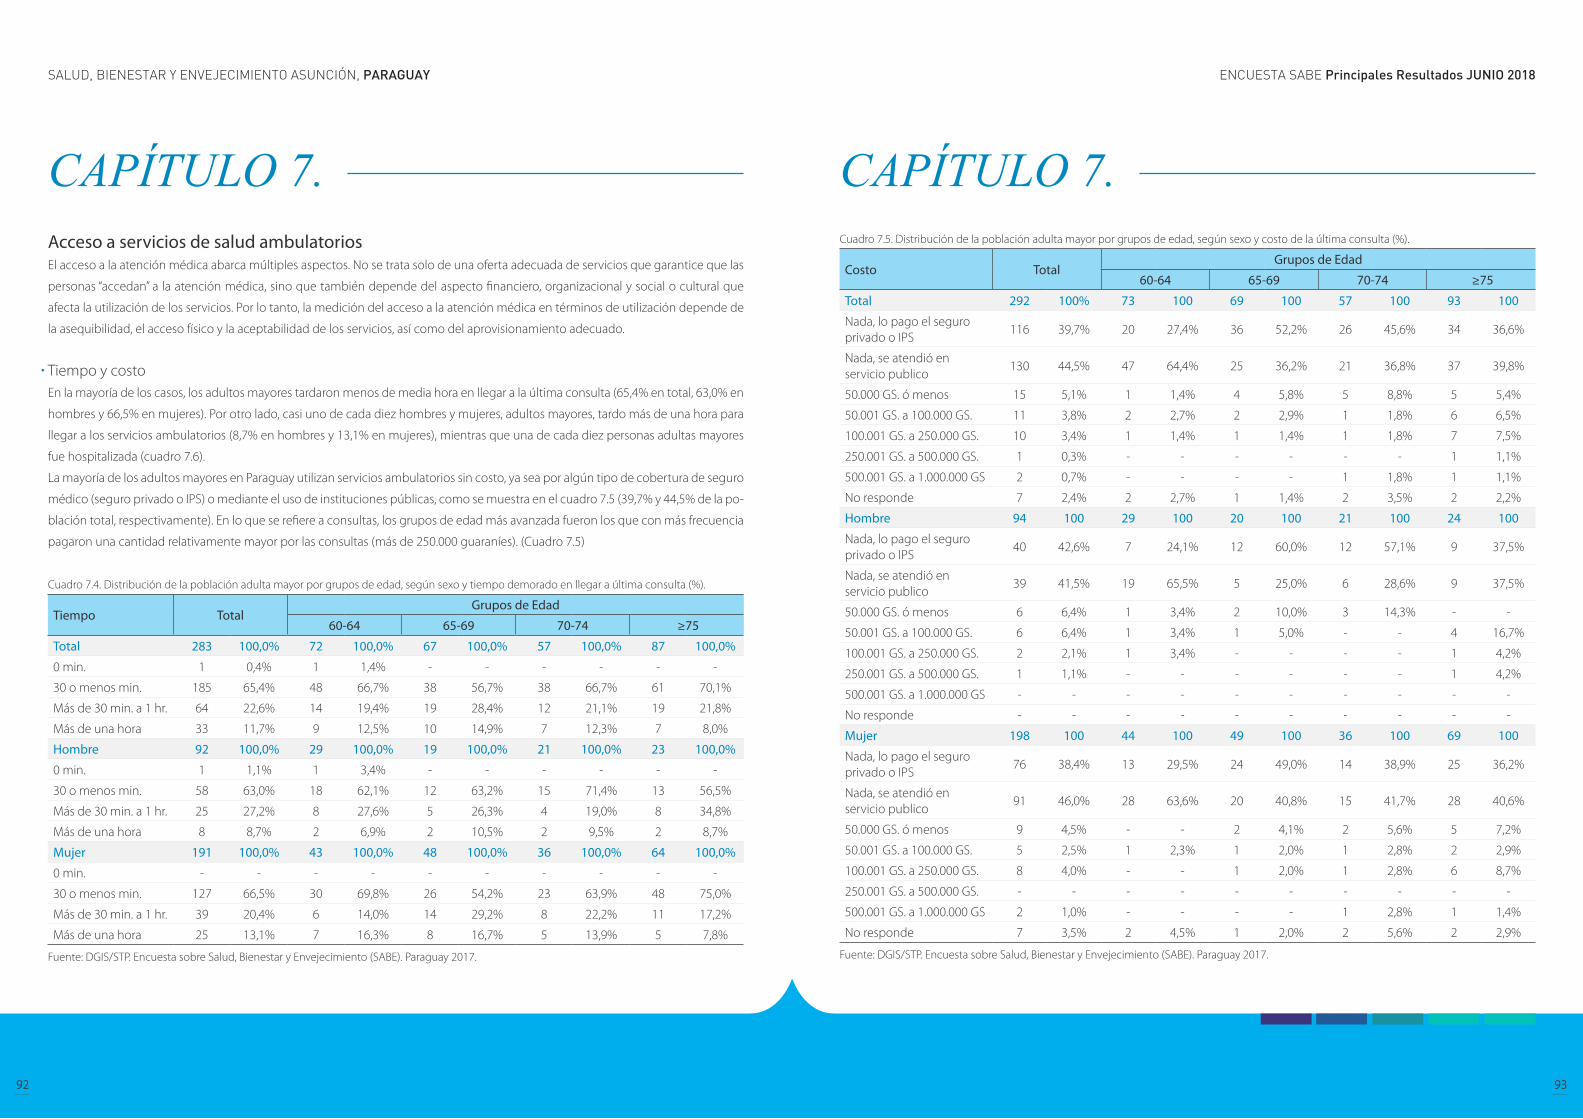
ENCUESTA SABE Principales Resultados JUNIO 2018SALUD, BIENESTAR Y ENVEJECIMIENTO ASUNCIÓN, PARAGUAY
92 93
CAPÍTULO 7. Acceso a servicios de salud ambulatoriosEl acceso a la atención médica abarca múltiples aspectos. No se trata solo de una oferta adecuada de servicios que garantice que las
personas “accedan” a la atención médica, sino que también depende del aspecto financiero, organizacional y social o cultural que
afecta la utilización de los servicios. Por lo tanto, la medición del acceso a la atención médica en términos de utilización depende de
la asequibilidad, el acceso físico y la aceptabilidad de los servicios, así como del aprovisionamiento adecuado.
Tiempo y costo En la mayoría de los casos, los adultos mayores tardaron menos de media hora en llegar a la última consulta (65,4% en total, 63,0% en
hombres y 66,5% en mujeres). Por otro lado, casi uno de cada diez hombres y mujeres, adultos mayores, tardo más de una hora para
llegar a los servicios ambulatorios (8,7% en hombres y 13,1% en mujeres), mientras que una de cada diez personas adultas mayores
fue hospitalizada (cuadro 7.6).
La mayoría de los adultos mayores en Paraguay utilizan servicios ambulatorios sin costo, ya sea por algún tipo de cobertura de seguro
médico (seguro privado o IPS) o mediante el uso de instituciones públicas, como se muestra en el cuadro 7.5 (39,7% y 44,5% de la po-
blación total, respectivamente). En lo que se refiere a consultas, los grupos de edad más avanzada fueron los que con más frecuencia
pagaron una cantidad relativamente mayor por las consultas (más de 250.000 guaraníes). (Cuadro 7.5)
Cuadro 7.4. Distribución de la población adulta mayor por grupos de edad, según sexo y tiempo demorado en llegar a última consulta (%).
Tiempo TotalGrupos de Edad
60-64 65-69 70-74 ≥75
Total 283 100,0% 72 100,0% 67 100,0% 57 100,0% 87 100,0%
0 min. 1 0,4% 1 1,4% - - - - - -
30 o menos min. 185 65,4% 48 66,7% 38 56,7% 38 66,7% 61 70,1%
Más de 30 min. a 1 hr. 64 22,6% 14 19,4% 19 28,4% 12 21,1% 19 21,8%
Más de una hora 33 11,7% 9 12,5% 10 14,9% 7 12,3% 7 8,0%
Hombre 92 100,0% 29 100,0% 19 100,0% 21 100,0% 23 100,0%
0 min. 1 1,1% 1 3,4% - - - - - -
30 o menos min. 58 63,0% 18 62,1% 12 63,2% 15 71,4% 13 56,5%
Más de 30 min. a 1 hr. 25 27,2% 8 27,6% 5 26,3% 4 19,0% 8 34,8%
Más de una hora 8 8,7% 2 6,9% 2 10,5% 2 9,5% 2 8,7%
Mujer 191 100,0% 43 100,0% 48 100,0% 36 100,0% 64 100,0%
0 min. - - - - - - - - - -
30 o menos min. 127 66,5% 30 69,8% 26 54,2% 23 63,9% 48 75,0%
Más de 30 min. a 1 hr. 39 20,4% 6 14,0% 14 29,2% 8 22,2% 11 17,2%
Más de una hora 25 13,1% 7 16,3% 8 16,7% 5 13,9% 5 7,8%
Fuente: DGIS/STP. Encuesta sobre Salud, Bienestar y Envejecimiento (SABE). Paraguay 2017.
CAPÍTULO 7. Cuadro 7.5. Distribución de la población adulta mayor por grupos de edad, según sexo y costo de la última consulta (%).
Costo TotalGrupos de Edad
60-64 65-69 70-74 ≥75
Total 292 100% 73 100 69 100 57 100 93 100
Nada, lo pago el seguro privado o IPS
116 39,7% 20 27,4% 36 52,2% 26 45,6% 34 36,6%
Nada, se atendió en servicio publico
130 44,5% 47 64,4% 25 36,2% 21 36,8% 37 39,8%
50.000 GS. ó menos 15 5,1% 1 1,4% 4 5,8% 5 8,8% 5 5,4%
50.001 GS. a 100.000 GS. 11 3,8% 2 2,7% 2 2,9% 1 1,8% 6 6,5%
100.001 GS. a 250.000 GS. 10 3,4% 1 1,4% 1 1,4% 1 1,8% 7 7,5%
250.001 GS. a 500.000 GS. 1 0,3% - - - - - - 1 1,1%
500.001 GS. a 1.000.000 GS 2 0,7% - - - - 1 1,8% 1 1,1%
No responde 7 2,4% 2 2,7% 1 1,4% 2 3,5% 2 2,2%
Hombre 94 100 29 100 20 100 21 100 24 100
Nada, lo pago el seguro privado o IPS
40 42,6% 7 24,1% 12 60,0% 12 57,1% 9 37,5%
Nada, se atendió en servicio publico
39 41,5% 19 65,5% 5 25,0% 6 28,6% 9 37,5%
50.000 GS. ó menos 6 6,4% 1 3,4% 2 10,0% 3 14,3% - -
50.001 GS. a 100.000 GS. 6 6,4% 1 3,4% 1 5,0% - - 4 16,7%
100.001 GS. a 250.000 GS. 2 2,1% 1 3,4% - - - - 1 4,2%
250.001 GS. a 500.000 GS. 1 1,1% - - - - - - 1 4,2%
500.001 GS. a 1.000.000 GS - - - - - - - - - -
No responde - - - - - - - - - -
Mujer 198 100 44 100 49 100 36 100 69 100
Nada, lo pago el seguro privado o IPS
76 38,4% 13 29,5% 24 49,0% 14 38,9% 25 36,2%
Nada, se atendió en servicio publico
91 46,0% 28 63,6% 20 40,8% 15 41,7% 28 40,6%
50.000 GS. ó menos 9 4,5% - - 2 4,1% 2 5,6% 5 7,2%
50.001 GS. a 100.000 GS. 5 2,5% 1 2,3% 1 2,0% 1 2,8% 2 2,9%
100.001 GS. a 250.000 GS. 8 4,0% - - 1 2,0% 1 2,8% 6 8,7%
250.001 GS. a 500.000 GS. - - - - - - - - - -
500.001 GS. a 1.000.000 GS 2 1,0% - - - - 1 2,8% 1 1,4%
No responde 7 3,5% 2 4,5% 1 2,0% 2 5,6% 2 2,9%
Fuente: DGIS/STP. Encuesta sobre Salud, Bienestar y Envejecimiento (SABE). Paraguay 2017.
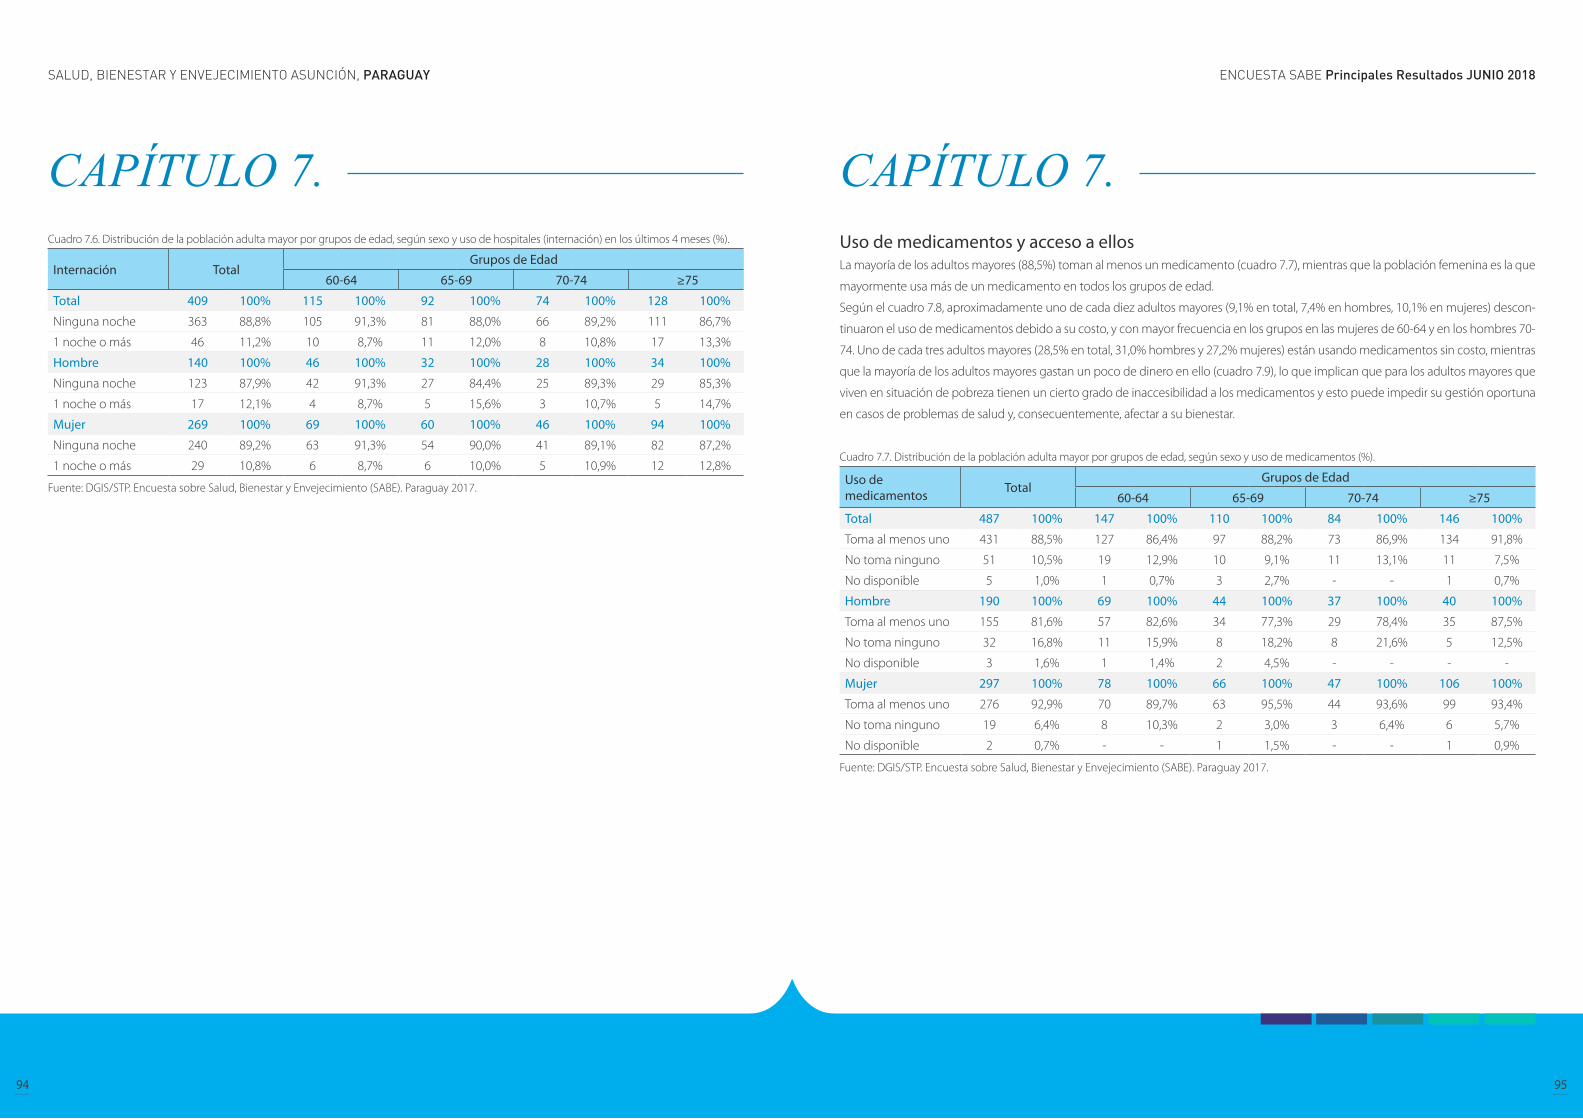
ENCUESTA SABE Principales Resultados JUNIO 2018SALUD, BIENESTAR Y ENVEJECIMIENTO ASUNCIÓN, PARAGUAY
94 95
CAPÍTULO 7. Cuadro 7.6. Distribución de la población adulta mayor por grupos de edad, según sexo y uso de hospitales (internación) en los últimos 4 meses (%).
Internación TotalGrupos de Edad
60-64 65-69 70-74 ≥75
Total 409 100% 115 100% 92 100% 74 100% 128 100%
Ninguna noche 363 88,8% 105 91,3% 81 88,0% 66 89,2% 111 86,7%
1 noche o más 46 11,2% 10 8,7% 11 12,0% 8 10,8% 17 13,3%
Hombre 140 100% 46 100% 32 100% 28 100% 34 100%
Ninguna noche 123 87,9% 42 91,3% 27 84,4% 25 89,3% 29 85,3%
1 noche o más 17 12,1% 4 8,7% 5 15,6% 3 10,7% 5 14,7%
Mujer 269 100% 69 100% 60 100% 46 100% 94 100%
Ninguna noche 240 89,2% 63 91,3% 54 90,0% 41 89,1% 82 87,2%
1 noche o más 29 10,8% 6 8,7% 6 10,0% 5 10,9% 12 12,8%
Fuente: DGIS/STP. Encuesta sobre Salud, Bienestar y Envejecimiento (SABE). Paraguay 2017.
CAPÍTULO 7. Uso de medicamentos y acceso a ellos La mayoría de los adultos mayores (88,5%) toman al menos un medicamento (cuadro 7.7), mientras que la población femenina es la que
mayormente usa más de un medicamento en todos los grupos de edad.
Según el cuadro 7.8, aproximadamente uno de cada diez adultos mayores (9,1% en total, 7,4% en hombres, 10,1% en mujeres) descon-
tinuaron el uso de medicamentos debido a su costo, y con mayor frecuencia en los grupos en las mujeres de 60-64 y en los hombres 70-
74. Uno de cada tres adultos mayores (28,5% en total, 31,0% hombres y 27,2% mujeres) están usando medicamentos sin costo, mientras
que la mayoría de los adultos mayores gastan un poco de dinero en ello (cuadro 7.9), lo que implican que para los adultos mayores que
viven en situación de pobreza tienen un cierto grado de inaccesibilidad a los medicamentos y esto puede impedir su gestión oportuna
en casos de problemas de salud y, consecuentemente, afectar a su bienestar.
Cuadro 7.7. Distribución de la población adulta mayor por grupos de edad, según sexo y uso de medicamentos (%).
Uso de medicamentos Total
Grupos de Edad
60-64 65-69 70-74 ≥75
Total 487 100% 147 100% 110 100% 84 100% 146 100%
Toma al menos uno 431 88,5% 127 86,4% 97 88,2% 73 86,9% 134 91,8%
No toma ninguno 51 10,5% 19 12,9% 10 9,1% 11 13,1% 11 7,5%
No disponible 5 1,0% 1 0,7% 3 2,7% - - 1 0,7%
Hombre 190 100% 69 100% 44 100% 37 100% 40 100%
Toma al menos uno 155 81,6% 57 82,6% 34 77,3% 29 78,4% 35 87,5%
No toma ninguno 32 16,8% 11 15,9% 8 18,2% 8 21,6% 5 12,5%
No disponible 3 1,6% 1 1,4% 2 4,5% - - - -
Mujer 297 100% 78 100% 66 100% 47 100% 106 100%
Toma al menos uno 276 92,9% 70 89,7% 63 95,5% 44 93,6% 99 93,4%
No toma ninguno 19 6,4% 8 10,3% 2 3,0% 3 6,4% 6 5,7%
No disponible 2 0,7% - - 1 1,5% - - 1 0,9%
Fuente: DGIS/STP. Encuesta sobre Salud, Bienestar y Envejecimiento (SABE). Paraguay 2017.
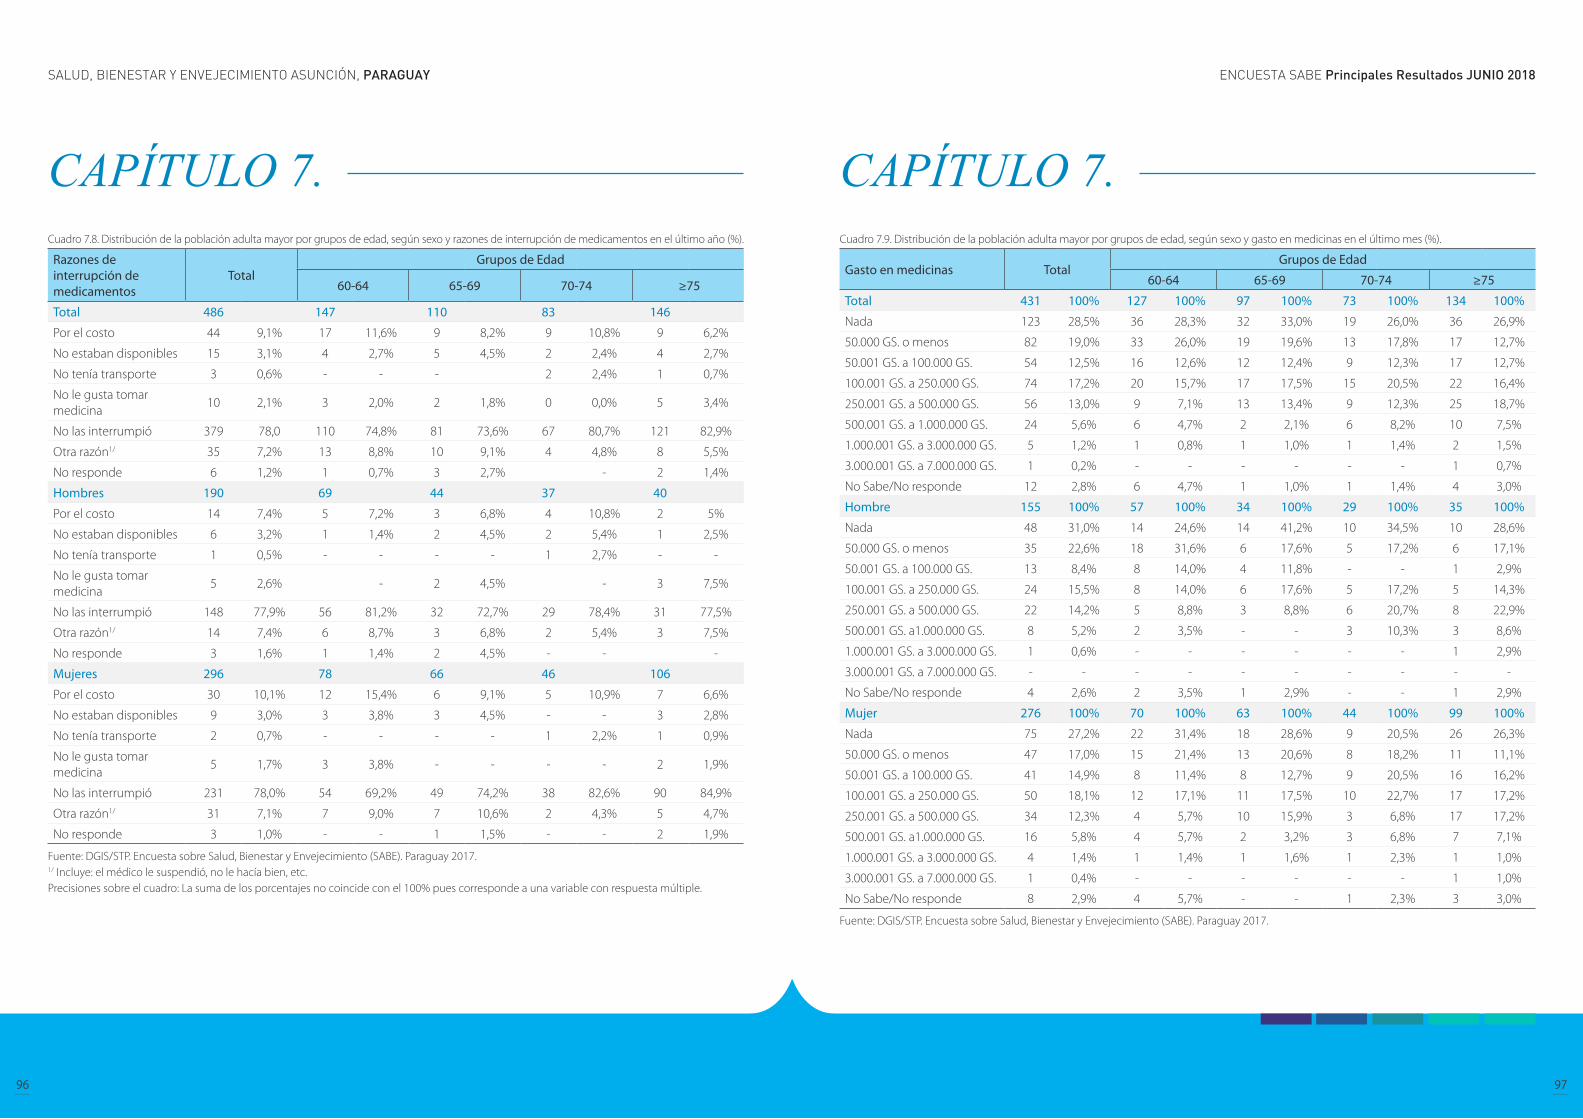
ENCUESTA SABE Principales Resultados JUNIO 2018SALUD, BIENESTAR Y ENVEJECIMIENTO ASUNCIÓN, PARAGUAY
96 97
CAPÍTULO 7. Cuadro 7.8. Distribución de la población adulta mayor por grupos de edad, según sexo y razones de interrupción de medicamentos en el último año (%).
Razones de interrupción de medicamentos
TotalGrupos de Edad
60-64 65-69 70-74 ≥75
Total 486 147 110 83 146
Por el costo 44 9,1% 17 11,6% 9 8,2% 9 10,8% 9 6,2%
No estaban disponibles 15 3,1% 4 2,7% 5 4,5% 2 2,4% 4 2,7%
No tenía transporte 3 0,6% - - - 2 2,4% 1 0,7%
No le gusta tomar medicina
10 2,1% 3 2,0% 2 1,8% 0 0,0% 5 3,4%
No las interrumpió 379 78,0 110 74,8% 81 73,6% 67 80,7% 121 82,9%
Otra razón1/ 35 7,2% 13 8,8% 10 9,1% 4 4,8% 8 5,5%
No responde 6 1,2% 1 0,7% 3 2,7% - 2 1,4%
Hombres 190 69 44 37 40
Por el costo 14 7,4% 5 7,2% 3 6,8% 4 10,8% 2 5%
No estaban disponibles 6 3,2% 1 1,4% 2 4,5% 2 5,4% 1 2,5%
No tenía transporte 1 0,5% - - - - 1 2,7% - -
No le gusta tomar medicina
5 2,6% - 2 4,5% - 3 7,5%
No las interrumpió 148 77,9% 56 81,2% 32 72,7% 29 78,4% 31 77,5%
Otra razón1/ 14 7,4% 6 8,7% 3 6,8% 2 5,4% 3 7,5%
No responde 3 1,6% 1 1,4% 2 4,5% - - -
Mujeres 296 78 66 46 106
Por el costo 30 10,1% 12 15,4% 6 9,1% 5 10,9% 7 6,6%
No estaban disponibles 9 3,0% 3 3,8% 3 4,5% - - 3 2,8%
No tenía transporte 2 0,7% - - - - 1 2,2% 1 0,9%
No le gusta tomar medicina
5 1,7% 3 3,8% - - - - 2 1,9%
No las interrumpió 231 78,0% 54 69,2% 49 74,2% 38 82,6% 90 84,9%
Otra razón1/ 31 7,1% 7 9,0% 7 10,6% 2 4,3% 5 4,7%
No responde 3 1,0% - - 1 1,5% - - 2 1,9%
Fuente: DGIS/STP. Encuesta sobre Salud, Bienestar y Envejecimiento (SABE). Paraguay 2017.1/ Incluye: el médico le suspendió, no le hacía bien, etc.Precisiones sobre el cuadro: La suma de los porcentajes no coincide con el 100% pues corresponde a una variable con respuesta múltiple.
CAPÍTULO 7. Cuadro 7.9. Distribución de la población adulta mayor por grupos de edad, según sexo y gasto en medicinas en el último mes (%).
Gasto en medicinas TotalGrupos de Edad
60-64 65-69 70-74 ≥75
Total 431 100% 127 100% 97 100% 73 100% 134 100%
Nada 123 28,5% 36 28,3% 32 33,0% 19 26,0% 36 26,9%
50.000 GS. o menos 82 19,0% 33 26,0% 19 19,6% 13 17,8% 17 12,7%
50.001 GS. a 100.000 GS. 54 12,5% 16 12,6% 12 12,4% 9 12,3% 17 12,7%
100.001 GS. a 250.000 GS. 74 17,2% 20 15,7% 17 17,5% 15 20,5% 22 16,4%
250.001 GS. a 500.000 GS. 56 13,0% 9 7,1% 13 13,4% 9 12,3% 25 18,7%
500.001 GS. a 1.000.000 GS. 24 5,6% 6 4,7% 2 2,1% 6 8,2% 10 7,5%
1.000.001 GS. a 3.000.000 GS. 5 1,2% 1 0,8% 1 1,0% 1 1,4% 2 1,5%
3.000.001 GS. a 7.000.000 GS. 1 0,2% - - - - - - 1 0,7%
No Sabe/No responde 12 2,8% 6 4,7% 1 1,0% 1 1,4% 4 3,0%
Hombre 155 100% 57 100% 34 100% 29 100% 35 100%
Nada 48 31,0% 14 24,6% 14 41,2% 10 34,5% 10 28,6%
50.000 GS. o menos 35 22,6% 18 31,6% 6 17,6% 5 17,2% 6 17,1%
50.001 GS. a 100.000 GS. 13 8,4% 8 14,0% 4 11,8% - - 1 2,9%
100.001 GS. a 250.000 GS. 24 15,5% 8 14,0% 6 17,6% 5 17,2% 5 14,3%
250.001 GS. a 500.000 GS. 22 14,2% 5 8,8% 3 8,8% 6 20,7% 8 22,9%
500.001 GS. a1.000.000 GS. 8 5,2% 2 3,5% - - 3 10,3% 3 8,6%
1.000.001 GS. a 3.000.000 GS. 1 0,6% - - - - - - 1 2,9%
3.000.001 GS. a 7.000.000 GS. - - - - - - - - - -
No Sabe/No responde 4 2,6% 2 3,5% 1 2,9% - - 1 2,9%
Mujer 276 100% 70 100% 63 100% 44 100% 99 100%
Nada 75 27,2% 22 31,4% 18 28,6% 9 20,5% 26 26,3%
50.000 GS. o menos 47 17,0% 15 21,4% 13 20,6% 8 18,2% 11 11,1%
50.001 GS. a 100.000 GS. 41 14,9% 8 11,4% 8 12,7% 9 20,5% 16 16,2%
100.001 GS. a 250.000 GS. 50 18,1% 12 17,1% 11 17,5% 10 22,7% 17 17,2%
250.001 GS. a 500.000 GS. 34 12,3% 4 5,7% 10 15,9% 3 6,8% 17 17,2%
500.001 GS. a1.000.000 GS. 16 5,8% 4 5,7% 2 3,2% 3 6,8% 7 7,1%
1.000.001 GS. a 3.000.000 GS. 4 1,4% 1 1,4% 1 1,6% 1 2,3% 1 1,0%
3.000.001 GS. a 7.000.000 GS. 1 0,4% - - - - - - 1 1,0%
No Sabe/No responde 8 2,9% 4 5,7% - - 1 2,3% 3 3,0%
Fuente: DGIS/STP. Encuesta sobre Salud, Bienestar y Envejecimiento (SABE). Paraguay 2017.

ENCUESTA SABE Principales Resultados JUNIO 2018SALUD, BIENESTAR Y ENVEJECIMIENTO ASUNCIÓN, PARAGUAY
98 99
CAPÍTULO 7. Cobertura de seguro de salud y servicios sociales La cobertura del seguro médico facilita a las personas el acceso a los servicios de atención a la salud. La falta de una cobertura adecuada
dificulta la obtención de la atención médica necesaria y en el caso de las personas no aseguradas, existen menos probabilidades de
recibir atención médica y de acceder a un diagnostico oportuno, lo que puede resultar en un estado de salud deficiente.
Los resultados del cuadro 7.10 muestran que el 36,6% de los hombres y el 38,0% de las mujeres adultos mayores tienen cobertura del
sistema IPS, pero como se mencionó anteriormente, con respecto a la utilización de consultas ambulatorias (cuadro 7.1), estas cifras
son sustancialmente más altas en comparación con los resultados de la Encuesta Permanente de Hogares del 2016 (DGEEC), donde el
18,35% de la población total (23,98% de los residentes urbanos y 9,60% los residentes rurales) está cubierta por el IPS. Como la Encuesta
de SABE se aplicó en el área de Asunción y las ciudades aledañas, se presume que los adultos mayores encuestados en estos ámbitos
podrían tener más acceso a la atención, en términos de cobertura de seguro y disponibilidad del servicio.
Cuadro 7.10. Distribución de la población adulta mayor por grupos de edad, según sexo y cobertura de seguro de salud (%).
Seguro de salud TotalGrupos de Edad
60-64 65-69 70-74 ≥75
Total 487 100% 147 100%% 110 100% 84 100% 146 100%
IPS 182 37,4% 40 27,2 45 40,9% 35 41,7% 62 42,5%
Otra institución pública 1/ 17 3,5% 6 4,1% 3 2,7% 4 4,8% 4 2,7%
Seguro privado 35 7,2% 12 8,2% 8 7,3% 8 9,5% 7 4,8%
Ninguno 247 50,7% 88 59,9% 51 46,4% 36 42,9% 72 49,3%
No sabe/no responde 6 1,2% 1 0,7% 3 2,7% 1 1,2% 1 0,7%
Hombre 190 100% 69 100% 44 100% 37 100% 40 100%
IPS 69 36,3% 21 30,4% 16 36,4% 16 43,2% 16 40,0%
Otra institución pública 1/ 9 4,7% 4 5,8% 1 2,3% 2 5,4% 2 5,0%
Seguro privado 12 6,3% 3 4,3% 4 9,1% 4 10,8% 1 2,5%
Ninguno 97 51,1% 40 58,0% 21 47,7% 15 40,5% 21 52,5%
No sabe/no responde 3 1,6% 1 1,4% 2 4,5% - - - -
Mujer 297 100% 78 100% 66 100% 47 100% 106 100%
IPS 113 38,0% 19 24,4% 29 43,9% 19 40,4% 46 43,4%
Otra institución pública 1/ 8 2,7% 2 2,6%% 2 3,0% 2 4,3% 2 1,9%
Seguro privado 23 7,7% 9 11,5% 4 6,1% 4 8,5% 6 5,7%
Ninguno 150 50,5% 48 61,5% 30 45,5% 21 44,7% 51 48,1%
No sabe/no responde 3 1,0% - - 1 1,5% 1 2,1% 1 0,9%
Fuente: DGIS/STP. Encuesta sobre Salud, Bienestar y Envejecimiento (SABE). Paraguay 2017.1/ Incluye: Hospital de Clínicas/Materno Infantil, Hospital del Ministerio/Centro de Salud/USF/Sanidad Militar y Policial.
CAPÍTULO 7. Servicios sociales en la comunidad El cuadro 7.11 muestra los servicios sociales que la población masculina y femenina adulta mayor recibe y brinda, las cifras señalan
que la mayor parte de la provisión de servicios se realiza a través de instituciones religiosas (86,1%) mientras que la asistencia guber-
namental desempeña un papel escaso (9,7%). La participación de los adultos mayores para la provisión de servicios sociales no es
común, ya que el 83,2% de la población total dijo que no participa en ninguna actividad.
Cuadro 7.11. Distribución de la población mayor de 60 años por sexo, según cobertura de servicios sociales (%).
Cobertura de servicios sociales Total
Sexo
Hombre Mujer
Recibe ayuda 495 100% 190 100% 305 100%
Ayuda del estado 48 9,7% 15 7,9% 33 10,8%
Iglesia o templo 426 86,1% 169 88,9% 257 84,3%
Otro 1/ 5 1,0% 1 0,5% 4 1,3%
No 2 0,4% 1 0,5% 1 0,3%
No sabe/no responde 14 2,8% 4 2,1% 10 3,3%
Otorga ayuda 495 100% 190 100% 305 100%
Servicio de Bienestar Social
8 1,6% 5 2,6% 3 1,0%
Iglesia o templo 46 9,3% 14 7,4% 32 10,5%
Centro de hogar de niños
6 1,2% 3 1,6% 3 1,0%
Otro 2/ 13 2,6% 5 2,6% 8 2,6%%
No 412 83,2% 159 83,7% 253 83,0
No responde 10 2,0% 4 2,1% 6 2,0%
Fuente: DGIS/STP. Encuesta sobre Salud, Bienestar y Envejecimiento (SABE). Paraguay 2017.1/ Incluye: servicios sociales2/ Incluye: fundación, comedor vecinal, etc.

ENCUESTA SABE Principales Resultados JUNIO 2018SALUD, BIENESTAR Y ENVEJECIMIENTO ASUNCIÓN, PARAGUAY
100 101
CAPÍTULO 8. Conclusiones y perspectivas
Los datos presentes en este documento, permiten caracterizar a la población adulta mayor de 60 años y más, a través de múltiples
dimensiones relacionadas con su calidad de vida cotidiana, a fin de que puedan ser utilizados como guía en la realización de políticas
pública a favor de este sector de la población.
En la Encuesta SABE Asunción, se contó con información de 487 cuestionarios aplicados a personas adultas mayores de 60 años y
más, residentes en Asunción y 8 distritos del Departamento Central (Mariano Roque Alonso, Lambaré, Fernando de la Mora, Luque,
Limpio, San Lorenzo, Villa Elisa y Ñemby).
Entre los principales resultados se destaca que aproximadamente el 40% de los adultos mayores entrevistados, se encuentran en el
grupo de edad de 65 a 74 años; además, que la proporción de quienes han estado casados o unidos es mayor con respecto aquellos
que no han estado en esa situación, este escenario se observa tanto para hombres como para mujeres.
Los hijos forman parte principal de apoyo en el desarrollo de la vida cotidiana de los adultos mayores, y en ocasiones es el único
recurso con el que cuentan, los hallazgos de SABE indican que hay un mayor porcentaje de quienes tuvieron 2 a 4 hijos con respecto
a los tuvieron uno o los que no tuvieron hijos. Por otra parte, uno de cada diez adultos mayores mencionó que al menos uno de sus
padres se mantiene vivo.
Se observa una gran diferencia en el grupo de 65 a 69 años, donde las mujeres viven solas en mayor medida que los hombres. Por
otra parte, los hombres tienden a vivir solos con su pareja en proporciones mayores que las mujeres, especialmente conforme avanza
la edad.
La proporción de mujeres que se encuentra en hogares conformados por otras personas como otros parientes, no parientes, hijos
viudos es mayor al de los hombres a medida que va aumentando la edad.
La escolaridad en general es baja, se observa que 6 de cada 10 adultos mayores cuenta con 1 a 6 años de estudio.
Generalmente, se piensa en la tercera edad como la época de la jubilación y el descanso, pero los resultados muestran que solo 1 de
cada 10 adultos mayores se encuentra jubilado o pensionado, el 38,1% continúa trabajando.
Los ingresos económicos de la mayoría de los adultos mayores son muy bajos, en ocasiones, no satisfacen ni siquiera las necesidades
básicas, por lo cual en mayor medida recae en el apoyo familiar.
Para evaluar el estado de salud de la población adulta mayor, la encuesta de SABE Asunción incluyó preguntas sobre la autoper-
cepción del estado de salud, así como también preguntas relacionadas al diagnóstico por parte de un médico. Aunque es una her-
ramienta de evaluación subjetiva, la autopercepción puede ser un medio válido y confiable para la evaluación del estado de salud
del encuestado sin deterioro cognitivo. Estudios han demostrado que la autopercepción es un indicador estrechamente asociado
a condiciones de salud tales como enfermedades cardiovasculares y cerebrovasculares, discapacidad visual y trastornos mentales.
Además, la autopercepción también puede tener implicaciones más significativas relacionadas a la desigualdad socioeconómica y la
salud de la población. Resultados de estudios relacionados han descubierto que los indicadores de desigualdad, como los años de
escolaridad más cortos e ingresos más bajos, están relacionados con la mala percepción de la salud.
CAPITULO 8. Conclusiones y perspectivas

SABE SURVEY Main Results JUNE 2018
103
SALUD, BIENESTAR Y ENVEJECIMIENTO ASUNCIÓN, PARAGUAY
102
CAPÍTULO 8. En el caso de los adultos mayores en Paraguay, la mayoría califica su salud como buena (buena, muy buena o excelente), y la relación
entre las variables de salud y desigualdad (como los años de escolaridad y la suficiencia de ingresos) no fue explícitamente lineal.
Sin embargo, las personas con más años de educación tenían más probabilidades de calificarse con buena o muy buena salud que
mala salud, mientras que las personas que solo recibieron educación primaria (1 a 6 años) tendieron a percibir que su salud es buena
o mala. Además, se descubrió también, que las personas con ingresos más bajos y que sienten que sus ingresos son insuficientes
tienden a percibir su salud en condiciones de buenas a malas, en comparación con las personas con mayores ingresos y que sienten
que sus ingresos son suficientes. Otras variables del estado de salud también se encuentran relacionadas de manera similar con las
variables de desigualdad. Por ejemplo, se encontró que las personas con educación primaria (1 a 6 años) tienen una mayor tendencia
a la discapacidad cognitiva en comparación a las personas con un mayor nivel de educación, y que los adultos mayores sin ingresos
son más propensos a sufrir deterioro cognitivo, mientras que es menos probable entre las personas que perciben suficientes ingresos.
En términos de salud y la relación con los comportamientos y hábitos, se observa que más del 70% de la población total de 60 años y
más tiene sobrepeso u obesidad (35,1% y 35,5, respectivamente), y que las mujeres son más obesas (39,7%) que los hombres (29,0%).
Se considera que la obesidad está relacionada con la dieta, las actividades físicas y otros factores socioeconómicos, al igual que con
enfermedades como la diabetes y las enfermedades cardiovasculares. Estos resultados pueden estar relacionados con la ingesta
calórica diaria excesiva y la elección de alimentos típicos con altos niveles calóricos, así como bajo nivel de actividades físicas. Por otro
lado, el 4,0% de la población total (2,7% de los hombres y 4,9% de las mujeres) informaron tener bajo peso. El bajo peso puede ser
especialmente grave para los adultos mayores, ya que aumenta el riesgo de problemas de salud, incluida la fractura ósea en caso de
caída y debilita el sistema inmunológico general, lo que hace que las personas sean más susceptibles a las infecciones.
Los adultos mayores se ven desproporcionadamente afectados por afecciones crónicas y en Paraguay, la hipertensión, la artritis y la
diabetes son las más prevalentes. En las tres condiciones, las mujeres son las que las sufren con mayor frecuencia, a diferencia de la
población masculina, pero debido a que estas conclusiones se basaron en la autopercepción, no se puede determinar si representa
con precisión la prevalencia. Del mismo modo, la tasa de prevalencia de estas afecciones también es bastante notable en relación
al acceso a la salud, es decir, una afección como la hipertensión puede ser diagnosticada con técnicas y equipos simples que están
ampliamente disponibles en los servicios de salud de primer nivel, pero problemas de salud tales como las enfermedades cardiovas-
culares o cerebrovasculares son más difíciles de determinar debido a la necesidad de equipos y tecnologías más avanzados que solo
están disponibles en ciertos servicios y en lugares determinados del país.
En cuanto a la recopilación de datos sobre cuestiones de salud específicas de género o de naturaleza sensible, se considera que será
necesario poner una mayor consideración en la forma en que se entrega las preguntas. Por ejemplo, ciertas informaciones relaciona-
das a la menopausia y los procedimientos médicos asociados pueden tener implicaciones socioculturales o ser consideradas como
tabú, así como aquellas relacionadas al acceso a la atención. Por otro lado, la aclaración general de ciertas terminologías también
podría realizarse durante la aplicación de la encuesta. Por ejemplo, las principales quejas y problemas urológicos son naturalmente
diferentes para el sexo masculino y femenino, por lo que, los problemas o dificultades para orinar en una mujer por lo general pueden
significar incontinencia, mientras que la misma situación en el hombre podría significar un problema relacionado con la salud de la
próstata.
Main Results JUNE 2018
HEALTH, WELL-BEING AND AGING IN ASUNCION, PARAGUAY
SABE SURVEY
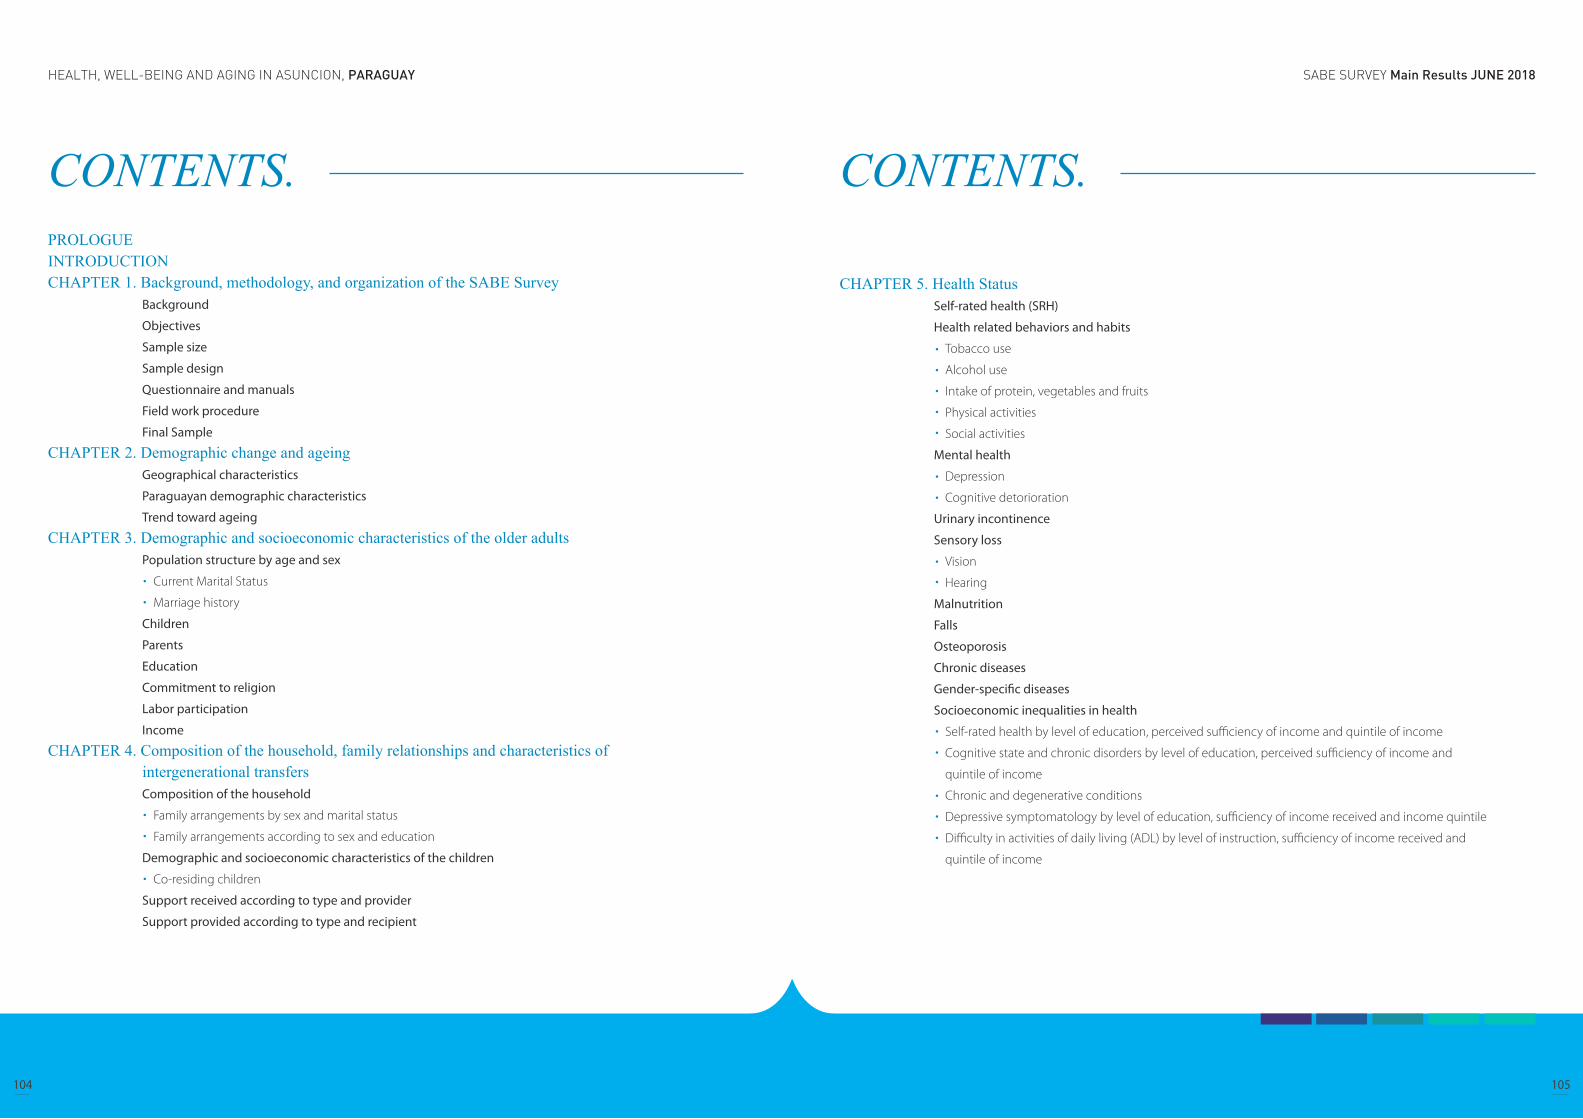
SABE SURVEY Main Results JUNE 2018HEALTH, WELL-BEING AND AGING IN ASUNCION, PARAGUAY
104 105
CONTENTS.PROLOGUE INTRODUCTION CHAPTER 1. Background, methodology, and organization of the SABE Survey
Background
Objectives
Sample size
Sample design
Questionnaire and manuals
Field work procedure
Final Sample
CHAPTER 2. Demographic change and ageing Geographical characteristics
Paraguayan demographic characteristics
Trend toward ageing
CHAPTER 3. Demographic and socioeconomic characteristics of the older adults Population structure by age and sex
Current Marital Status
Marriage history
Children
Parents
Education
Commitment to religion
Labor participation
Income CHAPTER 4. Composition of the household, family relationships and characteristics of intergenerational transfers
Composition of the household
Family arrangements by sex and marital status
Family arrangements according to sex and education
Demographic and socioeconomic characteristics of the children
Co-residing children
Support received according to type and provider
Support provided according to type and recipient
CHAPTER 5. Health Status Self-rated health (SRH)
Health related behaviors and habits
Tobacco use
Alcohol use
Intake of protein, vegetables and fruits
Physical activities
Social activities
Mental health
Depression
Cognitive detorioration
Urinary incontinence
Sensory loss
Vision
Hearing
Malnutrition
Falls
Osteoporosis
Chronic diseases
Gender-specific diseases
Socioeconomic inequalities in health
Self-rated health by level of education, perceived sufficiency of income and quintile of income
Cognitive state and chronic disorders by level of education, perceived sufficiency of income and
quintile of income
Chronic and degenerative conditions
Depressive symptomatology by level of education, sufficiency of income received and income quintile
Difficulty in activities of daily living (ADL) by level of instruction, sufficiency of income received and
quintile of income
CONTENTS.

SABE SURVEY Main Results JUNE 2018HEALTH, WELL-BEING AND AGING IN ASUNCION, PARAGUAY
106 107
CONTENTS. PROLOGUE.Within the framework of the Project “Construction the Santo Domingo Center for Long-term Care and Social Services and Consulting
on the Policies Establishment for Elderly in Paraguay”, which aims to build a complex facility for older adults care, strengthening the
administrative capacities of the long-term care centers and the development of health and social welfare policies for the older adults,
there is a need to obtain reliable data to be used as a guide for the realization of policies, laws and regulations in favor of the older
adults.
Therefore, the survey on Health, Well-being and Aging Survey (SABE) was carried out, by the signing a memorandum of understand-
ing between the Korean International Cooperation Agency (KOICA), through its office in Paraguay, and the Technical Secretariat of
Plannig for the Economic and Social Development (STP). The responsible unite for the planning, supervision and monitoring of the
survey was the General Directorate of Social Information (DGIS) of the STP.
The SABE Survey aims to provide information on the health conditions of the older adults and their social determinants in order to
analyze them and identify the needs of social services, in order to contribute to the national development of policies for the older
adults in Paraguay.
This document presents a summary of the main results of the survey, which will serve for the analysis of the health conditions of the
older adults and their social determinants, strongly linked to the economic and social environment; and as a guide in the realization
of policies, laws and regulations in favor of the older adults.
CHAPTER 6. Functional limitations Activities of daily living
Instrumental activities of daily living
Mobility CHAPTER 7. Use and access to social and health services
Use of ambulatory health services
Outpatient consultations
Vaccinations
Access to outpatient care
Hospitalizacion, time and cost
Use and access to medication
Health insurance and social services
Social services in the community
CHAPTER 8. Conclusion and Discussions
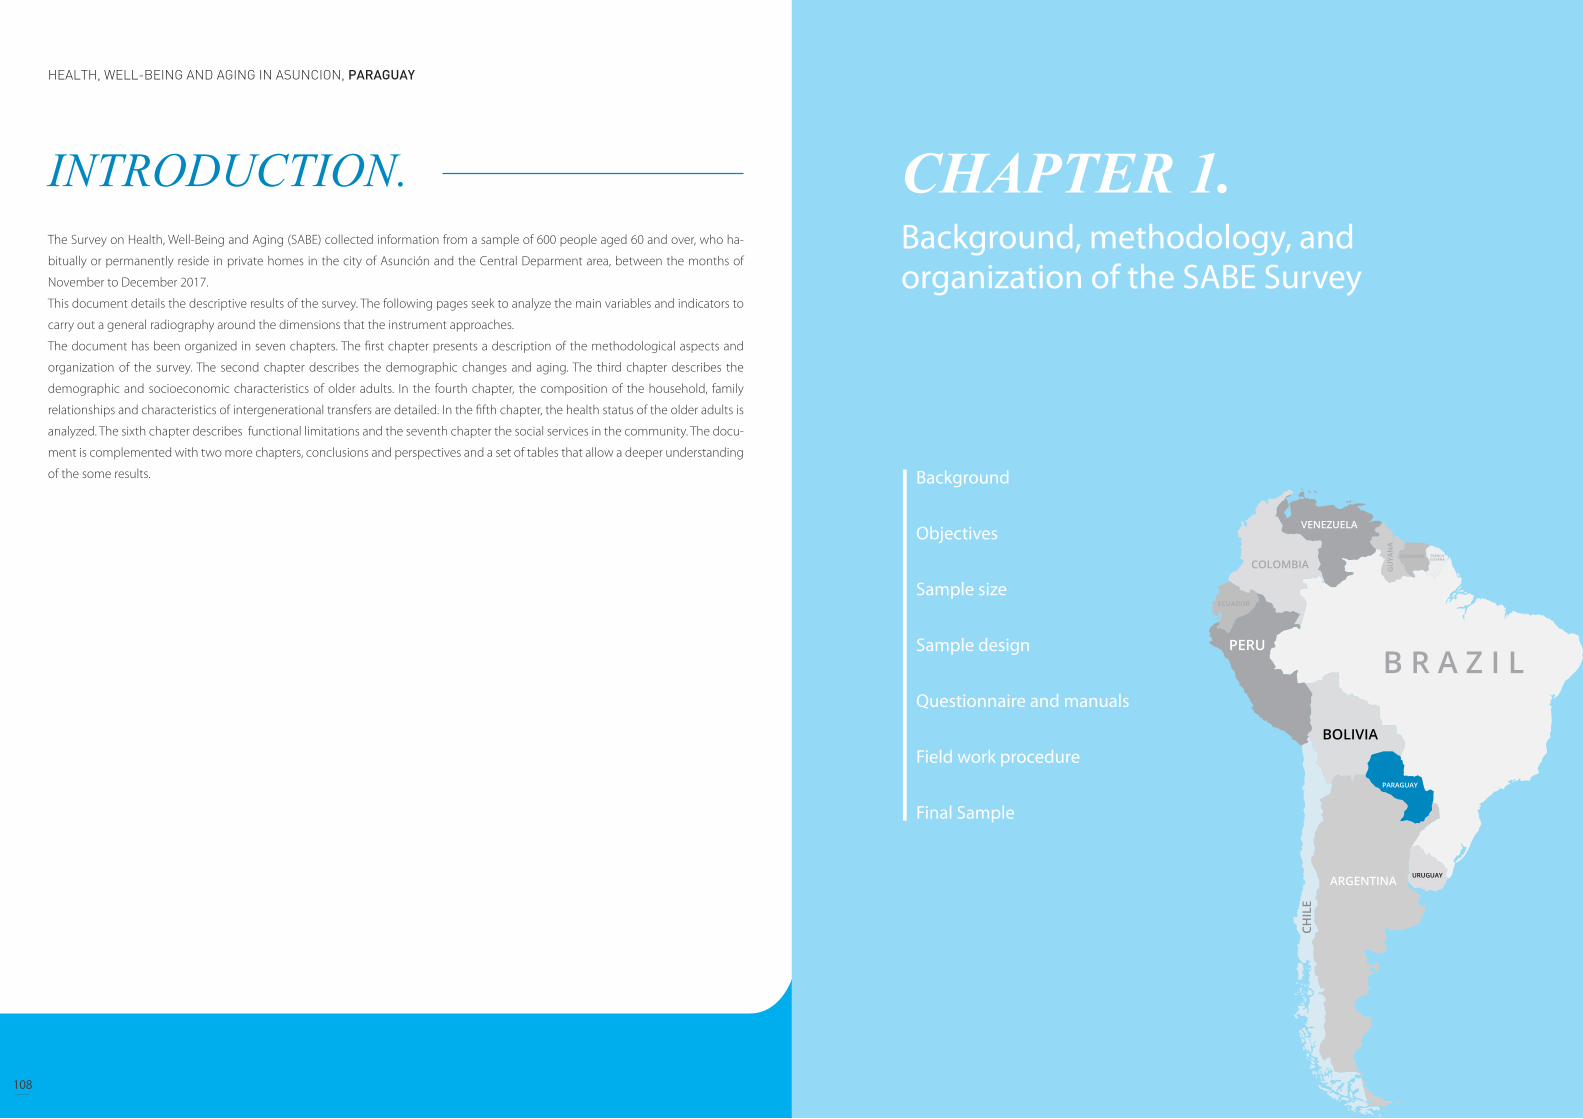
SABE SURVEY Main Results JUNE 2018HEALTH, WELL-BEING AND AGING IN ASUNCION, PARAGUAY
108 109
INTRODUCTION.The Survey on Health, Well-Being and Aging (SABE) collected information from a sample of 600 people aged 60 and over, who ha-
bitually or permanently reside in private homes in the city of Asunción and the Central Deparment area, between the months of
November to December 2017.
This document details the descriptive results of the survey. The following pages seek to analyze the main variables and indicators to
carry out a general radiography around the dimensions that the instrument approaches.
The document has been organized in seven chapters. The first chapter presents a description of the methodological aspects and
organization of the survey. The second chapter describes the demographic changes and aging. The third chapter describes the
demographic and socioeconomic characteristics of older adults. In the fourth chapter, the composition of the household, family
relationships and characteristics of intergenerational transfers are detailed. In the fifth chapter, the health status of the older adults is
analyzed. The sixth chapter describes functional limitations and the seventh chapter the social services in the community. The docu-
ment is complemented with two more chapters, conclusions and perspectives and a set of tables that allow a deeper understanding
of the some results.
CHAPTER 1. Background, methodology, and organization of the SABE Survey
Background
Objectives
Sample size
Sample design
Questionnaire and manuals
Field work procedure
Final Sample
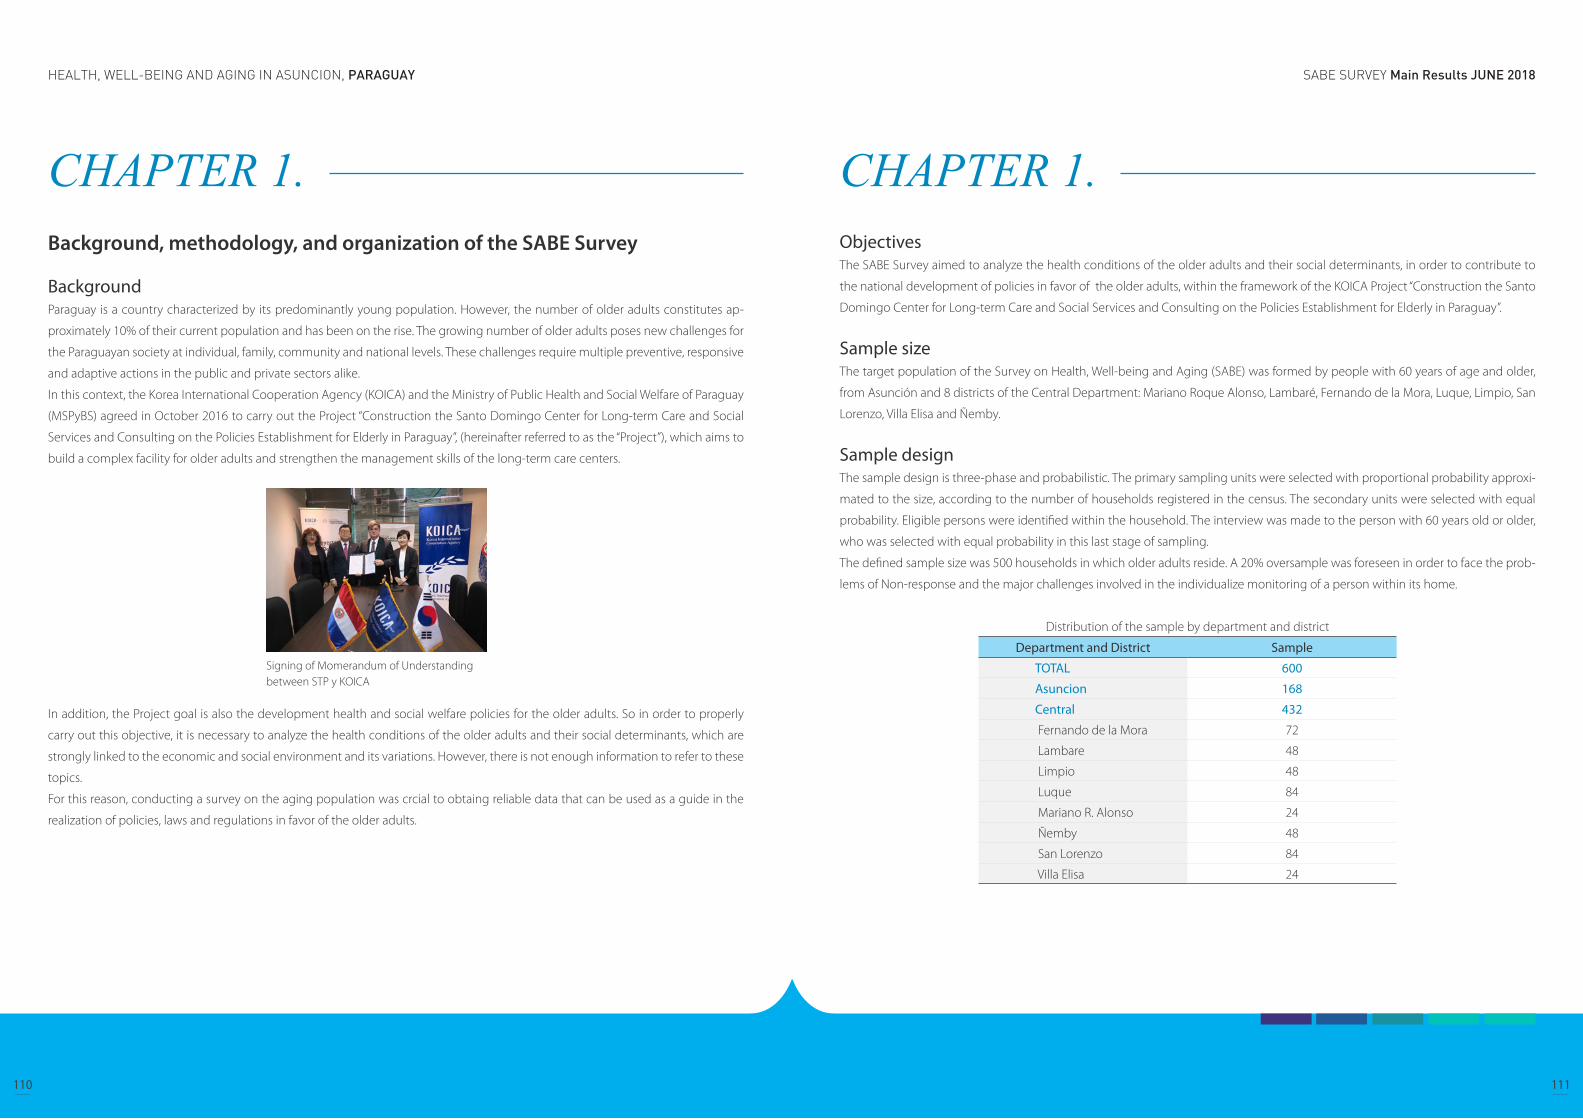
SABE SURVEY Main Results JUNE 2018HEALTH, WELL-BEING AND AGING IN ASUNCION, PARAGUAY
110 111
CHAPTER 1. Background, methodology, and organization of the SABE Survey
Background Paraguay is a country characterized by its predominantly young population. However, the number of older adults constitutes ap-
proximately 10% of their current population and has been on the rise. The growing number of older adults poses new challenges for
the Paraguayan society at individual, family, community and national levels. These challenges require multiple preventive, responsive
and adaptive actions in the public and private sectors alike.
In this context, the Korea International Cooperation Agency (KOICA) and the Ministry of Public Health and Social Welfare of Paraguay
(MSPyBS) agreed in October 2016 to carry out the Project “Construction the Santo Domingo Center for Long-term Care and Social
Services and Consulting on the Policies Establishment for Elderly in Paraguay”, (hereinafter referred to as the “Project”), which aims to
build a complex facility for older adults and strengthen the management skills of the long-term care centers.
In addition, the Project goal is also the development health and social welfare policies for the older adults. So in order to properly
carry out this objective, it is necessary to analyze the health conditions of the older adults and their social determinants, which are
strongly linked to the economic and social environment and its variations. However, there is not enough information to refer to these
topics.
For this reason, conducting a survey on the aging population was crcial to obtaing reliable data that can be used as a guide in the
realization of policies, laws and regulations in favor of the older adults.
Signing of Momerandum of Understanding between STP y KOICA
CHAPTER 1. ObjectivesThe SABE Survey aimed to analyze the health conditions of the older adults and their social determinants, in order to contribute to
the national development of policies in favor of the older adults, within the framework of the KOICA Project “Construction the Santo
Domingo Center for Long-term Care and Social Services and Consulting on the Policies Establishment for Elderly in Paraguay”.
Sample sizeThe target population of the Survey on Health, Well-being and Aging (SABE) was formed by people with 60 years of age and older,
from Asunción and 8 districts of the Central Department: Mariano Roque Alonso, Lambaré, Fernando de la Mora, Luque, Limpio, San
Lorenzo, Villa Elisa and Ñemby.
Sample designThe sample design is three-phase and probabilistic. The primary sampling units were selected with proportional probability approxi-
mated to the size, according to the number of households registered in the census. The secondary units were selected with equal
probability. Eligible persons were identified within the household. The interview was made to the person with 60 years old or older,
who was selected with equal probability in this last stage of sampling.
The defined sample size was 500 households in which older adults reside. A 20% oversample was foreseen in order to face the prob-
lems of Non-response and the major challenges involved in the individualize monitoring of a person within its home.
Distribution of the sample by department and district
Department and District Sample
TOTAL 600
Asuncion 168
Central 432
Fernando de la Mora 72
Lambare 48
Limpio 48
Luque 84
Mariano R. Alonso 24
Ñemby 48
San Lorenzo 84
Villa Elisa 24
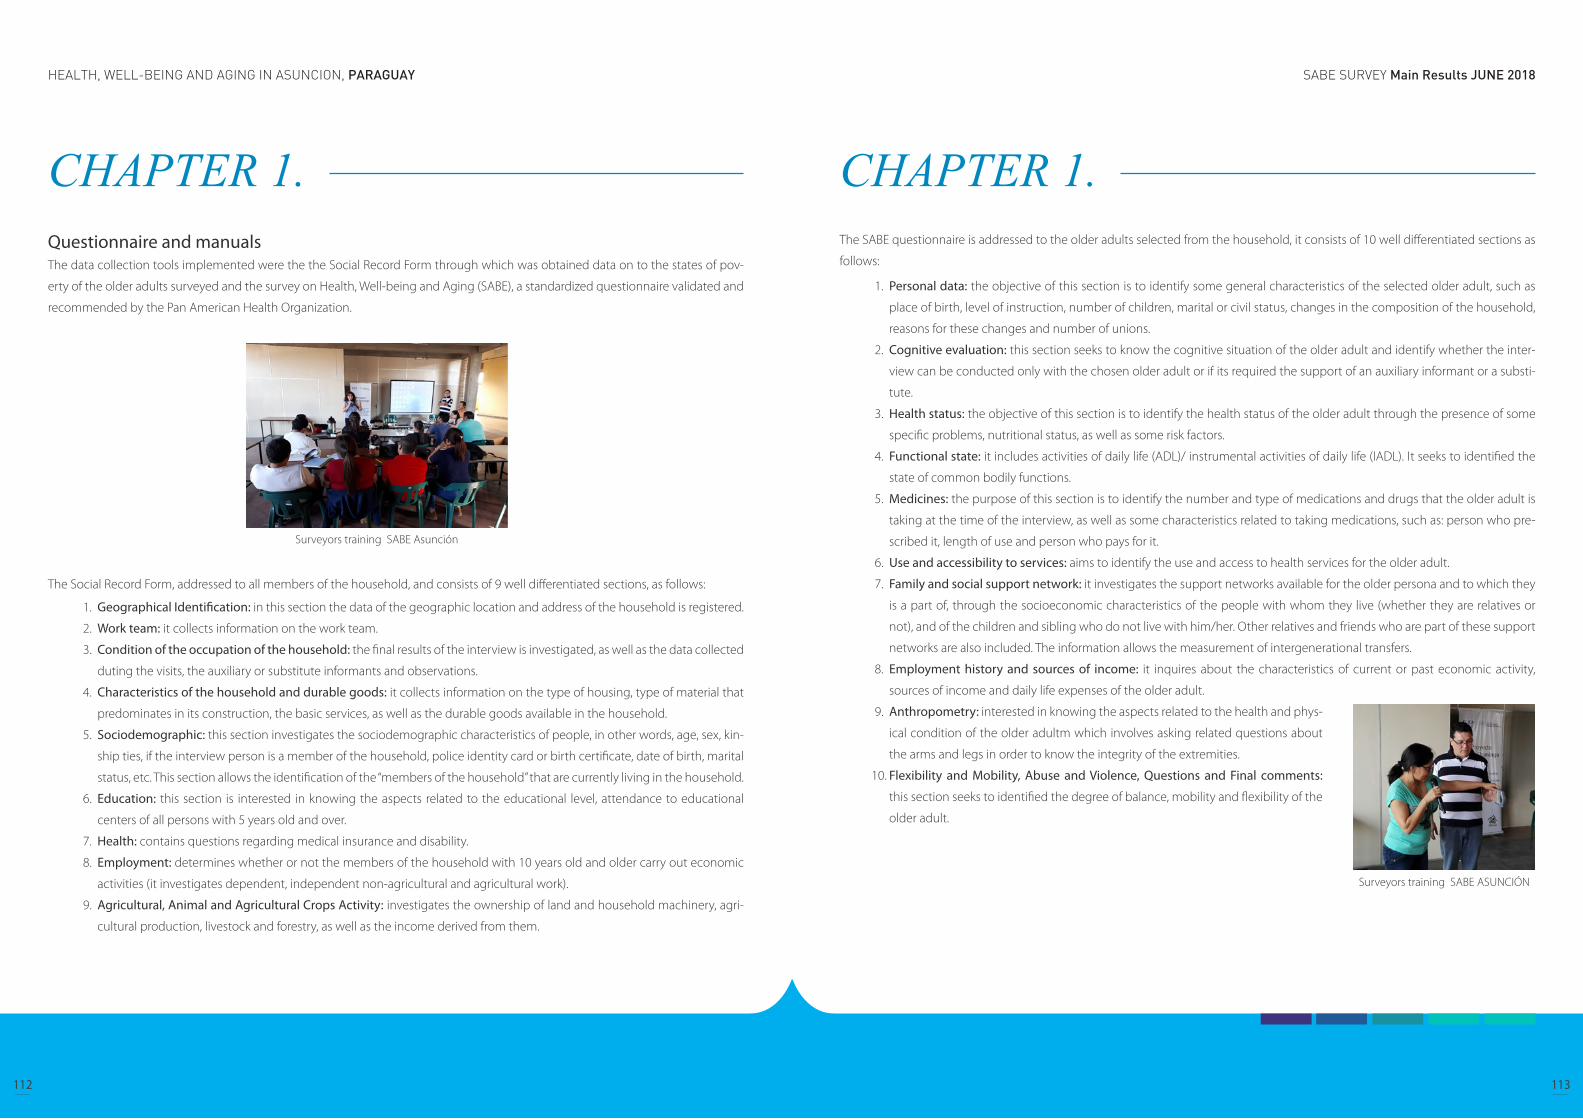
SABE SURVEY Main Results JUNE 2018HEALTH, WELL-BEING AND AGING IN ASUNCION, PARAGUAY
112 113
CHAPTER 1. Questionnaire and manualsThe data collection tools implemented were the the Social Record Form through which was obtained data on to the states of pov-
erty of the older adults surveyed and the survey on Health, Well-being and Aging (SABE), a standardized questionnaire validated and
recommended by the Pan American Health Organization.
The Social Record Form, addressed to all members of the household, and consists of 9 well differentiated sections, as follows:
Surveyors training SABE Asunción
Geographical Identification: in this section the data of the geographic location and address of the household is registered.
Work team: it collects information on the work team.
Condition of the occupation of the household: the final results of the interview is investigated, as well as the data collected
duting the visits, the auxiliary or substitute informants and observations.
Characteristics of the household and durable goods: it collects information on the type of housing, type of material that
predominates in its construction, the basic services, as well as the durable goods available in the household.
Sociodemographic: this section investigates the sociodemographic characteristics of people, in other words, age, sex, kin-
ship ties, if the interview person is a member of the household, police identity card or birth certificate, date of birth, marital
status, etc. This section allows the identification of the “members of the household” that are currently living in the household.
Education: this section is interested in knowing the aspects related to the educational level, attendance to educational
centers of all persons with 5 years old and over.
Health: contains questions regarding medical insurance and disability.
Employment: determines whether or not the members of the household with 10 years old and older carry out economic
activities (it investigates dependent, independent non-agricultural and agricultural work).
Agricultural, Animal and Agricultural Crops Activity: investigates the ownership of land and household machinery, agri-
cultural production, livestock and forestry, as well as the income derived from them.
1.
2.
3.
4.
5.
6.
7.
8.
9.
CHAPTER 1. The SABE questionnaire is addressed to the older adults selected from the household, it consists of 10 well differentiated sections as
follows:
Surveyors training SABE ASUNCIÓN
Personal data: the objective of this section is to identify some general characteristics of the selected older adult, such as
place of birth, level of instruction, number of children, marital or civil status, changes in the composition of the household,
reasons for these changes and number of unions.
Cognitive evaluation: this section seeks to know the cognitive situation of the older adult and identify whether the inter-
view can be conducted only with the chosen older adult or if its required the support of an auxiliary informant or a substi-
tute.
Health status: the objective of this section is to identify the health status of the older adult through the presence of some
specific problems, nutritional status, as well as some risk factors.
Functional state: it includes activities of daily life (ADL)/ instrumental activities of daily life (IADL). It seeks to identified the
state of common bodily functions.
Medicines: the purpose of this section is to identify the number and type of medications and drugs that the older adult is
taking at the time of the interview, as well as some characteristics related to taking medications, such as: person who pre-
scribed it, length of use and person who pays for it.
Use and accessibility to services: aims to identify the use and access to health services for the older adult.
Family and social support network: it investigates the support networks available for the older persona and to which they
is a part of, through the socioeconomic characteristics of the people with whom they live (whether they are relatives or
not), and of the children and sibling who do not live with him/her. Other relatives and friends who are part of these support
networks are also included. The information allows the measurement of intergenerational transfers.
Employment history and sources of income: it inquires about the characteristics of current or past economic activity,
sources of income and daily life expenses of the older adult.
Anthropometry: interested in knowing the aspects related to the health and phys-
ical condition of the older adultm which involves asking related questions about
the arms and legs in order to know the integrity of the extremities.
Flexibility and Mobility, Abuse and Violence, Questions and Final comments:
this section seeks to identified the degree of balance, mobility and flexibility of the
older adult.
1.
2.
3.
4.
5.
6.
7.
8.
9.
10.
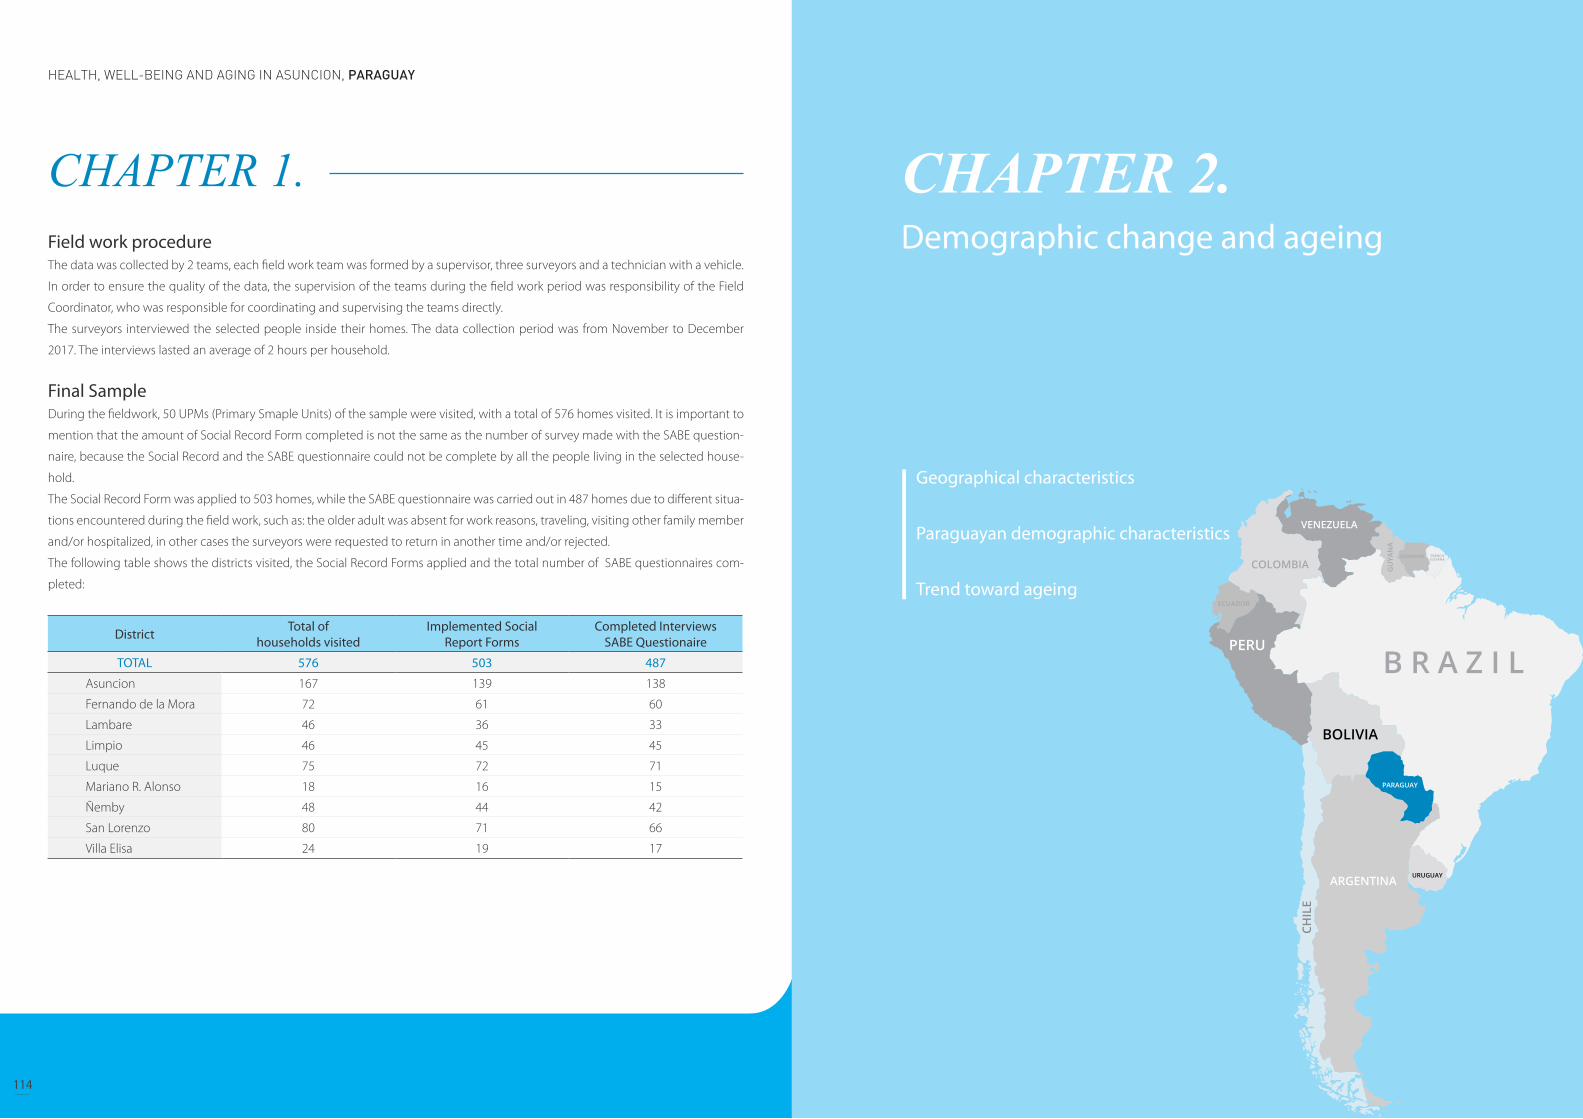
SABE SURVEY Main Results JUNE 2018HEALTH, WELL-BEING AND AGING IN ASUNCION, PARAGUAY
114 115
CHAPTER 1. Field work procedureThe data was collected by 2 teams, each field work team was formed by a supervisor, three surveyors and a technician with a vehicle.
In order to ensure the quality of the data, the supervision of the teams during the field work period was responsibility of the Field
Coordinator, who was responsible for coordinating and supervising the teams directly.
The surveyors interviewed the selected people inside their homes. The data collection period was from November to December
2017. The interviews lasted an average of 2 hours per household.
Final Sample During the fieldwork, 50 UPMs (Primary Smaple Units) of the sample were visited, with a total of 576 homes visited. It is important to
mention that the amount of Social Record Form completed is not the same as the number of survey made with the SABE question-
naire, because the Social Record and the SABE questionnaire could not be complete by all the people living in the selected house-
hold.
The Social Record Form was applied to 503 homes, while the SABE questionnaire was carried out in 487 homes due to different situa-
tions encountered during the field work, such as: the older adult was absent for work reasons, traveling, visiting other family member
and/or hospitalized, in other cases the surveyors were requested to return in another time and/or rejected.
The following table shows the districts visited, the Social Record Forms applied and the total number of SABE questionnaires com-
pleted:
District Total of households visited
Implemented Social Report Forms
Completed InterviewsSABE Questionaire
TOTAL 576 503 487
Asuncion 167 139 138
Fernando de la Mora 72 61 60
Lambare 46 36 33
Limpio 46 45 45
Luque 75 72 71
Mariano R. Alonso 18 16 15
Ñemby 48 44 42
San Lorenzo 80 71 66
Villa Elisa 24 19 17
CHAPTER 2. Demographic change and ageing
Geographical characteristics
Paraguayan demographic characteristics
Trend toward ageing

SABE SURVEY Main Results JUNE 2018HEALTH, WELL-BEING AND AGING IN ASUNCION, PARAGUAY
116 117
CHAPTER 2. Demographic change and ageing
Geographical characteristicsThe Paraguayan territory is located in the center of South America and between parallels 19º 10 ‘and 27º 50’ of south latitude and the
meridians 54º 10 ‘and 62º 50’ of west longitude. Its total surface is of 406 752 km and has no coastline on the sea, since it is a Mediter-
ranean country that borders on the north with Brazil and Bolivia, on the east with Brazil and Argentina, on the south with Argentina
and on the west with Bolivia and Argentina. Paraguay is divided politically into 17 departments, 14 in the Eastern Region and 3 in the
Western Region. The city of Asunción is its capital.
The Paraguay River divides the country into two large geographic regions with different geology and topography. The Eastern Region
has the 39% of the national territory, and consists of ferralitic and mostly acidic soils; however, meanwhile the Western Region or
Chaco, with 61% of the national territory, presents neutral to alkaline soils, formed by a extensive alluvial semi-arid to subhumid plain,
with extreme maximum temperatures in the summer that can exceed 40 °C. The Eastern Region, in turn, is subdivided into two sub-
regions, the largest corresponds to the Paraguay River basin and a lesser one to the Paraná River basin. This Region is predominated
by tropical and subtropical forests, and frequent rainfall. The average annual temperature varies between 20 and 23 °C.
The seasons are not well defined because most of the year the climate is very hot. The temperature difference between the warmest
month and the coldest month is 10 °C. Autumn and spring are transitional and unstable seasons, with large variations in temperature
that go between cool and hot, and in which even severe storms can occur. Normally at the beginning of autumn and the end of
spring, the weather is similar to summer.
On average, frosts in the center-north of the eastern and western region occur once or twice a year and in the south of the eastern
region the average increases to 3 times a year. The appearance of frost in the winter season is what differentiates the country from
the tropical climate, and occur in conjunction with the polar cold fronts, which usually occur between the winter months of June,
July and August.
Its two main rivers are Paraguay and Paraná, the territory also has wetlands and lakes. The set of wetlands of the Lake Ypoá, that is
fomed by four lakes, and the Lake Ypacaraí are the largest lakes in Paraguay. Paraguay also has a considerable amount of swamps such
as the Paraguayan Pantanal whose surfaces add up to a total of 793,910 hectares.
CHAPTER 2. Paraguayan demographic characteristics The General Directorate of Statistics, Surveys and Censuses (DGEEC) estimated the population of Paraguay in 2017 (2015 revision) at
6,953,646 inhabitants. The population density, 17.1 inhabitants/km², is lower than most of the other Latin American countries, and its
distribution throughout the territory is very irregular: the vast majority of people live in the Eastern Region, where the largest cities
such as Asunción and Gran Asunción or Ciudad del Este are based. The Chaco or Western Region, which covers approximately 60.7%
of the territory, has less than 5% of the national population.
Between 1864 and 1870, the Triple Alliance War took place in which Argentina, Brazil and Uruguay fought against Paraguay, causing
a massive mortality of the Paraguayan population, especially of the males. Just over half of the Paraguayan population died in this
war (approximately 90% of men were killed). Just at the beginning the twentieth century, during the first decades, Paraguay reached
the population it had before the war.
An important factor in the recovery of the Paraguayan population, in addition to European immigration and from the neighboring
countries to Paraguay, was the high birth rate of the population. For the five-year period 2000-2005, there was a gradual decrease in
TBN (Total Basic Number), from 26.9 births per thousand inhabitants, to 21.0 per thousand for the five-year period 2015-2020, coincid-
ing with the decrease in Global Fertility Rate (TFR), which fell from 3.48 children per woman to 2.33 in the same compared period. This
downward trend is maintained in the following five-year periods, according to the projection estimated by the DGEEC.
Table 2.1. Main indicators of population evolution in Paraguay. In the period between 2000 and 2050.
Period CBR CMR PGR (Per 1,000) TFR
2000-2005 26,9 26,94 21,2 3,48
2005-2010 24,8 24,75 19,1 3,08
2010-2015 22,8 22,78 17,3 2,76
2015-2020 21,0 20,95 15,4 2,51
2020-2025 19,3 19,27 13,5 2,33
2025-2030 17,8 17,81 11,8 2,2
2030-2035 16,6 16,6 10,2 2,1
2035-2040 15,6 15,58 8,8 2,04
2040-2045 14,7 14,71 7,5 1,99
2045-2050 14,0 13,97 6,3 1,96
Source: DGEEC. Demographic indicators estimated by 5 year periods. CBR: Crude Birth Rate; CMR: Crude Mortality Rate, PGR: Population Growth Rate, TFR: Total Fertility Rate

SABE SURVEY Main Results JUNE 2018HEALTH, WELL-BEING AND AGING IN ASUNCION, PARAGUAY
118 119
CHAPTER 2. Trend toward ageing In Paraguay, despite having a large percentage of young people in 2017 (29.9% under 15 years and 63.9% between 15 and 64 years),
the aging of the population can be seen in the gradual increase of the percentages of the older adults, so that it can be anticipated
and noted that this behavior will continue over the following years.
The effect of aging is at an incipient stage, but the process will be the demographic consequence of greater relevance in the present
century. Table 2. shows the population totals and percentages in three large age groups, which usually represent the participation of
children and young people from 0 to 14 years old, youth and adults from 15 to 64 and older adults with 65 years and older. The data
shows that from a percentage of 4.9% of older adults for the year 2000, it goes to 7.7% projected for the year 2025, in contrast, the
proportion of children and young people, decreases gradually, from 37.9% for 2000 it is reduced to 27.3% estimated for 2025.
It is observed that, from the year 2000 onwards, the increases began at a slow pace, but from 2008, the ascent accelerated, reaching
the porcentages of the population 65 and over to 7.7% in 2025. The results invite us to ponder the repercussions that may cause,
whether of social or economic nature and for the development of this increasing aging, especially if we take into account that in
Paraguay the research, planning, prevention, provision of services and political and administrative organization for the aging popula-
tion is in an incipient stage.
CHAPTER 2. Table 2.2. Total population and distribution of age group (%) in Paraguay, in 2000 – 2025.
Year Population 0-14 (%) 15-64 (%) 65 and older (%)
2000 5.284.480 37,9 57,2 4,9
2001 5.385.002 37,4 57,7 4,9
2002 5.484.610 36,9 58,2 4,9
2003 5.583.484 36,4 58,7 5,0
2004 5.681.872 35,8 59,2 5,0
2005 5.779.769 35,3 59,7 5,1
2006 5.877.323 34,8 60,1 5,1
2007 5.974.666 34,3 60,6 5,2
2008 6.071.781 33,8 61,0 5,2
2009 6.168.757 33,3 61,4 5,3
2010 6.265.877 32,8 61,8 5,4
2011 6.363.276 32,4 62,2 5,5
2012 6.461.041 31,9 62,5 5,6
2013 6.559.027 31,5 62,9 5,6
2014 6.657.232 31,1 63,2 5,8
2015 6.755.756 30,7 63,4 5,9
2016 6.854.536 30,3 63,7 6,0
2017 6.953.646 29,9 63,9 6,2
2018 7.052.983 29,6 64,1 6,4
2019 7.152.703 29,2 64,2 6,5
2020 7.252.672 28,9 64,4 6,7
2021 7.353.038 28,6 64,5 6,9
2022 7.453.695 28,2 64,7 7,1
2023 7.554.796 27,9 64,8 7,3
2024 7.656.215 27,6 64,9 7,5
2025 7.758.263 27,3 65,1 7,7
Source: DGEEC. Population projected by sex and age, according to district, 2000-2025.

SABE SURVEY Main Results JUNE 2018HEALTH, WELL-BEING AND AGING IN ASUNCION, PARAGUAY
120 121
CHAPTER 3. Demographic and socioeconomic characteristics of the older adults
Population structure by age and sexThe projection of population by sex and age groups estimates a total population of 6,953,646 people for the year 2017; and of these,
643,829 are over 60 years old, in other words, 9.2%. By age groups it is observed that, in the group of 60 to 69 years old, the propor-
tions of men and women are similar, while in the group of 70 and over there is a small difference between women and men (4.3 %
to 3.5%, respectively).
The femininity index in the group of 60 to 69 years of age is 98.4, while in the group of 70 and over it increases to 119.9. According
to the universal patterns of “feminization” of old age, as the age advances, the proportion of women increases with respect to that of
men.
Table 3.1. Population distribution by age and sex (%).
Age group
Number PercentageFemininity
IndexTotalSex
TotalSex
Male Female Male Female
Total 6.953.646 3.506.242 3.447.404 100 100 100 98,3
0 a 9 1.397.223 712.410 684.813 20,1 20,3 19,9 96,1
10 a 19 1.358.200 691.704 666.497 19,5 19,7 19,3 96,4
20 a 29 1.252.950 637.369 615.581 18 18,2 17,9 96,6
30 a 39 1.004.944 504.950 499.994 14,5 14,4 14,5 99
40 a 49 734.780 366.293 368.487 10,6 10,4 10,7 100,6
50 a 59 561.719 282.409 279.310 8,1 8,1 8,1 98,9
60 a 69 370.610 186.836 183.774 5,3 5,3 5,3 98,4
70 y más 273.219 124.271 148.948 3,9 3,5 4,3 119,9
Source: STP/DGEEC. Paraguay: Population projected by sex and age group, according to department, 2000-2020.
CHAPTER 3. Demographic and socioeconomic characteristics of the older adults
Population structure by age and sex
Children
Parents
Education
Commitment to religion
Labor participation
Income

SABE SURVEY Main Results JUNE 2018HEALTH, WELL-BEING AND AGING IN ASUNCION, PARAGUAY
122 123
CHAPTER 3. Figure 3.1. Population distribution by groups of age and sex (%)
Table 3.2 shows the percentages referred to the distribution of older adults in the SABE Survey, 30.8% corresponds to the group of
60-64 years old, 39.6% to the group 65-74 years old and 29, 6% to the group of 75 years and over.
In terms of distribution by sex, there is a predominance of men in the first three groups, for those with 75 and over there is an inverse
situation, 35.4% are women and 20.9% are men.
The average age of the population aged 60 and over, in the case of women is 71.7 years, while that of men is 69 years.
Table 3.2. Population structure of older persons1/ by sex and age (%).
Age group TotalSex
Male Female
Total 503 100,0% 201 100,0% 302 100,0%
60-64 155 30,8% 75 37,3% 80 26,5%
65-69 114 22,7% 47 23,4% 67 22,2%
70-74 85 16,9% 37 18,4% 48 15,9%
≥ 75 149 29,6% 42 20,9% 107 35,4%
Edad Media 70,7 69,0 71,7
Fuente: DGIS/STP. Survey on Health, Well-Being and Aging (SABE), Paraguay 20171/ Corresponds to all older adults selected for SABE
CHAPTER 3. Figure 3.2. Population structure of older persons by sex and age (%)
Source: DGIS/STP. Survey on Health, Well-Being and Aging (SABE), Paraguay 2017
Current Marital Status The general situation of marital status is shown in table 3.3, where older adults are placed according to the following categories:
married,cohabiting (which means the person lives with a spouse without having contracted civil or religious marriage), separated,
widowed, single or divorced.
The conjugal situation of the older adult is an indicator that reflects the possibility of having company of other people for the daily
development of life. Table 3.3 shows a higher proportion of married or cohabiting older adults (43.9%).
For the most part, men are married (55.2%) while, among women, the prevailing marital status is widowhood (41.7%) and then mar-
riage (22.5%). In the age group of 75 years and over, 6 out of 10 women are declared widows, while for men in the same age group,
this situation affects only 3 out of 10 men.
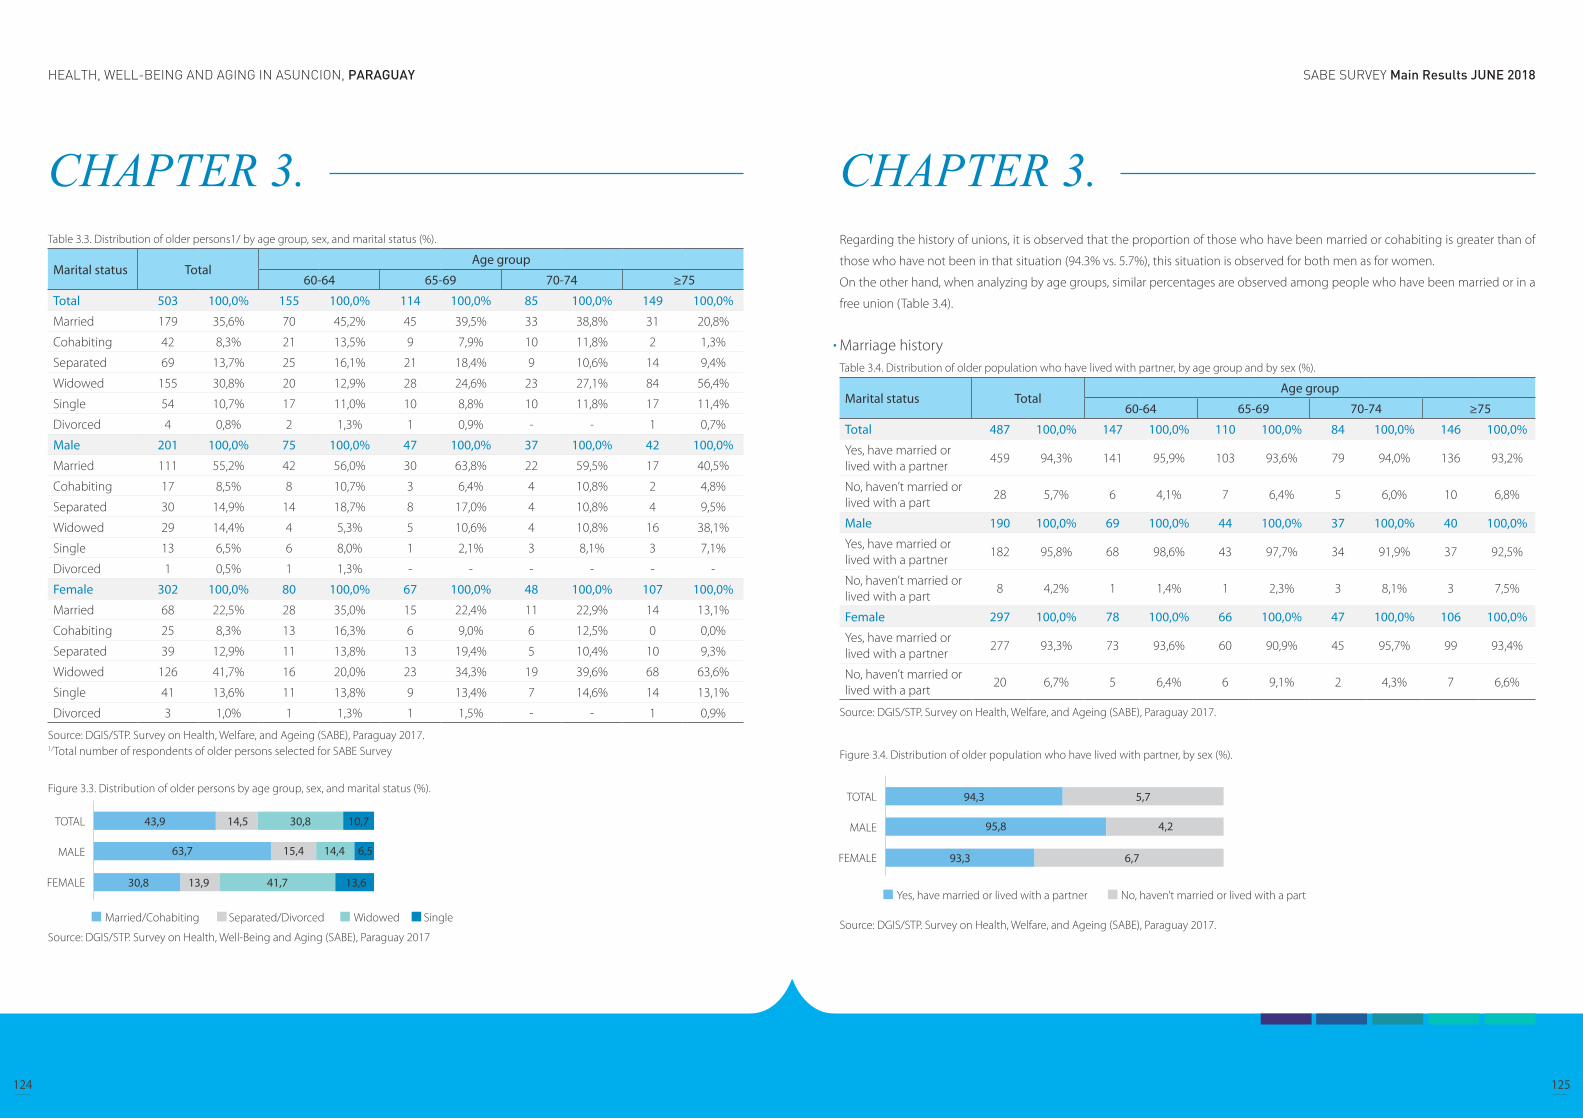
SABE SURVEY Main Results JUNE 2018HEALTH, WELL-BEING AND AGING IN ASUNCION, PARAGUAY
124 125
CHAPTER 3. Table 3.3. Distribution of older persons1/ by age group, sex, and marital status (%).
Marital status TotalAge group
60-64 65-69 70-74 ≥75
Total 503 100,0% 155 100,0% 114 100,0% 85 100,0% 149 100,0%
Married 179 35,6% 70 45,2% 45 39,5% 33 38,8% 31 20,8%
Cohabiting 42 8,3% 21 13,5% 9 7,9% 10 11,8% 2 1,3%
Separated 69 13,7% 25 16,1% 21 18,4% 9 10,6% 14 9,4%
Widowed 155 30,8% 20 12,9% 28 24,6% 23 27,1% 84 56,4%
Single 54 10,7% 17 11,0% 10 8,8% 10 11,8% 17 11,4%
Divorced 4 0,8% 2 1,3% 1 0,9% - - 1 0,7%
Male 201 100,0% 75 100,0% 47 100,0% 37 100,0% 42 100,0%
Married 111 55,2% 42 56,0% 30 63,8% 22 59,5% 17 40,5%
Cohabiting 17 8,5% 8 10,7% 3 6,4% 4 10,8% 2 4,8%
Separated 30 14,9% 14 18,7% 8 17,0% 4 10,8% 4 9,5%
Widowed 29 14,4% 4 5,3% 5 10,6% 4 10,8% 16 38,1%
Single 13 6,5% 6 8,0% 1 2,1% 3 8,1% 3 7,1%
Divorced 1 0,5% 1 1,3% - - - - - -
Female 302 100,0% 80 100,0% 67 100,0% 48 100,0% 107 100,0%
Married 68 22,5% 28 35,0% 15 22,4% 11 22,9% 14 13,1%
Cohabiting 25 8,3% 13 16,3% 6 9,0% 6 12,5% 0 0,0%
Separated 39 12,9% 11 13,8% 13 19,4% 5 10,4% 10 9,3%
Widowed 126 41,7% 16 20,0% 23 34,3% 19 39,6% 68 63,6%
Single 41 13,6% 11 13,8% 9 13,4% 7 14,6% 14 13,1%
Divorced 3 1,0% 1 1,3% 1 1,5% - - 1 0,9%
Source: DGIS/STP. Survey on Health, Welfare, and Ageing (SABE), Paraguay 2017.1/Total number of respondents of older persons selected for SABE Survey
Figure 3.3. Distribution of older persons by age group, sex, and marital status (%).
Source: DGIS/STP. Survey on Health, Well-Being and Aging (SABE), Paraguay 2017
CHAPTER 3. Regarding the history of unions, it is observed that the proportion of those who have been married or cohabiting is greater than of
those who have not been in that situation (94.3% vs. 5.7%), this situation is observed for both men as for women.
On the other hand, when analyzing by age groups, similar percentages are observed among people who have been married or in a
free union (Table 3.4).
Marriage historyTable 3.4. Distribution of older population who have lived with partner, by age group and by sex (%).
Marital status TotalAge group
60-64 65-69 70-74 ≥75
Total 487 100,0% 147 100,0% 110 100,0% 84 100,0% 146 100,0%
Yes, have married or lived with a partner
459 94,3% 141 95,9% 103 93,6% 79 94,0% 136 93,2%
No, haven’t married or lived with a part
28 5,7% 6 4,1% 7 6,4% 5 6,0% 10 6,8%
Male 190 100,0% 69 100,0% 44 100,0% 37 100,0% 40 100,0%
Yes, have married or lived with a partner
182 95,8% 68 98,6% 43 97,7% 34 91,9% 37 92,5%
No, haven’t married or lived with a part
8 4,2% 1 1,4% 1 2,3% 3 8,1% 3 7,5%
Female 297 100,0% 78 100,0% 66 100,0% 47 100,0% 106 100,0%
Yes, have married or lived with a partner
277 93,3% 73 93,6% 60 90,9% 45 95,7% 99 93,4%
No, haven’t married or lived with a part
20 6,7% 5 6,4% 6 9,1% 2 4,3% 7 6,6%
Source: DGIS/STP. Survey on Health, Welfare, and Ageing (SABE), Paraguay 2017.
Figure 3.4. Distribution of older population who have lived with partner, by sex (%).
Source: DGIS/STP. Survey on Health, Welfare, and Ageing (SABE), Paraguay 2017.

SABE SURVEY Main Results JUNE 2018HEALTH, WELL-BEING AND AGING IN ASUNCION, PARAGUAY
126 127
CHAPTER 3. Children are a main source of support in the development of everyday life for older adults, and sometimes it is the only resource they have.
Table 3.5 shows that 49.3% of the older adult population (60 years and over) has two to four children alive and 35.5% have five or
more children alive.
There are small differences when comparing the percentages between men and women who have only one child (9.5% and 12.5%,
respectively). On the other hand, the percentage is slightly higher for women with 5 or more children (36.4%), compared to men who
have the same number of children (34.2%).
ChildrenTable 3.5. Distribution of older population according to the number of live children, by sex and age group (%).
Number of live children Total
Age group
60-64 65-69 70-74 ≥75
Total 487 100,0% 147 100,0% 110 100,0% 84 100,0% 146 100,0%
0 2 0,4% 0 0,0% 0 0,0% 0 0,0% 2 1,4%
1 55 11,3% 16 10,9% 8 7,3% 6 7,1% 25 17,1%
2 – 4 240 49,3% 79 53,7% 63 57,3% 42 50,0% 56 38,4%
5 or more 173 35,5% 46 31,3% 34 30,9% 33 39,3% 60 41,1%
Don’t know 1 ,2% 1 0,7% - - - - - -
Never had children 16 3,3% 5 3,4% 5 4,5% 3 3,6% 3 2,1%
Male 190 100,0% 69 100,0% 44 100,0% 37 100,0% 40 100,0%
0 1 0,5% - - - - - - 1 2,5%
1 18 9,5% 7 10,1% 1 2,3% 2 5,4% 8 20,0%
2 – 4 100 52,6% 38 55,1% 29 65,9% 17 45,9% 16 40,0%
5 or more 65 34,2% 22 31,9% 14 31,8% 15 40,5% 14 35,0%
Don’t know - - - - - - - - - -
Never had children 6 3,2% 2 2,9% - - 3 8,1% 1 2,5%
Female 297 100,0% 78 100,0% 66 100,0% 47 100,0% 106 100,0%
0 1 0,3% - - - - - - 1 0,9%
1 37 12,5% 9 11,5% 7 10,6% 4 8,5% 17 16,0%
2 – 4 140 47,1% 41 52,6% 34 51,5% 25 53,2% 40 37,7%
5 or more 108 36,4% 24 30,8% 20 30,3% 18 38,3% 46 43,4%
Don’t know 1 0,3% 1 1,3% - - - - - -
Never had children 10 3,4% 3 3,8% 5 7,6% - - 2 1,9%
Source: DGIS/STP. Survey on Health, Welfare, and Ageing (SABE), Paraguay 2017.
CHAPTER 3. Figure 3.5. Distribution of older population according to the number of live children. (%)
Source: DGIS/STP. Survey on Health, Welfare, and Ageing (SABE), Paraguay 2017.
ParentsOlder adults were consulted, if either or both of their parents are still alive; 1 in 10 older adults mentioned that at least one of their
parents is still alive. By age groups, it is observed that this percentage decreases as the age advances, it becomes from 24.5% for the
group of 60-64 years to 1.4% for the group of 75 years and over. This same behavior is noted for both men and women.

SABE SURVEY Main Results JUNE 2018HEALTH, WELL-BEING AND AGING IN ASUNCION, PARAGUAY
128 129
CHAPTER 3. Table 3.6. Distribution of older population who has at least one parent alive, by sex and age group (%)
At least one live parent Total
Age group
60-64 65-69 70-74 ≥75
Total 487 100,0% 147 100,0% 110 100,0% 84 100,0% 146 100,0%
Yes 64 13,1% 36 24,5% 17 15,5% 9 10,7% 2 1,4%
No 406 83,4% 105 71,4% 90 81,8% 74 88,1% 137 93,8%
Don’t know 15 3,1% 6 4,1% 3 2,7% 1 1,2% 5 3,4%
No response 2 0,4% - - - - - - 2 1,4%
Male 190 100,0% 69 100,0% 44 100,0% 37 100,0% 40 100,0%
Yes 23 12,1% 15 21,7% 4 9,1% 3 8,1% 1 2,5%
No 159 83,7% 50 72,5% 38 86,4% 33 89,2% 38 95,0%
Don’t know 7 3,7% 4 5,8% 2 4,5% 1 2,7% - -
No response 1 ,5% 0 0,0% 0 0,0% 0 0,0% 1 2,5%
Female 297 100,0% 78 100,0% 66 100,0% 47 100,0% 106 100,0%
Yes 41 13,8% 21 26,9% 13 19,7% 6 12,8% 1 0,9%
No 247 83,2% 55 70,5% 52 78,8% 41 87,2% 99 93,4%
Don’t know 8 2,7% 2 2,6% 1 1,5% - - 5 4,7%
No response 1 0,3% - - - - - - 1 0,9%
Source: DGIS/STP. Survey on Health, Welfare, and Ageing (SABE), Paraguay 2017.
Figure 3.6. Distribution of older population who has at least one parent alive
Source: DGIS/STP. Survey on Health, Welfare, and Ageing (SABE), Paraguay 2017.
CHAPTER 3. EducationThe educational level of the older adult population is also analyzed, measured by the number of years of approved schooling. Table
3.7 shows that 42.9% of older adults have 4 - 6 years of schooling, followed by 23.8% who have 1 - 3 years. On the other hand, the
proportion of older adults without formal instruction corresponds to only 4.5%.
When analyzing by sex, no significant differences were observed between women and men who have 4 - 6 years of schooling (43.2%
and 42.8%, respectively). However, there are differences in the percentage of men who are 13 years old or more in comparison with
women, that is, 10% for men vs 5.7% for women.
By age groups, the percentage of older adults with 4 - 6 years of schooling predominates, both for men and for women.
Table 3.7. Distribution of older population according to level of schooling, by sex and age group (%)
Level of schooling TotalAge group
60-64 65-69 70-74 ≥75
Total 487 100,0% 147 100,0% 110 100,0% 84 100,0% 146 100,0%
No schooling 22 4,5% 4 2,7% 1 ,9% 2 2,4% 15 10,3%
1 - 3 years 116 23,8% 24 16,3% 21 19,1% 20 23,8% 51 34,9%
4 - 6 years 209 42,9% 74 50,3% 46 41,8% 34 40,5% 55 37,7%
7 - 9 years 48 9,9% 14 9,5% 14 12,7% 10 11,9% 10 6,8%
10 - 12 years 54 11,1% 20 13,6% 15 13,6% 12 14,3% 7 4,8%
13 years or more 36 7,4% 11 7,5% 13 11,8% 5 6,0% 7 4,8%
Not applicable 2 0,4% - - - - 1 1,2% 1 0,7%
Male 190 100,0% 69 100,0% 44 100,0% 37 100,0% 40 100,0%
No schooling 6 3,2% 0 0,0% 1 2,3% 1 2,7% 4 10,0%
1 - 3 years 31 16,3% 5 7,2% 7 15,9% 6 16,2% 13 32,5%
4 - 6 years 82 43,2% 37 53,6% 19 43,2% 12 32,4% 14 35,0%
7 - 9 years 25 13,2% 9 13,0% 6 13,6% 7 18,9% 3 7,5%
10 - 12 years 26 13,7% 11 15,9% 4 9,1% 8 21,6% 3 7,5%
13 years or more 19 10,0% 7 10,1% 7 15,9% 3 8,1% 2 5,0%
Not applicable 1 0,5% - - - - - - 1 2,5%
Female 297 100,0% 78 100,0% 66 100,0% 47 100,0% 106 100,0%
No schooling 16 5,4% 4 5,1% 0 0,0% 1 2,1% 11 10,4%
1 - 3 years 85 28,6% 19 24,4% 14 21,2% 14 29,8% 38 35,8%
4 - 6 years 127 42,8% 37 47,4% 27 40,9% 22 46,8% 41 38,7%
7 - 9 years 23 7,7% 5 6,4% 8 12,1% 3 6,4% 7 6,6%
10 - 12 years 28 9,4% 9 11,5% 11 16,7% 4 8,5% 4 3,8%
13 years or more 17 5,7% 4 5,1% 6 9,1% 2 4,3% 5 4,7%
Not applicable 1 0,3% - - - - 1 2,1% - -
Source: DGIS/STP. Survey on Health, Welfare, and Ageing (SABE), Paraguay 2017.

SABE SURVEY Main Results JUNE 2018HEALTH, WELL-BEING AND AGING IN ASUNCION, PARAGUAY
130 131
CHAPTER 3. Figure 3.7. Distribution of older population according to level of schooling, by sex (%)
Source: DGIS/STP. Survey on Health, Welfare, and Ageing (SABE), Paraguay 2017.
Commitment to religion Table 3.8 shows that the vast majority of older adults profess the Catholic religion (89.5%), 9.2% belong to the Evangelical religion or
Protestants, on the other hand, people without religion represent 0, 8%
By sex, it is observed that 12.5% of the women belong to a religion different from the Catholic one, a greater proportion compared to
the men, where only 4.2% belongs to the evangelical or protestant religion.
Table 3.8. Distribution of older population according to religion, by sex and age group (%)
Religión TotalAge group
60-64 65-69 70-74 ≥75
Total 487 100,0% 147 100,0% 110 100,0% 84 100,0% 146 100,0%
Catholic 436 89,5% 131 89,1% 96 87,3% 78 92,9% 131 89,7%
Protestant or evangelical
45 9,2% 13 8,8% 14 12,7% 5 6,0% 13 8,9%
Other1/ 2 0,4% - - - - - - 2 1,4%
None 4 0,8% 3 2,0% - - 1 1,2% - -
Male 190 100,0% 69 100,0% 44 100,0% 37 100,0% 40 100,0%
Catholic 178 93,7% 62 89,9% 43 97,7% 35 94,6% 38 95,0%
Protestant or evangelical
8 4,2% 5 7,2% 1 2,3% 1 2,7% 1 2,5%
Other1/ 1 0,5% - - - - - - 1 2,5%
None 3 1,6% 2 2,9% - - 1 2,7% - -
Female 297 100,0% 78 100,0% 66 100,0% 47 100,0% 106 100,0%
Catholic 258 86,9% 69 88,5% 53 80,3% 43 91,5% 93 87,7%
Protestant or evangelical
37 12,5% 8 10,3% 13 19,7% 4 8,5% 12 11,3%
Other1/ 1 0,3% - - - - - - 1 0,9%
None 1 0,3% 1 1,3% - - - - - -
Source: DGIS/STP. Survey on Health, Welfare, and Ageing (SABE), Paraguay 2017.1/Including the Church of Jesus Christ of Latter-day Saints (Mormons), etc.
CHAPTER 3. Figure 3.8. Distribution of older population according to religion. (%).
Source: DGIS/STP. Survey on Health, Welfare, and Ageing (SABE), Paraguay 2017.
In Table 3.9 it is observed that for 94% of older adults religion has a fundamental importance in their lives however, there is a relevant
difference between men and women, in which the latter have a greater interest in religion ( 88.2% vs. 97.6% respectively). This same
behavior is observed in each of the age groups.

SABE SURVEY Main Results JUNE 2018HEALTH, WELL-BEING AND AGING IN ASUNCION, PARAGUAY
132 133
CHAPTER 3. Table 3.9. Distribution of older population according to importance of religion in their life by sex and age group (%)
Level of importance Total
Age group
60-64 65-69 70-74 ≥75
Total 483 100,0% 144 100,0% 110 100,0% 83 100,0% 146 100,0%
Important 454 94,0% 139 96,5% 98 89,1% 78 94,0% 139 95,2%
Moderate 22 4,6% 5 3,5% 9 8,2% 3 3,6% 5 3,4%
Not important 4 0,8% - - 2 1,8% 2 2,4% - -
Don’t know 3 0,6% - - 1 ,9% 0 0,0% 2 1,4%
Male 187 100,0% 67 100,0% 44 100,0% 36 100,0% 40 100,0%
Important 165 88,2% 62 92,5% 35 79,5% 31 86,1% 37 92,5%
Moderate 19 10,2% 5 7,5% 8 18,2% 3 8,3% 3 7,5%
Not important 2 1,1% - - - - 2 5,6% 0 0,0%
Don’t know 1 0,5% - - 1 2,3% 0 0,0% 0 0,0%
Female 296 100,0% 77 100,0% 66 100,0% 47 100,0% 106 100,0%
Important 289 97,6% 77 100,0% 63 95,5% 47 100,0% 102 96,2%
Moderate 3 1,0% - - 1 1,5% - - 2 1,9%
Not important 2 0,7% - - 2 3,0% - - - -
Don’t know 2 0,7% - - - - - - 2 1,9%
Source: DGIS/STP. Survey on Health, Welfare, and Ageing (SABE), Paraguay 2017.
Figure 3.9. Distribution of older population according to importance of religion in their life. (%)
Source: DGIS/STP. Survey on Health, Welfare, and Ageing (SABE), Paraguay 2017.
CHAPTER 3. Labor participationAlthough the third age is ideally thought of as the time for retirement and rest, table 3.10 shows that very few older adults have the
benefit of a retirement or pension, only 10% have this income, while 38,1% continues working.
By sex, it can be noted that for men 13.4% have a retirement or pension, the percentage of women who have a pension is substan-
tially lower with 7.6%.
These limitations of social security are what determine that a large part of the aging population continues to work, particularly men
aged 60 - 64, more than 70% continue working.
Table 3.10. Distribution of older population according to labor participation, by sex and age group (%)
Labor participation TotalAge group
60-64 65-69 70-74 ≥75
Total 449 100,0% 141 100,0% 103 100,0% 75 100,0% 130 100,0%
Currently working 171 38,1% 89 63,1% 37 35,9% 29 38,7% 16 12,3%
Have a job, but did not work 4 0,9% 1 0,7% 2 1,9% 1 1,3% - -
Dedicated to house chores 80 17,8% 25 17,7% 23 22,3% 14 18,7% 18 13,8%
Retired or pensioner 45 10,0% 5 3,5% 8 7,8% 7 9,3% 25 19,2%
Disabled temporarily or permanently
42 9,4% 6 4,3% 6 5,8% 5 6,7% 25 19,2%
Currently do not work 106 23,6% 15 10,6% 26 25,2% 19 25,3% 46 35,4%
No response 1 0,2% - - 1 1,0% - - - -
Male 186 100,0% 68 100,0% 42 100,0% 36 100,0% 40 100,0%
Currently working 97 52,2% 53 77,9% 23 54,8% 16 44,4% 5 12,5%
Have a job, but did not work 3 1,6% 1 1,5% 1 2,4% 1 2,8% - -
Dedicated to house chores 8 4,3% 2 2,9% 3 7,1% 2 5,6% 1 2,5%
Retired or pensioner 25 13,4% 5 7,4% 4 9,5% 5 13,9% 11 27,5%
Disabled temporarily or permanently
15 8,1% 3 4,4% 4 9,5% 3 8,3% 5 12,5%
Currently do not work 38 20,4% 4 5,9% 7 16,7% 9 25,0% 18 45,0%
No response - - - - - - - - - -
Female 263 100,0% 73 100,0% 61 100,0% 39 100,0% 90 100,0%
Currently working 74 28,1% 36 49,3% 14 23,0% 13 33,3% 11 12,2%
Have a job, but did not work 1 0,4% - - 1 1,6% - - - -
Dedicated to house chores 72 27,4% 23 31,5% 20 32,8% 12 30,8% 17 18,9%
Retired or pensioner 20 7,6% - - 4 6,6% 2 5,1% 14 15,6%
Disabled temporarily or permanently
27 10,3% 3 4,1% 2 3,3% 2 5,1% 20 22,2%
Currently do not work 68 25,9% 11 15,1% 19 31,1% 10 25,6% 28 31,1%
No response 1 0,4% - - 1 1,6% - - - -
Source: DGIS/STP. Survey on Health, Welfare, and Ageing (SABE), Paraguay 2017.
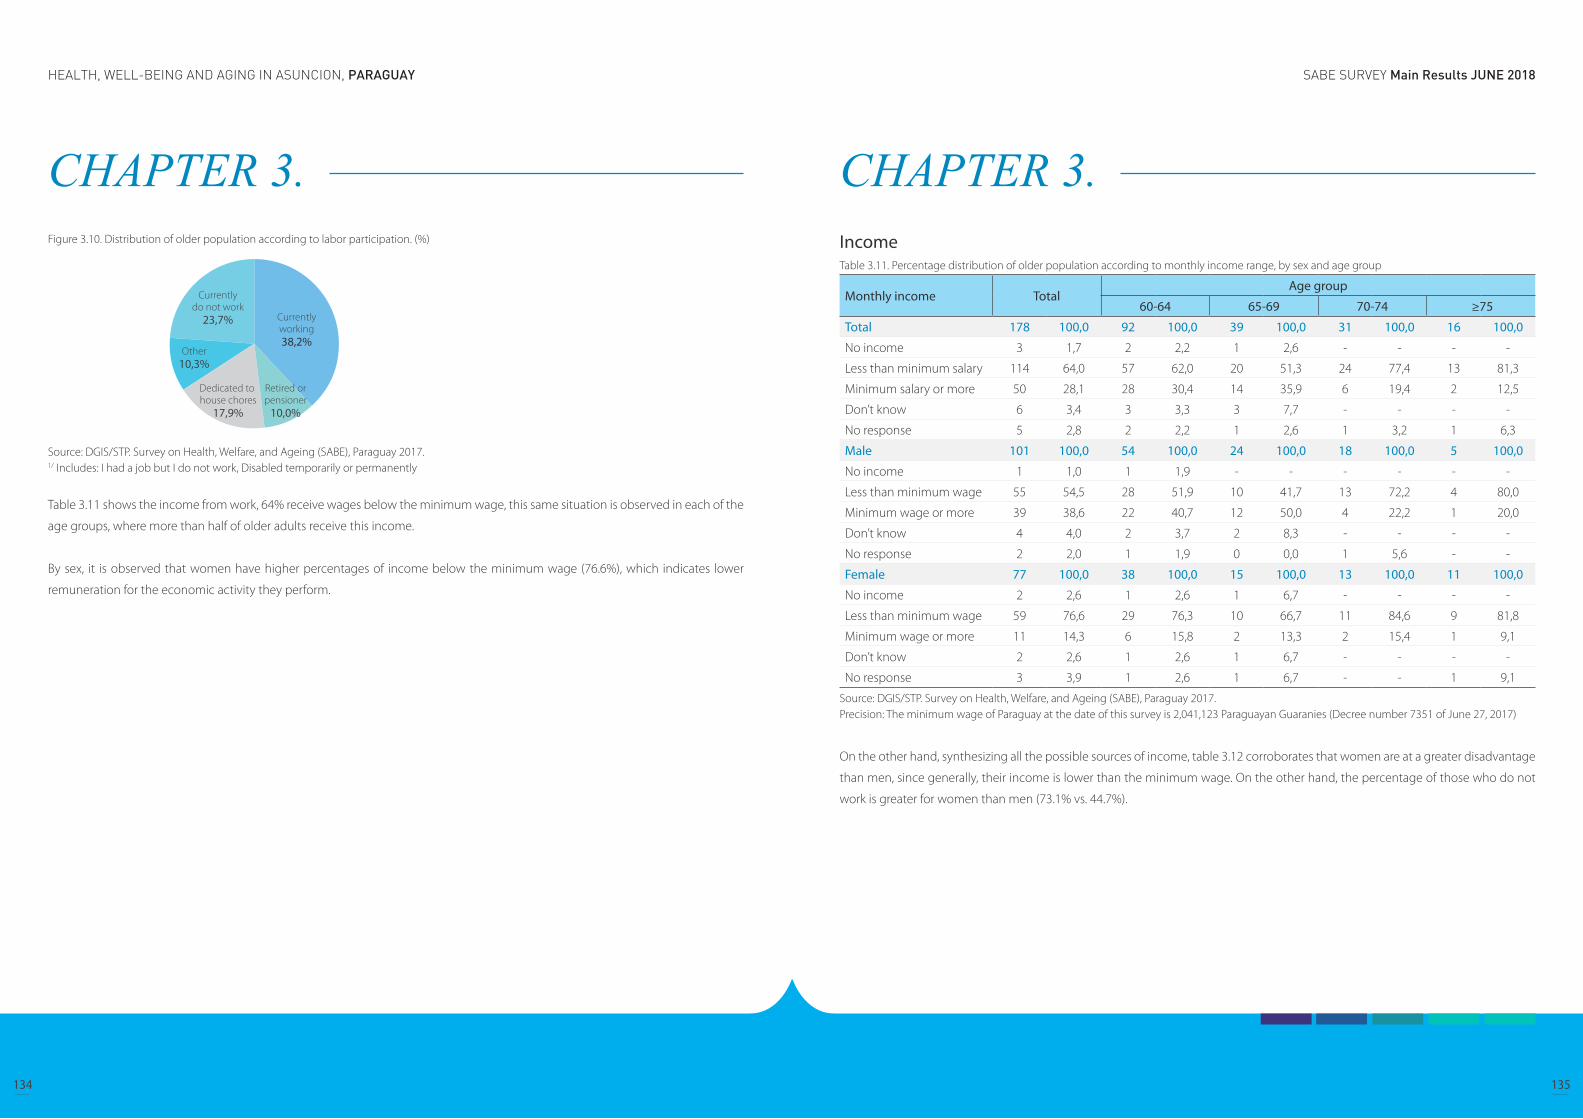
SABE SURVEY Main Results JUNE 2018HEALTH, WELL-BEING AND AGING IN ASUNCION, PARAGUAY
134 135
CHAPTER 3. Figure 3.10. Distribution of older population according to labor participation. (%)
Source: DGIS/STP. Survey on Health, Welfare, and Ageing (SABE), Paraguay 2017.1/ Includes: I had a job but I do not work, Disabled temporarily or permanently
Table 3.11 shows the income from work, 64% receive wages below the minimum wage, this same situation is observed in each of the
age groups, where more than half of older adults receive this income.
By sex, it is observed that women have higher percentages of income below the minimum wage (76.6%), which indicates lower
remuneration for the economic activity they perform.
CHAPTER 3. IncomeTable 3.11. Percentage distribution of older population according to monthly income range, by sex and age group
Monthly income TotalAge group
60-64 65-69 70-74 ≥75
Total 178 100,0 92 100,0 39 100,0 31 100,0 16 100,0
No income 3 1,7 2 2,2 1 2,6 - - - -
Less than minimum salary 114 64,0 57 62,0 20 51,3 24 77,4 13 81,3
Minimum salary or more 50 28,1 28 30,4 14 35,9 6 19,4 2 12,5
Don’t know 6 3,4 3 3,3 3 7,7 - - - -
No response 5 2,8 2 2,2 1 2,6 1 3,2 1 6,3
Male 101 100,0 54 100,0 24 100,0 18 100,0 5 100,0
No income 1 1,0 1 1,9 - - - - - -
Less than minimum wage 55 54,5 28 51,9 10 41,7 13 72,2 4 80,0
Minimum wage or more 39 38,6 22 40,7 12 50,0 4 22,2 1 20,0
Don’t know 4 4,0 2 3,7 2 8,3 - - - -
No response 2 2,0 1 1,9 0 0,0 1 5,6 - -
Female 77 100,0 38 100,0 15 100,0 13 100,0 11 100,0
No income 2 2,6 1 2,6 1 6,7 - - - -
Less than minimum wage 59 76,6 29 76,3 10 66,7 11 84,6 9 81,8
Minimum wage or more 11 14,3 6 15,8 2 13,3 2 15,4 1 9,1
Don’t know 2 2,6 1 2,6 1 6,7 - - - -
No response 3 3,9 1 2,6 1 6,7 - - 1 9,1
Source: DGIS/STP. Survey on Health, Welfare, and Ageing (SABE), Paraguay 2017.Precision: The minimum wage of Paraguay at the date of this survey is 2,041,123 Paraguayan Guaranies (Decree number 7351 of June 27, 2017)
On the other hand, synthesizing all the possible sources of income, table 3.12 corroborates that women are at a greater disadvantage
than men, since generally, their income is lower than the minimum wage. On the other hand, the percentage of those who do not
work is greater for women than men (73.1% vs. 44.7%).
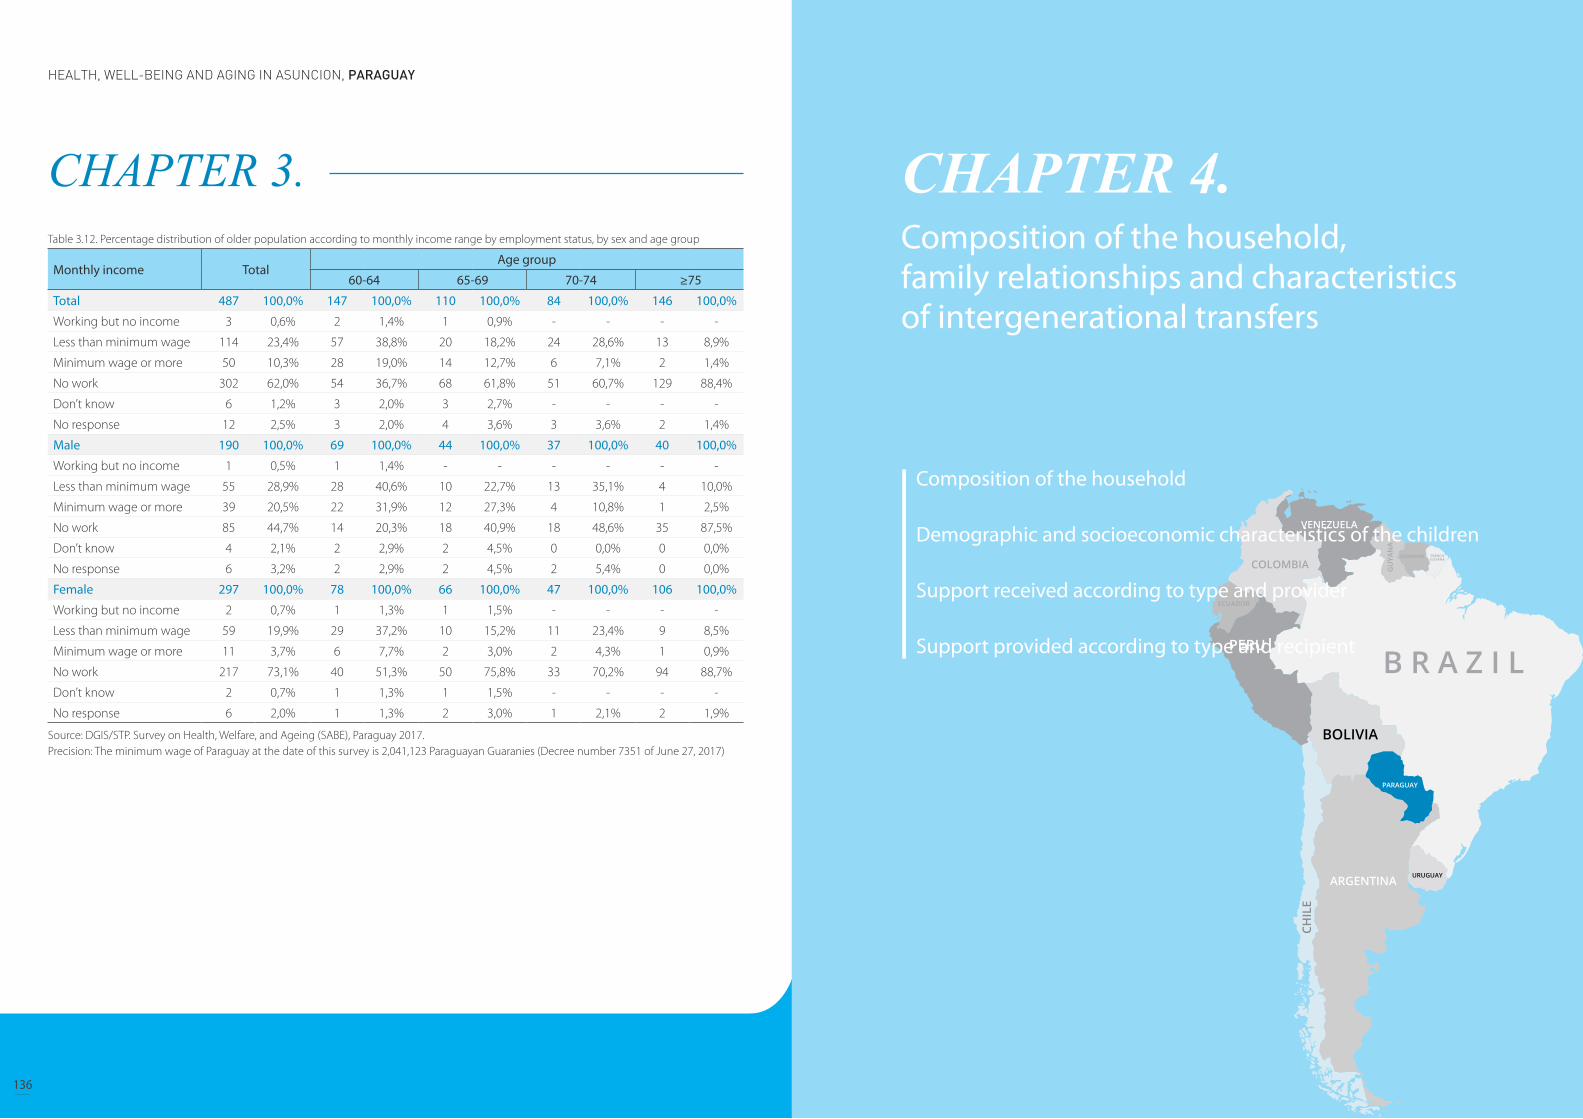
SABE SURVEY Main Results JUNE 2018HEALTH, WELL-BEING AND AGING IN ASUNCION, PARAGUAY
136 137
CHAPTER 3. Table 3.12. Percentage distribution of older population according to monthly income range by employment status, by sex and age group
Monthly income TotalAge group
60-64 65-69 70-74 ≥75
Total 487 100,0% 147 100,0% 110 100,0% 84 100,0% 146 100,0%
Working but no income 3 0,6% 2 1,4% 1 0,9% - - - -
Less than minimum wage 114 23,4% 57 38,8% 20 18,2% 24 28,6% 13 8,9%
Minimum wage or more 50 10,3% 28 19,0% 14 12,7% 6 7,1% 2 1,4%
No work 302 62,0% 54 36,7% 68 61,8% 51 60,7% 129 88,4%
Don’t know 6 1,2% 3 2,0% 3 2,7% - - - -
No response 12 2,5% 3 2,0% 4 3,6% 3 3,6% 2 1,4%
Male 190 100,0% 69 100,0% 44 100,0% 37 100,0% 40 100,0%
Working but no income 1 0,5% 1 1,4% - - - - - -
Less than minimum wage 55 28,9% 28 40,6% 10 22,7% 13 35,1% 4 10,0%
Minimum wage or more 39 20,5% 22 31,9% 12 27,3% 4 10,8% 1 2,5%
No work 85 44,7% 14 20,3% 18 40,9% 18 48,6% 35 87,5%
Don’t know 4 2,1% 2 2,9% 2 4,5% 0 0,0% 0 0,0%
No response 6 3,2% 2 2,9% 2 4,5% 2 5,4% 0 0,0%
Female 297 100,0% 78 100,0% 66 100,0% 47 100,0% 106 100,0%
Working but no income 2 0,7% 1 1,3% 1 1,5% - - - -
Less than minimum wage 59 19,9% 29 37,2% 10 15,2% 11 23,4% 9 8,5%
Minimum wage or more 11 3,7% 6 7,7% 2 3,0% 2 4,3% 1 0,9%
No work 217 73,1% 40 51,3% 50 75,8% 33 70,2% 94 88,7%
Don’t know 2 0,7% 1 1,3% 1 1,5% - - - -
No response 6 2,0% 1 1,3% 2 3,0% 1 2,1% 2 1,9%
Source: DGIS/STP. Survey on Health, Welfare, and Ageing (SABE), Paraguay 2017.Precision: The minimum wage of Paraguay at the date of this survey is 2,041,123 Paraguayan Guaranies (Decree number 7351 of June 27, 2017)
CHAPTER 4. Composition of the household, family relationships and characteristics of intergenerational transfers
Composition of the household
Demographic and socioeconomic characteristics of the children
Support received according to type and provider
Support provided according to type and recipient
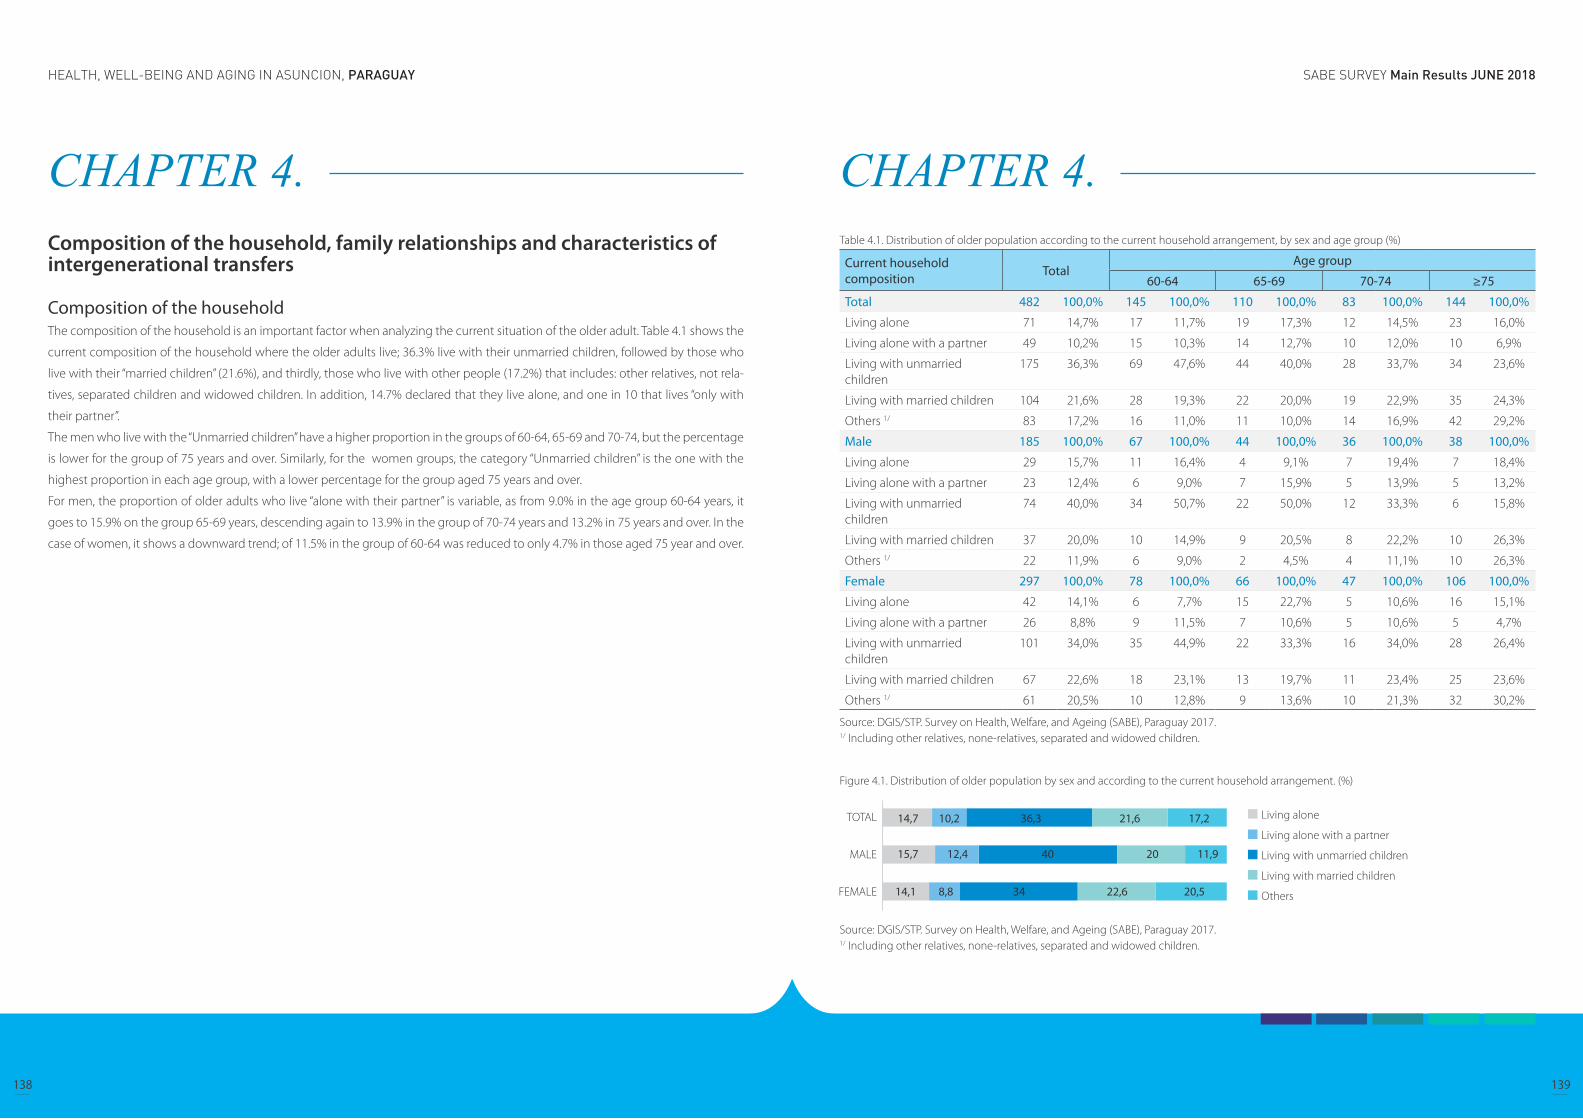
SABE SURVEY Main Results JUNE 2018HEALTH, WELL-BEING AND AGING IN ASUNCION, PARAGUAY
138 139
CHAPTER 4. Composition of the household, family relationships and characteristics of intergenerational transfers
Composition of the household The composition of the household is an important factor when analyzing the current situation of the older adult. Table 4.1 shows the
current composition of the household where the older adults live; 36.3% live with their unmarried children, followed by those who
live with their “married children” (21.6%), and thirdly, those who live with other people (17.2%) that includes: other relatives, not rela-
tives, separated children and widowed children. In addition, 14.7% declared that they live alone, and one in 10 that lives “only with
their partner”.
The men who live with the “Unmarried children” have a higher proportion in the groups of 60-64, 65-69 and 70-74, but the percentage
is lower for the group of 75 years and over. Similarly, for the women groups, the category “Unmarried children” is the one with the
highest proportion in each age group, with a lower percentage for the group aged 75 years and over.
For men, the proportion of older adults who live “alone with their partner” is variable, as from 9.0% in the age group 60-64 years, it
goes to 15.9% on the group 65-69 years, descending again to 13.9% in the group of 70-74 years and 13.2% in 75 years and over. In the
case of women, it shows a downward trend; of 11.5% in the group of 60-64 was reduced to only 4.7% in those aged 75 year and over.
CHAPTER 4. Table 4.1. Distribution of older population according to the current household arrangement, by sex and age group (%)
Current household composition Total
Age group
60-64 65-69 70-74 ≥75
Total 482 100,0% 145 100,0% 110 100,0% 83 100,0% 144 100,0%
Living alone 71 14,7% 17 11,7% 19 17,3% 12 14,5% 23 16,0%
Living alone with a partner 49 10,2% 15 10,3% 14 12,7% 10 12,0% 10 6,9%
Living with unmarried children
175 36,3% 69 47,6% 44 40,0% 28 33,7% 34 23,6%
Living with married children 104 21,6% 28 19,3% 22 20,0% 19 22,9% 35 24,3%
Others 1/ 83 17,2% 16 11,0% 11 10,0% 14 16,9% 42 29,2%
Male 185 100,0% 67 100,0% 44 100,0% 36 100,0% 38 100,0%
Living alone 29 15,7% 11 16,4% 4 9,1% 7 19,4% 7 18,4%
Living alone with a partner 23 12,4% 6 9,0% 7 15,9% 5 13,9% 5 13,2%
Living with unmarried children
74 40,0% 34 50,7% 22 50,0% 12 33,3% 6 15,8%
Living with married children 37 20,0% 10 14,9% 9 20,5% 8 22,2% 10 26,3%
Others 1/ 22 11,9% 6 9,0% 2 4,5% 4 11,1% 10 26,3%
Female 297 100,0% 78 100,0% 66 100,0% 47 100,0% 106 100,0%
Living alone 42 14,1% 6 7,7% 15 22,7% 5 10,6% 16 15,1%
Living alone with a partner 26 8,8% 9 11,5% 7 10,6% 5 10,6% 5 4,7%
Living with unmarried children
101 34,0% 35 44,9% 22 33,3% 16 34,0% 28 26,4%
Living with married children 67 22,6% 18 23,1% 13 19,7% 11 23,4% 25 23,6%
Others 1/ 61 20,5% 10 12,8% 9 13,6% 10 21,3% 32 30,2%
Source: DGIS/STP. Survey on Health, Welfare, and Ageing (SABE), Paraguay 2017.1/ Including other relatives, none-relatives, separated and widowed children.
Figure 4.1. Distribution of older population by sex and according to the current household arrangement. (%)
Source: DGIS/STP. Survey on Health, Welfare, and Ageing (SABE), Paraguay 2017.1/ Including other relatives, none-relatives, separated and widowed children.

SABE SURVEY Main Results JUNE 2018HEALTH, WELL-BEING AND AGING IN ASUNCION, PARAGUAY
140 141
CHAPTER 4. Family arrangements by sex and marital statusThe following information relates the marital status of the older adults according to the family composition and provides an overview
of the coexistence situation in which the older adults live.
36.3% of older adults whose marital status is “cohaniting” live with the “unmarried children”, a higher percentage of men (55.4%) in
relation to women (42.2%). For those who live “alone with their partner”, the percentage is higher for women (28.9%), while for men it
is 20.5%. In a lower percentage are older adults “living with married children” with 17.9% for men and 14.4% for women.
Regarding older adults whose marital status is “living alone”, men have a higher proportion of living alone (39.7), compared to women
(20.3%).
Table 4.2. Distribution of older population according to the current household arrangement, by marital status and sex (%).
Current household composition
Total
Marital status
Married Unmarried
Total Male Female Total Male Female
Total 482 100,0% 202 100,0% 112 100,0% 90 100,0% 280 100,0% 73 100,0% 207 100,0%
Living alone 71 14,7% - - - - - - 71 25,4% 29 39,7% 42 20,3%
Living alone with a partner
49 10,2% 49 24,3% 23 20,5% 26 28,9% - - - - - -
Living with unmarried children
175 36,3% 100 49,5% 62 55,4% 38 42,2% 75 26,8% 12 16,4% 63 30,4%
Living with married children
104 21,6% 33 16,3% 20 17,9% 13 14,4% 71 25,4% 17 23,3% 54 26,1%
Others 1/ 83 17,2% 20 9,9% 7 6,3% 13 14,4% 63 22,5% 15 20,5% 48 23,2%
Source: DGIS/STP. Survey on Health, Welfare, and Ageing (SABE), Paraguay 2017.1/ Including other relatives, none-relatives, separated and widowed children.
Figure 4.2. Distribution of older population according to the current household arrangement, by marital status and sex (%).
Source: DGIS/STP. Survey on Health, Welfare, and Ageing (SABE), Paraguay 2017.1/ Including other relatives, none-relatives, separated and widowed children.
CHAPTER 4. Family arrangements according to sex and educationTable 4.3 shows the educational level (measured in approved years of schooling) of older adults and the distribution in each of the
family composition categories. 50% of older adults aged 13 or more years of schoooling live with their “unmarried children”, while old-
er adults without education live with other people (other relatives, not relatives, separated children and widowed children) (31 , 8%).
30.0% of older men who have 1 - 3 years of schooling live wih their “married children”, as well as older adults who have 10 - 12 years of
schooling (30.8%); however, for women who live with their “married children”, all educational levels show lower proportions.
Table 4.3. Distribution of older population according to the current household arrangement, by level of education and sex.
Current household composition
TotalYears of education
No education 1-3 4-6 7-9 10-12 13 or more
Total 480 100,0% 22 100,0% 115 100,0% 205 100,0% 48 100,0% 54 100,0% 36 100,0%
Living alone 71 14,8% 4 18,2% 16 13,9% 32 15,6% 8 16,7% 5 9,3% 6 16,7%
Living alone with a partner
49 10,2% 1 4,5% 12 10,4% 15 7,3% 8 16,7% 9 16,7% 4 11,1%
Living with unmarried children
175 36,5% 6 27,3% 39 33,9% 77 37,6% 17 35,4% 18 33,3% 18 50,0%
Living with married children
104 21,7% 4 18,2% 27 23,5% 46 22,4% 9 18,8% 14 25,9% 4 11,1%
Others 1/ 81 16,9% 7 31,8% 21 18,3% 35 17,1% 6 12,5% 8 14,8% 4 11,1%
Male 184 100,0% 6 100,0% 30 100,0% 78 100,0% 25 100,0% 26 100,0% 19 100,0%
Living alone 29 15,8% 1 16,7% 3 10,0% 15 19,2% 4 16,0% 4 15,4% 2 10,5%
Living alone with a partner
23 12,5% 1 16,7% 6 20,0% 7 9,0% 4 16,0% 3 11,5% 2 10,5%
Living with unmarried children
74 40,2% 2 33,3% 8 26,7% 36 46,2% 9 36,0% 6 23,1% 13 68,4%
Living with married children
37 20,1% 1 16,7% 9 30,0% 12 15,4% 6 24,0% 8 30,8% 1 5,3%
Others 1/ 21 11,4% 1 16,7% 4 13,3% 8 10,3% 2 8,0% 5 19,2% 1 5,3%
Female 296 100,0% 16 100,0% 85 100,0% 127 100,0% 23 100,0% 28 100,0% 17 100,0%
Living alone 42 14,2% 3 18,8% 13 15,3% 17 13,4% 4 17,4% 1 3,6% 4 23,5%
Living alone with a partner
26 8,8% 0 0,0% 6 7,1% 8 6,3% 4 17,4% 6 21,4% 2 11,8%
Living with unmarried children
101 34,1% 4 25,0% 31 36,5% 41 32,3% 8 34,8% 12 42,9% 5 29,4%
Living with married children
67 22,6% 3 18,8% 18 21,2% 34 26,8% 3 13,0% 6 21,4% 3 17,6%
Others 1/ 60 20,3% 6 37,5% 17 20,0% 27 21,3% 4 17,4% 3 10,7% 3 17,6%
Source: DGIS/STP. Survey on Health, Welfare, and Ageing (SABE), Paraguay 2017.1/ Including other relatives, none-relatives, separated and widowed children.
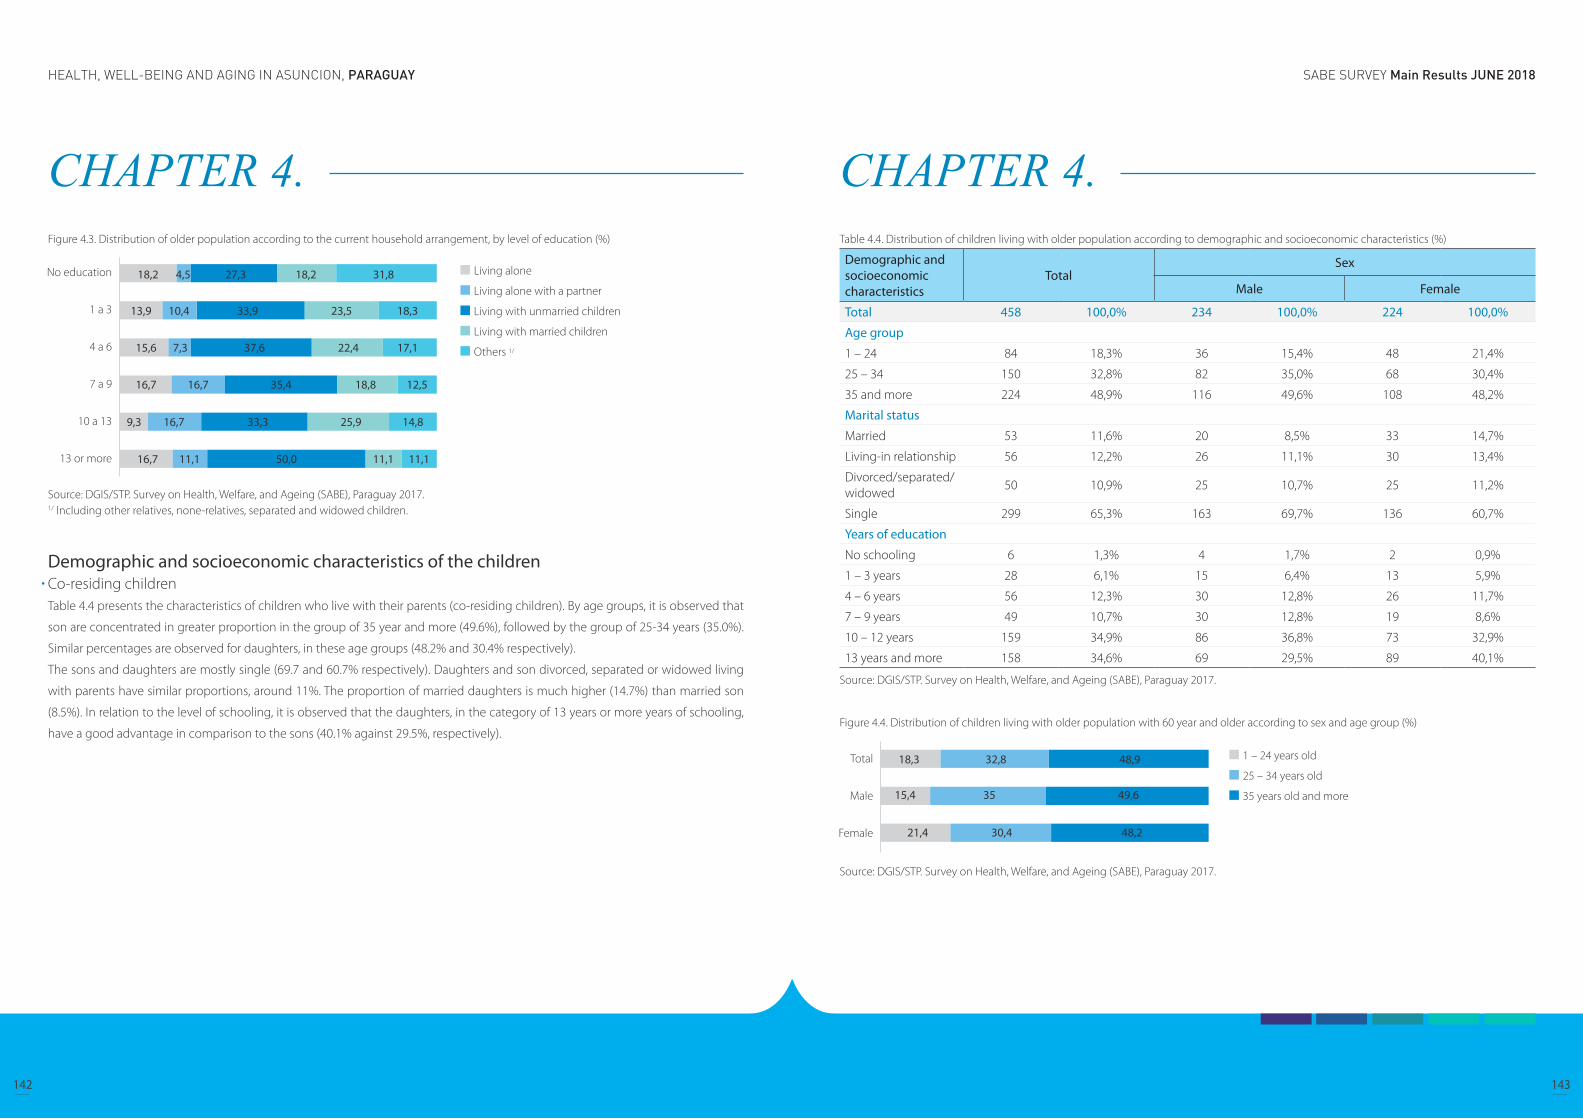
SABE SURVEY Main Results JUNE 2018HEALTH, WELL-BEING AND AGING IN ASUNCION, PARAGUAY
142 143
CHAPTER 4. Figure 4.3. Distribution of older population according to the current household arrangement, by level of education (%)
Source: DGIS/STP. Survey on Health, Welfare, and Ageing (SABE), Paraguay 2017.1/ Including other relatives, none-relatives, separated and widowed children.
Demographic and socioeconomic characteristics of the children Co-residing children Table 4.4 presents the characteristics of children who live with their parents (co-residing children). By age groups, it is observed that
son are concentrated in greater proportion in the group of 35 year and more (49.6%), followed by the group of 25-34 years (35.0%).
Similar percentages are observed for daughters, in these age groups (48.2% and 30.4% respectively).
The sons and daughters are mostly single (69.7 and 60.7% respectively). Daughters and son divorced, separated or widowed living
with parents have similar proportions, around 11%. The proportion of married daughters is much higher (14.7%) than married son
(8.5%). In relation to the level of schooling, it is observed that the daughters, in the category of 13 years or more years of schooling,
have a good advantage in comparison to the sons (40.1% against 29.5%, respectively).
CHAPTER 4. Table 4.4. Distribution of children living with older population according to demographic and socioeconomic characteristics (%)
Demographic and socioeconomic characteristics
TotalSex
Male Female
Total 458 100,0% 234 100,0% 224 100,0%
Age group
1 – 24 84 18,3% 36 15,4% 48 21,4%
25 – 34 150 32,8% 82 35,0% 68 30,4%
35 and more 224 48,9% 116 49,6% 108 48,2%
Marital status
Married 53 11,6% 20 8,5% 33 14,7%
Living-in relationship 56 12,2% 26 11,1% 30 13,4%
Divorced/separated/widowed
50 10,9% 25 10,7% 25 11,2%
Single 299 65,3% 163 69,7% 136 60,7%
Years of education
No schooling 6 1,3% 4 1,7% 2 0,9%
1 – 3 years 28 6,1% 15 6,4% 13 5,9%
4 – 6 years 56 12,3% 30 12,8% 26 11,7%
7 – 9 years 49 10,7% 30 12,8% 19 8,6%
10 – 12 years 159 34,9% 86 36,8% 73 32,9%
13 years and more 158 34,6% 69 29,5% 89 40,1%
Source: DGIS/STP. Survey on Health, Welfare, and Ageing (SABE), Paraguay 2017.
Figure 4.4. Distribution of children living with older population with 60 year and older according to sex and age group (%)
Source: DGIS/STP. Survey on Health, Welfare, and Ageing (SABE), Paraguay 2017.

SABE SURVEY Main Results JUNE 2018HEALTH, WELL-BEING AND AGING IN ASUNCION, PARAGUAY
144 145
CHAPTER 4. Support received according to type and providerTransfers refer to the aids or supports that older adults receive, such as alimony, family support, and assistance from non-family mem-
bers, among others.
Table 4.5 shows that 79.0% of the people that reside in the household provide some type of support to the older adult, similar propor-
tions are presented according to different age groups. When observing who provides the support, it mainly comes from the spouses
(90.8%), followed by the children (83.6%) and some other person who could be related or not related (69.1%).
When it is disaggregated by type of support, high percentages in services such as transportation, household chores, etc. are ob-
served. (55.6%); followed by help with meals and clothes (39.0%), and thirdly, monetary support (38.9%).
When observing the type of support according to age categories, the highest percentages correspond to services. The monetary
support occupies the second place of importance, except for the group of 75 years and older, where the help with materials like food,
clothes, etc. have the highest proportion.
CHAPTER 4. Table 4.5. Distribution of older population who receive support, by type of support and age group, according to the provider of support (%)
Type of support TotalCo-residents
Spouse Children Other1/
Total 1081 196 445 440
Cash 421 38,9% 91 46,4% 238 53,5% 92 20,9%
Service (transport, home chores and gardening, etc)
601 55,6% 148 75,5% 262 58,9% 191 43,4%
Materials (food, clothes, etc) 422 39,0% 104 53,1% 202 45,4% 116 26,4%
Other2/ 98 9,1% 17 8,7% 27 6,1% 54 12,3%
Support received 854 79,0% 178 90,8% 372 83,6% 304 69,1%
60 – 64 years old 337 79 168 90
Cash 128 38,0% 38 48,1% 73 43,5% 17 18,9%
Service (transport, home chores and gardening, etc)
183 54,3% 61 77,2% 84 50,0% 38 42,2%
Materials (food, clothes, etc) 110 32,6% 44 55,7% 49 29,2% 17 18,9%
Other2/ 17 5,0% 3 3,8% 7 4,2% 7 7,8%
Support received 265 78,6% 75 94,9% 134 79,8% 56 62,2%
65 – 69 years old 225 48 97 80
Cash 97 43,1% 23 47,9% 56 57,7% 18 22,5%
Service (transport, home chores and gardening, etc)
139 61,8% 39 81,3% 60 61,9% 40 50,0%
Materials (food, clothes, etc) 87 38,7% 29 60,4% 36 37,1% 22 27,5%
Other2/ 17 7,6% 5 10,4% 6 6,2% 6 7,5%
Support received 183 81,3% 43 89,6% 82 84,5% 58 72,5%
70 – 74 years old 187 41 74 72
Cash 82 43,9% 17 41,5% 49 66,2% 16 22,2%
Service (transport, home chores and gardening, etc)
88 47,1% 27 65,9% 36 48,6% 25 34,7%
Materials (food, clothes, etc) 68 36,4% 15 36,6% 38 51,4% 15 20,8%
Other2/ 14 7,5% 5 12,2% 4 5,4% 5 6,9%
Support received 142 75,9% 34 82,9% 62 83,8% 46 63,9%
75 years and older 332 28 106 198
Cash 114 34,3% 13 46,4% 60 56,6% 41 20,7%
Service (transport, home chores and gardening, etc)
191 57,5% 21 75,0% 82 77,4% 88 44,4%
Materials (food, clothes, etc) 157 47,3% 16 57,1% 79 74,5% 62 31,3%
Other2/ 50 15,1% 4 14,3% 10 9,4% 36 18,2%
Support received 264 79,5% 26 92,9% 94 88,7% 144 72,7%
Source: DGIS/STP. Survey on Health, Welfare, and Ageing (SABE), Paraguay 2017.1/ Including other relatives, non-relatives, etc.2/ Including medicines, accompanying, etc.Precision: The sum of the percentages does not coincide with 100% because it corresponds to a variable with multiple response.
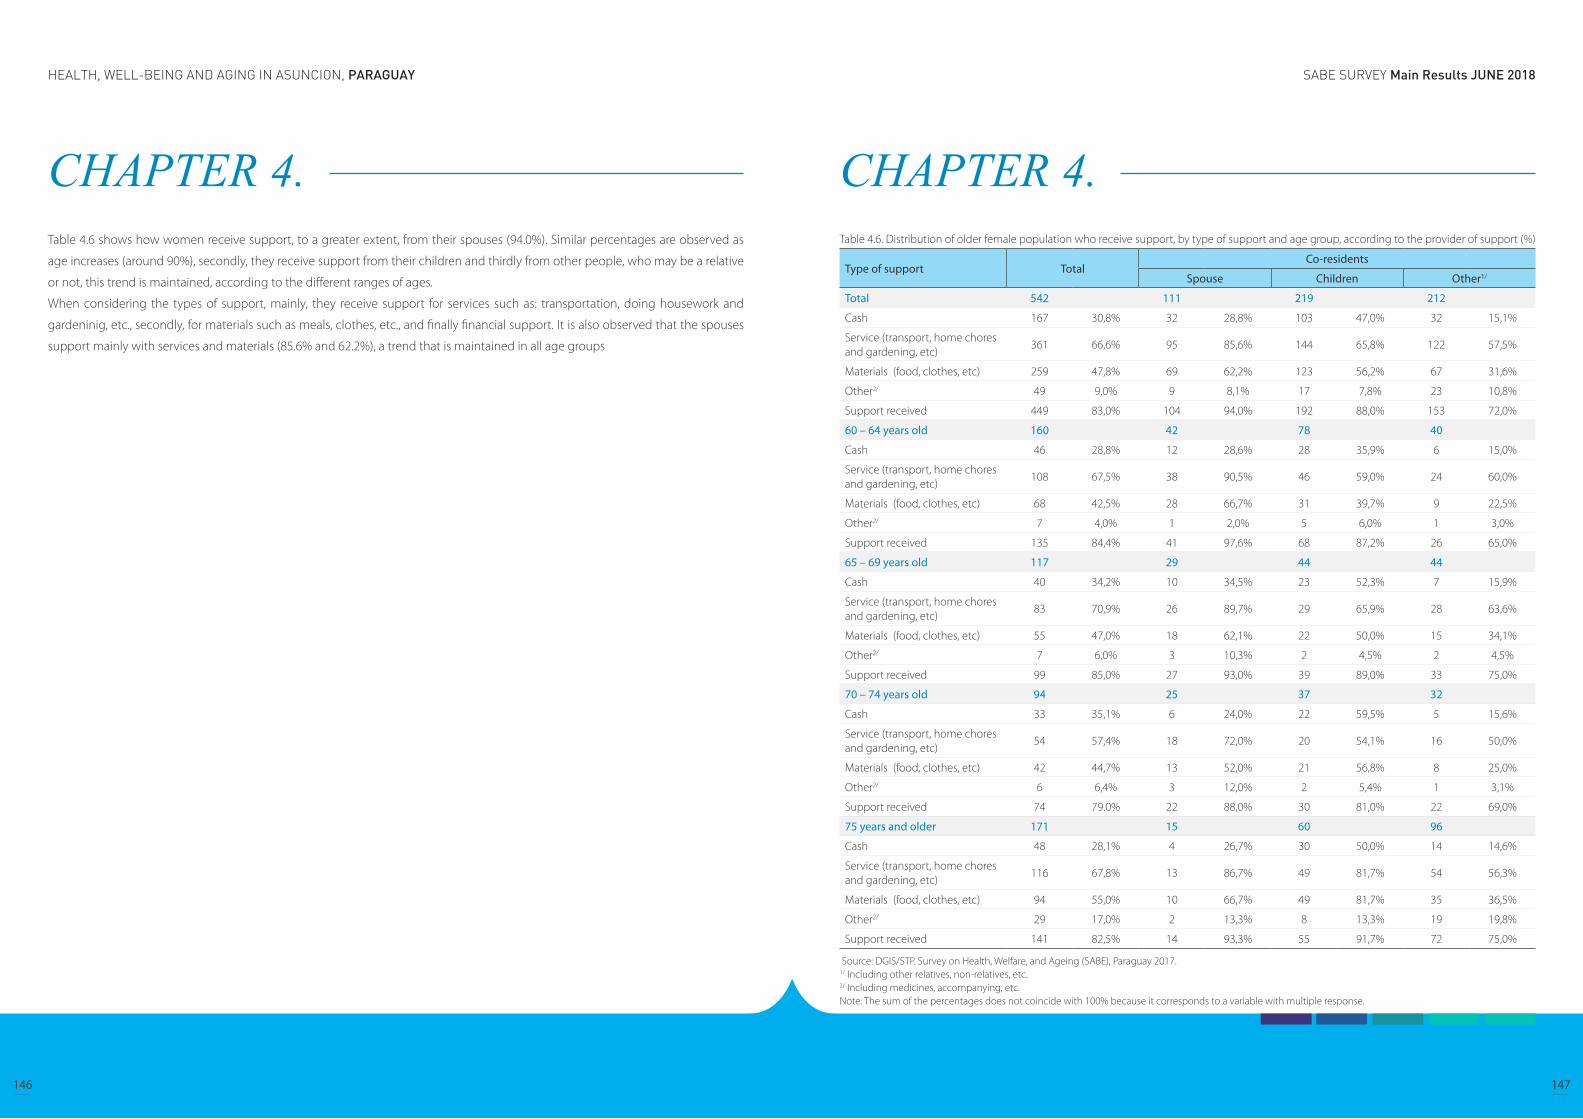
SABE SURVEY Main Results JUNE 2018HEALTH, WELL-BEING AND AGING IN ASUNCION, PARAGUAY
146 147
CHAPTER 4. Table 4.6 shows how women receive support, to a greater extent, from their spouses (94.0%). Similar percentages are observed as
age increases (around 90%), secondly, they receive support from their children and thirdly from other people, who may be a relative
or not, this trend is maintained, according to the different ranges of ages.
When considering the types of support, mainly, they receive support for services such as: transportation, doing housework and
gardeninig, etc., secondly, for materials such as meals, clothes, etc., and finally financial support. It is also observed that the spouses
support mainly with services and materials (85.6% and 62.2%), a trend that is maintained in all age groups
CHAPTER 4. Table 4.6. Distribution of older female population who receive support, by type of support and age group, according to the provider of support (%)
Type of support TotalCo-residents
Spouse Children Other1/
Total 542 111 219 212
Cash 167 30,8% 32 28,8% 103 47,0% 32 15,1%
Service (transport, home chores and gardening, etc)
361 66,6% 95 85,6% 144 65,8% 122 57,5%
Materials (food, clothes, etc) 259 47,8% 69 62,2% 123 56,2% 67 31,6%
Other2/ 49 9,0% 9 8,1% 17 7,8% 23 10,8%
Support received 449 83,0% 104 94,0% 192 88,0% 153 72,0%
60 – 64 years old 160 42 78 40
Cash 46 28,8% 12 28,6% 28 35,9% 6 15,0%
Service (transport, home chores and gardening, etc)
108 67,5% 38 90,5% 46 59,0% 24 60,0%
Materials (food, clothes, etc) 68 42,5% 28 66,7% 31 39,7% 9 22,5%
Other2/ 7 4,0% 1 2,0% 5 6,0% 1 3,0%
Support received 135 84,4% 41 97,6% 68 87,2% 26 65,0%
65 – 69 years old 117 29 44 44
Cash 40 34,2% 10 34,5% 23 52,3% 7 15,9%
Service (transport, home chores and gardening, etc)
83 70,9% 26 89,7% 29 65,9% 28 63,6%
Materials (food, clothes, etc) 55 47,0% 18 62,1% 22 50,0% 15 34,1%
Other2/ 7 6,0% 3 10,3% 2 4,5% 2 4,5%
Support received 99 85,0% 27 93,0% 39 89,0% 33 75,0%
70 – 74 years old 94 25 37 32
Cash 33 35,1% 6 24,0% 22 59,5% 5 15,6%
Service (transport, home chores and gardening, etc)
54 57,4% 18 72,0% 20 54,1% 16 50,0%
Materials (food, clothes, etc) 42 44,7% 13 52,0% 21 56,8% 8 25,0%
Other2/ 6 6,4% 3 12,0% 2 5,4% 1 3,1%
Support received 74 79.0% 22 88,0% 30 81,0% 22 69,0%
75 years and older 171 15 60 96
Cash 48 28,1% 4 26,7% 30 50,0% 14 14,6%
Service (transport, home chores and gardening, etc)
116 67,8% 13 86,7% 49 81,7% 54 56,3%
Materials (food, clothes, etc) 94 55,0% 10 66,7% 49 81,7% 35 36,5%
Other2/ 29 17,0% 2 13,3% 8 13,3% 19 19,8%
Support received 141 82,5% 14 93,3% 55 91,7% 72 75,0%
Source: DGIS/STP. Survey on Health, Welfare, and Ageing (SABE), Paraguay 2017.1/ Including other relatives, non-relatives, etc.2/ Including medicines, accompanying, etc.Note: The sum of the percentages does not coincide with 100% because it corresponds to a variable with multiple response.
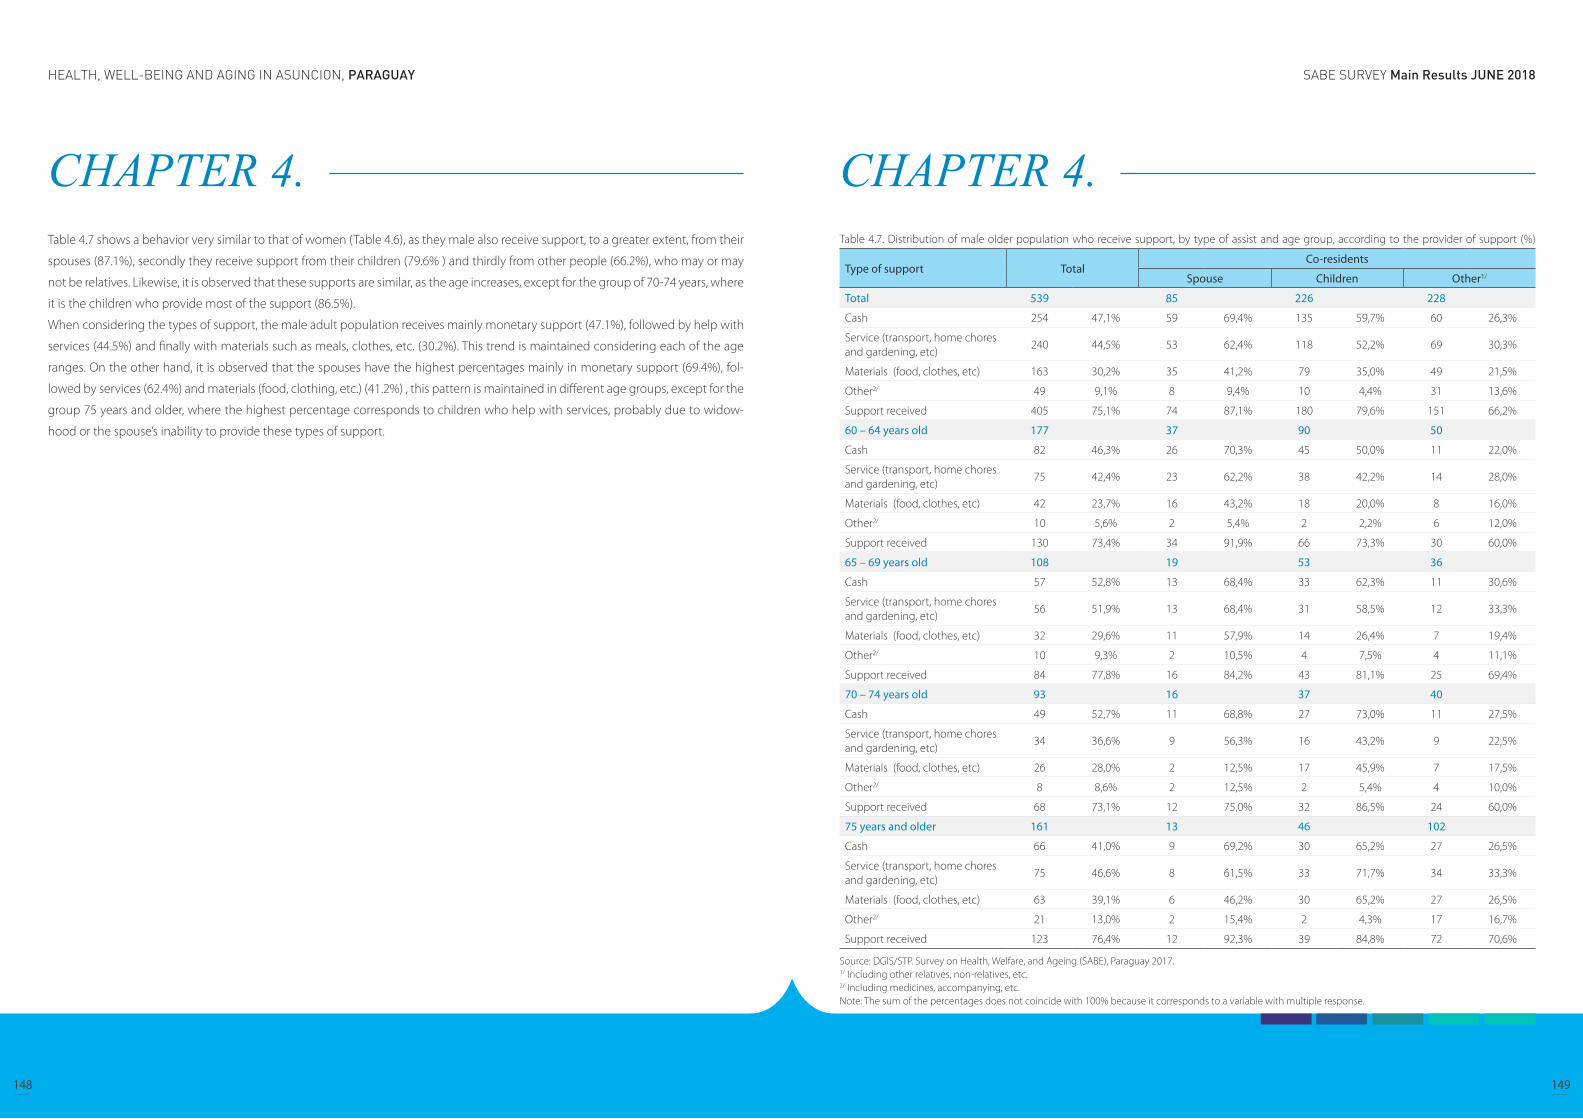
SABE SURVEY Main Results JUNE 2018HEALTH, WELL-BEING AND AGING IN ASUNCION, PARAGUAY
148 149
CHAPTER 4. Table 4.7 shows a behavior very similar to that of women (Table 4.6), as they male also receive support, to a greater extent, from their
spouses (87.1%), secondly they receive support from their children (79.6% ) and thirdly from other people (66.2%), who may or may
not be relatives. Likewise, it is observed that these supports are similar, as the age increases, except for the group of 70-74 years, where
it is the children who provide most of the support (86.5%).
When considering the types of support, the male adult population receives mainly monetary support (47.1%), followed by help with
services (44.5%) and finally with materials such as meals, clothes, etc. (30.2%). This trend is maintained considering each of the age
ranges. On the other hand, it is observed that the spouses have the highest percentages mainly in monetary support (69.4%), fol-
lowed by services (62.4%) and materials (food, clothing, etc.) (41.2%) , this pattern is maintained in different age groups, except for the
group 75 years and older, where the highest percentage corresponds to children who help with services, probably due to widow-
hood or the spouse’s inability to provide these types of support.
CHAPTER 4. Table 4.7. Distribution of male older population who receive support, by type of assist and age group, according to the provider of support (%)
Type of support TotalCo-residents
Spouse Children Other1/
Total 539 85 226 228
Cash 254 47,1% 59 69,4% 135 59,7% 60 26,3%
Service (transport, home chores and gardening, etc)
240 44,5% 53 62,4% 118 52,2% 69 30,3%
Materials (food, clothes, etc) 163 30,2% 35 41,2% 79 35,0% 49 21,5%
Other2/ 49 9,1% 8 9,4% 10 4,4% 31 13,6%
Support received 405 75,1% 74 87,1% 180 79,6% 151 66,2%
60 – 64 years old 177 37 90 50
Cash 82 46,3% 26 70,3% 45 50,0% 11 22,0%
Service (transport, home chores and gardening, etc)
75 42,4% 23 62,2% 38 42,2% 14 28,0%
Materials (food, clothes, etc) 42 23,7% 16 43,2% 18 20,0% 8 16,0%
Other2/ 10 5,6% 2 5,4% 2 2,2% 6 12,0%
Support received 130 73,4% 34 91,9% 66 73,3% 30 60,0%
65 – 69 years old 108 19 53 36
Cash 57 52,8% 13 68,4% 33 62,3% 11 30,6%
Service (transport, home chores and gardening, etc)
56 51,9% 13 68,4% 31 58,5% 12 33,3%
Materials (food, clothes, etc) 32 29,6% 11 57,9% 14 26,4% 7 19,4%
Other2/ 10 9,3% 2 10,5% 4 7,5% 4 11,1%
Support received 84 77,8% 16 84,2% 43 81,1% 25 69,4%
70 – 74 years old 93 16 37 40
Cash 49 52,7% 11 68,8% 27 73,0% 11 27,5%
Service (transport, home chores and gardening, etc)
34 36,6% 9 56,3% 16 43,2% 9 22,5%
Materials (food, clothes, etc) 26 28,0% 2 12,5% 17 45,9% 7 17,5%
Other2/ 8 8,6% 2 12,5% 2 5,4% 4 10,0%
Support received 68 73,1% 12 75,0% 32 86,5% 24 60,0%
75 years and older 161 13 46 102
Cash 66 41,0% 9 69,2% 30 65,2% 27 26,5%
Service (transport, home chores and gardening, etc)
75 46,6% 8 61,5% 33 71,7% 34 33,3%
Materials (food, clothes, etc) 63 39,1% 6 46,2% 30 65,2% 27 26,5%
Other2/ 21 13,0% 2 15,4% 2 4,3% 17 16,7%
Support received 123 76,4% 12 92,3% 39 84,8% 72 70,6%
Source: DGIS/STP. Survey on Health, Welfare, and Ageing (SABE), Paraguay 2017.1/ Including other relatives, non-relatives, etc.2/ Including medicines, accompanying, etc.Note: The sum of the percentages does not coincide with 100% because it corresponds to a variable with multiple response.
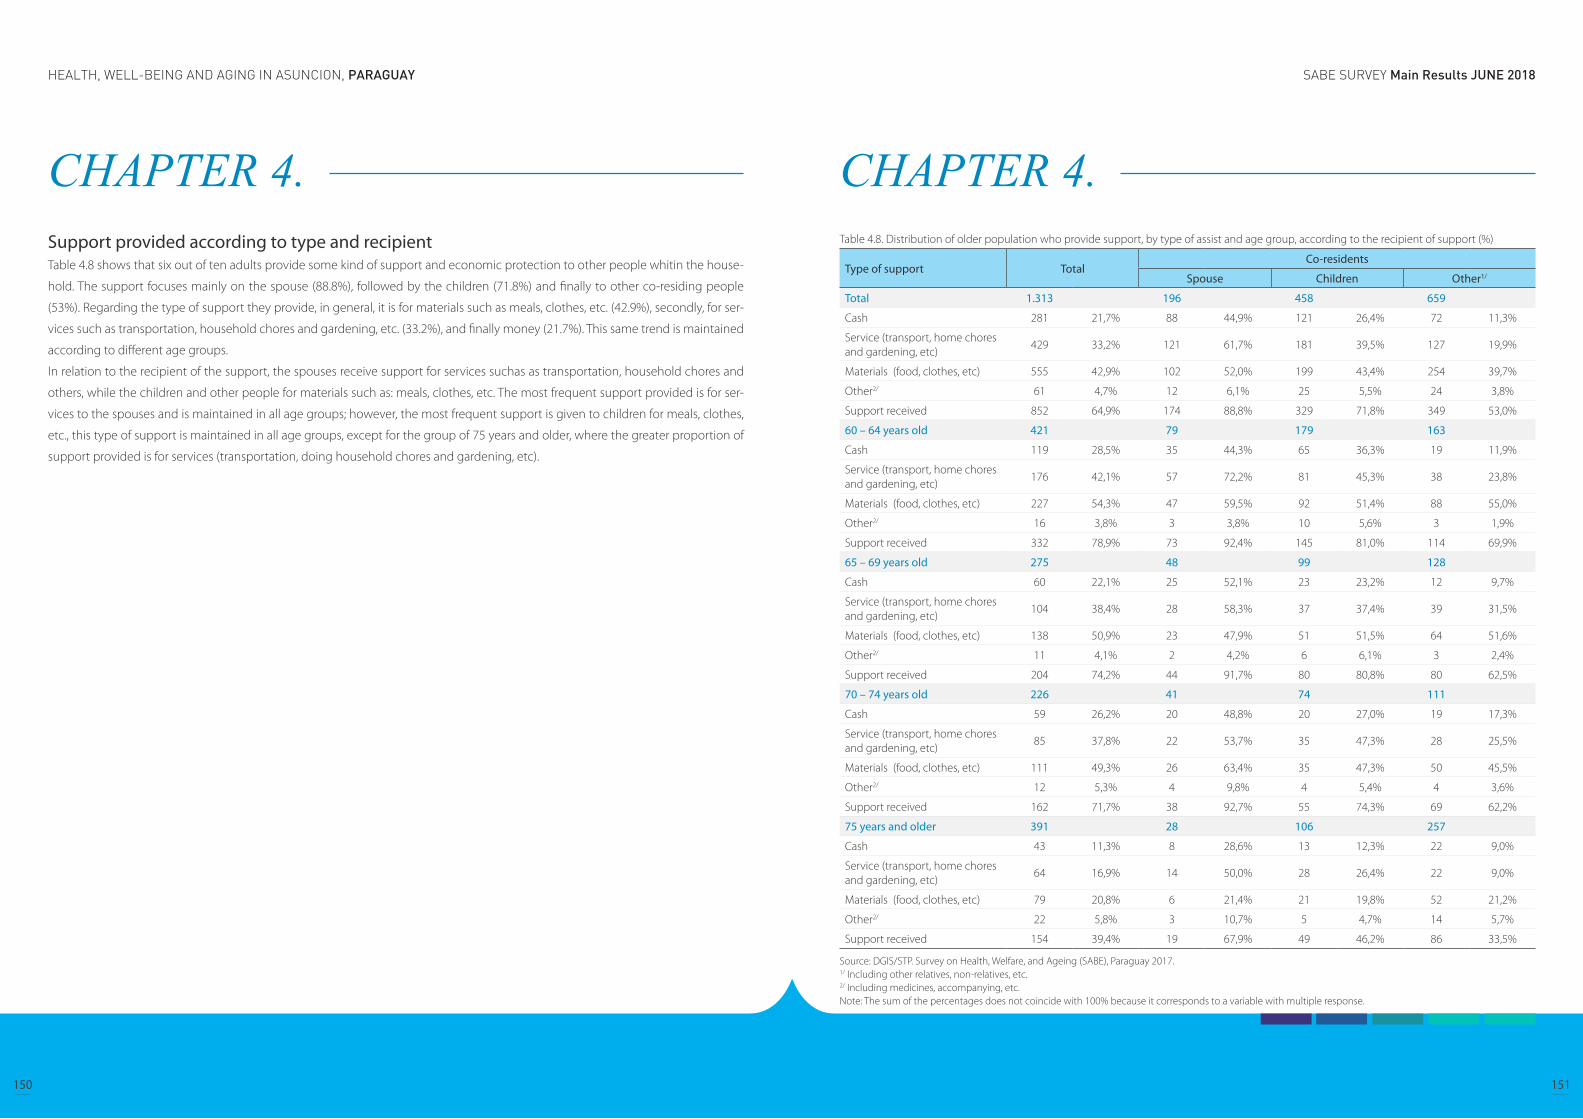
SABE SURVEY Main Results JUNE 2018HEALTH, WELL-BEING AND AGING IN ASUNCION, PARAGUAY
150 151
CHAPTER 4. Support provided according to type and recipientTable 4.8 shows that six out of ten adults provide some kind of support and economic protection to other people whitin the house-
hold. The support focuses mainly on the spouse (88.8%), followed by the children (71.8%) and finally to other co-residing people
(53%). Regarding the type of support they provide, in general, it is for materials such as meals, clothes, etc. (42.9%), secondly, for ser-
vices such as transportation, household chores and gardening, etc. (33.2%), and finally money (21.7%). This same trend is maintained
according to different age groups.
In relation to the recipient of the support, the spouses receive support for services suchas as transportation, household chores and
others, while the children and other people for materials such as: meals, clothes, etc. The most frequent support provided is for ser-
vices to the spouses and is maintained in all age groups; however, the most frequent support is given to children for meals, clothes,
etc., this type of support is maintained in all age groups, except for the group of 75 years and older, where the greater proportion of
support provided is for services (transportation, doing household chores and gardening, etc).
CHAPTER 4. Table 4.8. Distribution of older population who provide support, by type of assist and age group, according to the recipient of support (%)
Type of support TotalCo-residents
Spouse Children Other1/
Total 1.313 196 458 659
Cash 281 21,7% 88 44,9% 121 26,4% 72 11,3%
Service (transport, home chores and gardening, etc)
429 33,2% 121 61,7% 181 39,5% 127 19,9%
Materials (food, clothes, etc) 555 42,9% 102 52,0% 199 43,4% 254 39,7%
Other2/ 61 4,7% 12 6,1% 25 5,5% 24 3,8%
Support received 852 64,9% 174 88,8% 329 71,8% 349 53,0%
60 – 64 years old 421 79 179 163
Cash 119 28,5% 35 44,3% 65 36,3% 19 11,9%
Service (transport, home chores and gardening, etc)
176 42,1% 57 72,2% 81 45,3% 38 23,8%
Materials (food, clothes, etc) 227 54,3% 47 59,5% 92 51,4% 88 55,0%
Other2/ 16 3,8% 3 3,8% 10 5,6% 3 1,9%
Support received 332 78,9% 73 92,4% 145 81,0% 114 69,9%
65 – 69 years old 275 48 99 128
Cash 60 22,1% 25 52,1% 23 23,2% 12 9,7%
Service (transport, home chores and gardening, etc)
104 38,4% 28 58,3% 37 37,4% 39 31,5%
Materials (food, clothes, etc) 138 50,9% 23 47,9% 51 51,5% 64 51,6%
Other2/ 11 4,1% 2 4,2% 6 6,1% 3 2,4%
Support received 204 74,2% 44 91,7% 80 80,8% 80 62,5%
70 – 74 years old 226 41 74 111
Cash 59 26,2% 20 48,8% 20 27,0% 19 17,3%
Service (transport, home chores and gardening, etc)
85 37,8% 22 53,7% 35 47,3% 28 25,5%
Materials (food, clothes, etc) 111 49,3% 26 63,4% 35 47,3% 50 45,5%
Other2/ 12 5,3% 4 9,8% 4 5,4% 4 3,6%
Support received 162 71,7% 38 92,7% 55 74,3% 69 62,2%
75 years and older 391 28 106 257
Cash 43 11,3% 8 28,6% 13 12,3% 22 9,0%
Service (transport, home chores and gardening, etc)
64 16,9% 14 50,0% 28 26,4% 22 9,0%
Materials (food, clothes, etc) 79 20,8% 6 21,4% 21 19,8% 52 21,2%
Other2/ 22 5,8% 3 10,7% 5 4,7% 14 5,7%
Support received 154 39,4% 19 67,9% 49 46,2% 86 33,5%
Source: DGIS/STP. Survey on Health, Welfare, and Ageing (SABE), Paraguay 2017.1/ Including other relatives, non-relatives, etc.2/ Including medicines, accompanying, etc.Note: The sum of the percentages does not coincide with 100% because it corresponds to a variable with multiple response.
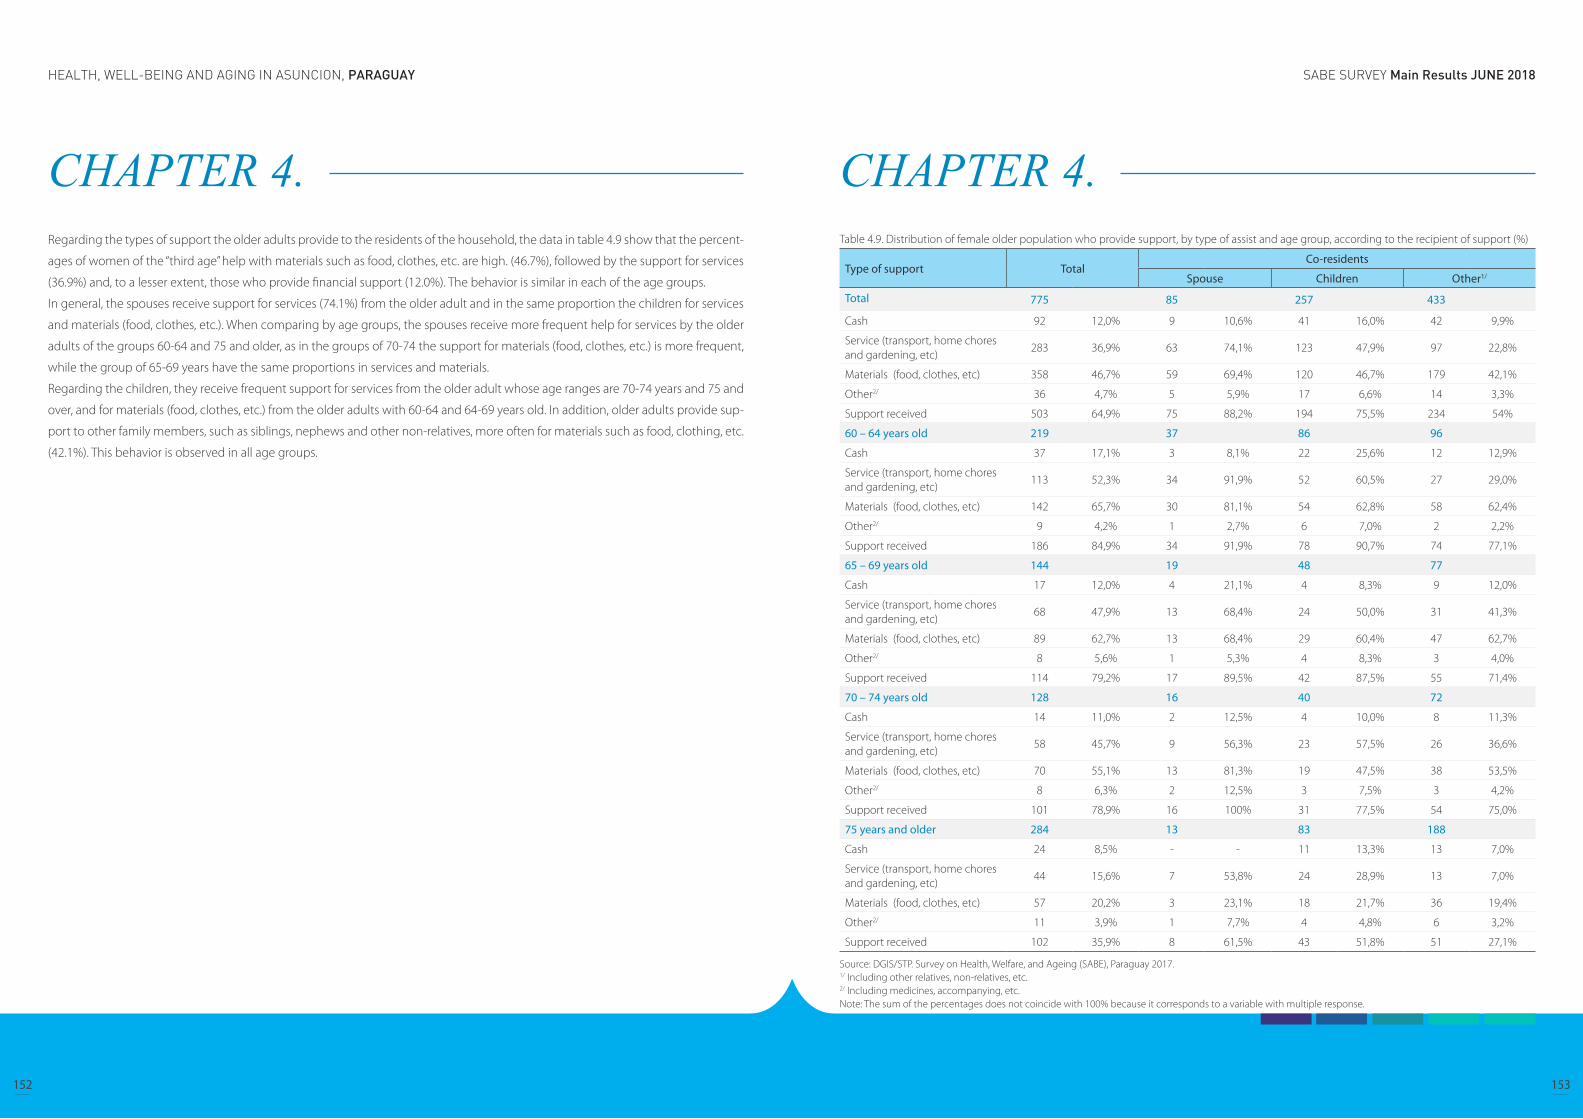
SABE SURVEY Main Results JUNE 2018HEALTH, WELL-BEING AND AGING IN ASUNCION, PARAGUAY
152 153
CHAPTER 4. Regarding the types of support the older adults provide to the residents of the household, the data in table 4.9 show that the percent-
ages of women of the “third age” help with materials such as food, clothes, etc. are high. (46.7%), followed by the support for services
(36.9%) and, to a lesser extent, those who provide financial support (12.0%). The behavior is similar in each of the age groups.
In general, the spouses receive support for services (74.1%) from the older adult and in the same proportion the children for services
and materials (food, clothes, etc.). When comparing by age groups, the spouses receive more frequent help for services by the older
adults of the groups 60-64 and 75 and older, as in the groups of 70-74 the support for materials (food, clothes, etc.) is more frequent,
while the group of 65-69 years have the same proportions in services and materials.
Regarding the children, they receive frequent support for services from the older adult whose age ranges are 70-74 years and 75 and
over, and for materials (food, clothes, etc.) from the older adults with 60-64 and 64-69 years old. In addition, older adults provide sup-
port to other family members, such as siblings, nephews and other non-relatives, more often for materials such as food, clothing, etc.
(42.1%). This behavior is observed in all age groups.
CHAPTER 4. Table 4.9. Distribution of female older population who provide support, by type of assist and age group, according to the recipient of support (%)
Type of support TotalCo-residents
Spouse Children Other1/
Total 775 85 257 433
Cash 92 12,0% 9 10,6% 41 16,0% 42 9,9%
Service (transport, home chores and gardening, etc)
283 36,9% 63 74,1% 123 47,9% 97 22,8%
Materials (food, clothes, etc) 358 46,7% 59 69,4% 120 46,7% 179 42,1%
Other2/ 36 4,7% 5 5,9% 17 6,6% 14 3,3%
Support received 503 64,9% 75 88,2% 194 75,5% 234 54%
60 – 64 years old 219 37 86 96
Cash 37 17,1% 3 8,1% 22 25,6% 12 12,9%
Service (transport, home chores and gardening, etc)
113 52,3% 34 91,9% 52 60,5% 27 29,0%
Materials (food, clothes, etc) 142 65,7% 30 81,1% 54 62,8% 58 62,4%
Other2/ 9 4,2% 1 2,7% 6 7,0% 2 2,2%
Support received 186 84,9% 34 91,9% 78 90,7% 74 77,1%
65 – 69 years old 144 19 48 77
Cash 17 12,0% 4 21,1% 4 8,3% 9 12,0%
Service (transport, home chores and gardening, etc)
68 47,9% 13 68,4% 24 50,0% 31 41,3%
Materials (food, clothes, etc) 89 62,7% 13 68,4% 29 60,4% 47 62,7%
Other2/ 8 5,6% 1 5,3% 4 8,3% 3 4,0%
Support received 114 79,2% 17 89,5% 42 87,5% 55 71,4%
70 – 74 years old 128 16 40 72
Cash 14 11,0% 2 12,5% 4 10,0% 8 11,3%
Service (transport, home chores and gardening, etc)
58 45,7% 9 56,3% 23 57,5% 26 36,6%
Materials (food, clothes, etc) 70 55,1% 13 81,3% 19 47,5% 38 53,5%
Other2/ 8 6,3% 2 12,5% 3 7,5% 3 4,2%
Support received 101 78,9% 16 100% 31 77,5% 54 75,0%
75 years and older 284 13 83 188
Cash 24 8,5% - - 11 13,3% 13 7,0%
Service (transport, home chores and gardening, etc)
44 15,6% 7 53,8% 24 28,9% 13 7,0%
Materials (food, clothes, etc) 57 20,2% 3 23,1% 18 21,7% 36 19,4%
Other2/ 11 3,9% 1 7,7% 4 4,8% 6 3,2%
Support received 102 35,9% 8 61,5% 43 51,8% 51 27,1%
Source: DGIS/STP. Survey on Health, Welfare, and Ageing (SABE), Paraguay 2017.1/ Including other relatives, non-relatives, etc.2/ Including medicines, accompanying, etc.Note: The sum of the percentages does not coincide with 100% because it corresponds to a variable with multiple response.

SABE SURVEY Main Results JUNE 2018HEALTH, WELL-BEING AND AGING IN ASUNCION, PARAGUAY
154 155
CHAPTER 4. In relation to the types of support that older adults provide to the residents of the household, table 4.10 shows that men of the “third
age” help more frequently with materials such as food, clothes, etc. (37.5%), followed by financial support (35.9%) and, to a lesser
extent, help with services (27.8%).
In general, 7 out of 10 spouses receive financial support from the older adult, the children however, receive financial support and for
materials (food, clothes, etc.) in almost the same proportion (39.8%, 39, 3% respectively). Other members of the household receive
more help for materials (meals, clothes, etc.) (35%).
When comparing by age groups, spouses receive more frequently financial support in all groups. Regarding the children, they receive
more frequently financial support from the older adult of 60-64 years, while the adults older than 70-74 years support their children
with money and materials (food, clothing, etc.) in equal proportion. Older adults provide support to other relatives, such as siblings,
nephews, and other non-relatives, in greater proportion for materials such as food, clothing, etc., this behavior is maintained in all age
groups.
CHAPTER 4. Table 4.10. Distribution of male older population who provide support, by type of assist and age group, according to the recipient of support (%)
Type of support TotalCo-residents
Spouse Children Other1/
Total 538 111 201 226
Cash 189 35,9% 79 71,2% 80 39,8% 30 14,0%
Service (transport, home chores and gardening, etc)
146 27,8% 58 52,3% 58 28,9% 30 14,0%
Materials (food, clothes, etc) 197 37,5% 43 38,7% 79 39,3% 75 35,0%
Other2/ 25 4,8% 7 6,3% 8 4,0% 10 4,7%
Support received 349 64,9% 99 89,2% 135 67,2% 115 50,9%
60 – 64 years old 202 42 93 67
Cash 82 40,6% 32 76,2% 43 46,2% 7 10,4%
Service (transport, home chores and gardening, etc)
63 31,2% 23 54,8% 29 31,2% 11 16,4%
Materials (food, clothes, etc) 85 42,1% 17 40,5% 38 40,9% 30 44,8%
Other2/ 7 3,5% 2 4,8% 4 4,3% 1 1,5%
Support received 146 72,3% 39 92,9% 67 72,0% 40 59,7%
65 – 69 years old 131 29 51 51
Cash 43 33,3% 21 72,4% 19 37,3% 3 6,1%
Service (transport, home chores and gardening, etc)
36 27,9% 15 51,7% 13 25,5% 8 16,3%
Materials (food, clothes, etc) 49 38,0% 10 34,5% 22 43,1% 17 34,7%
Other2/ 3 2,3% 1 3,4% 2 3,9% - -
Support received 90 68,7% 27 93,1% 38 74,5% 25 49,0%
70 – 74 years old 98 25 34 39
Cash 45 45,9% 18 72,0% 16 47,1% 11 28,2%
Service (transport, home chores and gardening, etc)
27 27,6% 13 52,0% 12 35,3% 2 5,1%
Materials (food, clothes, etc) 41 41,8% 13 52,0% 16 47,1% 12 30,8%
Other2/ 4 4,1% 2 8,0% 1 2,9% 1 2,6%
Support received 61 62,2% 22 88,0% 24 70,6% 15 38,5%
75 years and older 107 15 23 69
Cash 19 19,6% 8 53,3% 2 8,7% 9 15,3%
Service (transport, home chores and gardening, etc)
20 20,6% 7 46,7% 4 17,4% 9 15,3%
Materials (food, clothes, etc) 22 22,7% 3 20,0% 3 13,0% 16 27,1%
Other2/ 11 11,3% 2 13,3% 1 4,3% 8 13,6%
Support received 52 48,6% 11 73,3% 6 26,1% 35 50,7%
Source: DGIS/STP. Survey on Health, Welfare, and Ageing (SABE), Paraguay 2017.1/ Including other relatives, non-relatives, etc.2/ Including medicines, accompanying, etc.Note: The sum of the percentages does not coincide with 100% because it corresponds to a variable with multiple response.
SABE SURVEY Main Results JUNE 2018HEALTH, WELL-BEING AND AGING IN ASUNCION, PARAGUAY
156 157
CHAPTER 5. Health Status
Self-rated health (SRH)When older adults were asked to rate their health with excellent, very good, good, fair, and poor, majority of male and female of popu-
lation aged 60 and over rated themselves to be in good (good, very good, or excellent) health. Proportion of female who thought
they’re in excellent health decreased as they aged, and in all age groups smaller a proportion of female answered they feel in excel-
lent health in comparison to the male population.
Self-rated health is a subjective assessment tool, however, it can be a valid and reliable measure among those without cognitive
impairment. In previous studies, the prevalence of diseases was associated with poorer SRH, and the tendency was more prominent
in cardio-cerebral vascular diseases, visual impairment, and mental illnesses. And most of the health-related factors regarded as risks
were associated with poorer SRH, too (Wu S, Wang R, Zhao Y, et al. 2013). Further investigation of SRH in the SABE survey may be
beneficial for an evidence informed policy process of Paraguay.
SABE Asunción 2017
CHAPTER 5. Health Status
Self-rated health (SRH)
Health related behaviors and habits
Mental health
Urinary incontinence
Sensory loss
Malnutrition
Falls
Osteoporosis
Chronic diseases
Gender-specific diseases
Socioeconomic inequalities in health
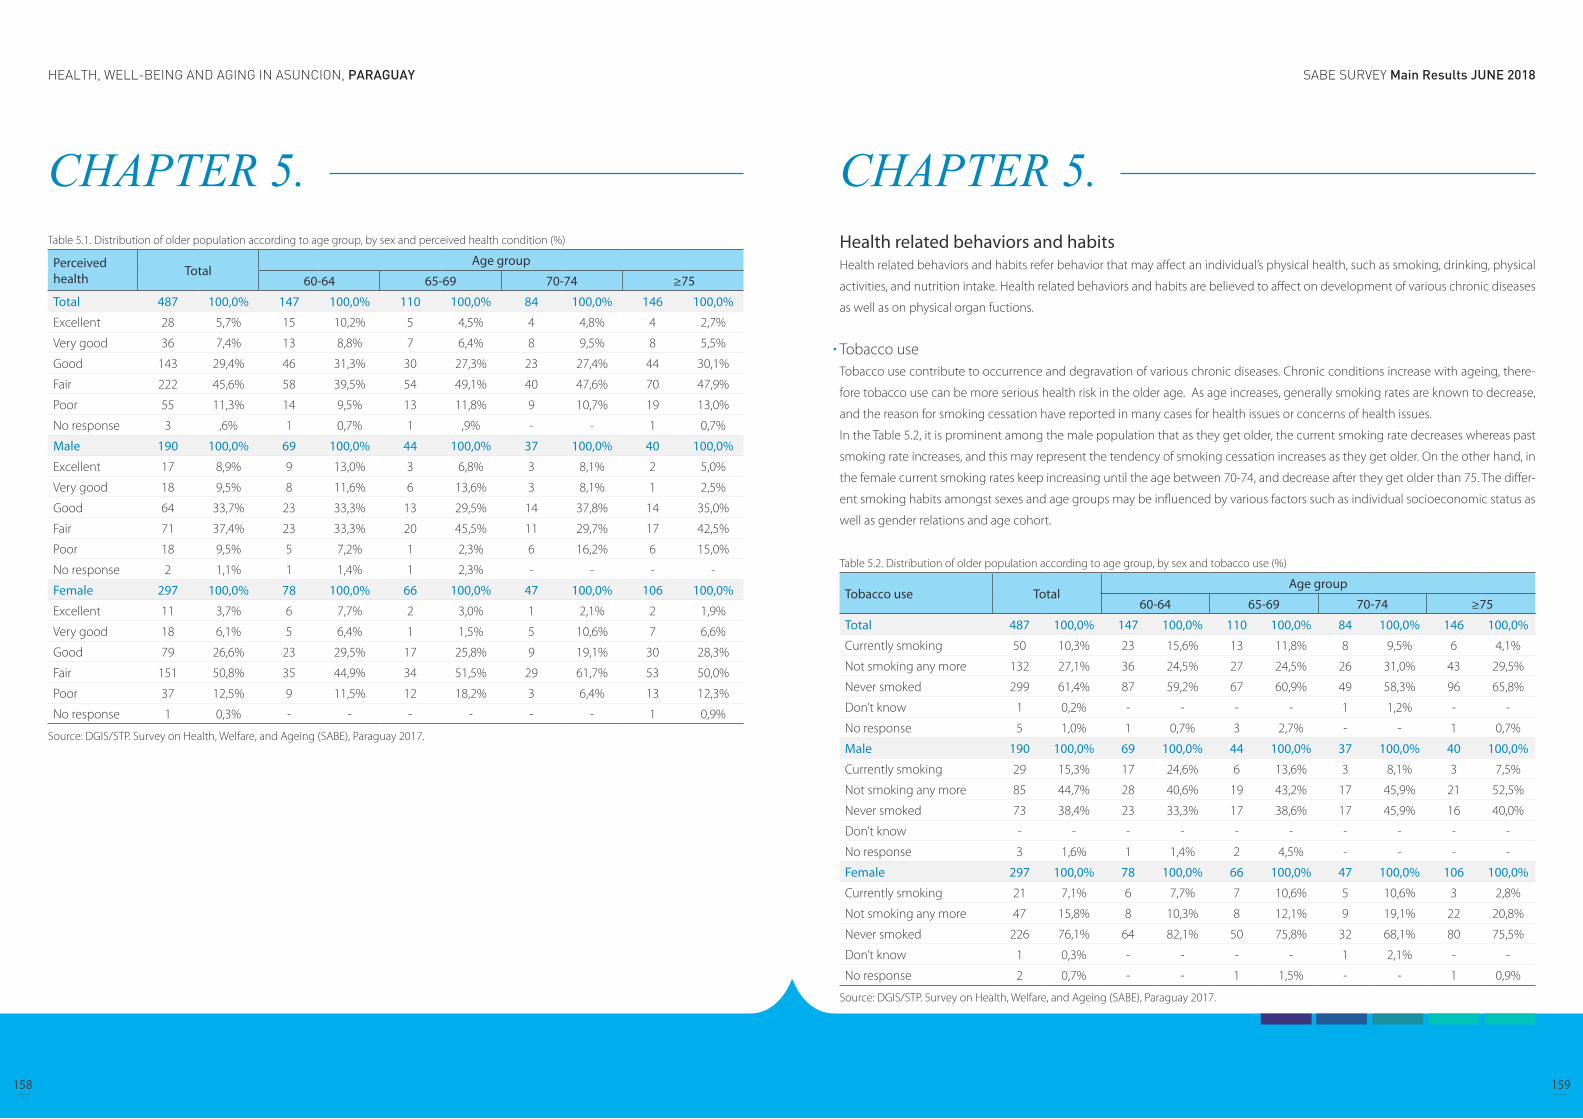
SABE SURVEY Main Results JUNE 2018HEALTH, WELL-BEING AND AGING IN ASUNCION, PARAGUAY
158 159
CHAPTER 5. Table 5.1. Distribution of older population according to age group, by sex and perceived health condition (%)
Perceived health Total
Age group
60-64 65-69 70-74 ≥75
Total 487 100,0% 147 100,0% 110 100,0% 84 100,0% 146 100,0%
Excellent 28 5,7% 15 10,2% 5 4,5% 4 4,8% 4 2,7%
Very good 36 7,4% 13 8,8% 7 6,4% 8 9,5% 8 5,5%
Good 143 29,4% 46 31,3% 30 27,3% 23 27,4% 44 30,1%
Fair 222 45,6% 58 39,5% 54 49,1% 40 47,6% 70 47,9%
Poor 55 11,3% 14 9,5% 13 11,8% 9 10,7% 19 13,0%
No response 3 ,6% 1 0,7% 1 ,9% - - 1 0,7%
Male 190 100,0% 69 100,0% 44 100,0% 37 100,0% 40 100,0%
Excellent 17 8,9% 9 13,0% 3 6,8% 3 8,1% 2 5,0%
Very good 18 9,5% 8 11,6% 6 13,6% 3 8,1% 1 2,5%
Good 64 33,7% 23 33,3% 13 29,5% 14 37,8% 14 35,0%
Fair 71 37,4% 23 33,3% 20 45,5% 11 29,7% 17 42,5%
Poor 18 9,5% 5 7,2% 1 2,3% 6 16,2% 6 15,0%
No response 2 1,1% 1 1,4% 1 2,3% - - - -
Female 297 100,0% 78 100,0% 66 100,0% 47 100,0% 106 100,0%
Excellent 11 3,7% 6 7,7% 2 3,0% 1 2,1% 2 1,9%
Very good 18 6,1% 5 6,4% 1 1,5% 5 10,6% 7 6,6%
Good 79 26,6% 23 29,5% 17 25,8% 9 19,1% 30 28,3%
Fair 151 50,8% 35 44,9% 34 51,5% 29 61,7% 53 50,0%
Poor 37 12,5% 9 11,5% 12 18,2% 3 6,4% 13 12,3%
No response 1 0,3% - - - - - - 1 0,9%
Source: DGIS/STP. Survey on Health, Welfare, and Ageing (SABE), Paraguay 2017.
CHAPTER 5. Health related behaviors and habitsHealth related behaviors and habits refer behavior that may affect an individual’s physical health, such as smoking, drinking, physical
activities, and nutrition intake. Health related behaviors and habits are believed to affect on development of various chronic diseases
as well as on physical organ fuctions.
Tobacco useTobacco use contribute to occurrence and degravation of various chronic diseases. Chronic conditions increase with ageing, there-
fore tobacco use can be more serious health risk in the older age. As age increases, generally smoking rates are known to decrease,
and the reason for smoking cessation have reported in many cases for health issues or concerns of health issues.
In the Table 5.2, it is prominent among the male population that as they get older, the current smoking rate decreases whereas past
smoking rate increases, and this may represent the tendency of smoking cessation increases as they get older. On the other hand, in
the female current smoking rates keep increasing until the age between 70-74, and decrease after they get older than 75. The differ-
ent smoking habits amongst sexes and age groups may be influenced by various factors such as individual socioeconomic status as
well as gender relations and age cohort.
Table 5.2. Distribution of older population according to age group, by sex and tobacco use (%)
Tobacco use TotalAge group
60-64 65-69 70-74 ≥75
Total 487 100,0% 147 100,0% 110 100,0% 84 100,0% 146 100,0%
Currently smoking 50 10,3% 23 15,6% 13 11,8% 8 9,5% 6 4,1%
Not smoking any more 132 27,1% 36 24,5% 27 24,5% 26 31,0% 43 29,5%
Never smoked 299 61,4% 87 59,2% 67 60,9% 49 58,3% 96 65,8%
Don’t know 1 0,2% - - - - 1 1,2% - -
No response 5 1,0% 1 0,7% 3 2,7% - - 1 0,7%
Male 190 100,0% 69 100,0% 44 100,0% 37 100,0% 40 100,0%
Currently smoking 29 15,3% 17 24,6% 6 13,6% 3 8,1% 3 7,5%
Not smoking any more 85 44,7% 28 40,6% 19 43,2% 17 45,9% 21 52,5%
Never smoked 73 38,4% 23 33,3% 17 38,6% 17 45,9% 16 40,0%
Don’t know - - - - - - - - - -
No response 3 1,6% 1 1,4% 2 4,5% - - - -
Female 297 100,0% 78 100,0% 66 100,0% 47 100,0% 106 100,0%
Currently smoking 21 7,1% 6 7,7% 7 10,6% 5 10,6% 3 2,8%
Not smoking any more 47 15,8% 8 10,3% 8 12,1% 9 19,1% 22 20,8%
Never smoked 226 76,1% 64 82,1% 50 75,8% 32 68,1% 80 75,5%
Don’t know 1 0,3% - - - - 1 2,1% - -
No response 2 0,7% - - 1 1,5% - - 1 0,9%
Source: DGIS/STP. Survey on Health, Welfare, and Ageing (SABE), Paraguay 2017.

SABE SURVEY Main Results JUNE 2018HEALTH, WELL-BEING AND AGING IN ASUNCION, PARAGUAY
160 161
CHAPTER 5. Alcohol useWhen asked their average number of day in a week that they use alcoholic beverage, the rate of both male and female who had no
alcoholic beverage at all increased as they get older.
In case of the male population, after the age of 65, drinking more than 2 days in a week decreases whereas drinking less than 1 day
increases. On the other hand, in the female group, the population of age between 70 and 74 is the highest rate who answered they
had drinks more than 2 days in a week.
Table 5.3. Distribution of older population according to age group, by sex and weekly alcohol use (%)
Consumo de alcohol Total
Age group
60-64 65-69 70-74 ≥75
Total 487 100,0% 147 100,0% 110 100,0% 84 100,0% 146 100,0%
No drinking 330 67,8% 88 59,9% 74 67,3% 53 63,1% 115 78,8%
Less than 1 day 62 12,7% 21 14,3% 10 9,1% 12 14,3% 19 13,0%
2 days or more 88 18,1% 36 24,5% 22 20,0% 19 22,6% 11 7,5%
No response 7 1,4% 2 1,4% 4 3,6% - - 1 0,7%
Male 190 100,0% 69 100,0% 44 100,0% 37 100,0% 40 100,0%
No drinking 87 45,8% 24 34,8% 18 40,9% 18 48,6% 27 67,5%
Less than 1 day 33 17,4% 14 20,3% 5 11,4% 7 18,9% 7 17,5%
2 days or more 65 34,2% 29 42,0% 18 40,9% 12 32,4% 6 15,0%
No response 5 2,6% 2 2,9% 3 6,8% - - - -
Female 297 100,0% 78 100,0% 66 100,0% 47 100,0% 106 100,0%
No drinking 243 81,8% 64 82,1% 56 84,8% 35 74,5% 88 83,0%
Less than 1 day 29 9,8% 7 9,0% 5 7,6% 5 10,6% 12 11,3%
2 days or more 23 7,7% 7 9,0% 4 6,1% 7 14,9% 5 4,7%
No response 2 0,7% - - 1 1,5% - - 1 0,9%
Source: DGIS/STP. Survey on Health, Welfare, and Ageing (SABE), Paraguay 2017.
CHAPTER 5. Intake of protein, vegetables and fruitsDietary intake is known to be associated with various health outcomes such as cardiovascular conditions and cancers. Protein intake
is crucial especially in terms of musculoskeletal maintenance. Fruits and vegetables are the source of fiber, vitamins, minerals and
antioxidants.
According to the results in the Table 5.4, the older people in Paraguay may have generally balanced diet with plenty of dairy and meat,
although there’s more room for the male population to increase their intake of fruits and vegetables.
Table 5.4. Distribution of older population according to age group, by sex and nutrition intake (%)
Nutritional Intake1/ TotalAge group
60-64 65-69 70-74 ≥75
Total
Dairy products 430 88,3% 130 88,4% 96 87,3% 73 86,9% 131 89,7%
Eggs or legumes 429 88,1% 131 89,1% 95 86,4% 77 91,7% 126 86,3%
Meat, poultry or fish 460 94,5% 143 97,3% 101 91,8% 80 95,2% 136 93,2%
Fruits or vegetables 373 76,6% 112 76,2% 84 76,4% 66 78,6% 111 76,0%
Male
Dairy products 157 82,6% 54 78,3% 37 84,1% 31 83,8% 35 87,5%
Eggs or legumes 171 90,0% 60 87,0% 42 95,5% 36 97,3% 33 82,5%
Meat, poultry or fish 181 95,3% 67 97,1% 41 93,2% 36 97,3% 37 92,5%
Fruits or vegetables 128 67,4% 46 66,7% 25 56,8% 28 75,7% 29 72,5%
Female
Dairy products 273 91,9% 76 97,4% 59 89,4% 42 89,4% 96 90,6%
Eggs or legumes 258 86,9% 71 91,0% 53 80,3% 41 87,2% 93 87,7%
Meat, poultry or fish 279 93,9% 76 97,4% 60 90,9% 44 93,6% 99 93,4%
Fruits or vegetables 245 82,5% 66 84,6% 59 89,4% 38 80,9% 82 77,4%
Source: DGIS/STP. Survey on Health, Welfare, and Ageing (SABE), Paraguay 2017.1/ Daily: Dairy products; At least once a week: Eggs or legumes; At least three times a week: Meat, poultry or fish; At least twice a day: Fruits or vegetables.
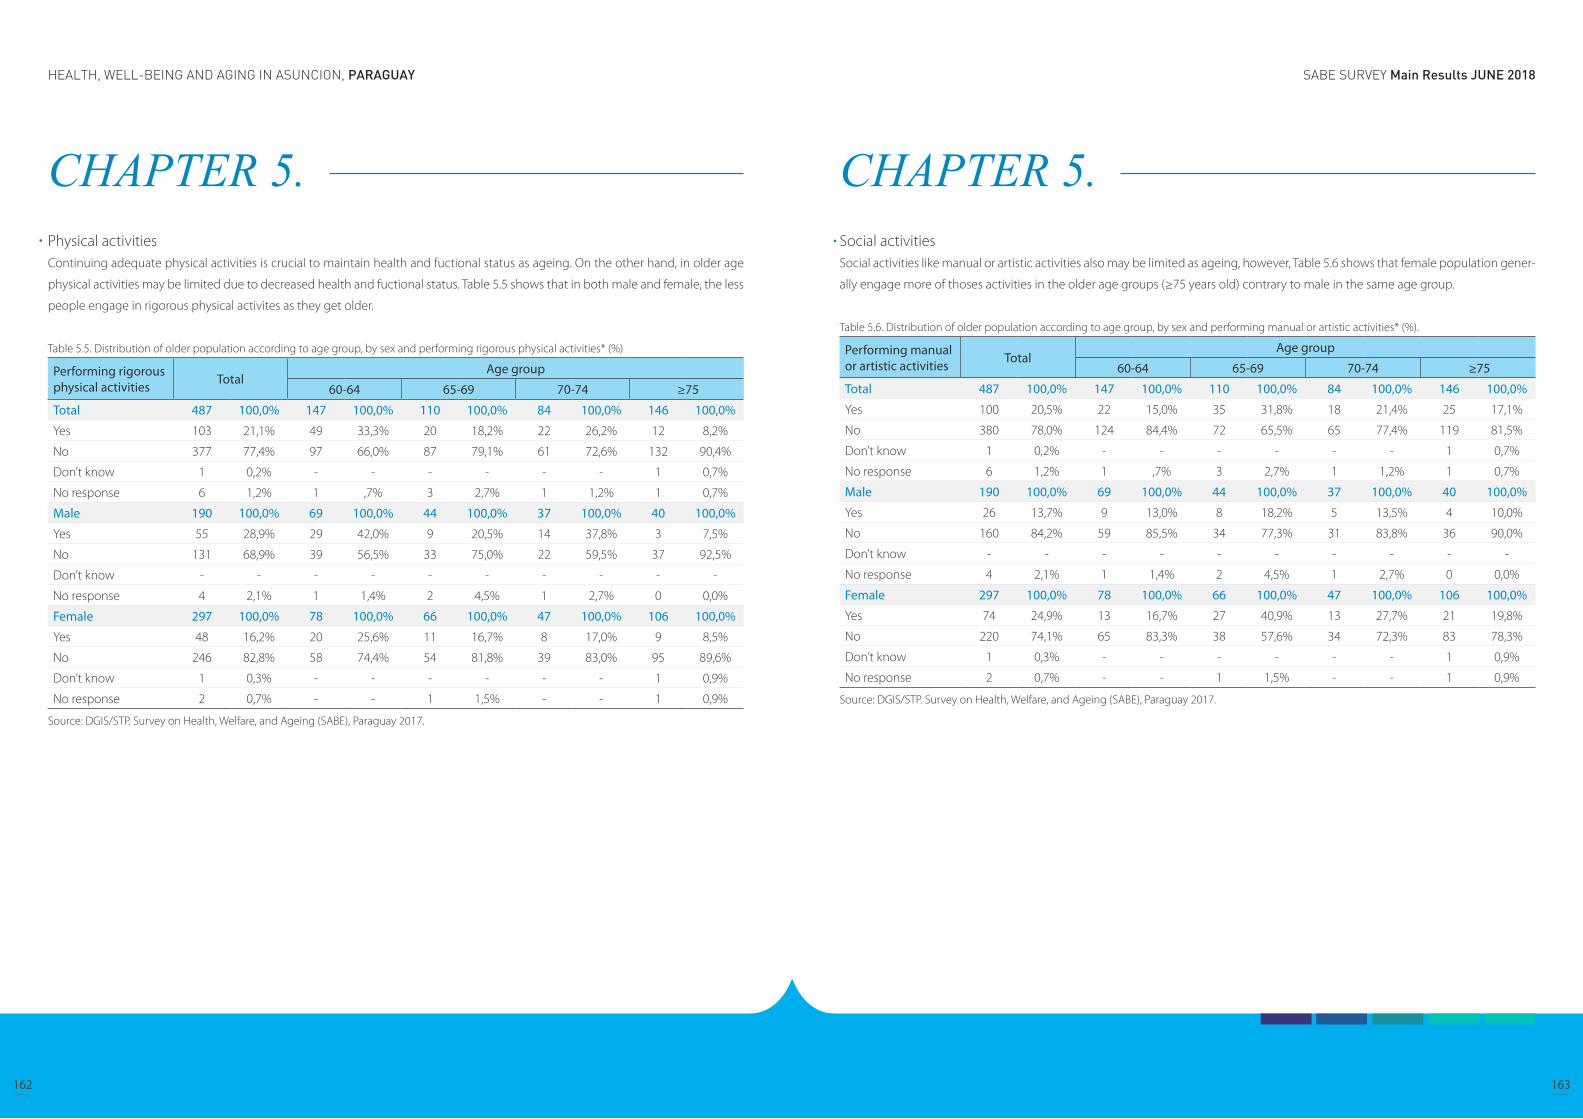
SABE SURVEY Main Results JUNE 2018HEALTH, WELL-BEING AND AGING IN ASUNCION, PARAGUAY
162 163
CHAPTER 5. Physical activitiesContinuing adequate physical activities is crucial to maintain health and fuctional status as ageing. On the other hand, in older age
physical activities may be limited due to decreased health and fuctional status. Table 5.5 shows that in both male and female, the less
people engage in rigorous physical activites as they get older.
Table 5.5. Distribution of older population according to age group, by sex and performing rigorous physical activities* (%)
Performing rigorous physical activities Total
Age group
60-64 65-69 70-74 ≥75
Total 487 100,0% 147 100,0% 110 100,0% 84 100,0% 146 100,0%
Yes 103 21,1% 49 33,3% 20 18,2% 22 26,2% 12 8,2%
No 377 77,4% 97 66,0% 87 79,1% 61 72,6% 132 90,4%
Don’t know 1 0,2% - - - - - - 1 0,7%
No response 6 1,2% 1 ,7% 3 2,7% 1 1,2% 1 0,7%
Male 190 100,0% 69 100,0% 44 100,0% 37 100,0% 40 100,0%
Yes 55 28,9% 29 42,0% 9 20,5% 14 37,8% 3 7,5%
No 131 68,9% 39 56,5% 33 75,0% 22 59,5% 37 92,5%
Don’t know - - - - - - - - - -
No response 4 2,1% 1 1,4% 2 4,5% 1 2,7% 0 0,0%
Female 297 100,0% 78 100,0% 66 100,0% 47 100,0% 106 100,0%
Yes 48 16,2% 20 25,6% 11 16,7% 8 17,0% 9 8,5%
No 246 82,8% 58 74,4% 54 81,8% 39 83,0% 95 89,6%
Don’t know 1 0,3% - - - - - - 1 0,9%
No response 2 0,7% - - 1 1,5% - - 1 0,9%
Source: DGIS/STP. Survey on Health, Welfare, and Ageing (SABE), Paraguay 2017.
CHAPTER 5. Social activities Social activities like manual or artistic activities also may be limited as ageing, however, Table 5.6 shows that female population gener-
ally engage more of thoses activities in the older age groups (≥75 years old) contrary to male in the same age group.
Table 5.6. Distribution of older population according to age group, by sex and performing manual or artistic activities* (%).
Performing manual or artistic activities Total
Age group
60-64 65-69 70-74 ≥75
Total 487 100,0% 147 100,0% 110 100,0% 84 100,0% 146 100,0%
Yes 100 20,5% 22 15,0% 35 31,8% 18 21,4% 25 17,1%
No 380 78,0% 124 84,4% 72 65,5% 65 77,4% 119 81,5%
Don’t know 1 0,2% - - - - - - 1 0,7%
No response 6 1,2% 1 ,7% 3 2,7% 1 1,2% 1 0,7%
Male 190 100,0% 69 100,0% 44 100,0% 37 100,0% 40 100,0%
Yes 26 13,7% 9 13,0% 8 18,2% 5 13,5% 4 10,0%
No 160 84,2% 59 85,5% 34 77,3% 31 83,8% 36 90,0%
Don’t know - - - - - - - - - -
No response 4 2,1% 1 1,4% 2 4,5% 1 2,7% 0 0,0%
Female 297 100,0% 78 100,0% 66 100,0% 47 100,0% 106 100,0%
Yes 74 24,9% 13 16,7% 27 40,9% 13 27,7% 21 19,8%
No 220 74,1% 65 83,3% 38 57,6% 34 72,3% 83 78,3%
Don’t know 1 0,3% - - - - - - 1 0,9%
No response 2 0,7% - - 1 1,5% - - 1 0,9%
Source: DGIS/STP. Survey on Health, Welfare, and Ageing (SABE), Paraguay 2017.
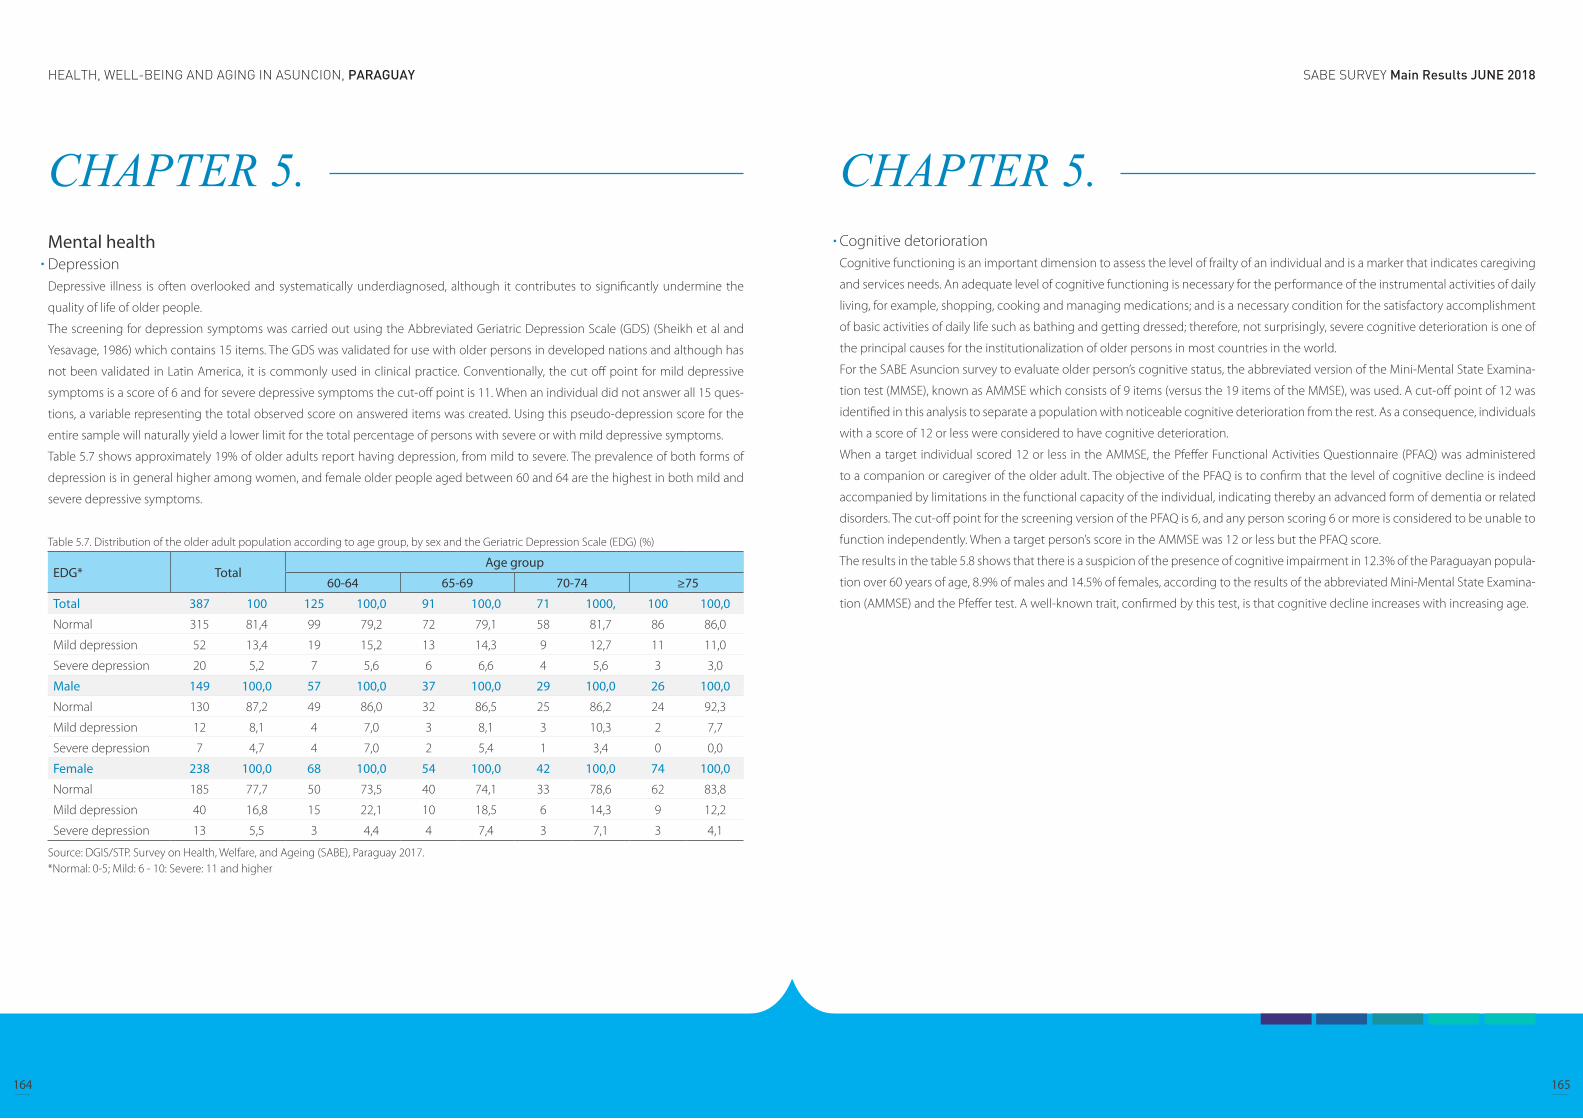
SABE SURVEY Main Results JUNE 2018HEALTH, WELL-BEING AND AGING IN ASUNCION, PARAGUAY
164 165
CHAPTER 5. Mental health DepressionDepressive illness is often overlooked and systematically underdiagnosed, although it contributes to significantly undermine the
quality of life of older people.
The screening for depression symptoms was carried out using the Abbreviated Geriatric Depression Scale (GDS) (Sheikh et al and
Yesavage, 1986) which contains 15 items. The GDS was validated for use with older persons in developed nations and although has
not been validated in Latin America, it is commonly used in clinical practice. Conventionally, the cut off point for mild depressive
symptoms is a score of 6 and for severe depressive symptoms the cut-off point is 11. When an individual did not answer all 15 ques-
tions, a variable representing the total observed score on answered items was created. Using this pseudo-depression score for the
entire sample will naturally yield a lower limit for the total percentage of persons with severe or with mild depressive symptoms.
Table 5.7 shows approximately 19% of older adults report having depression, from mild to severe. The prevalence of both forms of
depression is in general higher among women, and female older people aged between 60 and 64 are the highest in both mild and
severe depressive symptoms.
Table 5.7. Distribution of the older adult population according to age group, by sex and the Geriatric Depression Scale (EDG) (%)
EDG* TotalAge group
60-64 65-69 70-74 ≥75
Total 387 100 125 100,0 91 100,0 71 1000, 100 100,0
Normal 315 81,4 99 79,2 72 79,1 58 81,7 86 86,0
Mild depression 52 13,4 19 15,2 13 14,3 9 12,7 11 11,0
Severe depression 20 5,2 7 5,6 6 6,6 4 5,6 3 3,0
Male 149 100,0 57 100,0 37 100,0 29 100,0 26 100,0
Normal 130 87,2 49 86,0 32 86,5 25 86,2 24 92,3
Mild depression 12 8,1 4 7,0 3 8,1 3 10,3 2 7,7
Severe depression 7 4,7 4 7,0 2 5,4 1 3,4 0 0,0
Female 238 100,0 68 100,0 54 100,0 42 100,0 74 100,0
Normal 185 77,7 50 73,5 40 74,1 33 78,6 62 83,8
Mild depression 40 16,8 15 22,1 10 18,5 6 14,3 9 12,2
Severe depression 13 5,5 3 4,4 4 7,4 3 7,1 3 4,1
Source: DGIS/STP. Survey on Health, Welfare, and Ageing (SABE), Paraguay 2017.*Normal: 0-5; Mild: 6 - 10: Severe: 11 and higher
CHAPTER 5. Cognitive detorioration Cognitive functioning is an important dimension to assess the level of frailty of an individual and is a marker that indicates caregiving
and services needs. An adequate level of cognitive functioning is necessary for the performance of the instrumental activities of daily
living, for example, shopping, cooking and managing medications; and is a necessary condition for the satisfactory accomplishment
of basic activities of daily life such as bathing and getting dressed; therefore, not surprisingly, severe cognitive deterioration is one of
the principal causes for the institutionalization of older persons in most countries in the world.
For the SABE Asuncion survey to evaluate older person’s cognitive status, the abbreviated version of the Mini-Mental State Examina-
tion test (MMSE), known as AMMSE which consists of 9 items (versus the 19 items of the MMSE), was used. A cut-off point of 12 was
identified in this analysis to separate a population with noticeable cognitive deterioration from the rest. As a consequence, individuals
with a score of 12 or less were considered to have cognitive deterioration.
When a target individual scored 12 or less in the AMMSE, the Pfeffer Functional Activities Questionnaire (PFAQ) was administered
to a companion or caregiver of the older adult. The objective of the PFAQ is to confirm that the level of cognitive decline is indeed
accompanied by limitations in the functional capacity of the individual, indicating thereby an advanced form of dementia or related
disorders. The cut-off point for the screening version of the PFAQ is 6, and any person scoring 6 or more is considered to be unable to
function independently. When a target person’s score in the AMMSE was 12 or less but the PFAQ score.
The results in the table 5.8 shows that there is a suspicion of the presence of cognitive impairment in 12.3% of the Paraguayan popula-
tion over 60 years of age, 8.9% of males and 14.5% of females, according to the results of the abbreviated Mini-Mental State Examina-
tion (AMMSE) and the Pfeffer test. A well-known trait, confirmed by this test, is that cognitive decline increases with increasing age.

SABE SURVEY Main Results JUNE 2018HEALTH, WELL-BEING AND AGING IN ASUNCION, PARAGUAY
166 167
CHAPTER 5. Table 5.8. Distribution of older population according to age group, by sex and cognitive impairment (%)
Cognitive detorioration Total
Age group
60-64 65-69 70-74 ≥75
MMSE*
Total 487 100,0% 147 100,0% 110 100,0% 84 100,0% 146 100,0%
≥ 13 386 79,3% 132 89,8% 97 88,2% 69 82,1% 88 60,3%
≤ 12 60 12,3% 10 6,8% 7 6,4% 9 10,7% 34 23,3%
Not specified 41 8,4% 5 3,4% 6 5,5% 6 7,1% 24 16,4%
Male 190 100,0% 69 100,0% 44 100,0% 37 100,0% 40 100,0%
≥ 13 157 82,6% 62 89,9% 39 88,6% 29 78,4% 27 67,5%
≤ 12 17 8,9% 4 5,8% 2 4,5% 5 13,5% 6 15,0%
Not specified 16 8,4% 3 4,3% 3 6,8% 3 8,1% 7 17,5%
Female 297 100,0% 78 100,0% 66 100,0% 47 100,0% 106 100,0%
≥ 13 229 77,1% 70 89,7% 58 87,9% 40 85,1% 61 57,5%
≤ 12 43 14,5% 6 7,7% 5 7,6% 4 8,5% 28 26,4%
Not specified 25 8,4% 2 2,6% 3 4,5% 3 6,4% 17 16,0%
Pfeffer
Total 487 100,0% 147 100,0% 110 100,0% 84 100,0% 146 100,0%
≥ 6 62 12,7% 4 2,7% 7 6,4% 7 8,3% 44 30,1%
≤ 5 15 3,1% 2 1,4% 3 2,7% 4 4,8% 6 4,1%
Not specified, passed to the filter**
410 84,2% 141 95,9% 100 90,9% 73 86,9% 96 65,8%
Male 190 100,0% 69 100,0% 44 100,0% 37 100,0% 40 100,0%
≥ 6 19 10,0% 1 1,4% 3 6,8% 3 8,1% 12 30,0%
≤ 5 3 1,6% 1 1,4% 1 2,3% 1 2,7% - -
Not specified, passed to the filter**
168 88,4% 67 97,1% 40 90,9% 33 89,2% 28 70,0%
Female 297 100,0% 78 100,0% 66 100,0% 47 100,0% 106 100,0%
≥ 6 43 14,5% 3 3,8% 4 6,1% 4 8,5% 32 30,2%
≤ 5 12 4,0% 1 1,3% 2 3,0% 3 6,4% 6 5,7%
Not specified, passed to the filter**
242 81,5% 74 94,9% 60 90,9% 40 85,1% 68 64,2%
Source: DGIS/STP. Survey on Health, Welfare, and Ageing (SABE), Paraguay 2017.*Mini Mental State Examination. **MMSE =13 and higher.
CHAPTER 5. Urinary incontinenceUrinary incontinence is a common, disturbing and potentially disabling problem. It is defined as the involuntary loss of urine to a suf-
ficient extent to constitute a social or health problem. Its prevalence increases with age and is higher among women.
In Paraguay, it is discovered that in Table 5.9, 18.5% of the population over 60 reported some degree of incontinence in the last 12
months (12.1% of men and 22.6% of women), while it was noted in the Table 5.10 that the prevalence of persistent incontinence in
the last month, manifested in multiple episodes per week (more than five days per month), is totally 44.5 % (17.8% said they experi-
enced between 5-14 days and 26.7% said more than 15 days). Among male population, 39.1% answered they experienced inconti-
nence more than 15 days, while among female was 22.4%.
Studies have shown that there are many factor that can increase the risk and, ageing is known to be linked to urinary incontinence.
Pregnancy, delivery, and number of children increase the risk in women, while the men who have prostate problems are also at
increased risk. Poor overall health also increases risk. Diabetes, stroke, high blood pressure and smoking are also linked; obesity
increases the risk of urinary incontinence, while losing weight can improve bladder function and lessen urinary incontinence symp-
toms (Urology Care Foundation). Further systematic investigation of this area will be beneficial.
Table 5.9. Distribution of older population according to age group, by sex and urinary incontinence (%).
Urinary incontinence Total
Age group
60-64 65-69 70-74 ≥75
Total 487 100,0% 147 100,0% 110 100,0% 84 100,0% 146 100,0%
Incontinent 90 18,5% 16 10,9% 16 14,5% 19 22,6% 39 26,7%
Not incontinent 390 80,1% 129 87,8% 92 83,6% 65 77,4% 104 71,2%
No response 7 1,4% 2 1,4% 2 1,8% - - 3 2,1%
Male 190 100,0% 69 100,0% 44 100,0% 37 100,0% 40 100,0%
Incontinent 23 12,1% 4 5,8% 3 6,8% 6 16,2% 10 25,0%
Not incontinent 164 86,3% 63 91,3% 40 90,9% 31 83,8% 30 75,0%
No response 3 1,6% 2 2,9% 1 2,3% - - - -
Female 297 100,0% 78 100,0% 66 100,0% 47 100,0% 106 100,0%
Incontinent 67 22,6% 12 15,4% 13 19,7% 13 27,7% 29 27,4%
Not incontinent 226 76,1% 66 84,6% 52 78,8% 34 72,3% 74 69,8%
No response 4 1,3% - - 1 1,5% - - 3 2,8%
Source: DGIS/STP. Survey on Health, Welfare, and Ageing (SABE), Paraguay 2017.

SABE SURVEY Main Results JUNE 2018HEALTH, WELL-BEING AND AGING IN ASUNCION, PARAGUAY
168 169
CHAPTER 5. Table 5.10. Distribution of older population with urinary incontinence according to age group, by sex and frequency of the incontinent event (%).
Frecuency TotalAge group
60-64 65-69 70-74 ≥75
Total 90 100,0% 16 100,0% 16 100,0% 19 100,0% 39 100,0%4 days or less 41 45,6% 9 56,3% 6 37,5% 10 52,6% 16 41,0%
Between 5 - 14 days 16 17,8% 3 18,8% 3 18,8% 2 10,5% 8 20,5%
15 days or more 24 26,7% 2 12,5% 5 31,3% 7 36,8% 10 25,6%
Don’t know 5 5,6% 1 6,3% 2 12,5% - - 2 5,1%
No response 4 4,4% 1 6,3% 0 0,0% - - 3 7,7%
Male 23 100,0% 4 100,0% 3 100,0% 6 100,0% 10 100,0%4 days or less 10 43,5% 2 50,0% - - 3 50,0% 5 50,0%
Between 5 - 14 days 1 4,3% 1 25,0% - - 0 0,0% - -
15 days or more 9 39,1% 1 25,0% 3 100,0% 3 50,0% 2 20,0%
Don’t know 1 4,3% - - - - - - 1 10,0%
No response 2 8,7% - - - - - - 2 20,0%
Female 67 100,0% 12 100,0% 13 100,0% 13 100,0% 29 100,0%4 days or less 31 46,3% 7 58,3% 6 46,2% 7 53,8% 11 37,9%
Between 5 - 14 days 15 22,4% 2 16,7% 3 23,1% 2 15,4% 8 27,6%
15 days or more 15 22,4% 1 8,3% 2 15,4% 4 30,8% 8 27,6%
Don’t know 4 6,0% 1 8,3% 2 15,4% - - 1 3,4%
No response 2 3,0% 1 8,3% - - - - 1 3,4%
Source: DGIS/STP. Survey on Health, Welfare, and Ageing (SABE), Paraguay 2017.
Table 5.11. Distribution of older population according to age group, by sex and fecal incontinence. (%)
Fecal incontinence TotalAge group
60-64 65-69 70-74 ≥75
Total 487 100,0% 147 100,0% 110 100,0% 84 100,0% 146 100,0%Yes 30 6,2% 3 2,0% 5 4,5% 9 10,7% 13 8,9%
No 447 91,8% 142 96,6% 102 92,7% 75 89,3% 128 87,7%
Don’t know 1 0,2% - - - - - - 1 0,7%
No response 9 1,8% 2 1,4% 3 2,7% - - 4 2,7%
Male 190 100,0% 69 100,0% 44 100,0% 37 100,0% 40 100,0%Yes 11 5,8% 1 1,4% 2 4,5% 4 10,8% 4 10,0%
No 175 92,1% 66 95,7% 41 93,2% 33 89,2% 35 87,5%
Don’t know 1 0,5% 0 0,0% 0 0,0% 0 0,0% 1 2,5%
No response 3 1,6% 2 2,9% 1 2,3% 0 0,0% 0 0,0%
Female 297 100,0% 78 100,0% 66 100,0% 47 100,0% 106 100,0%Yes 19 6,4% 2 2,6% 3 4,5% 5 10,6% 9 8,5%
No 272 91,6% 76 97,4% 61 92,4% 42 89,4% 93 87,7%
No response 6 2,0% - - 2 3,0% - - 4 3,8%
Source: DGIS/STP. Survey on Health, Welfare, and Ageing (SABE), Paraguay 2017.
CHAPTER 5. Sensory lossVisionAlthough general visual deterioration found to be increased with advance of ageing in both sexes, the complete loss of sight (blind)
was only reported at more than 75 years of age. Severe vision impairment (inability to read the fine print of the newspaper) is enough
to interfere with numerous activities of daily life, and impaired vision can lead to loss of self-esteem and functional independence.
In tables 5.12 and 5.13, the serious visual deficit to see from afar occurs in amost two out of ten people, with more people reported
to have difficulties seeing objects up close, especially in female (44.2%).
Table 5.12. Distribution of older population according to age group, by sex and condition to see from afar (%)
Condition to see from afar Total
Age group
60-64 65-69 70-74 ≥75
Total 487 100,0% 147 100,0% 110 100,0% 84 100,0% 146 100,0%
Excellent 50 10,3% 19 12,9% 13 11,8% 10 11,9% 8 5,5%
Very good 65 13,3% 24 16,3% 12 10,9% 15 17,9% 14 9,6%
Good 105 21,6% 20 13,6% 24 21,8% 20 23,8% 41 28,1%
Normal 153 31,4% 58 39,5% 36 32,7% 27 32,1% 32 21,9%
Bad 106 21,8% 24 16,3% 24 21,8% 12 14,3% 46 31,5%
Blind 5 1,0% 1 0,7% - - - - 4 2,7%
No response 3 0,6% 1 0,7% 1 0,9% - - 1 0,7%
Male 190 100,0% 69 100,0% 44 100,0% 37 100,0% 40 100,0%
Excellent 30 15,8% 12 17,4% 9 20,5% 4 10,8% 5 12,5%
Very good 27 14,2% 14 20,3% 4 9,1% 5 13,5% 4 10,0%
Good 45 23,7% 11 15,9% 9 20,5% 11 29,7% 14 35,0%
Normal 59 31,1% 28 40,6% 16 36,4% 10 27,0% 5 12,5%
Bad 27 14,2% 3 4,3% 5 11,4% 7 18,9% 12 30,0%
Blind - - - - - - - - - -
No response 2 1,1% 1 1,4% 1 2,3% - - - -
Female 297 100,0% 78 100,0% 66 100,0% 47 100,0% 106 100,0%
Excellent 20 6,7% 7 9,0% 4 6,1% 6 12,8% 3 2,8%
Very good 38 12,8% 10 12,8% 8 12,1% 10 21,3% 10 9,4%
Good 60 20,2% 9 11,5% 15 22,7% 9 19,1% 27 25,5%
Normal 94 31,6% 30 38,5% 20 30,3% 17 36,2% 27 25,5%
Bad 79 26,6% 21 26,9% 19 28,8% 5 10,6% 34 32,1%
Blind 5 1,7% 1 1,3% - - - - 4 3,8%
No response 1 0,3% - - - - - - 1 0,9%
Source: DGIS/STP. Survey on Health, Welfare, and Ageing (SABE), Paraguay 2017.
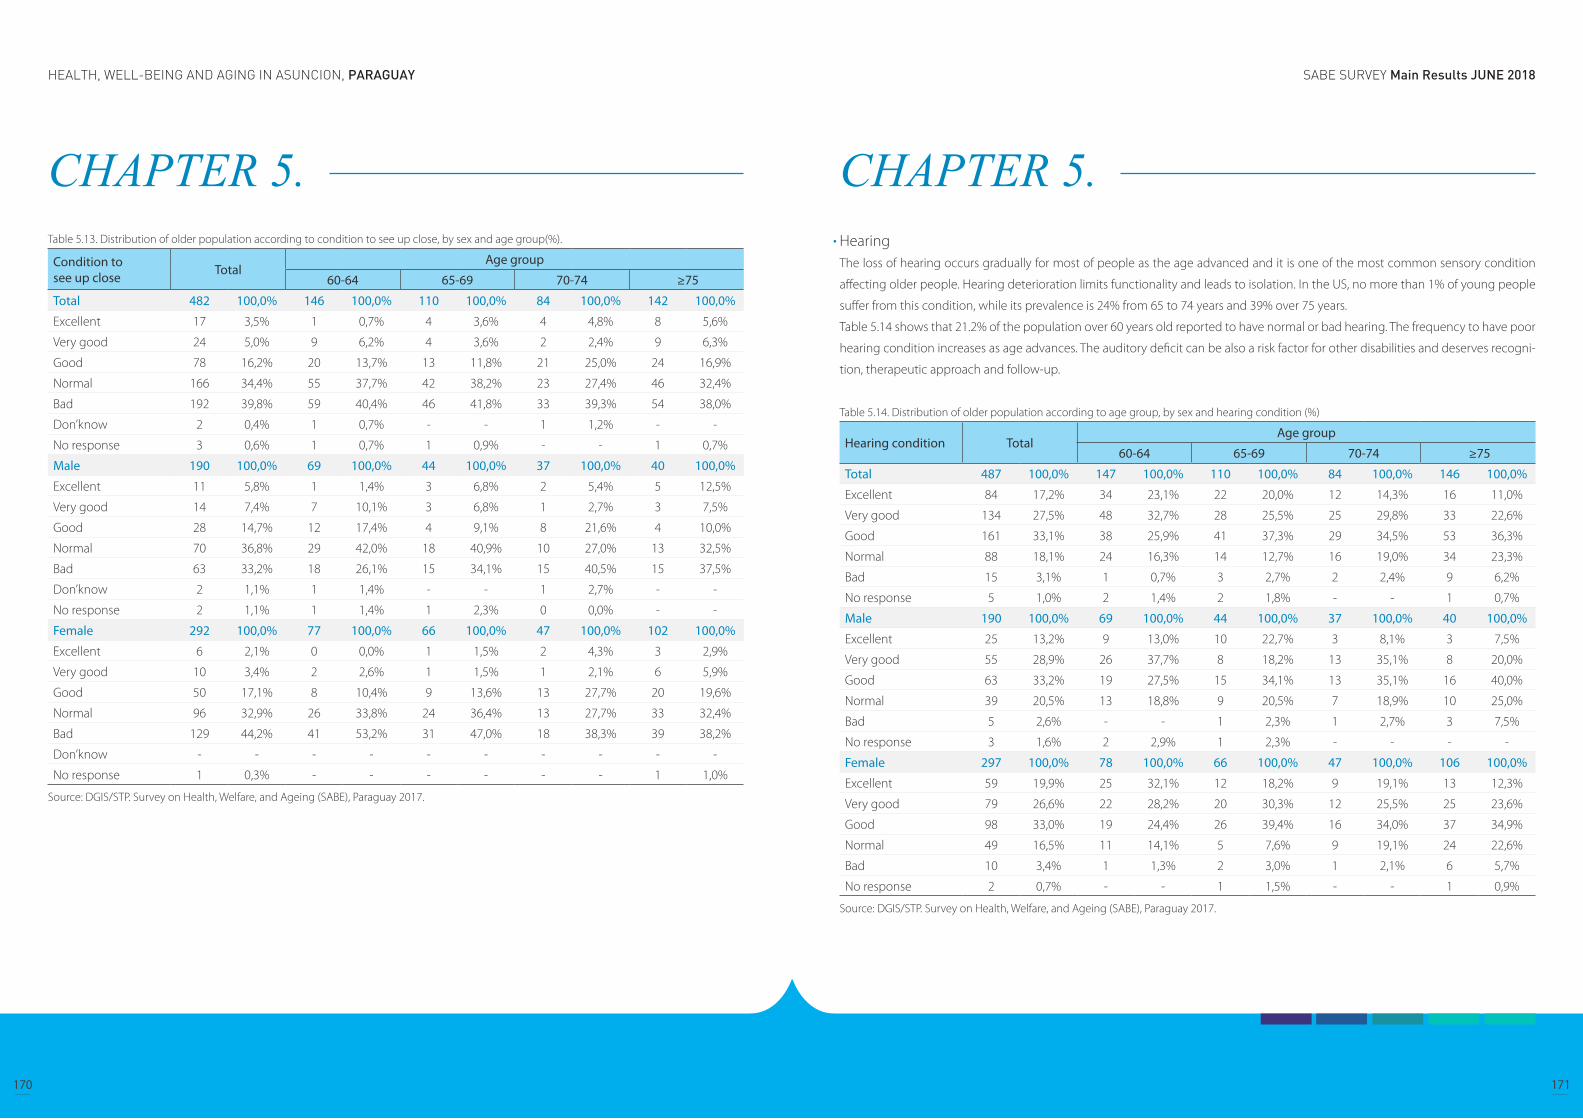
SABE SURVEY Main Results JUNE 2018HEALTH, WELL-BEING AND AGING IN ASUNCION, PARAGUAY
170 171
CHAPTER 5. Table 5.13. Distribution of older population according to condition to see up close, by sex and age group(%).
Condition to see up close Total
Age group
60-64 65-69 70-74 ≥75
Total 482 100,0% 146 100,0% 110 100,0% 84 100,0% 142 100,0%
Excellent 17 3,5% 1 0,7% 4 3,6% 4 4,8% 8 5,6%
Very good 24 5,0% 9 6,2% 4 3,6% 2 2,4% 9 6,3%
Good 78 16,2% 20 13,7% 13 11,8% 21 25,0% 24 16,9%
Normal 166 34,4% 55 37,7% 42 38,2% 23 27,4% 46 32,4%
Bad 192 39,8% 59 40,4% 46 41,8% 33 39,3% 54 38,0%
Don’know 2 0,4% 1 0,7% - - 1 1,2% - -
No response 3 0,6% 1 0,7% 1 0,9% - - 1 0,7%
Male 190 100,0% 69 100,0% 44 100,0% 37 100,0% 40 100,0%
Excellent 11 5,8% 1 1,4% 3 6,8% 2 5,4% 5 12,5%
Very good 14 7,4% 7 10,1% 3 6,8% 1 2,7% 3 7,5%
Good 28 14,7% 12 17,4% 4 9,1% 8 21,6% 4 10,0%
Normal 70 36,8% 29 42,0% 18 40,9% 10 27,0% 13 32,5%
Bad 63 33,2% 18 26,1% 15 34,1% 15 40,5% 15 37,5%
Don’know 2 1,1% 1 1,4% - - 1 2,7% - -
No response 2 1,1% 1 1,4% 1 2,3% 0 0,0% - -
Female 292 100,0% 77 100,0% 66 100,0% 47 100,0% 102 100,0%
Excellent 6 2,1% 0 0,0% 1 1,5% 2 4,3% 3 2,9%
Very good 10 3,4% 2 2,6% 1 1,5% 1 2,1% 6 5,9%
Good 50 17,1% 8 10,4% 9 13,6% 13 27,7% 20 19,6%
Normal 96 32,9% 26 33,8% 24 36,4% 13 27,7% 33 32,4%
Bad 129 44,2% 41 53,2% 31 47,0% 18 38,3% 39 38,2%
Don’know - - - - - - - - - -
No response 1 0,3% - - - - - - 1 1,0%
Source: DGIS/STP. Survey on Health, Welfare, and Ageing (SABE), Paraguay 2017.
CHAPTER 5. HearingThe loss of hearing occurs gradually for most of people as the age advanced and it is one of the most common sensory condition
affecting older people. Hearing deterioration limits functionality and leads to isolation. In the US, no more than 1% of young people
suffer from this condition, while its prevalence is 24% from 65 to 74 years and 39% over 75 years.
Table 5.14 shows that 21.2% of the population over 60 years old reported to have normal or bad hearing. The frequency to have poor
hearing condition increases as age advances. The auditory deficit can be also a risk factor for other disabilities and deserves recogni-
tion, therapeutic approach and follow-up.
Table 5.14. Distribution of older population according to age group, by sex and hearing condition (%)
Hearing condition TotalAge group
60-64 65-69 70-74 ≥75
Total 487 100,0% 147 100,0% 110 100,0% 84 100,0% 146 100,0%
Excellent 84 17,2% 34 23,1% 22 20,0% 12 14,3% 16 11,0%
Very good 134 27,5% 48 32,7% 28 25,5% 25 29,8% 33 22,6%
Good 161 33,1% 38 25,9% 41 37,3% 29 34,5% 53 36,3%
Normal 88 18,1% 24 16,3% 14 12,7% 16 19,0% 34 23,3%
Bad 15 3,1% 1 0,7% 3 2,7% 2 2,4% 9 6,2%
No response 5 1,0% 2 1,4% 2 1,8% - - 1 0,7%
Male 190 100,0% 69 100,0% 44 100,0% 37 100,0% 40 100,0%
Excellent 25 13,2% 9 13,0% 10 22,7% 3 8,1% 3 7,5%
Very good 55 28,9% 26 37,7% 8 18,2% 13 35,1% 8 20,0%
Good 63 33,2% 19 27,5% 15 34,1% 13 35,1% 16 40,0%
Normal 39 20,5% 13 18,8% 9 20,5% 7 18,9% 10 25,0%
Bad 5 2,6% - - 1 2,3% 1 2,7% 3 7,5%
No response 3 1,6% 2 2,9% 1 2,3% - - - -
Female 297 100,0% 78 100,0% 66 100,0% 47 100,0% 106 100,0%
Excellent 59 19,9% 25 32,1% 12 18,2% 9 19,1% 13 12,3%
Very good 79 26,6% 22 28,2% 20 30,3% 12 25,5% 25 23,6%
Good 98 33,0% 19 24,4% 26 39,4% 16 34,0% 37 34,9%
Normal 49 16,5% 11 14,1% 5 7,6% 9 19,1% 24 22,6%
Bad 10 3,4% 1 1,3% 2 3,0% 1 2,1% 6 5,7%
No response 2 0,7% - - 1 1,5% - - 1 0,9%
Source: DGIS/STP. Survey on Health, Welfare, and Ageing (SABE), Paraguay 2017.
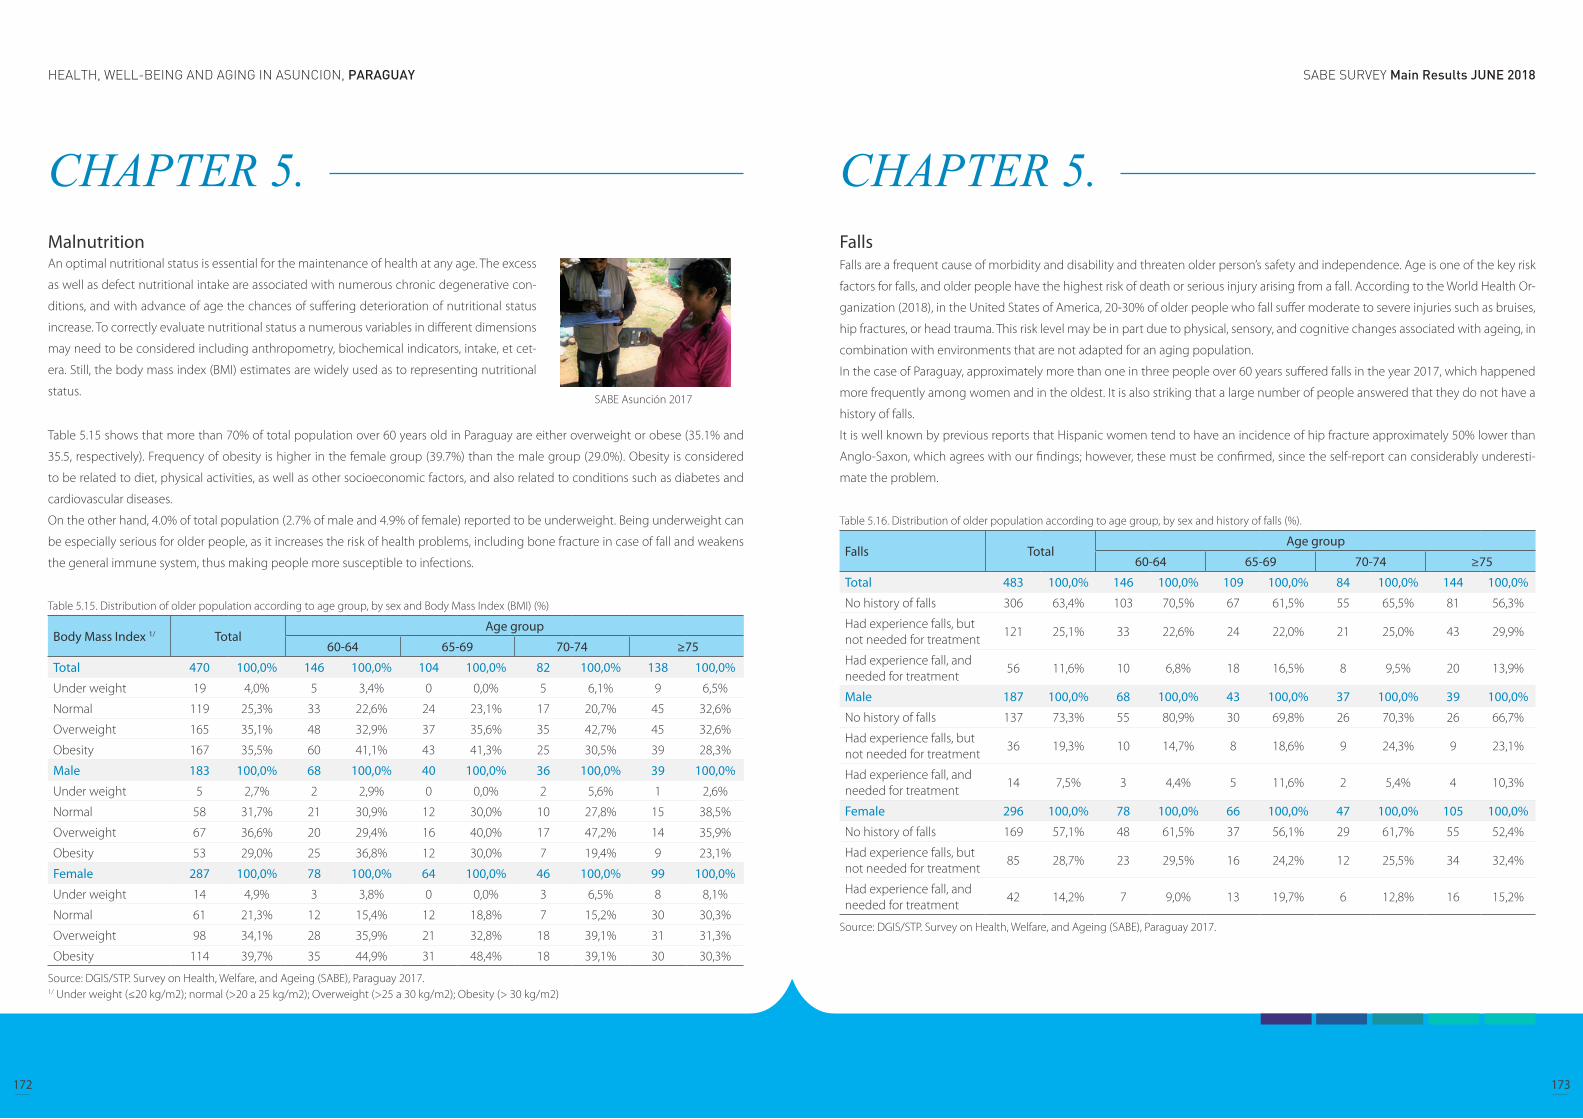
SABE SURVEY Main Results JUNE 2018HEALTH, WELL-BEING AND AGING IN ASUNCION, PARAGUAY
172 173
CHAPTER 5. Malnutrition
Table 5.15 shows that more than 70% of total population over 60 years old in Paraguay are either overweight or obese (35.1% and
35.5, respectively). Frequency of obesity is higher in the female group (39.7%) than the male group (29.0%). Obesity is considered
to be related to diet, physical activities, as well as other socioeconomic factors, and also related to conditions such as diabetes and
cardiovascular diseases.
On the other hand, 4.0% of total population (2.7% of male and 4.9% of female) reported to be underweight. Being underweight can
be especially serious for older people, as it increases the risk of health problems, including bone fracture in case of fall and weakens
the general immune system, thus making people more susceptible to infections.
Table 5.15. Distribution of older population according to age group, by sex and Body Mass Index (BMI) (%)
Body Mass Index 1/ TotalAge group
60-64 65-69 70-74 ≥75
Total 470 100,0% 146 100,0% 104 100,0% 82 100,0% 138 100,0%
Under weight 19 4,0% 5 3,4% 0 0,0% 5 6,1% 9 6,5%
Normal 119 25,3% 33 22,6% 24 23,1% 17 20,7% 45 32,6%
Overweight 165 35,1% 48 32,9% 37 35,6% 35 42,7% 45 32,6%
Obesity 167 35,5% 60 41,1% 43 41,3% 25 30,5% 39 28,3%
Male 183 100,0% 68 100,0% 40 100,0% 36 100,0% 39 100,0%
Under weight 5 2,7% 2 2,9% 0 0,0% 2 5,6% 1 2,6%
Normal 58 31,7% 21 30,9% 12 30,0% 10 27,8% 15 38,5%
Overweight 67 36,6% 20 29,4% 16 40,0% 17 47,2% 14 35,9%
Obesity 53 29,0% 25 36,8% 12 30,0% 7 19,4% 9 23,1%
Female 287 100,0% 78 100,0% 64 100,0% 46 100,0% 99 100,0%
Under weight 14 4,9% 3 3,8% 0 0,0% 3 6,5% 8 8,1%
Normal 61 21,3% 12 15,4% 12 18,8% 7 15,2% 30 30,3%
Overweight 98 34,1% 28 35,9% 21 32,8% 18 39,1% 31 31,3%
Obesity 114 39,7% 35 44,9% 31 48,4% 18 39,1% 30 30,3%
Source: DGIS/STP. Survey on Health, Welfare, and Ageing (SABE), Paraguay 2017.1/ Under weight (≤20 kg/m2); normal (>20 a 25 kg/m2); Overweight (>25 a 30 kg/m2); Obesity (> 30 kg/m2)
An optimal nutritional status is essential for the maintenance of health at any age. The excess
as well as defect nutritional intake are associated with numerous chronic degenerative con-
ditions, and with advance of age the chances of suffering deterioration of nutritional status
increase. To correctly evaluate nutritional status a numerous variables in different dimensions
may need to be considered including anthropometry, biochemical indicators, intake, et cet-
era. Still, the body mass index (BMI) estimates are widely used as to representing nutritional
status.SABE Asunción 2017
CHAPTER 5. FallsFalls are a frequent cause of morbidity and disability and threaten older person’s safety and independence. Age is one of the key risk
factors for falls, and older people have the highest risk of death or serious injury arising from a fall. According to the World Health Or-
ganization (2018), in the United States of America, 20-30% of older people who fall suffer moderate to severe injuries such as bruises,
hip fractures, or head trauma. This risk level may be in part due to physical, sensory, and cognitive changes associated with ageing, in
combination with environments that are not adapted for an aging population.
In the case of Paraguay, approximately more than one in three people over 60 years suffered falls in the year 2017, which happened
more frequently among women and in the oldest. It is also striking that a large number of people answered that they do not have a
history of falls.
It is well known by previous reports that Hispanic women tend to have an incidence of hip fracture approximately 50% lower than
Anglo-Saxon, which agrees with our findings; however, these must be confirmed, since the self-report can considerably underesti-
mate the problem.
Table 5.16. Distribution of older population according to age group, by sex and history of falls (%).
Falls TotalAge group
60-64 65-69 70-74 ≥75
Total 483 100,0% 146 100,0% 109 100,0% 84 100,0% 144 100,0%
No history of falls 306 63,4% 103 70,5% 67 61,5% 55 65,5% 81 56,3%
Had experience falls, but not needed for treatment
121 25,1% 33 22,6% 24 22,0% 21 25,0% 43 29,9%
Had experience fall, and needed for treatment
56 11,6% 10 6,8% 18 16,5% 8 9,5% 20 13,9%
Male 187 100,0% 68 100,0% 43 100,0% 37 100,0% 39 100,0%
No history of falls 137 73,3% 55 80,9% 30 69,8% 26 70,3% 26 66,7%
Had experience falls, but not needed for treatment
36 19,3% 10 14,7% 8 18,6% 9 24,3% 9 23,1%
Had experience fall, and needed for treatment
14 7,5% 3 4,4% 5 11,6% 2 5,4% 4 10,3%
Female 296 100,0% 78 100,0% 66 100,0% 47 100,0% 105 100,0%
No history of falls 169 57,1% 48 61,5% 37 56,1% 29 61,7% 55 52,4%
Had experience falls, but not needed for treatment
85 28,7% 23 29,5% 16 24,2% 12 25,5% 34 32,4%
Had experience fall, and needed for treatment
42 14,2% 7 9,0% 13 19,7% 6 12,8% 16 15,2%
Source: DGIS/STP. Survey on Health, Welfare, and Ageing (SABE), Paraguay 2017.
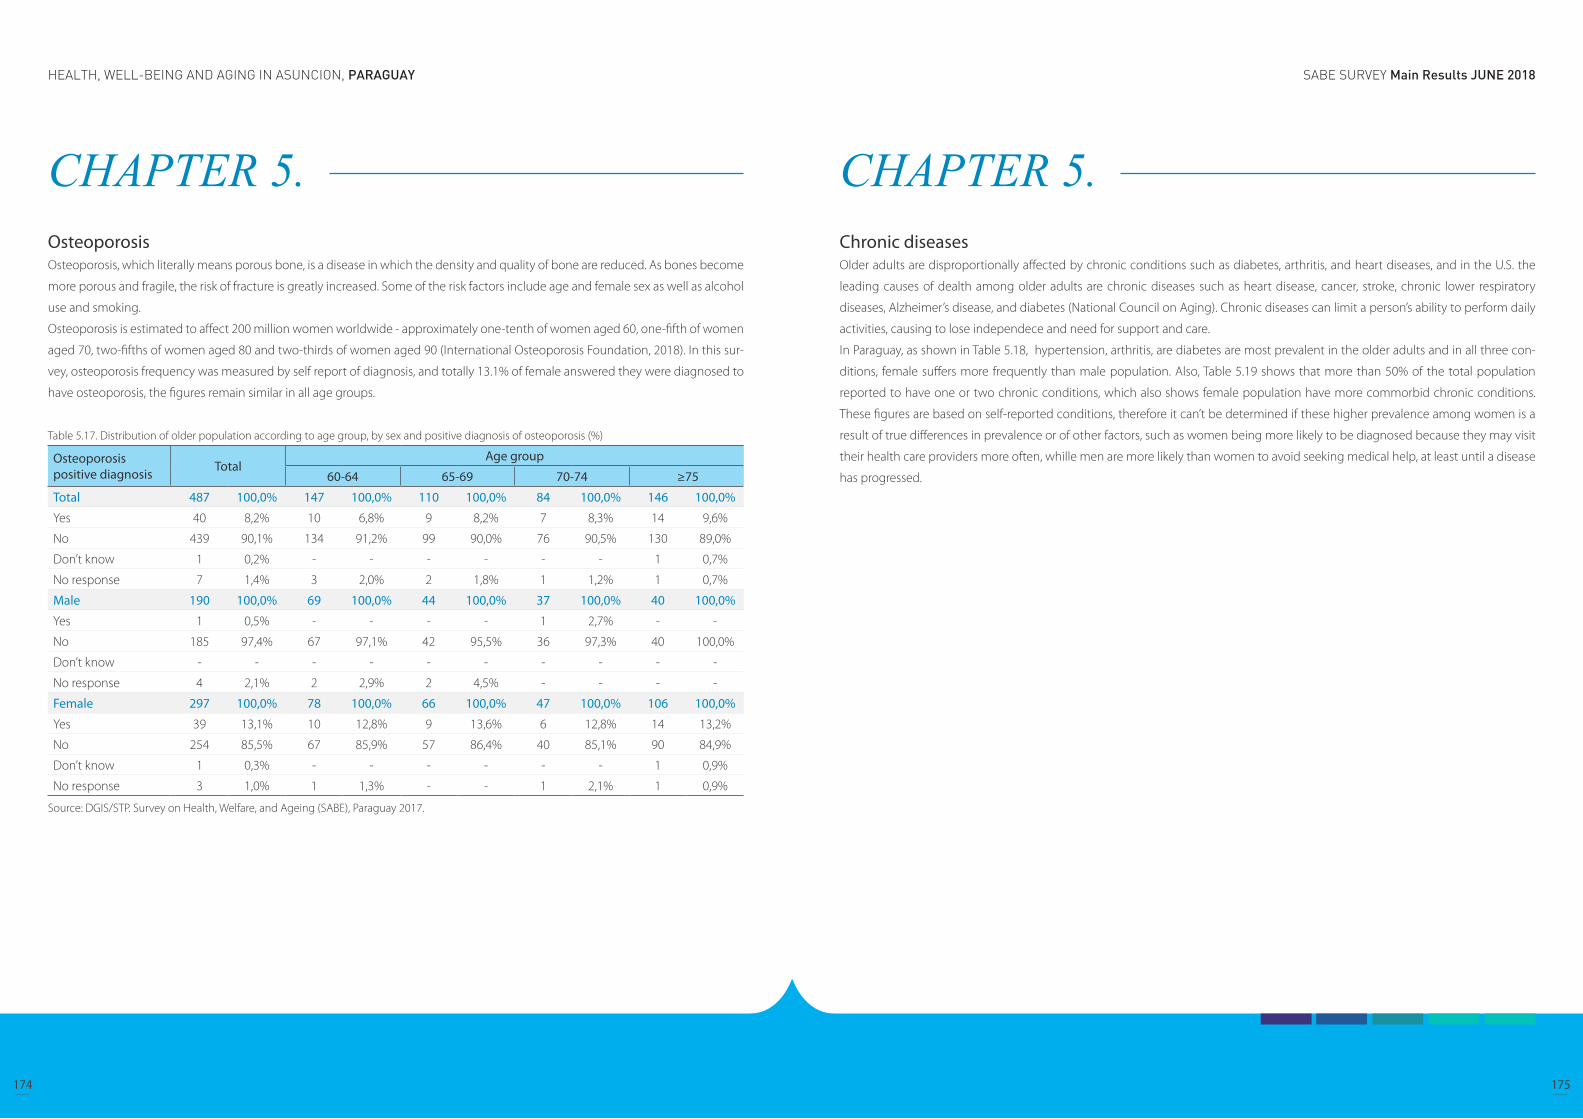
SABE SURVEY Main Results JUNE 2018HEALTH, WELL-BEING AND AGING IN ASUNCION, PARAGUAY
174 175
CHAPTER 5. OsteoporosisOsteoporosis, which literally means porous bone, is a disease in which the density and quality of bone are reduced. As bones become
more porous and fragile, the risk of fracture is greatly increased. Some of the risk factors include age and female sex as well as alcohol
use and smoking.
Osteoporosis is estimated to affect 200 million women worldwide - approximately one-tenth of women aged 60, one-fifth of women
aged 70, two-fifths of women aged 80 and two-thirds of women aged 90 (International Osteoporosis Foundation, 2018). In this sur-
vey, osteoporosis frequency was measured by self report of diagnosis, and totally 13.1% of female answered they were diagnosed to
have osteoporosis, the figures remain similar in all age groups.
Table 5.17. Distribution of older population according to age group, by sex and positive diagnosis of osteoporosis (%)
Osteoporosis positive diagnosis Total
Age group
60-64 65-69 70-74 ≥75
Total 487 100,0% 147 100,0% 110 100,0% 84 100,0% 146 100,0%
Yes 40 8,2% 10 6,8% 9 8,2% 7 8,3% 14 9,6%
No 439 90,1% 134 91,2% 99 90,0% 76 90,5% 130 89,0%
Don’t know 1 0,2% - - - - - - 1 0,7%
No response 7 1,4% 3 2,0% 2 1,8% 1 1,2% 1 0,7%
Male 190 100,0% 69 100,0% 44 100,0% 37 100,0% 40 100,0%
Yes 1 0,5% - - - - 1 2,7% - -
No 185 97,4% 67 97,1% 42 95,5% 36 97,3% 40 100,0%
Don’t know - - - - - - - - - -
No response 4 2,1% 2 2,9% 2 4,5% - - - -
Female 297 100,0% 78 100,0% 66 100,0% 47 100,0% 106 100,0%
Yes 39 13,1% 10 12,8% 9 13,6% 6 12,8% 14 13,2%
No 254 85,5% 67 85,9% 57 86,4% 40 85,1% 90 84,9%
Don’t know 1 0,3% - - - - - - 1 0,9%
No response 3 1,0% 1 1,3% - - 1 2,1% 1 0,9%
Source: DGIS/STP. Survey on Health, Welfare, and Ageing (SABE), Paraguay 2017.
CHAPTER 5. Chronic diseasesOlder adults are disproportionally affected by chronic conditions such as diabetes, arthritis, and heart diseases, and in the U.S. the
leading causes of dealth among older adults are chronic diseases such as heart disease, cancer, stroke, chronic lower respiratory
diseases, Alzheimer’s disease, and diabetes (National Council on Aging). Chronic diseases can limit a person’s ability to perform daily
activities, causing to lose independece and need for support and care.
In Paraguay, as shown in Table 5.18, hypertension, arthritis, are diabetes are most prevalent in the older adults and in all three con-
ditions, female suffers more frequently than male population. Also, Table 5.19 shows that more than 50% of the total population
reported to have one or two chronic conditions, which also shows female population have more commorbid chronic conditions.
These figures are based on self-reported conditions, therefore it can’t be determined if these higher prevalence among women is a
result of true differences in prevalence or of other factors, such as women being more likely to be diagnosed because they may visit
their health care providers more often, whille men are more likely than women to avoid seeking medical help, at least until a disease
has progressed.
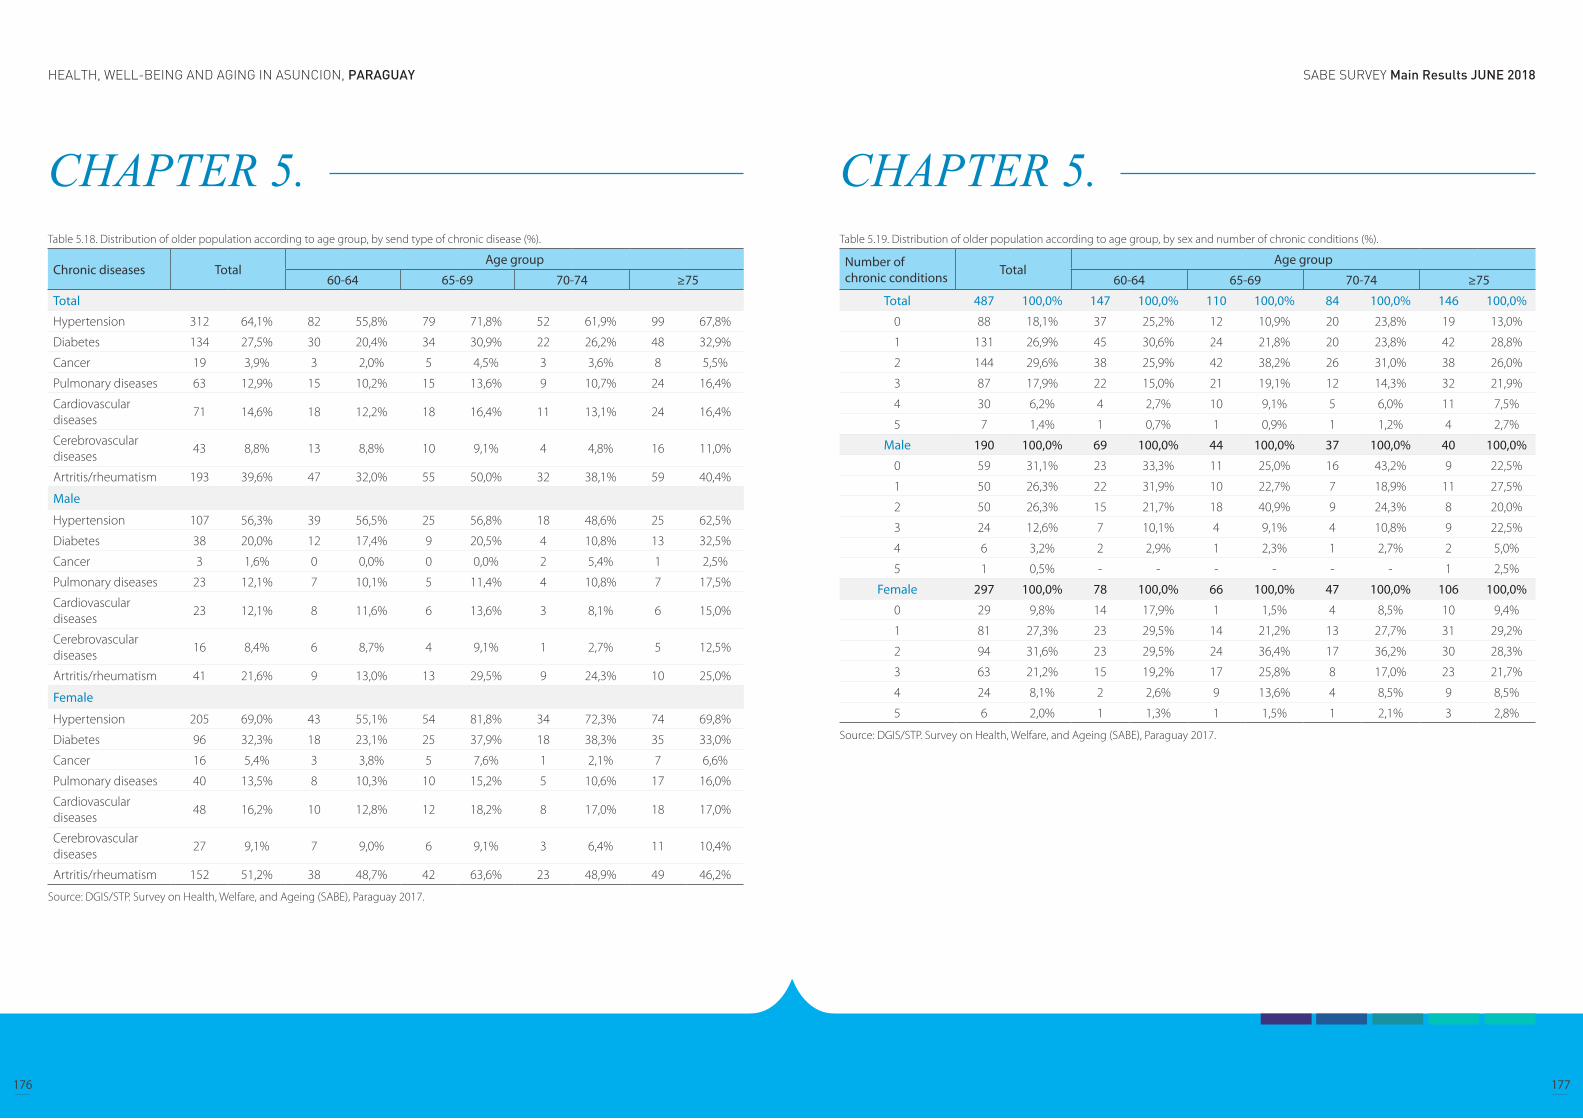
SABE SURVEY Main Results JUNE 2018HEALTH, WELL-BEING AND AGING IN ASUNCION, PARAGUAY
176 177
CHAPTER 5. Table 5.18. Distribution of older population according to age group, by send type of chronic disease (%).
Chronic diseases TotalAge group
60-64 65-69 70-74 ≥75
Total
Hypertension 312 64,1% 82 55,8% 79 71,8% 52 61,9% 99 67,8%
Diabetes 134 27,5% 30 20,4% 34 30,9% 22 26,2% 48 32,9%
Cancer 19 3,9% 3 2,0% 5 4,5% 3 3,6% 8 5,5%
Pulmonary diseases 63 12,9% 15 10,2% 15 13,6% 9 10,7% 24 16,4%
Cardiovascular diseases
71 14,6% 18 12,2% 18 16,4% 11 13,1% 24 16,4%
Cerebrovascular diseases
43 8,8% 13 8,8% 10 9,1% 4 4,8% 16 11,0%
Artritis/rheumatism 193 39,6% 47 32,0% 55 50,0% 32 38,1% 59 40,4%
Male
Hypertension 107 56,3% 39 56,5% 25 56,8% 18 48,6% 25 62,5%
Diabetes 38 20,0% 12 17,4% 9 20,5% 4 10,8% 13 32,5%
Cancer 3 1,6% 0 0,0% 0 0,0% 2 5,4% 1 2,5%
Pulmonary diseases 23 12,1% 7 10,1% 5 11,4% 4 10,8% 7 17,5%
Cardiovascular diseases
23 12,1% 8 11,6% 6 13,6% 3 8,1% 6 15,0%
Cerebrovascular diseases
16 8,4% 6 8,7% 4 9,1% 1 2,7% 5 12,5%
Artritis/rheumatism 41 21,6% 9 13,0% 13 29,5% 9 24,3% 10 25,0%
Female
Hypertension 205 69,0% 43 55,1% 54 81,8% 34 72,3% 74 69,8%
Diabetes 96 32,3% 18 23,1% 25 37,9% 18 38,3% 35 33,0%
Cancer 16 5,4% 3 3,8% 5 7,6% 1 2,1% 7 6,6%
Pulmonary diseases 40 13,5% 8 10,3% 10 15,2% 5 10,6% 17 16,0%
Cardiovascular diseases
48 16,2% 10 12,8% 12 18,2% 8 17,0% 18 17,0%
Cerebrovascular diseases
27 9,1% 7 9,0% 6 9,1% 3 6,4% 11 10,4%
Artritis/rheumatism 152 51,2% 38 48,7% 42 63,6% 23 48,9% 49 46,2%
Source: DGIS/STP. Survey on Health, Welfare, and Ageing (SABE), Paraguay 2017.
CHAPTER 5. Table 5.19. Distribution of older population according to age group, by sex and number of chronic conditions (%).
Number of chronic conditions Total
Age group
60-64 65-69 70-74 ≥75
Total 487 100,0% 147 100,0% 110 100,0% 84 100,0% 146 100,0%
0 88 18,1% 37 25,2% 12 10,9% 20 23,8% 19 13,0%
1 131 26,9% 45 30,6% 24 21,8% 20 23,8% 42 28,8%
2 144 29,6% 38 25,9% 42 38,2% 26 31,0% 38 26,0%
3 87 17,9% 22 15,0% 21 19,1% 12 14,3% 32 21,9%
4 30 6,2% 4 2,7% 10 9,1% 5 6,0% 11 7,5%
5 7 1,4% 1 0,7% 1 0,9% 1 1,2% 4 2,7%
Male 190 100,0% 69 100,0% 44 100,0% 37 100,0% 40 100,0%
0 59 31,1% 23 33,3% 11 25,0% 16 43,2% 9 22,5%
1 50 26,3% 22 31,9% 10 22,7% 7 18,9% 11 27,5%
2 50 26,3% 15 21,7% 18 40,9% 9 24,3% 8 20,0%
3 24 12,6% 7 10,1% 4 9,1% 4 10,8% 9 22,5%
4 6 3,2% 2 2,9% 1 2,3% 1 2,7% 2 5,0%
5 1 0,5% - - - - - - 1 2,5%
Female 297 100,0% 78 100,0% 66 100,0% 47 100,0% 106 100,0%
0 29 9,8% 14 17,9% 1 1,5% 4 8,5% 10 9,4%
1 81 27,3% 23 29,5% 14 21,2% 13 27,7% 31 29,2%
2 94 31,6% 23 29,5% 24 36,4% 17 36,2% 30 28,3%
3 63 21,2% 15 19,2% 17 25,8% 8 17,0% 23 21,7%
4 24 8,1% 2 2,6% 9 13,6% 4 8,5% 9 8,5%
5 6 2,0% 1 1,3% 1 1,5% 1 2,1% 3 2,8%
Source: DGIS/STP. Survey on Health, Welfare, and Ageing (SABE), Paraguay 2017.
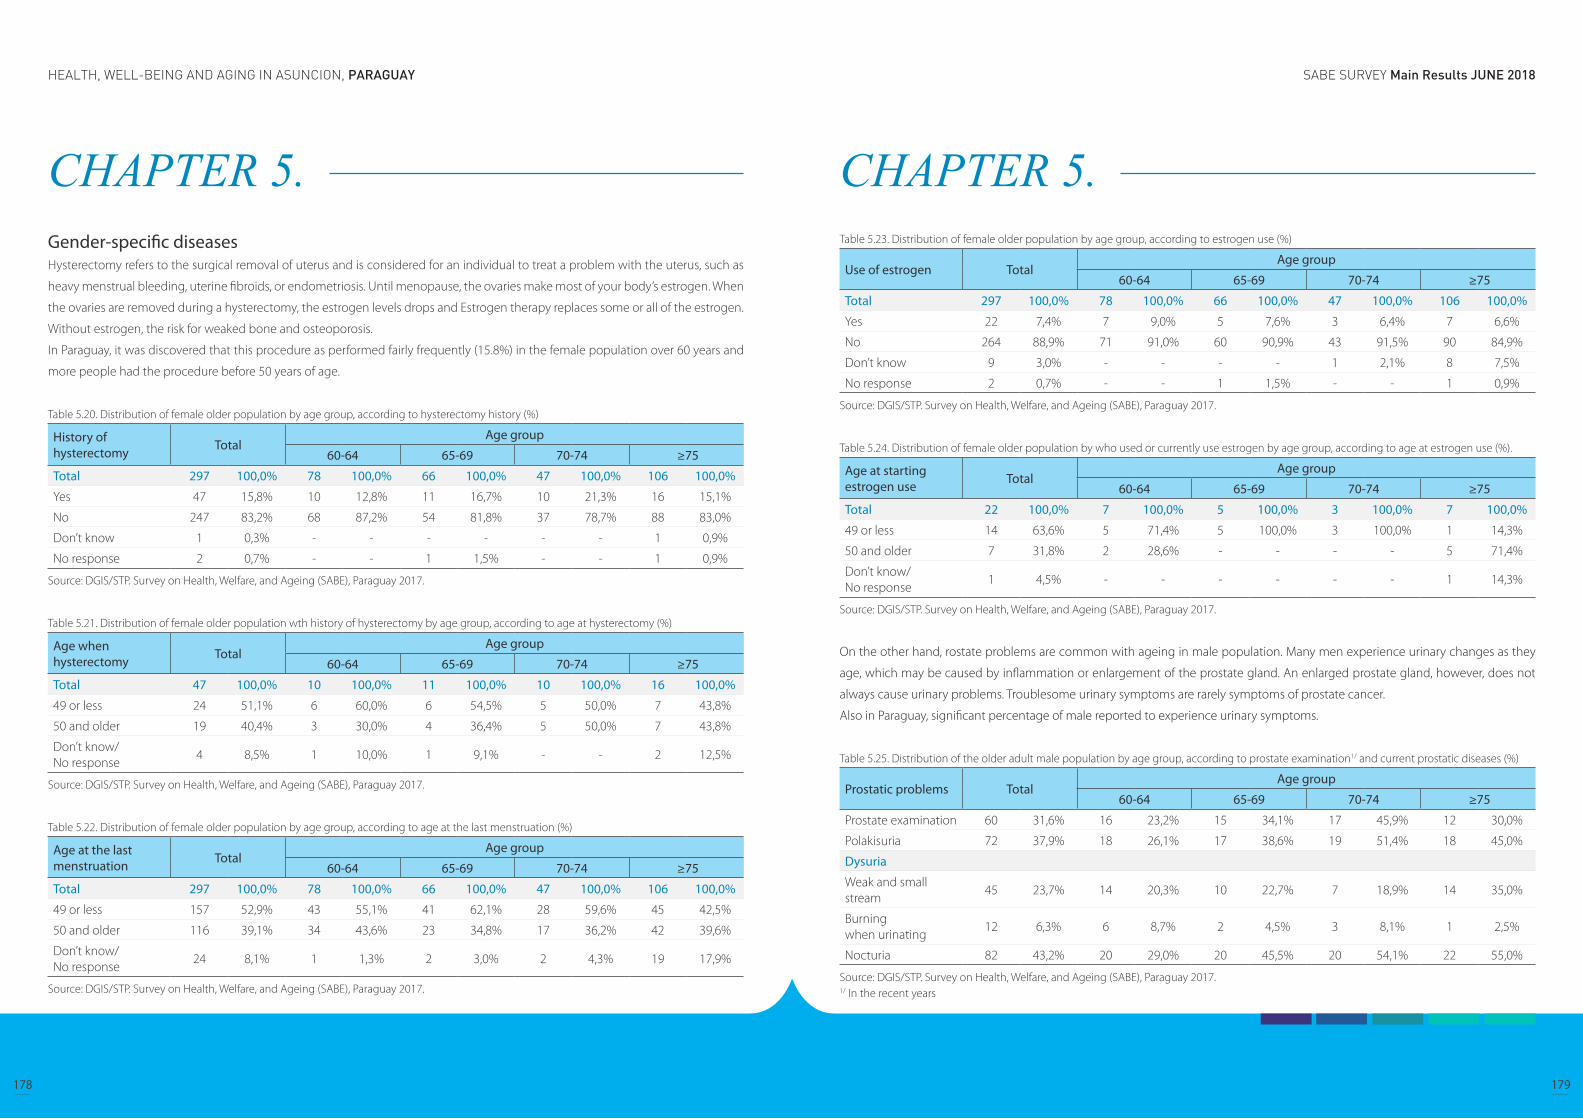
SABE SURVEY Main Results JUNE 2018HEALTH, WELL-BEING AND AGING IN ASUNCION, PARAGUAY
178 179
CHAPTER 5. Gender-specific diseases Hysterectomy refers to the surgical removal of uterus and is considered for an individual to treat a problem with the uterus, such as
heavy menstrual bleeding, uterine fibroids, or endometriosis. Until menopause, the ovaries make most of your body’s estrogen. When
the ovaries are removed during a hysterectomy, the estrogen levels drops and Estrogen therapy replaces some or all of the estrogen.
Without estrogen, the risk for weaked bone and osteoporosis.
In Paraguay, it was discovered that this procedure as performed fairly frequently (15.8%) in the female population over 60 years and
more people had the procedure before 50 years of age.
Table 5.20. Distribution of female older population by age group, according to hysterectomy history (%)
History of hysterectomy Total
Age group
60-64 65-69 70-74 ≥75
Total 297 100,0% 78 100,0% 66 100,0% 47 100,0% 106 100,0%
Yes 47 15,8% 10 12,8% 11 16,7% 10 21,3% 16 15,1%
No 247 83,2% 68 87,2% 54 81,8% 37 78,7% 88 83,0%
Don’t know 1 0,3% - - - - - - 1 0,9%
No response 2 0,7% - - 1 1,5% - - 1 0,9%
Source: DGIS/STP. Survey on Health, Welfare, and Ageing (SABE), Paraguay 2017.
Table 5.21. Distribution of female older population wth history of hysterectomy by age group, according to age at hysterectomy (%)
Age when hysterectomy Total
Age group
60-64 65-69 70-74 ≥75
Total 47 100,0% 10 100,0% 11 100,0% 10 100,0% 16 100,0%
49 or less 24 51,1% 6 60,0% 6 54,5% 5 50,0% 7 43,8%
50 and older 19 40,4% 3 30,0% 4 36,4% 5 50,0% 7 43,8%
Don’t know/No response
4 8,5% 1 10,0% 1 9,1% - - 2 12,5%
Source: DGIS/STP. Survey on Health, Welfare, and Ageing (SABE), Paraguay 2017.
Table 5.22. Distribution of female older population by age group, according to age at the last menstruation (%)
Age at the last menstruation Total
Age group
60-64 65-69 70-74 ≥75
Total 297 100,0% 78 100,0% 66 100,0% 47 100,0% 106 100,0%
49 or less 157 52,9% 43 55,1% 41 62,1% 28 59,6% 45 42,5%
50 and older 116 39,1% 34 43,6% 23 34,8% 17 36,2% 42 39,6%
Don’t know/No response
24 8,1% 1 1,3% 2 3,0% 2 4,3% 19 17,9%
Source: DGIS/STP. Survey on Health, Welfare, and Ageing (SABE), Paraguay 2017.
CHAPTER 5. Table 5.23. Distribution of female older population by age group, according to estrogen use (%)
Use of estrogen TotalAge group
60-64 65-69 70-74 ≥75
Total 297 100,0% 78 100,0% 66 100,0% 47 100,0% 106 100,0%
Yes 22 7,4% 7 9,0% 5 7,6% 3 6,4% 7 6,6%
No 264 88,9% 71 91,0% 60 90,9% 43 91,5% 90 84,9%
Don’t know 9 3,0% - - - - 1 2,1% 8 7,5%
No response 2 0,7% - - 1 1,5% - - 1 0,9%
Source: DGIS/STP. Survey on Health, Welfare, and Ageing (SABE), Paraguay 2017.
Table 5.24. Distribution of female older population by who used or currently use estrogen by age group, according to age at estrogen use (%).
Age at starting estrogen use Total
Age group
60-64 65-69 70-74 ≥75
Total 22 100,0% 7 100,0% 5 100,0% 3 100,0% 7 100,0%
49 or less 14 63,6% 5 71,4% 5 100,0% 3 100,0% 1 14,3%
50 and older 7 31,8% 2 28,6% - - - - 5 71,4%
Don’t know/No response
1 4,5% - - - - - - 1 14,3%
Source: DGIS/STP. Survey on Health, Welfare, and Ageing (SABE), Paraguay 2017.
On the other hand, rostate problems are common with ageing in male population. Many men experience urinary changes as they
age, which may be caused by inflammation or enlargement of the prostate gland. An enlarged prostate gland, however, does not
always cause urinary problems. Troublesome urinary symptoms are rarely symptoms of prostate cancer.
Also in Paraguay, significant percentage of male reported to experience urinary symptoms.
Table 5.25. Distribution of the older adult male population by age group, according to prostate examination1/ and current prostatic diseases (%)
Prostatic problems TotalAge group
60-64 65-69 70-74 ≥75
Prostate examination 60 31,6% 16 23,2% 15 34,1% 17 45,9% 12 30,0%
Polakisuria 72 37,9% 18 26,1% 17 38,6% 19 51,4% 18 45,0%
Dysuria
Weak and small stream
45 23,7% 14 20,3% 10 22,7% 7 18,9% 14 35,0%
Burning when urinating
12 6,3% 6 8,7% 2 4,5% 3 8,1% 1 2,5%
Nocturia 82 43,2% 20 29,0% 20 45,5% 20 54,1% 22 55,0%
Source: DGIS/STP. Survey on Health, Welfare, and Ageing (SABE), Paraguay 2017.1/ In the recent years
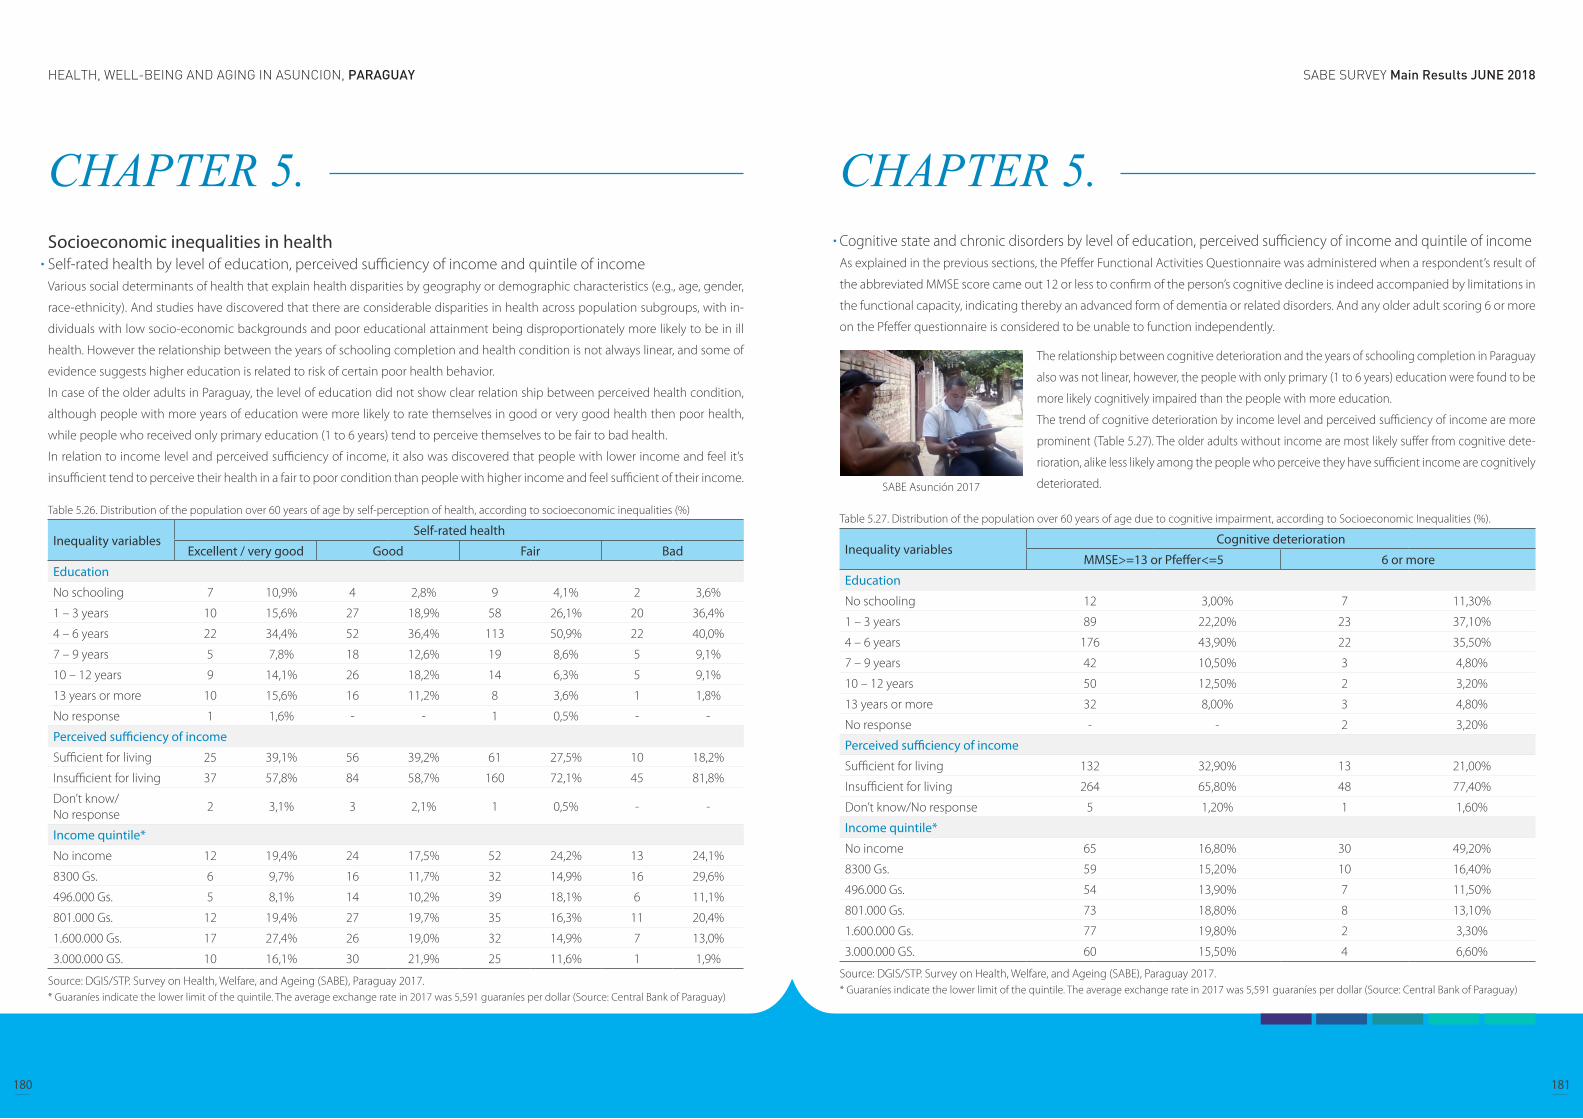
SABE SURVEY Main Results JUNE 2018HEALTH, WELL-BEING AND AGING IN ASUNCION, PARAGUAY
180 181
CHAPTER 5. Socioeconomic inequalities in healthSelf-rated health by level of education, perceived sufficiency of income and quintile of incomeVarious social determinants of health that explain health disparities by geography or demographic characteristics (e.g., age, gender,
race-ethnicity). And studies have discovered that there are considerable disparities in health across population subgroups, with in-
dividuals with low socio-economic backgrounds and poor educational attainment being disproportionately more likely to be in ill
health. However the relationship between the years of schooling completion and health condition is not always linear, and some of
evidence suggests higher education is related to risk of certain poor health behavior.
In case of the older adults in Paraguay, the level of education did not show clear relation ship between perceived health condition,
although people with more years of education were more likely to rate themselves in good or very good health then poor health,
while people who received only primary education (1 to 6 years) tend to perceive themselves to be fair to bad health.
In relation to income level and perceived sufficiency of income, it also was discovered that people with lower income and feel it’s
insufficient tend to perceive their health in a fair to poor condition than people with higher income and feel sufficient of their income.
Table 5.26. Distribution of the population over 60 years of age by self-perception of health, according to socioeconomic inequalities (%)
Inequality variablesSelf-rated health
Excellent / very good Good Fair Bad
Education
No schooling 7 10,9% 4 2,8% 9 4,1% 2 3,6%
1 – 3 years 10 15,6% 27 18,9% 58 26,1% 20 36,4%
4 – 6 years 22 34,4% 52 36,4% 113 50,9% 22 40,0%
7 – 9 years 5 7,8% 18 12,6% 19 8,6% 5 9,1%
10 – 12 years 9 14,1% 26 18,2% 14 6,3% 5 9,1%
13 years or more 10 15,6% 16 11,2% 8 3,6% 1 1,8%
No response 1 1,6% - - 1 0,5% - -
Perceived sufficiency of income
Sufficient for living 25 39,1% 56 39,2% 61 27,5% 10 18,2%
Insufficient for living 37 57,8% 84 58,7% 160 72,1% 45 81,8%
Don’t know/No response
2 3,1% 3 2,1% 1 0,5% - -
Income quintile*
No income 12 19,4% 24 17,5% 52 24,2% 13 24,1%
8300 Gs. 6 9,7% 16 11,7% 32 14,9% 16 29,6%
496.000 Gs. 5 8,1% 14 10,2% 39 18,1% 6 11,1%
801.000 Gs. 12 19,4% 27 19,7% 35 16,3% 11 20,4%
1.600.000 Gs. 17 27,4% 26 19,0% 32 14,9% 7 13,0%
3.000.000 GS. 10 16,1% 30 21,9% 25 11,6% 1 1,9%
Source: DGIS/STP. Survey on Health, Welfare, and Ageing (SABE), Paraguay 2017.* Guaraníes indicate the lower limit of the quintile. The average exchange rate in 2017 was 5,591 guaraníes per dollar (Source: Central Bank of Paraguay)
CHAPTER 5. Cognitive state and chronic disorders by level of education, perceived sufficiency of income and quintile of incomeAs explained in the previous sections, the Pfeffer Functional Activities Questionnaire was administered when a respondent’s result of
the abbreviated MMSE score came out 12 or less to confirm of the person’s cognitive decline is indeed accompanied by limitations in
the functional capacity, indicating thereby an advanced form of dementia or related disorders. And any older adult scoring 6 or more
on the Pfeffer questionnaire is considered to be unable to function independently.
Table 5.27. Distribution of the population over 60 years of age due to cognitive impairment, according to Socioeconomic Inequalities (%).
Inequality variablesCognitive deterioration
MMSE>=13 or Pfeffer<=5 6 or more
Education
No schooling 12 3,00% 7 11,30%
1 – 3 years 89 22,20% 23 37,10%
4 – 6 years 176 43,90% 22 35,50%
7 – 9 years 42 10,50% 3 4,80%
10 – 12 years 50 12,50% 2 3,20%
13 years or more 32 8,00% 3 4,80%
No response - - 2 3,20%
Perceived sufficiency of income
Sufficient for living 132 32,90% 13 21,00%
Insufficient for living 264 65,80% 48 77,40%
Don’t know/No response 5 1,20% 1 1,60%
Income quintile*
No income 65 16,80% 30 49,20%
8300 Gs. 59 15,20% 10 16,40%
496.000 Gs. 54 13,90% 7 11,50%
801.000 Gs. 73 18,80% 8 13,10%
1.600.000 Gs. 77 19,80% 2 3,30%
3.000.000 GS. 60 15,50% 4 6,60%
Source: DGIS/STP. Survey on Health, Welfare, and Ageing (SABE), Paraguay 2017.* Guaraníes indicate the lower limit of the quintile. The average exchange rate in 2017 was 5,591 guaraníes per dollar (Source: Central Bank of Paraguay)
The relationship between cognitive deterioration and the years of schooling completion in Paraguay
also was not linear, however, the people with only primary (1 to 6 years) education were found to be
more likely cognitively impaired than the people with more education.
The trend of cognitive deterioration by income level and perceived sufficiency of income are more
prominent (Table 5.27). The older adults without income are most likely suffer from cognitive dete-
rioration, alike less likely among the people who perceive they have sufficient income are cognitively
deteriorated. SABE Asunción 2017
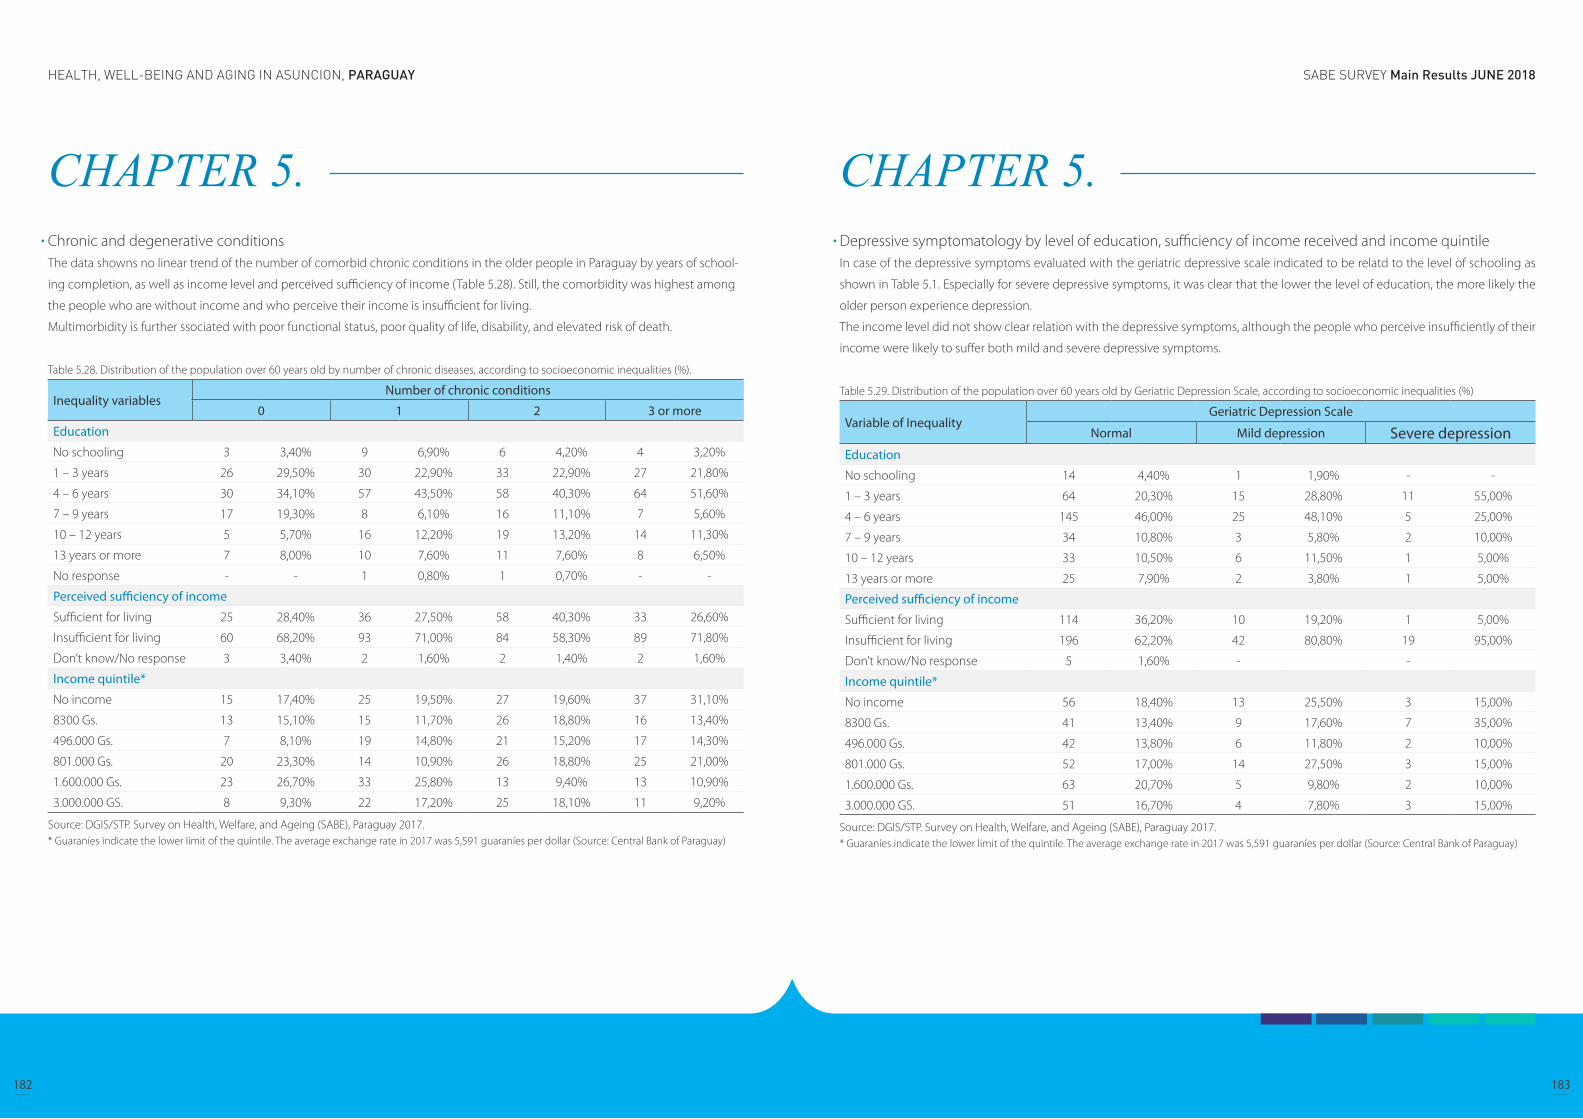
SABE SURVEY Main Results JUNE 2018HEALTH, WELL-BEING AND AGING IN ASUNCION, PARAGUAY
182 183
CHAPTER 5. Chronic and degenerative conditions The data showns no linear trend of the number of comorbid chronic conditions in the older people in Paraguay by years of school-
ing completion, as well as income level and perceived sufficiency of income (Table 5.28). Still, the comorbidity was highest among
the people who are without income and who perceive their income is insufficient for living.
Multimorbidity is further ssociated with poor functional status, poor quality of life, disability, and elevated risk of death.
Table 5.28. Distribution of the population over 60 years old by number of chronic diseases, according to socioeconomic inequalities (%).
Inequality variablesNumber of chronic conditions
0 1 2 3 or more
Education
No schooling 3 3,40% 9 6,90% 6 4,20% 4 3,20%
1 – 3 years 26 29,50% 30 22,90% 33 22,90% 27 21,80%
4 – 6 years 30 34,10% 57 43,50% 58 40,30% 64 51,60%
7 – 9 years 17 19,30% 8 6,10% 16 11,10% 7 5,60%
10 – 12 years 5 5,70% 16 12,20% 19 13,20% 14 11,30%
13 years or more 7 8,00% 10 7,60% 11 7,60% 8 6,50%
No response - - 1 0,80% 1 0,70% - -
Perceived sufficiency of income
Sufficient for living 25 28,40% 36 27,50% 58 40,30% 33 26,60%
Insufficient for living 60 68,20% 93 71,00% 84 58,30% 89 71,80%
Don’t know/No response 3 3,40% 2 1,60% 2 1,40% 2 1,60%
Income quintile*
No income 15 17,40% 25 19,50% 27 19,60% 37 31,10%
8300 Gs. 13 15,10% 15 11,70% 26 18,80% 16 13,40%
496.000 Gs. 7 8,10% 19 14,80% 21 15,20% 17 14,30%
801.000 Gs. 20 23,30% 14 10,90% 26 18,80% 25 21,00%
1.600.000 Gs. 23 26,70% 33 25,80% 13 9,40% 13 10,90%
3.000.000 GS. 8 9,30% 22 17,20% 25 18,10% 11 9,20%
Source: DGIS/STP. Survey on Health, Welfare, and Ageing (SABE), Paraguay 2017.* Guaraníes indicate the lower limit of the quintile. The average exchange rate in 2017 was 5,591 guaraníes per dollar (Source: Central Bank of Paraguay)
CHAPTER 5. Depressive symptomatology by level of education, sufficiency of income received and income quintileIn case of the depressive symptoms evaluated with the geriatric depressive scale indicated to be relatd to the level of schooling as
shown in Table 5.1. Especially for severe depressive symptoms, it was clear that the lower the level of education, the more likely the
older person experience depression.
The income level did not show clear relation with the depressive symptoms, although the people who perceive insufficiently of their
income were likely to suffer both mild and severe depressive symptoms.
Table 5.29. Distribution of the population over 60 years old by Geriatric Depression Scale, according to socioeconomic inequalities (%)
Variable of InequalityGeriatric Depression Scale
Normal Mild depression Severe depressionEducation
No schooling 14 4,40% 1 1,90% - -
1 – 3 years 64 20,30% 15 28,80% 11 55,00%
4 – 6 years 145 46,00% 25 48,10% 5 25,00%
7 – 9 years 34 10,80% 3 5,80% 2 10,00%
10 – 12 years 33 10,50% 6 11,50% 1 5,00%
13 years or more 25 7,90% 2 3,80% 1 5,00%
Perceived sufficiency of income
Sufficient for living 114 36,20% 10 19,20% 1 5,00%
Insufficient for living 196 62,20% 42 80,80% 19 95,00%
Don’t know/No response 5 1,60% - -
Income quintile*
No income 56 18,40% 13 25,50% 3 15,00%
8300 Gs. 41 13,40% 9 17,60% 7 35,00%
496.000 Gs. 42 13,80% 6 11,80% 2 10,00%
801.000 Gs. 52 17,00% 14 27,50% 3 15,00%
1.600.000 Gs. 63 20,70% 5 9,80% 2 10,00%
3.000.000 GS. 51 16,70% 4 7,80% 3 15,00%
Source: DGIS/STP. Survey on Health, Welfare, and Ageing (SABE), Paraguay 2017.* Guaraníes indicate the lower limit of the quintile. The average exchange rate in 2017 was 5,591 guaraníes per dollar (Source: Central Bank of Paraguay)

SABE SURVEY Main Results JUNE 2018HEALTH, WELL-BEING AND AGING IN ASUNCION, PARAGUAY
184 185
CHAPTER 5. Difficulty in activities of daily living (ADL) by level of instruction, sufficiency of income received and quintile of income The data shows that older people who received education only for primary level (1 to 6 years) are most likely to have difficulties in
performing activities of dailiy living with great difference from the people with higher education (7 or more years), but the people
without education did not seem to have more difficulties than the people who completed the lower education level (Table 5.30).
Income level and the perceived sufficiency of income indicated to be more related with the difficulties that older people experience
in the activities of daily living. It becomes significantly less that an individual feel difficulty in ADL when they have income of more
than 1,600,000 Guraranies.
Table 5.30. Distribution of the population over 60 years of age by difficulty with at least one ADL, * according to socioeconomic inequalities (%)
Variable of InequalityDifficulty in activities of daily living *
Si No
Education
No schooling 6 4,5% 16 4,6%
1 – 3 years 40 30,3% 75 21,5%
4 – 6 years 61 46,2% 146 41,8%
7 – 9 years 9 6,8% 38 10,9%
10 – 12 years 10 7,6% 43 12,3%
13 years or more 4 3,0% 31 8,9%
No response 2 1,5% - -
Perceived sufficiency of income
Sufficient for living 31 23,5% 120 34,4%
Insufficient for living 100 75,8% 226 64,8%
Don’t know/No response
1 0,8% 3 0,9%
Income quintile*
No income 40 31,3% 59 17,5%
8300 Gs. 26 20,3% 44 13,0%
496.000 Gs. 26 20,3% 38 11,2%
801.000 Gs. 24 18,8% 61 18,0%
1.600.000 Gs. 4 3,1% 78 23,1%
3.000.000 GS. 8 6,3% 58 17,2%
Source: DGIS/STP. Survey on Health, Welfare, and Ageing (SABE), Paraguay 2017.1/ Basic activities of daily life: crossing a room walking, bathing, going to the bathroom, getting dressed, feeding and lying down or getting out of bed.2/ Guaraníes indicate the lower limit of the quintile. The average exchange rate in 2017 was 5,591 guaraníes per dollar (Source: Central Bank of Paraguay).
CHAPTER 6. Functional limitations
Activities of daily living
Instrumental activities of daily living
Mobility
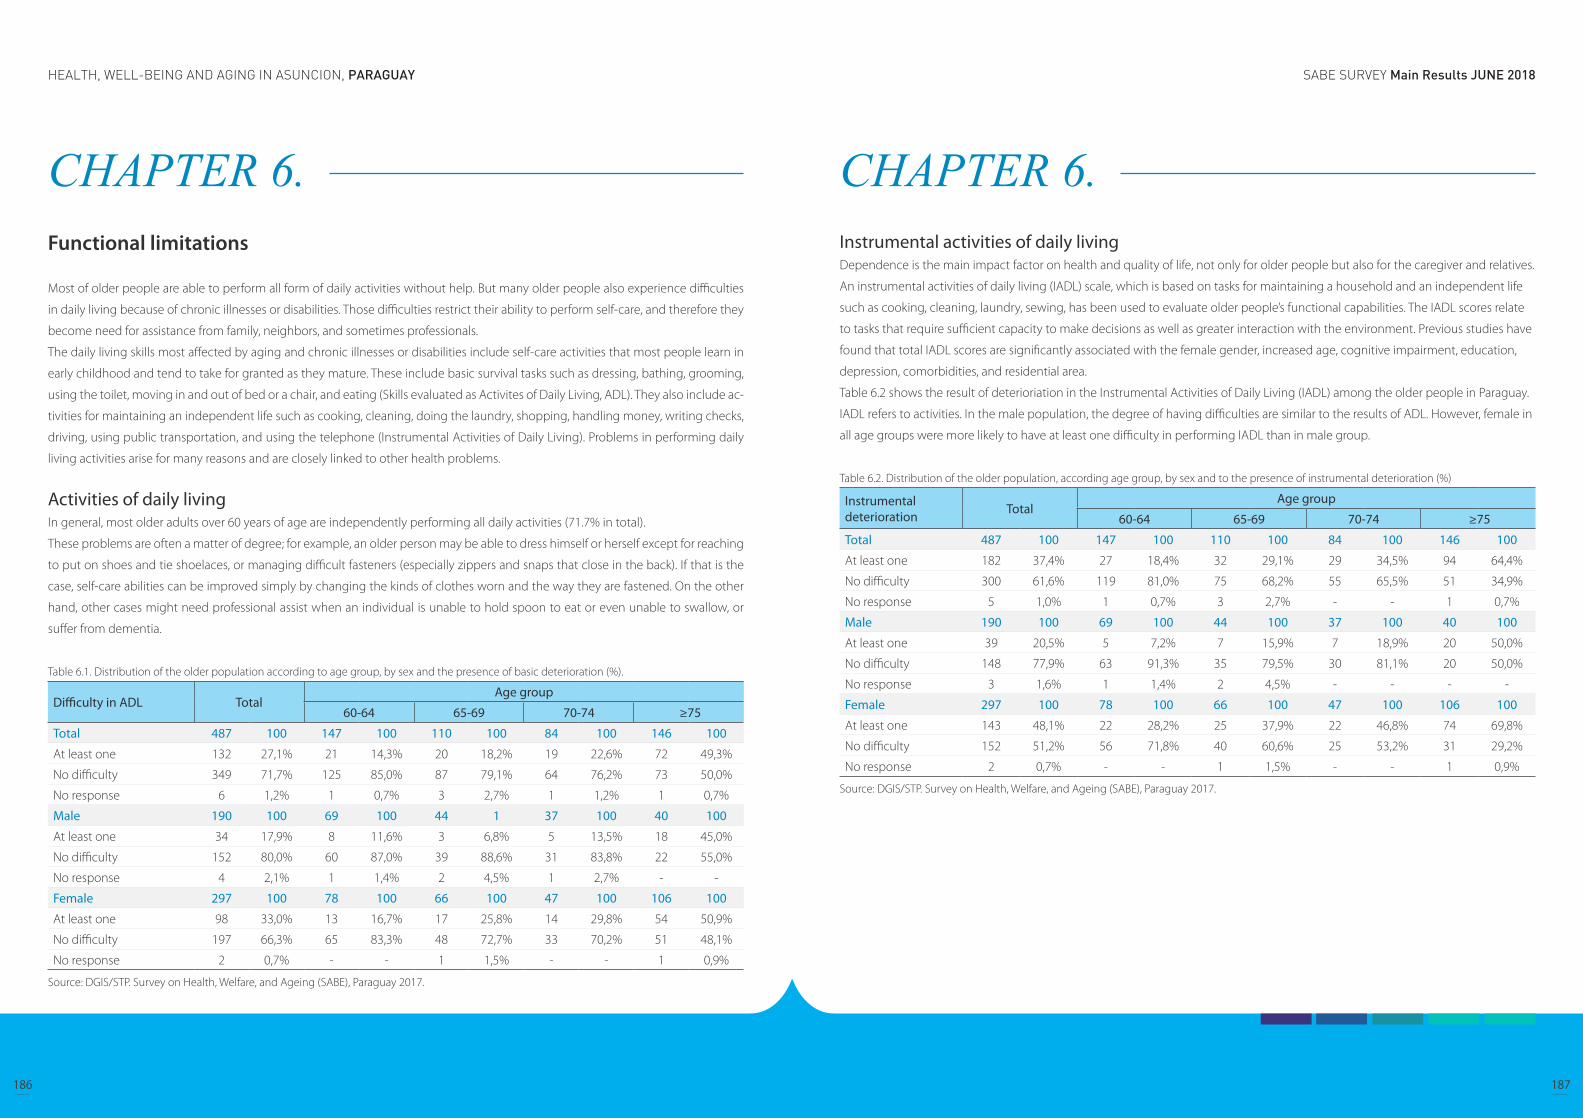
SABE SURVEY Main Results JUNE 2018HEALTH, WELL-BEING AND AGING IN ASUNCION, PARAGUAY
186 187
CHAPTER 6. Functional limitations
Most of older people are able to perform all form of daily activities without help. But many older people also experience difficulties
in daily living because of chronic illnesses or disabilities. Those difficulties restrict their ability to perform self-care, and therefore they
become need for assistance from family, neighbors, and sometimes professionals.
The daily living skills most affected by aging and chronic illnesses or disabilities include self-care activities that most people learn in
early childhood and tend to take for granted as they mature. These include basic survival tasks such as dressing, bathing, grooming,
using the toilet, moving in and out of bed or a chair, and eating (Skills evaluated as Activites of Daily Living, ADL). They also include ac-
tivities for maintaining an independent life such as cooking, cleaning, doing the laundry, shopping, handling money, writing checks,
driving, using public transportation, and using the telephone (Instrumental Activities of Daily Living). Problems in performing daily
living activities arise for many reasons and are closely linked to other health problems.
Activities of daily livingIn general, most older adults over 60 years of age are independently performing all daily activities (71.7% in total).
These problems are often a matter of degree; for example, an older person may be able to dress himself or herself except for reaching
to put on shoes and tie shoelaces, or managing difficult fasteners (especially zippers and snaps that close in the back). If that is the
case, self-care abilities can be improved simply by changing the kinds of clothes worn and the way they are fastened. On the other
hand, other cases might need professional assist when an individual is unable to hold spoon to eat or even unable to swallow, or
suffer from dementia.
Table 6.1. Distribution of the older population according to age group, by sex and the presence of basic deterioration (%).
Difficulty in ADL TotalAge group
60-64 65-69 70-74 ≥75
Total 487 100 147 100 110 100 84 100 146 100
At least one 132 27,1% 21 14,3% 20 18,2% 19 22,6% 72 49,3%
No difficulty 349 71,7% 125 85,0% 87 79,1% 64 76,2% 73 50,0%
No response 6 1,2% 1 0,7% 3 2,7% 1 1,2% 1 0,7%
Male 190 100 69 100 44 1 37 100 40 100
At least one 34 17,9% 8 11,6% 3 6,8% 5 13,5% 18 45,0%
No difficulty 152 80,0% 60 87,0% 39 88,6% 31 83,8% 22 55,0%
No response 4 2,1% 1 1,4% 2 4,5% 1 2,7% - -
Female 297 100 78 100 66 100 47 100 106 100
At least one 98 33,0% 13 16,7% 17 25,8% 14 29,8% 54 50,9%
No difficulty 197 66,3% 65 83,3% 48 72,7% 33 70,2% 51 48,1%
No response 2 0,7% - - 1 1,5% - - 1 0,9%
Source: DGIS/STP. Survey on Health, Welfare, and Ageing (SABE), Paraguay 2017.
CHAPTER 6. Instrumental activities of daily livingDependence is the main impact factor on health and quality of life, not only for older people but also for the caregiver and relatives.
An instrumental activities of daily living (IADL) scale, which is based on tasks for maintaining a household and an independent life
such as cooking, cleaning, laundry, sewing, has been used to evaluate older people’s functional capabilities. The IADL scores relate
to tasks that require sufficient capacity to make decisions as well as greater interaction with the environment. Previous studies have
found that total IADL scores are significantly associated with the female gender, increased age, cognitive impairment, education,
depression, comorbidities, and residential area.
Table 6.2 shows the result of deterioriation in the Instrumental Activities of Daily Living (IADL) among the older people in Paraguay.
IADL refers to activities. In the male population, the degree of having difficulties are similar to the results of ADL. However, female in
all age groups were more likely to have at least one difficulty in performing IADL than in male group.
Table 6.2. Distribution of the older population, according age group, by sex and to the presence of instrumental deterioration (%)
Instrumental deterioration Total
Age group
60-64 65-69 70-74 ≥75
Total 487 100 147 100 110 100 84 100 146 100
At least one 182 37,4% 27 18,4% 32 29,1% 29 34,5% 94 64,4%
No difficulty 300 61,6% 119 81,0% 75 68,2% 55 65,5% 51 34,9%
No response 5 1,0% 1 0,7% 3 2,7% - - 1 0,7%
Male 190 100 69 100 44 100 37 100 40 100
At least one 39 20,5% 5 7,2% 7 15,9% 7 18,9% 20 50,0%
No difficulty 148 77,9% 63 91,3% 35 79,5% 30 81,1% 20 50,0%
No response 3 1,6% 1 1,4% 2 4,5% - - - -
Female 297 100 78 100 66 100 47 100 106 100
At least one 143 48,1% 22 28,2% 25 37,9% 22 46,8% 74 69,8%
No difficulty 152 51,2% 56 71,8% 40 60,6% 25 53,2% 31 29,2%
No response 2 0,7% - - 1 1,5% - - 1 0,9%
Source: DGIS/STP. Survey on Health, Welfare, and Ageing (SABE), Paraguay 2017.
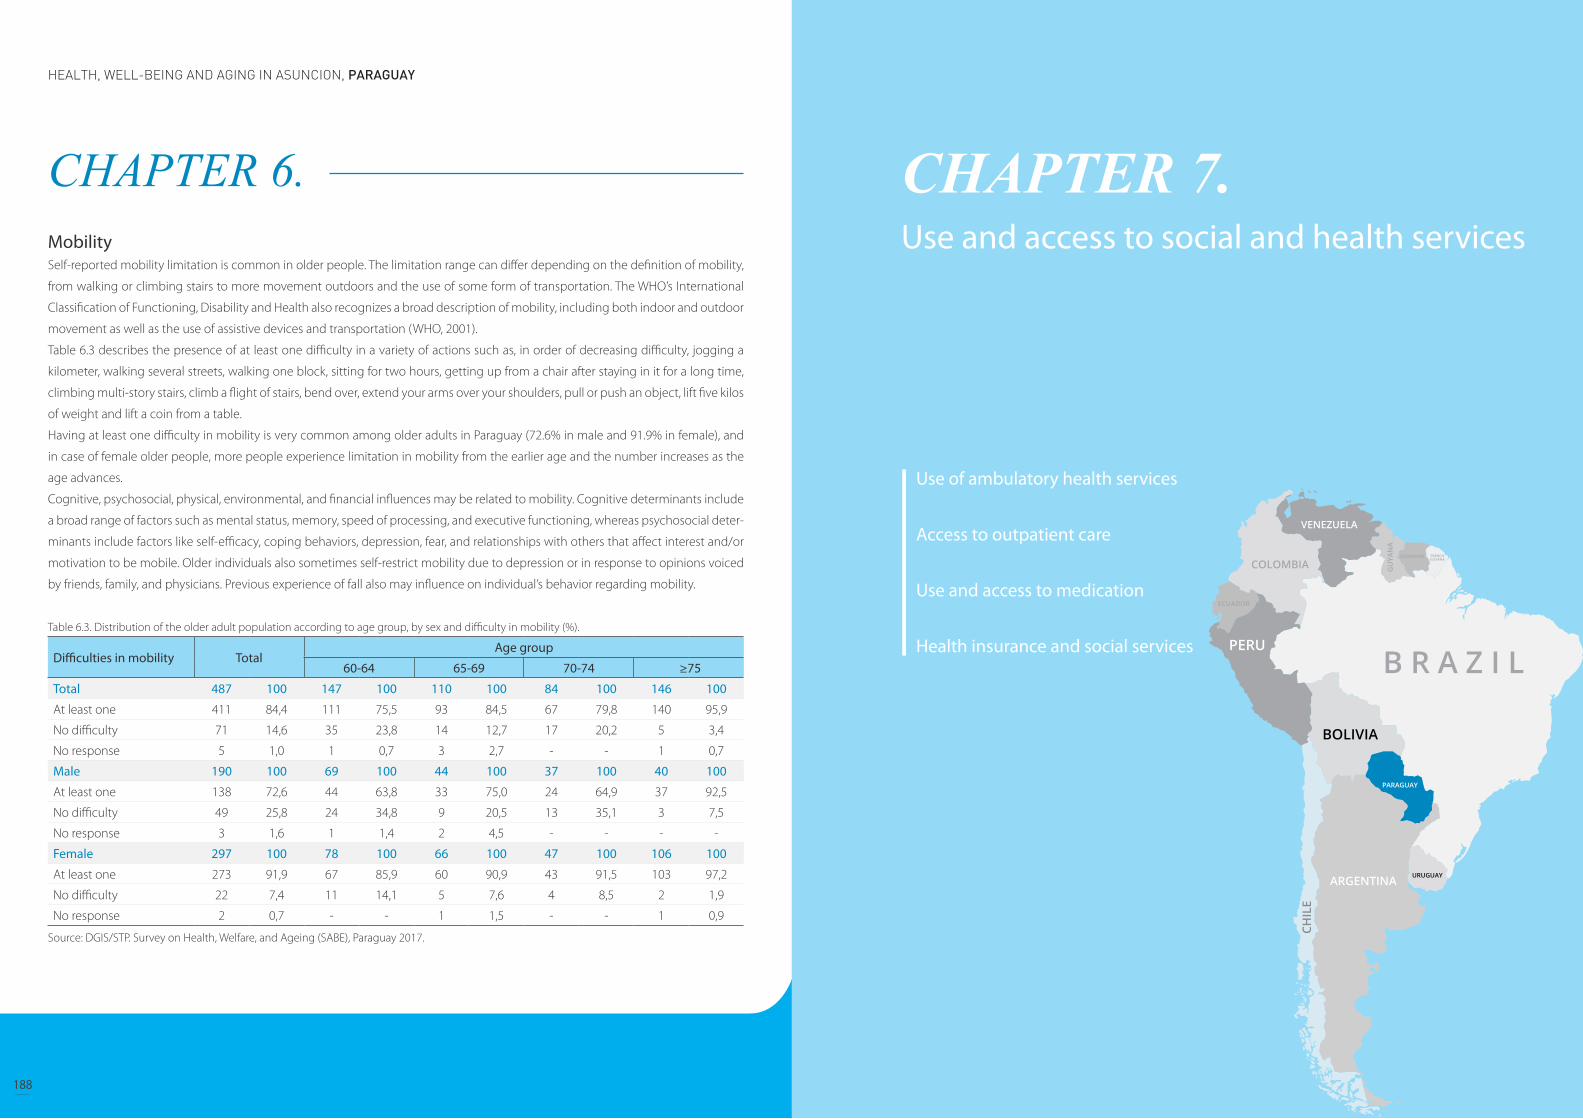
SABE SURVEY Main Results JUNE 2018HEALTH, WELL-BEING AND AGING IN ASUNCION, PARAGUAY
188 189
CHAPTER 6. MobilitySelf-reported mobility limitation is common in older people. The limitation range can differ depending on the definition of mobility,
from walking or climbing stairs to more movement outdoors and the use of some form of transportation. The WHO’s International
Classification of Functioning, Disability and Health also recognizes a broad description of mobility, including both indoor and outdoor
movement as well as the use of assistive devices and transportation (WHO, 2001).
Table 6.3 describes the presence of at least one difficulty in a variety of actions such as, in order of decreasing difficulty, jogging a
kilometer, walking several streets, walking one block, sitting for two hours, getting up from a chair after staying in it for a long time,
climbing multi-story stairs, climb a flight of stairs, bend over, extend your arms over your shoulders, pull or push an object, lift five kilos
of weight and lift a coin from a table.
Having at least one difficulty in mobility is very common among older adults in Paraguay (72.6% in male and 91.9% in female), and
in case of female older people, more people experience limitation in mobility from the earlier age and the number increases as the
age advances.
Cognitive, psychosocial, physical, environmental, and financial influences may be related to mobility. Cognitive determinants include
a broad range of factors such as mental status, memory, speed of processing, and executive functioning, whereas psychosocial deter-
minants include factors like self-efficacy, coping behaviors, depression, fear, and relationships with others that affect interest and/or
motivation to be mobile. Older individuals also sometimes self-restrict mobility due to depression or in response to opinions voiced
by friends, family, and physicians. Previous experience of fall also may influence on individual’s behavior regarding mobility.
Table 6.3. Distribution of the older adult population according to age group, by sex and difficulty in mobility (%).
Difficulties in mobility TotalAge group
60-64 65-69 70-74 ≥75
Total 487 100 147 100 110 100 84 100 146 100
At least one 411 84,4 111 75,5 93 84,5 67 79,8 140 95,9
No difficulty 71 14,6 35 23,8 14 12,7 17 20,2 5 3,4
No response 5 1,0 1 0,7 3 2,7 - - 1 0,7
Male 190 100 69 100 44 100 37 100 40 100
At least one 138 72,6 44 63,8 33 75,0 24 64,9 37 92,5
No difficulty 49 25,8 24 34,8 9 20,5 13 35,1 3 7,5
No response 3 1,6 1 1,4 2 4,5 - - - -
Female 297 100 78 100 66 100 47 100 106 100
At least one 273 91,9 67 85,9 60 90,9 43 91,5 103 97,2
No difficulty 22 7,4 11 14,1 5 7,6 4 8,5 2 1,9
No response 2 0,7 - - 1 1,5 - - 1 0,9
Source: DGIS/STP. Survey on Health, Welfare, and Ageing (SABE), Paraguay 2017.
CHAPTER 7. Use and access to social and health services
Use of ambulatory health services
Access to outpatient care
Use and access to medication
Health insurance and social services
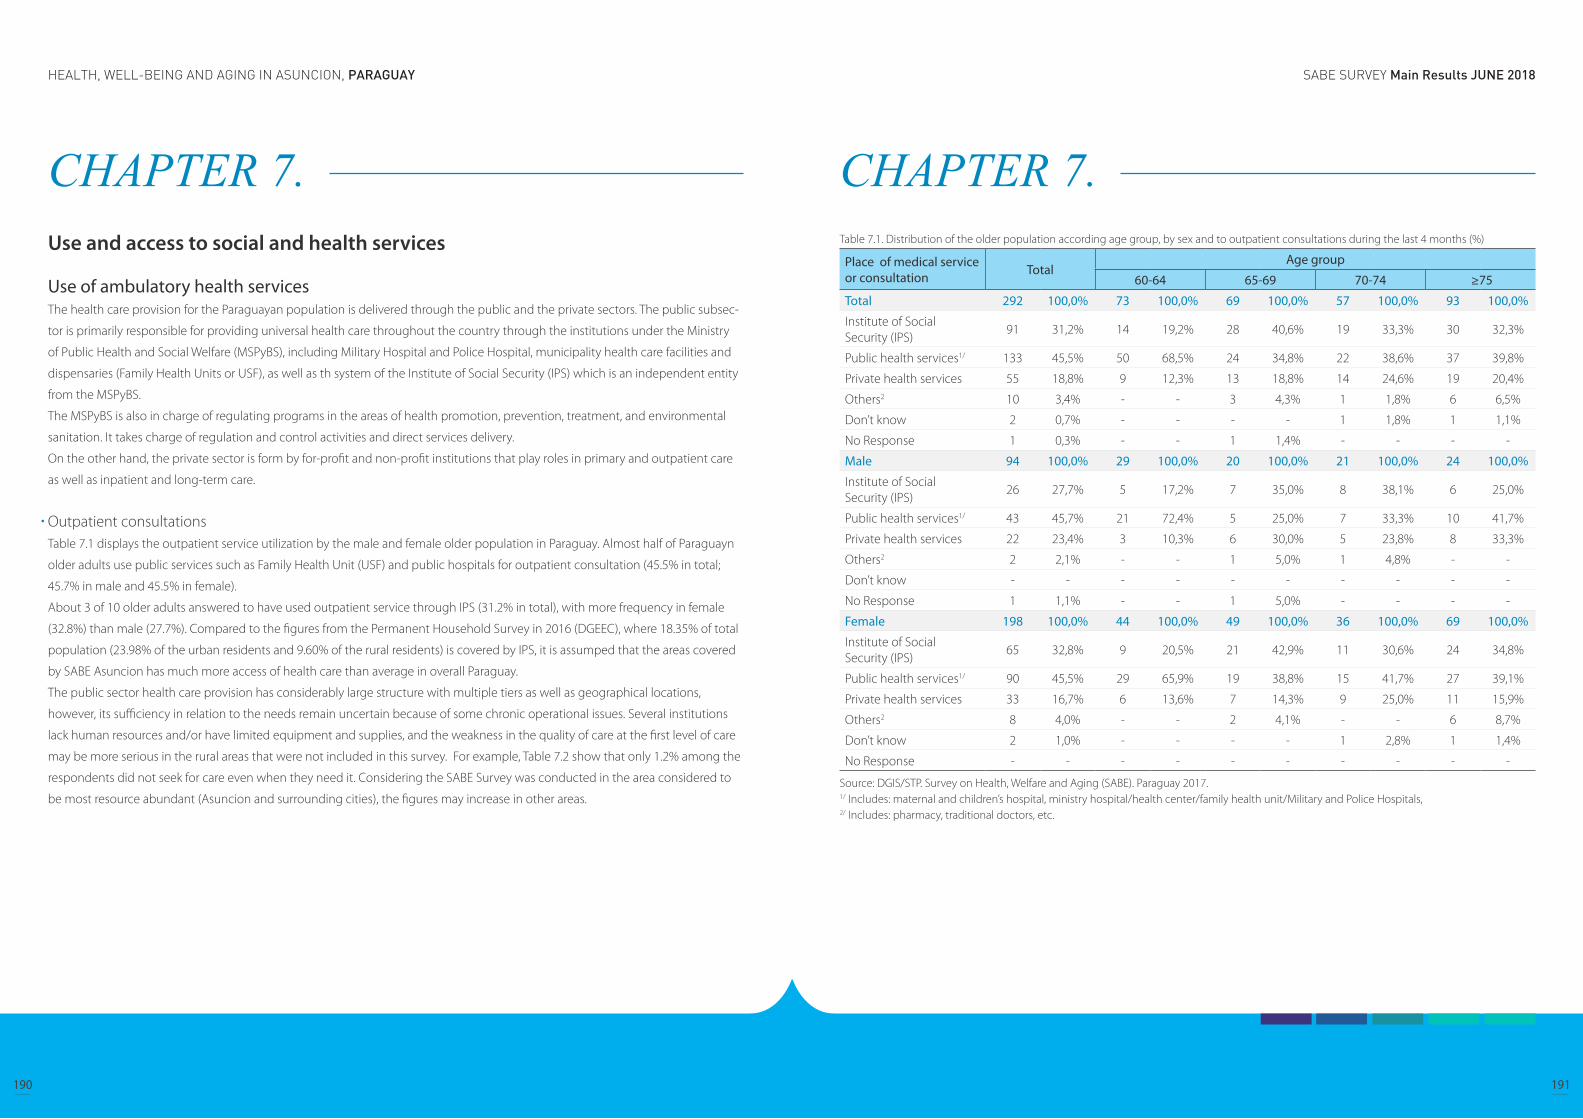
SABE SURVEY Main Results JUNE 2018HEALTH, WELL-BEING AND AGING IN ASUNCION, PARAGUAY
190 191
CHAPTER 7. Use and access to social and health services
Use of ambulatory health servicesThe health care provision for the Paraguayan population is delivered through the public and the private sectors. The public subsec-
tor is primarily responsible for providing universal health care throughout the country through the institutions under the Ministry
of Public Health and Social Welfare (MSPyBS), including Military Hospital and Police Hospital, municipality health care facilities and
dispensaries (Family Health Units or USF), as well as th system of the Institute of Social Security (IPS) which is an independent entity
from the MSPyBS.
The MSPyBS is also in charge of regulating programs in the areas of health promotion, prevention, treatment, and environmental
sanitation. It takes charge of regulation and control activities and direct services delivery.
On the other hand, the private sector is form by for-profit and non-profit institutions that play roles in primary and outpatient care
as well as inpatient and long-term care.
Outpatient consultationsTable 7.1 displays the outpatient service utilization by the male and female older population in Paraguay. Almost half of Paraguayn
older adults use public services such as Family Health Unit (USF) and public hospitals for outpatient consultation (45.5% in total;
45.7% in male and 45.5% in female).
About 3 of 10 older adults answered to have used outpatient service through IPS (31.2% in total), with more frequency in female
(32.8%) than male (27.7%). Compared to the figures from the Permanent Household Survey in 2016 (DGEEC), where 18.35% of total
population (23.98% of the urban residents and 9.60% of the rural residents) is covered by IPS, it is assumped that the areas covered
by SABE Asuncion has much more access of health care than average in overall Paraguay.
The public sector health care provision has considerably large structure with multiple tiers as well as geographical locations,
however, its sufficiency in relation to the needs remain uncertain because of some chronic operational issues. Several institutions
lack human resources and/or have limited equipment and supplies, and the weakness in the quality of care at the first level of care
may be more serious in the rural areas that were not included in this survey. For example, Table 7.2 show that only 1.2% among the
respondents did not seek for care even when they need it. Considering the SABE Survey was conducted in the area considered to
be most resource abundant (Asuncion and surrounding cities), the figures may increase in other areas.
CHAPTER 7. Table 7.1. Distribution of the older population according age group, by sex and to outpatient consultations during the last 4 months (%)
Place of medical service or consultation Total
Age group
60-64 65-69 70-74 ≥75
Total 292 100,0% 73 100,0% 69 100,0% 57 100,0% 93 100,0%
Institute of Social Security (IPS)
91 31,2% 14 19,2% 28 40,6% 19 33,3% 30 32,3%
Public health services1/ 133 45,5% 50 68,5% 24 34,8% 22 38,6% 37 39,8%
Private health services 55 18,8% 9 12,3% 13 18,8% 14 24,6% 19 20,4%
Others2 10 3,4% - - 3 4,3% 1 1,8% 6 6,5%
Don’t know 2 0,7% - - - - 1 1,8% 1 1,1%
No Response 1 0,3% - - 1 1,4% - - - -
Male 94 100,0% 29 100,0% 20 100,0% 21 100,0% 24 100,0%
Institute of Social Security (IPS)
26 27,7% 5 17,2% 7 35,0% 8 38,1% 6 25,0%
Public health services1/ 43 45,7% 21 72,4% 5 25,0% 7 33,3% 10 41,7%
Private health services 22 23,4% 3 10,3% 6 30,0% 5 23,8% 8 33,3%
Others2 2 2,1% - - 1 5,0% 1 4,8% - -
Don’t know - - - - - - - - - -
No Response 1 1,1% - - 1 5,0% - - - -
Female 198 100,0% 44 100,0% 49 100,0% 36 100,0% 69 100,0%
Institute of Social Security (IPS)
65 32,8% 9 20,5% 21 42,9% 11 30,6% 24 34,8%
Public health services1/ 90 45,5% 29 65,9% 19 38,8% 15 41,7% 27 39,1%
Private health services 33 16,7% 6 13,6% 7 14,3% 9 25,0% 11 15,9%
Others2 8 4,0% - - 2 4,1% - - 6 8,7%
Don’t know 2 1,0% - - - - 1 2,8% 1 1,4%
No Response - - - - - - - - - -
Source: DGIS/STP. Survey on Health, Welfare and Aging (SABE). Paraguay 2017.1/ Includes: maternal and children’s hospital, ministry hospital/health center/family health unit/Military and Police Hospitals,2/ Includes: pharmacy, traditional doctors, etc.

SABE SURVEY Main Results JUNE 2018HEALTH, WELL-BEING AND AGING IN ASUNCION, PARAGUAY
192 193
CHAPTER 7. Table 7.2. Distribution of the elderly population according to age groups and health consultations during the last 12 months (%).
Health consultations TotalAge group
60-64 65-69 70-74 ≥75
Didn’t receive service despite needs
6 1,2% 2 1,4% 1 - - - 3 2,1%
No needed for service 66 13,6% 29 19,7% 14 12,7% 9 10,7% 14 9,6%
IPS 132 27,1% 25 17,0% 36 32,7% 26 31% 45 30,8%
Use of public services 251 51,5% 92 62,6% 50 45,5% 43 51,2% 66 45,2%
Use of private services 88 18,1% 17 11,6% 19 17,3% 16 19% 36 24,7%
Other1/ 16 3,3% 2 1,4% 5 4,5% 1 1,2% 8 5,5%
Don’t know 2 0,4% 1 0,7% 1 0,9% 0 - - -
No response 8 1,6% 2 1,4% 4 3,6% 1 1,2% 1 0,7%
Source: DGIS/STP. Survey on Health, Welfare and Aging (SABE). Paraguay 2017.1/ Includes: pharmacy, traditional doctors, etc.Precisions on the table: The sum of the percentages does not coincide with 100% because it corresponds to a variable with multiple responses
CHAPTER 7. VaccinationsVaccines are especially important for older adults. As growing older, the human immune system weakens and it can be more difficult
to fight off infections. Thus older person become more likely to get diseases like the flu, pneumonia, and shingles, and the complica-
tions of these conditions can lead to long-term illness, hospitalization, and even death.
The Expanded Immunization Program (PAI) under the Ministry of Public Health and Social Welfare of Paraguay recommends the rou-
tine vaccination of he anti-flu, pneumococcal and DPT (Diphtheria, Tetanus, Pertussis) for adults who are over 60 years old. Overall,
vaccination rate for the older adults in Paraguay was found to be insufficient, as shown in Table 7.3, less than half of the population
received the necessary vaccinations in most of the age groups.
Table 7.3. Distribution of the older adult population according to age groups, by sex and vaccines (%)
Vaccinations TotalAge group
60-64 65-69 70-74 ≥75
Total 487 100% 147 100% 110 100% 84 100% 146 100%
Flu 51 10,5% 9 6,1% 11 10,0% 7 8,3% 24 16,4%
Tetanus 108 22,2% 44 29,9% 26 23,6% 13 15,5% 25 17,1%
Tetanus and Flu 192 39,4% 53 36,1% 49 44,5% 41 48,8% 49 33,6%
None 122 25,1% 39 26,5% 19 17,3% 22 26,2% 42 28,8%
Don’t know 8 1,6% 1 0,7% 2 1,8% - - 5 3,4%
No response 6 1,2% 1 0,7% 3 2,7% 1 1,2% 1 0,7
Male 190 100% 69 100% 44 100% 37 100% 40 100%
Flu 20 10,5% 3 4,3% 2 4,5% 5 13,5% 10 25,0%
Tetanus 40 21,1% 19 27,5% 8 18,2% 7 18,9% 6 15,0%
Tetanus and Flu 73 38,4% 23 33,3% 22 50,0% 16 43,2% 12 30,0%
None 51 26,8% 23 33,3% 9 20,5% 9 24,3% 10 25,0%
Don’t know 3 1,6% - - 1 2,3% - - 2 5,0%
No response 3 1,6% 1 1,4% 2 4,5% - - - -
Female 297 100% 78 100% 66 100% 47 100% 106 100%
Flu 31 10,4% 6 7,7% 9 13,6% 2 4,3% 14 13,2%
Tetanus 68 22,9% 25 32,1% 18 27,3% 6 12,8% 19 17,9%
Tetanus and Flu 119 40,1% 30 38,5% 27 40,9% 25 53,2% 37 34,9%
None 71 23,9% 16 20,5% 10 15,2% 13 27,7% 32 30,2%
Don’t know 5 1,7% 1 1,3% 1 1,5% - - 3 2,8%
No response 3 1,0% - - 1 1,5% 1 2,1% 1 0,9%
Source: DGIS/STP. Survey on Health, Welfare and Aging (SABE). Paraguay 2017.
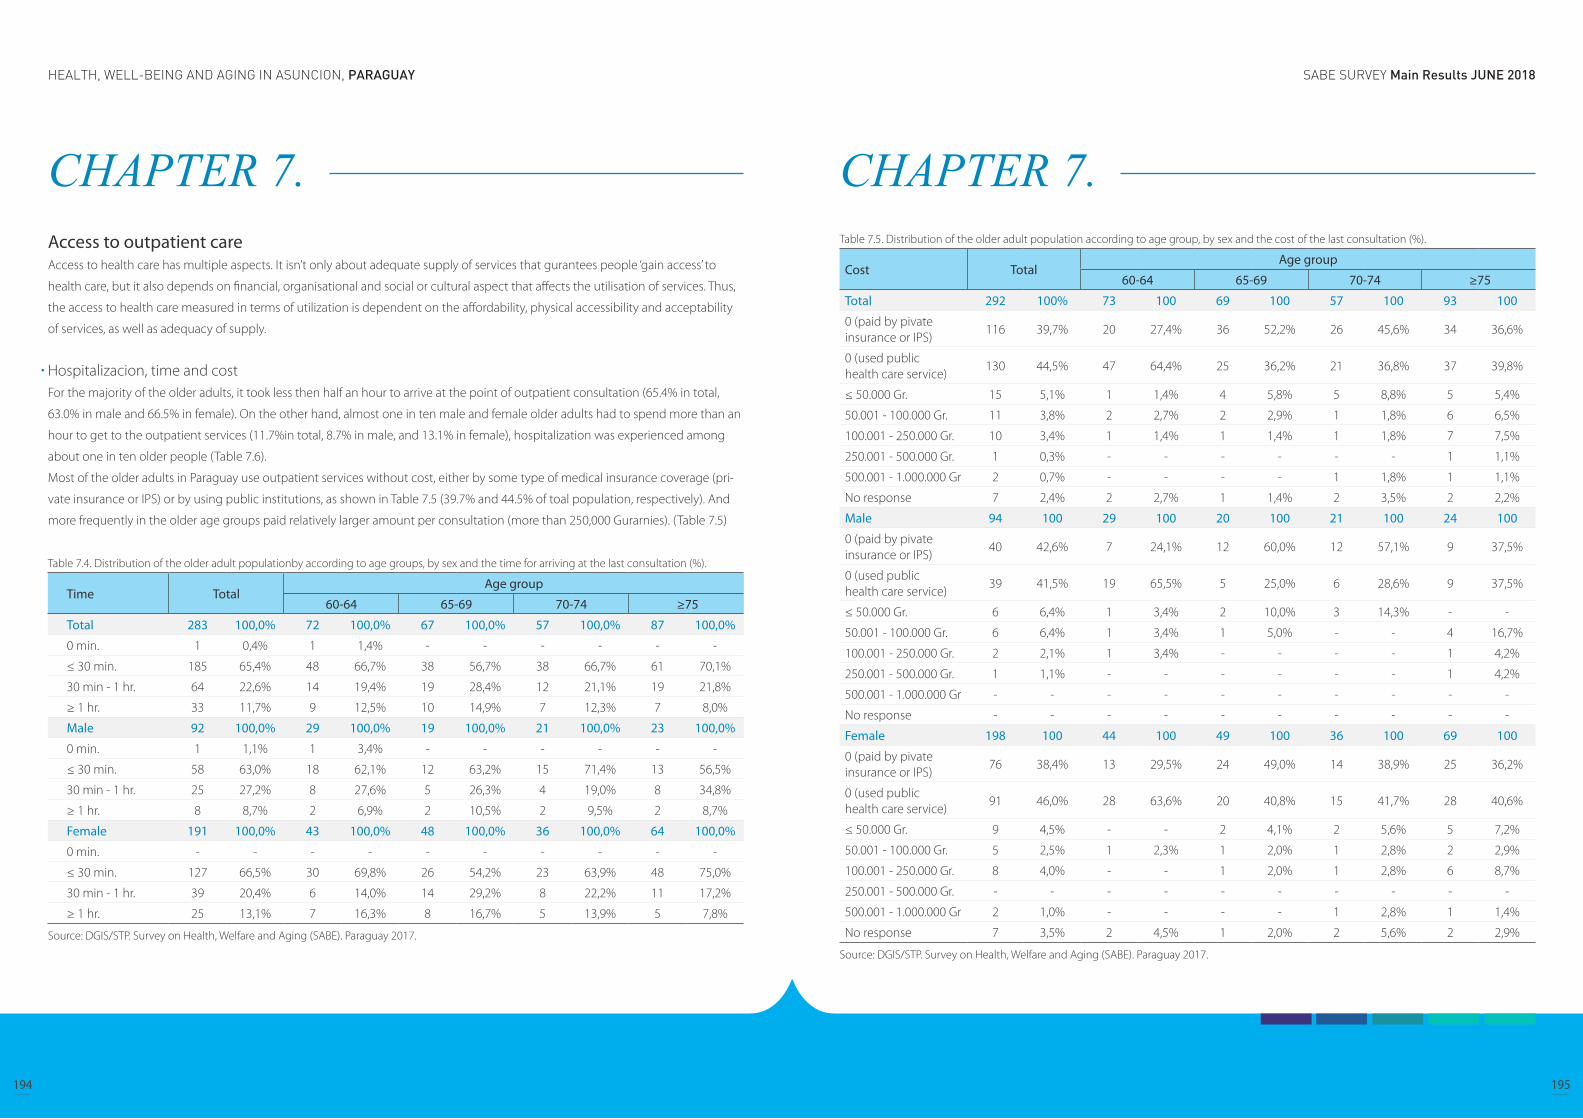
SABE SURVEY Main Results JUNE 2018HEALTH, WELL-BEING AND AGING IN ASUNCION, PARAGUAY
194 195
CHAPTER 7. Access to outpatient careAccess to health care has multiple aspects. It isn’t only about adequate supply of services that gurantees people ‘gain access’ to
health care, but it also depends on financial, organisational and social or cultural aspect that affects the utilisation of services. Thus,
the access to health care measured in terms of utilization is dependent on the affordability, physical accessibility and acceptability
of services, as well as adequacy of supply.
Hospitalizacion, time and costFor the majority of the older adults, it took less then half an hour to arrive at the point of outpatient consultation (65.4% in total,
63.0% in male and 66.5% in female). On the other hand, almost one in ten male and female older adults had to spend more than an
hour to get to the outpatient services (11.7%in total, 8.7% in male, and 13.1% in female), hospitalization was experienced among
about one in ten older people (Table 7.6).
Most of the older adults in Paraguay use outpatient services without cost, either by some type of medical insurance coverage (pri-
vate insurance or IPS) or by using public institutions, as shown in Table 7.5 (39.7% and 44.5% of toal population, respectively). And
more frequently in the older age groups paid relatively larger amount per consultation (more than 250,000 Gurarnies). (Table 7.5)
Table 7.4. Distribution of the older adult populationby according to age groups, by sex and the time for arriving at the last consultation (%).
Time TotalAge group
60-64 65-69 70-74 ≥75
Total 283 100,0% 72 100,0% 67 100,0% 57 100,0% 87 100,0%
0 min. 1 0,4% 1 1,4% - - - - - -
≤ 30 min. 185 65,4% 48 66,7% 38 56,7% 38 66,7% 61 70,1%
30 min - 1 hr. 64 22,6% 14 19,4% 19 28,4% 12 21,1% 19 21,8%
≥ 1 hr. 33 11,7% 9 12,5% 10 14,9% 7 12,3% 7 8,0%
Male 92 100,0% 29 100,0% 19 100,0% 21 100,0% 23 100,0%
0 min. 1 1,1% 1 3,4% - - - - - -
≤ 30 min. 58 63,0% 18 62,1% 12 63,2% 15 71,4% 13 56,5%
30 min - 1 hr. 25 27,2% 8 27,6% 5 26,3% 4 19,0% 8 34,8%
≥ 1 hr. 8 8,7% 2 6,9% 2 10,5% 2 9,5% 2 8,7%
Female 191 100,0% 43 100,0% 48 100,0% 36 100,0% 64 100,0%
0 min. - - - - - - - - - -
≤ 30 min. 127 66,5% 30 69,8% 26 54,2% 23 63,9% 48 75,0%
30 min - 1 hr. 39 20,4% 6 14,0% 14 29,2% 8 22,2% 11 17,2%
≥ 1 hr. 25 13,1% 7 16,3% 8 16,7% 5 13,9% 5 7,8%
Source: DGIS/STP. Survey on Health, Welfare and Aging (SABE). Paraguay 2017.
CHAPTER 7. Table 7.5. Distribution of the older adult population according to age group, by sex and the cost of the last consultation (%).
Cost TotalAge group
60-64 65-69 70-74 ≥75
Total 292 100% 73 100 69 100 57 100 93 100
0 (paid by pivate insurance or IPS)
116 39,7% 20 27,4% 36 52,2% 26 45,6% 34 36,6%
0 (used public health care service)
130 44,5% 47 64,4% 25 36,2% 21 36,8% 37 39,8%
≤ 50.000 Gr. 15 5,1% 1 1,4% 4 5,8% 5 8,8% 5 5,4%
50.001 - 100.000 Gr. 11 3,8% 2 2,7% 2 2,9% 1 1,8% 6 6,5%
100.001 - 250.000 Gr. 10 3,4% 1 1,4% 1 1,4% 1 1,8% 7 7,5%
250.001 - 500.000 Gr. 1 0,3% - - - - - - 1 1,1%
500.001 - 1.000.000 Gr 2 0,7% - - - - 1 1,8% 1 1,1%
No response 7 2,4% 2 2,7% 1 1,4% 2 3,5% 2 2,2%
Male 94 100 29 100 20 100 21 100 24 100
0 (paid by pivate insurance or IPS)
40 42,6% 7 24,1% 12 60,0% 12 57,1% 9 37,5%
0 (used public health care service)
39 41,5% 19 65,5% 5 25,0% 6 28,6% 9 37,5%
≤ 50.000 Gr. 6 6,4% 1 3,4% 2 10,0% 3 14,3% - -
50.001 - 100.000 Gr. 6 6,4% 1 3,4% 1 5,0% - - 4 16,7%
100.001 - 250.000 Gr. 2 2,1% 1 3,4% - - - - 1 4,2%
250.001 - 500.000 Gr. 1 1,1% - - - - - - 1 4,2%
500.001 - 1.000.000 Gr - - - - - - - - - -
No response - - - - - - - - - -
Female 198 100 44 100 49 100 36 100 69 100
0 (paid by pivate insurance or IPS)
76 38,4% 13 29,5% 24 49,0% 14 38,9% 25 36,2%
0 (used public health care service)
91 46,0% 28 63,6% 20 40,8% 15 41,7% 28 40,6%
≤ 50.000 Gr. 9 4,5% - - 2 4,1% 2 5,6% 5 7,2%
50.001 - 100.000 Gr. 5 2,5% 1 2,3% 1 2,0% 1 2,8% 2 2,9%
100.001 - 250.000 Gr. 8 4,0% - - 1 2,0% 1 2,8% 6 8,7%
250.001 - 500.000 Gr. - - - - - - - - - -
500.001 - 1.000.000 Gr 2 1,0% - - - - 1 2,8% 1 1,4%
No response 7 3,5% 2 4,5% 1 2,0% 2 5,6% 2 2,9%
Source: DGIS/STP. Survey on Health, Welfare and Aging (SABE). Paraguay 2017.

SABE SURVEY Main Results JUNE 2018HEALTH, WELL-BEING AND AGING IN ASUNCION, PARAGUAY
196 197
CHAPTER 7. Table 7.6. Distribution of the older adult population by sex and age groups, according to the use of hospitals (hospitalization) in the last 4 months (%).
Hospitalization TotalAge group
60-64 65-69 70-74 ≥75
Total 409 100% 115 100% 92 100% 74 100% 128 100%
None 363 88,8% 105 91,3% 81 88,0% 66 89,2% 111 86,7%
1 night or more 46 11,2% 10 8,7% 11 12,0% 8 10,8% 17 13,3%
Male 140 100% 46 100% 32 100% 28 100% 34 100%
None 123 87,9% 42 91,3% 27 84,4% 25 89,3% 29 85,3%
1 night or more 17 12,1% 4 8,7% 5 15,6% 3 10,7% 5 14,7%
Female 269 100% 69 100% 60 100% 46 100% 94 100%
None 240 89,2% 63 91,3% 54 90,0% 41 89,1% 82 87,2%
1 night or more 29 10,8% 6 8,7% 6 10,0% 5 10,9% 12 12,8%
Source: DGIS/STP. Survey on Health, Welfare and Aging (SABE). Paraguay 2017.
CHAPTER 7. Use and access to medication Majority of older adults (88.5%) take at least one medicine (Table 7.7), and more people of the female population are using more than
one medicine in all age groups.
According to Table 7.8, approximadely one in ten older adults (9.1% in total, 7.4% in male, 10.1% in female) discontinued taking
medicine because of cost, and those were most frequent in the females with 60 – 64 years old and in the males with 70-74 year old.
While three in one older adults (28.5% in total, 31.0% in male and 27.2% in female) are using medicines at no cost, while most of the
older adults spend some cost (Table 7.9). This implies that for older adults living in poverty have to some degree unaccessibility to
medicines and this may impede their timely management of health issues and eventually affect on their well-being.
Table 7.7. Distribution of the older adult population according to age group, by sex and use of medications (%).
Use of medication TotalAge group
60-64 65-69 70-74 ≥75
Total 487 100% 147 100% 110 100% 84 100% 146 100%
At least one 431 88,5% 127 86,4% 97 88,2% 73 86,9% 134 91,8%
None 51 10,5% 19 12,9% 10 9,1% 11 13,1% 11 7,5%
Not available 5 1,0% 1 0,7% 3 2,7% - - 1 0,7%
Male 190 100% 69 100% 44 100% 37 100% 40 100%
At least one 155 81,6% 57 82,6% 34 77,3% 29 78,4% 35 87,5%
None 32 16,8% 11 15,9% 8 18,2% 8 21,6% 5 12,5%
Not available 3 1,6% 1 1,4% 2 4,5% - - - -
Female 297 100% 78 100% 66 100% 47 100% 106 100%
At least one 276 92,9% 70 89,7% 63 95,5% 44 93,6% 99 93,4%
None 19 6,4% 8 10,3% 2 3,0% 3 6,4% 6 5,7%
Not available 2 0,7% - - 1 1,5% - - 1 0,9%
Source: DGIS/STP. Survey on Health, Welfare and Aging (SABE). Paraguay 2017.

SABE SURVEY Main Results JUNE 2018HEALTH, WELL-BEING AND AGING IN ASUNCION, PARAGUAY
198 199
CHAPTER 7. Table 7.8. Distribution of the older adult population according to age group, by sex and the reasons for interruption of medications in the last year (%).
Reasons for interruption of medications
TotalAge group
60-64 65-69 70-74 ≥75
Total 486 147 110 83 146
Cost 44 9,1% 17 11,6% 9 8,2% 9 10,8% 9 6,2%
Medication was not available
15 3,1% 4 2,7% 5 4,5% 2 2,4% 4 2,7%
Did not have transportation
3 0,6% - - - 2 2,4% 1 0,7%
Does not like to take medications
10 2,1% 3 2,0% 2 1,8% 0 0,0% 5 3,4%
Was not interrupted 379 78,0 110 74,8% 81 73,6% 67 80,7% 121 82,9%
Other1/ 35 7,2% 13 8,8% 10 9,1% 4 4,8% 8 5,5%
No response 6 1,2% 1 0,7% 3 2,7% - 2 1,4%
Male 190 69 44 37 40
Cost 14 7,4% 5 7,2% 3 6,8% 4 10,8% 2 5%
Medication was not available
6 3,2% 1 1,4% 2 4,5% 2 5,4% 1 2,5%
Did not have transportation
1 0,5% - - - - 1 2,7% - -
Does not like to take medications
5 2,6% - 2 4,5% - 3 7,5%
Was not interrupted 148 77,9% 56 81,2% 32 72,7% 29 78,4% 31 77,5%
Other1/ 14 7,4% 6 8,7% 3 6,8% 2 5,4% 3 7,5%
No response 3 1,6% 1 1,4% 2 4,5% - - -
Female 296 78 66 46 106
Cost 30 10,1% 12 15,4% 6 9,1% 5 10,9% 7 6,6%
Medication was not available
9 3,0% 3 3,8% 3 4,5% - - 3 2,8%
Did not have transportation
2 0,7% - - - - 1 2,2% 1 0,9%
Does not like to take medications
5 1,7% 3 3,8% - - - - 2 1,9%
Was not interrupted 231 78,0% 54 69,2% 49 74,2% 38 82,6% 90 84,9%
Other1/ 31 7,1% 7 9,0% 7 10,6% 2 4,3% 5 4,7%
No response 3 1,0% - - 1 1,5% - - 2 1,9%
Source: DGIS/STP. Survey on Health, Welfare and Aging (SABE). Paraguay 2017.1/ Incluye: el médico le suspendió, no le hacía bien, etc.Precisions on the table: The sum of the percentages does not coincide with 100% because it corresponds to a variable with multiple responses
CHAPTER 7. Table 7.9. Distribution of the older adult population according to age group, by sex and expenditure on medicines in the last month (%).
Expenditure on medicines TotalAge group
60-64 65-69 70-74 ≥75
Total 431 100% 127 100% 97 100% 73 100% 134 100%
None 123 28,5% 36 28,3% 32 33,0% 19 26,0% 36 26,9%
50.000 GS or less 82 19,0% 33 26,0% 19 19,6% 13 17,8% 17 12,7%
50.001 GS. - 100.000 GS. 54 12,5% 16 12,6% 12 12,4% 9 12,3% 17 12,7%
100.001 GS. - 250.000 GS. 74 17,2% 20 15,7% 17 17,5% 15 20,5% 22 16,4%
250.001 GS. - 500.000 GS. 56 13,0% 9 7,1% 13 13,4% 9 12,3% 25 18,7%
500.001 GS. - 1.000.000 GS. 24 5,6% 6 4,7% 2 2,1% 6 8,2% 10 7,5%
1.000.001 GS. - 3.000.000 GS. 5 1,2% 1 0,8% 1 1,0% 1 1,4% 2 1,5%
3.000.001 GS. - 7.000.000 GS. 1 0,2% - - - - - - 1 0,7%
Does not know /No response 12 2,8% 6 4,7% 1 1,0% 1 1,4% 4 3,0%
Male 155 100% 57 100% 34 100% 29 100% 35 100%
None 48 31,0% 14 24,6% 14 41,2% 10 34,5% 10 28,6%
50.000 GS or less 35 22,6% 18 31,6% 6 17,6% 5 17,2% 6 17,1%
50.001 GS. - 100.000 GS. 13 8,4% 8 14,0% 4 11,8% - - 1 2,9%
100.001 GS. - 250.000 GS. 24 15,5% 8 14,0% 6 17,6% 5 17,2% 5 14,3%
250.001 GS. - 500.000 GS. 22 14,2% 5 8,8% 3 8,8% 6 20,7% 8 22,9%
500.001 GS. - 1.000.000 GS. 8 5,2% 2 3,5% - - 3 10,3% 3 8,6%
1.000.001 GS. - 3.000.000 GS. 1 0,6% - - - - - - 1 2,9%
3.000.001 GS. - 7.000.000 GS. - - - - - - - - - -
Does not know /No response 4 2,6% 2 3,5% 1 2,9% - - 1 2,9%
Female 276 100% 70 100% 63 100% 44 100% 99 100%
None 75 27,2% 22 31,4% 18 28,6% 9 20,5% 26 26,3%
50.000 GS or less 47 17,0% 15 21,4% 13 20,6% 8 18,2% 11 11,1%
50.001 GS. - 100.000 GS. 41 14,9% 8 11,4% 8 12,7% 9 20,5% 16 16,2%
100.001 GS. - 250.000 GS. 50 18,1% 12 17,1% 11 17,5% 10 22,7% 17 17,2%
250.001 GS. - 500.000 GS. 34 12,3% 4 5,7% 10 15,9% 3 6,8% 17 17,2%
500.001 GS. - 1.000.000 GS. 16 5,8% 4 5,7% 2 3,2% 3 6,8% 7 7,1%
1.000.001 GS. - 3.000.000 GS. 4 1,4% 1 1,4% 1 1,6% 1 2,3% 1 1,0%
3.000.001 GS. - 7.000.000 GS. 1 0,4% - - - - - - 1 1,0%
Does not know /No response 8 2,9% 4 5,7% - - 1 2,3% 3 3,0%
Source: DGIS/STP. Survey on Health, Welfare and Aging (SABE). Paraguay 2017.
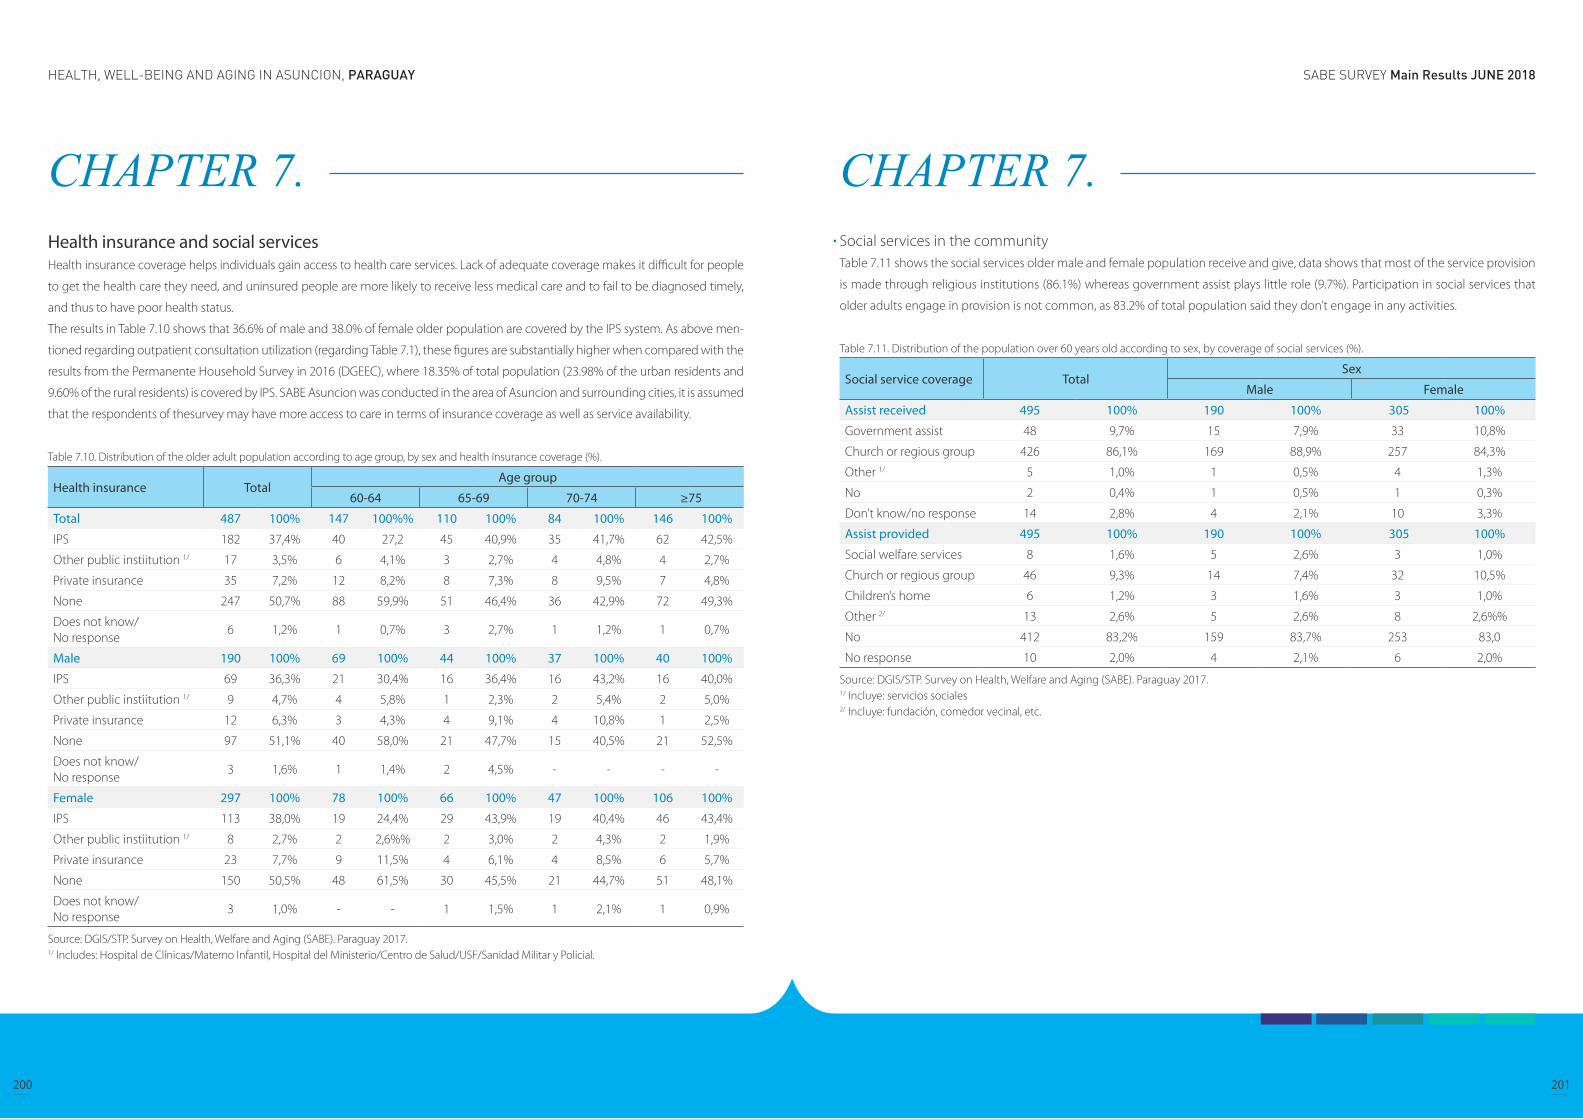
SABE SURVEY Main Results JUNE 2018HEALTH, WELL-BEING AND AGING IN ASUNCION, PARAGUAY
200 201
CHAPTER 7. Health insurance and social services Health insurance coverage helps individuals gain access to health care services. Lack of adequate coverage makes it difficult for people
to get the health care they need, and uninsured people are more likely to receive less medical care and to fail to be diagnosed timely,
and thus to have poor health status.
The results in Table 7.10 shows that 36.6% of male and 38.0% of female older population are covered by the IPS system. As above men-
tioned regarding outpatient consultation utilization (regarding Table 7.1), these figures are substantially higher when compared with the
results from the Permanente Household Survey in 2016 (DGEEC), where 18.35% of total population (23.98% of the urban residents and
9.60% of the rural residents) is covered by IPS. SABE Asuncion was conducted in the area of Asuncion and surrounding cities, it is assumed
that the respondents of thesurvey may have more access to care in terms of insurance coverage as well as service availability.
Table 7.10. Distribution of the older adult population according to age group, by sex and health insurance coverage (%).
Health insurance TotalAge group
60-64 65-69 70-74 ≥75
Total 487 100% 147 100%% 110 100% 84 100% 146 100%
IPS 182 37,4% 40 27,2 45 40,9% 35 41,7% 62 42,5%
Other public instiitution 1/ 17 3,5% 6 4,1% 3 2,7% 4 4,8% 4 2,7%
Private insurance 35 7,2% 12 8,2% 8 7,3% 8 9,5% 7 4,8%
None 247 50,7% 88 59,9% 51 46,4% 36 42,9% 72 49,3%
Does not know/ No response
6 1,2% 1 0,7% 3 2,7% 1 1,2% 1 0,7%
Male 190 100% 69 100% 44 100% 37 100% 40 100%
IPS 69 36,3% 21 30,4% 16 36,4% 16 43,2% 16 40,0%
Other public instiitution 1/ 9 4,7% 4 5,8% 1 2,3% 2 5,4% 2 5,0%
Private insurance 12 6,3% 3 4,3% 4 9,1% 4 10,8% 1 2,5%
None 97 51,1% 40 58,0% 21 47,7% 15 40,5% 21 52,5%
Does not know/ No response
3 1,6% 1 1,4% 2 4,5% - - - -
Female 297 100% 78 100% 66 100% 47 100% 106 100%
IPS 113 38,0% 19 24,4% 29 43,9% 19 40,4% 46 43,4%
Other public instiitution 1/ 8 2,7% 2 2,6%% 2 3,0% 2 4,3% 2 1,9%
Private insurance 23 7,7% 9 11,5% 4 6,1% 4 8,5% 6 5,7%
None 150 50,5% 48 61,5% 30 45,5% 21 44,7% 51 48,1%
Does not know/ No response
3 1,0% - - 1 1,5% 1 2,1% 1 0,9%
Source: DGIS/STP. Survey on Health, Welfare and Aging (SABE). Paraguay 2017.1/ Includes: Hospital de Clínicas/Materno Infantil, Hospital del Ministerio/Centro de Salud/USF/Sanidad Militar y Policial.
CHAPTER 7. Social services in the communityTable 7.11 shows the social services older male and female population receive and give, data shows that most of the service provision
is made through religious institutions (86.1%) whereas government assist plays little role (9.7%). Participation in social services that
older adults engage in provision is not common, as 83.2% of total population said they don’t engage in any activities.
Table 7.11. Distribution of the population over 60 years old according to sex, by coverage of social services (%).
Social service coverage TotalSex
Male Female
Assist received 495 100% 190 100% 305 100%
Government assist 48 9,7% 15 7,9% 33 10,8%
Church or regious group 426 86,1% 169 88,9% 257 84,3%
Other 1/ 5 1,0% 1 0,5% 4 1,3%
No 2 0,4% 1 0,5% 1 0,3%
Don’t know/no response 14 2,8% 4 2,1% 10 3,3%
Assist provided 495 100% 190 100% 305 100%
Social welfare services 8 1,6% 5 2,6% 3 1,0%
Church or regious group 46 9,3% 14 7,4% 32 10,5%
Children’s home 6 1,2% 3 1,6% 3 1,0%
Other 2/ 13 2,6% 5 2,6% 8 2,6%%
No 412 83,2% 159 83,7% 253 83,0
No response 10 2,0% 4 2,1% 6 2,0%
Source: DGIS/STP. Survey on Health, Welfare and Aging (SABE). Paraguay 2017.1/ Incluye: servicios sociales2/ Incluye: fundación, comedor vecinal, etc.

SABE SURVEY Main Results JUNE 2018HEALTH, WELL-BEING AND AGING IN ASUNCION, PARAGUAY
202 203
CHAPTER 8. Conclusion and Discussions
The data presented in this document allow a characterization of the older adult population with 60 years old and over, through mul-
tiple dimensions related to their quality of daily life, so that it can be used as a guide in the elaboration of public policies in favor of
this sector of the population.
SABE Asunción Survey collected information from 487 questionnaires applied to older adults with 60 years old and over, residents
of Asunción and 8 districts of the Central Department (Mariano Roque Alonso, Lambaré, Fernando de la Mora, Luque, Limpio, San
Lorenzo, Villa Elisa and Ñemby).
Among the main results, it is highlighted that approximately 40% of the older adults interviewed are in the age group of 65 to 74
years old; also, the proportion of those who have been married or united is greater in comparison to those who have not been in that
situation, this scenario is observed for both men and women.
Children are a main source of support in the development of the older adults daily life, and sometimes is the only resource they have,
the findings of SABE indicate that there is a greater percentage of those who had 2 to 4 children in comparison with those who had
one or no children. On the other hand, one in ten older adults mentioned that at least one of their parents are still alive.
There is a great difference in the group of 65 to 69 years old, where women live alone to a greater extent than men. On the other hand,
men tend to live alone with their partner in larger proportions than women, especially as age advances.
The proportion of women in households with co-residnents, such as other relatives, non-relatives, widowed children, is greater than
that of men as the age increases.
Schooling in general is low, it is observed that 6 out of 10 older adults have 1 to 6 years of study.
Generally, third age is though as the time for retirement and rest, but the results show that only 1 in 10 older adults are retired or
pensioned, 38.1% continue working.
The economic income of the majority of the older adults is very low, sometimes it does not even satisfy the basic needs, for which, to
a greater extent, it depends of the family support.
To assess population health status, SABE Asuncion survey included questions for self-rated health staus as well as experience of
diagnosis by a clinician. Although it is a subjective assessment tool, self-rated health status can be a valid and reliable health status
measure for a respondent without cognitive impairment. In the previous studies, it was proved that the self-rated health status has
significant association with health conditions such as cardiovascular and cerebrovascular diseases, visual impairment and mental
illness. Moreover, self-rated health also may have more significant implication in ration to socioeconomic inequality and population
health. It had been discovered in previous studies that inequality indicators such as shorter schooling years and lower income status
are related to poor perception of health.
CHAPTER 8. Conclusion and Discussions
HEALTH, WELL-BEING AND AGING IN ASUNCION, PARAGUAY
204
CHAPTER 8. In case of the older adults in Paraguay, most people perceive themselves to be good (good, very good, or excellent) health, and
the relationship between health and inequality variables (such as schooling years and income sufficiency) were not explicitly linear.
However, people with more years of education were more likely to rate themselves in good or very good health then poor health,
while people who received only primary education (1 to 6 years) tend to perceive themselves to be fair to bad health, and it also was
discovered that people with lower income and feel it’s insufficient tend to perceive their health in a fair to poor condition than people
with higher income and feel sufficient of their income. Other health status variables also found to be similarly related to the inequality
variables. For example, the people with only primary (1 to 6 years) education were found to be more likely cognitively impaired than
the people with more education and older adults without income are most likely suffer from cognitive deterioration, while less likely
among the people who perceive they have sufficient income are cognitively deteriorated.
In terms of health in relation to behaviors and habits, it is noted that more than 70% of total population over 60 years old in Paraguay
are either overweight or obese (35.1% and 35.5, respectively) and that more women are obese (39.7%) than men (29.0%). Obesity
is considered to be related to diet, physical activities, as well as other socioeconomic factors, and also related to conditions such as
diabetes and cardiovascular diseases. This result may be related to general excessive calorie intake on a daily basis with the tradition
food choice that are high in calories, as well as low level of physical activities. On the other hand, 4.0% of total population (2.7% of
male and 4.9% of female) reported to be underweight. Being underweight can be especially serious for older people, as it increases
the risk of health problems, including bone fracture in case of fall and weakens the general immune system, thus making people
more susceptible to infections.
Older adults are disproportionally affected by chronic conditions and in Paraguay, hypertension, arthritis, are diabetes are most preva-
lent. In all three conditions, female suffers more frequently than male population. Although this was based on self reporting and can’t
determine if accurately represents the prevalence, the prevalence rate is also rather noticeable in terms of access to care. That is, a
condition such as hypertension can be diagnosed with simple technique and equipment that are widely available in the country’s
primary level health service. On the other than, health issues such as cardiovascular or cerebrovascular conditions are more difficult
to deterime with necessity of more complicated equipment and technologies that are only available at a certain level services in a
limited location within the country.
To collect information from older adults especially regarding health issues that are gender speficic occurance or gender sensitive
nature, it is assumed that more consideration in terms of question delivery will be necessary. For example, some of the information
regarding menopause and related medical procedure may have implication of social culture and taboo as well as accessibility to
care. On the other hand, general clarification of terminology may worth emphysized again in survey administration. For example,
major complaints and issues of urology conditions are naturally different in male and female sexes, therefore problems/difficulties in
urinating for a female older person may typically mean incontinence, whereas the same may mean for a male older person a issue
regarding prostate health.