Embed Size (px)
Citation preview
Equity Research – Investment Notes
ENERGY AND ENERGY POLICY
A COST BENEFIT ANALYSIS OF ELECTRIC AND HYBRID ELECTRIC VEHICLES
PRESENTED BY: JAWAD ARSHAD JAWWAD ZAKARIA DAVID SUNG RAYMOND CHI EDUARDO CISNEROS ZACHARIAS BOURAS
1

Equity Research – Investment Notes
ACKNOWLEDGEMENTS:
We would like to acknowledge and thank the following people:
Professor George Tolley, University of Chicago
Professor R. Stephen Berry, University of Chicago
Jing Wu, University of Chicago
Jaeyoon Lee, University of Chicago
2
Equity Research – Investment Notes
CONTENTS Abstract…………………………………………………………………..….5
Introduction………………………………………………………………....6
1. Reason for Electric Vehicles…………………………………………..8
2. Reasons For Internal Combustion Engine Vehicles …………........13
3. Hydrogen as an alternative to electricity…………………………...17
4. Electric Range Problems …………...…………………………….....22
5. Cost Benefit Analysis …………...…………………………………...32
6. Cost Efficiency Analysis of Low Cost Ice Versus Alternative of Ice
Versus Alternative Energy Vehicles ………………………………..33
7. Cost Benefit Analysis Of The Tesla S Vs. Luxury Sedans………...41
8. Quantifying The Unquantifiable…….……………………………....48
9. Conclusion…………………………………………………………….56
10.Sources………………………………………………………………..58
3

Equity Research – Investment Notes
TABLES 4.1 Electric Vehicle Comparison
5.1 Fuel Price Efficiency 6.1 Consumer Present Value (PV) of Fuel Savings from Increased MPG
7.1 Competitor List 7.2 Present Value Determination Data
7.3 Savings based on Present Value Calculations
FIGURES 1.1 Gasoline vs. Electric: Cost to drive 27 miles 1.2 Coming off the line Electric vs. Gasoline
2.1 Emission ReductionPotential 3.1 Steam Reforming Schematic
3.2 Chemical Reactions 3.3 Renewable Hydrogen vs Renewable Electricity
4.1 Air Aluminum Battery Schematic 4.2 CO2 Limitation
4.3 Air Aluminum Battery Cartridge 4.4 Water Refill
5.1 Present Value Equation one 5.2 Hybrid Break Even 5.3 Electric Break Even
6.1 Market Size 6.2 Discounted Estimation Electric Vehicles
6.3 Oil Importation 6.4 Projected Oil Imports
6.5 Pollutants 6.6 Lives Saved (VSL)
4
Equity Research – Investment Notes
ABSTRACT
As the inevitable exhaustion of fossil fuel resources looms nearer, mankind has begun
the necessary task of converting its energy economy from a chemical to an electrical base.
One of the most significant components of the new electrical energy economy is the electric
vehicle. Investors, corporations, and governments have turned to the electric vehicle as a
means towards reducing greenhouse gas emissions and reliance on fossil fuel resources.
Thoroughly assessing the mechanical advantages of the electric vehicle compared to the
internal combustion engine vehicle, disproving the feasibility of the closest renewable
competitor (hydrogen fuel cell vehicles), discussing methods to mitigate the current
shortcomings of electric vehicles, followed by conducting a costbenefit analysis considering
the micro and macroeconomic effects of an electric vehicle economy will demonstrate that
the battery electric vehicle is the most feasible, efficient, and sustainable successor to the
traditional internal combustion engine vehicle.
KEYWORDS: batteries, charging infrastructure, cost efficiency, electric vehicles, energy,
energy efficiency, fuel cost, greenhouse gas emissions, hydrogen fuel cells, macroeconomic
benefit, Tesla
5
Equity Research – Investment Notes
INTRODUCTION
Electric vehicles (EVs) refer to vehicles that use electric motors for propulsion, with
electrical energy stored in rechargeable battery packs. Due to the use of electrical energy and
lack of combustion products, these vehicles have negligible emissions compared to their
gasolinepowered counterparts, and thus are considered better for the environment. To better
understand the advantages of electric vehicles, we will provide a basic outline of their inner
workings. The key components of an electric car are the electric motor, the motor’s controller
and the rechargeable battery packs. These components are connected such that the controller
uses the power stored in the batteries and delivers it to the motor while a potentiometer
attached to the accelerator pedal delivers signals to the controller to indicate how much
power should be delivered.
The motor used can be either an AC or DC motor. A DC motor usually runs on a
voltage between 96 to 192 volts and most of these DC motors that are used in electric cars
are obtained from forklift industrial vehicles. An AC motor is a threephase motor that makes
use of 240 volts AC and has a 300volt battery pack attached. DC motors usually have a
20,000 to 30,000 watt range and a controller will be in the range of 40,000 to 60,000 watts.
DC motors are usually cheaper and have the option of going into overdrive in short bursts
whereby the motor will permit 100,000 watts and supply up to five times the regular
horsepower. This enables quick bursts of acceleration in short periods of time, but can also
generate significant amounts of heat that could potentially damage the motor. Compared to
DC motors, AC motors utilize regenerative braking, an energy recovery mechanism which
6
Equity Research – Investment Notes
slows down the vehicle by acting as a generator and converting its kinetic energy into
electrical energy which can then be transferred to the rechargeable battery pack.
The battery is the only physical component in an EV that sets it back in comparison to
a gas vehicle, and is thus an important factor in determining the viability of an EV. The
leadacid battery and the lithiumion battery are the two main batteries used in EVs today.
The leadacid battery is heavy, slow to charge and has a very short life span (approximately
34 years). Furthermore, it has a very limited capacity of only about 1215 kilowatthours of
electricity, thus requiring frequent recharging and providing low driving range. The Tesla
Model S makes use of a LithiumIron Phosphate (LiFePO4) battery because it has a longer
lifespan (over 6 years) in addition to a higher power retention rate. It is also approximately
60% lighter than a leadacid battery. These advantages also lead to Liion battery technology
being significantly more expensive. However, given that cars such as Tesla have plans to
mass produce their vehicles, we can expect high production rates of these batteries and thus
lower costs in the near future as more and more electric cars switch to this alternative.
Given this high level overview of EVs, the rest of this paper will focus on evaluating
the viability of EVs in terms of environmental and economic factors. We will first assess the
mechanical advantages of EVs over ICE vehicles and then evaluate the feasibility of
hydrogen fuel cell vehicles. We will then discuss methods to mitigate the current
shortcomings of electric vehicles, followed by a costbenefit analysis considering the micro
and macroeconomic effects of an electric vehicle economy.
7
Equity Research – Investment Notes
REASONS FOR ELECTRIC VEHICLES
The past decade has seen the emergence of electric vehicles with large
automakers such as Nissan venturing into the electric vehicle arena, while newer
companies such as Tesla have made large strides in electric vehicle technology. With the
emergence of these cars, the future of ICE vehicles is thrown into question. Proponents
of EVs claim that their use brings about environmental, financial and operational
benefits.
Batterypowered EVs offer significant environmental advantages over
conventional gasoline or dieselpowered cars. Electric operation reduces tailpipe
emissions and allows the use of cleaner, renewable and more environmentally friendly
energy sources. With EVs, the only exhaust emissions come from power plants that
generate the electricity used to charge the vehicles’ batteries. The amount of greenhouse
gas reduction depends on the how the electricity is generated. Coalfired plants produce
the most greenhouse gases, but even in regions where most electricity is produced by
coal, electric cars can still reduce greenhouse gases by more than 25% compared to
conventional vehicles. These “upstream” emissions are an important part of the equation
when comparing the overall emissions, or “welltowheels,” calculation of EVs
(Holdway 2010) . A study by the Union of Concerned Scientists has found that
regardless of where an EV is plugged in, the emissions produced by an EV are less than
the emissions of an average compact conventional vehicle. When charged by nuclear
power or renewable energy sources such as hydroelectric, wind, or solar power, EVs cut
8
Equity Research – Investment Notes
greenhouse gas emissions even more dramatically. Over time, EVs will become even
more environmentally friendly as additional renewable energy from other technologies
is added to the power grid (Anair 2012) .
The financial benefits of EVs are summarized in a McKinsey report, which
states that scale effects and manufacturing productivity improvements, representing
about onethird of the potential price reductions through 2025, could mostly be captured
by 2015. Savings would come largely from improving manufacturing processes,
standardizing equipment, and spreading fixed costs over higher unit volumes. New
plants could therefore be significantly more productive than those in operation before
201011. Additionally, reductions in materials and components prices, representing
about 25% of the overall savings opportunity, could mostly be captured by 2020.
Component suppliers could reduce their costs dramatically by increasing manufacturing
productivity and moving operations to locations where costs are optimal. Furthermore,
technical advances in cathodes, anodes, and electrolytes could increase the capacity of
batteries by 80% to 110% by 2020–25. These efforts represent 40% to 45% of the
identified price reductions (McKinsey 2012).
EVs also exhibit savings for consumers in terms of driving expenses. According
to a study done by the Union of Concerned Scientists, the average national price of
electricity has remained fairly static over the last decade, whereas the global oil market
has caused the average price of gasoline to rise, drop, spike, dip, and rise again over the
same time period. Hence, driving on electricity will help safeguard customers from
future spikes in the average price of gasoline (Union of Concerned Scientists 2013). The
9
Equity Research – Investment Notes
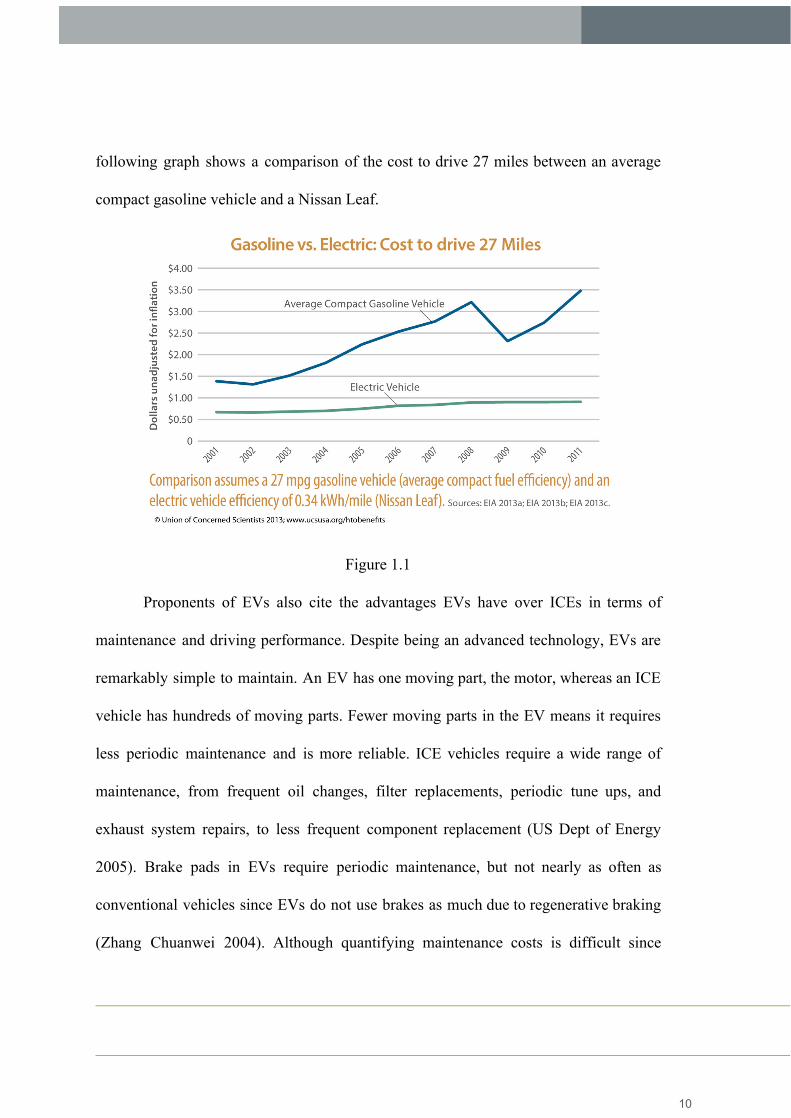
following graph shows a comparison of the cost to drive 27 miles between an average
compact gasoline vehicle and a Nissan Leaf.
Figure 1.1
Proponents of EVs also cite the advantages EVs have over ICEs in terms of
maintenance and driving performance. Despite being an advanced technology, EVs are
remarkably simple to maintain. An EV has one moving part, the motor, whereas an ICE
vehicle has hundreds of moving parts. Fewer moving parts in the EV means it requires
less periodic maintenance and is more reliable. ICE vehicles require a wide range of
maintenance, from frequent oil changes, filter replacements, periodic tune ups, and
exhaust system repairs, to less frequent component replacement (US Dept of Energy
2005). Brake pads in EVs require periodic maintenance, but not nearly as often as
conventional vehicles since EVs do not use brakes as much due to regenerative braking
(Zhang Chuanwei 2004). Although quantifying maintenance costs is difficult since
10
Equity Research – Investment Notes
newer EVs have not been on the roads as long as conventional vehicles, a study
conducted at the Institute for Automotive Research (IFA) at the Nürtingen–Geislingen
University found that EV maintenance can cost 35% less than that of a conventional
vehicle (Diez 2014).
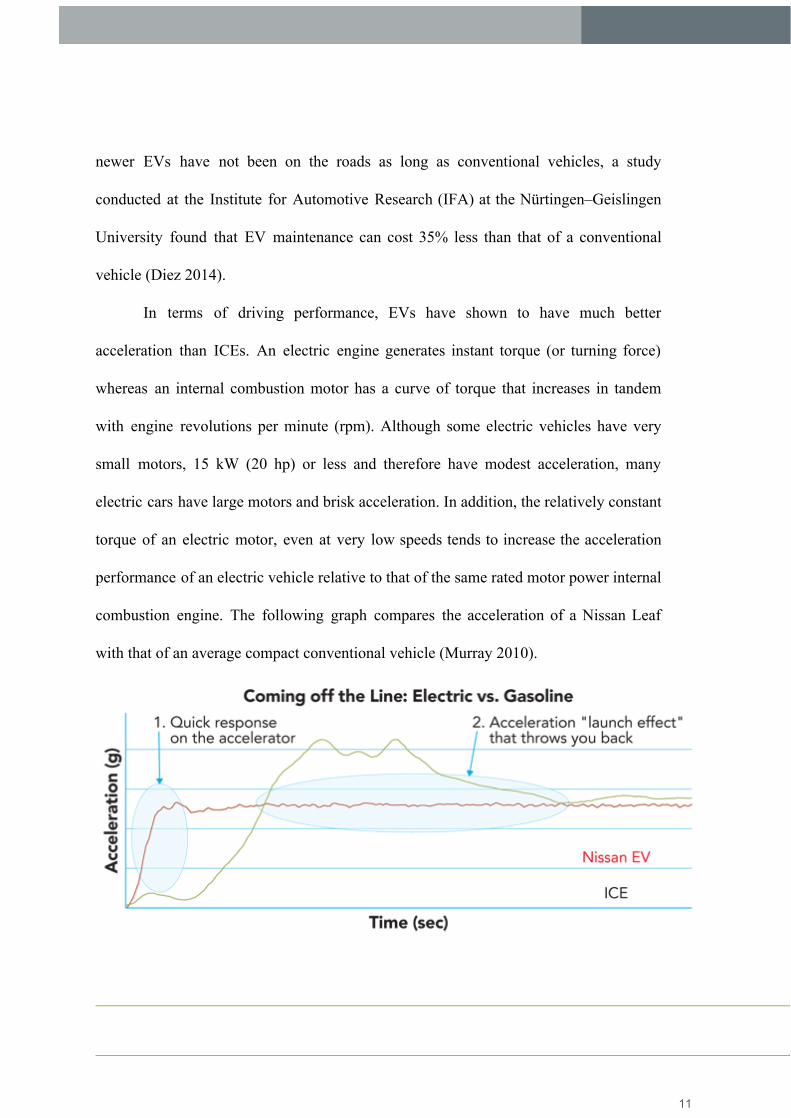
In terms of driving performance, EVs have shown to have much better
acceleration than ICEs. An electric engine generates instant torque (or turning force)
whereas an internal combustion motor has a curve of torque that increases in tandem
with engine revolutions per minute (rpm). Although some electric vehicles have very
small motors, 15 kW (20 hp) or less and therefore have modest acceleration, many
electric cars have large motors and brisk acceleration. In addition, the relatively constant
torque of an electric motor, even at very low speeds tends to increase the acceleration
performance of an electric vehicle relative to that of the same rated motor power internal
combustion engine. The following graph compares the acceleration of a Nissan Leaf
with that of an average compact conventional vehicle (Murray 2010).
11

Equity Research – Investment Notes
Figure 1.2
The graph shows that the Nissan Leaf has a much quicker initial acceleration
than the ICE vehicle. Although the ICE vehicle has a higher acceleration at certain
points, the Nissan Leaf exhibits a much smoother acceleration pattern.
12
Equity Research – Investment Notes
REASONS FOR INTERNAL COMBUSTION ENGINE VEHICLES
Although electric vehicles have shown a lot of promise, it will be some time
before they are fully adopted. Additionally, the transition to alternative means of
transportation will still require use of internal combustion engines. It is no coincidence
that internal combustion engines have been so successful and widely adopted. There are
a few reasons for the success of the internal combustion engine. One of the most
important reasons is that ICEs use efficient fuels like gasoline and diesel. Another
reason for their importance and utility is that because ICEs are so prevalent there’s a
higher incentive to research and improve the efficiency of these engines. Additionally,
there is already a sound infrastructure built specifically for the needs of ICE users.
Also, while ICEs may still produce considerable amounts of emissions, the technology
to reduce emissions is improving. Thus it is reasonable to assume that internal
combustion engines will play a pivotal role in the transition to alternative fuel sources.
ICEs will be needed because other technologies have not yet caught up to the
economiesofscale, power or reliability of ICEs.
Diesel and gasoline are excellent fuel sources because they can safely, for the
most part, be transported in liquid state over a large range of temperatures. This also
allows them to be used in most environments, which adds to their versatility.
Additionally, these fuels have a lot of energy relative to their volume hence they are able
to power engines effectively. Refueling is also very easy and takes but a few minutes.
This contrasts with the high charging times of EVs. High charging times coupled with
shorter ranges create a severe constriction that most consumers are not willing to accept.
13
Equity Research – Investment Notes
Additionally, options to charge are not as widely available as refueling stations are
prevalent. There is an already sound infrastructure to support ICEs. EV support
infrastructure will most likely increase as the technology is adopted more widely but in
the meantime ICEs meet the needs of most.
Even though ICEs do produce emissions, there is plenty of room to increase
efficiency so less fuel is used and also so less emission are emitted. The importance of
ICEs lies in their application in hybrid vehicles. This seems more feasible than a direct
adoption of EVs, which will not be possible until there is improvement in the efficiency
of charging and storing electricity. Already there have been many improvements to the
internal combustion engine since it’s invention. One of these is direct fuel injection,
which involves fuel being pumped directly into the cylinder of the internal combustion
engine. This allows for a higher compression ratio during cycles which also increases
fuel efficiency. (National Research Council, 2013) Additionally as the technology for
engines improves, engines can be reduced in size to achieve similar power while
increasing efficiency since less weight is pulled. The use of direct fuel injection along
with turbochargers has been a popular move by automakers since it increases fuel
economy and offers similar or even better performance. More expensive technologies
like variable lift systems are also available but there is room for improvement to
increase stability for smaller engines so these can be implement at a more cost effective
level. Most of these improvements lie in using computers to electronically control the
mechanisms in place of camshafts, which will allow for greater control.
14
Equity Research – Investment Notes
Newer technologies, in addition to improving older systems, are also being
developed like homogenous–charge compression ignition which combines some
features of the diesel and gas engine. At low levels, it operates like a diesel engine using
pressure and heat compression for combustion. However, fuel is already injected before
the compression stroke of the ICE. At higher operating levels, a spark plug provides
combustion much like a gasoline engine. As the technology to control switching
between levels improves, this type of ignition could significantly help increase
efficiency and conserve fuel. There is also the possibility of improving current flexfuel
engines by increasing their ability to effectively use the higher octane of cornbased
ethanol. A similar system to the HCCI that allows an engine to run on gasoline at lower
levels and flex fuel at higher operating levels is one way that efficiency could increased.
In addition to engines, the structural materials, weightreduction techniques and
aerodynamics of traditional cars can also be improved. There are prohibitive cost factors
in implementing some of these technologies because they are still expensive. An
example of this is the use of carbon fiber to reduce weight. However, carbon fiber that is
strong enough to be used in automobiles is significantly more expensive than current
alternatives. Additionally, efficiency improvements for accessories, such as air
conditioning and other electronics, are other areas which automakers are currently
researching for improvements. The coupling of improvements in mechanical and
structural hold much promise for increasing efficiency in internal combustion engines.
This will further add to the utility and lifespan of ICE’s.
15
Equity Research – Investment Notes
EmissionsReduction Potential
Figure 2.1
16
Equity Research – Investment Notes
HYDROGEN AS AN ALTERNATIVE TO ELECTRICITY:
Thus far, we have focused on ICE vehicles as a benchmark to establish the relative
advantages of electric vehicles. The reasoning for this is simple: electric vehicles are the only
renewable energy vehicles that are close competitors to ICE vehicles. We will support this
claim by demonstrating that the next closest renewable competitor, hydrogen vehicles, are
not a feasible solution to the problem of creating efficient renewable energy vehicles.
In the vehicle space, calling hydrogen renewable may in fact be a misnomer.
Currently, nearly 95% of hydrogen is produced from natural gas, composed mostly of
methane (Hoffmann 2002). The hydrogen is produced from this methane using a distributed
natural gas steam reforming process which does not provide a significant reduction in
wellstowheels greenhouse gas emissions (compared to ICE or electric vehicles). In his 2014
study, Cox finds that one kilogram of hydrogen produced in the most efficient commercial
route emits a minimum of 14.34kg CO2e versus 11.13kg CO2e for a U.S. gallon of gasoline
(of which 13.2Kg is actual CO2 gas in the case of hydrogen) (Cox 2014). There also exist
difficulties in transporting bulk quantities of hydrogen (namely converting into liquid form
before transport), which lower the feasibility of onsite hydrogen production by preventing
the efficiencies of economies of scale. On top of the current production and transportation
limitations of hydrogen, hydrogen vehicles lack the long term potential for growth that
electric and ICE vehicles have. As such, we have identified three main barriers for hydrogen
vehicles, which are production inefficiencies, transportation and storage costs, and a
foreseeable lack of future growth avenues.
17
Equity Research – Investment Notes
Production inefficiencies arise from inherent properties of hydrogen. Since molecular
hydrogen is not available on earth in convenient natural reservoirs, the manufacture of
hydrogen requires the consumption of a hydrogen carrier (either a fossil fuel, in most cases,
or water). In the case of water, hydrogen is produced using electrolysis which uses electrical
or thermal energy from a primary source, which ironically will be fossil fuels in most cases.
As for producing hydrogen from fossil fuels, manufacturers use the process of steam
reforming. Figure 1 shows a schematic representation of steam the steam reforming process.
Steam Reforming Schematic
Figure 3.1
Steam and hydrocarbon enter the reactor as feedstock, and hydrogen and carbon dioxide are
generated as outputs. The process is facilitated through the following chemical reactions:
18
Equity Research – Investment Notes
Chemical Reactions
Figure 3.2
The first reaction, where methane reacts with water to create carbon monoxide and hydrogen,
is endothermic and so requires a temperature of 850°C for optimal conversion. Again, this
heat is usually supplied by fossil fuels, as current best processes of water electrolysis have an
efficiency of 50% to 80%, so that 1kg of hydrogen (which has a specific energy of 143
MJ/kg, about 40 kWh/kg) requires 50 to 79 kWh of electricity. At 0.08 $/kWh, that's
$4.00/kg of hydrogen, which is 3 to 10 times the price of hydrogen from current steam
reformation of natural gas (EERE 2002). The price differential is a result of the fact that
steam reformation utilizes a direct conversion from fossil fuels to hydrogen, while
electrolysis burns an energy source to create electricity for the hydrogen electrolysis process.
Although we have established that steam reformation is the most efficient process of
producing hydrogen, it is more appropriate to compare electrolysis, the renewable production
method of hydrogen production, with renewable forms of gridproduced electricity. We
believe this is justified due to the fact that about 5% of current hydrogen production is
renewable, while 13% of electricity in 2013 was produced from renewable sources (Bossel
19
Equity Research – Investment Notes
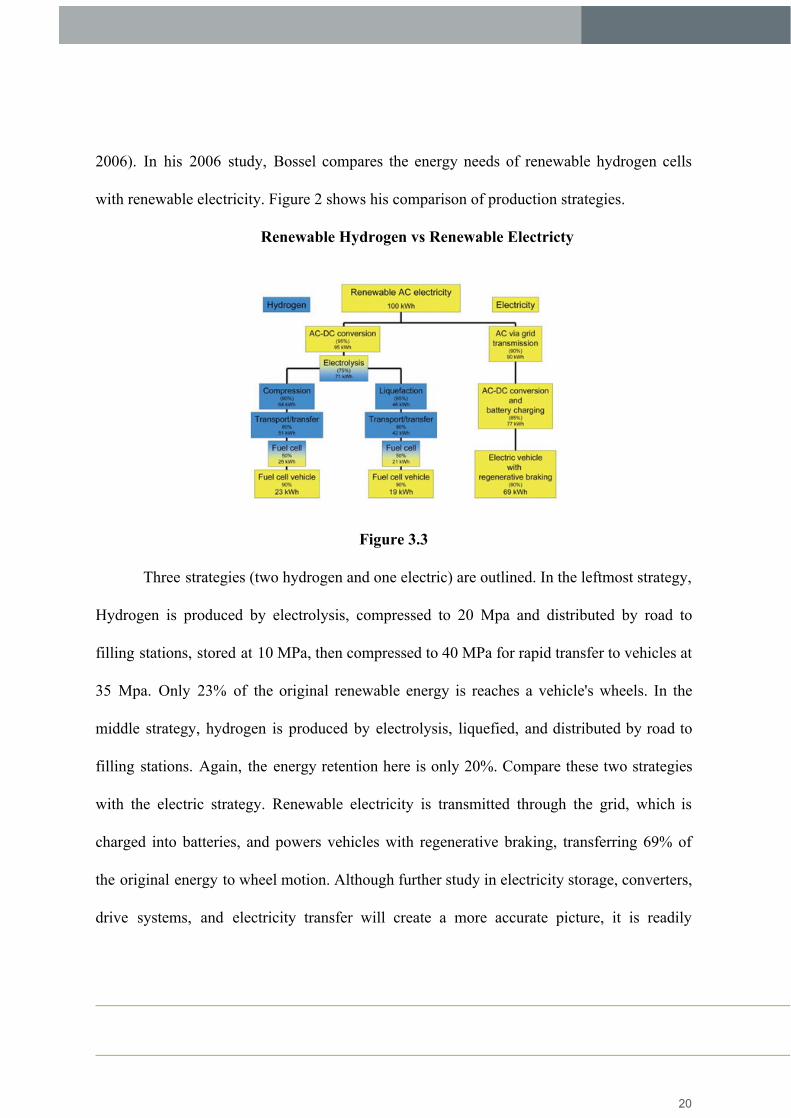
2006). In his 2006 study, Bossel compares the energy needs of renewable hydrogen cells
with renewable electricity. Figure 2 shows his comparison of production strategies.
Renewable Hydrogen vs Renewable Electricty
Figure 3.3
Three strategies (two hydrogen and one electric) are outlined. In the leftmost strategy,
Hydrogen is produced by electrolysis, compressed to 20 Mpa and distributed by road to
filling stations, stored at 10 MPa, then compressed to 40 MPa for rapid transfer to vehicles at
35 Mpa. Only 23% of the original renewable energy is reaches a vehicle's wheels. In the
middle strategy, hydrogen is produced by electrolysis, liquefied, and distributed by road to
filling stations. Again, the energy retention here is only 20%. Compare these two strategies
with the electric strategy. Renewable electricity is transmitted through the grid, which is
charged into batteries, and powers vehicles with regenerative braking, transferring 69% of
the original energy to wheel motion. Although further study in electricity storage, converters,
drive systems, and electricity transfer will create a more accurate picture, it is readily
20
Equity Research – Investment Notes
apparent that hydrogen, an artificial carrier, is much less efficient than electricity, which
serves as renewable hydrogen's own energy source.
Aside from the inherent inefficiencies of hydrogen production, certain properties of
hydrogen prevent ease of storage and transport, preventing economies of scale. Firstly,
hydrogen has a low viscosity of 0.083g/cms x 105 at 1 atm and 20°C. It is very difficult to
prevent leaks from developing in hydrogen pipework; pipework pressuretested for nitrogen
will often leak significantly when handling hydrogen loads. In a highpressure storage
system, hydrogen is estimated to leak 3 times faster than natural gas and 5 times faster than
propane (Pritchard and Rattigan, 2010). Combining hydrogen's propensity to leak with its
very low ignition energy causes an explosion hazard. Because hydrogen readily forms an
explosive mixture with air, the energy necessary to initiate an explosion of a 2:1
hydrogen/oxygen mixture is only about 0.02 mJ, less than one tenth of the energy required to
initiate explosions with other fuels such as methane, LPG, or petrol. In terms of transport,
hydrogen is most easily transported in its liquid form. As we have discussed earlier,
liquefaction will consume about a third of the original hydrogen's energy. Further, the
complications of rapid phase transitions, boiloff, and condensation must be mitigated during
transport. Due to these challenges, producers and regulators are reluctant to build hydrogen
pipelines – which would require extensive materials and integrity testing – and have yet to
start supplying hydrogen refuelling stations through bulk road tanker transport – which
would necessitate thorough risk mitigation of transport through populated or urban areas.
21
Equity Research – Investment Notes
ELECTRIC RANGE PROBLEMS
Most electric vehicles have a maximum range of only 100 miles, which means that
the point of no return is only 50 miles. There are some exceptions including Tesla Motors
vehicles. The longer range is only accomplished through higher capacity batteries and thus a
higher initial price. The problem with this is that batteries are expensive, which is why Tesla
electric vehicles are nearly four times the price of other electric vehicles (Massias, 2011).
Therefore, a solution could be as simple as making batteries cheaper and more efficient.
There is another problem, which is that the batteries cannot take up too much space or be too
heavy. A heavy battery is inefficient because it takes more electric power to move. A battery
cannot take up too much space, because then it would be cumbersome and expensive to build
bulky electric vehicles. Therefore, batteries need to become lighter, cheaper and more
efficient. Another issue is charging times for electric vehicles. Extending the range of electric
vehicles by increasing the size of batteries could lead to even longer charging times.
The range would not be an issue if there was massive infrastructure built around
electric vehicles. However, this infrastructure could be unwieldy and hard to use. although
Tesla is planning to build charging stations. Pumping gas takes little to no time, whereas
charging an electric vehicle takes at least 30 minutes with a Tesla supercharger and
significantly longer with other charging methods. The other inventive solution might be
switching stations. One could drive one’s electric vehicle into the station, take a fully charged
battery and then leave the depleted battery to charge. However, there are a number of
logistical problems with switching stations. First, switching heavy batteries requires
machinery and expertise. The Nissan Leaf’s battery, which is quite standard, weighs around
22
Equity Research – Investment Notes
600lbs (Battuniversity, 2011). A Tesla vehicle’s battery weighs much more and can make up
the entire floor of the car (Fisher, 2013). A trained individual may also be required to operate
machinery to switch the battery, which would add to costs. Second, the switching stations
would have to monitor the batteries being switched, since batteries are expensive and can be
damaged or no longer charge fully. One could simply go to a switching station with a used up
battery that has been worn out or simply broken and switch it. Then, the switching station
would lose money. To prevent such scenarios, one would need a trained individual or some
kind of testing device that tests the batteries. That would be expensive and time consuming.
It is a foreseeable problem switching stations would have to overcome, for them to truly be
fast and efficient. Therefore, at this time switching stations as well as charging stations do
not seem viable. Charging stations take too long and switching stations would probably be
very costly and/or take too long. Hence, electric vehicle range is very important, since
electric vehicles do not have an infrastructure built around them.
The problems with electric vehicle range are numerous and there is no easy fix. One
solution currently is to just have larger batteries, as Tesla does. The problem is that leads to
very expensive cars. Therefore, if a consumer wants an electric vehicle with a larger than 100
mile range, they will have to buy a more expensive luxury vehicle. However, emerging
battery technology does hold promise. If batteries can become cheaper, lighter and more
efficient, electric vehicle ranges can be extended further than 100 miles quite easily. If the
batteries become lighter, the car will weigh less and use less electricity to power. If the
batteries become cheaper, they can reduce the cost of electric vehicles dramatically, allowing
23

Equity Research – Investment Notes
for larger batteries and, thus, greater range. A cheaper electric vehicle means the range can be
extended for fractions of the cost previously. Batteries are indeed becoming better, and
research is being done, so it does seem viable. More efficient batteries can make electric
vehicles much more popular.
24
Equity Research – Investment Notes
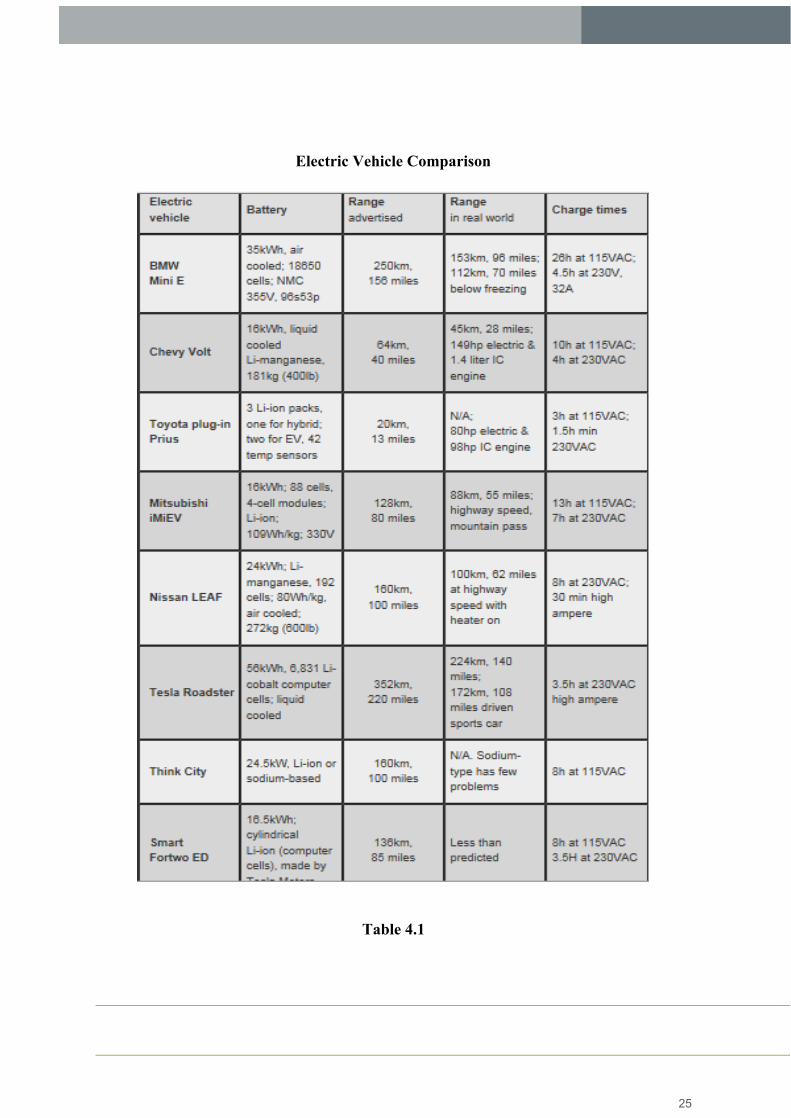
Electric Vehicle Comparison
Table 4.1
25
Equity Research – Investment Notes
There is new battery technology, in the form of an air aluminum battery that is not
rechargeable. The air aluminum battery has the capability of making a subcompact electric
vehicle have a range of over 1,000 miles (Mearian, 2014). The battery just uses air, water and
aluminum. The only issue is that the battery is not rechargeable, but an innovative design
allows for replacement of aluminum cartridges, which makes the battery reusable.
The battery will work in conjunction with a common Lithium ion battery found in
electric vehicles. This will allow the electric vehicle to be driven short distances without
using up the aluminum battery cartridges. The air aluminum battery will kick in effectively
as a range extender. This can ease people’s range anxiety that is currently associated with
electric vehicles.
Aluminumair batteries do wear out under normal use. The aluminum through use
turns into aluminum hydroxide. Worn out aluminumair batteries can be recycled to create
new batteries (Cobb, 2014). This opens the door for feasible electric vehicle infrastructure to
be built around these batteries. Switching stations can be a real possibility in which people
take their used air aluminum batteries and switch them for new ones(Cobb, 2014). Also,
water needs to be added to the battery every couple hundred miles of use, though readily
available tap water can be used.
The only problem with this technology is it is not on the market yet. It has not been
incorporated into current electric vehicle models. The companies claim that travel distances,
26
Equity Research – Investment Notes
purchase prices and lifecycle costs of their aluminumair battery system are comparable to
that of petrol powered vehicles (MacKenzie, 2014).
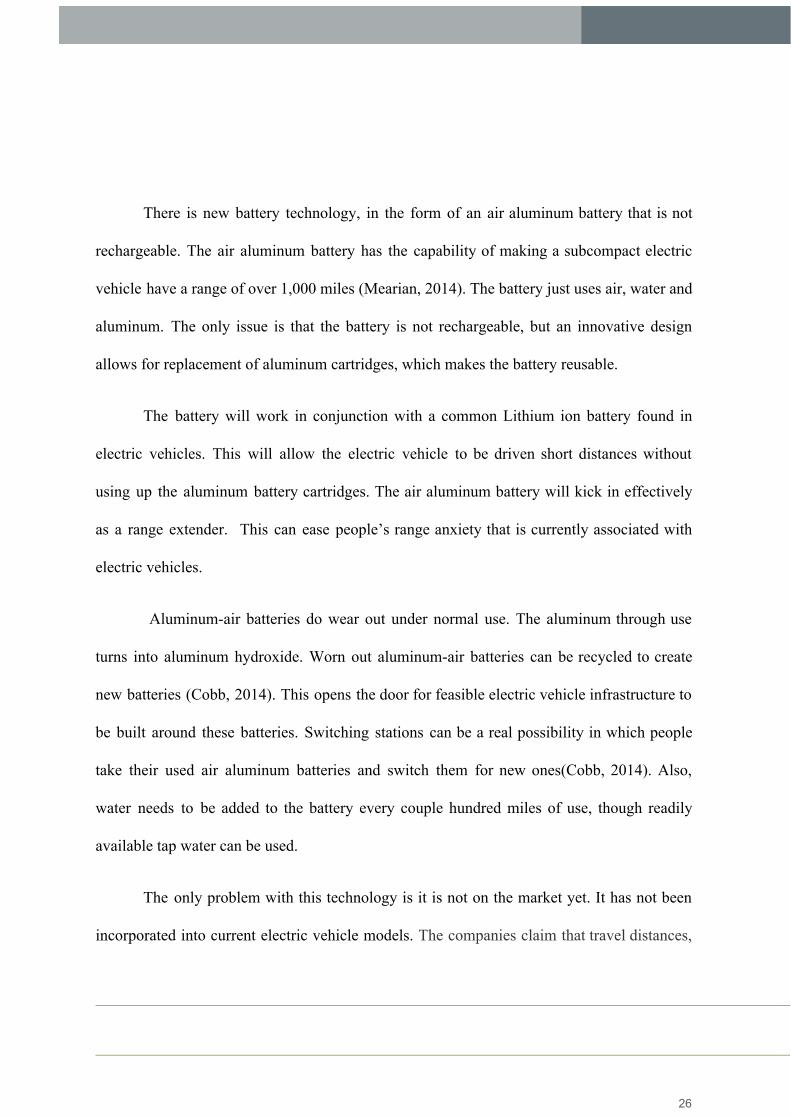
Air Aluminum Battery Schematic
Figure 4.1 Unlike lithiumion batteries, the aluminum air technology relies on a
chemical reaction between aluminum, water and oxygen to create electricity (Cobb,
2014).
27

Equity Research – Investment Notes
CO2 limitation
Figure 4.2 The PhinergyAlcoa team has resolved the lifespan limiting CO2 issue by
developing air electrodes with a silverbased catalyst that allows oxygen into the cell
while blocking CO2 molecules (Cobb, 2014).
28

Equity Research – Investment Notes
Air Aluminum Battery Cartridge
Figure 4.3 What an aluminum cartridge would look like
29
Equity Research – Investment Notes
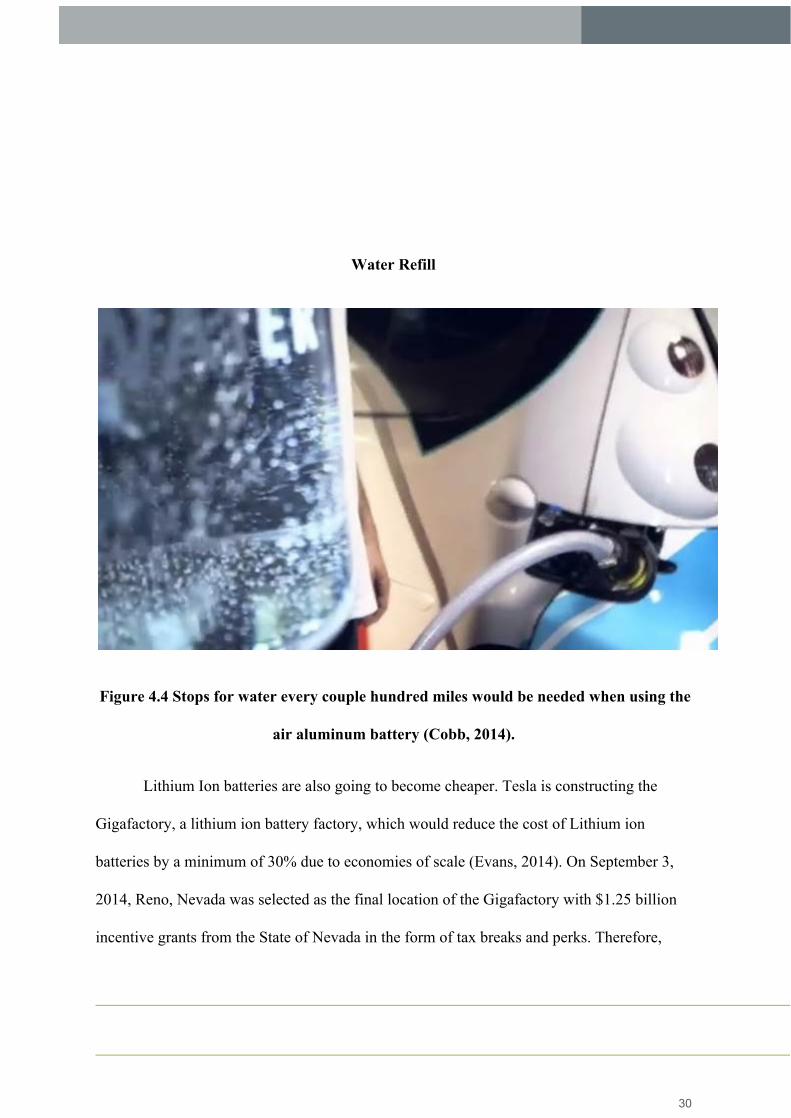
Water Refill
Figure 4.4 Stops for water every couple hundred miles would be needed when using the
air aluminum battery (Cobb, 2014).
Lithium Ion batteries are also going to become cheaper. Tesla is constructing the
Gigafactory, a lithium ion battery factory, which would reduce the cost of Lithium ion
batteries by a minimum of 30% due to economies of scale (Evans, 2014). On September 3,
2014, Reno, Nevada was selected as the final location of the Gigafactory with $1.25 billion
incentive grants from the State of Nevada in the form of tax breaks and perks. Therefore,
30

Equity Research – Investment Notes
Lithium ion batteries will become cheaper, and these savings can be passed on to consumers.
This will allow the feasibility of extending electric vehicle ranges by simply making larger
batteries.
31
Equity Research – Investment Notes
COST BENEFIT ANALYSIS
The most effective way to quantify and analyze the overall benefits of electric
vehicles is through a simple costbenefit analysis. Therefore, we have looked into a
quantitative analysis of both micro factors associated with electric vehicles as well as more
difficult to quantify macro factors involved with these electric vehicles. In the former section,
we will break down two different scenarios. The first is when electric and hybrid electric
vehicles are compared in sensitivity tables to lower cost ICE vehicles. We felt this was the
best approach given that electric vehicles are inherently higher cost yet could produce long
term savings. The next scenario is against similarly priced luxury sedans versus electric
vehicles. Finally, we look into a review of the literature on the effects of oil and our own
estimation of health related effects of electric vehicles. An emphasis here is that our analysis
is not comprehensive given the scope of potential externalities related to these vehicles and
the length of our project time.
32
Equity Research – Investment Notes
COST EFFICIENCY ANALYSIS OF LOW COST ICE VERSUS
ALTERNATIVE OF ICE VERSUS ALTERNATIVE ENERGY VEHICLES
Assumptions:
1) Average of gas costs = $4.00 (U.S. Department of Transportation)
2) Miles driven per year = 12,000 miles (U.S. Department of Transportation)
3) Interest rate = 6% (Ng, Michelle, 2011)
4) Electricity cost = 2.2 cents (Ng, Michelle, 2011)
5) Consumers have no preference toward being “environmentally friendly”.
Electric and Hybrid vehicles have long been seen to be the solution to the problems created
by fossil fuels. With the ability to reduce carbon emissions and reduce negative externalities,
these vehicles can cut the dependence on foreign oil sources. However, the U.S. economies
reluctance to accept the widespread production is puzzling. Thus, this section will analyze
the cost efficiency of alternative energy vehicles. This analysis was done by comparing
hybridelectric and electric cars to an average ICE sedan. More specifically, this research was
done through a lens of an average American consumer using the Chevrolet Volt, Toyota
Prius and Honda Civic as the electric, hybrid and ICE respectively.
33
Equity Research – Investment Notes
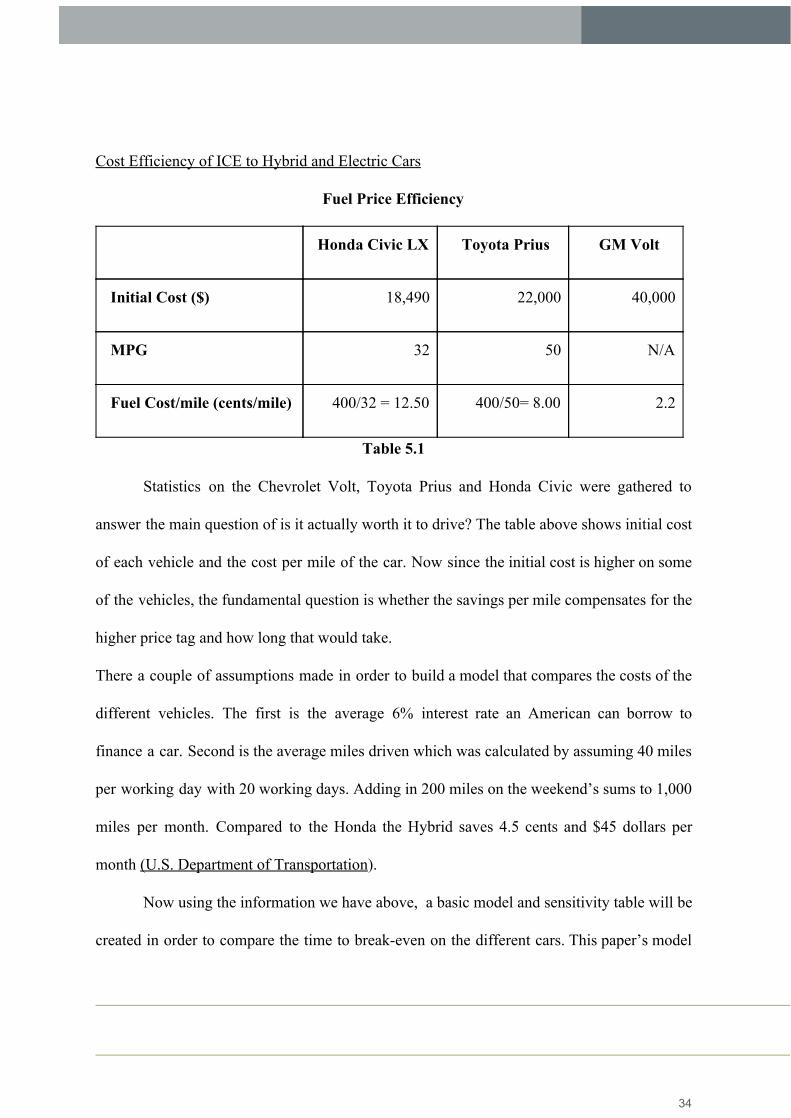
Cost Efficiency of ICE to Hybrid and Electric Cars
Fuel Price Efficiency
Honda Civic LX Toyota Prius GM Volt
Initial Cost ($) 18,490 22,000 40,000
MPG 32 50 N/A
Fuel Cost/mile (cents/mile) 400/32 = 12.50 400/50= 8.00 2.2
Table 5.1
Statistics on the Chevrolet Volt, Toyota Prius and Honda Civic were gathered to
answer the main question of is it actually worth it to drive? The table above shows initial cost
of each vehicle and the cost per mile of the car. Now since the initial cost is higher on some
of the vehicles, the fundamental question is whether the savings per mile compensates for the
higher price tag and how long that would take.
There a couple of assumptions made in order to build a model that compares the costs of the
different vehicles. The first is the average 6% interest rate an American can borrow to
finance a car. Second is the average miles driven which was calculated by assuming 40 miles
per working day with 20 working days. Adding in 200 miles on the weekend’s sums to 1,000
miles per month. Compared to the Honda the Hybrid saves 4.5 cents and $45 dollars per
month (U.S. Department of Transportation).
Now using the information we have above, a basic model and sensitivity table will be
created in order to compare the time to breakeven on the different cars. This paper’s model
34
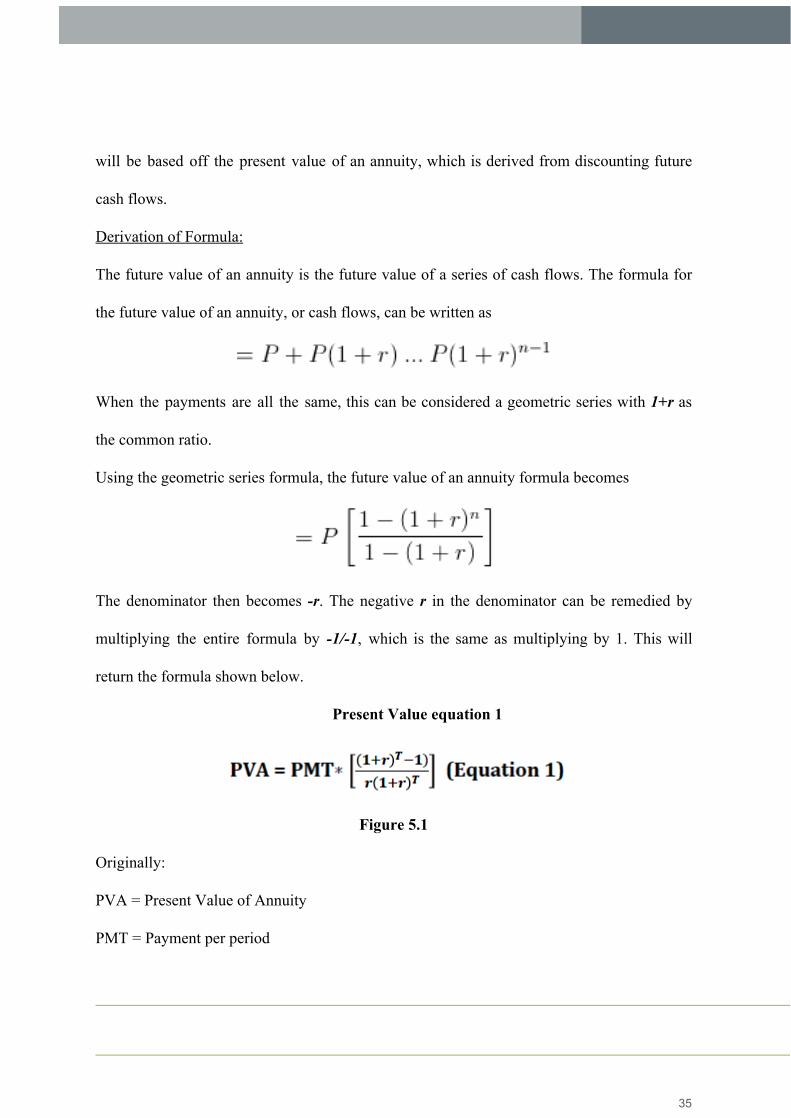
Equity Research – Investment Notes
will be based off the present value of an annuity, which is derived from discounting future
cash flows.
Derivation of Formula:
The future value of an annuity is the future value of a series of cash flows. The formula for
the future value of an annuity, or cash flows, can be written as
When the payments are all the same, this can be considered a geometric series with 1+r as
the common ratio.
Using the geometric series formula, the future value of an annuity formula becomes
The denominator then becomes r. The negative r in the denominator can be remedied by
multiplying the entire formula by 1/1, which is the same as multiplying by 1. This will
return the formula shown below.
Present Value equation 1
Figure 5.1
Originally:
PVA = Present Value of Annuity
PMT = Payment per period
35
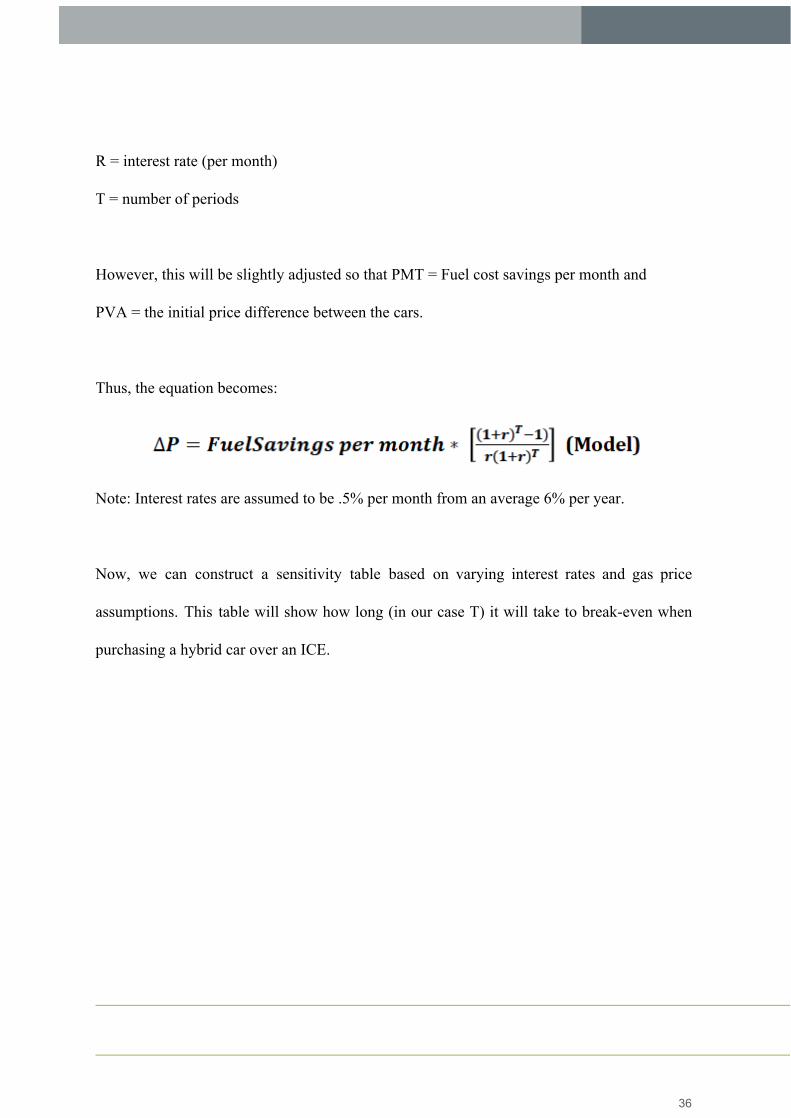
Equity Research – Investment Notes
R = interest rate (per month)
T = number of periods
However, this will be slightly adjusted so that PMT = Fuel cost savings per month and
PVA = the initial price difference between the cars.
Thus, the equation becomes:
Note: Interest rates are assumed to be .5% per month from an average 6% per year.
Now, we can construct a sensitivity table based on varying interest rates and gas price
assumptions. This table will show how long (in our case T) it will take to breakeven when
purchasing a hybrid car over an ICE.
36

Equity Research – Investment Notes
Hybrid Break Even
Figure 5.2
Based on the table above it would take about 7.98 years for an average American to break
even when purchasing a hybrid over a traditional ICE vehicle. These are based off the $4.00
per gallon gas assumption and all other assumptions stated before. “N/A” essentially means
the consumers will not breakeven because of interest rate compounding.
Similarly, another sensitivity table was made for the breakeven time between purchasing a
electric vehicle to ICE.
37
Equity Research – Investment Notes
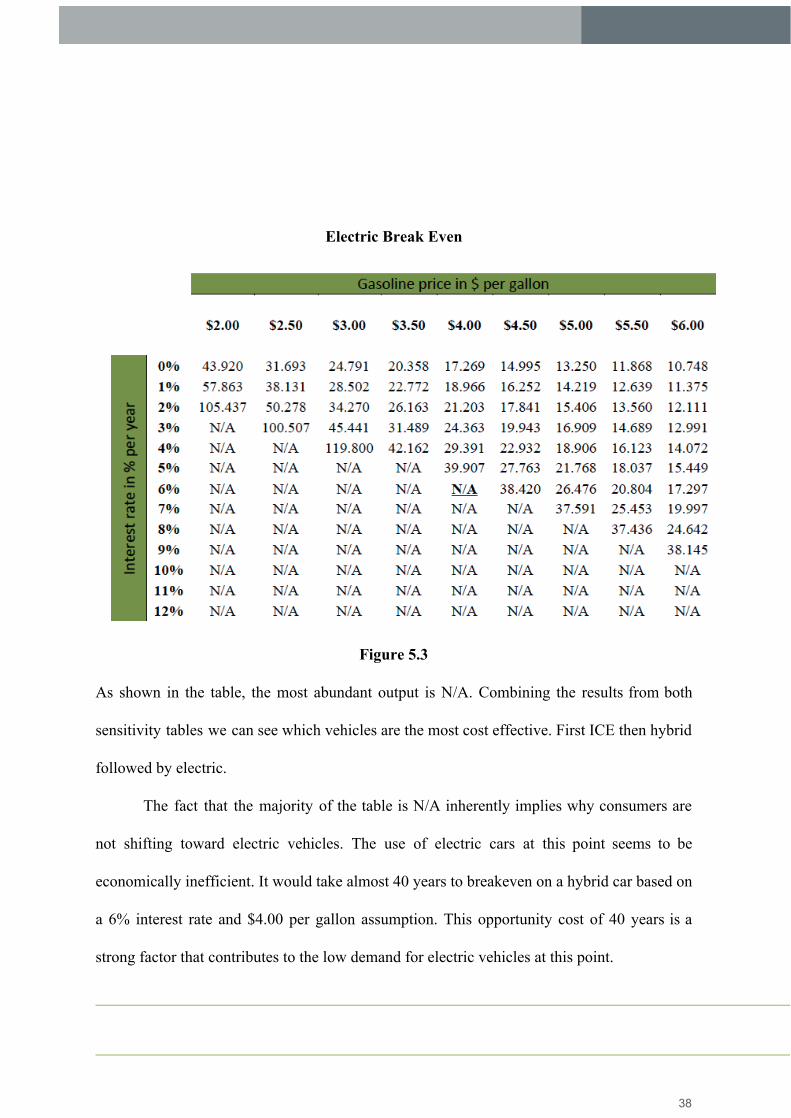
Electric Break Even
Figure 5.3
As shown in the table, the most abundant output is N/A. Combining the results from both
sensitivity tables we can see which vehicles are the most cost effective. First ICE then hybrid
followed by electric.
The fact that the majority of the table is N/A inherently implies why consumers are
not shifting toward electric vehicles. The use of electric cars at this point seems to be
economically inefficient. It would take almost 40 years to breakeven on a hybrid car based on
a 6% interest rate and $4.00 per gallon assumption. This opportunity cost of 40 years is a
strong factor that contributes to the low demand for electric vehicles at this point.
38
Equity Research – Investment Notes
Juxtaposing the Volt, Civic and Prius, the data and model demonstrate that alternative
energy cars in the short and long term are cost inefficient. Even though the Volt and Prius are
much more fuelefficient, the initial cost prevents consumers from purchasing an alternative
energy vehicle.
However, there are many factors that will promote the usage of electric vehicles.
These factors, among others, include economies of scale on the automobile industry,
declining charging costs and subsidies or taxes. These will be discussed more in detail.
Case Study Tesla Model S vs. Nissan Leaf
With codename “whitestar” during its research, Tesla Model S was introduced in
June 2012, after a muchanticipated arrival. The Tesla S is a top of the line luxury sedan that
is fully electric and it received a 5.0 NHTSA safety rating. The Model S actually has two
different options, the 60kWh and 85 kWh batteries. Another similar more affordable car is
the Nissan Leaf(U.S. Department of Energy). The leaf has a 24kWh battery but has smaller
dimensions in comparison. However, beside the battery size there are a couple of features
that are most critical to an electrical vehicle: performance, environmental impact, and
charging.
The performance of the model S is unparalleled at this point in the electric vehicle
market. In terms of miles per charge it has the highest in the market. With the 85kWh battery
fully charged the Tesla model S could go 265 miles, although this varies with weather
conditions and speed of the car. Another important statistic to bring to light is Miles per
Gallon of Gasoline Equivalent (MPGe) where 1 gallon of gasoline = 33.7kWh. The Model S
39
Equity Research – Investment Notes
with the 85kWh battery gets 89 MPGe. In addition to this, the annual fuel cost is roughly
only $700 based on 12,000 annual miles and electricity cost $.12/kWh(U.S. Department of
Transportation 2014). The only real downside to the Tesla’s performance is the initial cost of
$69,900. Combined with low production, this initial cost is preventing most consumers from
buying the Tesla S(US Dept of Energy 2014).
The Nissan Leaf lags slightly in performance in terms of horsepower and acceleration
but it makes up for its weaknesses in fuel savings. The Leaf has 114 MPGe and the fueling
costs only about $550 a year (using the same assumptions as the Tesla). However, the Leaf
can only travel 84 miles on a full charge so this limits the consumer in a variety of
ways(Nissan 2014).
From a purely economical and consumer perspective is it even worth buying the
Tesla Model S? Assuming the consumer does not prefer clean energy, lets quickly analyze
the costs. The national average for the cost of fuel is $3.90 with the comparable large sedan
getting about 22mpg. Also assuming 12,000 miles driven per year, the total fuel cost for a
comparable sedan is $2,659. Assuming the same for the Model S with electricity costing $.12
kWh, the total cost for fuel is $524. Thus, the average savings per year is $2,135.
Consequently, the more a consumer drives the more he or she will save during the year and
vice versa. However, the average luxury sedan costs roughly $50,000, which is almost
$30,000 cheaper than the Tesla S. Thus, with the current technology it would take 15 years to
start saving money(Tesla 2014)
40
Equity Research – Investment Notes
COST BENEFIT ANALYSIS OF THE TESLA S VS HIGH PRICE LUXURY
SEDANS
We conducted a costbenefit analysis with separate assumptions from our main
analysis looking to quantify the potential cost savings by using the Tesla S over the next 8
years versus high price luxury sedans which appear to be the main group where there could
be cost savings. As shown in the previous section, there do not appear to be cost savings in
the short term versus most other types of vehicles. This is an especially relevant analysis
given that this could be the main group of people who would switch over to the newer Tesla
model which is currently the most efficient car in its cost class and could likely be the future
projecting forward of electric vehicles. Therefore, this is why we used it as a model. The
following assumptions were made:
1) The price of 93 octane oil, annual mileage and interest rates will be the same as in the
assumptions in the comparison of an EV and ICE vehicle above.
2) Comparison Car MPG is 21.5 MPG (Combined) for Competitors: BMW 7 Series =
21, Lexus 460 = 20, Mercedes S Class = 22, Audi A8 = 23. Tesla performance
characteristics are closer to these models or to performance models than to the
midrange luxury vehicles. (Kelley Blue Book 2014)
3) Tesla's MPGe per EPA is 96 mpg (Tesla 2014)
4) Annual Gas Price Rate increase is 1.70 %. Set at current inflation. (CPI 2013)
41
Equity Research – Investment Notes
5) Tesla Model S MSRP: $69,900 (Edmunds 2014)
6) Length of Ownership – 8 years (Polk 2014)
7) 200 minutes saved via Gas Station times savings based on an estimate of 40 trips to
the station per year in a normal car
8) $50/hour, for the leisure time of an individual able to afford a Tesla
As per other reports, the present value equation is shown below:
Based on these assumptions and the use of present value calculations over 8 years we
were able to add up the total present value added over this time for regular cars and hybrids.
Calculations:
Price Point Calculation:
The competitors list in Table 7.1 was assimilated and the average MSRP was used to help
calculate the Tesla price premium:
MSRP
BMW 5 $47,800
BMW 7 $73,600
Audi A8 $82,500
Mercedes E $51,900
Mercedes S $92,350
Porsche Panamera $78,100
Lexus LS460 $71,990
42
Equity Research – Investment Notes
Jaguar XJ $73,200
Average MSRP $71,430
Table 7.1
As mentioned in assumption 5, the average MSRP was found to be $69,900. Hence the price
premium here is $71,430 $ 69,900 = $1,530 which will be used later in the cost
effectiveness section.
Discount Factor Calculation:
The initial discount factor of 1 was taken and multiplied by (1+.06). 6% was used as it is the
risk free discount rate cited above. This discounting was taken into account for 8 years.
Gas Price Calculation:
Starting with the initial gas price of $4.00 there was a 1.7% increase multiplied by this $4.00
for each of the subsequent years
Gas Cost Calculation:
Each year we multiplied the 12,000 yearly miles by the gas price for the year based on the
increasing gas price value. This was then divided by the comparison car mpg value of 21.5
mpg to get the overall cost of gasoline for the year for the luxury sedans.
43
Equity Research – Investment Notes
PV of Gas Regular Car Calculation:
For each year, the gas cost was divided by the discount factor given the discounting for each
year to take into account present value. This was then added for the next row, the total PV of
gas, regular car.
Fuel Costs Hybrid Calculation:
In this calculation, we took the total number of miles travelled to be the same as a normal
car, so 12,000 a year. We then multiplied this by the gas price for each year but divided it
now by the 96 mpg we assumed for hybrid vehicles as they are more efficient than the other
vehicles. This helped to find the overall fuel costs for the hybrid vehicles.
Value of Time Calculations:
Here we used a baselines assumption of 50 dollars per hour for the opportunity cost of time.
From there we assumed 40 trips to the gas station a year with 5 minutes each time we spent
refueling. This meant that there would be 200 minutes spent refueling each year. However,
the difference between the electric vehicle and the luxury sedan is that the electric vehicle
was assumed to only have 20% of the total refuel needs of the luxury sedan thus making the
time savings 160 minutes. To make the estimation simpler, we assumed we were comparing
this to the case of a Tesla home charged vehicle which would have an in garage charger and
not take extra time to charge otherwise. Therefore, we multiplied the 50 dollars per hour by
44
Equity Research – Investment Notes
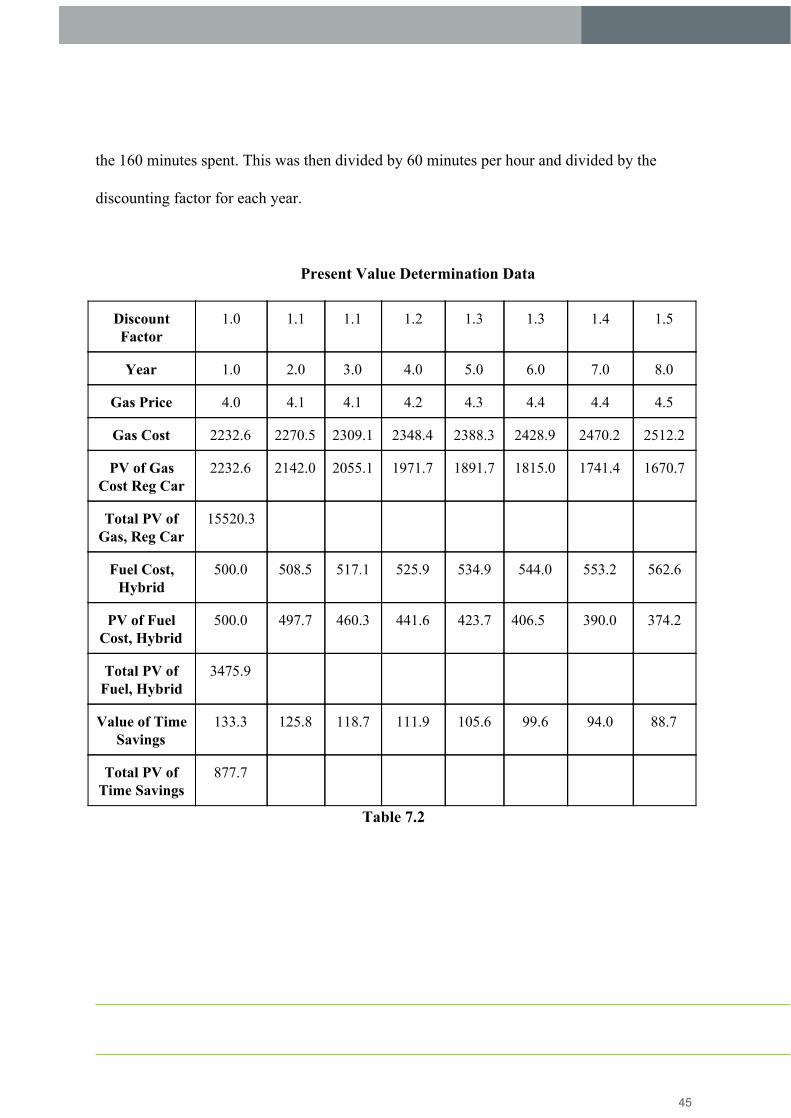
the 160 minutes spent. This was then divided by 60 minutes per hour and divided by the
discounting factor for each year.
Present Value Determination Data
Discount Factor
1.0 1.1 1.1 1.2 1.3 1.3 1.4 1.5
Year 1.0 2.0 3.0 4.0 5.0 6.0 7.0 8.0
Gas Price 4.0 4.1 4.1 4.2 4.3 4.4 4.4 4.5
Gas Cost 2232.6 2270.5 2309.1 2348.4 2388.3 2428.9 2470.2 2512.2
PV of Gas Cost Reg Car
2232.6 2142.0 2055.1 1971.7 1891.7 1815.0 1741.4 1670.7
Total PV of Gas, Reg Car
15520.3
Fuel Cost, Hybrid
500.0 508.5 517.1 525.9 534.9 544.0 553.2 562.6
PV of Fuel Cost, Hybrid
500.0 497.7 460.3 441.6 423.7 406.5 390.0 374.2
Total PV of Fuel, Hybrid
3475.9
Value of Time Savings
133.3 125.8 118.7 111.9 105.6 99.6 94.0 88.7
Total PV of Time Savings
877.7
Table 7.2
45
Equity Research – Investment Notes
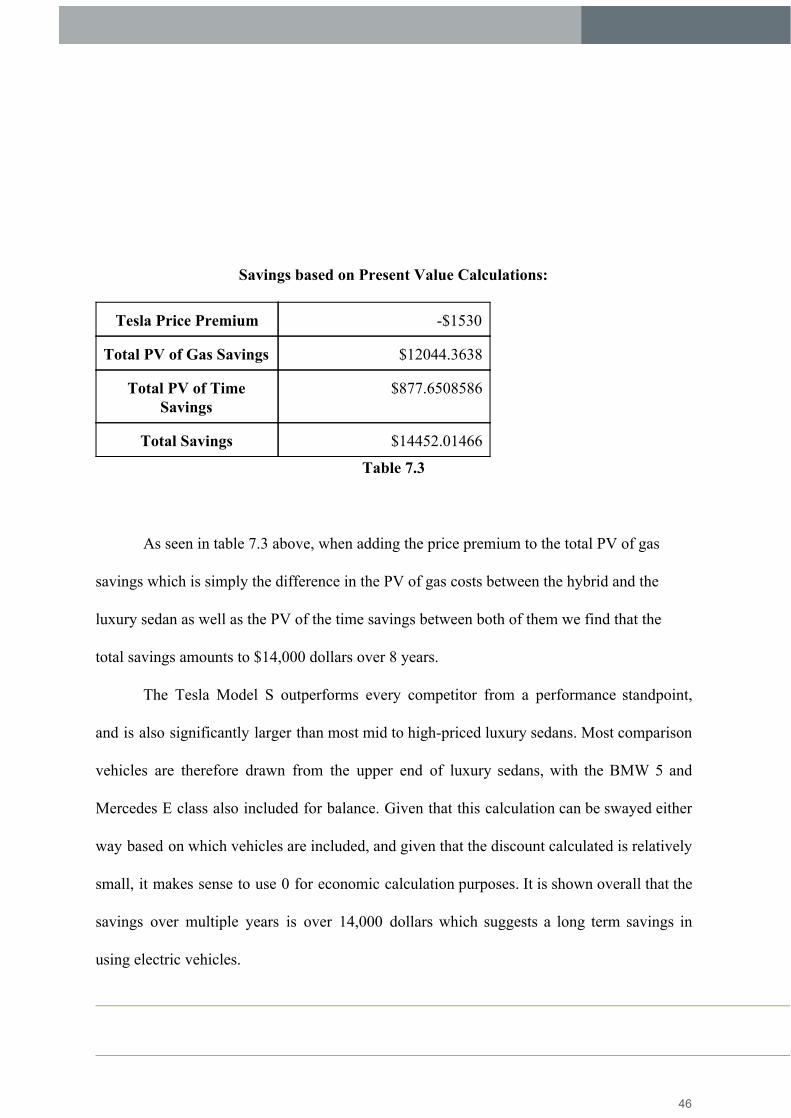
Savings based on Present Value Calculations:
Tesla Price Premium $1530
Total PV of Gas Savings $12044.3638
Total PV of Time Savings
$877.6508586
Total Savings $14452.01466
Table 7.3
As seen in table 7.3 above, when adding the price premium to the total PV of gas
savings which is simply the difference in the PV of gas costs between the hybrid and the
luxury sedan as well as the PV of the time savings between both of them we find that the
total savings amounts to $14,000 dollars over 8 years.
The Tesla Model S outperforms every competitor from a performance standpoint,
and is also significantly larger than most mid to highpriced luxury sedans. Most comparison
vehicles are therefore drawn from the upper end of luxury sedans, with the BMW 5 and
Mercedes E class also included for balance. Given that this calculation can be swayed either
way based on which vehicles are included, and given that the discount calculated is relatively
small, it makes sense to use 0 for economic calculation purposes. It is shown overall that the
savings over multiple years is over 14,000 dollars which suggests a long term savings in
using electric vehicles.
46
Equity Research – Investment Notes
Uncertainties: There are a myriad of uncertainties that are included in these models.
However, the biggest factor is oil price. With OPEC making a decision not to cut supply
recently oil prices have been dropping dramatically. Oil has dropped from around
$100/barrel to $68.51/barrel which leads to a more cost efficient model for the ICE vehicles.
However, oil prices are highly volatile and this leads to unpredictability which cannot be
captured in our costbenefit model.
Another huge concern is quantifying the cost of carbon in the environment. Scientists
have spent years trying to quantify the externalities and costs associated with greenhouse gas
emissions and particularly CO2. Moreover, it is difficult to quantify the cost of global
warming because costs are realized over long periods of time and it is difficult to isolate the
factors. Factors would include: health costs and environmental costs.
Another limiting factor of this model is energy sustainability. Electric vehicles are
increasingly being generated using natural gas owing to the explosion of shale gas in the U.S.
Natural gas is only expected to grow in availability and as a source of power generation. This
will lead to the independence from foreign importers for natural gas.
Many of the factors listed above are not accounted for in the cost benefit analysis.
The oil price, cost of carbon and energy sustainability are factors that are difficult to
quantify. However, the cost of pollutants is estimated in the next section because we believed
that it is a huge negative externality that could not be ignored.
47
Equity Research – Investment Notes
QUANTIFYING THE UNQUANTIFIABLE
REVIEW OF LITERATURE - OIL IMPORTATION
Baseline Estimations:
Figure 6.1 below uses data from the 2001 National Household Travel Survey to
estimate the percentage of U.S. lightvehicles unlikely to switch to electric cars with
switchable, 100mile batteries. We will use two scenarios, one with oil prices being high
over $5/gallon, and the other being baseline or around $4/gallon. In the high price case,
around 10% of US light vehicles will be exchanged in addition to the roughly 20% already
in line to be exchanged in the baseline case. This equals around 30% of these vehicles being
switched by 2030. It adapts the methodology used by McKinsey (2009) to estimate the
addressable market size for alternative powertrain vehicles and was presented in a paper by
Thomas Becker from the University of California, Berkeley (2009).
48

Equity Research – Investment Notes
Market Size
Figure 6.1
The assumptions of both a high price and baseline scenario was integrated into the graph
below to show the expected numbers of gasoline, electric, and hybrid cars from 2010 to 2030
by Becker.
49
Equity Research – Investment Notes
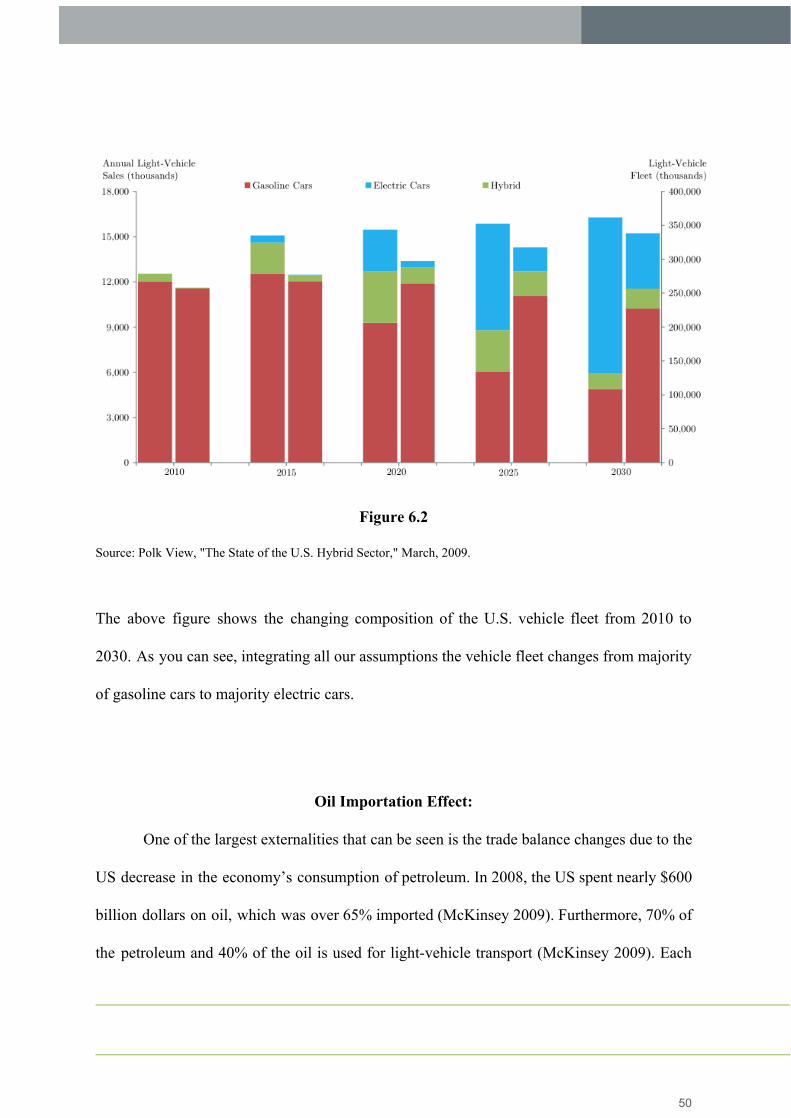
Figure 6.2
Source: Polk View, "The State of the U.S. Hybrid Sector," March, 2009.
The above figure shows the changing composition of the U.S. vehicle fleet from 2010 to
2030. As you can see, integrating all our assumptions the vehicle fleet changes from majority
of gasoline cars to majority electric cars.
Oil Importation Effect:
One of the largest externalities that can be seen is the trade balance changes due to the
US decrease in the economy’s consumption of petroleum. In 2008, the US spent nearly $600
billion dollars on oil, which was over 65% imported (McKinsey 2009). Furthermore, 70% of
the petroleum and 40% of the oil is used for lightvehicle transport (McKinsey 2009). Each
50
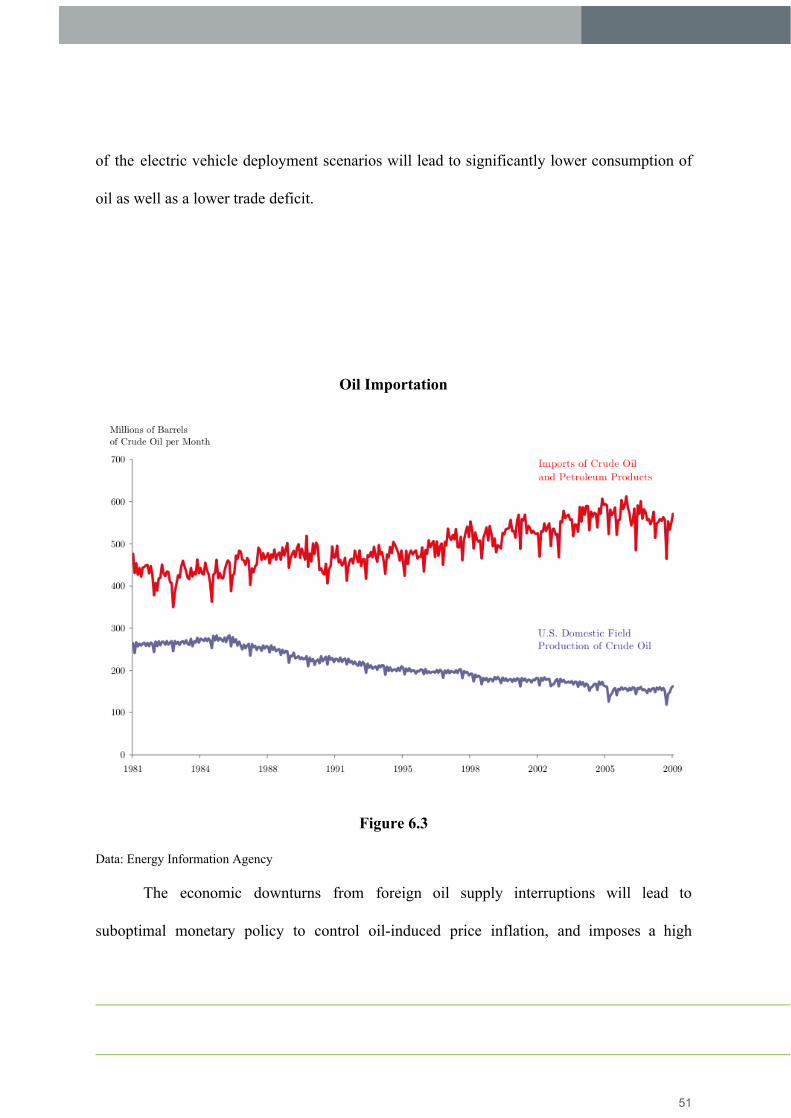
Equity Research – Investment Notes
of the electric vehicle deployment scenarios will lead to significantly lower consumption of
oil as well as a lower trade deficit.
Oil Importation
Figure 6.3
Data: Energy Information Agency
The economic downturns from foreign oil supply interruptions will lead to
suboptimal monetary policy to control oilinduced price inflation, and imposes a high
51
Equity Research – Investment Notes
military cost to secure foreign oil supplies. This is where the deployment of electric vehicles
comes in as they will significantly reduce the transportation sector’s reliance on petroleum
based fuels which will thereby diminish the problems associated with oil dependency in the
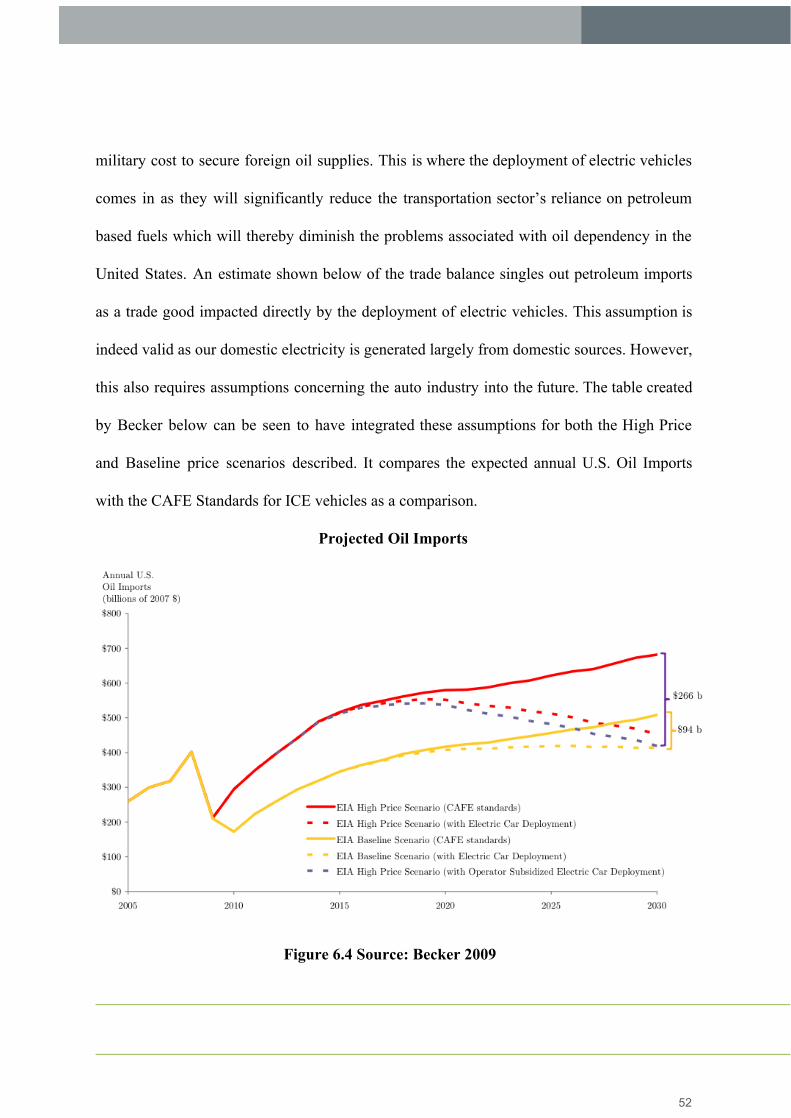
United States. An estimate shown below of the trade balance singles out petroleum imports
as a trade good impacted directly by the deployment of electric vehicles. This assumption is
indeed valid as our domestic electricity is generated largely from domestic sources. However,
this also requires assumptions concerning the auto industry into the future. The table created
by Becker below can be seen to have integrated these assumptions for both the High Price
and Baseline price scenarios described. It compares the expected annual U.S. Oil Imports
with the CAFE Standards for ICE vehicles as a comparison.
Projected Oil Imports
Figure 6.4 Source: Becker 2009
52
Equity Research – Investment Notes
QUANTIFYING POLLUTANTS
Given the negative health related externalities of emissions they must be taken into
account. Such pollutants include but are not limited to sulfur dioxide, nitrous dioxide,
particulate matter, and volatile organic compounds as well as heavy metals, oils, and grease
which are all runoff pollutants. With this information, we have compiled information on the
three scenarios mentioned for the macroeconomic analysis based on the health care costs
associated with each type of pollutant from the U.S. Department of Transportation.
The health care cost savings are calculated by multiplying the number of vehicle
miles traveled (VMT) by the fleet of electric vehicles in each year by the health cost of each
pollutant used by the Department of Transportation (2014). The net present value
calculation uses a 5% discount rate to discount the health care costs for each year through
2030 back to 2014. The noncarbon power generation scenario (renewables plus nuclear and
hydroelectric) has 100% of the power for electric vehicles sourced from zero polluting
sources. The current grid generation mix scenario uses the 2014 electric generation and
pollution profile. This setup is analogous to the Becker 2009 paper.
There are two sets of situations shown based on estimates from the Department of
Transportation. The first is using the current electric grid to produce electricity for the needs
of the 2030 market for electric vehicles established in the Becker paper mentioned earlier.
This is compared in both the high price and baseline scenarios. Furthermore, there is the
other situation where there is noncarbon generation of electricity thus causing what was
53
Equity Research – Investment Notes
originally a sulfur dioxide negative externality to be become a reduction in sulfur dioxide
use.
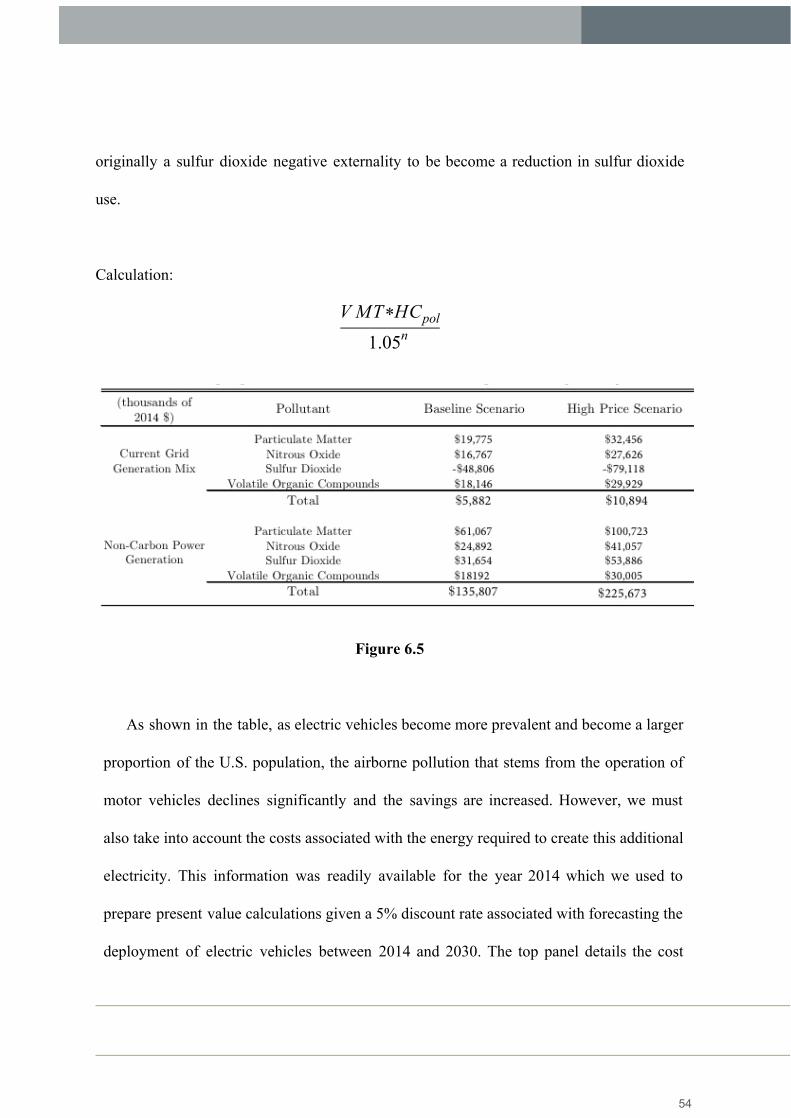
Calculation:
1.05n VMT HC* pol
Figure 6.5
As shown in the table, as electric vehicles become more prevalent and become a larger
proportion of the U.S. population, the airborne pollution that stems from the operation of
motor vehicles declines significantly and the savings are increased. However, we must
also take into account the costs associated with the energy required to create this additional
electricity. This information was readily available for the year 2014 which we used to
prepare present value calculations given a 5% discount rate associated with forecasting the
deployment of electric vehicles between 2014 and 2030. The top panel details the cost
54
Equity Research – Investment Notes
savings using present value for the electric vehicles in each of the scenarios assuming a
polluting source creating the electricity. Conversely, the bottom shows the additional
electricity being produced from nonpollutive sources such as hydroelectric which creates
a much broader gap in the value and externality projections in favor of electric vehicles.
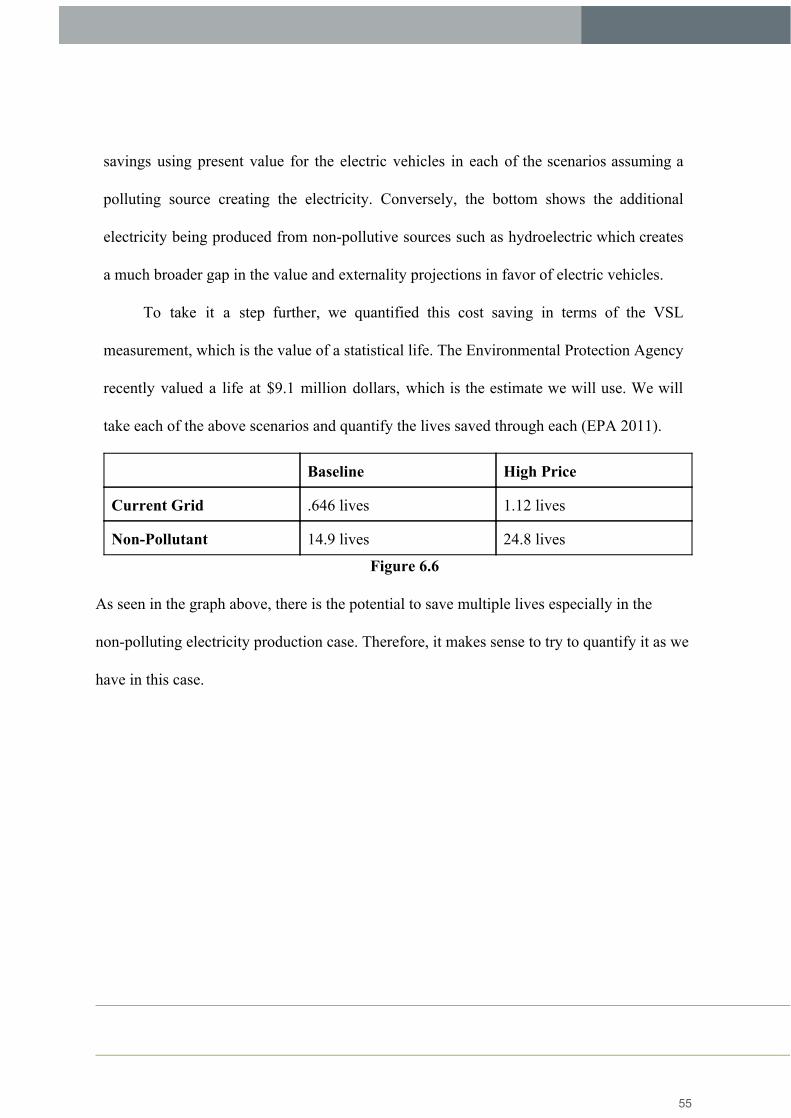
To take it a step further, we quantified this cost saving in terms of the VSL
measurement, which is the value of a statistical life. The Environmental Protection Agency
recently valued a life at $9.1 million dollars, which is the estimate we will use. We will
take each of the above scenarios and quantify the lives saved through each (EPA 2011).
Baseline High Price
Current Grid .646 lives 1.12 lives
NonPollutant 14.9 lives 24.8 lives
Figure 6.6
As seen in the graph above, there is the potential to save multiple lives especially in the
nonpolluting electricity production case. Therefore, it makes sense to try to quantify it as we
have in this case.
55
Equity Research – Investment Notes
CONCLUSION:
As research into electric vehicles progresses, they will become more efficient and
cheaper to develop. Until this point is economically feasible, the use of internal combustion
engines and hybrids is important as our economy transitions to EV’s. These two types of
vehicles are also further being developed along with technology for electric vehicles. The
uncertain research and development schedule makes projections into the future somewhat
difficult to make and also creates larger variance.
When focusing on the larger scale macro effects of electric vehicle deployment we
see that it is provides the greatest benefit in high price scenarios when the trade balance will
effectively be able to be offset by these electric vehicles. However, without domestic battery
production which was an assumption in the model the deployment of said electric vehicles
would offset a reduction of the trade deficit overall which was a simplifying assumption
made in Becker’s study.
In quantifying the health benefits of using electric vehicles, we found that the benefits
of the deployment of electric vehicles was nearly twenty times larger when using electric
vehicles which use nonpolluting sources of gathering electricity. This is largely due to the
negative health effects from the sulfur dioxide produced from the existing coal power plants
which produce electricity. This was also shown in the VSL measurements. Furthermore, this
quantifiable difference in health outcomes could provide another possible benefit by allowing
for the centralization of purchasing power by electric car drivers into a set of network
operators which would ultimately allow for the sourcing for electricity from the wholesale
market.
56

Equity Research – Investment Notes
Overall, hybrid electric vehicles appear to be cost efficient both in terms of cost
benefit analysis versus both low price vehicles and high price luxury sedans as well as versus
the macro effects from pollution that we quantified. However, it appears that without drastic
changes in oil prices or the assumptions in our analyses all electric vehicles do not appear to
be a cost efficient method yet. The main issues will be as stated electric range problems and
the overall creation of an electrical infrastructure to allow for these large scale changes that
our assumptions are based off.
57
Equity Research – Investment Notes
SOURCES
1. AllElectric Vehicles: Compare SidebySide. (2014, January 1). Retrieved
December 2, 2014, from http://www.fueleconomy.gov/feg/evsbs.shtml
2. Average Annual Miles per Driver by Age Group. (2014,September26). Retrieved
December2,2014,fromhttps://www.fhwa.dot.gov/ohim/onh00/bar8.htm
3. Becker, Thomas. "Electric Vehicles in the United States A New Model with
Forecasts to 2030." Center for Entrepreneurship & Technology (CET) Technical
Brief (2009): n. pag. Web.
4. Bossel, Ulf. "Does a Hydrogen Economy."Proceedings of the IEEE 94.10 (2006):
n. pag. Print.
5. "BU1203: Electric Vehicle." – Battery University. N.p., n.d. Web. 01 Dec. 2014.
6. Center for Automotive Research
7.Charles Murray, Nissan Bets on the Electric Car,2010
8. Cobb. "RenaultNissan To Use Phinergy's AluminumAir Battery
HybridCars.com." HybridCarscom RenaultNissan To Use Phinergys AluminumAir
Battery Comments. N.p., 2014. Web. 02 Dec. 2014.
9.Cox, Severe Issues With Fuel Cell Vehicle GHG Emissions Claims and Hydrogen
Refueling Infrastructure Grants. Clean Technica (2014): n. pag. Web. 20 Nov 2014.
58
Equity Research – Investment Notes
10. Corrigan D, Masias A (2011) Batteries for electric and hybrid vehicles. In: Reddy
TB (ed)Linden’s handbook of batteries, 4th edn. McGraw Hill, New York
11.Consumer Price Index for All Urban Consumers (CPIU): U.S. City Average, by
Expenditure Category and Commodity and Service Group
12. Department of Transportation, "2001 National Household Travel Survey,"
NHTSA20090062, 2004.
13. Department of Transportation, "Average Fuel Economy Standards Passenger Cars
and Light Trucks Model Year 2011," 2009.
14. Dr. Willi Diez, Mehr Profit durch Kundenbindung,Institut für
Automobilwirtschaft 2014
15. Energy Information Agency, 2009 Annual Energy Outlook, 2009.
16. Evans, P. "Driving Ahead." The Economist. The Economist Newspaper, 03 Mar.
2014. Web. 02 Dec. 2014.
17. Fisher. "What Goes Into A Tesla Model S BatteryAnd What It May
Cost."Green Car Reports. N.p., 2013. Web. 01 Dec. 2014.
18. Forbes Magazine, Industry Survey, 2009
19. Gas Mileage of 2013 Tesla Model S. N.p., n.d. Web. 23 Nov. 2014.
20. Han, Z.l., and Yang Yang Wang. "On the Study of Electric Vehicle Regenerative
Braking." Applied Mechanics and Materials 33 (2010): 27375. Web.
59
Equity Research – Investment Notes
21. Hensley, John Newman, and Matt Rogers, Battery technology charges ahead
(McKinsey 2012)
22. P. Hoffmann, Tomorrow's Energy: Hydrogen, Fuel Cells, and the Prospects for a
Cleaner Planet (MIT Press, 2002).
23. Holdway, Aaron R., Alexander R. Williams, Oliver R. Inderwildi, and David A.
King. "Indirect Emissions from Electric Vehicles: Emissions from Electricity
Generation." Energy & Environmental Science 3.12 (2010): 1825. Web.
24. MacKenzie."Electric Test Car with Aluminumair Battery Takes to the
Track."Electric test Car with Aluminumair Battery Takes to the Track. N.p., 2014.
Web. 01 Dec. 2014.
25. McKinsey 2009
26. Mearian. "Electric Car Battery Tech Lets You Go 1,000 Miles between Charges."
Computerworld. N.p., 9 June 2014. Web. 02 Dec. 2014.
" MercedesBenz CClass." Edmunds. N.p., n.d. Web. 23 Nov. 2014.
27. Ng, Michelle. (2011). Short andLongTerm Cost Efficiency Analysis of Fossil Fuel
versus Alternative EnergyVehicles. Journal of BusinessStudies Quarterly, 3(2),4556.
Retrieved January 1, 2014, from
http://jbsq.org/wpcontent/uploads/2011/12/Dec_2011_4.pdf
28. National Research Council.Transitions to Alternative Transportation
TechnologiesA Focus on Hydrogen. Washington, DC: The National Academies Press,
2008.
60
Equity Research – Investment Notes
29. National Research Council.Transitions to Alternative Vehicles and Fuels.
Washington,
DC: The National Academies Press, 2013.
30. Nissan LEAF® Electric Car: 100% Electric. 100% Fun. (n.d.). Retrieved December
2, 2014, from http://www.nissanusa.com/electriccars/leaf/
31. "Polk." Finds Average Age of Light Vehicles Continues to Rise, 2013
32. "Polk." Length of U.S. Vehicle Ownership Hits Record High. N.p., n.d. Web. 23
Nov. 2014
33. Polk View, "The State of the U.S. Hybrid Sector," March, 2009.
34. Pritchard, D.K. and Rattigan, W.M., Hazards of Liquid Hydrogen Position Paper,
HSE Research Report RR769, 2010.
35. RenaultNissan, EV Solutions, “Price and Installation Costs for Home Charging
Units,” accessed April 2011. <www.mynissanleaf.com>, www.evsolutions.avinc.com;
SPX, “Home ChargingUnits: Installation Prices Ranges,” Accessed
2011,<www.homecharging.spx.com/volt/>.
36. Union of Concerned Scientists, Fueling a Better Future The Many Benefits of
“Half the Oil”, 2013
37. Union of Concerned Scientists, State of Charge, 2012
61
Equity Research – Investment Notes
38. U.S. Department of Commerce
39. U.S. Department of Energy , How Do Gasoline and Electric Vehicles Compare?,
2005
40. U.S. Department of Energy, Office of Energy and Renewable Energy, Fuel Economy
Guide Model Year(s) 2010/2011, Washington D.C.: U.S. EPA, 2010/2011.
41. "Vehicle Technologies Program: Fact #205: February 25, 2002 Hydrogen Cost and
Worldwide Production". eere.energy.gov. Retrieved 20090919.
42. Your Questions Answered | Tesla Motors. (n.d.). Retrieved December 2, 2014, from
http://www.teslamotors.com/goelectric#
62