Embed Size (px)
Citation preview
© OECD/IEA, October 2011
First presented at the Energy For All Conference in Oslo, Norway in October 2011
ENERGY FOR ALL
Financing access for the poor
Special early excerpt of the World Energy Outlook 2011
2011
WORLD ENERGY
OUTLOOK
INTERNATIONAL ENERGY AGENCY
The International Energy Agency (IEA), an autonomous agency, was established in November 1974. Its primary mandate was – and is – two-fold: to promote energy security amongst its member countries through collective response to physical disruptions in oil supply, and provide authoritative
research and analysis on ways to ensure reliable, affordable and clean energy for its 28 member countries and beyond. The IEA carries out a comprehensive programme of energy co-operation among its member countries, each of which is obliged to hold oil stocks equivalent to 90 days of its net imports. The Agency’s aims include the following objectives:
n Secure member countries’ access to reliable and ample supplies of all forms of energy; in particular, through maintaining effective emergency response capabilities in case of oil supply disruptions.
n Promote sustainable energy policies that spur economic growth and environmental protection in a global context – particularly in terms of reducing greenhouse-gas emissions that contribute to climate change.
n Improve transparency of international markets through collection and analysis of energy data.
n Support global collaboration on energy technology to secure future energy supplies and mitigate their environmental impact, including through improved energy
efficiency and development and deployment of low-carbon technologies.
n Find solutions to global energy challenges through engagement and dialogue with non-member countries, industry, international
organisations and other stakeholders. IEA member countries:
Australia Austria
Belgium Canada
Czech RepublicDenmark
Finland France
GermanyGreece
HungaryIreland
ItalyJapan
Korea (Republic of)LuxembourgNetherlandsNew Zealand NorwayPolandPortugalSlovak RepublicSpainSwedenSwitzerland
TurkeyUnited Kingdom
United States
The European Commission also participates in
the work of the IEA.
Please note that this publication is subject to specific restrictions that limit its use and distribution.
The terms and conditions are available online at www.iea.org/about/copyright.asp
© OECD/IEA, 2011International Energy Agency
9 rue de la Fédération 75739 Paris Cedex 15, France
www.iea.org
© OECD/IEA, October 2011
First presented at the Energy For All Conference in Oslo, Norway in October 2011
ENERGY FOR ALL
Financing access for the poor
Special early excerpt of the World Energy Outlook 2011

ENERGY FOR ALL– Financing access for the poor
© OECD/IEA 2011
Page | 3
Summary As energy is the source of all life, so modern energy can be the source of a better life for all. The International Energy Agency’s World Energy Outlook (WEO) has focused attention on modern energy access for a decade, providing the international community with quantitative, objective analysis. This report, a special early excerpt of World Energy Outlook 2011, tackles the critical issue of financing the delivery of universal modern energy access.
Modern energy services are crucial to human well‐being and to a country’s economic development; and yet globally over 1.3 billion people are without access to electricity and 2.7 billion people are without clean cooking facilities. More than 95% of these people are either in sub‐Saharan Africa or developing Asia and 84% are in rural areas.
In 2009, we estimate that $9.1 billion was invested globally in extending access to modern energy services. In the absence of significant new policies, we project that the investment to this end between 2010 and 2030 will average $14 billion per year, mostly devoted to new on‐grid electricity connections in urban areas. This level of investment will still leave 1.0 billion people without electricity and, despite progress, population growth means that 2.7 billion people will remain without clean cooking facilities in 2030. To provide universal modern energy access by 2030 annual average investment needs to average $48 billion per year, more than five‐times the level of 2009. The majority of this investment is required in sub‐Saharan Africa.
The barriers to achieving modern energy access are surmountable, as many countries have proven. Our analysis concludes that five actions are essential to transforming the situation:
1. Adopt a clear and consistent statement that modern energy access is a political priority and that policies and funding will be reoriented accordingly. National governments need to adopt a specific energy access target, allocate funds to its achievement and define their strategy for delivering it.
2. Mobilise additional investment in universal access, above the $14 billion per year assumed in our central scenario, of $34 billion per year. All sources and forms of investment have their part to play, reflecting the varying risks and returns of particular solutions. All need to grow. The sum is large, but is equivalent to around 3% of global investment in energy infrastructure over the period to 2030.
3. Private sector investment needs to grow the most, but significant barriers must first be overcome. National governments need to adopt strong governance and regulatory frameworks and invest in internal capacity building. The public sector, including multilateral and bilateral institutions, needs to use its tools to leverage greater private sector investment where the commercial case is marginal and encourage the development of replicable business models. When used, public subsidies must be well‐targeted to reach the poorest.
4. Concentrate an important part of multilateral and bilateral direct funding on those difficult areas of access which do not initially offer an adequate commercial return. Provision of end‐user finance is required to overcome the barrier of the initial capital cost of gaining access to modern energy services. Operating through local banks and microfinance arrangements can support the creation of local networks and the necessary capacity in energy sector activity.
5. Make provision for the collection of robust, regular and comprehensive data to quantify the outstanding challenge and monitor progress towards its elimination.
International concern about the issue of energy access is growing. While the United Nations Millennium Development Goals do not include specific targets in relation to access to electricity or to clean cooking facilities, the United Nations has declared 2012 to be the “International Year of Sustainable Energy for All”. The Energy for All Conference in Oslo, Norway (October 2011) and the COP17 in Durban, South Africa (December 2011) are important preliminary opportunities to establish the link between energy access, climate change and development. These issues can then be addressed at the United Nations Conference on Sustainable Development (Rio+20) in Rio de Janeiro, Brazil in June 2012. That conference will be the occasion for commitments to specific action to achieve sustainable development, including universal energy access.

ENERGY FOR ALL– Financing access for the poor
© OECD/IEA 2011
Page | 5
Table of Contents
Highlights ............................................................................................................................................. 7
Introduction ......................................................................................................................................... 8
Current status of modern energy access .............................................................................................. 10
Current status of investment in modern energy access.................................................................... 13
Outlook for energy access and investment in the New Policies Scenario .............................................. 15
Access to electricity ........................................................................................................................... 15
Access to clean cooking facilities ....................................................................................................... 19
Investment needed to achieve modern energy access for all ................................................................ 20
Access to electricity ........................................................................................................................... 21
Access to clean cooking facilities ....................................................................................................... 24
Broader implications of achieving modern energy access for all ........................................................... 26
Financing to achieve modern energy access for all ............................................................................... 29
Electricity access – financing on‐grid electrification ......................................................................... 30
Electricity access – financing mini‐grid electrification ...................................................................... 31
Electricity access – financing off‐grid electrification ......................................................................... 32
Clean cooking facilities – financing LPG stoves ................................................................................. 33
Clean cooking facilities – financing biogas systems .......................................................................... 35
Clean cooking facilities – financing advanced cookstoves ................................................................ 35
Sources of financing and barriers to scaling up ..................................................................................... 36
Multilateral and bilateral development sources ............................................................................... 36
Carbon financing .......................................................................................................................... 39
Developing country government sources ......................................................................................... 40
Private sector sources ....................................................................................................................... 41
Implications for policy ......................................................................................................................... 43
Regional and country groupings .......................................................................................................... 44
References .......................................................................................................................................... 46

ENERGY FOR ALL– Financing access for the poor
© OECD/IEA 2011
Page | 7
Highlights
Modern energy services are crucial to human well‐being and to a country’s economic
development; and yet over 1.3 billion people are without access to electricity and 2.7 billion
people are without clean cooking facilities. More than 95% of these people are either in sub‐
Saharan Africa or developing Asia and 84% are in rural areas.
In 2009, we estimate that $9.1 billion was invested globally in extending access to modern
energy services, supplying 20 million more people with electricity access and 7 million people
with advanced biomass cookstoves. In the New Policies Scenario, our central scenario,
$296 billion is invested in energy access between 2010 and 2030 – an average of $14 billion
per year, 56% higher than the level in 2009. But, this is not nearly enough: it still leaves
1.0 billion people without electricity (more than 60% are in sub‐Saharan Africa) and, despite
progress, population growth means that 2.7 billion people will remain without clean cooking
facilities in 2030. To provide universal modern energy access by 2030 cumulative investment
of $1 trillion is required – an average of $48 billion per year, more than five‐times the level
in 2009.
The $9.1 billion invested in extending energy access in 2009 was sourced from multilateral
organisations (34%), domestic government finance (30%), private investors (22%) and bilateral
aid (14%). To provide the $48 billion per year required for universal access, we estimate that
around $18 billion per year is needed from multilateral and bilateral development sources,
$15 billion per year from the governments of developing countries and $15 billion per year
from the broad range of actors that form the private sector.
Private sector investment needs to grow the most, but significant barriers must first be
overcome. Public authorities must provide a supportive investment climate, such as by
implementing strong governance and regulatory reforms. The public sector, including donors,
needs also to use its tools to leverage private sector investment where the commercial case is
marginal. At present, energy access funding tends to be directed primarily toward large‐scale
electricity infrastructure. This does not always reach the poorest households. Access to
funding at a local level is essential to support initiatives that cater effectively for local needs,
building local financial and technical capacity and stimulating sectoral development.
Achieving universal access by 2030 would increase global electricity generation by 2.5%.
Demand for fossil fuels would grow by 0.8% and CO2 emissions go up by 0.7%, both figures
being trivial in relation to concerns about energy security or climate change. The prize would
be a major contribution to social and economic development and help to avoid 1.5 million
premature deaths per year.
ENERGY FOR ALL– Financing access for the poor
© OECD/IEA 2011
Page | 8
Introduction
Energy is a critical enabler. Every advanced economy has required secure access to modern sources of
energy to underpin its development and growing prosperity. While many developed countries may be
focused on domestic energy security or decarbonising their energy mix, many other countries are still
seeking to secure enough energy to meet basic human needs. In developing countries, access to
affordable and reliable energy services is fundamental to reducing poverty and improving health,
increasing productivity, enhancing competitiveness and promoting economic growth. Despite the
importance of these matters, billions of people continue to be without basic modern energy services,
lacking reliable access to either electricity or clean cooking facilities. This situation is expected to change
only a little by 2030 unless more vigorous action is taken.
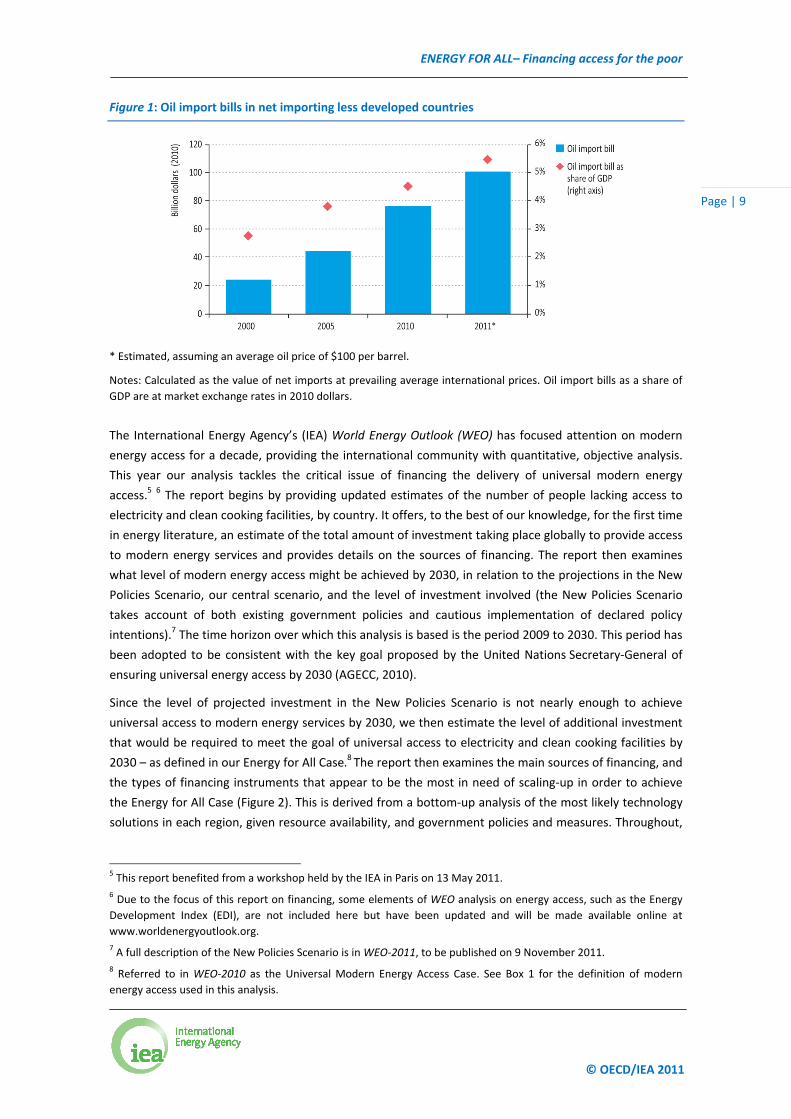
Developing countries that import oil are today facing prices in excess of $100 a barrel when, at a
comparable stage of economic development, many OECD countries faced an average oil price of around
$22 a barrel (in 2010 dollars). In little over a decade, the bill of oil importing less developed countries1 has
quadrupled to hit an estimated $100 billion in 2011, or 5.5% of their gross domestic product (GDP)
(Figure 1). Oil import bills in sub‐Saharan Africa increased by $2.2 billion in 2010, more than one‐third
higher than the increase in Official Development Assistance (ODA)2 over the year. In contrast, oil
exporters in sub‐Saharan Africa, such as Nigeria and Angola, are benefitting from the oil price boom and
tackling energy poverty is, financially at least, within their means. We estimate that the capital cost of
providing modern energy services to all deprived households in the ten largest oil and gas exporting
countries of sub‐Saharan Africa3 would be around $30 billion, equivalent to around 0.7% of those
governments’ cumulative take from oil and gas exports.
International concern about the issue of energy access is growing. While the United Nations Millennium
Development Goals4 (MDGs) do not include specific targets in relation to access to electricity or to clean
cooking facilities, the United Nations has declared 2012 to be the “International Year of Sustainable
Energy for All”. Other strategic platforms to discuss the link between energy access, climate change and
development include the “Energy for All Conference” in Oslo, Norway in October 2011, and the COP17 in
Durban, South Africa in December 2011. These issues are also expected to be addressed at the United
Nations Conference on Sustainable Development (UNCSD) in Rio de Janeiro, Brazil in June 2012. That
conference will aim to secure renewed political commitment to sustainable development, to assess
progress to date and to address new and emerging challenges. It will bring to centre‐stage in the
international debate the need to reconcile environment, development and poverty eradication issues
such as energy access.
1 The group includes India and the oil‐importing countries within the United Nation’s classification of least developed
countries (available at www.unohrlls.org). This group has a combined population of 1.8 billion people and accounts
for 65% of those lacking access to modern energy.
2 Data available from the OECD/DCD‐DAC database: www.oecd.org.
3 These countries include: Angola, Cameroon, Chad, Democratic Republic of Congo, Equatorial Guinea, Gabon,
Ivory Coast, Mozambique, Nigeria and Sudan.
4 See www.un.org/millenniumgoals for more information.
ENERGY FOR ALL– Financing access for the poor
© OECD/IEA 2011
Page | 9
Figure 1: Oil import bills in net importing less developed countries
* Estimated, assuming an average oil price of $100 per barrel.
Notes: Calculated as the value of net imports at prevailing average international prices. Oil import bills as a share of
GDP are at market exchange rates in 2010 dollars.
The International Energy Agency’s (IEA) World Energy Outlook (WEO) has focused attention on modern
energy access for a decade, providing the international community with quantitative, objective analysis.
This year our analysis tackles the critical issue of financing the delivery of universal modern energy
access.5 6 The report begins by providing updated estimates of the number of people lacking access to
electricity and clean cooking facilities, by country. It offers, to the best of our knowledge, for the first time
in energy literature, an estimate of the total amount of investment taking place globally to provide access
to modern energy services and provides details on the sources of financing. The report then examines
what level of modern energy access might be achieved by 2030, in relation to the projections in the New
Policies Scenario, our central scenario, and the level of investment involved (the New Policies Scenario
takes account of both existing government policies and cautious implementation of declared policy
intentions).7 The time horizon over which this analysis is based is the period 2009 to 2030. This period has
been adopted to be consistent with the key goal proposed by the United Nations Secretary‐General of
ensuring universal energy access by 2030 (AGECC, 2010).
Since the level of projected investment in the New Policies Scenario is not nearly enough to achieve
universal access to modern energy services by 2030, we then estimate the level of additional investment
that would be required to meet the goal of universal access to electricity and clean cooking facilities by
2030 – as defined in our Energy for All Case.8 The report then examines the main sources of financing, and
the types of financing instruments that appear to be the most in need of scaling‐up in order to achieve
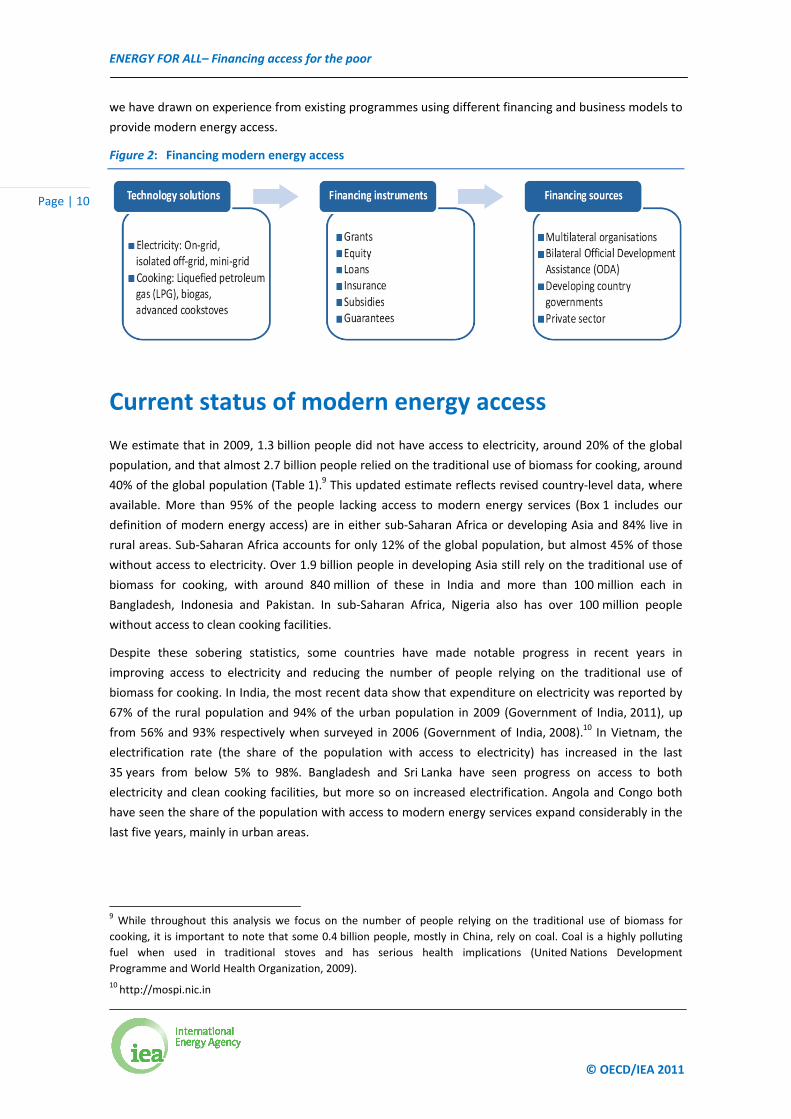
the Energy for All Case (Figure 2). This is derived from a bottom‐up analysis of the most likely technology
solutions in each region, given resource availability, and government policies and measures. Throughout,
5 This report benefited from a workshop held by the IEA in Paris on 13 May 2011.
6 Due to the focus of this report on financing, some elements of WEO analysis on energy access, such as the Energy
Development Index (EDI), are not included here but have been updated and will be made available online at
www.worldenergyoutlook.org.
7 A full description of the New Policies Scenario is in WEO‐2011, to be published on 9 November 2011.
8 Referred to in WEO‐2010 as the Universal Modern Energy Access Case. See Box 1 for the definition of modern
energy access used in this analysis.
ENERGY FOR ALL– Financing access for the poor
© OECD/IEA 2011
Page | 10
we have drawn on experience from existing programmes using different financing and business models to
provide modern energy access.
Figure 2: Financing modern energy access
Current status of modern energy access
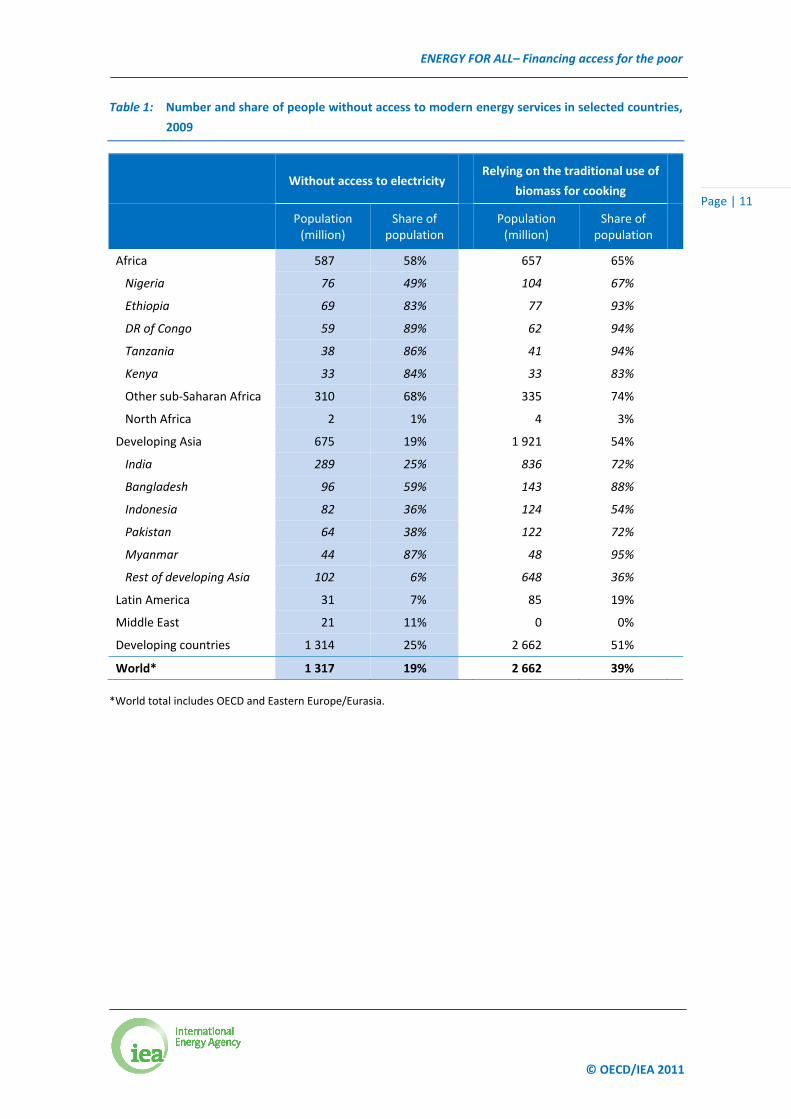
We estimate that in 2009, 1.3 billion people did not have access to electricity, around 20% of the global
population, and that almost 2.7 billion people relied on the traditional use of biomass for cooking, around
40% of the global population (Table 1).9 This updated estimate reflects revised country‐level data, where
available. More than 95% of the people lacking access to modern energy services (Box 1 includes our
definition of modern energy access) are in either sub‐Saharan Africa or developing Asia and 84% live in
rural areas. Sub‐Saharan Africa accounts for only 12% of the global population, but almost 45% of those
without access to electricity. Over 1.9 billion people in developing Asia still rely on the traditional use of
biomass for cooking, with around 840 million of these in India and more than 100 million each in
Bangladesh, Indonesia and Pakistan. In sub‐Saharan Africa, Nigeria also has over 100 million people
without access to clean cooking facilities.
Despite these sobering statistics, some countries have made notable progress in recent years in
improving access to electricity and reducing the number of people relying on the traditional use of
biomass for cooking. In India, the most recent data show that expenditure on electricity was reported by
67% of the rural population and 94% of the urban population in 2009 (Government of India, 2011), up
from 56% and 93% respectively when surveyed in 2006 (Government of India, 2008).10 In Vietnam, the
electrification rate (the share of the population with access to electricity) has increased in the last
35 years from below 5% to 98%. Bangladesh and Sri Lanka have seen progress on access to both
electricity and clean cooking facilities, but more so on increased electrification. Angola and Congo both
have seen the share of the population with access to modern energy services expand considerably in the
last five years, mainly in urban areas.
9 While throughout this analysis we focus on the number of people relying on the traditional use of biomass for
cooking, it is important to note that some 0.4 billion people, mostly in China, rely on coal. Coal is a highly polluting
fuel when used in traditional stoves and has serious health implications (United Nations Development
Programme and World Health Organization, 2009).
10 http://mospi.nic.in
ENERGY FOR ALL– Financing access for the poor
© OECD/IEA 2011
Page | 11
Table 1: Number and share of people without access to modern energy services in selected countries,
2009
Without access to electricity
Relying on the traditional use of
biomass for cooking
Population (million)
Share of population
Population (million)
Share of population
Africa 587 58% 657 65%
Nigeria 76 49% 104 67%
Ethiopia 69 83% 77 93%
DR of Congo 59 89% 62 94%
Tanzania 38 86% 41 94%
Kenya 33 84% 33 83%
Other sub‐Saharan Africa 310 68% 335 74%
North Africa 2 1% 4 3%
Developing Asia 675 19% 1 921 54%
India 289 25% 836 72%
Bangladesh 96 59% 143 88%
Indonesia 82 36% 124 54%
Pakistan 64 38% 122 72%
Myanmar 44 87% 48 95%
Rest of developing Asia 102 6% 648 36%
Latin America 31 7% 85 19%
Middle East 21 11% 0 0%
Developing countries 1 314 25% 2 662 51%
World* 1 317 19% 2 662 39%
*World total includes OECD and Eastern Europe/Eurasia.
ENERGY FOR ALL– Financing access for the poor
© OECD/IEA 2011
Page | 12
Box 1: Defining modern energy access
11 We assume an average of five people per household.
12 The assumed threshold levels for electricity consumption are consistent with previous WEO analyses. However, we
recognise that different levels are sometimes adopted in other published analysis. Sanchez (2010), for example,
assumes 120 kWh per person (600 kWh per household, assuming five people per household). As another point of
reference, the observed electricity consumption in India in 2009 was 96 kWh per person in rural areas and 288 kWh
in urban areas on average over all people connected to electricity, implying a lower consumption for those that have
been connected more recently (Government of India, 2011).
There is no universally‐agreed and universally‐adopted definition of modern energy access. For our
analysis, we define modern energy access as “a household having reliable and affordable access to
clean cooking facilities, a first connection to electricity and then an increasing level of electricity
consumption over time to reach the regional average.”11 By defining access to modern energy
services at the household level, it is recognised that some other categories are excluded, such as
electricity access to businesses and public buildings that are crucial to economic and social
development i.e. schools and hospitals.
Access to electricity involves more than a first supply connection to the household; our definition
of access also involves consumption of a specified minimum level of electricity, the amount varies
based on whether the household is in a rural or an urban area. The initial threshold level of
electricity consumption for rural households is assumed to be 250 kilowatt‐hours (kWh) per year
and for urban households it is 500 kWh per year.12 In rural areas, this level of consumption could,
for example, provide for the use of a floor fan, a mobile telephone and two compact fluorescent
light bulbs for about five hours per day. In urban areas, consumption might also include an
efficient refrigerator, a second mobile telephone per household and another appliance, such as a
small television or a computer.
Once initial connection to electricity has been achieved, the level of consumption is assumed to
rise gradually over time, attaining the average regional consumption level after five years. This
definition of electricity access to include an initial period of growing consumption is a deliberate
attempt to reflect the fact that eradication of energy poverty is a long‐term endeavour. In our
analysis, the average level of electricity consumption per capita across all those households newly
connected over the period is 800 kWh in 2030. This is comparable with levels currently seen in
much of developing Asia.
This definition of energy access also includes provision of cooking facilities which can be used
without harm to the health of those in the household and which are more environmentally
sustainable and energy‐efficient than the average biomass cookstove currently used in developing
countries. This definition refers primarily to biogas systems, liquefied petroleum gas (LPG) stoves
and advanced biomass cookstoves that have considerably lower emissions and higher efficiencies
than traditional three‐stone fires for cooking. In our analysis, we assume that LPG stoves and
advanced biomass cookstoves require replacement every five years, while a biogas digester is
assumed to last 20 years. Related infrastructure, distribution and fuel costs are not included in our
estimates of investment costs.
ENERGY FOR ALL– Financing access for the poor
© OECD/IEA 2011
Page | 13
Current status of investment in modern energy access
For the billions of people currently deprived, the lack of access to modern forms of energy tends to go
hand‐in‐hand with a lack of provision of clean water, sanitation and healthcare. It also represents a major
barrier to economic development and prosperity. The importance of modern energy access is being
recognised increasingly by many organisations that provide development funding. We estimate that
capital investment of $9.1 billion was incurred globally in 2009 (Box 2 describes our methodology) to
provide 20 million people with access to electricity and 7 million people with advanced biomass
cookstoves ($70 million of the total). An incomplete set of past observations suggests that this is the
highest level of investment ever devoted to energy access.13
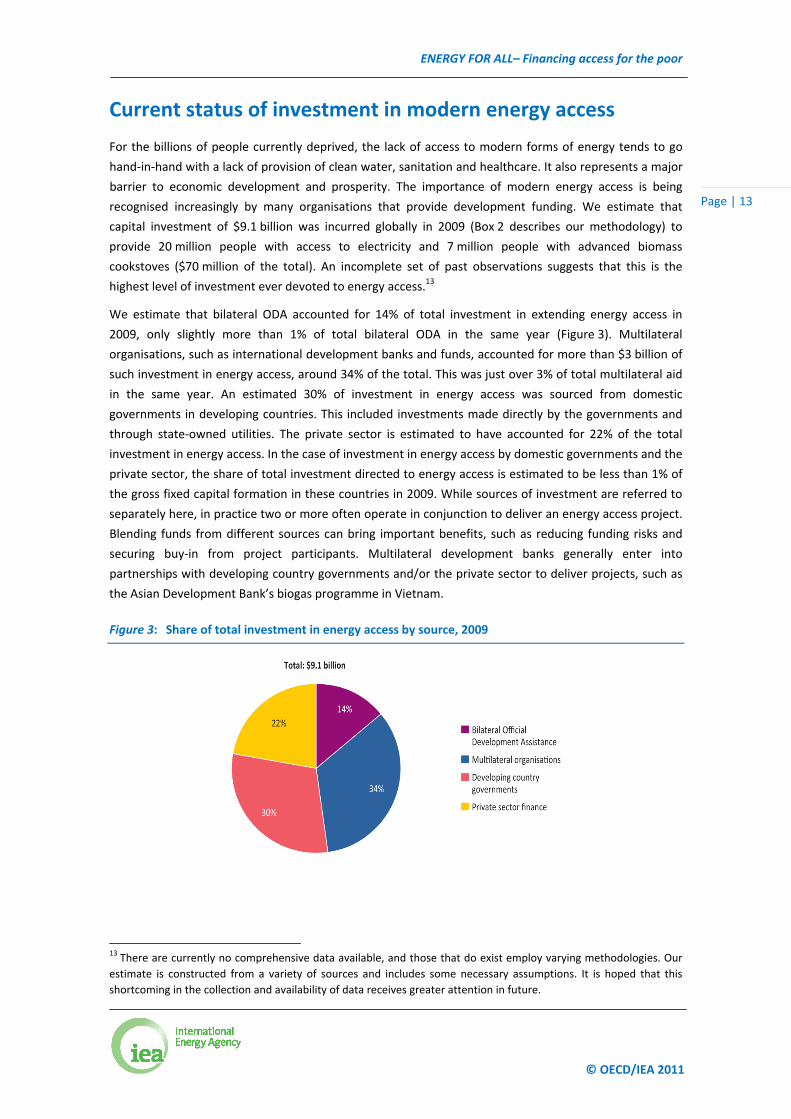
We estimate that bilateral ODA accounted for 14% of total investment in extending energy access in
2009, only slightly more than 1% of total bilateral ODA in the same year (Figure 3). Multilateral
organisations, such as international development banks and funds, accounted for more than $3 billion of
such investment in energy access, around 34% of the total. This was just over 3% of total multilateral aid
in the same year. An estimated 30% of investment in energy access was sourced from domestic
governments in developing countries. This included investments made directly by the governments and
through state‐owned utilities. The private sector is estimated to have accounted for 22% of the total
investment in energy access. In the case of investment in energy access by domestic governments and the
private sector, the share of total investment directed to energy access is estimated to be less than 1% of
the gross fixed capital formation in these countries in 2009. While sources of investment are referred to
separately here, in practice two or more often operate in conjunction to deliver an energy access project.
Blending funds from different sources can bring important benefits, such as reducing funding risks and
securing buy‐in from project participants. Multilateral development banks generally enter into
partnerships with developing country governments and/or the private sector to deliver projects, such as
the Asian Development Bank’s biogas programme in Vietnam.
Figure 3: Share of total investment in energy access by source, 2009
13 There are currently no comprehensive data available, and those that do exist employ varying methodologies. Our
estimate is constructed from a variety of sources and includes some necessary assumptions. It is hoped that this
shortcoming in the collection and availability of data receives greater attention in future.
ENERGY FOR ALL– Financing access for the poor
© OECD/IEA 2011
Page | 14
Box 2: Measuring investment in modern energy access
14 www.worldenergy.org/documents/g8report.pdf.
15 Multilateral development banks are a channel for funds from bilateral sources and from bond markets.
16 Publicly available sources supplemented with bilateral dialogue.
17 www.ppi.worldbank.org.
Our estimate of investment in modern energy access is based on the latest data available and has
several components. The estimate is of the capital investment made to provide household access to
electricity (both the cost of the provision of first connection and the capital cost to sustain an
escalating supply over time) and the cost of providing clean cooking facilities to those who currently
lack them. Operating costs, such as fuel costs and maintenance costs, are not included. Broader
technical assistance, such as policy and institutional development advice, is also not included. In the
case of on‐grid and mini‐grid solutions for electricity access, the estimate does not include the
investment required in supportive infrastructure, such as roads.
Our estimate is based on an average of high and low estimates of investment data from several
sources:
Bilateral Official Development Assistance (ODA) – In line with the Multilateral Development
Banks’ Clean Energy Investment Framework methodology,14 our estimate of total ODA for
energy access includes the investment flows for electricity generation, transmission and
distribution in countries eligible for International Development Association (IDA) funding,
i.e. the poorest countries. We have also included financing for off‐grid generation and
transmission for those countries eligible for International Bank for Reconstruction and
Development (IBRD) funding (countries which, while not among the poorest, still have difficulty
accessing commercial credit markets).
Multilateral organisations (development banks,15 funds, etc.) – This estimate is based on the
organisations’ own data when available,16 or the same methodology as ODA where data is not
available.
Domestic governments in developing countries – This estimate includes investments made both
directly by the governments and through state‐owned utilities. It includes investment
independently conducted by the governments as well as government investment leveraged
through multilateral funding. In IDA countries, it is estimated that for every $1 spent in aid on
energy access, it is matched by an additional equal amount from either the private sector or
developing country governments. Countries eligible for IDA funding account for 82% of the total
population lacking access to electricity, so the same leverage factor has been applied to all
countries.
Private sector – The broad range of private sector actors makes this the most challenging
category for which to produce a comprehensive estimate. In constructing this estimate, which is
based on data on private sector investment in infrastructure, including public‐private
partnerships (PPP), sourced from the World Bank PPI database,17 we have assumed that the
private sector component of PPP‐funded projects is around 50% and that between 5% and 20%
of the total investment goes towards energy access, depending on the region.
ENERGY FOR ALL– Financing access for the poor
© OECD/IEA 2011
Page | 15
Outlook for energy access and investment in the New Policies Scenario
In the New Policies Scenario, our central scenario, we project that total cumulative investment in
extending access to modern energy is $296 billion from 2010 to 2030, an average of $14 billion per year.18
The projected annual average investment required is therefore 56% higher in the New Policies Scenario
than the level observed in 2009. All sources of finance increase their investment in absolute terms to
meet this requirement in the New Policies Scenario. Domestic finance in developing countries and
multilateral developing banks are the largest sources of finance. But private sector finance is close behind
and actually sees the most growth.
In the New Policies Scenario, around 550 million additional people gain access to electricity and
860 million are provided with clean cooking facilities from 2010 to 2030. The increase in access to modern
energy services is driven largely by rapid economic growth in several developing countries, accompanied
by rapid urbanisation in some cases. For example, in the case of China, the 12th Five‐Year Plan (covering
the period 2011 to 2015) provides for rapid urbanisation, with plans to create 45 million new urban jobs
and an expectation that the urbanisation rate will increase to 52% by 2015, the date by which the country
also expects to achieve full electrification.
In several countries, national targets to increase electricity access succeed in delivering improvements
over the projection period, but only on a limited scale: many such targets will not be achieved unless
robust national strategies and implementation programmes are put in place. Access to clean cooking
facilities has in the past often received less government attention than electricity access, with the result
that there are fewer related programmes and targets in place at a national level. At an international level,
an important step forward was taken in September 2010 when the UN Foundation launched the “Global
Alliance for Clean Cookstoves”. The Alliance seeks to overcome market barriers that impede the
production, deployment and use of clean cookstoves in the developing world, so as to achieve the goal of
100 million households adopting clean and efficient stoves and fuels by 2020.19
Access to electricity
In the New Policies Scenario, around $275 billion of investment goes toward providing electricity access
from 2010 to 2030. This represents annual average investment of $13 billion to connect around 26 million
people per year. The capital intensive nature of electricity generation, transmission and distribution
means that this investment accounts for over 90% of total investment to deliver modern energy services
over the projection period. The average annual level of investment in electricity access increases by
almost 45%, compared with that observed in 2009. While the share of the global population lacking
access to electricity declines from 19% in 2009 to 12% in 2030, 1.0 billion people are still without
electricity by the end of the period (Table 2). The proportion of those without access to electricity in rural
areas was around five‐times higher than in urban areas in 2009, and this disparity widens to be around
18 We focus primarily on the average level of investment per year over the projection period, as a better illustration
of ongoing investment activity than the cumulative total. 19 www.cleancookstoves.org.
ENERGY FOR ALL– Financing access for the poor
© OECD/IEA 2011
Page | 16
six‐times higher in 2030. There are examples of progress in increasing rates of rural electrification, such as
in Angola and Botswana, but this is often from a low base.
Annual investment to increase on‐grid electricity access averages $7 billion in the New Policies Scenario.
The main sources of investment for on‐grid access are domestic government finance and the private
sector. Almost 55% of total private sector investment is estimated to be in on‐grid solutions. Over 40% of
the investment made by multilateral development banks is also estimated to be in on‐grid solutions.
Investment in mini‐grid and off‐grid electricity generation together averages around $6 billion annually in
the New Policies Scenario.20 Private sector investment represents a significantly smaller share of the total
for such projects, reflecting the obstacles to developing commercially viable projects.
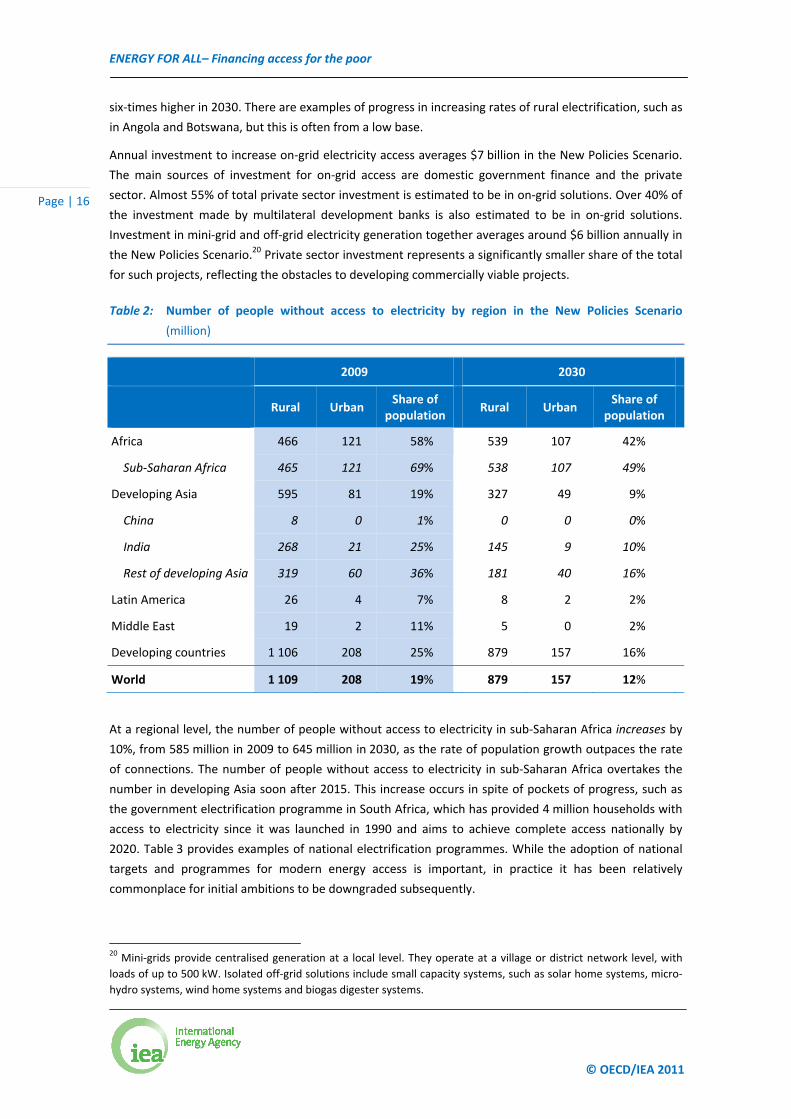
Table 2: Number of people without access to electricity by region in the New Policies Scenario
(million)
2009 2030
Rural Urban Share of
population Rural Urban
Share of population
Africa 466 121 58% 539 107 42%
Sub‐Saharan Africa 465 121 69% 538 107 49%
Developing Asia 595 81 19% 327 49 9%
China 8 0 1% 0 0 0%
India 268 21 25% 145 9 10%
Rest of developing Asia 319 60 36% 181 40 16%
Latin America 26 4 7% 8 2 2%
Middle East 19 2 11% 5 0 2%
Developing countries 1 106 208 25% 879 157 16%
World 1 109 208 19% 879 157 12%
At a regional level, the number of people without access to electricity in sub‐Saharan Africa increases by
10%, from 585 million in 2009 to 645 million in 2030, as the rate of population growth outpaces the rate
of connections. The number of people without access to electricity in sub‐Saharan Africa overtakes the
number in developing Asia soon after 2015. This increase occurs in spite of pockets of progress, such as
the government electrification programme in South Africa, which has provided 4 million households with
access to electricity since it was launched in 1990 and aims to achieve complete access nationally by
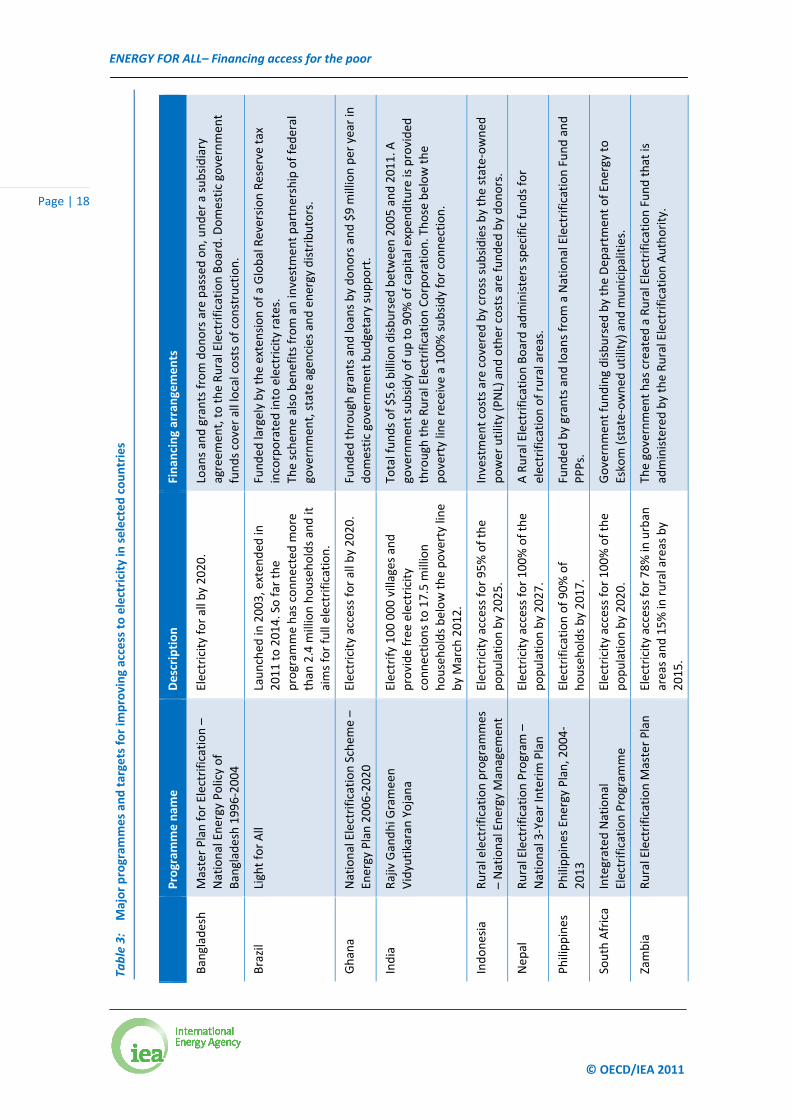
2020. Table 3 provides examples of national electrification programmes. While the adoption of national
targets and programmes for modern energy access is important, in practice it has been relatively
commonplace for initial ambitions to be downgraded subsequently.
20 Mini‐grids provide centralised generation at a local level. They operate at a village or district network level, with
loads of up to 500 kW. Isolated off‐grid solutions include small capacity systems, such as solar home systems, micro‐
hydro systems, wind home systems and biogas digester systems.
ENERGY FOR ALL– Financing access for the poor
© OECD/IEA 2011
Page | 17
The number of people without access to electricity in developing Asia is projected to decrease by almost
45%, from 675 million people in 2009 to 375 million in 2030. Around 270 million people in rural areas are
given access to electricity but, despite this, the rural population still constitutes the great majority of
those lacking access in 2030. China has provided 500 million people in rural areas with electricity access
since 1990 and is expected to achieve universal electrification by 2015. In India, the Rajiv Gandhi
Grameen Vidyutikaran Yojana Programme is making progress towards a goal of electrifying over
one hundred thousand villages and providing free electricity connections to more than 17 million rural
households living below the national poverty line. Our projections show India reaching a 98%
electrification rate in urban areas and 84% in rural areas in 2030. In the rest of developing Asia, the
average electrification rate reaches almost 93%. The difference in trajectory between developing Asia and
sub‐Saharan Africa is clear, with an improving situation in the former and a worsening one in the latter. In
developing Asia, India accounts for much of the increased access to electricity, while in sub‐Saharan Africa
a more mixed picture within the region does not, in aggregate, overcome the deteriorating picture, driven
primarily by population growth.
Outside Asia and Africa, there are at present smaller, but significant, numbers of people without access to
electricity in Latin America, but near‐universal access is achieved there by 2030 in the New Policies
Scenario. In Brazil, Luz para Todos (light for all) is a government programme, operated by a majority state‐
owned power utility company, and executed by electricity concessionaires and co‐operatives. The project
promotes renewable energy as the most practical solution in remote areas, with the government
providing funding to help cover the costs for renewable energy projects in these areas.
ENERGY FOR ALL– Financing access for the poor
© OECD/IEA 2011
Page | 18
Finan
cing arrangements
Loans and grants from donors are passed on, under a subsidiary
agreem
ent, to the Rural Electrification Board. D
omestic governmen
t
funds cover all local costs of construction.
Funded
largely by the extension of a Global Reversion Reserve tax
incorporated into electricity rates.
The schem
e also ben
efits from an investmen
t partnership of federal
governmen
t, state agencies and energy distributors.
Funded
through
grants and loans by donors and $9 m
illion per year in
domestic governmen
t budgetary support.
Total funds of $5.6 billion disbursed
between 2005 and 2011. A
governmen
t subsidy of up to 90% of capital expen
diture is provided
through
the Rural Electrification Corporation. Those below the
poverty line receive a 100% subsidy for connection.
Investmen
t costs are covered by cross subsidies by the state‐owned
power utility (PNL) and other costs are funded
by donors.
A Rural Electrification Board administers specific funds for
electrification of rural areas.
Funded
by grants and loans from a National Electrification Fund and
PPPs.
Governmen
t funding disbursed
by the Dep
artm
ent of Energy to
Eskom (state‐owned
utility) and m
unicipalities.
The governmen
t has created
a Rural Electrification Fund that is
administered by the Rural Electrification Authority.
Description
Electricity for all by 2020.
Launched
in 2003, exten
ded
in
2011 to 2014. So far the
program
me has connected m
ore
than
2.4 m
illion households and it
aims for full electrification.
Electricity access for all by 2020.
Electrify 100 000 villages and
provide free
electricity
connections to 17.5 m
illion
households below the poverty line
by March 2012.
Electricity access for 95% of the
population by 2025.
Electricity access for 100% of the
population by 2027.
Electrification of 90% of
households by 2017.
Electricity access for 100% of the
population by 2020.
Electricity access for 78% in
urban
areas and 15% in
rural areas by
2015.
Program
me nam
e
Master Plan for Electrification –
National Energy Policy of
Bangladesh 1996‐2004
Light for All
National Electrification Schem
e –
Energy Plan 2006‐2020
Rajiv Gandhi G
rameen
Vidyutikaran Yojana
Rural electrification program
mes
– National Energy M
anagem
ent
Rural Electrification Program
–
National 3‐Year Interim Plan
Philippines Energy Plan, 2004‐
2013
Integrated
National
Electrification Program
me
Rural Electrification M
aster Plan
Bangladesh
Brazil
Ghana
India
Indonesia
Nep
al
Philippines
South Africa
Zambia
Table 3:
Major program
mes an
d targets for im
proving access to electricity in
selected countries
ENERGY FOR ALL– Financing access for the poor
© OECD/IEA 2011
Page | 19
Access to clean cooking facilities
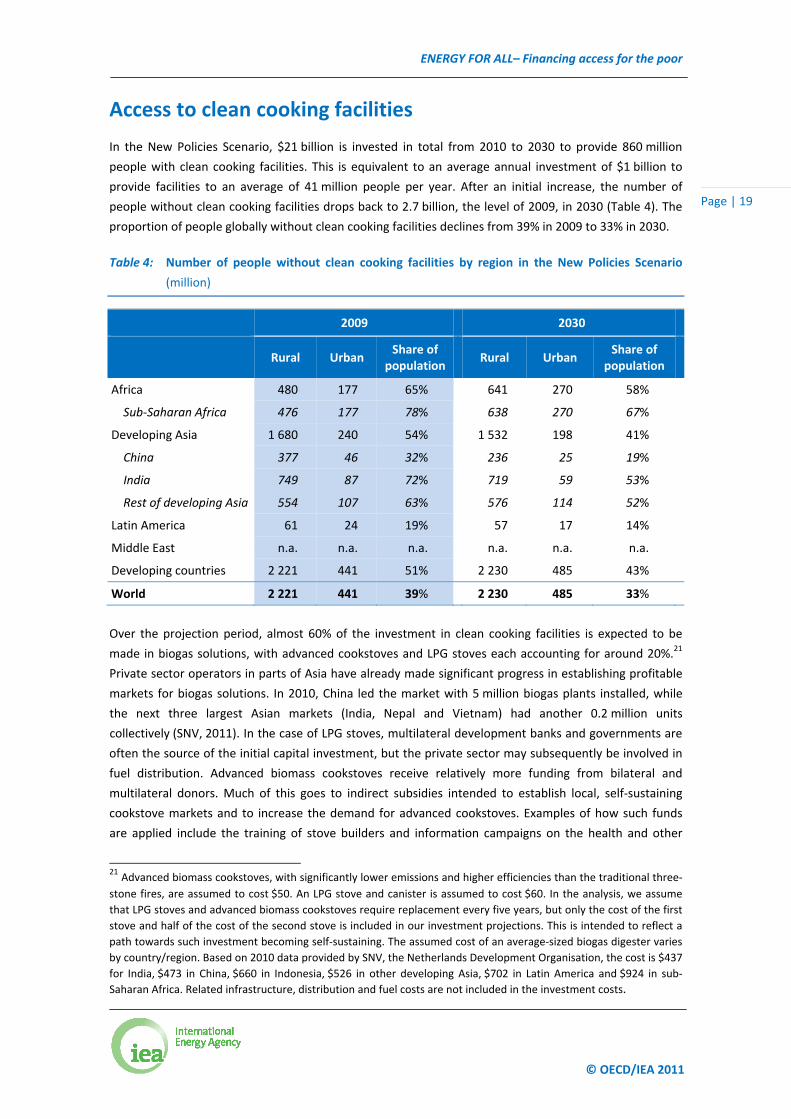
In the New Policies Scenario, $21 billion is invested in total from 2010 to 2030 to provide 860 million
people with clean cooking facilities. This is equivalent to an average annual investment of $1 billion to
provide facilities to an average of 41 million people per year. After an initial increase, the number of
people without clean cooking facilities drops back to 2.7 billion, the level of 2009, in 2030 (Table 4). The
proportion of people globally without clean cooking facilities declines from 39% in 2009 to 33% in 2030.
Table 4: Number of people without clean cooking facilities by region in the New Policies Scenario
(million)
2009 2030
Rural Urban
Share of population
Rural Urban Share of
population
Africa 480 177 65% 641 270 58%
Sub‐Saharan Africa 476 177 78% 638 270 67%
Developing Asia 1 680 240 54% 1 532 198 41%
China 377 46 32% 236 25 19%
India 749 87 72% 719 59 53%
Rest of developing Asia 554 107 63% 576 114 52%
Latin America 61 24 19% 57 17 14%
Middle East n.a. n.a. n.a. n.a. n.a. n.a.
Developing countries 2 221 441 51% 2 230 485 43%
World 2 221 441 39% 2 230 485 33%
Over the projection period, almost 60% of the investment in clean cooking facilities is expected to be
made in biogas solutions, with advanced cookstoves and LPG stoves each accounting for around 20%.21
Private sector operators in parts of Asia have already made significant progress in establishing profitable
markets for biogas solutions. In 2010, China led the market with 5 million biogas plants installed, while
the next three largest Asian markets (India, Nepal and Vietnam) had another 0.2 million units
collectively (SNV, 2011). In the case of LPG stoves, multilateral development banks and governments are
often the source of the initial capital investment, but the private sector may subsequently be involved in
fuel distribution. Advanced biomass cookstoves receive relatively more funding from bilateral and
multilateral donors. Much of this goes to indirect subsidies intended to establish local, self‐sustaining
cookstove markets and to increase the demand for advanced cookstoves. Examples of how such funds
are applied include the training of stove builders and information campaigns on the health and other
21 Advanced biomass cookstoves, with significantly lower emissions and higher efficiencies than the traditional three‐
stone fires, are assumed to cost $50. An LPG stove and canister is assumed to cost $60. In the analysis, we assume
that LPG stoves and advanced biomass cookstoves require replacement every five years, but only the cost of the first
stove and half of the cost of the second stove is included in our investment projections. This is intended to reflect a
path towards such investment becoming self‐sustaining. The assumed cost of an average‐sized biogas digester varies
by country/region. Based on 2010 data provided by SNV, the Netherlands Development Organisation, the cost is $437
for India, $473 in China, $660 in Indonesia, $526 in other developing Asia, $702 in Latin America and $924 in sub‐
Saharan Africa. Related infrastructure, distribution and fuel costs are not included in the investment costs.
ENERGY FOR ALL– Financing access for the poor
© OECD/IEA 2011
Page | 20
benefits of more efficient stoves. Expenditure of this kind is not included in our calculation of the
estimated investment cost of access.
In the New Policies Scenario, the number of people in sub‐Saharan Africa without clean cooking facilities
increases by nearly 40%, to reach more than 900 million by 2030, despite a fall in the proportion of
population without access. Almost 65% of the increase in number occurs in rural areas. By 2030, one‐
third of the people without clean cooking facilities globally are in sub‐Saharan Africa, up from one‐quarter
in 2009.
In developing Asia, the number of people without access to clean cooking facilities declines from
1.9 billion in 2009 to around 1.7 billion in 2030. In the New Policies Scenario, the number of people
without clean cooking facilities in India peaks before 2015 and then declines, but India still has nearly
780 million people without clean cooking facilities in 2030. India previously had the “National Programme
for Improved Chulhas” (1985 to 2002), and has recently launched the National Biomass Cookstoves
Initiative (NCI) to develop and deploy next‐generation cleaner biomass cookstoves to households. The
government is piloting the demonstration of 100 000 cookstoves during 2011 and 2012 – providing
financial assistance for up to 50% of the cost of the stoves – and this will be used to formulate a
deployment strategy for India’s next five year plan (2012 to 2017).
The number of people without clean cooking facilities in China maintains a declining trend and stands at
around 260 million in 2030. China, like India, will be building on previous national programmes, such as
the National Improved Stove Program, to distribute cookstoves to rural areas. Together, China and India
account for all of the fall in the number of people lacking clean cooking facilities in the region. Across the
rest of developing Asia, the number of people without access increases by 4.5% to reach 690 million.
Investment needed to achieve modern energy access for all
The remainder of this analysis focuses on the investment required to achieve the goal of universal access
to electricity and clean cooking facilities by 2030 – referred to here as the Energy for All Case – and the
methods of financing that may be the most appropriate to support this. We have calculated the cost of
achieving this goal to be $1 trillion. This estimate includes the $296 billion reflected in the New Policies
Scenario. Achieving modern energy access for all by 2030 would therefore require more than three‐times
the expected level of investment in the New Policies Scenario, growing from $14 billion per year to
$48 billion per year (Figure 4).22 This means that an additional $34 billion is needed every year, over and
above investment already reflected in the New Policies Scenario. The total required is more than five‐
times the estimated level of actual investment in 2009. Nonetheless, the total investment required is a
small share of global investment in energy infrastructure, around 3% of the total.
22 The estimated additional investment required is derived from analysis to match the most likely technical solutions
in each region, given resource availability and government policies and measures, with financing instruments and
sources of financing.

ENERGY FOR ALL– Financing access for the poor
© OECD/IEA 2011
Page | 21
Figure 4: Average annual investment in modern energy access by scenario
Access to electricity
In the Energy for All Case, the additional investment required to achieve universal access to electricity is
estimated to be around $640 billion between 2010 and 2030 (Table 5).23 To arrive at this estimate, it was
first necessary to assess the required combination of on‐grid, mini‐grid and isolated off‐grid solutions. To
identify the most suitable technology option for providing electricity access in each region, the Energy for
All Case takes into account regional costs and consumer density, resulting in the key determining variable
of regional cost per megawatt‐hour (MWh). When delivered through an established grid, the cost
per MWh is cheaper than that of mini‐grids or off‐grid solutions, but the cost of extending the grid to
sparsely populated, remote or mountainous areas can be very high and long distance transmission
systems can have high technical losses. This results in grid extension being the most suitable option for all
urban zones and for around 30% of rural areas, but not proving to be cost effective in more remote rural
areas. Therefore, 70% of rural areas are connected either with mini‐grids (65% of this share) or with
small, stand‐alone off‐grid solutions (the remaining 35%). These stand alone systems have no
transmission and distribution costs, but higher costs per MWh. Mini‐grids, providing centralised
generation at a local level and using a village level network, are a competitive solution in rural areas, and
can allow for future demand growth, such as that from income‐generating activities.
More than 60% of the additional investment required is in sub‐Saharan Africa, with the region needing
the equivalent of an extra $19 billion per year to achieve universal electricity access by 2030. There is
greater dependency here on mini‐grid and isolated off‐grid solutions, particularly in countries such as
Ethiopia, Nigeria and Tanzania, where a relatively higher proportion of those lacking electricity are in rural
areas. Developing Asia accounts for 38% of the additional investment required to achieve universal
electricity access. Achieving universal access to electricity by 2030 requires total incremental electricity
output of around 840 terawatt‐hours (TWh), and additional power generating capacity of around
220 gigawatts (GW) (Box 3 discusses the potential role of hydropower).
23 For illustrative purposes, if we instead adopted the assumed minimum consumption threshold of 120 kWh per
person in Sanchez (2010), together with our own assumption of five people per household i.e. a threshold electricity
consumption level of 600 kWh per household, this would increase the additional investment required in the Energy
for All Case by 4%, taking the total additional investment required to $665 billion to 2030.
ENERGY FOR ALL– Financing access for the poor
© OECD/IEA 2011
Page | 22
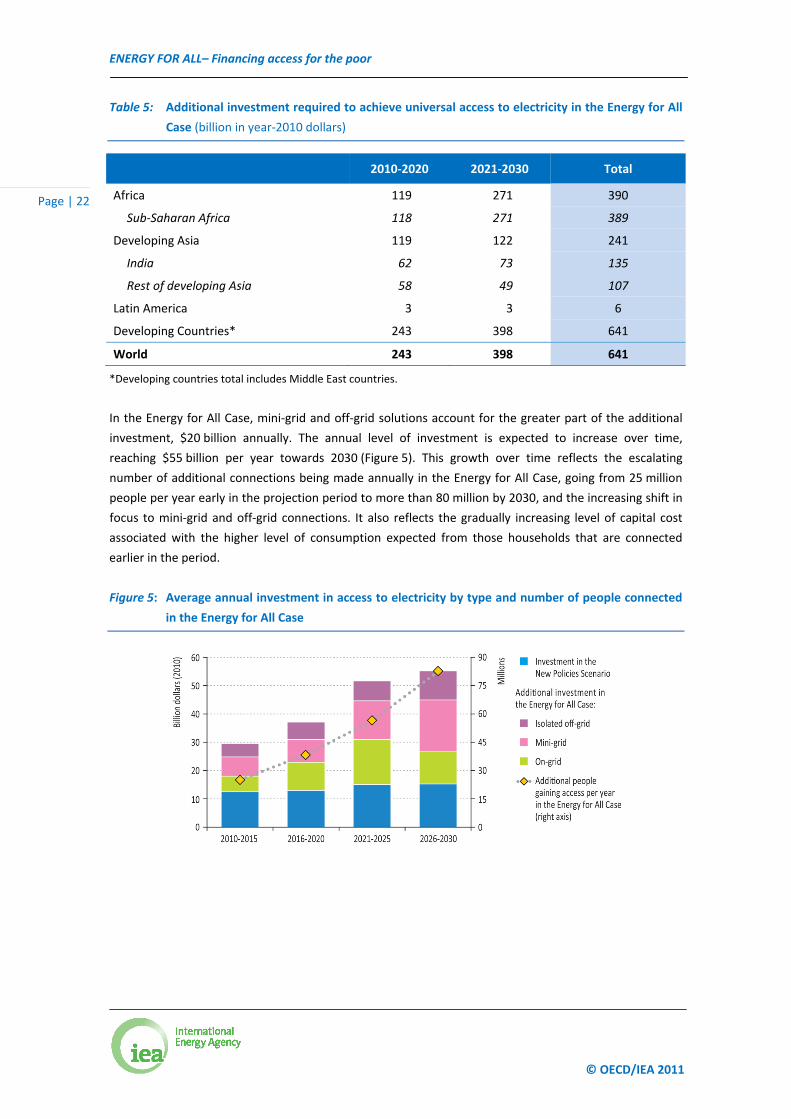
Table 5: Additional investment required to achieve universal access to electricity in the Energy for All
Case (billion in year‐2010 dollars)
2010‐2020 2021‐2030 Total
Africa 119 271 390
Sub‐Saharan Africa 118 271 389
Developing Asia 119 122 241
India 62 73 135
Rest of developing Asia 58 49 107
Latin America 3 3 6
Developing Countries* 243 398 641
World 243 398 641
*Developing countries total includes Middle East countries.
In the Energy for All Case, mini‐grid and off‐grid solutions account for the greater part of the additional
investment, $20 billion annually. The annual level of investment is expected to increase over time,
reaching $55 billion per year towards 2030 (Figure 5). This growth over time reflects the escalating
number of additional connections being made annually in the Energy for All Case, going from 25 million
people per year early in the projection period to more than 80 million by 2030, and the increasing shift in
focus to mini‐grid and off‐grid connections. It also reflects the gradually increasing level of capital cost
associated with the higher level of consumption expected from those households that are connected
earlier in the period.
Figure 5: Average annual investment in access to electricity by type and number of people connected
in the Energy for All Case
ENERGY FOR ALL– Financing access for the poor
© OECD/IEA 2011
Page | 23
Box 3: What is the role of hydropower in increasing energy access?
Renewables play a large role in the Energy for All Case. As a mature, reliable technology that can
supply electricity at competitive costs, hydropower is one part of the solution to providing
universal access to electricity. It has a place in large on‐grid projects and in isolated grids for rural
electrification. The global technical potential for hydropower generation is estimated at
14 500 TWh, more than four‐times current production (IJHD, 2010), and most of the undeveloped
potential is in Africa and in Asia, where 92% and 80% of reserves respectively are untapped.
Water basins can act as a catalyst for economic and social development by providing two essential
enablers for development: energy and water. Large hydropower projects can have important
multiplier effects; creating additional indirect benefits for every dollar of value generated
(IPCC, 2011). However, they may have adverse environmental impacts and induce involuntary
population displacement if not designed carefully.
The Nam Theun 2 hydropower plant in Laos is an example of a project that has advanced
economic and social goals successfully. While managing to achieve this, there are still lessons to be
learned in terms of how governments, private developers and multilateral development banks
partner to deliver projects more simply and efficiently. Small‐scale, hydropower‐based rural
electrification in China has had some success. Over 45 000 small hydropower plants (SHPs),
representing 55 GW, have been built and are producing 160 TWh per year. While many of these
plants form part of China’s centralised electricity networks, SHPs constitute one‐third of total
hydropower capacity and provide services to more than 300 million people (Liu and Hu, 2010).
In the Energy for All Case, hydropower on‐grid accounts for 14% of additional generation, while
SHPs account for 8% of off‐grid additional generation. Overall, additional investment in
hydropower amounts to just above $80 billion over the period 2010 to 2030. Successfully raising
this investment will depend on mitigating the risks related to high upfront costs and lengthy lead
times for planning, permitting and construction. Projects that provide broader development
benefits and arrangements to tackle planning approval and regulatory risks are important to
achieve the required level of investment for hydropower development.
ENERGY FOR ALL– Financing access for the poor
© OECD/IEA 2011
Page | 24
Access to clean cooking facilities
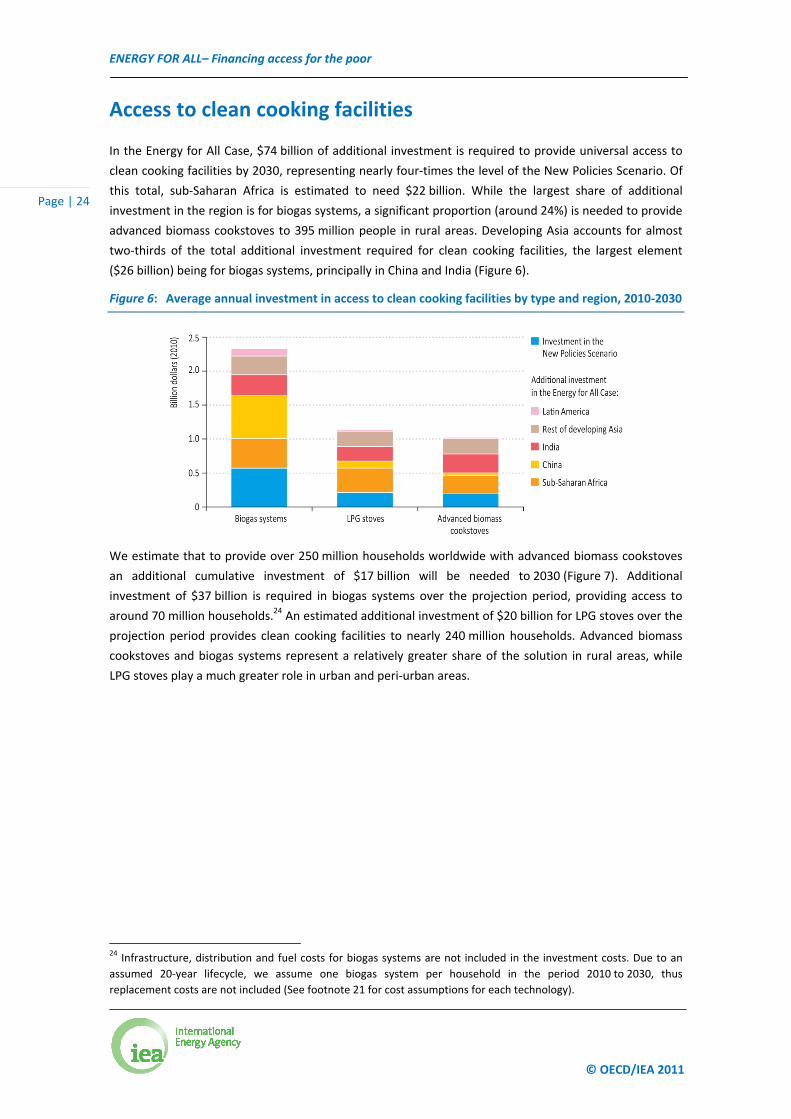
In the Energy for All Case, $74 billion of additional investment is required to provide universal access to
clean cooking facilities by 2030, representing nearly four‐times the level of the New Policies Scenario. Of
this total, sub‐Saharan Africa is estimated to need $22 billion. While the largest share of additional
investment in the region is for biogas systems, a significant proportion (around 24%) is needed to provide
advanced biomass cookstoves to 395 million people in rural areas. Developing Asia accounts for almost
two‐thirds of the total additional investment required for clean cooking facilities, the largest element
($26 billion) being for biogas systems, principally in China and India (Figure 6).
Figure 6: Average annual investment in access to clean cooking facilities by type and region, 2010‐2030
We estimate that to provide over 250 million households worldwide with advanced biomass cookstoves
an additional cumulative investment of $17 billion will be needed to 2030 (Figure 7). Additional
investment of $37 billion is required in biogas systems over the projection period, providing access to
around 70 million households.24 An estimated additional investment of $20 billion for LPG stoves over the
projection period provides clean cooking facilities to nearly 240 million households. Advanced biomass
cookstoves and biogas systems represent a relatively greater share of the solution in rural areas, while
LPG stoves play a much greater role in urban and peri‐urban areas.
24 Infrastructure, distribution and fuel costs for biogas systems are not included in the investment costs. Due to an
assumed 20‐year lifecycle, we assume one biogas system per household in the period 2010 to 2030, thus
replacement costs are not included (See footnote 21 for cost assumptions for each technology).
ENERGY FOR ALL– Financing access for the poor
© OECD/IEA 2011
Page | 25
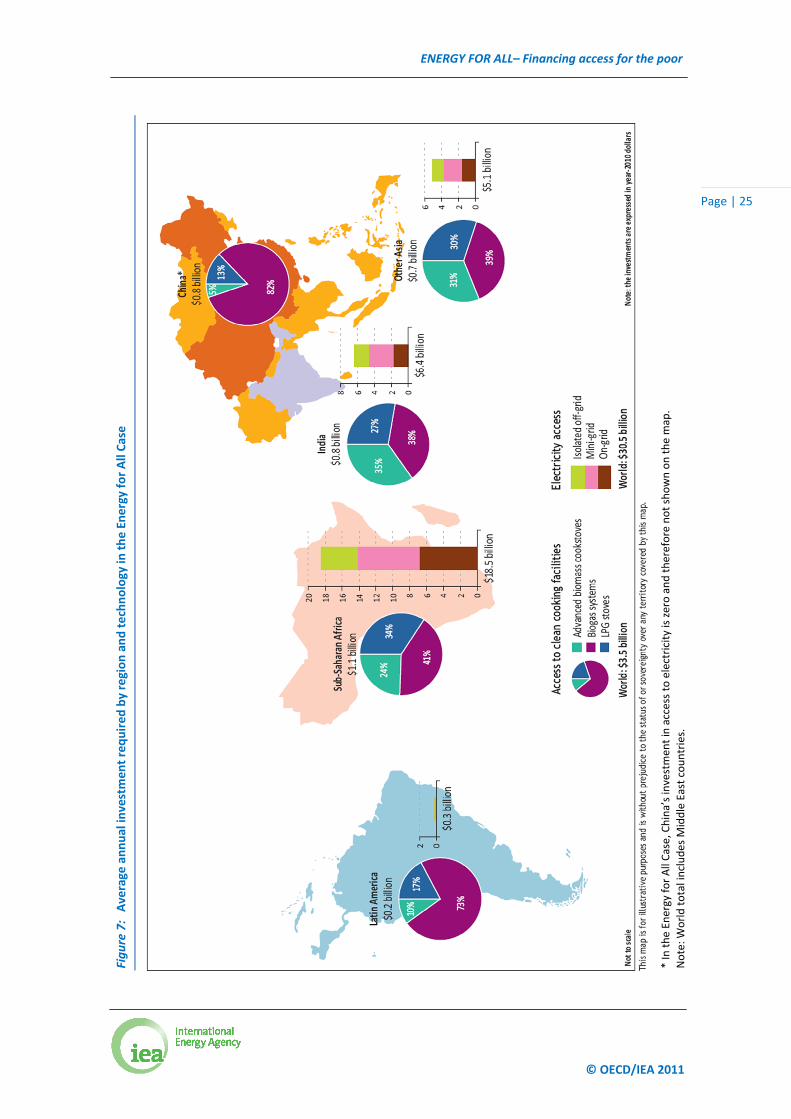
Figure 7: Average
annual investmen
t required by region and technology in
the Energy for All Case
* In the Energy for All Case, China’s investmen
t in access to electricity is zero and therefore not shown on the m
ap.
Note: W
orld total includes Middle East countries.
ENERGY FOR ALL– Financing access for the poor
© OECD/IEA 2011
Page | 26
Broader implications of achieving modern energy access for all
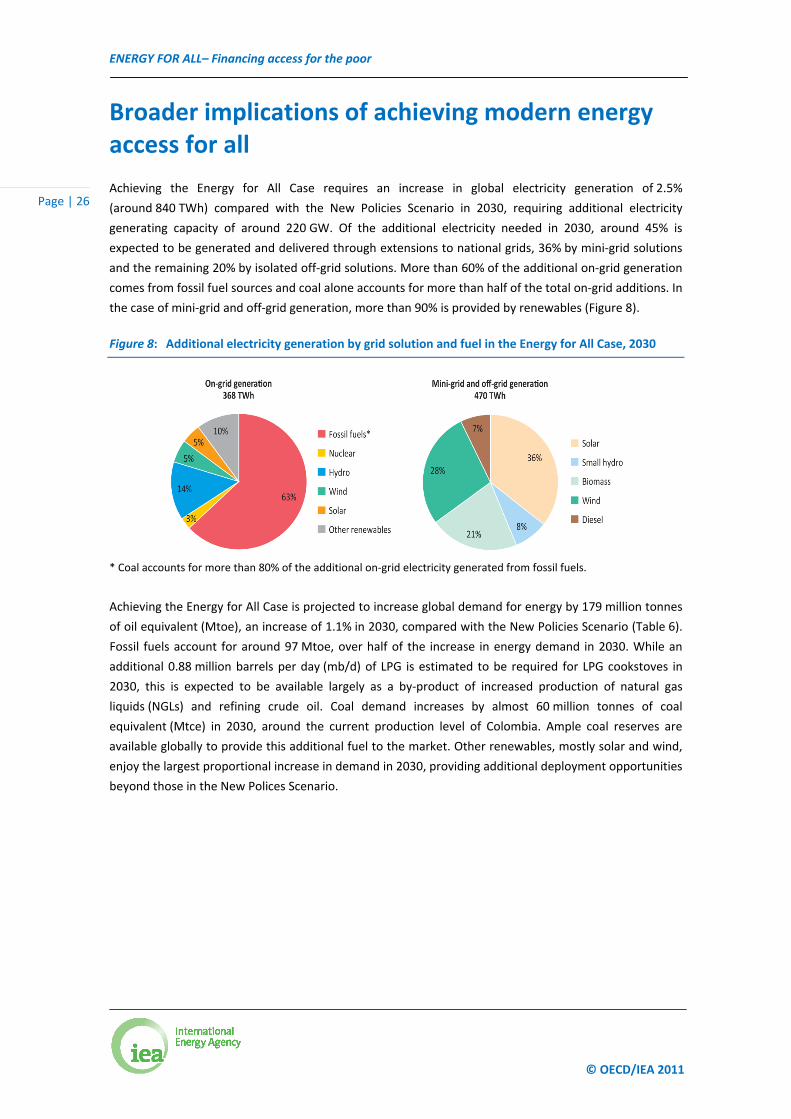
Achieving the Energy for All Case requires an increase in global electricity generation of 2.5%
(around 840 TWh) compared with the New Policies Scenario in 2030, requiring additional electricity
generating capacity of around 220 GW. Of the additional electricity needed in 2030, around 45% is
expected to be generated and delivered through extensions to national grids, 36% by mini‐grid solutions
and the remaining 20% by isolated off‐grid solutions. More than 60% of the additional on‐grid generation
comes from fossil fuel sources and coal alone accounts for more than half of the total on‐grid additions. In
the case of mini‐grid and off‐grid generation, more than 90% is provided by renewables (Figure 8).
Figure 8: Additional electricity generation by grid solution and fuel in the Energy for All Case, 2030
* Coal accounts for more than 80% of the additional on‐grid electricity generated from fossil fuels.
Achieving the Energy for All Case is projected to increase global demand for energy by 179 million tonnes
of oil equivalent (Mtoe), an increase of 1.1% in 2030, compared with the New Policies Scenario (Table 6).
Fossil fuels account for around 97 Mtoe, over half of the increase in energy demand in 2030. While an
additional 0.88 million barrels per day (mb/d) of LPG is estimated to be required for LPG cookstoves in
2030, this is expected to be available largely as a by‐product of increased production of natural gas
liquids (NGLs) and refining crude oil. Coal demand increases by almost 60 million tonnes of coal
equivalent (Mtce) in 2030, around the current production level of Colombia. Ample coal reserves are
available globally to provide this additional fuel to the market. Other renewables, mostly solar and wind,
enjoy the largest proportional increase in demand in 2030, providing additional deployment opportunities
beyond those in the New Polices Scenario.
ENERGY FOR ALL– Financing access for the poor
© OECD/IEA 2011
Page | 27
Table 6: Additional energy demand in the Energy for All Case compared with the New Policies
Scenario, 2030
Additional energy demand
(Mtoe) Change versus the
New Policies Scenario
2020 2030 2020 2030
Coal 10 42 0.2% 1.0%
Oil 25 48 0.6% 1.1%
Gas 1 7 0.0% 0.2%
Nuclear 3 3 0.3% 0.2%
Hydro 6 8 1.5% 1.7%
Biomass and waste 8 31 0.5% 1.8%
Other renewables 12 41 4.0% 7.8%
Total 64 179 0.4% 1.1%
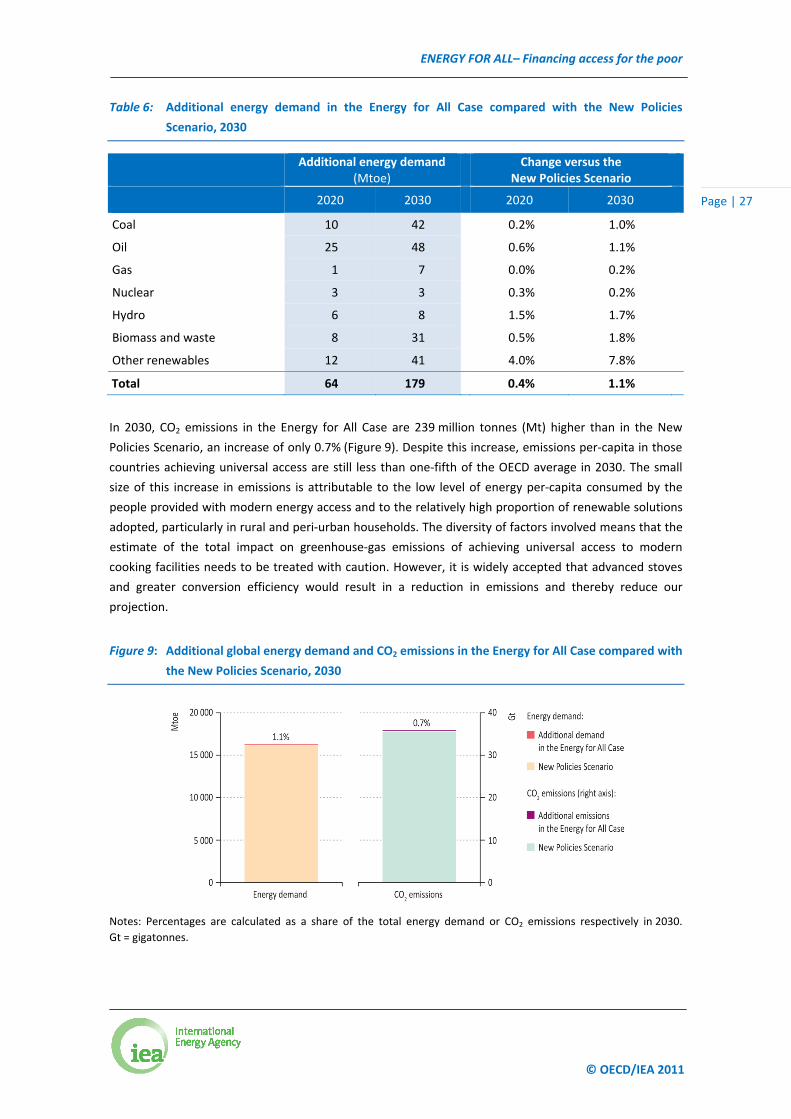
In 2030, CO2 emissions in the Energy for All Case are 239 million tonnes (Mt) higher than in the New
Policies Scenario, an increase of only 0.7% (Figure 9). Despite this increase, emissions per‐capita in those
countries achieving universal access are still less than one‐fifth of the OECD average in 2030. The small
size of this increase in emissions is attributable to the low level of energy per‐capita consumed by the
people provided with modern energy access and to the relatively high proportion of renewable solutions
adopted, particularly in rural and peri‐urban households. The diversity of factors involved means that the
estimate of the total impact on greenhouse‐gas emissions of achieving universal access to modern
cooking facilities needs to be treated with caution. However, it is widely accepted that advanced stoves
and greater conversion efficiency would result in a reduction in emissions and thereby reduce our
projection.
Figure 9: Additional global energy demand and CO2 emissions in the Energy for All Case compared with
the New Policies Scenario, 2030
Notes: Percentages are calculated as a share of the total energy demand or CO2 emissions respectively in 2030.
Gt = gigatonnes.
ENERGY FOR ALL– Financing access for the poor
© OECD/IEA 2011
Page | 28
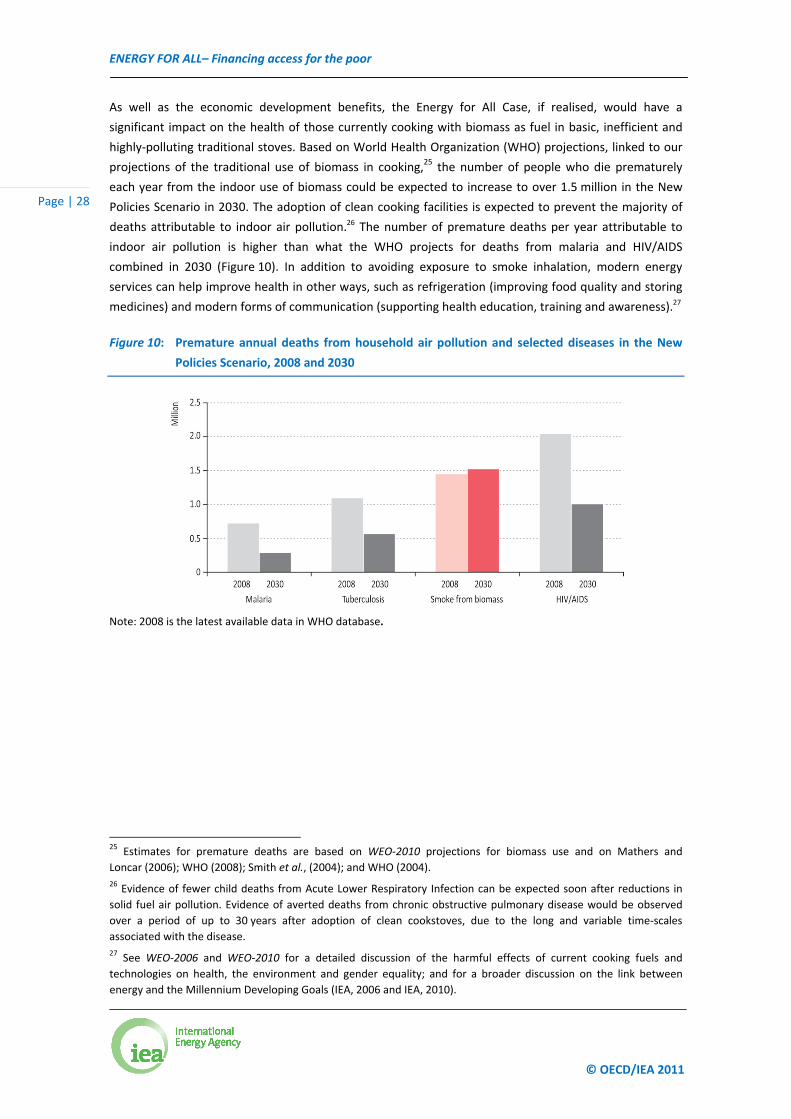
As well as the economic development benefits, the Energy for All Case, if realised, would have a
significant impact on the health of those currently cooking with biomass as fuel in basic, inefficient and
highly‐polluting traditional stoves. Based on World Health Organization (WHO) projections, linked to our
projections of the traditional use of biomass in cooking,25 the number of people who die prematurely
each year from the indoor use of biomass could be expected to increase to over 1.5 million in the New
Policies Scenario in 2030. The adoption of clean cooking facilities is expected to prevent the majority of
deaths attributable to indoor air pollution.26 The number of premature deaths per year attributable to
indoor air pollution is higher than what the WHO projects for deaths from malaria and HIV/AIDS
combined in 2030 (Figure 10). In addition to avoiding exposure to smoke inhalation, modern energy
services can help improve health in other ways, such as refrigeration (improving food quality and storing
medicines) and modern forms of communication (supporting health education, training and awareness).27
Figure 10: Premature annual deaths from household air pollution and selected diseases in the New
Policies Scenario, 2008 and 2030
Note: 2008 is the latest available data in WHO database.
25 Estimates for premature deaths are based on WEO‐2010 projections for biomass use and on Mathers and
Loncar (2006); WHO (2008); Smith et al., (2004); and WHO (2004).
26 Evidence of fewer child deaths from Acute Lower Respiratory Infection can be expected soon after reductions in
solid fuel air pollution. Evidence of averted deaths from chronic obstructive pulmonary disease would be observed
over a period of up to 30 years after adoption of clean cookstoves, due to the long and variable time‐scales
associated with the disease.
27 See WEO‐2006 and WEO‐2010 for a detailed discussion of the harmful effects of current cooking fuels and
technologies on health, the environment and gender equality; and for a broader discussion on the link between
energy and the Millennium Developing Goals (IEA, 2006 and IEA, 2010).
ENERGY FOR ALL– Financing access for the poor
© OECD/IEA 2011
Page | 29
Financing to achieve modern energy access for all
The size of the increase in investment that is required in the Energy for All Case is significant. We focus
here on how the investment required to achieve the objectives of the Energy for All Case can best be
financed. Whatever the possible sources, it is important to recognise that sufficient finance will not be
forthcoming in the absence of strong governance and regulatory reform. Technical assistance in these
areas from multilateral and bilateral organisations and non‐governmental organisations (NGOs) will be
essential. While such assistance is often important in influencing the success of energy access projects,
the cost of its provision is difficult to quantify and the purpose and benefits are rarely confined only to
the eradication of energy poverty. Moreover, the most appropriate potential sources of finance depend,
in part, on the technical and social characteristics of the solutions best suited to each element of the
requirement (on‐grid, mini‐grid, off‐grid). A bottom‐up analysis on this basis has been undertaken to
suggest which financing instruments (loans, grants, etc.) and sources of financing (domestic government,
multilateral or bilateral development funding, or the private sector) might be most appropriate.
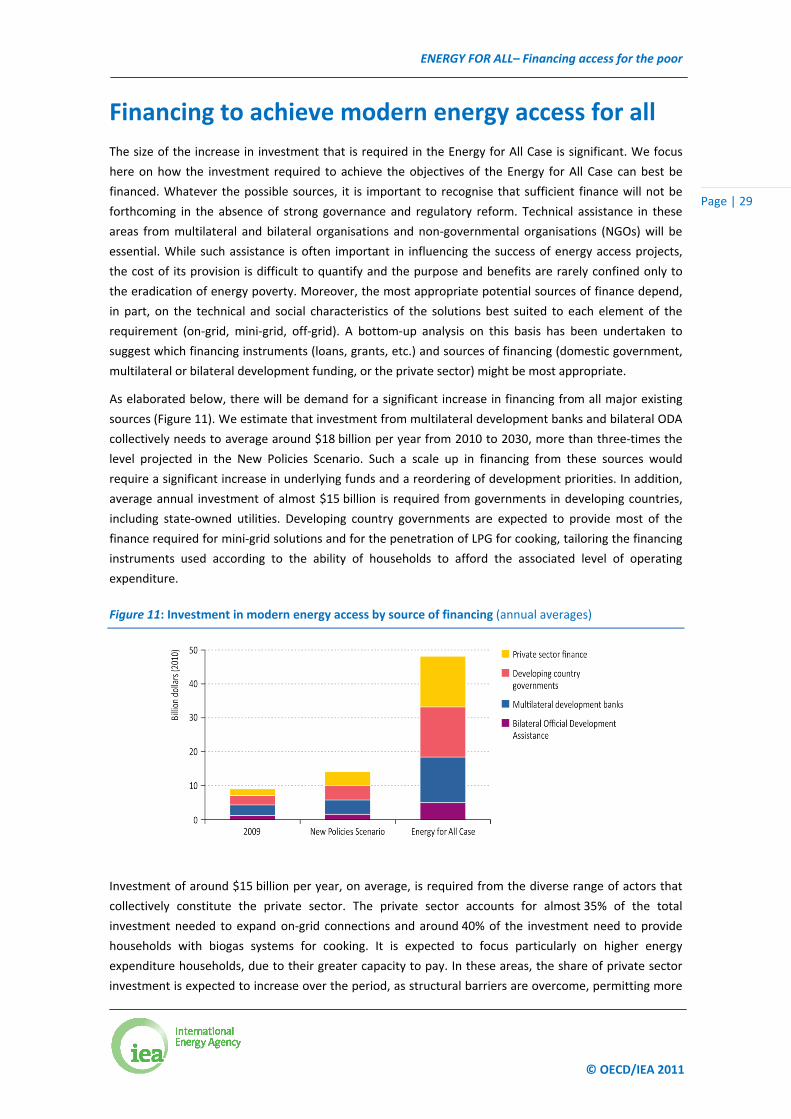
As elaborated below, there will be demand for a significant increase in financing from all major existing
sources (Figure 11). We estimate that investment from multilateral development banks and bilateral ODA
collectively needs to average around $18 billion per year from 2010 to 2030, more than three‐times the
level projected in the New Policies Scenario. Such a scale up in financing from these sources would
require a significant increase in underlying funds and a reordering of development priorities. In addition,
average annual investment of almost $15 billion is required from governments in developing countries,
including state‐owned utilities. Developing country governments are expected to provide most of the
finance required for mini‐grid solutions and for the penetration of LPG for cooking, tailoring the financing
instruments used according to the ability of households to afford the associated level of operating
expenditure.
Figure 11: Investment in modern energy access by source of financing (annual averages)
Investment of around $15 billion per year, on average, is required from the diverse range of actors that
collectively constitute the private sector. The private sector accounts for almost 35% of the total
investment needed to expand on‐grid connections and around 40% of the investment need to provide
households with biogas systems for cooking. It is expected to focus particularly on higher energy
expenditure households, due to their greater capacity to pay. In these areas, the share of private sector
investment is expected to increase over the period, as structural barriers are overcome, permitting more
ENERGY FOR ALL– Financing access for the poor
© OECD/IEA 2011
Page | 30
rapid expansion and for its potential to be increasingly realised. By contrast, a breakthrough is still
required in developing commercially‐viable business models for providing modern energy services to the
rural poor on a significant scale. Until such models are developed, private sector investment is not
expected to contribute substantially in this area, meaning that the public sector plays the dominant role.
In examining financing for access to both electricity and clean cooking facilities, we draw a distinction
between lower and higher household energy expenditure. For electricity, this is based on the
classification used by the International Finance Corporation (IFC) in its report on Energy Access Business
Models (IFC, forthcoming). It is estimated that around half of the 270 million households currently lacking
access to electricity spend up to $5.50 per month on traditional energy for lighting services: we refer to
these as lower energy expenditure households and those above this threshold as higher energy
expenditure households.28 For financing clean cooking facilities, a similar distinction, based on IFC energy
expenditure thresholds, does not prove meaningful for our purposes.29 Instead, we adopt a classification
based on the international poverty line of receiving income of $1.25 per day: those living under the
poverty line are classified as lower income and those above the poverty line as higher income.30
Electricity access – financing on‐grid electrification
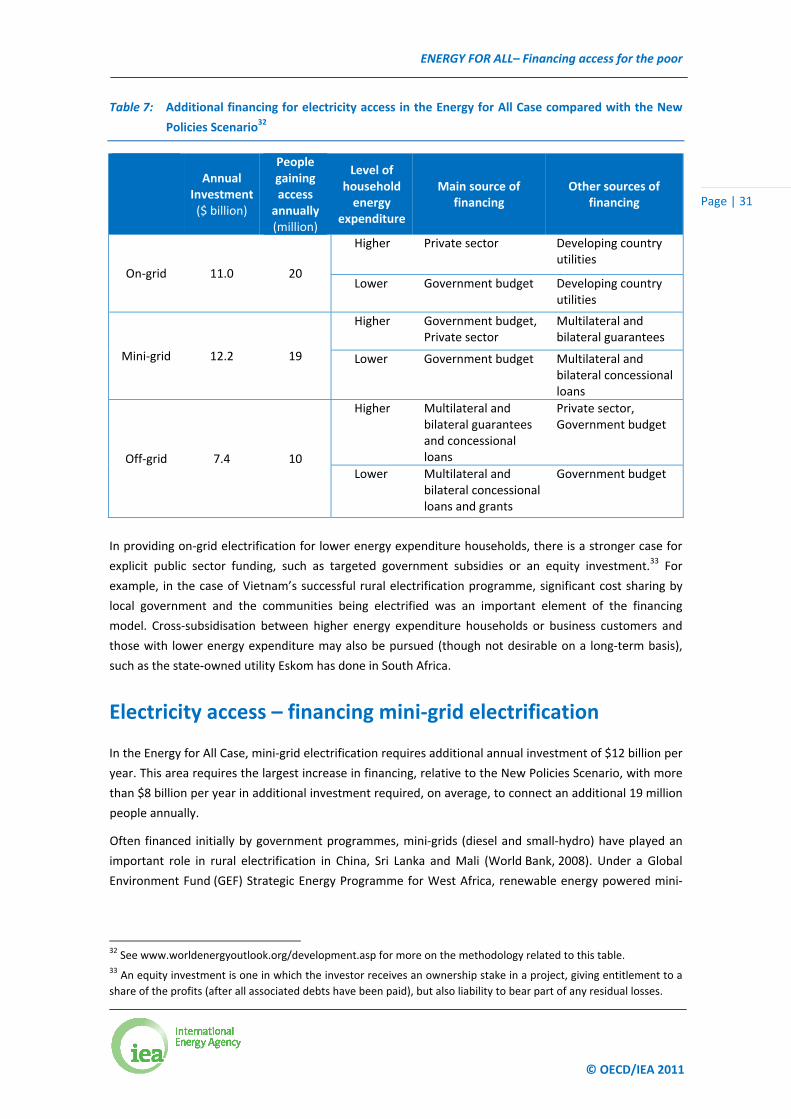
In the Energy for All Case, on‐grid electrification requires additional annual investment of $11 billion. This
is $4 billion per year higher than projected in the New Policies Scenario and provides access to electricity
to an additional 20 million people per year. Table 7 shows a breakdown of the additional annual
investment required for universal access to electricity, together with an indication of what the main and
supplementary sources of finance are anticipated to be in each area.
We estimate that around 60% of the additional investment required relates to higher energy expenditure
households. For this category, private investors may be expected to bid for a concession or to enter into a
public‐private partnership (PPP) with a local utility to extend the grid and provide universal access in an
agreed area.31 It may be important to include electricity generation, often the financially more attractive
element, together with transmission and distribution, as it can be difficult to generate interest in the
latter separately. Such concessionaire grid extensions have taken place in Argentina, Chile, Guatemala
and Uganda (World Bank, 2009a). Private investors may also be able to source loans from international or
local banks on the basis of the financial attractiveness of the project, backed by multilateral development
bank guarantees. Attracting private investment to such projects depends crucially on investors being able
to charge tariffs that generate a reasonable return. In some instances, a state‐owned utility mandated by
the government to provide universal access may be able to attract private sector loans at competitive
rates to supplement internal financing. In other instances, a utility (in private or public ownership) may
not be sufficiently creditworthy to raise finance commercially, and may require support, such as through
a partial risk guarantee.
28 Lighting services includes kerosene, candles and disposable batteries.
29 Available information on household expenditure thresholds for cooking fuels results in 95% being placed in one
category, therefore resulting in little differentiation.
30 www.worldbank.org
31 Public private partnerships are contractual arrangements typified by joint working between the public and private
sector. In the broadest sense, they can cover all types of collaboration across the interface between the public and
private sectors to deliver policies, services and infrastructure.
ENERGY FOR ALL– Financing access for the poor
© OECD/IEA 2011
Page | 31
Table 7: Additional financing for electricity access in the Energy for All Case compared with the New
Policies Scenario32
Annual
Investment ($ billion)
People gaining access annually (million)
Level of household energy
expenditure
Main source of financing
Other sources of financing
On‐grid 11.0 20
Higher Private sector Developing country utilities
Lower Government budget Developing country utilities
Mini‐grid 12.2 19
Higher Government budget, Private sector
Multilateral and bilateral guarantees
Lower Government budget Multilateral and bilateral concessional loans
Off‐grid 7.4 10
Higher Multilateral andbilateral guarantees and concessional loans
Private sector, Government budget
Lower Multilateral andbilateral concessional loans and grants
Government budget
In providing on‐grid electrification for lower energy expenditure households, there is a stronger case for
explicit public sector funding, such as targeted government subsidies or an equity investment.33 For
example, in the case of Vietnam’s successful rural electrification programme, significant cost sharing by
local government and the communities being electrified was an important element of the financing
model. Cross‐subsidisation between higher energy expenditure households or business customers and
those with lower energy expenditure may also be pursued (though not desirable on a long‐term basis),
such as the state‐owned utility Eskom has done in South Africa.
Electricity access – financing mini‐grid electrification
In the Energy for All Case, mini‐grid electrification requires additional annual investment of $12 billion per
year. This area requires the largest increase in financing, relative to the New Policies Scenario, with more
than $8 billion per year in additional investment required, on average, to connect an additional 19 million
people annually.
Often financed initially by government programmes, mini‐grids (diesel and small‐hydro) have played an
important role in rural electrification in China, Sri Lanka and Mali (World Bank, 2008). Under a Global
Environment Fund (GEF) Strategic Energy Programme for West Africa, renewable energy powered mini‐
32 See www.worldenergyoutlook.org/development.asp for more on the methodology related to this table. 33 An equity investment is one in which the investor receives an ownership stake in a project, giving entitlement to a
share of the profits (after all associated debts have been paid), but also liability to bear part of any residual losses.
ENERGY FOR ALL– Financing access for the poor
© OECD/IEA 2011
Page | 32
grids are being established in eight countries.34 Hybrid mini‐grids, integrating renewable generation with
back‐up capacity, have expanded rapidly in Thailand (Phuangpornpitak et al., 2005), and are becoming
competitive compared with 100% diesel‐based generation (ARE, 2011a). In Laos, a successful public‐
private partnership, has been established to fund a hybrid (hydro, solar PV and diesel) mini‐grid, serving
more than 100 rural households. In the project, public partners fund the capital assets, while the private
local energy provider finances the operating costs (ARE, 2011b).
The most appropriate type of technical and financing solution for mini‐grid projects can vary significantly.
In some cases, mini‐grid projects can be run on a cost‐recovery basis with a guaranteed margin, and
therefore attract private sector finance on commercial terms (particularly diesel systems). In the case of
more marginal projects, output‐based subsidies may be used to support private sector activity in the
sector. For many high energy expenditure households, an auction for concessions, combined with output‐
based subsidies, can keep subsidies low while giving concessionaires incentives to complete promised
connections. In such cases, electricity providers bid for the value of subsidies that they require (referred
to as “viability gap funding”) or for the number of electricity connections they will make during a specified
period at a pre‐determined rate of subsidy per connection. Ideally, such auctions are technology‐neutral,
as in Senegal’s recent programme, allowing providers to determine the most cost‐effective solution.
Loans or grants to the government from multilateral and bilateral sources could provide financing to
support the initial auction and subsidy costs, as the International Development Association (IDA) and GEF
grants did in Senegal (GPOBA, 2007). Such sources may also help support end‐user financing programmes
which offer assistance to cover the connection charges through the concessionaire or local banking
system. For example, the IDA and GEF helped Ethiopia’s Electric Power Corporation offer credit to rural
customers (GPOBA, 2009).
An important form of financing for mini‐grid electrification for low energy expenditure households is
expected to be government‐initiated co‐operatives and public‐private partnerships.35 Bangladesh and
Nepal provide examples of such co‐operatives (Yadoo and Cruickshank, 2010). There is a relatively high
assumed capital subsidy from the government in this model, typically with support in the form of
concessional loans from multilateral and bilateral donors.
Electricity access – financing off‐grid electrification
Isolated off‐grid electricity solutions require additional investment of $7 billion per year to 2030. This
represents an increase of $5 billion per year, compared with the New Policies Scenario, in order to
provide electricity access to an additional 10 million people per year. In general, off‐grid connections are
less attractive to the private sector and require different technical solutions and related financing. In the
Energy for All Case, the main financing model for off‐grid electrification of high energy expenditure
households involves enhancing the capacity of dealers in solar home systems and lanterns to offer
financing to end‐users. Examples of this may be found in the Philippines (UNEP, 2007) and Kenya (Yadoo
and Cruickshank, 2010). Government and concessional funds could also be used directly to support
34 www.un‐energy.org 35 Many forms of business co‐operatives exist but, in general, the term refers to a company that is owned by a group
of individuals who also consume the goods and services it produces and/or are its employees. A utility co‐operative is
tasked with the generation and/or transmission and distribution of electricity.
ENERGY FOR ALL– Financing access for the poor
© OECD/IEA 2011
Page | 33
microfinancing36 networks or local banks that, in turn, provide loans down the chain to end‐users, as has
happened, for example, in UNEP’s India Solar Loan Programme (UNEP, 2007) and in several African
countries under the Rural Energy Foundation, which is supported by the government of the Netherlands
(Morris et al., 2007). In some cases, where microfinance is not available, local agricultural co‐operatives
might be a channel for funds. Government and concessional funds could also be used for output‐based
subsidies in some countries. Different sources of financing can play complementary roles in different
stages of a programme or project to deliver energy access. For example, a programme for small‐hydro
systems in rural areas in Nepal received over 90% of its funding from public sources at the beginning,
much of which was dedicated to capacity development. The share of public financing gradually declined
to about 50% at a later stage, suggesting that public investments in developing national and local
capacities subsequently attracted private financing (UNDP, AEPC and Practical Action, 2010).
Off‐grid electrification of low energy expenditure households is the most challenging area in which to
raise finance. A potentially attractive solution for many such cases is sustainable solar marketing
packages, pioneered by the World Bank and GEF in the Philippines and later introduced in Zambia and
Tanzania. They are based on a service contract to install and maintain solar photovoltaic systems to key
public service customers, such as schools, clinics and public buildings. Such contracts include an exclusive
right to provide such services also to households and commercial customers, and provide a subsidy for
each non‐public system installed in the concession area. As for many other solutions, the development of
end‐user financing is also important. The first phase of the “Lighting Africa” programme by the IFC and
World Bank saw the most basic needs met through solar home systems (SHS) provided on a fee‐for‐
service basis. While donor‐based models remain, and SHS are still an important and growing segment, the
lighting market is now entering a new phase that is being led by entrepreneurs providing solar portable
lights. The scale of these operations is currently small, and the cost can still be a barrier, but the
technology is improving at a rapid rate and business models are maturing (IFC and World Bank, 2010).
Clean cooking facilities – financing LPG stoves
In the Energy for All Case, of the additional $3.5 billion per year in investment needed to achieve
universal access to clean cooking facilities, $0.9 billion is required for LPG stoves to supply an additional
55 million people per year with a first stove and financing for 50% of the first replacement after five years
(Table 8). Households supplied with LPG stoves are concentrated in urban and peri‐urban areas or may be
in areas with high levels of deforestation. As in most countries where LPG stoves have been successfully
introduced, such as Kenya, Gabon and Senegal, the government has a role to play in market creation,
such as developing common standards and the distribution infrastructure. This will require a certain
amount of investment on the part of the government, which may be financed in part by concessional
loans from multilateral and bilateral institutions. Besides investment in supporting public infrastructure,
such as roads, the government may need to ensure that loans are available for entrepreneurs wishing to
invest in LPG distribution. This could be done through a guarantee programme for a line of credit made
available through participating local banks, possibly ultimately supported by a multilateral development
bank.
36 The term microfinance typically refers to the provision of financial services to low income people that lack access
to such services from mainstream providers, either due to the small sums involved or because they are on terms that
are not considered commercially attractive. The stated intention of microfinance organisations is often to provide
access to financial services as a means of poverty alleviation.
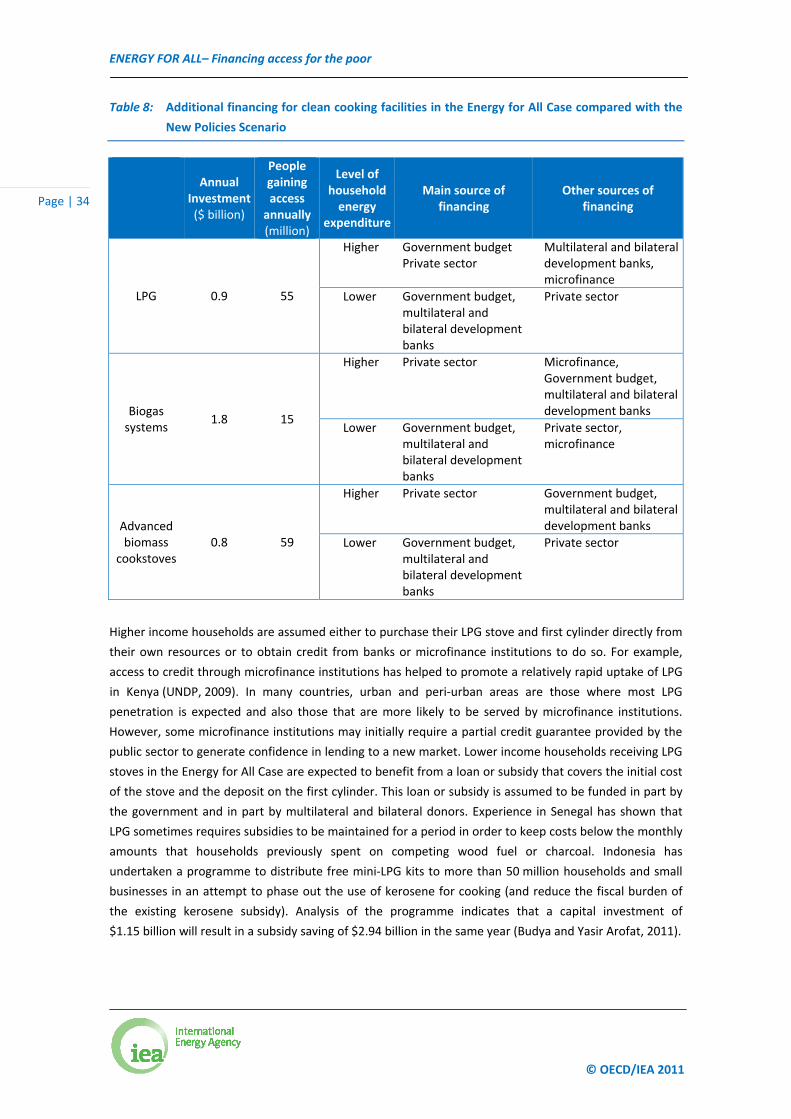
ENERGY FOR ALL– Financing access for the poor
© OECD/IEA 2011
Page | 34
Table 8: Additional financing for clean cooking facilities in the Energy for All Case compared with the
New Policies Scenario
Annual
Investment ($ billion)
People gaining access annually (million)
Level of household energy
expenditure
Main source of financing
Other sources of financing
LPG 0.9 55
Higher Government budget Private sector
Multilateral and bilateral development banks, microfinance
Lower Government budget,multilateral and bilateral development banks
Private sector
Biogas systems
1.8 15
Higher Private sector Microfinance, Government budget, multilateral and bilateral development banks
Lower Government budget, multilateral and bilateral development banks
Private sector, microfinance
Advanced biomass
cookstoves 0.8 59
Higher Private sector Government budget, multilateral and bilateral development banks
Lower Government budget, multilateral and bilateral development banks
Private sector
Higher income households are assumed either to purchase their LPG stove and first cylinder directly from
their own resources or to obtain credit from banks or microfinance institutions to do so. For example,
access to credit through microfinance institutions has helped to promote a relatively rapid uptake of LPG
in Kenya (UNDP, 2009). In many countries, urban and peri‐urban areas are those where most LPG
penetration is expected and also those that are more likely to be served by microfinance institutions.
However, some microfinance institutions may initially require a partial credit guarantee provided by the
public sector to generate confidence in lending to a new market. Lower income households receiving LPG
stoves in the Energy for All Case are expected to benefit from a loan or subsidy that covers the initial cost
of the stove and the deposit on the first cylinder. This loan or subsidy is assumed to be funded in part by
the government and in part by multilateral and bilateral donors. Experience in Senegal has shown that
LPG sometimes requires subsidies to be maintained for a period in order to keep costs below the monthly
amounts that households previously spent on competing wood fuel or charcoal. Indonesia has
undertaken a programme to distribute free mini‐LPG kits to more than 50 million households and small
businesses in an attempt to phase out the use of kerosene for cooking (and reduce the fiscal burden of
the existing kerosene subsidy). Analysis of the programme indicates that a capital investment of
$1.15 billion will result in a subsidy saving of $2.94 billion in the same year (Budya and Yasir Arofat, 2011).
ENERGY FOR ALL– Financing access for the poor
© OECD/IEA 2011
Page | 35
Clean cooking facilities – financing biogas systems
In the Energy for All Case, additional annual investment of $1.8 billion is required in biogas systems over
the projection period. This is an increase in investment of $1.2 billion annually, compared with the New
Policies Scenario, and provides an additional 15 million people each year with a biogas system for
cooking. In the Energy for All Case, an output‐based subsidy programme for trained and certified
installation companies is assumed to cover about 30% of the cost of a biogas digester. In 2010, a subsidy
of 26% of the total cost was available for a home biogas plant of an average size in Bangladesh and Nepal,
while in China subsidy levels have been as high as 69% of total costs (SNV, 2011). A subsidy may be
provided to the builder via a rural development agency or equivalent after verification of successful
installation. In return for receiving the subsidy, the installer can be obliged to guarantee the unit for
several years. Assistance from multilateral and bilateral donors or NGOs can help train biogas digester
builders, as SNV has done in several countries.
Both higher and lower income households may require a loan to cover part of the cost of a biogas system.
For example, the Asian Development Bank (ADB) has worked with SNV to add a credit component to a
biogas programme in Vietnam (ADB, 2009). The Biogas Partnership in Nepal has on‐lent donor and
government funds to over eighty local banks and microfinance institutions to provide end‐user
financing (UNDP, 2009 and Ashden Awards, 2006). This programme involved support for the development
of local, private sector biogas manufacturing capacity, as well as training and certification facilities to
ensure that quality standards were maintained. Between 35% and 50% of the capital costs were
subsidised through grants from international donors, such as the German development finance
institution, KfW. Loan capital was available for the remaining capital investment.
The government, through a national development bank or rural energy agency, may need to support
microfinance institutions or rural agricultural credit co‐operatives to expand their coverage and lending to
rural areas. This can be done by offering grants, or by temporarily offering partial credit guarantees or
loans at below‐market interest rates that enable on‐lending, until financial institutions are confident to
operate in the new market. In some cases, lower income households may also lower the unit price by
contributing their labour, which can be around 30% of the cost (Ashden Awards, 2010).
Clean cooking facilities – financing advanced cookstoves
In the Energy for All Case, additional annual financing of $0.8 billion is required in advanced biomass
cookstoves. This is an increase of $0.6 billion per year, compared with the New Policies Scenario, and
serves to provide a first advanced cookstove to an additional 60 million people per year and financing
for 50% of the first replacement after five years. While advanced cookstoves can help cut wood fuel use
substantially, the economic arguments alone may not be compelling for many households, especially if
wood fuel is considered “free” and the time of the persons collecting it – typically women and girls – is
not sufficiently valued. Comprehensive public information and demonstration campaigns to explain the
health and other benefits are therefore likely to be required to increase household acceptance. In
addition, funding will be required to ensure adequate quality control of cookstoves.37 Such campaigns are
37 Funding for quality control is not included in our estimates of the required investment costs.
ENERGY FOR ALL– Financing access for the poor
© OECD/IEA 2011
Page | 36
expected to be funded with grants, either from the government or multilateral and bilateral development
partners, and will benefit from international support through initiatives such as The Global Alliance for
Clean Cookstoves. Public information and demonstration campaigns have successfully led to market
transformation in Uganda, Mali and Madagascar among others (AFD, 2011). In Sri Lanka, an estimated
6 million advanced cookstoves have been sold over the last ten years using innovative business models,
such as “try before you buy”. The programme has been supported by several international donors and
the government of Sri Lanka (IEA, 2011).
Of the additional investment in the Energy for All Case, an estimated 70% is directed to lower income
households. For these, the provision of credit to help purchase advanced cookstoves may be appropriate
in some cases, as successfully implemented by Grameen Shakti in Bangladesh (Ashden Awards, 2008).
Unfortunately, use of microcredit may be problematic for advanced stoves, particularly because of the
high transaction costs compared with the purchase price and the traditional focus of microcredit on
income‐generating activities (Marrey and Bellanca, 2010). As an alternative, the government may help
develop dealer financing through certified cookstove builders, i.e. using a partial credit guarantee with
funds provided by the government or by multilateral and bilateral development partners. Experience in
some countries has shown that large subsidies (and especially give‐aways) can actually undermine the
market for advanced stoves and create expectations of a subsidy for replacement stoves (AFD, 2011).
Sources of financing and barriers to scaling up This section considers the main sources of financing in more detail, and the types of projects and
instruments to which they are, or may become, most effectively committed. These sources are
summarised under the main categories: multilateral and bilateral development sources, developing
country government sources and private sector sources. It is recognised that there are instances in which
these categories may overlap or change over time. For example, countries currently focused on investing
in energy access domestically may also invest in other countries. Rapidly industrialising countries, such as
China and India, may be such cases. Within each broad category, several different types of organisations
may offer one or more types of financing instrument to improve energy access. Table 9 shows different
financing instruments and a summary of the sources that might typically offer them.
Multilateral and bilateral development sources
Multilateral development sources include the World Bank Group,38 the regional development banks39 and
major multilateral funds, such as the Organization of the Petroleum Exporting Counties Fund for
International Development (OFID) and the Scaling‐up Renewable Energy Program for Low‐Income
Countries (SREP) (Box 4 considers the International Energy and Climate Partnership – Energy+). Bilateral
sources are primarily official development assistance provided by the 24 OECD countries that are
members of the OECD Development Assistance Committee (DAC). These OECD member countries
account for the bulk of global development aid today (99% of total ODA in 2010), including that provided
38 World Bank Group includes the World Bank, International Development Association, International Bank for
Reconstruction and Development, International Finance Corporation and Multilateral Investment Guarantee Agency.
39 Regional development banks include the Asian Development Bank, African Development Bank and the Inter‐
American Development Bank.
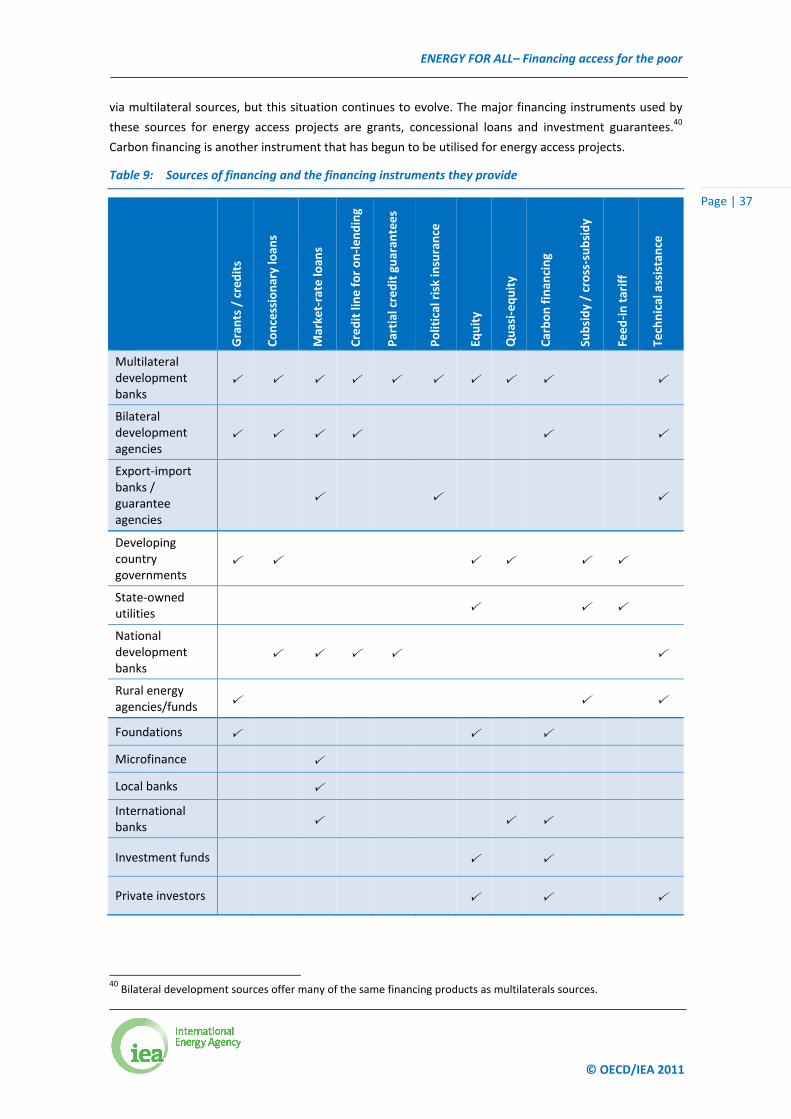
ENERGY FOR ALL– Financing access for the poor
© OECD/IEA 2011
Page | 37
via multilateral sources, but this situation continues to evolve. The major financing instruments used by
these sources for energy access projects are grants, concessional loans and investment guarantees.40
Carbon financing is another instrument that has begun to be utilised for energy access projects.
Table 9: Sources of financing and the financing instruments they provide
Grants / credits
Concessionary loan
s
Market‐rate loan
s
Credit line for on‐len
ding
Partial credit guaran
tees
Political risk insurance
Equity
Quasi‐eq
uity
Carbon finan
cing
Subsidy / cross‐subsidy
Feed
‐in tariff
Technical assistance
Multilateral development banks
Bilateral development agencies
Export‐import banks / guarantee agencies
Developing country governments
State‐owned utilities
National development banks
Rural energy agencies/funds
Foundations
Microfinance
Local banks
International banks
Investment funds
Private investors
40 Bilateral development sources offer many of the same financing products as multilaterals sources.
ENERGY FOR ALL– Financing access for the poor
© OECD/IEA 2011
Page | 38
Credits from the International Development Association (IDA) have been the main instrument employed
by the World Bank Group for energy access projects, followed by grants, including from special funds such
as the GEF and the Carbon Funds. However, obtaining grants can require long proposal preparation
periods and the need to satisfy multiple criteria. The International Bank for Reconstruction and
Development (IBRD) also provides concessional loans to medium‐income governments, which are
typically applied to large electricity infrastructure projects. The IFC is able to lend to the private sector
and organise loan syndications that give international banks greater confidence to invest in projects in
developing countries. It also lends to local financial institutions for on‐lending to small and medium
businesses, and is increasingly creating guarantee products that help develop the capacity of the local
banking sector and making equity investments. The UN Development Programme (UNDP) and
UN Environment Programme (UNEP) have been particularly active in helping develop schemes for end‐
user finance.
Political risk insurers, such as the Multilateral Investment Guarantee Agency (MIGA), and bilateral
programmes such as Norway’s Guarantee Institution for Export Credit (GIEK), have a mission to promote
foreign direct investment in developing countries by insuring private investors against risks such as
breach of contract, non‐fulfilment of government financial obligations and civil disturbances. Obtaining
such risk insurance can have leveraging effects, making it easier for projects to obtain commercial
finance, or to do so at lower cost. Financing from most multilateral and bilateral development sources is
usually accompanied by technical assistance, such as policy and institutional development advice to
ensure the efficient use of the provided funds. Such investment in technical assistance can be important
in ensuring that an adequate number of private projects enter the financing pipeline.
Potential barriers to scaling up the financing instruments provided by multilateral and bilateral sources
for energy access include: the significant amount of regulatory and financial sector reforms that may be
necessary to enable some countries to absorb increases in development (and other) financing; the need
to satisfy multiple criteria in order to apply much of the available development assistance to energy
access projects, particularly those related to renewable sources and climate change; and, the reordering
of development priorities that may be required of organisations (and the governments behind them) in
order to increase the share of energy access projects within their portfolios.
Box 4: International Energy and Climate Partnership – Energy+
The International Energy and Climate Partnership – Energy+, an initiative that aims to increase access to
energy and decrease or avoid greenhouse‐gas emissions by supporting efforts to scale up investments in
renewable energy and energy efficiency, is a pertinent example of the increasing international
recognition of the importance of providing modern energy access to the poor. It focuses on the inter‐
related challenges of access to modern energy services and climate change, recognising that both issues
require a serious increase in capital financing. The initiative seeks to engage with developing countries
to support large‐scale transformative change to energy access and to avoid or reduce energy sector
greenhouse‐gas emissions. It seeks to apply a results‐based sector level approach and to leverage
private capital and carbon market financing. The Energy+ Partnership aims to co‐operate with
governments and to leverage private sector investment, to develop commercially viable renewable
energy and energy efficiency business opportunities to meet the challenge of increasing access to
energy in a sustainable manner. The intention is to facilitate increased market readiness by creating the
necessary technical, policy and institutional frameworks. The government of Norway has initiated
dialogue with possible partners to develop the initiative.
ENERGY FOR ALL– Financing access for the poor
© OECD/IEA 2011
Page | 39
Carbon financing
Carbon finance offers a possible source of income for energy access projects that also help reduce
greenhouse‐gas emissions. The revenue is raised through the sale of carbon credits within the Clean
Development Mechanism (CDM) and voluntary mechanisms. The value of carbon credits produced from
new CDM projects reached around $7 billion per year prior to the global financial and economic crisis.
However, low income regions so far have made little use of carbon finance mechanisms to mobilise
capital for investment in energy access. Up to June 2011, only 15 CDM projects, or 0.2% of the total, have
been designed to increase or improve energy access for households.41
The potential for projects to serve both energy access and climate change purposes in sub‐Saharan Africa
is estimated to be large, nearly 1 200 TWh (150 GW) of electricity generation at an investment cost of
$200 billion. In total, these projects could possibly generate $98 billion in CDM revenue at a carbon offset
price of $10 per tonne of CO2 (World Bank, 2011).
Substantial obstacles must first be overcome. Getting any project approved for CDM is at present often a
long, uncertain and expensive process. Upfront costs are incurred to determine the emissions baseline
and to get the project assessed, registered, monitored and certified. These high transaction costs mean
that CDM is not currently practical for small projects. The CDM Executive Board has taken steps to
simplify the requirements for small‐scale projects and for projects in the least developed countries and it
is hoped that these and other ongoing initiatives, such as standardised project baselines, will facilitate the
application of the CDM for energy access projects. The increasing development of programmatic CDM
should help reduce transaction costs by consolidating the small carbon savings of individual access
projects. National governments in developing countries can act to reap the benefits from such
candidates, as recent projects have shown for advanced cookstoves in Togo, Zambia and Rwanda, and for
household lighting in Bangladesh and Senegal. Rural electrification agencies or national development
banks can act under government direction as co‐ordinating and managing entities for bundling energy
access projects.
Consensus is building on the importance of using carbon finance to support the development agenda in
poor countries. European Union (EU) legislation provides that carbon credits from new projects registered
after 2012 can only be used in the EU Emissions Trading Scheme if the projects are located in the least
developed countries. Such steps provide a more bankable basis for raising capital. To get capital flowing
into energy access projects backed by carbon finance in low income countries, it remains for national
governments fully to empower the relevant national authority to simplify the regulatory requirements
and to create the secure commercial environment necessary to win investor confidence. A recent report
by the UN Secretary General’s High‐level Advisory Group on Climate Financing (AGF)42 recognised carbon
offset development as a stimulant for private sector investment. Building private sector understanding of
the process of using carbon finance and confidence in it is an important objective for all parties.
41 Data available at UNEP RISOE CDM Pipeline Analysis and Database: www.uneprisoe.org.
42 The UN Secretary‐General established a High‐level Advisory Group on Climate Change Financing on
12 February 2010 for a duration of ten months. This Group studied potential sources of revenue that can enable
achievement of the level of climate change financing that was promised during the United Nations Climate Change
Conference in Copenhagen in December 2009. See www.un.org/climatechnage/agf.
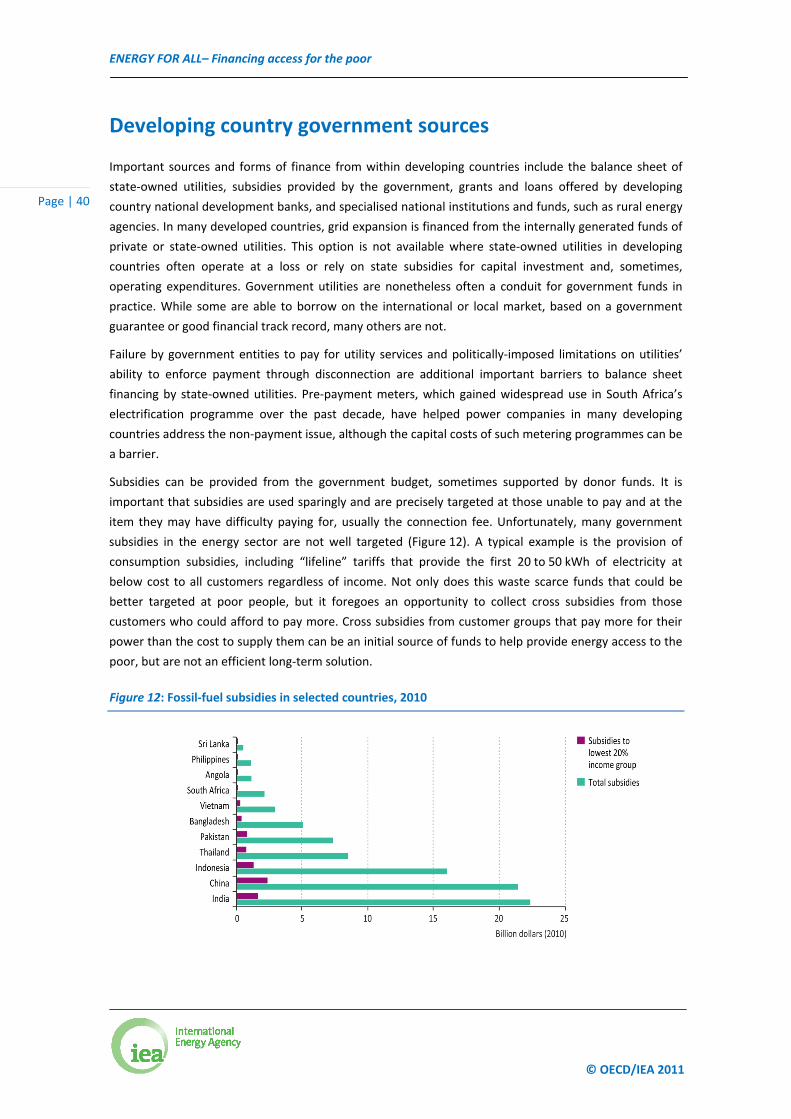
ENERGY FOR ALL– Financing access for the poor
© OECD/IEA 2011
Page | 40
Developing country government sources
Important sources and forms of finance from within developing countries include the balance sheet of
state‐owned utilities, subsidies provided by the government, grants and loans offered by developing
country national development banks, and specialised national institutions and funds, such as rural energy
agencies. In many developed countries, grid expansion is financed from the internally generated funds of
private or state‐owned utilities. This option is not available where state‐owned utilities in developing
countries often operate at a loss or rely on state subsidies for capital investment and, sometimes,
operating expenditures. Government utilities are nonetheless often a conduit for government funds in
practice. While some are able to borrow on the international or local market, based on a government
guarantee or good financial track record, many others are not.
Failure by government entities to pay for utility services and politically‐imposed limitations on utilities’
ability to enforce payment through disconnection are additional important barriers to balance sheet
financing by state‐owned utilities. Pre‐payment meters, which gained widespread use in South Africa’s
electrification programme over the past decade, have helped power companies in many developing
countries address the non‐payment issue, although the capital costs of such metering programmes can be
a barrier.
Subsidies can be provided from the government budget, sometimes supported by donor funds. It is
important that subsidies are used sparingly and are precisely targeted at those unable to pay and at the
item they may have difficulty paying for, usually the connection fee. Unfortunately, many government
subsidies in the energy sector are not well targeted (Figure 12). A typical example is the provision of
consumption subsidies, including “lifeline” tariffs that provide the first 20 to 50 kWh of electricity at
below cost to all customers regardless of income. Not only does this waste scarce funds that could be
better targeted at poor people, but it foregoes an opportunity to collect cross subsidies from those
customers who could afford to pay more. Cross subsidies from customer groups that pay more for their
power than the cost to supply them can be an initial source of funds to help provide energy access to the
poor, but are not an efficient long‐term solution.
Figure 12: Fossil‐fuel subsidies in selected countries, 2010
ENERGY FOR ALL– Financing access for the poor
© OECD/IEA 2011
Page | 41
Many developing countries have established development banks to help channel government and donor
finance to priority sectors that are not receiving sufficient private investment. National development
banks are useful entry points for multilateral and bilateral development institutions seeking to use their
lending to the energy‐sector, including to end‐users, to generate complementary funding from other
sources. Some have on‐lending and credit guarantee programmes with the local banking sector that
might be adapted to lending for energy access projects. National development banks may sometimes be
able to serve as an official guarantor for lending programmes supported with donor financing. In recent
years, several developing country governments have established agencies specifically to fund and
facilitate rural electrification. Some also promote modern cooking facilities, renewables and energy
efficiency. Use of rural energy agencies has been particularly prevalent in Africa, including in Mali,
Tanzania, Zambia, Senegal and Uganda, though they exist in a several Asian countries too, including
Cambodia and Nepal.
There are many reasons why domestic governments have difficulty in attracting or repaying financing for
energy access. The most notable is poor governance and regulatory frameworks. The absence of good
governance increases risk, so discouraging potential investors. The issue must be tackled.
Private sector sources
Private sector financing sources for energy access investments include international banks, local banks
and microfinance institutions, as well as international and domestic project developers, concessionaires
and contractors. Private finance may also come from specialist risk capital providers, such as venture
capital funds, private equity funds and pension funds. The main forms of instruments favoured by private
sources include equity, debt and mezzanine finance.43 An increasingly important instrument, offered
through local banks, is the extension of credit to end‐users, often with guarantees arranged in
partnership with multilateral development banks.
Private investors, enjoying a choice of where to place their money, across countries and across sectors,
respond to tradeoffs between risk and reward. Important issues to tackle when seeking to increase
private sector investment therefore include the provision of a competitive rate of return that incentivises
private sector performance while representing value for money to the public sector, and the clear
allocation to the most appropriate party of responsibility for risk. Existing experience reveals that
justifying the business case is not always easy, and many private sector participants in energy access
projects are doing so on the grounds of broader benefits to the company, such as corporate social
responsibility. Despite the challenges, there is significant innovation taking place with several models,
products and services in a pilot stage of development. Many potential private sector participants
currently view a PPP‐type model to be among the most attractive. In instances where the business case
for private sector investment is marginal, but there are clear public benefits, government support to
enhance or guarantee investment returns may be appropriate.
Countries that are seen to be particularly risky, in terms of macroeconomic, political or regulatory
stability, either have to assume more of the risks themselves, by offering credible guarantees, or seek to
have these risks covered by some form of insurance. A strong track record of introducing and
43 Mezzanine finance is a hybrid of debt and equity financing. Mezzanine financing is basically debt capital that gives
the lender the right to convert to an ownership or equity interest in the company under certain pre‐agreed
conditions.
ENERGY FOR ALL– Financing access for the poor
© OECD/IEA 2011
Page | 42
implementing robust and equitable government policies can reduce the need for financing guarantees.
Important factors for private investors in the power sector typically include (Lamech and Saeed, 2003):
A legal framework that defines the rights and obligations of private investors.
Consumer payment discipline and enforcement.
Credit enhancement or guarantee from the government or a multilateral agency.
Independent regulatory processes, free from arbitrary government interference.
International commercial banks have an established record of financing projects in the energy sector in
emerging markets, predominantly in power generation. Pricing finance at market rates according to
perceived risk, they offer debt financing, mezzanine finance and, in some cases, equity. They can lend to
project developers directly or to a special purpose vehicle set up to conduct the project. Commercial bank
financing terms can be less onerous if certain risks are covered by guarantees from a multilateral
development bank or the host government.
Local financial institutions in many developing countries are unable or unwilling to provide credit to rural
energy projects or to the end‐users of such projects. The World Bank, UNDP and UNEP, among others,
have been involved in pilot projects to create links between local banks and renewable energy service
providers and help them design suitable credit instruments. Understanding households’ existing energy
expenditures is one important step towards unlocking end‐user finance: poor people often are able to
afford the full price of modern energy because it costs less than the traditional forms it replaces, such as
kerosene lamps and dry cell batteries, but may be unable to overcome the important hurdle of the initial
capital cost.
Microfinance has been used as part of several programmes to tackle the problem of end‐user financing
for energy access, particularly in India and Bangladesh. It has been found to be particularly useful for grid
connection fees and LPG stoves. The scale of the transaction is important. Microfinance has proved more
problematic in relation to large solar home systems, where the loan size and consequent payment period
can be greater than microfinance institutions are used to handling, or in relation to wood‐burning stoves,
where the transaction costs can be large relative to the loan amounts involved. Microfinance institutions
are often part of networks, which act as wholesale lenders to them: these networks may be able to
develop guaranteed lines of credit and related technical assistance from larger organisations. However,
microfinance institutions and associated networks are often less prevalent in rural areas, in particular in
parts of sub‐Saharan Africa.
The main obstacle to obtaining greater private sector financing, apart from uncertain investment and
regulatory environments and political risks in many developing countries, is the lack of a strong business
case for tackling the worst cases of energy deprivation, because of the inability of users to pay. This issue
needs to be squarely faced through some form of public sector support, if there is to be a breakthrough
to universal access to modern energy. In addition, local financial institutions and microfinance institutions
find it difficult to be sufficiently expert regarding new technologies and may underestimate the potential
credit‐worthiness of poor households, based on the large amount they already pay for more traditional
sources of energy.
ENERGY FOR ALL– Financing access for the poor
© OECD/IEA 2011
Page | 43
Implications for policy
Modern energy services are crucial to economic and social development; yet escalating global energy
prices are pushing this fundamental building block further out of reach of those most in need. Even with
the projected level of investment in modern energy access of $14 billion per year in the New Policies
Scenario, the absolute numbers of people without access to modern energy in 2030 will be scarcely
changed (though the proportion of the global population so deprived will have fallen). In sub‐Saharan
Africa, the numbers without modern energy access will have actually increased. Neither the policies
adopted today nor the plausible new policies allowed for in the New Policies Scenario will do nearly
enough to achieve universal access to modern energy services by 2030.
The barriers to achieving modern energy access are surmountable, as many countries have proven. What
actions does this analysis suggest that are essential to transform the situation? There are five:
1) Adopt a clear and consistent statement that modern energy access is a political priority and that
policies and funding will be reoriented accordingly. National governments need to adopt a specific,
staged energy access target, allocate funds to its achievement and define their strategy, implementing
measures and the monitoring arrangements to be adopted, with provision for regular public
reporting.
2) Mobilise additional investment in universal access, above the $14 billion per year assumed in the New
Policies Scenario, of $34 billion per year. The sum is large, but is equivalent to around 3% of global
energy infrastructure investment over the period.
3) Draw on all sources and forms of investment finance, to reflect the varying risks and returns of the
particular solutions adapted to the differing circumstances of those without access to modern energy.
To realise the considerable potential for stepping up the proportional involvement of the private
sector, national governments need to adopt strong governance and regulatory frameworks and invest
in internal capacity building. Multilateral and bilateral institutions need to use their funds, where
possible, to leverage greater private sector involvement and encourage the development of replicable
business models.
4) Concentrate an important part of multilateral and bilateral direct funding on those difficult areas of
access which do not initially offer an adequate commercial return. Provision of end‐user finance is
required to overcome the barrier of the initial capital cost of gaining access to modern energy
services. Operating through local banks and microfinance arrangements, directly or through
guarantees, can support the creation of local networks and the necessary capacity in energy sector
activity.
5) In many ways, providing energy access is an objective well suited to development frameworks such as
output‐based financing, but accurate data needs to be collected to measure progress. While the
World Energy Outlook has sought to shed light in this area, it is important that energy access
programmes and projects make provision for the collection of robust, regular and comprehensive data
to quantify the outstanding challenge and monitor progress towards its elimination.
ENERGY FOR ALL– Financing access for the poor
© OECD/IEA 2011
Page | 44
Regional and country groupings
Africa
Algeria, Angola, Benin, Botswana, Cameroon, Congo, Democratic Republic of Congo, Côte d’Ivoire, Egypt,
Eritrea, Ethiopia, Gabon, Ghana, Kenya, Libya, Morocco, Mozambique, Namibia, Nigeria, Senegal, South
Africa, Sudan, United Republic of Tanzania, Togo, Tunisia, Zambia, Zimbabwe and other African countries
(Burkina Faso, Burundi, Cape Verde, Central African Republic, Chad, Comoros, Djibouti, Equatorial Guinea,
Gambia, Guinea, Guinea‐Bissau, Lesotho, Liberia, Madagascar, Malawi, Mali, Mauritania, Mauritius, Niger,
Reunion, Rwanda, Sao Tome and Principe, Seychelles, Sierra Leone, Somalia, Swaziland and Uganda).
China
Refers to the People's Republic of China, including Hong Kong.
Developing countries
Non‐OECD Asia, Middle East, Africa and Latin America regional groupings.
Eastern Europe/Eurasia
Albania, Armenia, Azerbaijan, Belarus, Bosnia and Herzegovina, Bulgaria, Croatia, Estonia, Georgia,
Kazakhstan, Kyrgyz Republic, Latvia, Lithuania, the former Yugoslav Republic of Macedonia, the Republic
of Moldova, Romania, Russian Federation, Serbia44, Slovenia, Tajikistan, Turkmenistan, Ukraine and
Uzbekistan. For statistical reasons, this region also includes Cyprus, Gibraltar and Malta.
Latin America
Argentina, Bolivia, Brazil, Chile, Colombia, Costa Rica, Cuba, the Dominican Republic, Ecuador, El Salvador,
Guatemala, Haiti, Honduras, Jamaica, Netherlands Antilles, Nicaragua, Panama, Paraguay, Peru, Trinidad
and Tobago, Uruguay, Venezuela and other Latin American countries (Antigua and Barbuda, Aruba,
Bahamas, Barbados, Belize, Bermuda, British Virgin Islands, Cayman Islands,. Dominica, Falkland Islands,
French Guyana, Grenada, Guadeloupe, Guyana, Martinique, Montserrat, St. Kitts and Nevis, Saint Lucia,
Saint Pierre et Miquelon, St. Vincent and the Grenadines, Suriname and Turks and Caicos Islands).
Middle East
Bahrain, the Islamic Republic of Iran, Iraq, Israel, Jordan, Kuwait, Lebanon, Oman, Qatar, Saudi Arabia,
Syrian Arab Republic, United Arab Emirates and Yemen. It includes the neutral zone between Saudi Arabia
and Iraq.
Developing Asia
Bangladesh, Brunei Darussalam, Cambodia, China, Chinese Taipei, India, Indonesia, the Democratic
People’s Republic of Korea, Malaysia, Mongolia, Myanmar, Nepal, Pakistan, the Philippines, Singapore, Sri
Lanka, Thailand, Vietnam and other non‐OECD Asian countries (Afghanistan, Bhutan, Cook Islands, East
Timor, Fiji, French Polynesia, Kiribati, Laos, Macau, Maldives, New Caledonia, Papua New Guinea, Samoa,
Solomon Islands, Tonga and Vanuatu).
44 Serbia includes Montenegro until 2004 and Kosovo until 1999.
ENERGY FOR ALL– Financing access for the poor
© OECD/IEA 2011
Page | 45
North Africa
Algeria, Egypt, Libyan Arab Jamahiriya, Morocco and Tunisia.
OECD
Includes OECD Europe, OECD Americas and OECD Pacific regional groupings.
OECD Europe
Austria, Belgium, the Czech Republic, Denmark, Finland, France, Germany, Greece, Hungary, Iceland,
Israel, Ireland, Italy, Luxembourg, the Netherlands, Norway, Poland, Portugal, the Slovak Republic,
Slovenia, Spain, Sweden, Switzerland, Turkey and United Kingdom.
OECD Americas
Canada, Chile, Mexico and United States.
OECD Pacific
Australia, Japan, Korea and New Zealand.
Sub‐Saharan Africa
Africa regional grouping excluding the North African regional grouping.
ENERGY FOR ALL– Financing access for the poor
© OECD/IEA 2011
Page | 46
References
ADB (Asia Development Bank) (2009), Energy for All: Vietnam: Boosting Biogas, ADB, Manila.
AFD (Agence Française de Développement) (2011), “The Paris‐Nairobi Climate Initiative: Access to Clean
Energy for All in Africa and Countries Vulnerable to Climate Change”, background document to Clean
Energy for All Conference, Paris, 21 April 2011.
AGECC (Secretary‐General’s Advisory Group on Energy and Climate Change) (2010), Energy for a
Sustainable Future Summary Report and Recommendations, United Nations, New York.
ARE (Alliance for Rural Electrification) (2011a), Hybrid Mini‐Grid for Rural Electrification: Lessons Learned,
ARE, Brussels.
ARE (2011b) Rural Electrification with Renewable Technologies, Quality Standards and Business Models,
ARE, Brussels.
Ashden Awards (2006), Case Study: Biogas Sector Partnership, Ashden Awards, London.
Ashden Awards (2008), Grameen Shakti, Bangladesh: Rapidly Growing Solar Installer Provides Clean
Cooking as Well, Ashden Awards, London.
Ashden Awards (2010), Case Study Summary: Ministry of Agriculture and Rural Development (MARD),
Vietnam and Netherlands Development Organisation (SNV), Ashden Awards, London.
Budya, H. and M. Yasir Arofat (2011), “Providing Cleaner Energy Access in Indonesia through the Mega‐
project of Kerosene Conversion to LPG”, Energy Policy (2011), Elsevier, Amsterdam, pp. 1‐12.
Government of India (2011), Key Indicators of Household Consumer Expenditure in India, 2009‐10,
Ministry of Statistics and Programme Implementation, Government of India, New Delhi.
Government of India (2008), Household Consumer Expenditure in India, 2006‐07, Ministry of Statistics and
Programme Implementation, Government of India, New Delhi.
GPOBA (Global Partnership on Output‐Based Aid) (2007), “Output‐Based Aid in Senegal – Designing
Technology‐Neutral Concessions for Rural Electrification”, OBApproaches Note No. 14, GPOBA,
Washington D.C.
GPOBA (2009), “Output‐Based Aid in Ethiopia: Dealing with the ‘Last Mile’ Paradox in Rural
Electrification”, OBApproaches Note No. 27, GPOBA, Washington D.C.
IEA (International Energy Agency) (2006), World Energy Outlook 2006, OECD/IEA, Paris.
IEA (2010), World Energy Outlook 2010, OECD/IEA, Paris.
IEA (2011), Energy Systems in Emerging Economies and Developing Countries, OECD/IEA, Paris.
IFC (International Finance Corporation) (forthcoming), Energy Access Business Models: Leveraging the
Private Sector to Serve the Poor, IFC, Washington D.C.
IFC and World Bank (2010), “Solar Lighting for the Base of the Pyramid – Overview of an Emerging
Market”, Lighting Africa Report, IFC and World Bank, Washington D.C.
IJHD (International Journal of Hydropower and Dams) (2010), International Journal of Hydropower and
Dams World Atlas and Industry Guide, Aqua Media International Ltd, Wallington, United Kingdom.
ENERGY FOR ALL– Financing access for the poor
© OECD/IEA 2011
Page | 47
IPCC (International Panel on Climate Change) (2011), “Hydropower”, Special Report on Renewable Energy
Sources and Climate Change Mitigation, IPCC, Geneva.
Lamech, R. and K. Saeed (2003), “What International Investors Look for When Investing in Developing
Countries: Results from a Survey of International Investors in the Power Sector”, Energy and Mining
Sector Board Discussion Paper, No. 6, World Bank, Washington D.C.
Liu, H., and X. Hu (2010), “The Development and Practice of Small Hydropower Clean Development
Mechanism Project in China”, China Water Power and Electrification, Vol.69, No.9, pp. 8‐14.
Marrey, C. and R. Bellanca (2010), GTZ‐HERA Cooking Energy Compendium, GTZ‐HERA, Eschborn,
Germany.
Mathers, C. and D. Loncar (2006), “Projections of Global Mortality and Burden of Disease from
2002 to 2030”, PLoS Medicine, Vol. 3, No. 11, 28 November, Public Library of Science, Cambridge,
United Kingdom.
Morris, E., J. Winiecki, S. Chowdhard and D. Cortiglia (2007), Using Microfinance to Expand Access to
Energy Services: Summary of Findings, Small Enterprise Education and Promotion Network
(SEEP) Network, Washington D.C.
Phuangpornpitak, N., S. Kumar (2007), “PV Hybrid Systems for Rural Electrification in Thailand”,
Renewable and Sustainable Energy Reviews, Vol. 11, Asian Institute of Technology, Klong Luang,
Thailand, pp. 1 530‐1 543.
Sanchez, T. (2010), The Hidden Energy Crisis: How Policies Are Failing the World's Poor, Practical Action
Publishing, London.
SNV Netherlands Development Organisation (2011), “Domestic Biogas Newsletter, Issue 5, September,
SNV, The Hague, Netherlands.
Smith, K., S. Mehta and M. Feuz (2004), “Indoor Air Pollution from Household Use of Solid Fuels” in M.
Ezzati et al., (eds.), Comparative Quantification of Health Risks: Global and Regional Burden of Disease
Attributable to Selected Major Risk Factors, World Health Organization, Geneva.
UNEP (United Nations Environment Programme) (2007), Financing Mechanisms and Public/Private Risk
Sharing Instruments for Financing Small‐Scale Renewable Energy Equipment and Projects, UNEP, Paris.
UNDP (United Nations Development Programme) (2009), Bringing Small‐Scale Finance to the Poor for
Modern Energy Services: What is the Role of Government?, UNDP, New York.
UNDP and World Health Organization (2009), The Energy Access Situation in Developing Countries – A
Review on the Least Developed Countries and Sub‐Saharan Africa, UNDP, New York.
UNDP, AEPC (Alternative Energy Promotion Centre) and Practical Action (2010), Capacity Development for
Scaling Up Decentralised Energy Access Programmes: Lessons from Nepal on its Role, Costs, and
Financing, Practical Action Publishing, Rugby, United Kingdom.
WHO (World Health Organization) (2004), “Indoor Smoke from Solid Fuel Use: Assessing the
Environmental Burden of Disease”, Environmental Burden of Disease Series, No. 4, WHO, Geneva.
WHO (2008), The Global Burden of Disease: 2004 Update, WHO, Geneva.
World Bank (2008), Designing Sustainable Off‐Grid Rural Electrification Projects: Principles and Practices,
World Bank, Washington D.C.
ENERGY FOR ALL– Financing access for the poor
© OECD/IEA 2011
Page | 48
World Bank (2009a), Africa Electrification Initiative Workshop, proceedings of conference held 9‐
12 June 2009, Maputo, Mozambique, World Bank, Washington, D.C.
World Bank (2009b) “Africa’s Infrastructure, a Time for Transformation”, World Bank Africa Infrastructure
Country Diagnostic, World Bank, Washington D.C.
World Bank (2011), State and Trends of the Carbon Market 2011, World Bank, Washington D.C.
Yadoo, A. and H. Cruickshank (2010), “The Value of Co‐operatives in Rural Electrification”, Energy Policy,
Vol. 38, Issue 6, Elsevier, Amsterdam, pp. 2 941‐2 947.
What impact will the return of high energy prices have on the fragile economic recovery? Will geopolitical unrest, price volatility and policy inaction defer investment in the oil sector and amplify risks to our energy security? What will renewed uncertainty surrounding the role of nuclear power mean for future energy and environmental trends? Is the gap between our climate actions and our climate goals becoming insurmountable? World Energy Outlook 2011 tackles these and other pressing questions.
The latest data, policy developments, and the experience of another turbulent year are brought together to provide robust analysis and insight into global energy markets. WEO-2011 once again gives detailed energy demand and supply projections out to 2035, broken down by region, fuel, sector and scenario. This year it also gives a special focus to topical energy sector issues:
� Russian energy prospects and their implications for global markets. � The role of coal in driving economic growth in an emissions-constrained world. � The implications of a possible downturn in oil and gas sector investment in the
Middle East and North Africa. � Climate change – “lock-in” and the “room to manoeuvre” to meet the 2oC goal. � Reforms to fossil fuel subsidies and support for renewable energy. � A “Lower-Nuclear Case” to investigate what a rapid slowdown in the use of
nuclear power would mean for the global energy landscape. � �Investment�and�financing�options�to�achieve�modern energy access for all.
With extensive data, projections and analysis, WEO-2011 provides invaluable insights into how the energy system could evolve over the next quarter of a century. The book is essential reading for anyone with a stake in the energy sector.
For more information, please visit our website: www.worldenergyoutlook.org
Order from our website: www.iea.org/booksor e-mail: [email protected]
2011
WORLDENERGY
OUTLOOK
RE
LE
AS
E9
No
vem
be
r 2
01
1
9 rue de la Fédération 75739 Paris Cedex 15
www.iea.orgwww.worldenergyoutlook.org