Embed Size (px)
DESCRIPTION
Energy Saving in Steam Systems.
Citation preview
Energy saving in steam systems. Dr.G.G.Rajan / Cochin / India
Substantial quantity of savings in steam is possible by adopting the following
thumb rules. Most important operating parameters to minimize steam consumption
include using dry saturated steam having saturation temperature equal or very nearly
equal to the required process temperature in steam consuming devices such as
Steam heaters
Steam heated reboilers
Steam tracers etc.
On the contrary, superheated steam must be used in
Back pressure turbines
Extraction turbines and
Total condensing turbines.
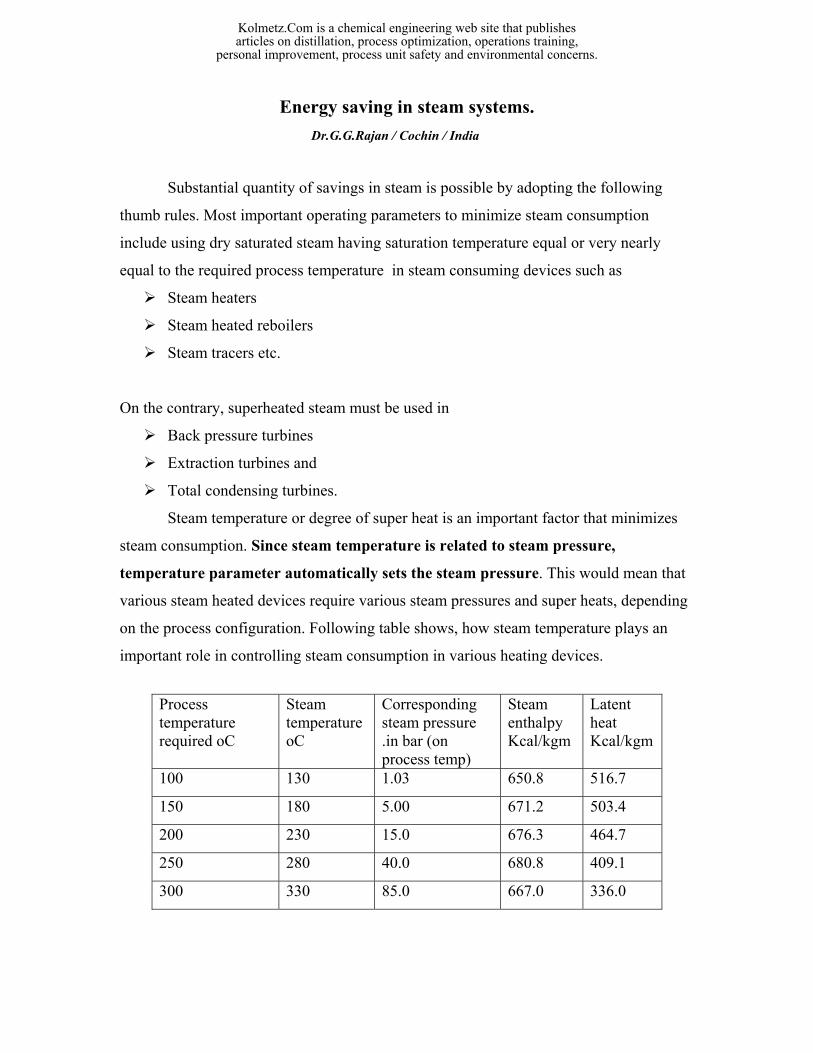
Steam temperature or degree of super heat is an important factor that minimizes
steam consumption. Since steam temperature is related to steam pressure,
temperature parameter automatically sets the steam pressure. This would mean that
various steam heated devices require various steam pressures and super heats, depending
on the process configuration. Following table shows, how steam temperature plays an
important role in controlling steam consumption in various heating devices.
Process temperature required oC
Steam temperature oC
Corresponding steam pressure .in bar (on process temp)
Steam enthalpy Kcal/kgm
Latent heat Kcal/kgm
100 130 1.03 650.8 516.7
150 180 5.00 671.2 503.4
200 230 15.0 676.3 464.7
250 280 40.0 680.8 409.1
300 330 85.0 667.0 336.0
Kolmetz.Com is a chemical engineering web site that publishesarticles on distillation, process optimization, operations training,
personal improvement, process unit safety and environmental concerns.
Steam temperature is selected 30 oC higher than the required process temperature.
The best steam for industrial process heating is dry saturated steam, which is
neither wet not highly super heated. Wet steam reduces heat transfer while super heated
steam is not desirable for process heating because of the problems in temperature
control of the process fluids and the low heat transfer coefficient. Condensation heat
transfer is best suited for process heating applications. Available enthalpy in wet steam is
reduced depending on the moisture content present in the steam. For example, latent
heat available in a 95% dry steam, with 5% moisture shall have a latent heat of 478.2
kcal/kgm against the value of 503.4.
It is only the latent heat of steam that takes part in the process heating. Hence
it is essential that the latent heat of steam used for process heating is as high as possible.
From the above table it is obvious that lower the steam pressure, the higher is the latent
heat of steam. It may also be noted from the above table that as the steam pressure comes
down, the saturation temperature also comes down. The steam pressure for process
heating must therefore, be selected based on the required process temperature. The
saturation temperature may be selected a few degrees higher ( 10 to 20 oC) and the steam
pressure fixed accordingly.
For example, when the process temperature to be maintained is between 100 to
200 oC, it is economical to select steam pressure whose saturation temperature just
matches the process temperature plus 5 to 10 oC. Using dry saturated steam for process
heating is efficient due to it’s film heat transfer coefficient which is comparatively
higher than highly super heated steam.
Kolmetz.Com is a chemical engineering web site that publishesarticles on distillation, process optimization, operations training,
personal improvement, process unit safety and environmental concerns.
Example : Furnace oil is used as a fuel in a fired heater. The furnace oil is stored in a
tank and maintained at 70 oC. The oil is heated in a steam heated exchanger to 110 oC
using a steam heater. The flow rate of furnace oil is 10 tons /hr. the specific heat of FO is
0.68. Determine the optimum steam pressure for this system and calculate the steam
rate?
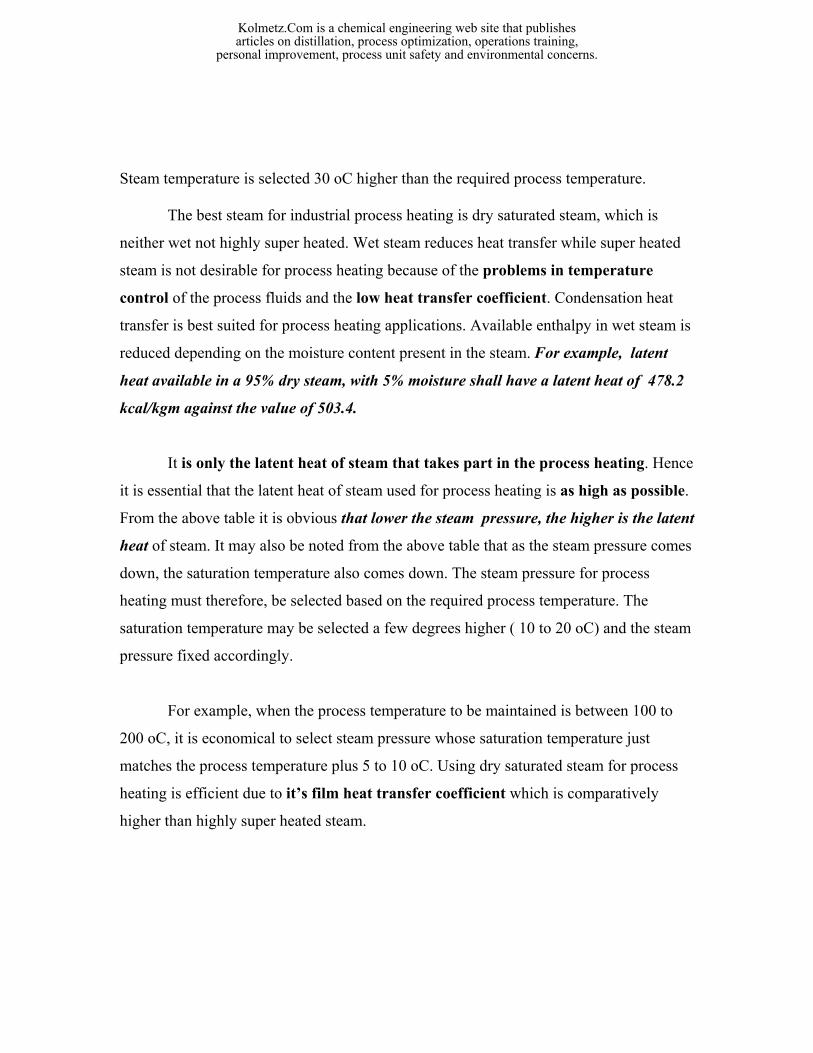
Following figure shows the arrangement for heating the furnace oil. There are two
reasons for heating the furnace oil, before it goes to the burner. The primary reason is to
reduce the viscosity of the furnace oil at burner tip, so that it is atomized easily and the
secondary reason is to increase the burner efficiency and accelerate ease of combustion.
Heat required to increase FO temperature from 70 to 110 oC is given by
= Mass x Sp.heat x ∆t
= 10 x 1000 x 0.68 x ( 110-70) kcal/hr
= 272000 kcal/hr.
Steam in
Condensate
FO Tank
FO pump
Hot FO @ 110 oC to heater
70 oC
FO return
Furnace Oil Heating using dry saturated steam
Kolmetz.Com is a chemical engineering web site that publishesarticles on distillation, process optimization, operations training,
personal improvement, process unit safety and environmental concerns.
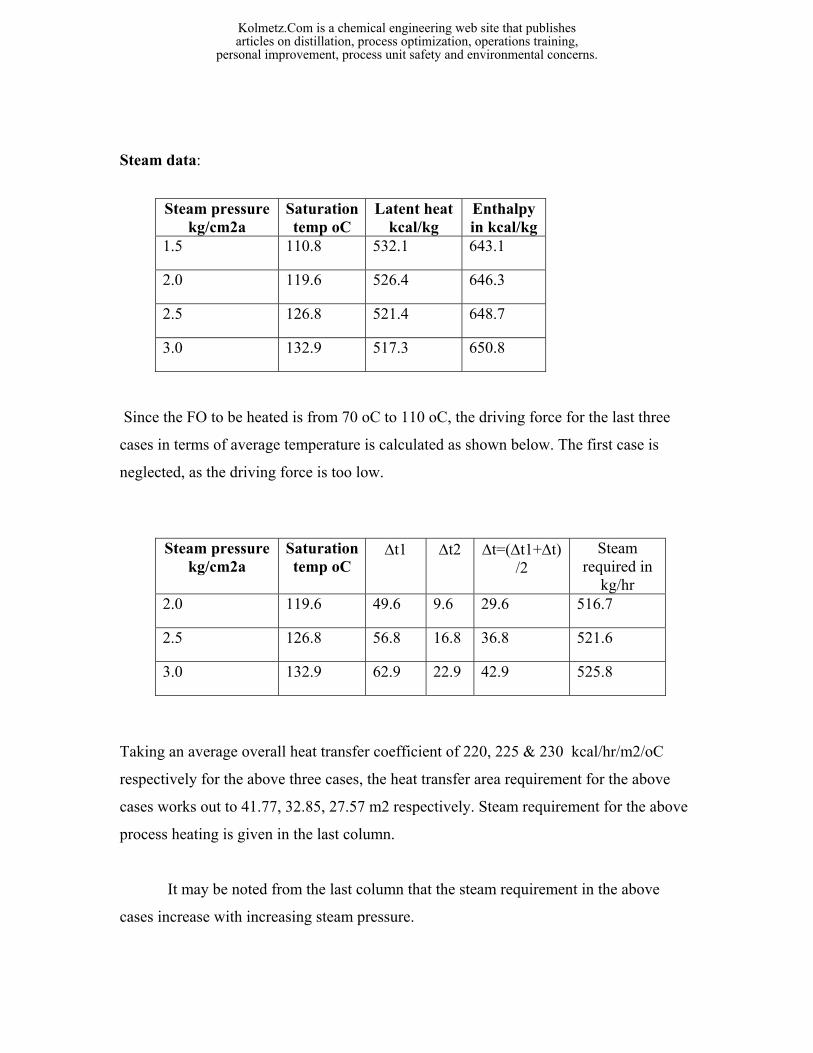
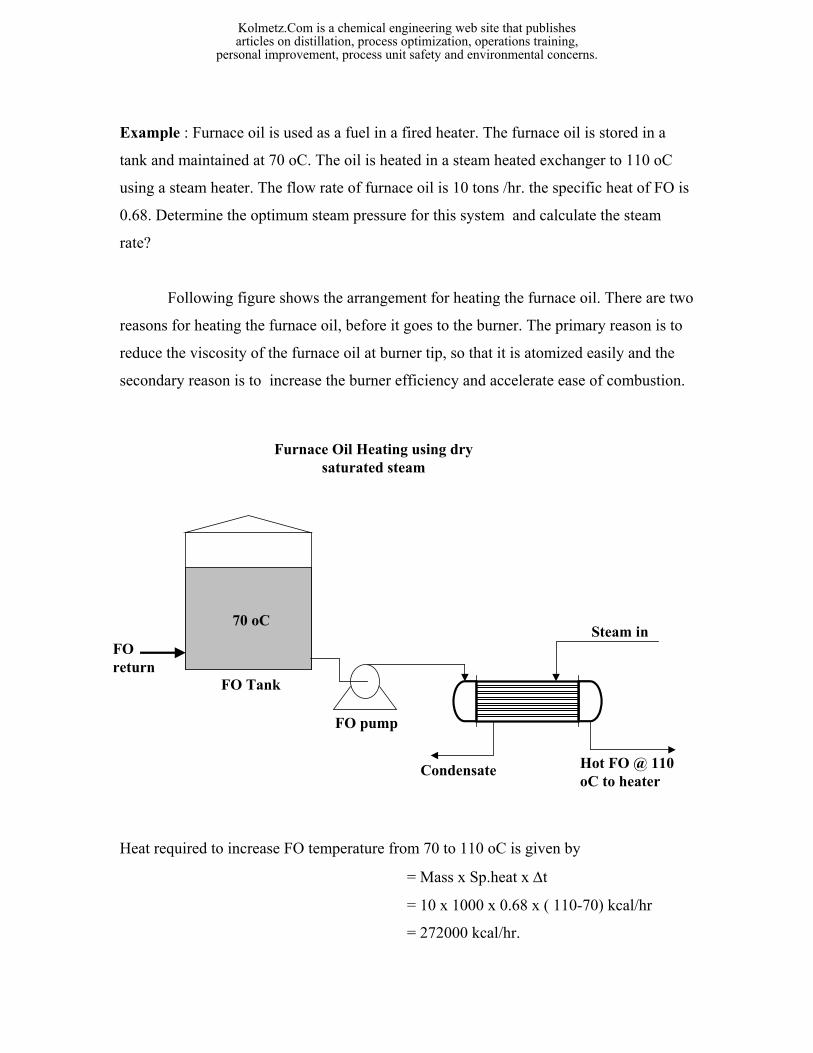
Steam data:
Since the FO to be heated is from 70 oC to 110 oC, the driving force for the last three
cases in terms of average temperature is calculated as shown below. The first case is
neglected, as the driving force is too low.
Taking an average overall heat transfer coefficient of 220, 225 & 230 kcal/hr/m2/oC
respectively for the above three cases, the heat transfer area requirement for the above
cases works out to 41.77, 32.85, 27.57 m2 respectively. Steam requirement for the above
process heating is given in the last column.
It may be noted from the last column that the steam requirement in the above
cases increase with increasing steam pressure.
Steam pressure kg/cm2a
Saturation temp oC
Latent heat kcal/kg
Enthalpy in kcal/kg
1.5 110.8 532.1 643.1
2.0 119.6 526.4 646.3
2.5 126.8 521.4 648.7
3.0 132.9 517.3 650.8
Steam pressure kg/cm2a
Saturation temp oC
∆t1 ∆t2 ∆t=(∆t1+∆t)/2
Steam required in
kg/hr 2.0 119.6 49.6 9.6 29.6 516.7
2.5 126.8 56.8 16.8 36.8 521.6
3.0 132.9 62.9 22.9 42.9 525.8
Kolmetz.Com is a chemical engineering web site that publishesarticles on distillation, process optimization, operations training,
personal improvement, process unit safety and environmental concerns.
Based on 8000 operating hours per year, the steam consumption works out to
4133.6, 4172.8 & 4206.4 tons respectively. While the above example refers to a single
steam heater, there will be substantial savings in steam in major process industries
comprising a number of such steam devices.
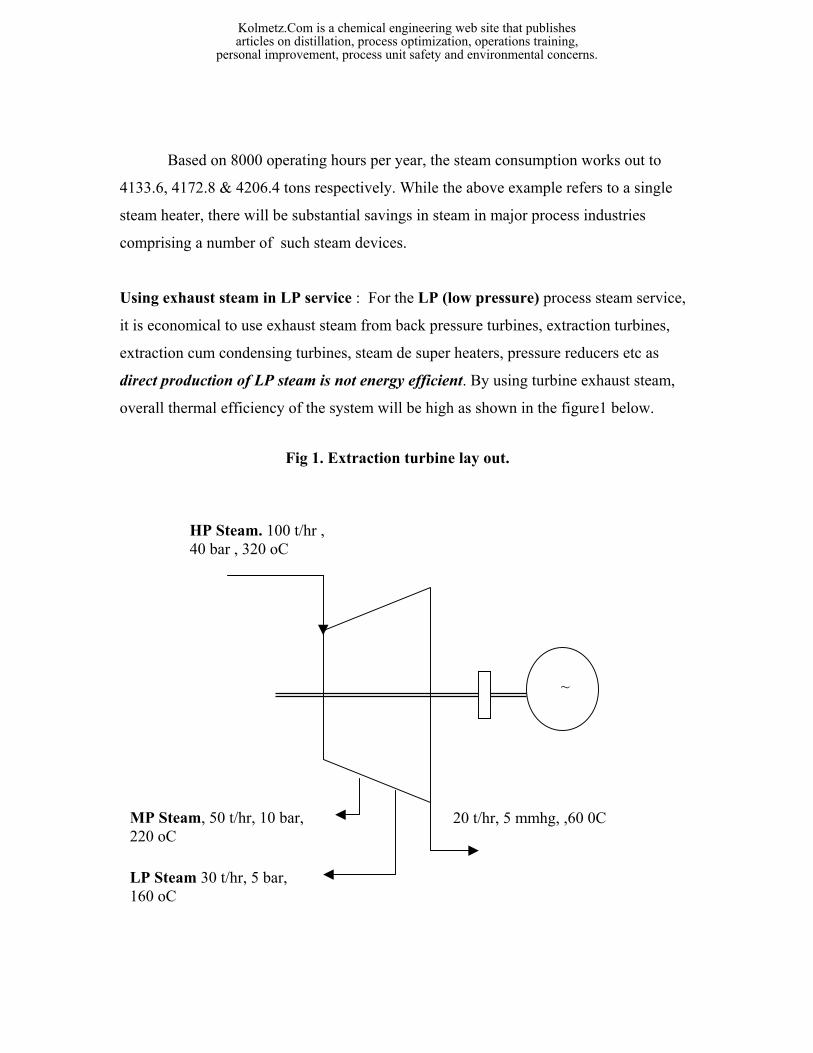
Using exhaust steam in LP service : For the LP (low pressure) process steam service,
it is economical to use exhaust steam from back pressure turbines, extraction turbines,
extraction cum condensing turbines, steam de super heaters, pressure reducers etc as
direct production of LP steam is not energy efficient. By using turbine exhaust steam,
overall thermal efficiency of the system will be high as shown in the figure1 below.
HP Steam. 100 t/hr , 40 bar , 320 oC
MP Steam, 50 t/hr, 10 bar, 220 oC
20 t/hr, 5 mmhg, ,60 0C
LP Steam 30 t/hr, 5 bar, 160 oC
~
Fig 1. Extraction turbine lay out.
Kolmetz.Com is a chemical engineering web site that publishesarticles on distillation, process optimization, operations training,
personal improvement, process unit safety and environmental concerns.
Theoretical Carnot cycle efficiency of the turbine in Stage I, II & III are 16.86,
12.17 and 23.09 respectively. This is calculated by the relationship
ηcarnot = (T1 – T2) x100 /T1
where T1 & T2 are steam inlet and outlet temperatures absolute (oK) at each stage.
Theoretical power generation for the above parameters may be calculated by
enthalpy values at inlet and outlet conditions at each stage.
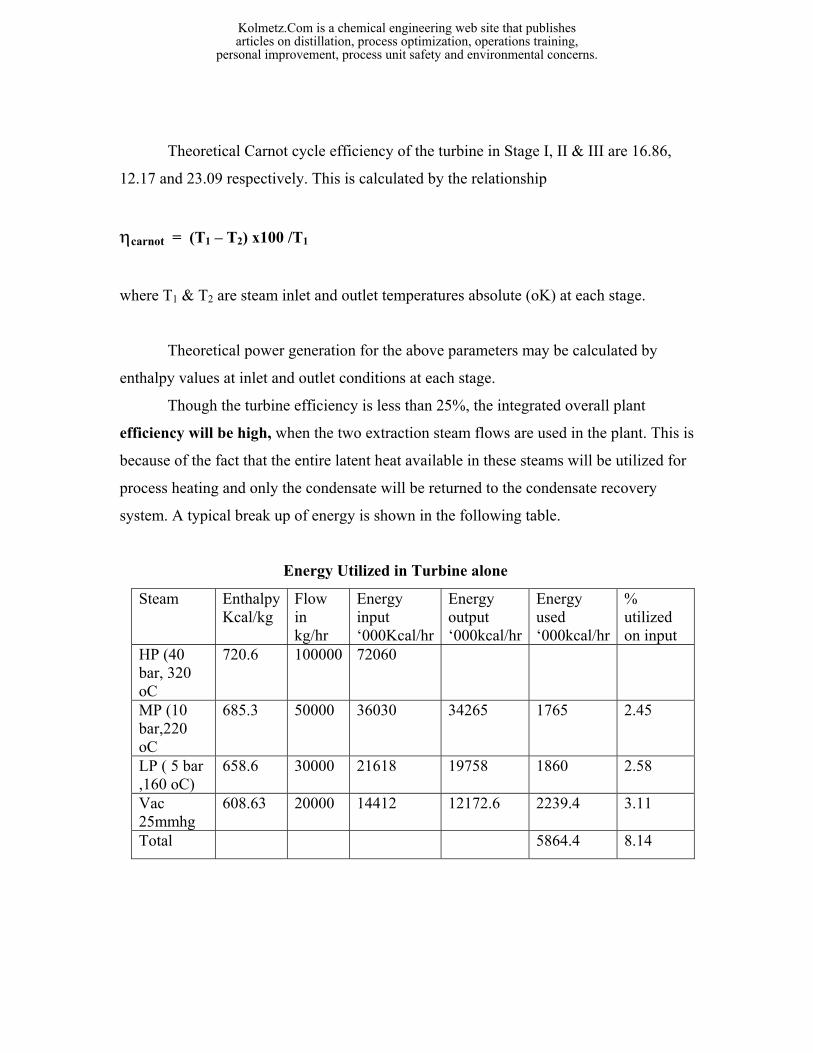
Though the turbine efficiency is less than 25%, the integrated overall plant
efficiency will be high, when the two extraction steam flows are used in the plant. This is
because of the fact that the entire latent heat available in these steams will be utilized for
process heating and only the condensate will be returned to the condensate recovery
system. A typical break up of energy is shown in the following table.
Energy Utilized in Turbine alone
Steam Enthalpy Kcal/kg
Flow in kg/hr
Energy input ‘000Kcal/hr
Energy output ‘000kcal/hr
Energy used ‘000kcal/hr
% utilized on input
HP (40 bar, 320 oC
720.6 100000 72060
MP (10 bar,220 oC
685.3 50000 36030 34265 1765 2.45
LP ( 5 bar ,160 oC)
658.6 30000 21618 19758 1860 2.58
Vac 25mmhg
608.63 20000 14412 12172.6 2239.4 3.11
Total 5864.4 8.14
Kolmetz.Com is a chemical engineering web site that publishesarticles on distillation, process optimization, operations training,
personal improvement, process unit safety and environmental concerns.
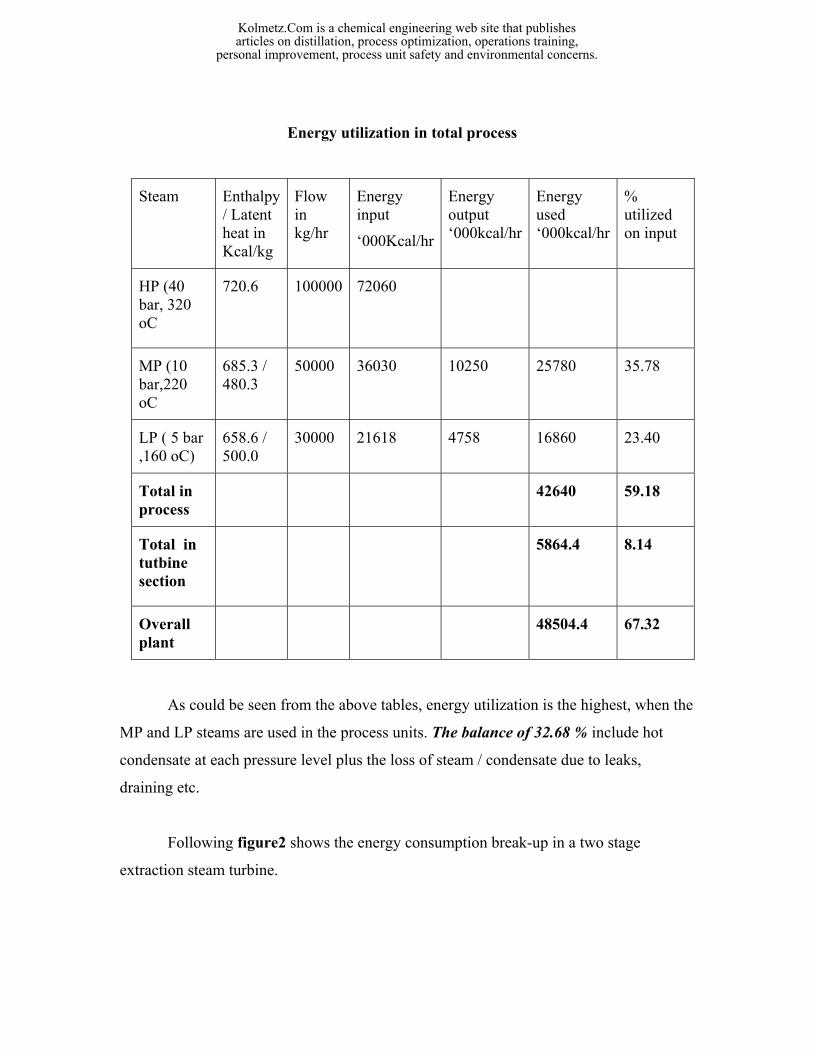
Energy utilization in total process
Steam Enthalpy / Latent heat in Kcal/kg
Flow in kg/hr
Energy input
‘000Kcal/hr
Energy output ‘000kcal/hr
Energy used ‘000kcal/hr
% utilized on input
HP (40 bar, 320 oC
720.6
100000 72060
MP (10 bar,220 oC
685.3 / 480.3
50000 36030 10250 25780 35.78
LP ( 5 bar ,160 oC)
658.6 / 500.0
30000 21618 4758 16860 23.40
Total in process
42640 59.18
Total in tutbine section
5864.4 8.14
Overall plant
48504.4 67.32
As could be seen from the above tables, energy utilization is the highest, when the
MP and LP steams are used in the process units. The balance of 32.68 % include hot
condensate at each pressure level plus the loss of steam / condensate due to leaks,
draining etc.
Following figure2 shows the energy consumption break-up in a two stage
extraction steam turbine.
Kolmetz.Com is a chemical engineering web site that publishesarticles on distillation, process optimization, operations training,
personal improvement, process unit safety and environmental concerns.
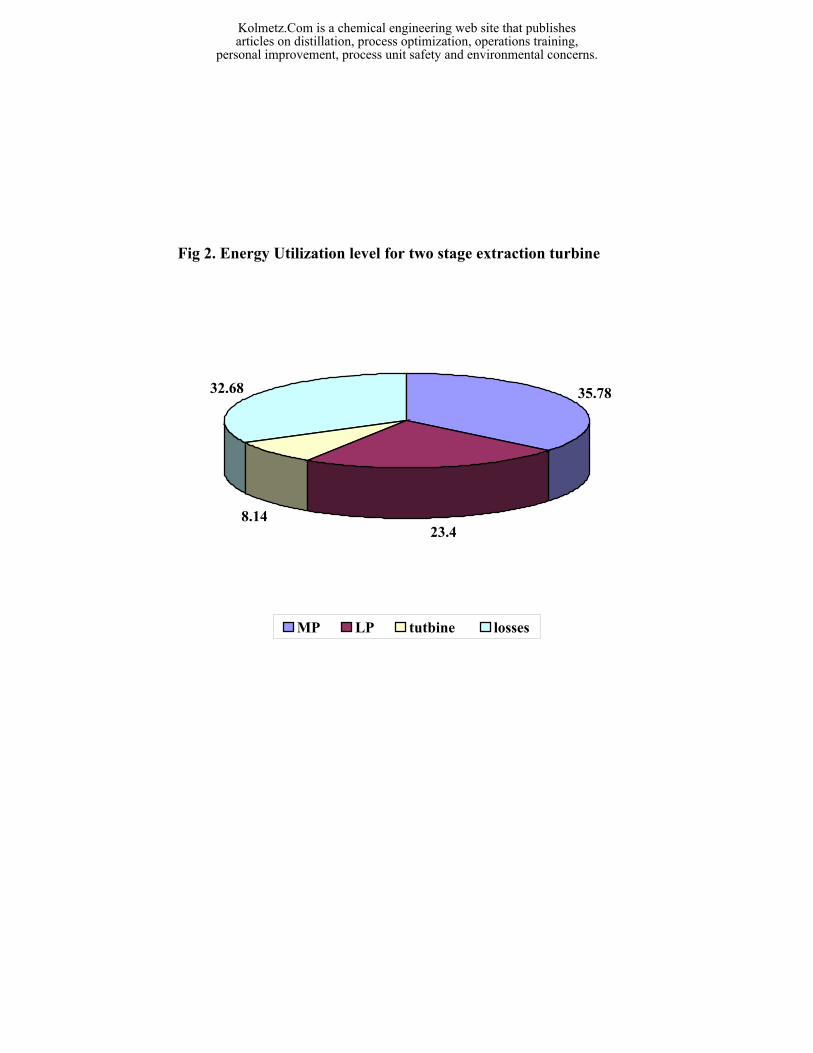
Energy Utilization Level for two stage extraction turbine
35.78
23.48.14
32.68
MP LP tutbine losses
Fig 2. Energy Utilization level for two stage extraction turbine
Kolmetz.Com is a chemical engineering web site that publishesarticles on distillation, process optimization, operations training,
personal improvement, process unit safety and environmental concerns.
Economizing Steam consumption in typical back pressure / condensing steam turbines.
Steam turbines may be operated in different ways to meet the power demand. For
example, the turbine may be operated in total condensing mode or back pressure mode
depending on the steam and power demand of the process. Steam turbines used in the
process are major energy consumers. Optimizing process operating conditions can
considerably improve turbine efficiency , which in turn will significantly reduce energy
requirement. Various operating parameters affect condensing and back pressure turbine
steam consumption and efficiency.
Turbine efficiency – Significance.
The industrial sector is the largest energy consumer, accounting for about 30 % of
total energy used. With the present trend of energy prices and scarcity of hydrocarbon
resources, lowering energy requirement is a top priority. Energy conservation benefits
depend on applying certain minor or major modifications and using the modern
operational features. Energy conservation does not mean curtailing energy use alone at
the cost of industrial and economic growth. In major / mega process industries, steam
turbines are the main energy consumers. Savings achieved here will be significant, with a
better return on investment than for most other equipment.
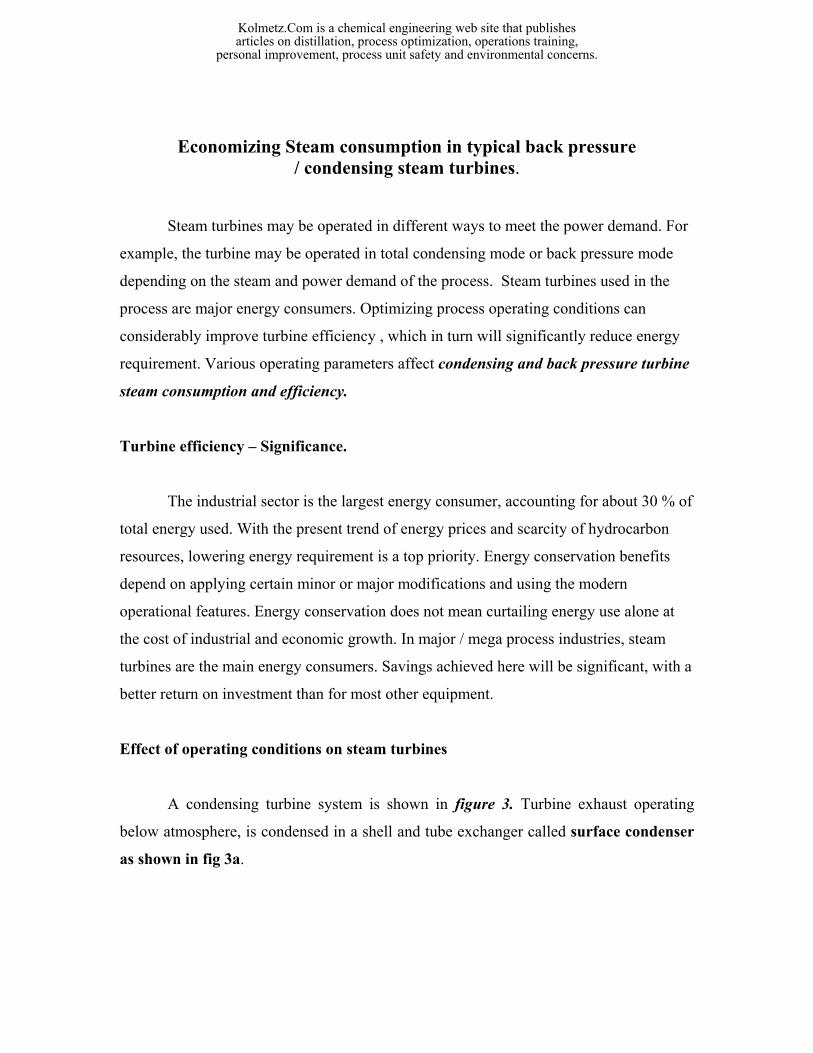
Effect of operating conditions on steam turbines
A condensing turbine system is shown in figure 3. Turbine exhaust operating
below atmosphere, is condensed in a shell and tube exchanger called surface condenser
as shown in fig 3a.
Kolmetz.Com is a chemical engineering web site that publishesarticles on distillation, process optimization, operations training,
personal improvement, process unit safety and environmental concerns.
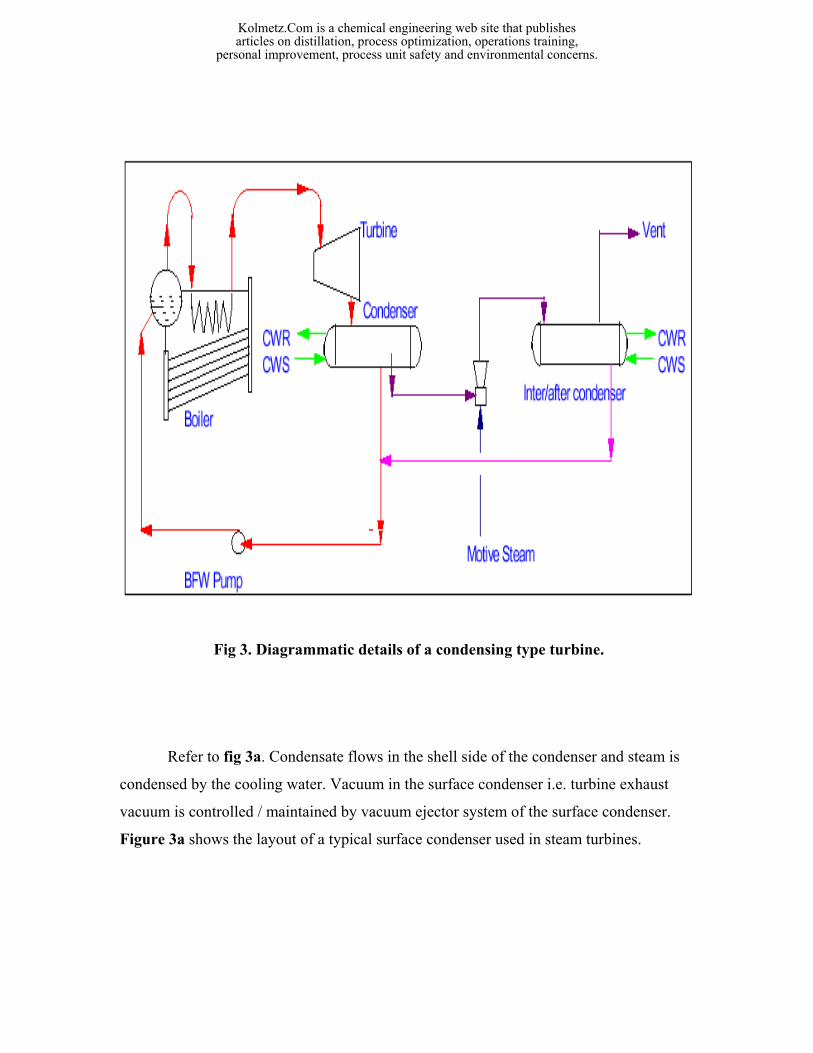
Refer to fig 3a. Condensate flows in the shell side of the condenser and steam is
condensed by the cooling water. Vacuum in the surface condenser i.e. turbine exhaust
vacuum is controlled / maintained by vacuum ejector system of the surface condenser.
Figure 3a shows the layout of a typical surface condenser used in steam turbines.
Fig 3. Diagrammatic details of a condensing type turbine.
Kolmetz.Com is a chemical engineering web site that publishesarticles on distillation, process optimization, operations training,
personal improvement, process unit safety and environmental concerns.
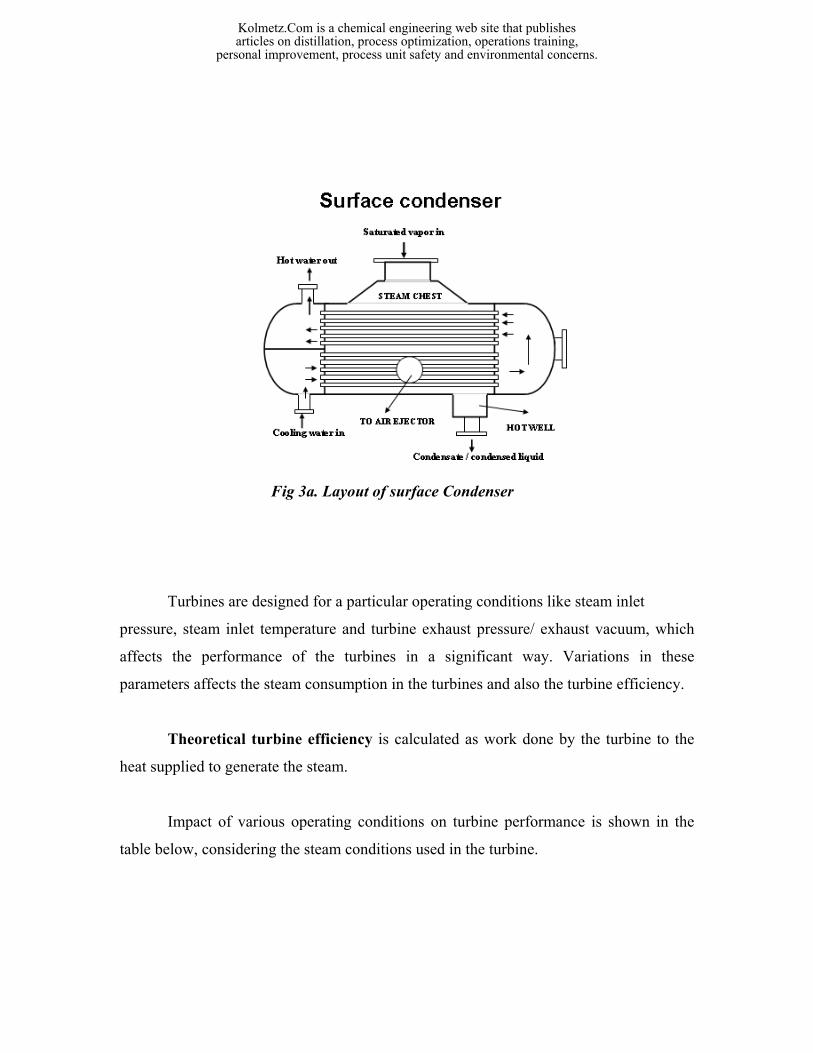
Fig 3a. Layout of surface Condenser
Turbines are designed for a particular operating conditions like steam inlet
pressure, steam inlet temperature and turbine exhaust pressure/ exhaust vacuum, which
affects the performance of the turbines in a significant way. Variations in these
parameters affects the steam consumption in the turbines and also the turbine efficiency.
Theoretical turbine efficiency is calculated as work done by the turbine to the
heat supplied to generate the steam.
Impact of various operating conditions on turbine performance is shown in the
table below, considering the steam conditions used in the turbine.
Kolmetz.Com is a chemical engineering web site that publishesarticles on distillation, process optimization, operations training,
personal improvement, process unit safety and environmental concerns.
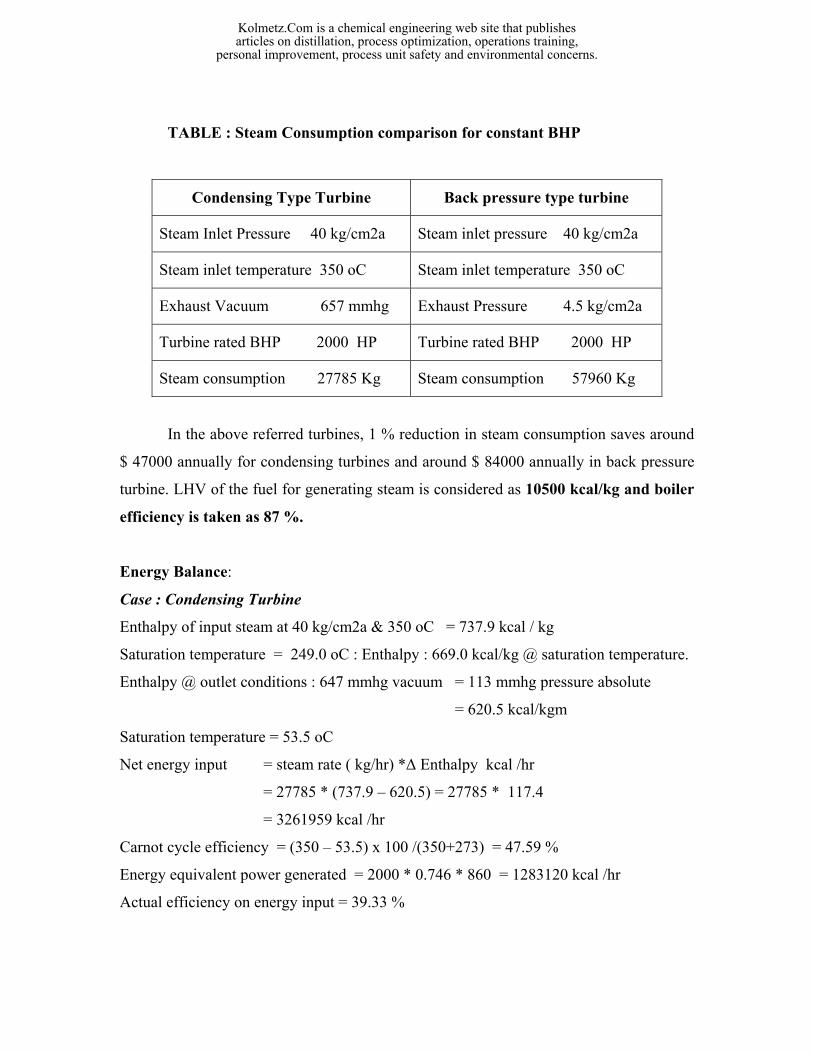
TABLE : Steam Consumption comparison for constant BHP
In the above referred turbines, 1 % reduction in steam consumption saves around
$ 47000 annually for condensing turbines and around $ 84000 annually in back pressure
turbine. LHV of the fuel for generating steam is considered as 10500 kcal/kg and boiler
efficiency is taken as 87 %.
Energy Balance:
Case : Condensing Turbine
Enthalpy of input steam at 40 kg/cm2a & 350 oC = 737.9 kcal / kg
Saturation temperature = 249.0 oC : Enthalpy : 669.0 kcal/kg @ saturation temperature.
Enthalpy @ outlet conditions : 647 mmhg vacuum = 113 mmhg pressure absolute
= 620.5 kcal/kgm
Saturation temperature = 53.5 oC
Net energy input = steam rate ( kg/hr) *∆ Enthalpy kcal /hr
= 27785 * (737.9 – 620.5) = 27785 * 117.4
= 3261959 kcal /hr
Carnot cycle efficiency = (350 – 53.5) x 100 /(350+273) = 47.59 %
Energy equivalent power generated = 2000 * 0.746 * 860 = 1283120 kcal /hr
Actual efficiency on energy input = 39.33 %
Condensing Type Turbine Back pressure type turbine
Steam Inlet Pressure 40 kg/cm2a Steam inlet pressure 40 kg/cm2a
Steam inlet temperature 350 oC Steam inlet temperature 350 oC
Exhaust Vacuum 657 mmhg Exhaust Pressure 4.5 kg/cm2a
Turbine rated BHP 2000 HP Turbine rated BHP 2000 HP
Steam consumption 27785 Kg Steam consumption 57960 Kg
Kolmetz.Com is a chemical engineering web site that publishesarticles on distillation, process optimization, operations training,
personal improvement, process unit safety and environmental concerns.
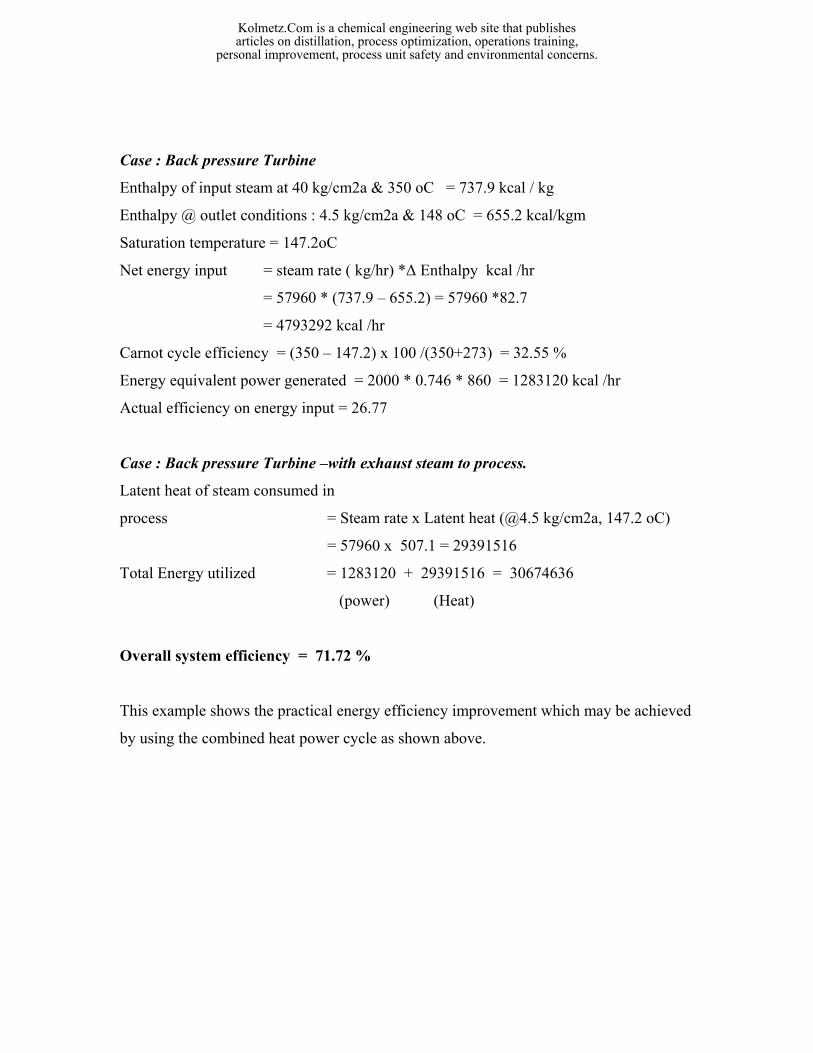
Case : Back pressure Turbine
Enthalpy of input steam at 40 kg/cm2a & 350 oC = 737.9 kcal / kg
Enthalpy @ outlet conditions : 4.5 kg/cm2a & 148 oC = 655.2 kcal/kgm
Saturation temperature = 147.2oC
Net energy input = steam rate ( kg/hr) *∆ Enthalpy kcal /hr
= 57960 * (737.9 – 655.2) = 57960 *82.7
= 4793292 kcal /hr
Carnot cycle efficiency = (350 – 147.2) x 100 /(350+273) = 32.55 %
Energy equivalent power generated = 2000 * 0.746 * 860 = 1283120 kcal /hr
Actual efficiency on energy input = 26.77
Case : Back pressure Turbine –with exhaust steam to process.
Latent heat of steam consumed in
process = Steam rate x Latent heat (@4.5 kg/cm2a, 147.2 oC)
= 57960 x 507.1 = 29391516
Total Energy utilized = 1283120 + 29391516 = 30674636
(power) (Heat)
Overall system efficiency = 71.72 %
This example shows the practical energy efficiency improvement which may be achieved
by using the combined heat power cycle as shown above.
Kolmetz.Com is a chemical engineering web site that publishesarticles on distillation, process optimization, operations training,
personal improvement, process unit safety and environmental concerns.
Steam system efficiency.
In conventional process plants, steam boilers are used to generate steam for the
process and generate power required by the process using steam turbine. The demand
scenario of power and steam (heat) is always dynamic and depends on a number of
process parameters such as through put ( capacity utilization ), feed quality, operating
severity, down stream operations etc.
A critical analysis of the process shall reveal that the overall steam system
efficiency is a function of
Boiler efficiency
Turbine efficiency
Steam transmission efficiency
Individual steam consuming device efficiency
Specific consumption of process steam in processes.
Steam losses due to leaks, blow downs, flashing venting etc.
For maintaining steam system efficiency, it is imperative to monitor all the above
factors meticulously. Boiler efficiency is a function of excess air, burner efficiency, type
of fuel used , convection and radiation losses and blow down losses.
Boiler feed water quality also plays an important role in heat transfer in the boiler
water tubes, economizer section and super heating section. Hence boiler efficiency is a
function of economizer efficiency, water evaporation efficiency in the boiler and super
heater efficiency. A simple method of determining boiler efficiency is by indirect
method in which the sum of energy losses is determined from boiler operating data as %
of energy input and subtracted from 100 to get the boiler efficiency. This method is good
enough for monitoring purposes. Figure 4 shows the various losses associated with
boiler efficiency and the table shows a typical boiler efficiency program output.
Kolmetz.Com is a chemical engineering web site that publishesarticles on distillation, process optimization, operations training,
personal improvement, process unit safety and environmental concerns.
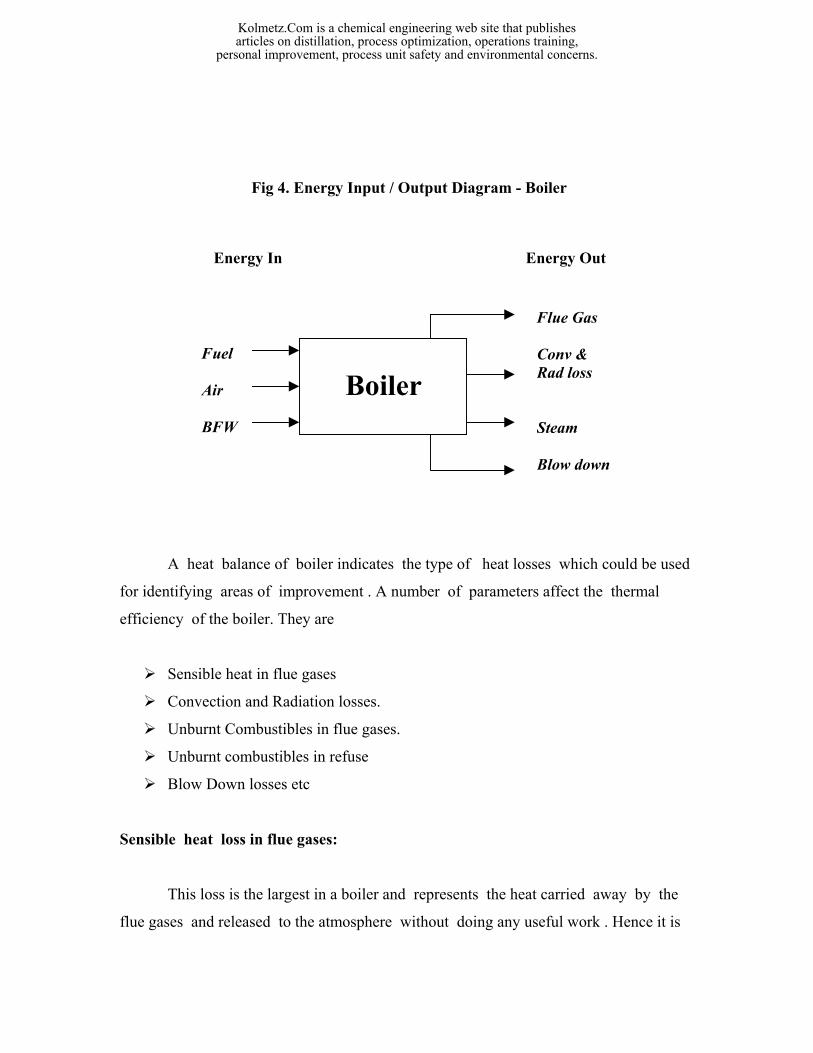
Fig 4. Energy Input / Output Diagram - Boiler
A heat balance of boiler indicates the type of heat losses which could be used
for identifying areas of improvement . A number of parameters affect the thermal
efficiency of the boiler. They are
Sensible heat in flue gases
Convection and Radiation losses.
Unburnt Combustibles in flue gases.
Unburnt combustibles in refuse
Blow Down losses etc
Sensible heat loss in flue gases:
This loss is the largest in a boiler and represents the heat carried away by the
flue gases and released to the atmosphere without doing any useful work . Hence it is
Boiler
Energy In Energy Out
Fuel Air BFW
Flue Gas Conv & Rad loss Steam Blow down
Kolmetz.Com is a chemical engineering web site that publishesarticles on distillation, process optimization, operations training,
personal improvement, process unit safety and environmental concerns.
obvious that if more than the required quantity of air is used in a boiler , more will be
the loss in flue gases and the thermal efficiency of the boiler will be reduced
correspondingly.
Convection and Radiation losses :
This depends on the temperature of boiler's external surface . Quantity of heat
lost by convection and radiation is a function of shell temperature and wind velocity.
This loss occurs basically due to poor insulation and poor design characteristics .
If the refractory lining and other insulating materials are not in good condition ,
these losses will tend to increase and reduce the thermal efficiency of the boiler. Hence
it is imperative that the surface temperature at various sections should be monitored
periodically and corrective actions taken to minimize this loss.
Unburnt matter in flue gas:
When combustion is incomplete , part of the carbon present in the hydro
carbon fuel may be converted into carbon monoxide instead of carbon-di-oxide. When
the carbon content of the fuel is not fully burnt to carbon-di-oxide, there will be
substantial energy loss to the atmosphere from the flue gases ( besides atmospheric
pollution) , the loss being proportional to the amount of carbon monoxide produced .
This could be estimated by a carbon balance across the boiler taking into
consideration carbon content in fuel , carbon-di-oxide and carbon monoxide in the flue
gases and carbon content in the refuse.
Unburnt matter may show itself in the flue gas in the form of black smoke
which represents presence of carbon particles in the flue gas. It may also show itself
as Carbon monoxide in the flue gas While every kg of carbon present in the flue gas
represents a loss of 8084 kcals , every kg of Carbon partially oxidized to CO results
Kolmetz.Com is a chemical engineering web site that publishesarticles on distillation, process optimization, operations training,
personal improvement, process unit safety and environmental concerns.
in a loss of 5654 kcals . This situation could be controlled with optimum excess air
input to the boiler.
Blow Down Losses:
Dissolved salts find entry to the boiler through make-up water which is
continuously fed by the Boiler Feed Water pump ( bfw) . In the boiler , there is
continuous evaporation of water into steam . This leaves behind the salts in the boiler.
Concentration of these salts , tend to increase in the boiler drum and starts precipitation
after certain concentration level .
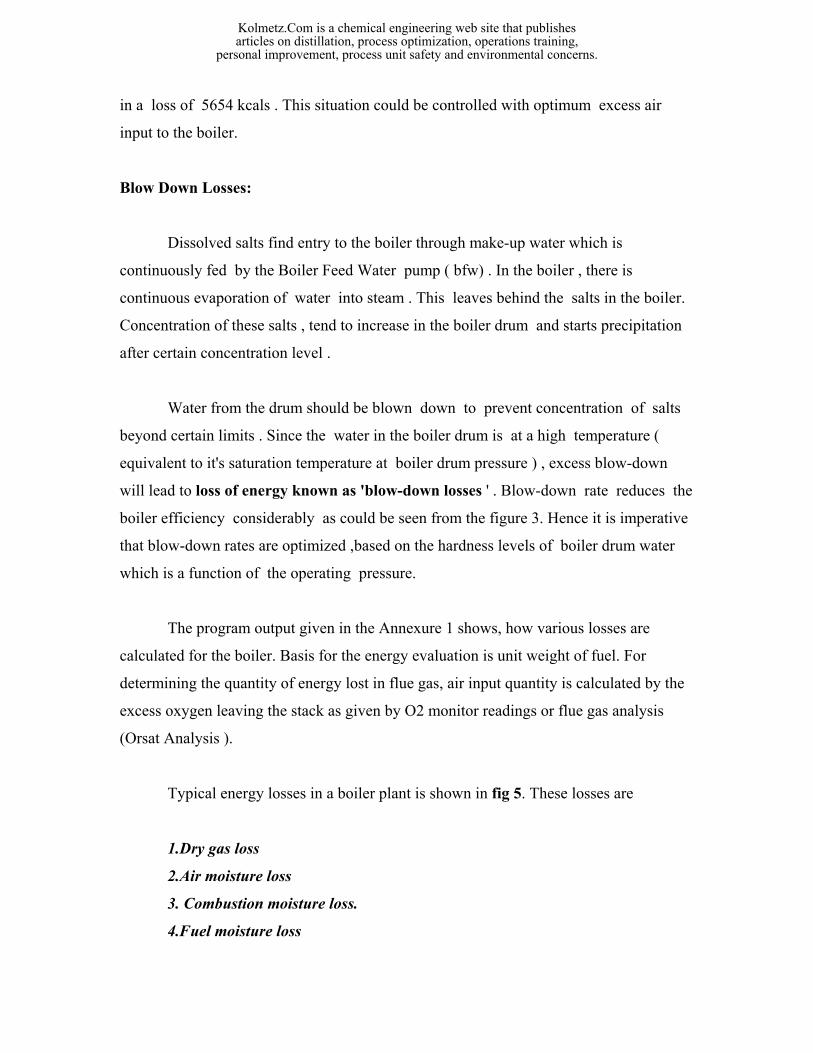
Water from the drum should be blown down to prevent concentration of salts
beyond certain limits . Since the water in the boiler drum is at a high temperature (
equivalent to it's saturation temperature at boiler drum pressure ) , excess blow-down
will lead to loss of energy known as 'blow-down losses ' . Blow-down rate reduces the
boiler efficiency considerably as could be seen from the figure 3. Hence it is imperative
that blow-down rates are optimized ,based on the hardness levels of boiler drum water
which is a function of the operating pressure.
The program output given in the Annexure 1 shows, how various losses are
calculated for the boiler. Basis for the energy evaluation is unit weight of fuel. For
determining the quantity of energy lost in flue gas, air input quantity is calculated by the
excess oxygen leaving the stack as given by O2 monitor readings or flue gas analysis
(Orsat Analysis ).
Typical energy losses in a boiler plant is shown in fig 5. These losses are
1.Dry gas loss
2.Air moisture loss
3. Combustion moisture loss.
4.Fuel moisture loss
Kolmetz.Com is a chemical engineering web site that publishesarticles on distillation, process optimization, operations training,
personal improvement, process unit safety and environmental concerns.
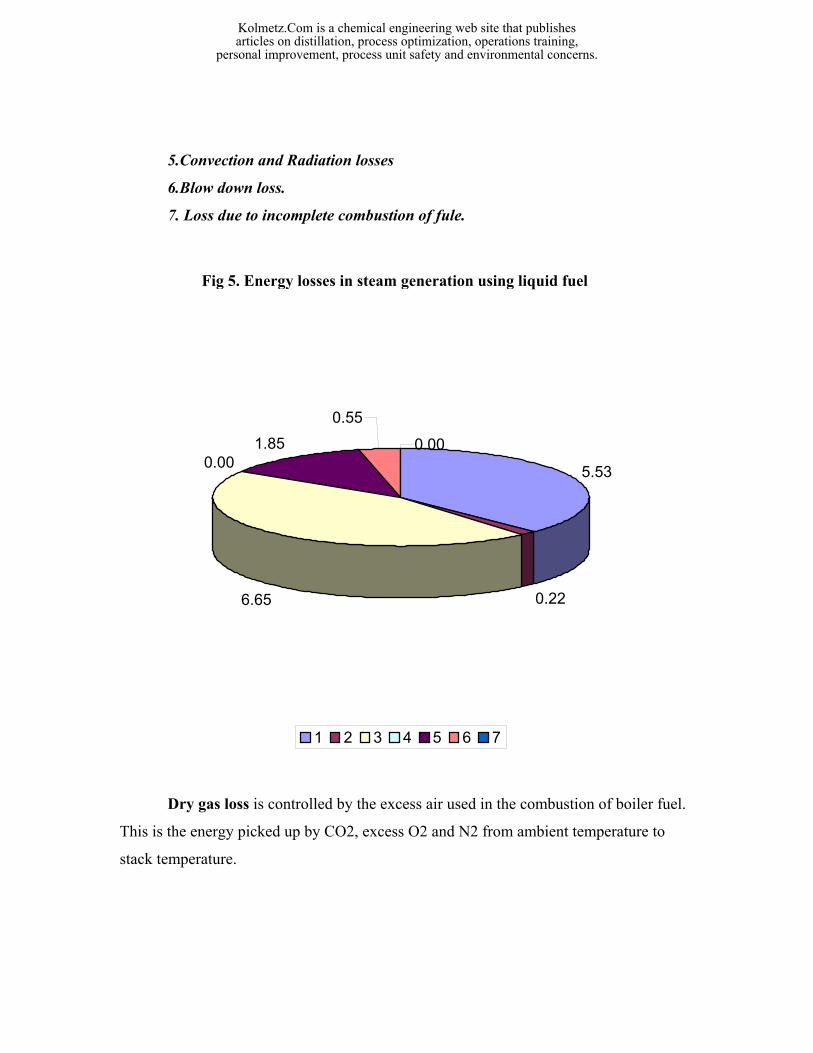
5.Convection and Radiation losses
6.Blow down loss.
7. Loss due to incomplete combustion of fule.
5.53
0.226.65
0.001.85
0.55
0.00
1 2 3 4 5 6 7
Dry gas loss is controlled by the excess air used in the combustion of boiler fuel.
This is the energy picked up by CO2, excess O2 and N2 from ambient temperature to
stack temperature.
Fig 5. Energy losses in steam generation using liquid fuel
Kolmetz.Com is a chemical engineering web site that publishesarticles on distillation, process optimization, operations training,
personal improvement, process unit safety and environmental concerns.
Combustion moisture is controlled by the type of fuel used. High Carbon /
Hydrogen ratio of the fuel minimizes combustion moisture. But the calorific value of
high carbon fuel will be lower than lower Carbon fuel. Hence type of fuel used in the
boiler determines this loss. An optimum fuel mix (considering the cost) may be used to
minimize this loss.
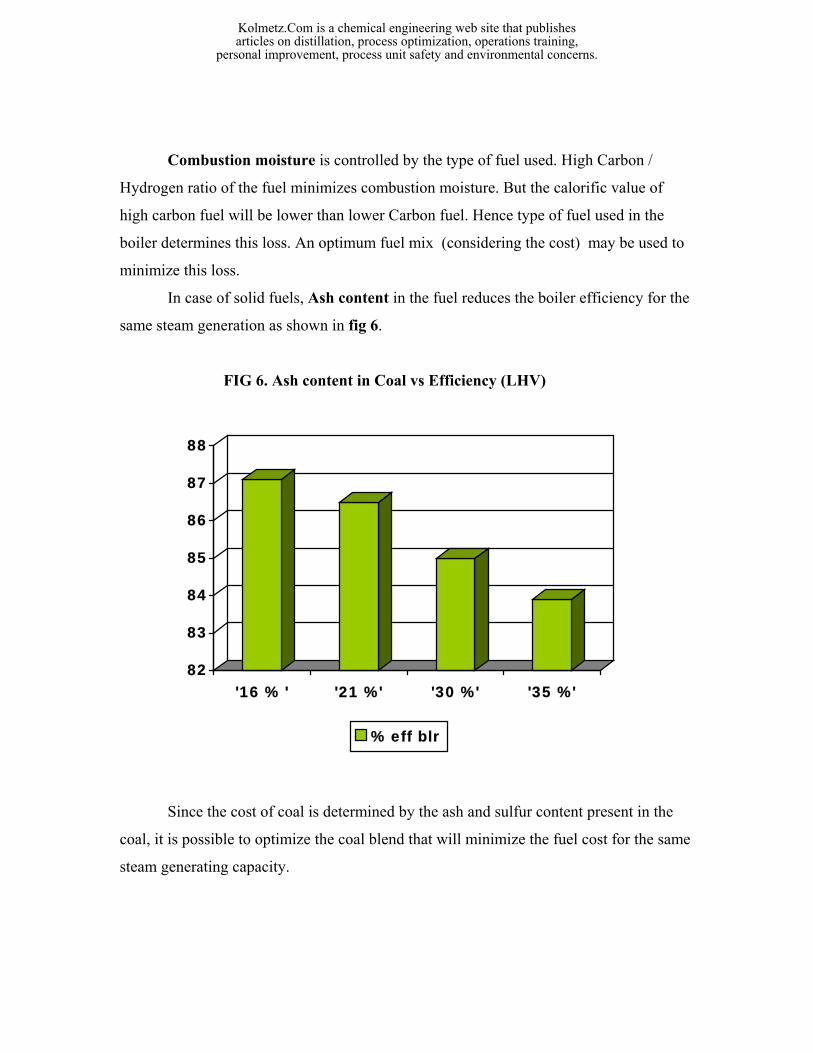
In case of solid fuels, Ash content in the fuel reduces the boiler efficiency for the
same steam generation as shown in fig 6.
FIG 6. Ash content in Coal vs Efficiency (LHV)
Since the cost of coal is determined by the ash and sulfur content present in the
coal, it is possible to optimize the coal blend that will minimize the fuel cost for the same
steam generating capacity.
82
83
84
85
86
87
88
'16 % ' '21 %' '30 %' '35 %'
% eff blr
Kolmetz.Com is a chemical engineering web site that publishesarticles on distillation, process optimization, operations training,
personal improvement, process unit safety and environmental concerns.
Other two controllable losses are Convection and Radiation Loss and Blow down
losses. Convection and Radiation losses may be controlled by periodic Boiler Shell
temperature survey.
Convection and Radiation losses .
For this purpose, the entire boiler shell may be divided into a number of sections
and the average temperature physically measured using a digital thermo meter or contact
thermometer. During the survey, wind velocity in the vicinity of the section may be
measured using an anemometer. Area of the section surveyed is also measured
From the shell temperature and the wind velocity, heat loss from the section is
give by standard programs in kcal / hr / m2 / oC. Multiplying this coefficient by the area
and the measured temperature, the convection and radiation loss is obtained as kcal /hr.
The sum of these values will represent total heat loss from the boiler shell due to
convection and radiation.
Annexure II gives the output of the program used to calculate the convection and
radiation loss from a boiler. Periodic monitoring of the convection and radiation loss
from boiler shall reveal the boiler refractory / shell condition.
When any hot spot develops in the boiler shell, heat loss will be more and boiler
efficiency will start dropping down. Using convection and radiation loss historic data , it
is possible to estimate the boiler efficiency deterioration as a function of time for taking
corrective action.
Fig 7 shows how the convection and radiation loss survey results are used for
developing a time dependant model.
Kolmetz.Com is a chemical engineering web site that publishesarticles on distillation, process optimization, operations training,
personal improvement, process unit safety and environmental concerns.
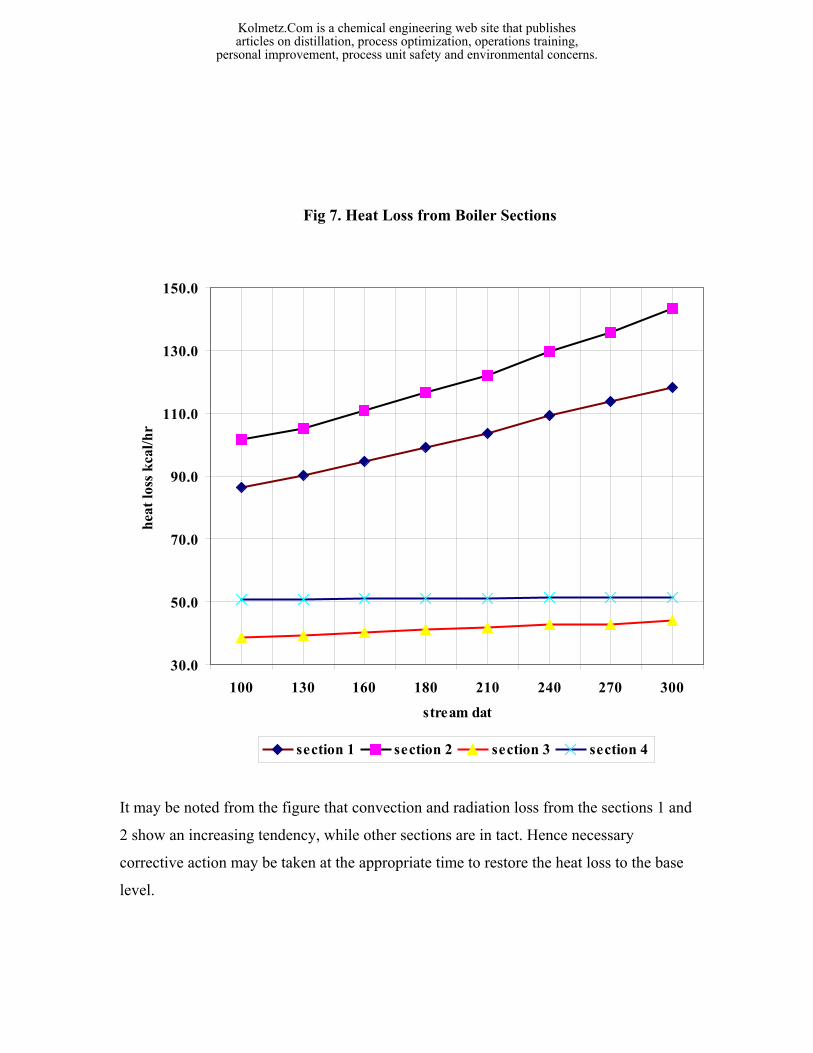
Fig 7. Heat Loss from Boiler Sections
30.0
50.0
70.0
90.0
110.0
130.0
150.0
100 130 160 180 210 240 270 300
stream dat
heat
loss
kca
l/hr
section 1 section 2 section 3 section 4
It may be noted from the figure that convection and radiation loss from the sections 1 and
2 show an increasing tendency, while other sections are in tact. Hence necessary
corrective action may be taken at the appropriate time to restore the heat loss to the base
level.
Kolmetz.Com is a chemical engineering web site that publishesarticles on distillation, process optimization, operations training,
personal improvement, process unit safety and environmental concerns.
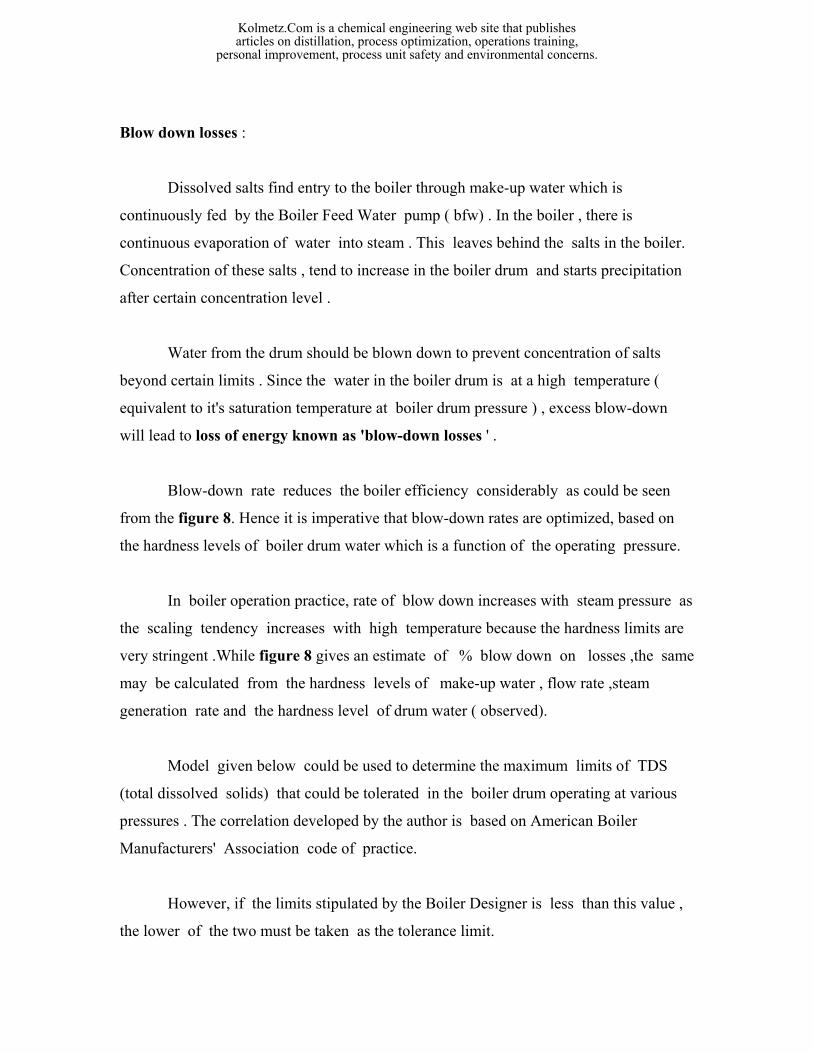
Blow down losses :
Dissolved salts find entry to the boiler through make-up water which is
continuously fed by the Boiler Feed Water pump ( bfw) . In the boiler , there is
continuous evaporation of water into steam . This leaves behind the salts in the boiler.
Concentration of these salts , tend to increase in the boiler drum and starts precipitation
after certain concentration level .
Water from the drum should be blown down to prevent concentration of salts
beyond certain limits . Since the water in the boiler drum is at a high temperature (
equivalent to it's saturation temperature at boiler drum pressure ) , excess blow-down
will lead to loss of energy known as 'blow-down losses ' .
Blow-down rate reduces the boiler efficiency considerably as could be seen
from the figure 8. Hence it is imperative that blow-down rates are optimized, based on
the hardness levels of boiler drum water which is a function of the operating pressure.
In boiler operation practice, rate of blow down increases with steam pressure as
the scaling tendency increases with high temperature because the hardness limits are
very stringent .While figure 8 gives an estimate of % blow down on losses ,the same
may be calculated from the hardness levels of make-up water , flow rate ,steam
generation rate and the hardness level of drum water ( observed).
Model given below could be used to determine the maximum limits of TDS
(total dissolved solids) that could be tolerated in the boiler drum operating at various
pressures . The correlation developed by the author is based on American Boiler
Manufacturers' Association code of practice.
However, if the limits stipulated by the Boiler Designer is less than this value ,
the lower of the two must be taken as the tolerance limit.
Kolmetz.Com is a chemical engineering web site that publishesarticles on distillation, process optimization, operations training,
personal improvement, process unit safety and environmental concerns.
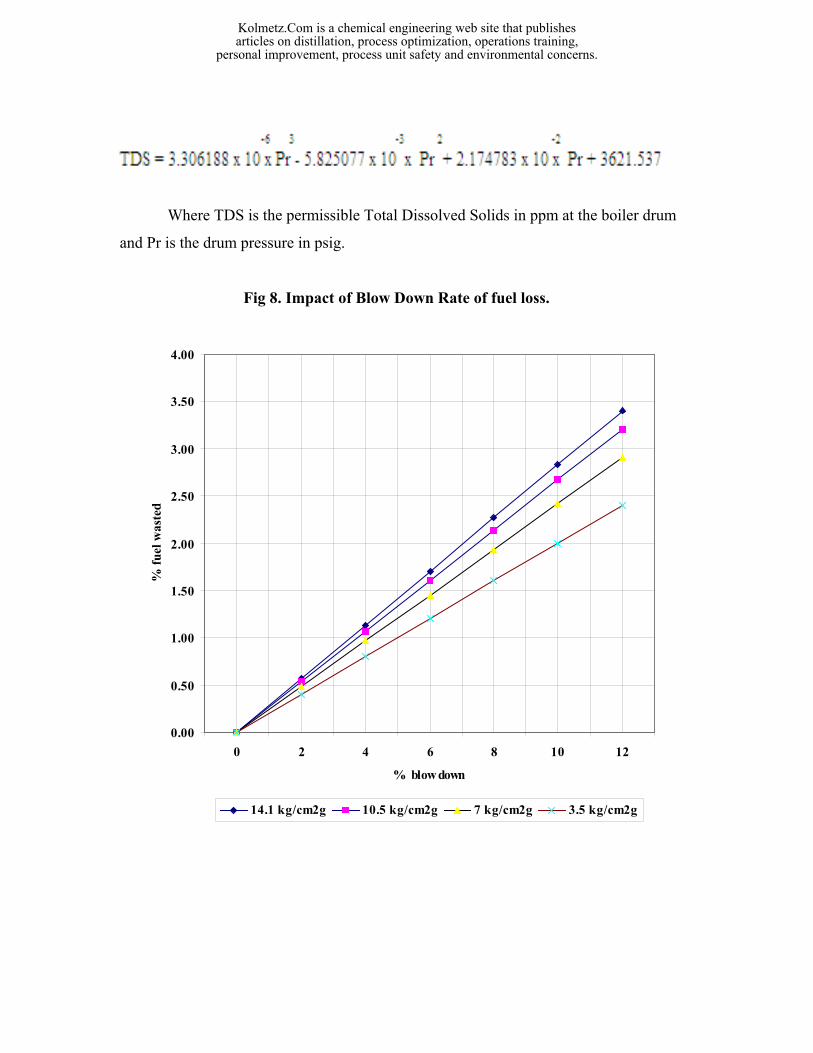
Where TDS is the permissible Total Dissolved Solids in ppm at the boiler drum
and Pr is the drum pressure in psig.
Fig 8. Impact of Blow Down Rate of fuel loss.
0.00
0.50
1.00
1.50
2.00
2.50
3.00
3.50
4.00
0 2 4 6 8 10 12
% blow down
% fu
el w
aste
d
14.1 kg/cm2g 10.5 kg/cm2g 7 kg/cm2g 3.5 kg/cm2g
Kolmetz.Com is a chemical engineering web site that publishesarticles on distillation, process optimization, operations training,
personal improvement, process unit safety and environmental concerns.
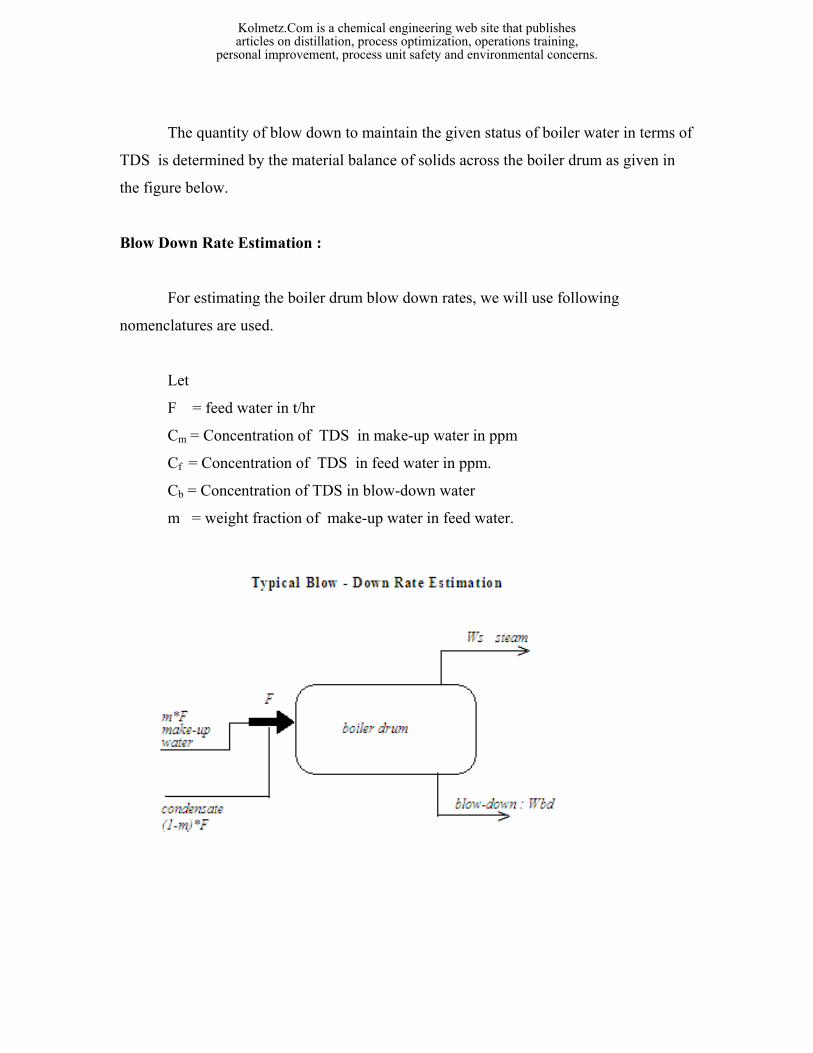
The quantity of blow down to maintain the given status of boiler water in terms of
TDS is determined by the material balance of solids across the boiler drum as given in
the figure below.
Blow Down Rate Estimation :
For estimating the boiler drum blow down rates, we will use following
nomenclatures are used.
Let
F = feed water in t/hr
Cm = Concentration of TDS in make-up water in ppm
Cf = Concentration of TDS in feed water in ppm.
Cb = Concentration of TDS in blow-down water
m = weight fraction of make-up water in feed water.
Kolmetz.Com is a chemical engineering web site that publishesarticles on distillation, process optimization, operations training,
personal improvement, process unit safety and environmental concerns.
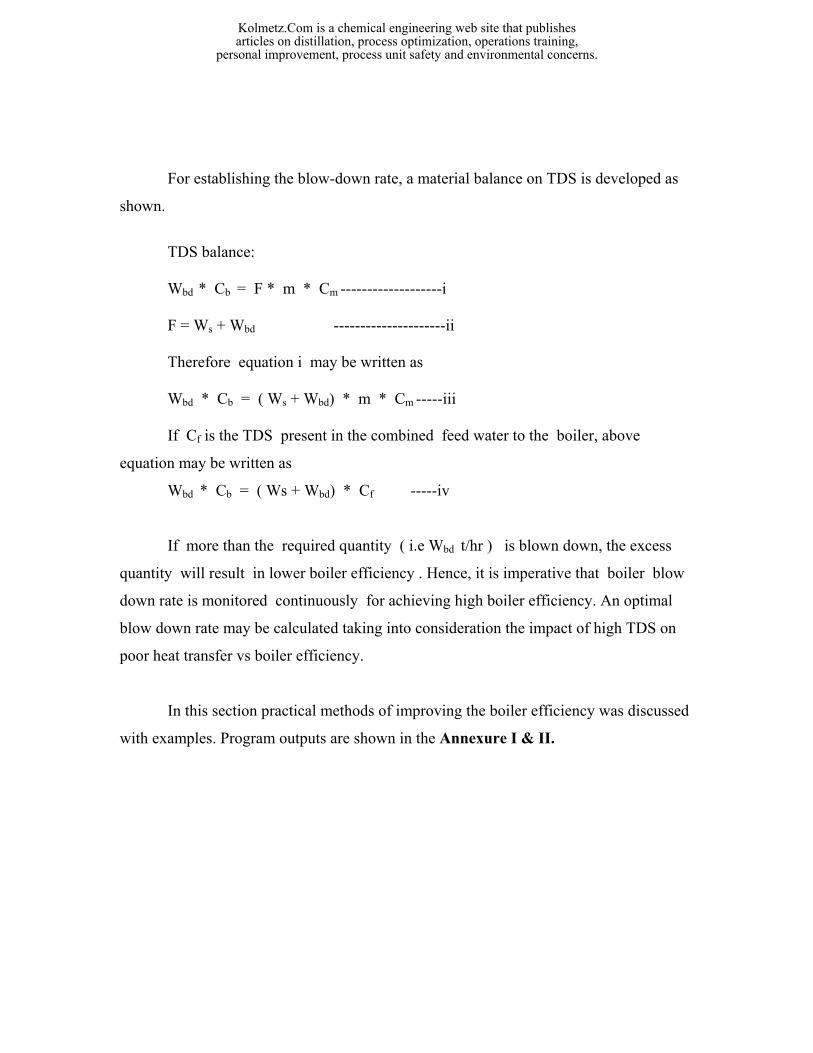
For establishing the blow-down rate, a material balance on TDS is developed as
shown.
TDS balance: Wbd * Cb = F * m * Cm -------------------i F = Ws + Wbd ---------------------ii Therefore equation i may be written as Wbd * Cb = ( Ws + Wbd) * m * Cm -----iii
If Cf is the TDS present in the combined feed water to the boiler, above
equation may be written as
Wbd * Cb = ( Ws + Wbd) * Cf -----iv
If more than the required quantity ( i.e Wbd t/hr ) is blown down, the excess
quantity will result in lower boiler efficiency . Hence, it is imperative that boiler blow
down rate is monitored continuously for achieving high boiler efficiency. An optimal
blow down rate may be calculated taking into consideration the impact of high TDS on
poor heat transfer vs boiler efficiency.
In this section practical methods of improving the boiler efficiency was discussed
with examples. Program outputs are shown in the Annexure I & II.
Kolmetz.Com is a chemical engineering web site that publishesarticles on distillation, process optimization, operations training,
personal improvement, process unit safety and environmental concerns.
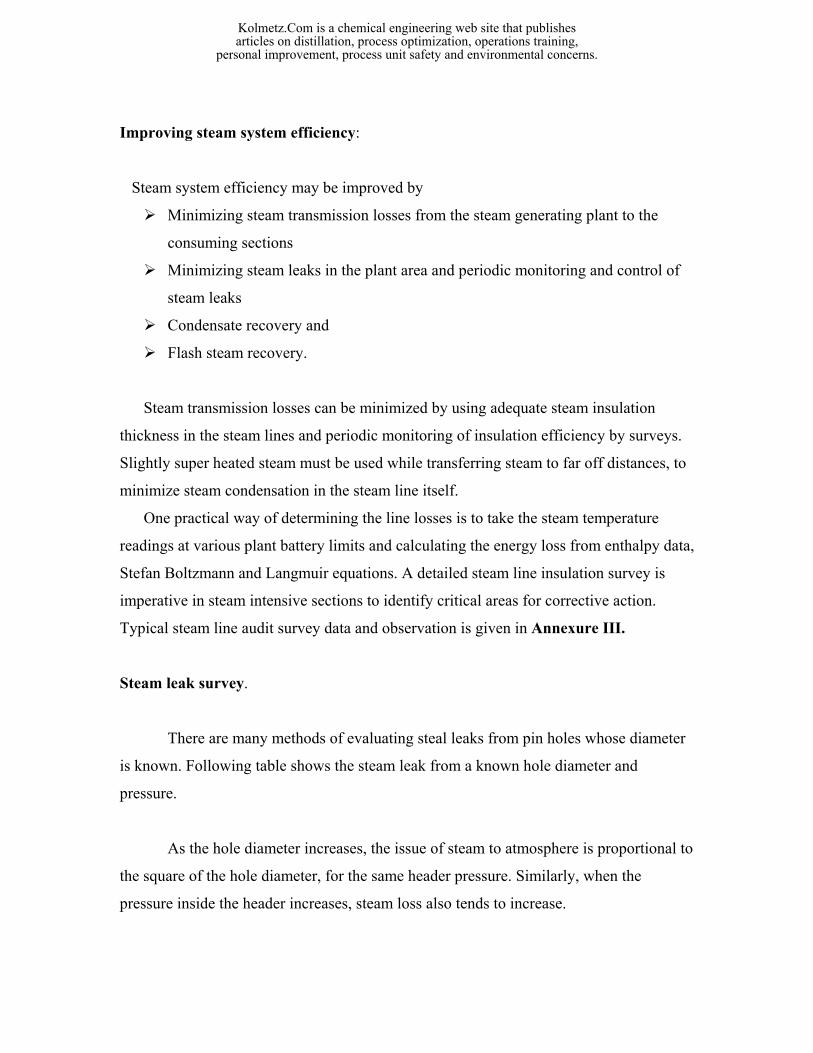
Improving steam system efficiency:
Steam system efficiency may be improved by
Minimizing steam transmission losses from the steam generating plant to the
consuming sections
Minimizing steam leaks in the plant area and periodic monitoring and control of
steam leaks
Condensate recovery and
Flash steam recovery.
Steam transmission losses can be minimized by using adequate steam insulation
thickness in the steam lines and periodic monitoring of insulation efficiency by surveys.
Slightly super heated steam must be used while transferring steam to far off distances, to
minimize steam condensation in the steam line itself.
One practical way of determining the line losses is to take the steam temperature
readings at various plant battery limits and calculating the energy loss from enthalpy data,
Stefan Boltzmann and Langmuir equations. A detailed steam line insulation survey is
imperative in steam intensive sections to identify critical areas for corrective action.
Typical steam line audit survey data and observation is given in Annexure III.
Steam leak survey.
There are many methods of evaluating steal leaks from pin holes whose diameter
is known. Following table shows the steam leak from a known hole diameter and
pressure.
As the hole diameter increases, the issue of steam to atmosphere is proportional to
the square of the hole diameter, for the same header pressure. Similarly, when the
pressure inside the header increases, steam loss also tends to increase.
Kolmetz.Com is a chemical engineering web site that publishesarticles on distillation, process optimization, operations training,
personal improvement, process unit safety and environmental concerns.
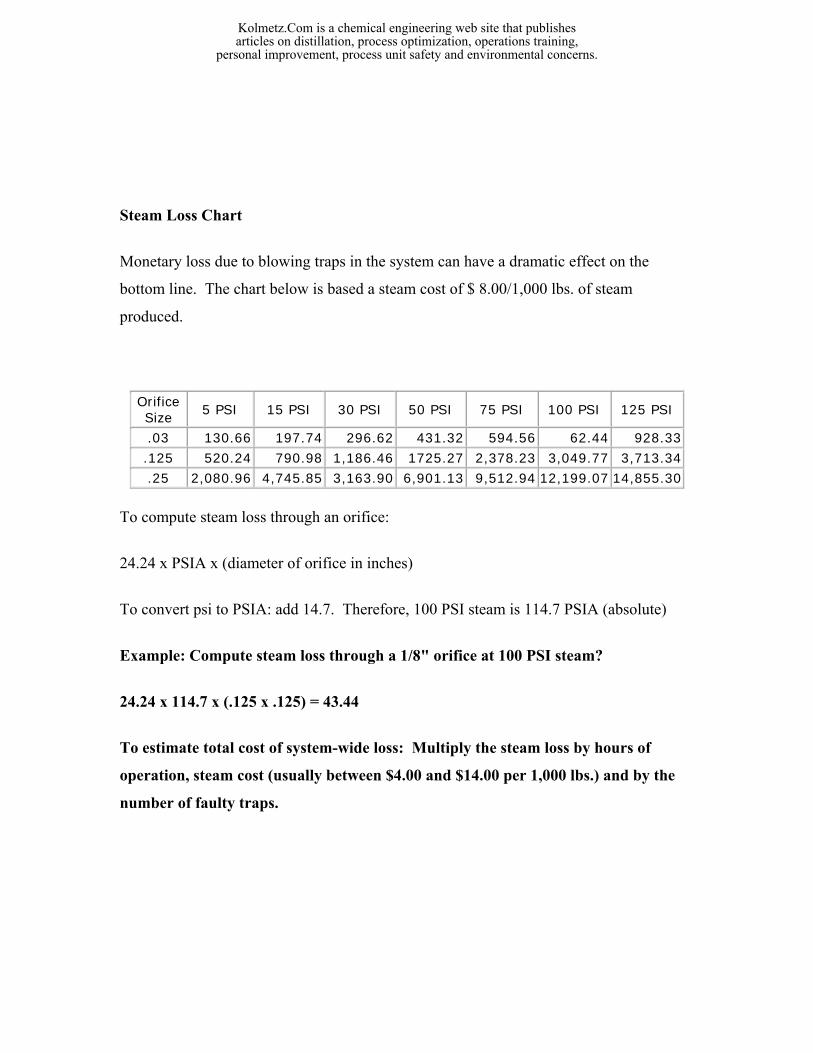
Steam Loss Chart
Monetary loss due to blowing traps in the system can have a dramatic effect on the
bottom line. The chart below is based a steam cost of $ 8.00/1,000 lbs. of steam
produced.
Orifice Size 5 PSI 15 PSI 30 PSI 50 PSI 75 PSI 100 PSI 125 PSI
.03 130.66 197.74 296.62 431.32 594.56 62.44 928.33
.125 520.24 790.98 1,186.46 1725.27 2,378.23 3,049.77 3,713.34
.25 2,080.96 4,745.85 3,163.90 6,901.13 9,512.94 12,199.07 14,855.30
To compute steam loss through an orifice:
24.24 x PSIA x (diameter of orifice in inches)
To convert psi to PSIA: add 14.7. Therefore, 100 PSI steam is 114.7 PSIA (absolute)
Example: Compute steam loss through a 1/8" orifice at 100 PSI steam?
24.24 x 114.7 x (.125 x .125) = 43.44
To estimate total cost of system-wide loss: Multiply the steam loss by hours of
operation, steam cost (usually between $4.00 and $14.00 per 1,000 lbs.) and by the
number of faulty traps.
Kolmetz.Com is a chemical engineering web site that publishesarticles on distillation, process optimization, operations training,
personal improvement, process unit safety and environmental concerns.
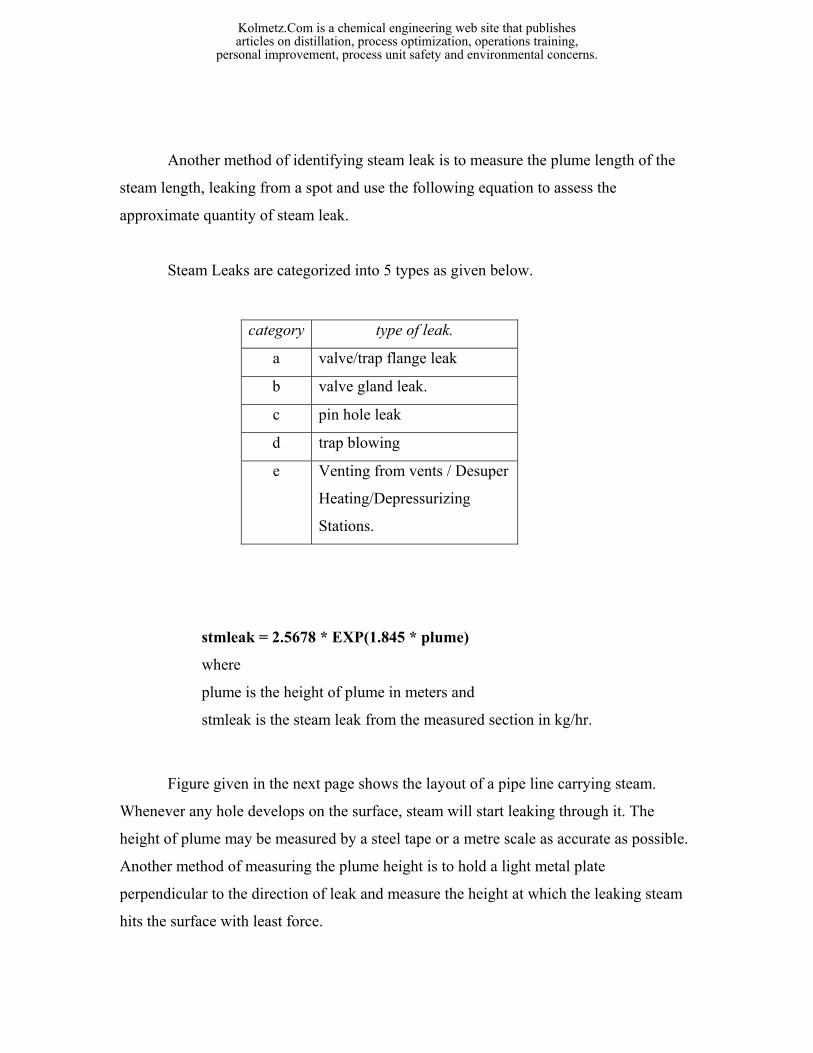
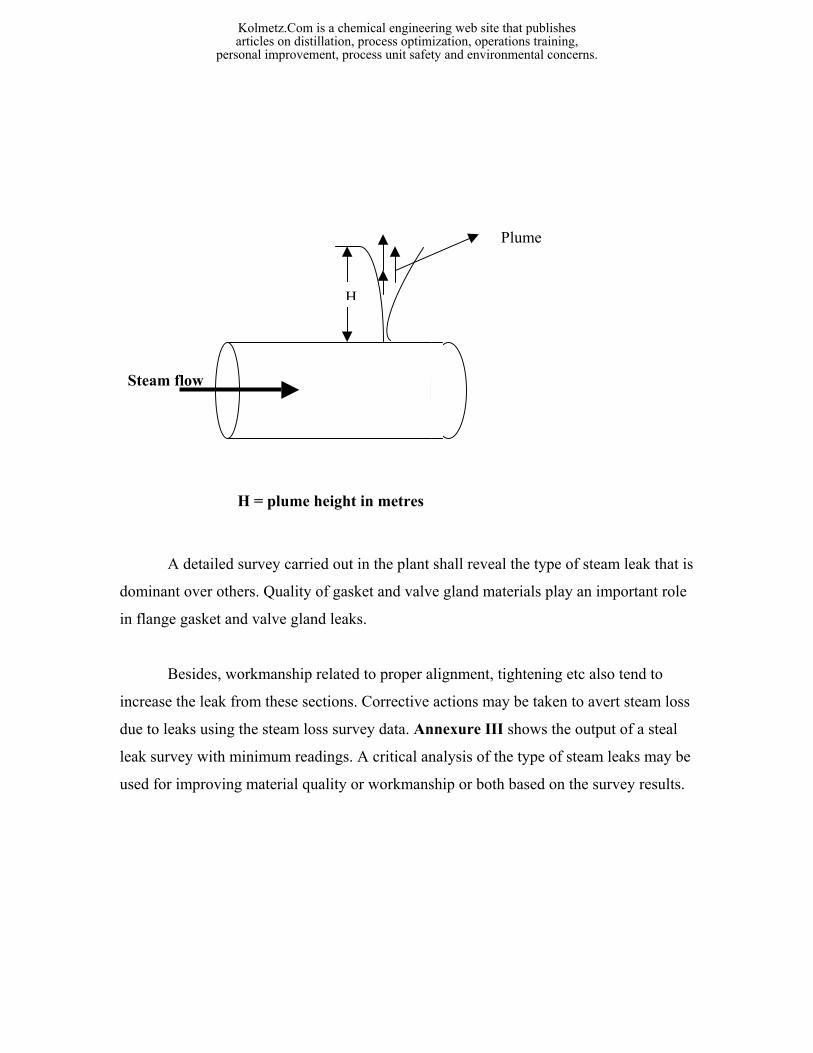
Another method of identifying steam leak is to measure the plume length of the
steam length, leaking from a spot and use the following equation to assess the
approximate quantity of steam leak.
Steam Leaks are categorized into 5 types as given below.
Figure given in the next page shows the layout of a pipe line carrying steam.
Whenever any hole develops on the surface, steam will start leaking through it. The
height of plume may be measured by a steel tape or a metre scale as accurate as possible.
Another method of measuring the plume height is to hold a light metal plate
perpendicular to the direction of leak and measure the height at which the leaking steam
hits the surface with least force.
category type of leak.
a valve/trap flange leak
b valve gland leak.
c pin hole leak
d trap blowing
e Venting from vents / Desuper
Heating/Depressurizing
Stations.
stmleak = 2.5678 * EXP(1.845 * plume)
where
plume is the height of plume in meters and
stmleak is the steam leak from the measured section in kg/hr.
Kolmetz.Com is a chemical engineering web site that publishesarticles on distillation, process optimization, operations training,
personal improvement, process unit safety and environmental concerns.
Steam flow
A detailed survey carried out in the plant shall reveal the type of steam leak that is
dominant over others. Quality of gasket and valve gland materials play an important role
in flange gasket and valve gland leaks.
Besides, workmanship related to proper alignment, tightening etc also tend to
increase the leak from these sections. Corrective actions may be taken to avert steam loss
due to leaks using the steam loss survey data. Annexure III shows the output of a steal
leak survey with minimum readings. A critical analysis of the type of steam leaks may be
used for improving material quality or workmanship or both based on the survey results.
H
Plume
H = plume height in metres
Kolmetz.Com is a chemical engineering web site that publishesarticles on distillation, process optimization, operations training,
personal improvement, process unit safety and environmental concerns.
Conclusion :
In this paper a number of methods related to steam system management and
energy efficiency improvements have been high lighted. A number of practical examples
and cases have been covered. Since this is an area of continuous improvement and the
controlling techniques vary with cost of energy from time to time, it is imperative to
adapt to the changes as and when called for. Only by this approach , Steam system
efficiency shall be maintained at the peak.
Kolmetz.Com is a chemical engineering web site that publishesarticles on distillation, process optimization, operations training,
personal improvement, process unit safety and environmental concerns.
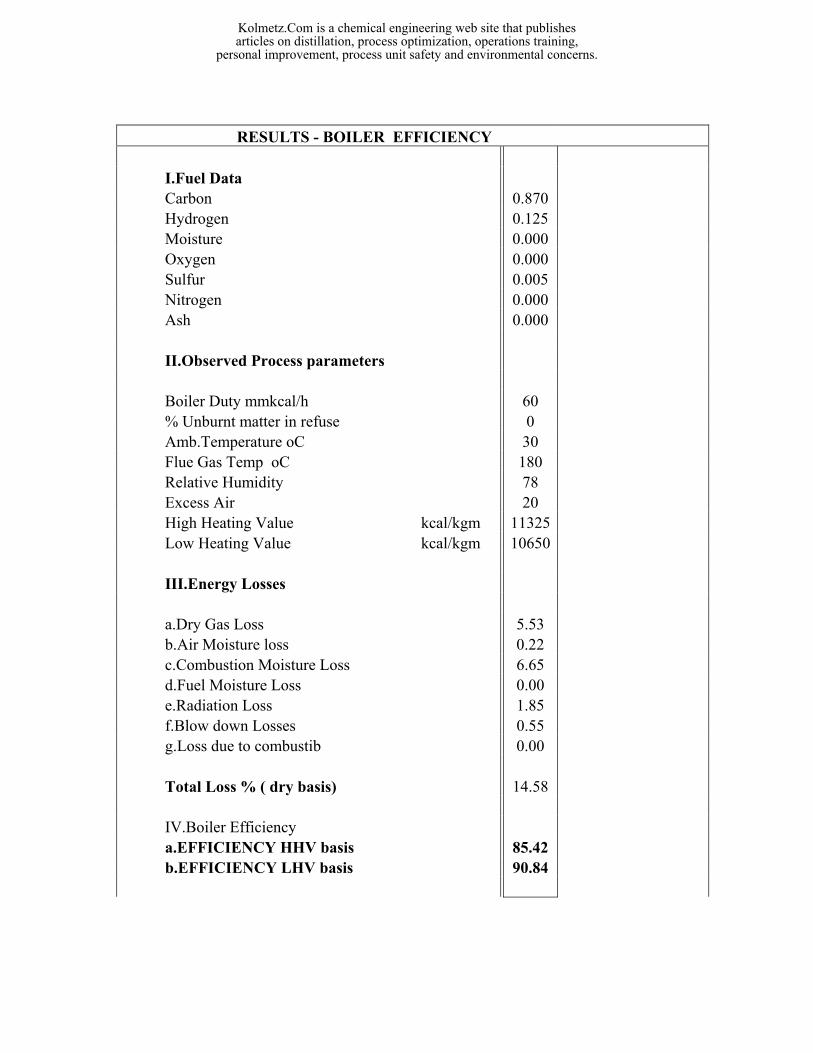
RESULTS - BOILER EFFICIENCY
I.Fuel Data Carbon 0.870 Hydrogen 0.125 Moisture 0.000 Oxygen 0.000 Sulfur 0.005 Nitrogen 0.000 Ash 0.000 II.Observed Process parameters Boiler Duty mmkcal/h 60 % Unburnt matter in refuse 0 Amb.Temperature oC 30 Flue Gas Temp oC 180 Relative Humidity 78 Excess Air 20 High Heating Value kcal/kgm 11325 Low Heating Value kcal/kgm 10650 III.Energy Losses a.Dry Gas Loss 5.53 b.Air Moisture loss 0.22 c.Combustion Moisture Loss 6.65 d.Fuel Moisture Loss 0.00 e.Radiation Loss 1.85 f.Blow down Losses 0.55 g.Loss due to combustib 0.00 Total Loss % ( dry basis) 14.58 IV.Boiler Efficiency a.EFFICIENCY HHV basis 85.42 b.EFFICIENCY LHV basis 90.84
Kolmetz.Com is a chemical engineering web site that publishesarticles on distillation, process optimization, operations training,
personal improvement, process unit safety and environmental concerns.
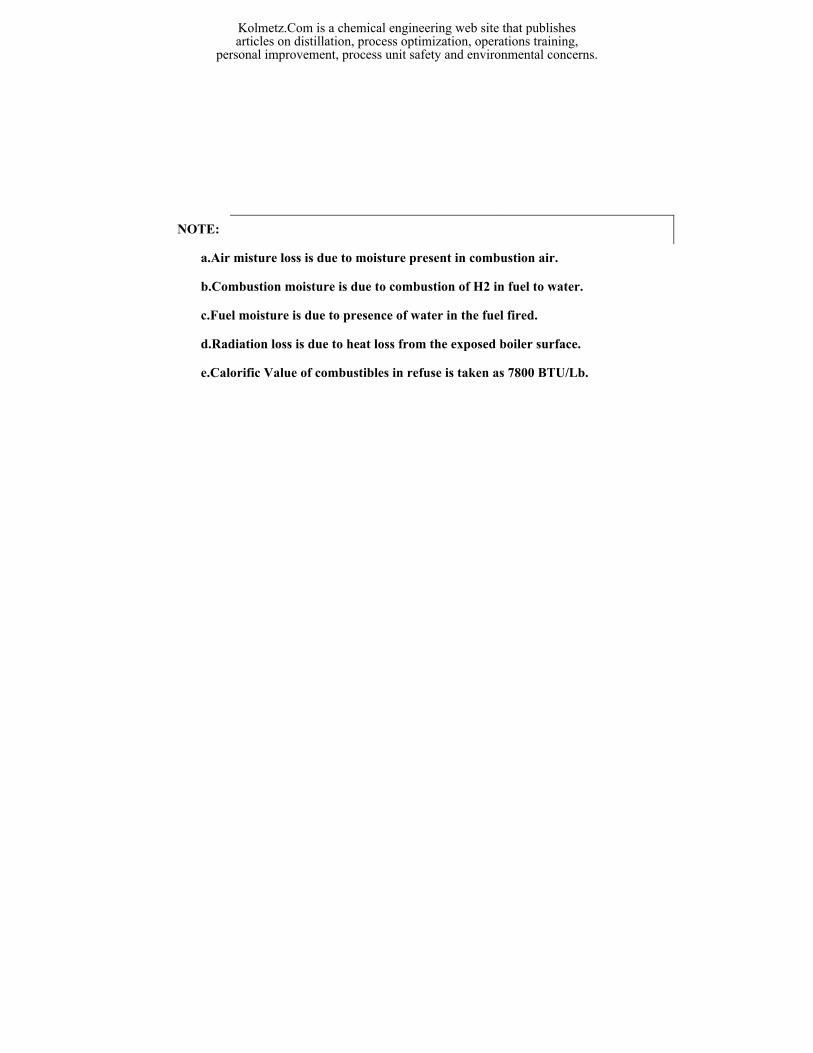
NOTE:
a.Air misture loss is due to moisture present in combustion air.
b.Combustion moisture is due to combustion of H2 in fuel to water.
c.Fuel moisture is due to presence of water in the fuel fired.
d.Radiation loss is due to heat loss from the exposed boiler surface.
e.Calorific Value of combustibles in refuse is taken as 7800 BTU/Lb.
Kolmetz.Com is a chemical engineering web site that publishesarticles on distillation, process optimization, operations training,
personal improvement, process unit safety and environmental concerns.
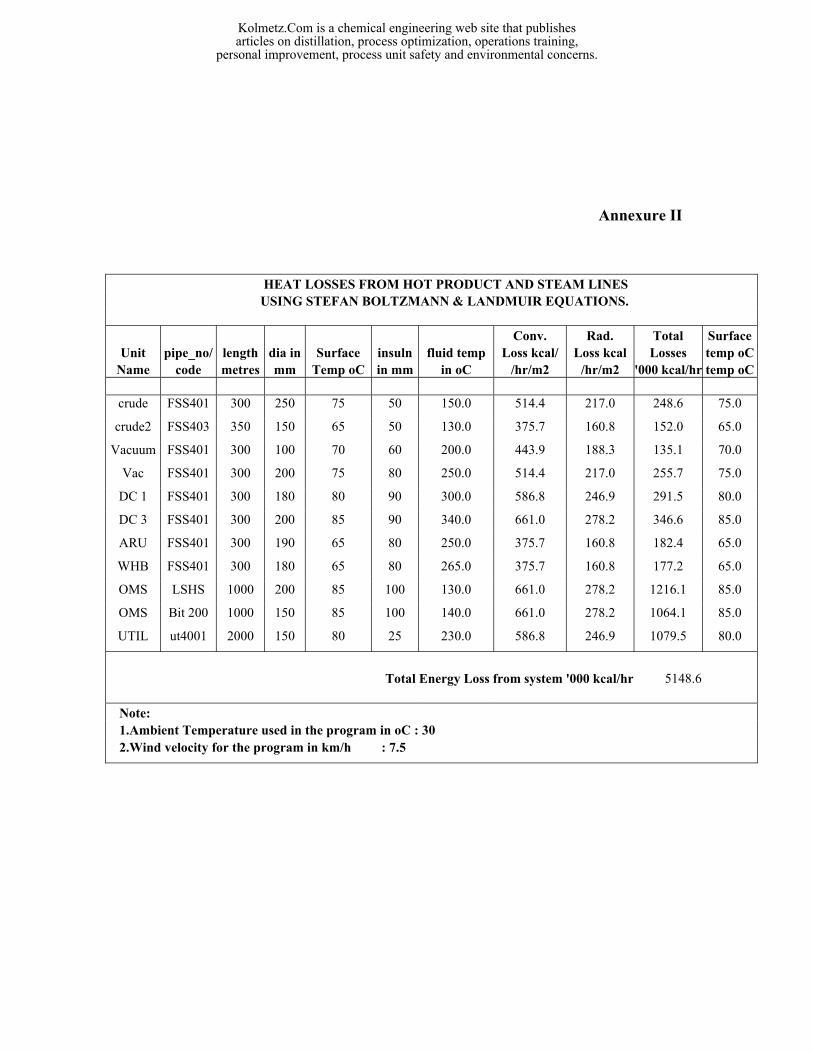
Annexure II
HEAT LOSSES FROM HOT PRODUCT AND STEAM LINES USING STEFAN BOLTZMANN & LANDMUIR EQUATIONS.
Conv. Rad. Total SurfaceUnit pipe_no/ length dia in Surface insuln fluid temp Loss kcal/ Loss kcal Losses temp oC
Name code metres mm Temp oC in mm in oC /hr/m2 /hr/m2 '000 kcal/hr temp oC
crude FSS401 300 250 75 50 150.0 514.4 217.0 248.6 75.0
crude2 FSS403 350 150 65 50 130.0 375.7 160.8 152.0 65.0
Vacuum FSS401 300 100 70 60 200.0 443.9 188.3 135.1 70.0
Vac FSS401 300 200 75 80 250.0 514.4 217.0 255.7 75.0
DC 1 FSS401 300 180 80 90 300.0 586.8 246.9 291.5 80.0
DC 3 FSS401 300 200 85 90 340.0 661.0 278.2 346.6 85.0
ARU FSS401 300 190 65 80 250.0 375.7 160.8 182.4 65.0
WHB FSS401 300 180 65 80 265.0 375.7 160.8 177.2 65.0
OMS LSHS 1000 200 85 100 130.0 661.0 278.2 1216.1 85.0
OMS Bit 200 1000 150 85 100 140.0 661.0 278.2 1064.1 85.0
UTIL ut4001 2000 150 80 25 230.0 586.8 246.9 1079.5 80.0
Total Energy Loss from system '000 kcal/hr 5148.6 Note: 1.Ambient Temperature used in the program in oC : 30 2.Wind velocity for the program in km/h : 7.5
Kolmetz.Com is a chemical engineering web site that publishesarticles on distillation, process optimization, operations training,
personal improvement, process unit safety and environmental concerns.
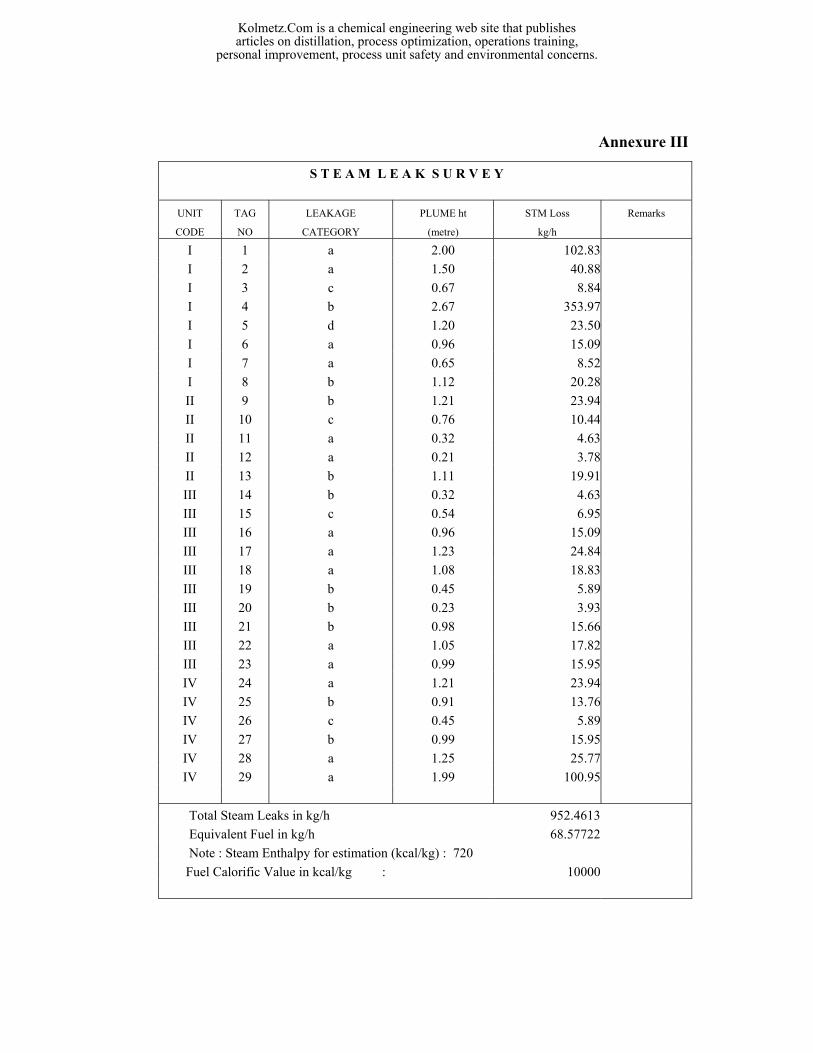
Annexure III
S T E A M L E A K S U R V E Y
UNIT TAG LEAKAGE PLUME ht STM Loss Remarks
CODE NO CATEGORY (metre) kg/h
I 1 a 2.00 102.83 I 2 a 1.50 40.88 I 3 c 0.67 8.84 I 4 b 2.67 353.97 I 5 d 1.20 23.50 I 6 a 0.96 15.09 I 7 a 0.65 8.52 I 8 b 1.12 20.28 II 9 b 1.21 23.94 II 10 c 0.76 10.44 II 11 a 0.32 4.63 II 12 a 0.21 3.78 II 13 b 1.11 19.91 III 14 b 0.32 4.63 III 15 c 0.54 6.95 III 16 a 0.96 15.09 III 17 a 1.23 24.84 III 18 a 1.08 18.83 III 19 b 0.45 5.89 III 20 b 0.23 3.93 III 21 b 0.98 15.66 III 22 a 1.05 17.82 III 23 a 0.99 15.95 IV 24 a 1.21 23.94 IV 25 b 0.91 13.76 IV 26 c 0.45 5.89 IV 27 b 0.99 15.95 IV 28 a 1.25 25.77 IV 29 a 1.99 100.95
Total Steam Leaks in kg/h 952.4613 Equivalent Fuel in kg/h 68.57722 Note : Steam Enthalpy for estimation (kcal/kg) : 720 Fuel Calorific Value in kcal/kg : 10000
Kolmetz.Com is a chemical engineering web site that publishesarticles on distillation, process optimization, operations training,
personal improvement, process unit safety and environmental concerns.