Embed Size (px)
Citation preview
Energy Yield Values and other rationales for improving performance of HHO technology.
Ver. 1.2.
March 27, 2011

This report was prepared by HHO Research, a workgroup for promoting better quality quality research into the science and technology of HHO gas.
2 03/27/11
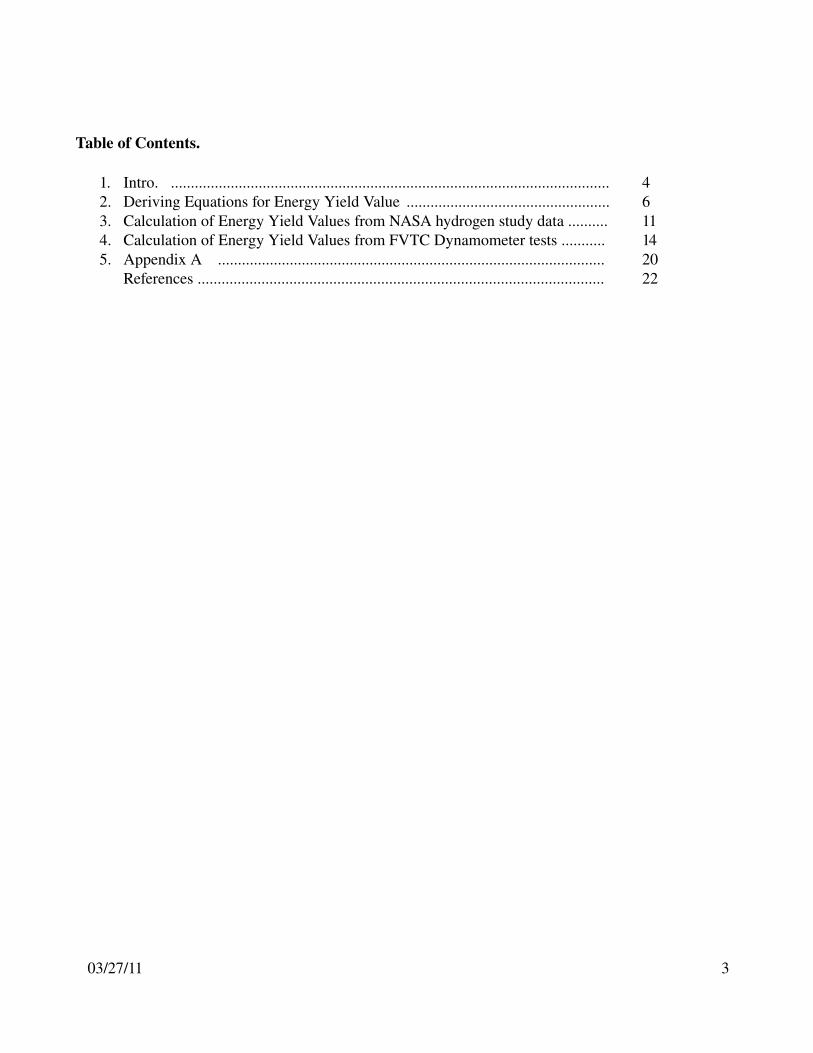
Table of Contents.
1. Intro. .............................................................................................................. 42. Deriving Equations for Energy Yield Value ................................................... 63. Calculation of Energy Yield Values from NASA hydrogen study data .......... 114. Calculation of Energy Yield Values from FVTC Dynamometer tests ........... 145. Appendix A ................................................................................................. 20
References ...................................................................................................... 22
03/27/11 3
Chapter 1. Intro.
Common duct water electrolyzers that generate a hydrogen oxygen mixture ondemand for injection into internal combustion engines is widely promoted as a method for improving mileage and reducing emissions. This gas mixture is often referred to as Brown's gas or HHO. The purpose of this book is to report the results of my research on this gas.
The conventional viewpoint is that it is not significantly different from a stoichiometric mixture of molecular oxygen and hydrogen. However, analysis of engine dynamometer data suggests that it is quite different from a simple stable mixture of oxygen and hydrogen gases. In this book, we develop the concept of energy yield per gram of gas injected. Applying this rationale to engine dynamometer test data show yield values hundreds of times greater for HHO as compared with bottled hydrogen or hydrogen produced by a methanol reformer.
Such a great difference is hard to explain using conventional rationales (e.g., flame velocity of hydrogen, increased effective compression ratio, etc) based on classical physics. At the very least, this indicates the need for further testing. I feel that it indicates that something is going on here that is not well understood, yet is very significant. It also suggests that perhaps HHO technology still has a large undeveloped potential.
4 03/27/11
Chapter 2. Deriving Equations for Energy Yield Value
Energy yield value (EYV) quantifies the additional output of useful energy that results from injection of gas into an internal combustion engine under a specified set of conditions. Quantifying useful additional output per unit quantity of injected HHO gas is an important step in developing a more systematic approach to HHO gas engineering research.
The measurements for determining EYV are performed under a specified set of conditions by running an engine on a dynamometer test stand. Dynamometer measurements will generally be much more repeatable, reproducible and accurate than tests on vehicles operating under road conditions. Appendix A contains an explanation of engine dynamometers as some readers may not be familiar with this kind of equipment. A general understanding of engine dynamometry is helpful to understanding the calculation of EYV for HHO injection at various speeds and loads.
To measure EYV, fuel consumption is measured with and without HHO injection under identical conditions. That is, the load and speed settings are the same in both tests. Fuel consumption for HHO dynamometer tests are done by weighing the fuel container, running the engine for a specific amount of time at a certain speed and load, weighing the fuel container again and calculating the difference to obtain the weight of fuel used during the test period. Weight is a better basis than volume since weight can generally be measured more accurately and precisely, whereas, the amount of fuel in a given volume is more greatly affected by temperature. This is much less the case with a weight measurement.
The two parameters that define test conditions are engine speed (usually expressed as RPM) and engine load (generally expressed in the US as foot pounds measured on a scale or more often an electronic load cell). The formula that is generally used to calculate power output of an engine is:
RPM x torque (foot pounds) / 5252.113 = Horsepower output (brake HP)
Derivation of EYV equation: Efficiency of an engine is generally denoted by the italicized lowercase Greek letter eta: . We shall follow this convention. We shall define efficiency variables as follow:
engine efficiency with out gas injection. Also called baseline efficiency.
engine efficiency with gas injection.
gadditional engine efficiency resulting from gas injection.
Note that in this book, we never refer to gasoline as “gas”. The term gas refers to matter in a gaseous state such as hydrogen, HHO or Brown's gas, nitrous oxide or any other gas for which one might wish to measure an EYV. Gasoline, diesel oil, straight vegetable oil (SVO), etc. are collectively referred to as fuel.
03/27/11 5
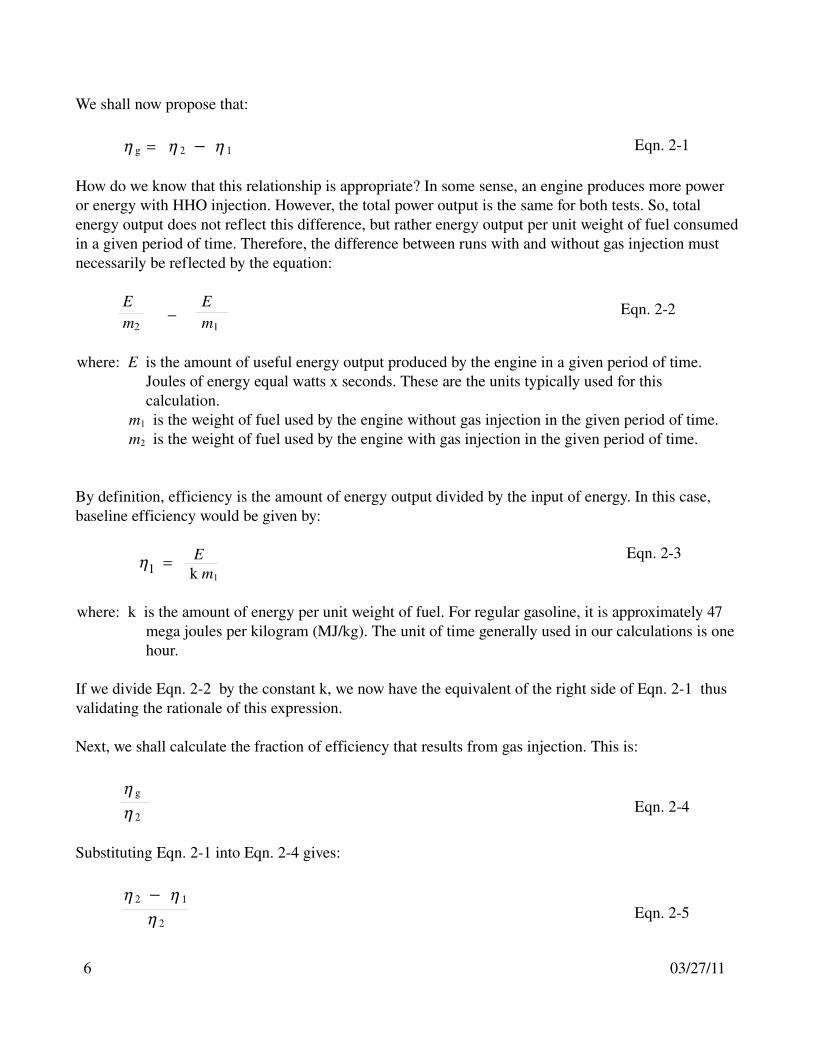
We shall now propose that:
g
How do we know that this relationship is appropriate? In some sense, an engine produces more power or energy with HHO injection. However, the total power output is the same for both tests. So, total energy output does not reflect this difference, but rather energy output per unit weight of fuel consumed in a given period of time. Therefore, the difference between runs with and without gas injection must necessarily be reflected by the equation:
E Em2 m1
where: E is the amount of useful energy output produced by the engine in a given period of time. Joules of energy equal watts x seconds. These are the units typically used for this calculation.
m1 is the weight of fuel used by the engine without gas injection in the given period of time.m2 is the weight of fuel used by the engine with gas injection in the given period of time.
By definition, efficiency is the amount of energy output divided by the input of energy. In this case, baseline efficiency would be given by:
E k m1
where: k is the amount of energy per unit weight of fuel. For regular gasoline, it is approximately 47 mega joules per kilogram (MJ/kg). The unit of time generally used in our calculations is one hour.
If we divide Eqn. 22 by the constant k, we now have the equivalent of the right side of Eqn. 21 thus validating the rationale of this expression.
Next, we shall calculate the fraction of efficiency that results from gas injection. This is:
g
Substituting Eqn. 21 into Eqn. 24 gives:
6 03/27/11
1
Eqn. 21
Eqn. 22
Eqn. 23
Eqn. 24
Eqn. 25
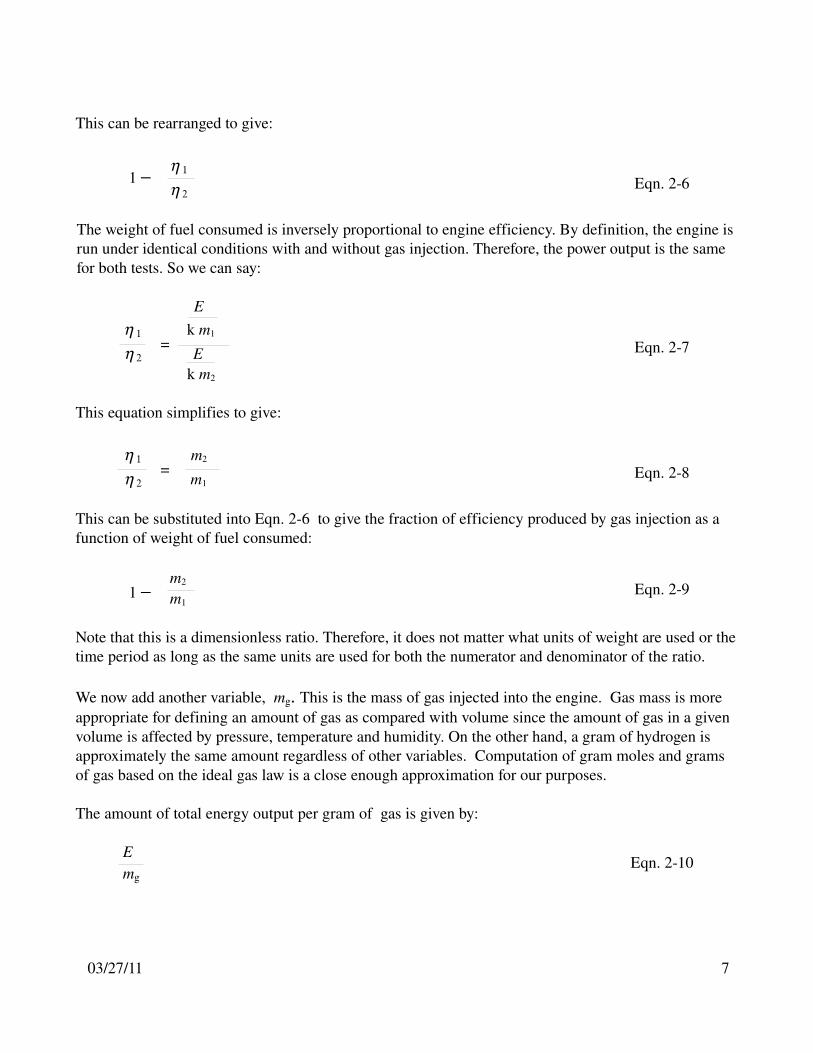
This can be rearranged to give:
The weight of fuel consumed is inversely proportional to engine efficiency. By definition, the engine is run under identical conditions with and without gas injection. Therefore, the power output is the same for both tests. So we can say:
E k m1
E k m2
This equation simplifies to give:
m2
m1
This can be substituted into Eqn. 26 to give the fraction of efficiency produced by gas injection as a function of weight of fuel consumed:
m2
m1
Note that this is a dimensionless ratio. Therefore, it does not matter what units of weight are used or the time period as long as the same units are used for both the numerator and denominator of the ratio.
We now add another variable, mg. This is the mass of gas injected into the engine. Gas mass is more appropriate for defining an amount of gas as compared with volume since the amount of gas in a given volume is affected by pressure, temperature and humidity. On the other hand, a gram of hydrogen is approximately the same amount regardless of other variables. Computation of gram moles and grams of gas based on the ideal gas law is a close enough approximation for our purposes.
The amount of total energy output per gram of gas is given by:
Emg
03/27/11 7
1
=
=
1
Eqn. 26
Eqn. 27
Eqn. 28
Eqn. 29
Eqn. 210
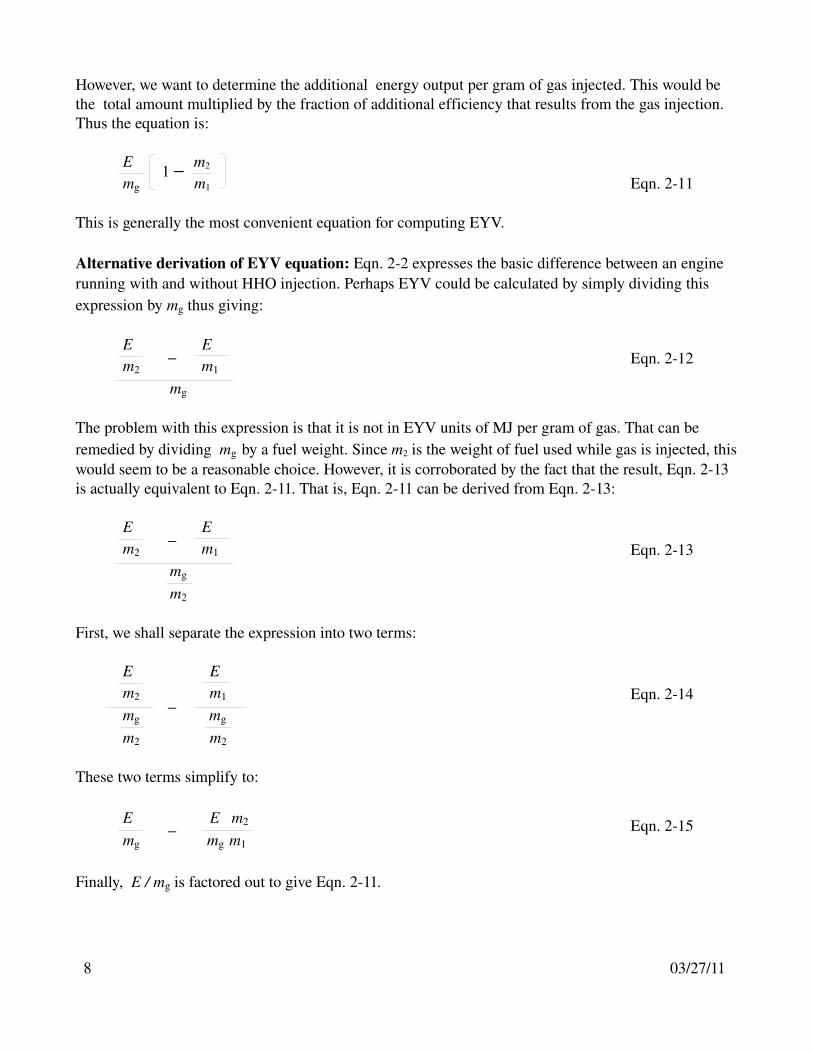
However, we want to determine the additional energy output per gram of gas injected. This would be the total amount multiplied by the fraction of additional efficiency that results from the gas injection. Thus the equation is:
E m2
mg m1
This is generally the most convenient equation for computing EYV.
Alternative derivation of EYV equation: Eqn. 22 expresses the basic difference between an engine running with and without HHO injection. Perhaps EYV could be calculated by simply dividing this expression by mg thus giving:
E Em2 m1
mg
The problem with this expression is that it is not in EYV units of MJ per gram of gas. That can be remedied by dividing mg by a fuel weight. Since m2 is the weight of fuel used while gas is injected, this would seem to be a reasonable choice. However, it is corroborated by the fact that the result, Eqn. 213 is actually equivalent to Eqn. 211. That is, Eqn. 211 can be derived from Eqn. 213:
E Em2 m1
mg
m2
First, we shall separate the expression into two terms:
E Em2 m1
mg mg
m2 m2
These two terms simplify to:
E E m2
mg mg m1
Finally, E / mg is factored out to give Eqn. 211.
8 03/27/11
1
Eqn. 211
Eqn. 212
Eqn. 213
Eqn. 214
Eqn. 215
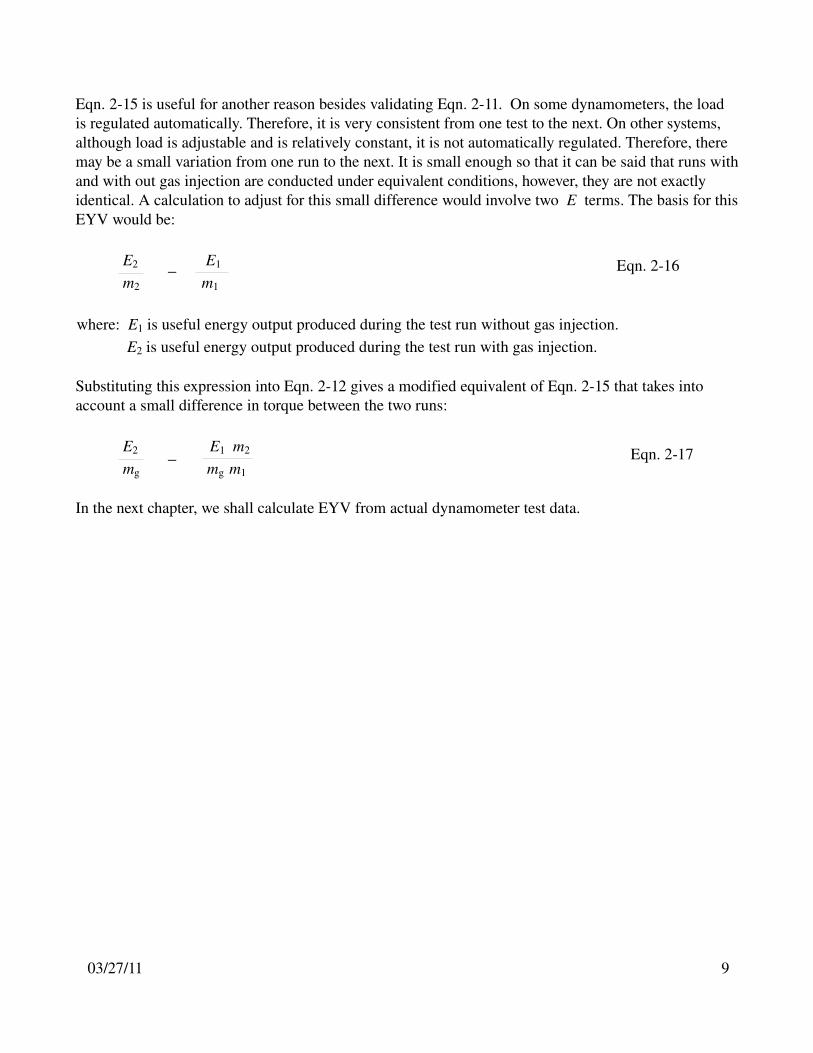
Eqn. 215 is useful for another reason besides validating Eqn. 211. On some dynamometers, the load is regulated automatically. Therefore, it is very consistent from one test to the next. On other systems, although load is adjustable and is relatively constant, it is not automatically regulated. Therefore, there may be a small variation from one run to the next. It is small enough so that it can be said that runs with and with out gas injection are conducted under equivalent conditions, however, they are not exactly identical. A calculation to adjust for this small difference would involve two E terms. The basis for this EYV would be:
E2 E1
m2 m1
where: E1 is useful energy output produced during the test run without gas injection.E2 is useful energy output produced during the test run with gas injection.
Substituting this expression into Eqn. 212 gives a modified equivalent of Eqn. 215 that takes into account a small difference in torque between the two runs:
E2 E1 m2
mg mg m1
In the next chapter, we shall calculate EYV from actual dynamometer test data.
03/27/11 9
Eqn. 216
Eqn. 217
Chapter 3. Calculation of Energy Yield Values from NASA hydrogen study data.
In 1977, a study of the effects of injection of bottled hydrogen gas on spark ignition engine performance was done at the NASA Lewis Research Center in Cleveland OH[1]. The results showed that hydrogen injection did increase engine efficiency as long as the fuelair mixture was set very lean. The best results were obtained at about 70% of the stoichiometric ratio.
This study is often cited by promoters of HHO gas generator products as proof that their products will improve gas mileage. However, calculating the energy yield value (EYV) for this data, we find it to be only about 15 kJ/gram of hydrogen. An electrolysis unit needs about 200 kJ to generate a gram of hydrogen. Therefore, the results of this study indicate that energy yields fall far short of the amount of energy needed to generate the hydrogen. Therefore, this study indicates that an HHO generator will decrease mileage if anything.
However, EYV calculated for other dynamometer tests on diesel engines with HHO generators average about 6.5 MJ/gram. This figure is really rather remarkable. It is like paying 20 cents for 6 singles and two quarters. The laws of classical physics are not usually that generous. This is about a 300 fold difference from the NASA study. Such a great difference is hard to explain using conventional rationales (e.g., flame velocity of hydrogen, increased effective compression ratio, etc) based on classical physics. This may suggest that characteristics of fresh HHO are explained by unconventional rationales that may not involve classical physics. At the very least, it indicates that further testing is needed.
10 03/27/11
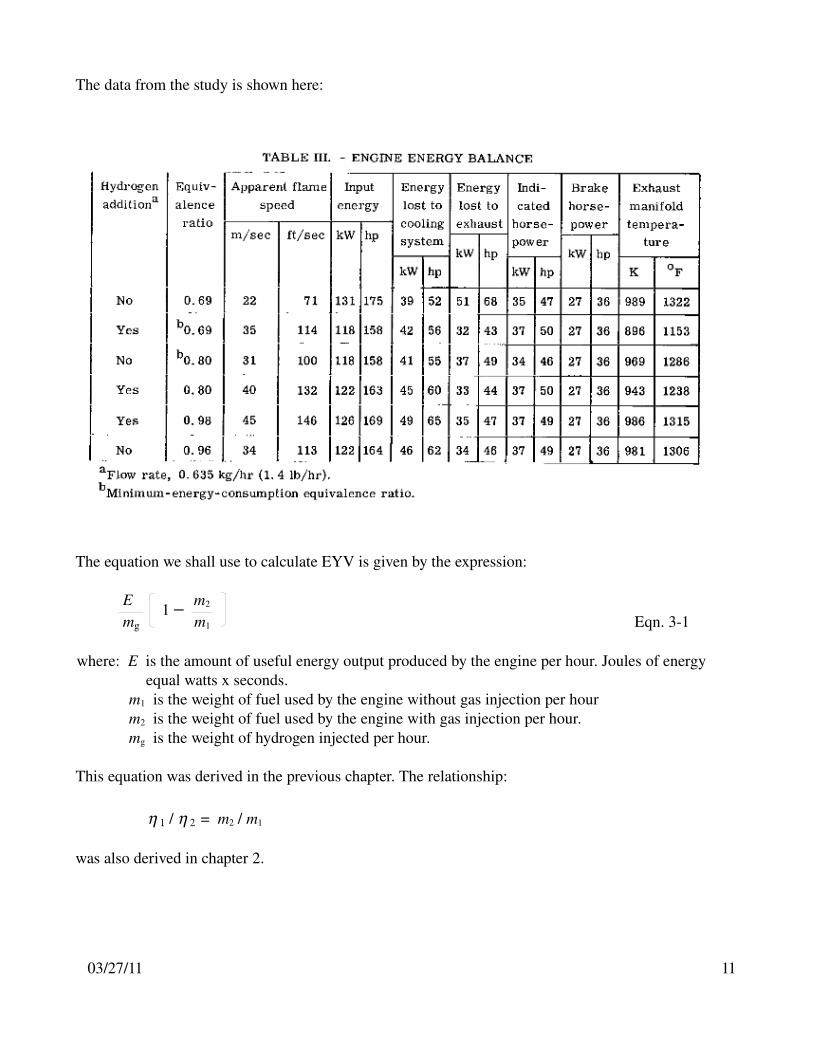
The data from the study is shown here:
The equation we shall use to calculate EYV is given by the expression:
E m2
mg m1
where: E is the amount of useful energy output produced by the engine per hour. Joules of energy equal watts x seconds.
m1 is the weight of fuel used by the engine without gas injection per hourm2 is the weight of fuel used by the engine with gas injection per hour.mg is the weight of hydrogen injected per hour.
This equation was derived in the previous chapter. The relationship:
/ = m2 / m1
was also derived in chapter 2.
03/27/11 11
1 Eqn. 31
So / can be calculated from the input power values that are given. Efficiency equals output power divided by input power. Therefore,
/
Hydrogen injection rate is given as 635 grams/hr.
The time unit is one hour. Therefore, energy output is 27 kW x 3600 sec. = 97.2 MJ.
Substituting these values into Eqn. 31 gives :
(1 – 0.9008) x 97.2 MJ / 635 = 15.19 kJ/gram
In the next chapter, we shall calculate EYV for tests on a diesel engine done in Oshkosh, WI. at the Fabtech training center of Fox Valley Technical College.
12 03/27/11
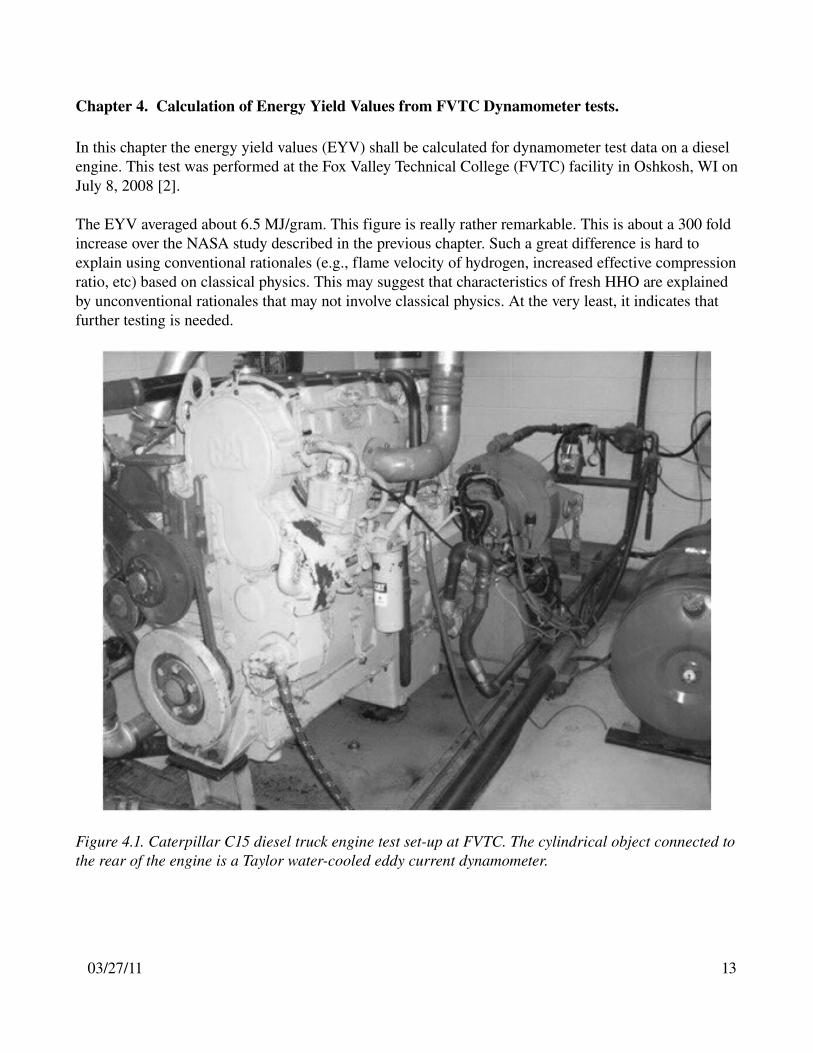
Chapter 4. Calculation of Energy Yield Values from FVTC Dynamometer tests.
In this chapter the energy yield values (EYV) shall be calculated for dynamometer test data on a diesel engine. This test was performed at the Fox Valley Technical College (FVTC) facility in Oshkosh, WI on July 8, 2008 [2].
The EYV averaged about 6.5 MJ/gram. This figure is really rather remarkable. This is about a 300 fold increase over the NASA study described in the previous chapter. Such a great difference is hard to explain using conventional rationales (e.g., flame velocity of hydrogen, increased effective compression ratio, etc) based on classical physics. This may suggest that characteristics of fresh HHO are explained by unconventional rationales that may not involve classical physics. At the very least, it indicates that further testing is needed.
Figure 4.1. Caterpillar C15 diesel truck engine test setup at FVTC. The cylindrical object connected to the rear of the engine is a Taylor watercooled eddy current dynamometer.
03/27/11 13
In this series of tests, the engine was run over a wide range of speeds and loads so a considerable range of EYV can be calculated. Unfortunately, all testing was done on a single day. The engine was run at a given load and RPM for 5 to 10 minutes. The fuel container was weighed before and after each run.
During runs at 25% load, the current of the HHO generator seems to be ramping up. Perhaps, time was so limited that they did not give the HHO generator a chance to reach an equilibrium temperature. This may explain a negative yield value on the first run with HHO.
These yield estimates are approximate. It appears that engine speed could be controlled by a feedback loop. Although, torque was adjustable on this dynamometer, it appears that it was not regulated, that is, the pressure on the brake was not automatically regulated by the torque measurement. Torque values differ a bit from one run to the next. Therefore, Eqn. 16 from the first chapter is used to calculate EYV.
None of these considerations alter the fact that the average EYV is very much larger than what would be expected based on conventional rationales.
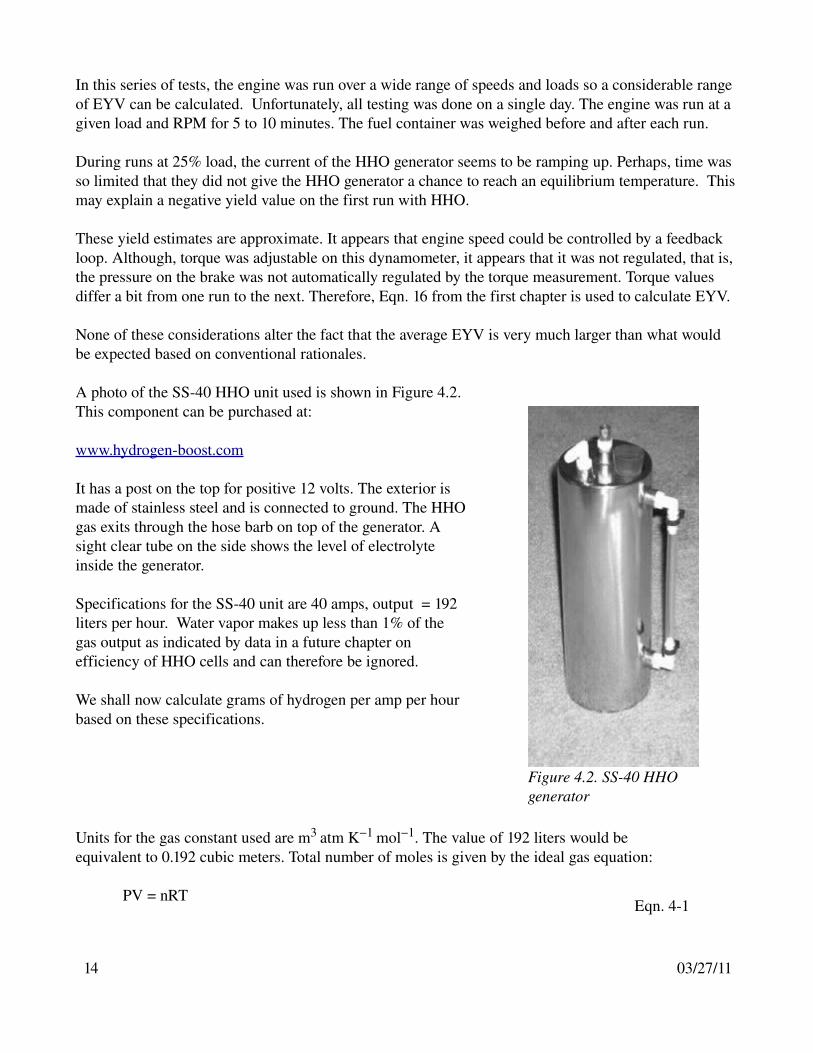
A photo of the SS40 HHO unit used is shown in Figure 4.2. This component can be purchased at:
www.hydrogenboost.com
It has a post on the top for positive 12 volts. The exterior is made of stainless steel and is connected to ground. The HHO gas exits through the hose barb on top of the generator. A sight clear tube on the side shows the level of electrolyte inside the generator.
Specifications for the SS40 unit are 40 amps, output = 192 liters per hour. Water vapor makes up less than 1% of the gas output as indicated by data in a future chapter on efficiency of HHO cells and can therefore be ignored.
We shall now calculate grams of hydrogen per amp per hour based on these specifications.
Units for the gas constant used are m3 atm K−1 mol −1. The value of 192 liters would be equivalent to 0.192 cubic meters. Total number of moles is given by the ideal gas equation:
PV = nRT
14 03/27/11
Figure 4.2. SS40 HHO generator
Eqn. 41
where P = pressure in atmospheres, i.e., 1V = volume, 0.192 cu. meters in this casen = number of gram moles of gasR = the ideal gas constant, about 8.205 x 10 5 T = temperature in degrees Kelvin, i.e., 25 degrees C or 298 degrees Kelvin
Solving for n = PV / RT to give the total number of gram moles: 7.85.
The number of gram moles of hydrogen gas is 2/3 this amount since HHO is a mixture of H2 + ½ O2 . Number of moles of H2 is therefore 7.85 x 2 / 3 = 5.23.
Standard atomic weight of hydrogen is 1.01. Therefore, the molecular weight of H2 is twice this amount or 2.02 grams per mole.
Moles x mol. wt. gives grams of gas which equals 10.55.
Finally, grams per hour per amp equals 10.55 / 40 amps which equals 0.26.
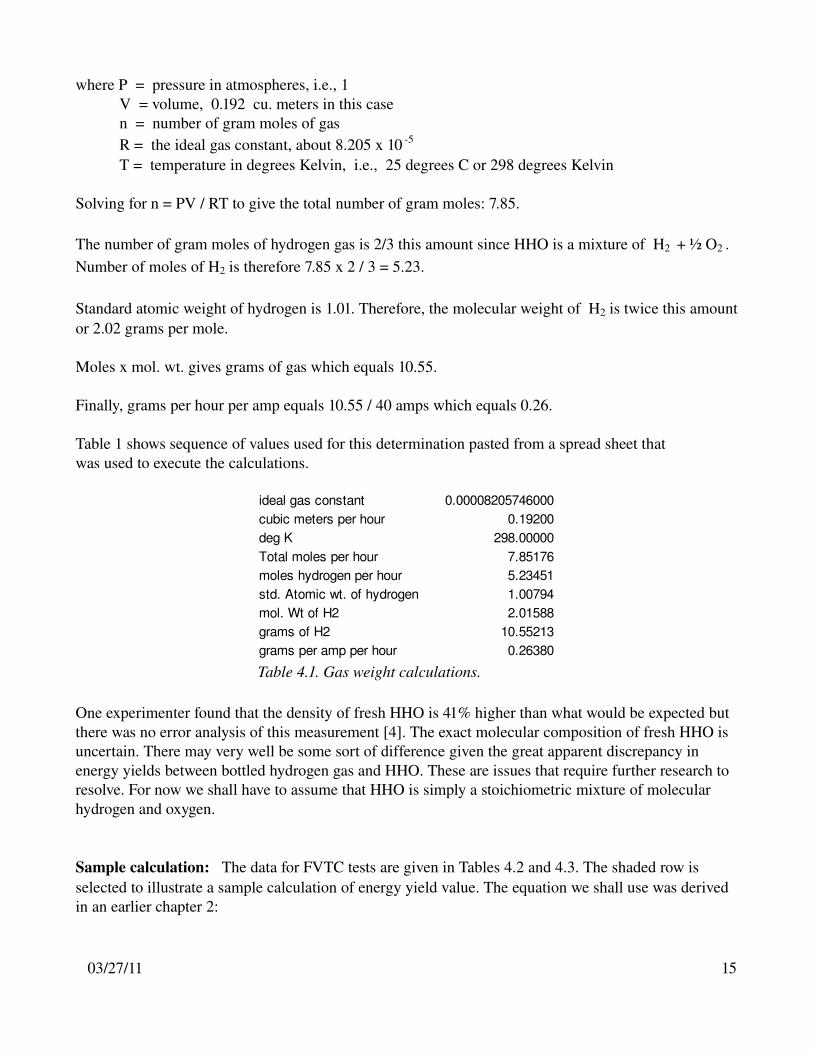
Table 1 shows sequence of values used for this determination pasted from a spread sheet that was used to execute the calculations.
One experimenter found that the density of fresh HHO is 41% higher than what would be expected but there was no error analysis of this measurement [4]. The exact molecular composition of fresh HHO is uncertain. There may very well be some sort of difference given the great apparent discrepancy in energy yields between bottled hydrogen gas and HHO. These are issues that require further research to resolve. For now we shall have to assume that HHO is simply a stoichiometric mixture of molecular hydrogen and oxygen.
Sample calculation: The data for FVTC tests are given in Tables 4.2 and 4.3. The shaded row is selected to illustrate a sample calculation of energy yield value. The equation we shall use was derived in an earlier chapter 2:
03/27/11 15
Table 4.1. Gas weight calculations.
ideal gas constant 0.00008205746000cubic meters per hour 0.19200deg K 298.00000Total moles per hour 7.85176moles hydrogen per hour 5.23451std. Atomic wt. of hydrogen 1.00794mol. Wt of H2 2.01588grams of H2 10.55213grams per amp per hour 0.26380
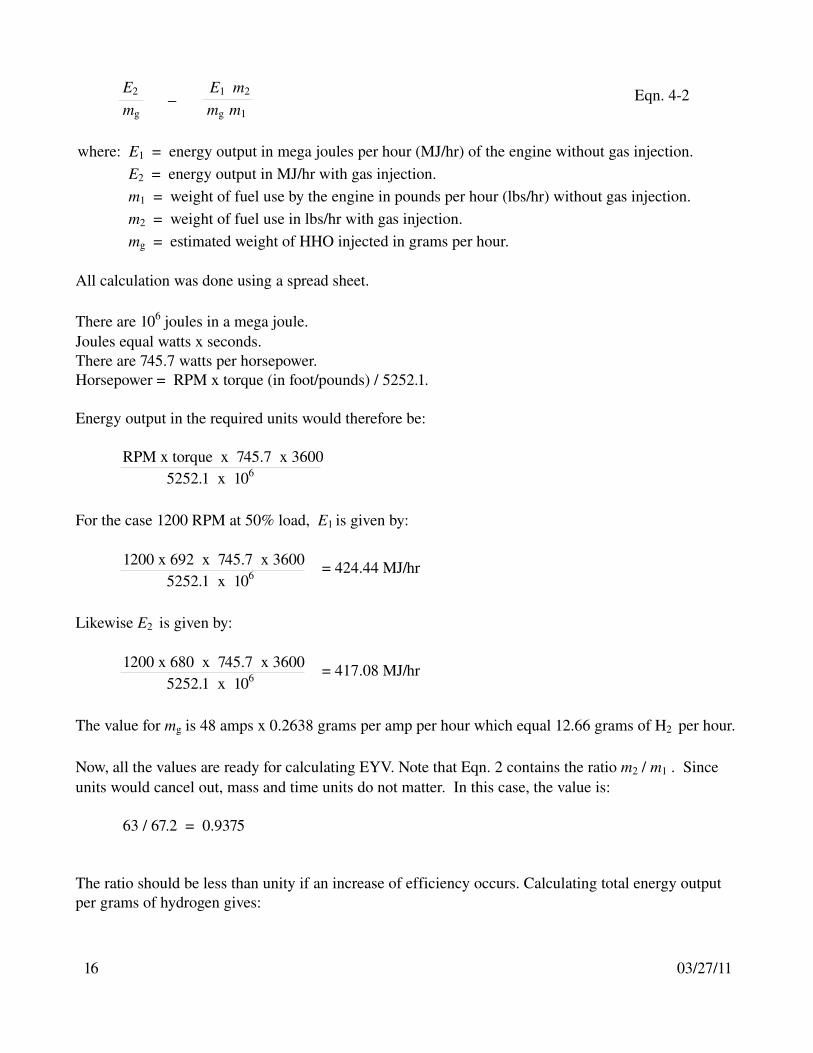
E2 E1 m2
mg mg m1
where: E1 = energy output in mega joules per hour (MJ/hr) of the engine without gas injection.E2 = energy output in MJ/hr with gas injection.m1 = weight of fuel use by the engine in pounds per hour (lbs/hr) without gas injection.m2 = weight of fuel use in lbs/hr with gas injection.mg = estimated weight of HHO injected in grams per hour.
All calculation was done using a spread sheet.
There are 106 joules in a mega joule.Joules equal watts x seconds. There are 745.7 watts per horsepower. Horsepower = RPM x torque (in foot/pounds) / 5252.1.
Energy output in the required units would therefore be:
RPM x torque x 745.7 x 3600 5252.1 x 106
For the case 1200 RPM at 50% load, E1 is given by:
1200 x 692 x 745.7 x 3600 5252.1 x 106
Likewise E2 is given by:
1200 x 680 x 745.7 x 3600 5252.1 x 106
The value for mg is 48 amps x 0.2638 grams per amp per hour which equal 12.66 grams of H2 per hour.
Now, all the values are ready for calculating EYV. Note that Eqn. 2 contains the ratio m2 / m1 . Since units would cancel out, mass and time units do not matter. In this case, the value is:
63 / 67.2 = 0.9375
The ratio should be less than unity if an increase of efficiency occurs. Calculating total energy output per grams of hydrogen gives:
16 03/27/11
Eqn. 42
= 424.44 MJ/hr
= 417.08 MJ/hr
E2 E1
mg mg
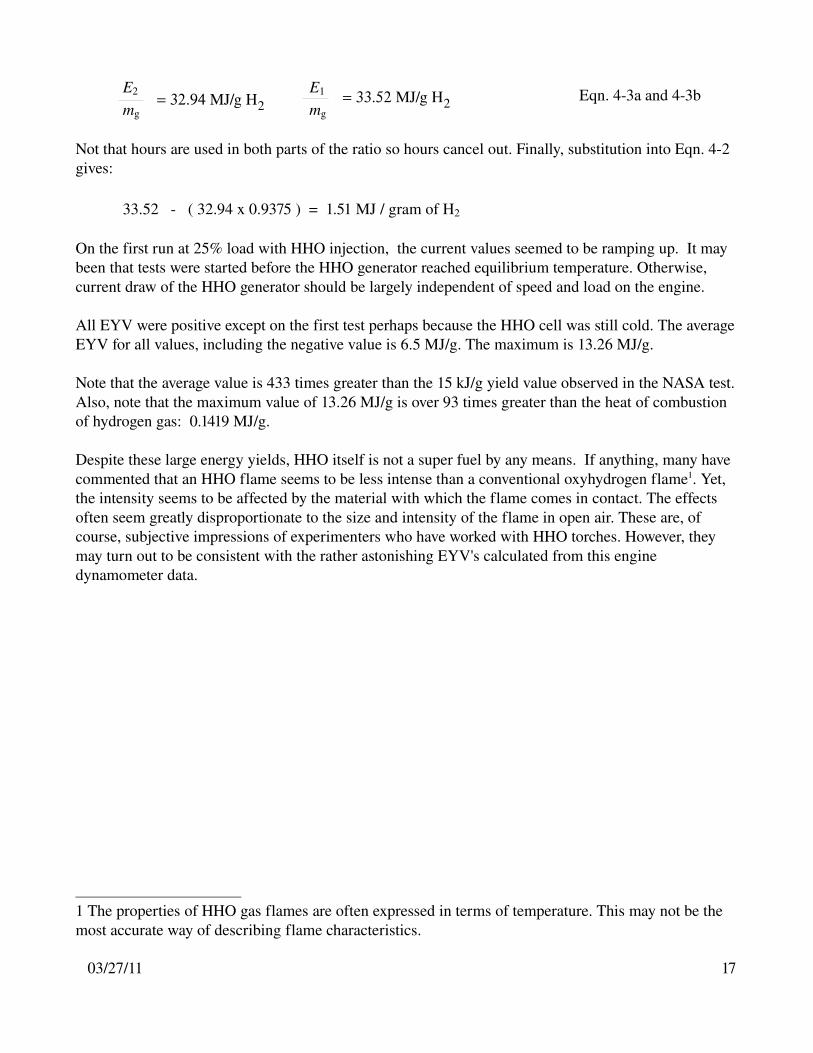
Not that hours are used in both parts of the ratio so hours cancel out. Finally, substitution into Eqn. 42 gives:
33.52 ( 32.94 x 0.9375 ) = 1.51 MJ / gram of H2
On the first run at 25% load with HHO injection, the current values seemed to be ramping up. It may been that tests were started before the HHO generator reached equilibrium temperature. Otherwise, current draw of the HHO generator should be largely independent of speed and load on the engine.
All EYV were positive except on the first test perhaps because the HHO cell was still cold. The average EYV for all values, including the negative value is 6.5 MJ/g. The maximum is 13.26 MJ/g.
Note that the average value is 433 times greater than the 15 kJ/g yield value observed in the NASA test. Also, note that the maximum value of 13.26 MJ/g is over 93 times greater than the heat of combustion of hydrogen gas: 0.1419 MJ/g.
Despite these large energy yields, HHO itself is not a super fuel by any means. If anything, many have commented that an HHO flame seems to be less intense than a conventional oxyhydrogen flame1. Yet, the intensity seems to be affected by the material with which the flame comes in contact. The effects often seem greatly disproportionate to the size and intensity of the flame in open air. These are, of course, subjective impressions of experimenters who have worked with HHO torches. However, they may turn out to be consistent with the rather astonishing EYV's calculated from this engine dynamometer data.
1 The properties of HHO gas flames are often expressed in terms of temperature. This may not be the most accurate way of describing flame characteristics.
03/27/11 17
Eqn. 43a and 43bMJ/g H2 MJ/g H2
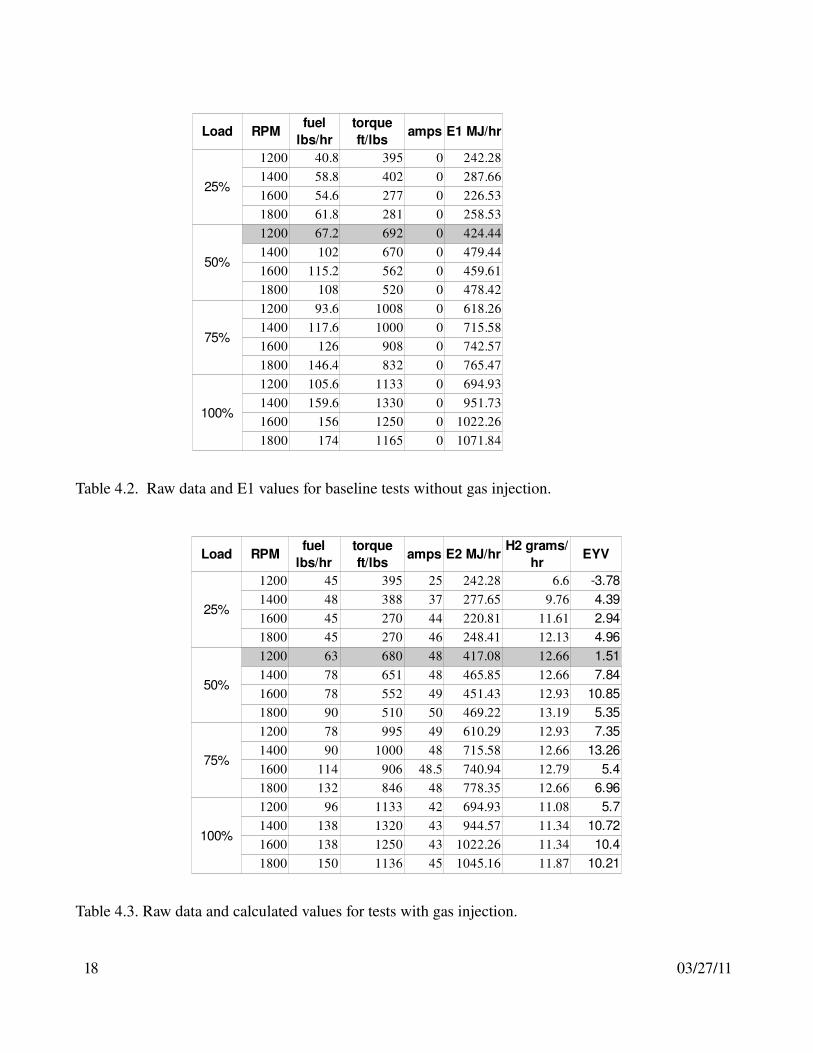
Table 4.2. Raw data and E1 values for baseline tests without gas injection.
Table 4.3. Raw data and calculated values for tests with gas injection.
18 03/27/11
Load RPM amps E1 MJ/hr
25%
1200 40.8 395 0 242.281400 58.8 402 0 287.661600 54.6 277 0 226.531800 61.8 281 0 258.53
50%
1200 67.2 692 0 424.441400 102 670 0 479.441600 115.2 562 0 459.611800 108 520 0 478.42
75%
1200 93.6 1008 0 618.261400 117.6 1000 0 715.581600 126 908 0 742.571800 146.4 832 0 765.47
100%
1200 105.6 1133 0 694.931400 159.6 1330 0 951.731600 156 1250 0 1022.261800 174 1165 0 1071.84
fuel lbs/hr
torque ft/lbs
Load RPM amps E2 MJ/hr EYV
25%
1200 45 395 25 242.28 6.6 3.781400 48 388 37 277.65 9.76 4.391600 45 270 44 220.81 11.61 2.941800 45 270 46 248.41 12.13 4.96
50%
1200 63 680 48 417.08 12.66 1.511400 78 651 48 465.85 12.66 7.841600 78 552 49 451.43 12.93 10.851800 90 510 50 469.22 13.19 5.35
75%
1200 78 995 49 610.29 12.93 7.351400 90 1000 48 715.58 12.66 13.261600 114 906 48.5 740.94 12.79 5.41800 132 846 48 778.35 12.66 6.96
100%
1200 96 1133 42 694.93 11.08 5.71400 138 1320 43 944.57 11.34 10.721600 138 1250 43 1022.26 11.34 10.41800 150 1136 45 1045.16 11.87 10.21
fuel lbs/hr
torque ft/lbs
H2 grams/hr
These tests were sponsored by Fran Giroux, owner of the Hydrogen Boost. In evaluating study, we contacted Mr. Giroux as well as staff at Fox Valley Technical College. We did obtain independent verification that these test were conducted as described. There were quality problems with the evaluation so the results cannot be considered entirely definitive. They are presented here as an example of results that could very possibly be achieved if a definitive evaluation were performed.
To perform what would considered a “definitive” evaluation would require that researchers follow rationales typically used by scientists and engineers to validate experimental data. An evaluation of repeatability and reproducibility (R&R) should be performed. In this case:
1. Repeatability should be evaluated to ensure that the size of data sets is adequate to ensure that determinations made from analysis of the data are statistically significant.
2. Reproducibility should be evaluated. A set of operating conditions that would generally be considered “normal” should be clearly defined and it should be verified that corresponding conditions where measurements are taken with and without gas injection are statistically equivalent to normal or normalized operating conditions. For example, one might take measurements without gas injection when the engine is cold. Then they might take measurements with gas injection after the engine has warmed up. A diesel engine is much more efficient when it is hot, therefore these results would be skewed towards higher yields due to a lack of reproducibility of the evaluation.
We are currently aware of other tests that were conducted at Purdue University and University of Northwest Ohio. The tests at Purdue could not be independently verifed. The UNO evaluation appears to be of better quality and it can probably be independently verified. As of the date of this document, however, we have not had a chance to research it.
03/27/11 19
Appendix A.
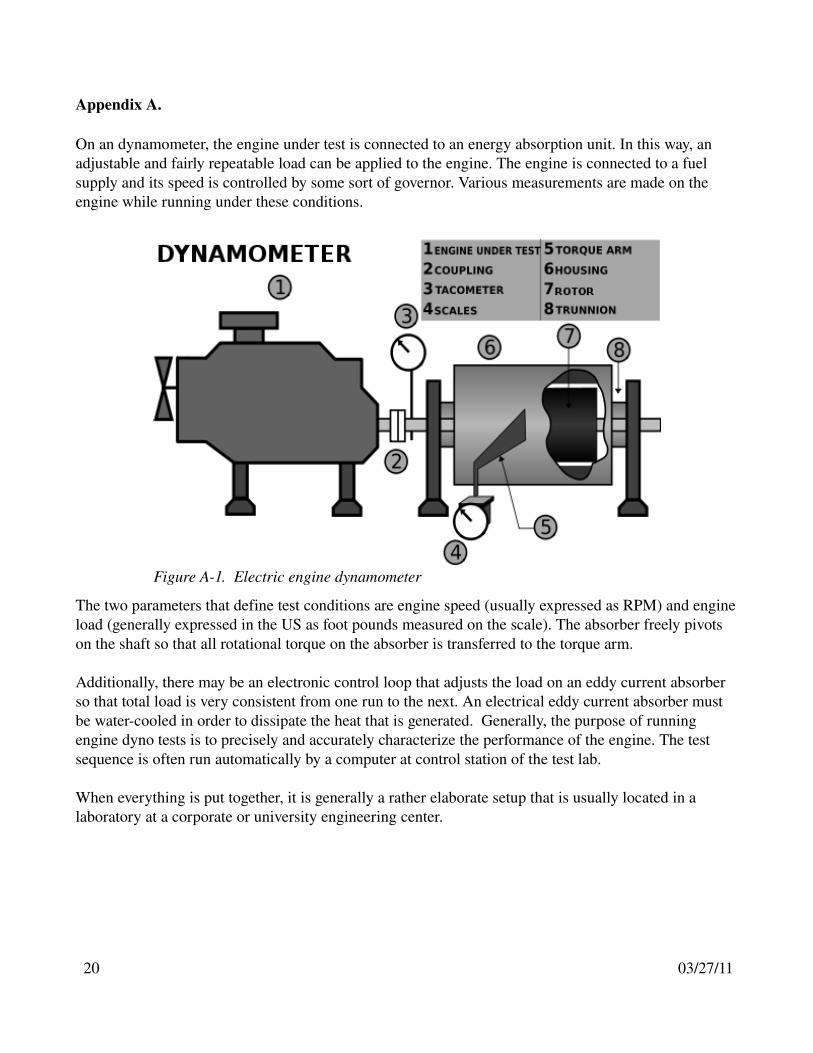
On an dynamometer, the engine under test is connected to an energy absorption unit. In this way, an adjustable and fairly repeatable load can be applied to the engine. The engine is connected to a fuel supply and its speed is controlled by some sort of governor. Various measurements are made on the engine while running under these conditions.
The two parameters that define test conditions are engine speed (usually expressed as RPM) and engine load (generally expressed in the US as foot pounds measured on the scale). The absorber freely pivots on the shaft so that all rotational torque on the absorber is transferred to the torque arm.
Additionally, there may be an electronic control loop that adjusts the load on an eddy current absorber so that total load is very consistent from one run to the next. An electrical eddy current absorber must be watercooled in order to dissipate the heat that is generated. Generally, the purpose of running engine dyno tests is to precisely and accurately characterize the performance of the engine. The test sequence is often run automatically by a computer at control station of the test lab.
When everything is put together, it is generally a rather elaborate setup that is usually located in a laboratory at a corporate or university engineering center.
20 03/27/11
Figure A1. Electric engine dynamometer
The formula that is generally used to calculate power output of an engine is:
RPM x torque (foot pounds) / 5252.113 = Horsepower output (brake HP)
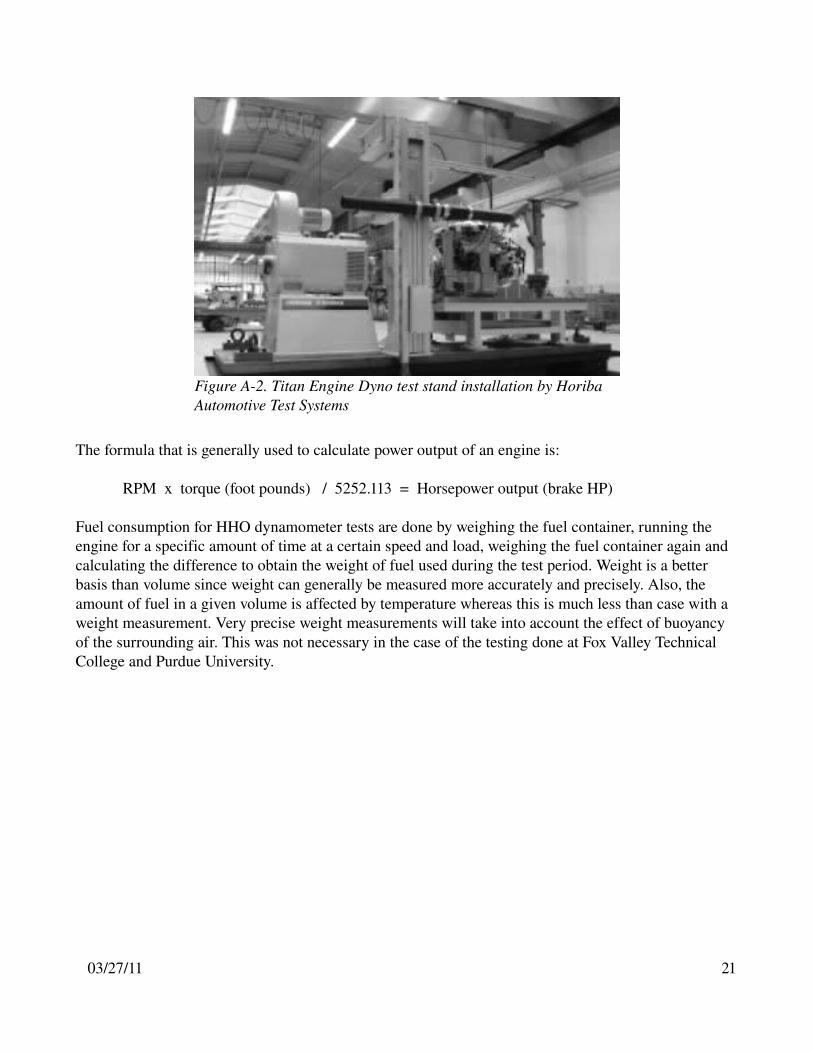
Fuel consumption for HHO dynamometer tests are done by weighing the fuel container, running the engine for a specific amount of time at a certain speed and load, weighing the fuel container again and calculating the difference to obtain the weight of fuel used during the test period. Weight is a better basis than volume since weight can generally be measured more accurately and precisely. Also, the amount of fuel in a given volume is affected by temperature whereas this is much less than case with a weight measurement. Very precise weight measurements will take into account the effect of buoyancy of the surrounding air. This was not necessary in the case of the testing done at Fox Valley Technical College and Purdue University.
03/27/11 21
Figure A2. Titan Engine Dyno test stand installation by Horiba Automotive Test Systems

References
1. NASA Technical Note, May 1977, "Emissions and Total Energy Consumption of a Multicylinder Piston Engine Running on Gasoline and a HydrogenGasoline Mixture”
2. Fox Valley Technical College Dynamometer Test Analysis http://www.hydrogenboost.com/August%202008.html
22 03/27/11