Embed Size (px)
Citation preview
ANNUAL REPORT
2015
ENGEN BOTSWANA LIMITED
2
ENGEN BOTSWANA LIMITED | ANNUAL REPORT 2015
CONTENTSENGEN BOTSWANA LIMITED | ANNUAL REPORT 2015
CONTENTS
0102
0304
Financial Highlights 01About Engen 02Presence 03
INTRODUCTION
Board of Directors 05Chairman’s Report 07Managing Director’s Report 09Financial Results 11Financial Summury 12
COMMENTARY
Sustainablity Report 15Commercial ReportProperty Report 19Distribution 20Retail Results 21Human Resources 23Corporate Social Responsibility Report 24
SECTORS
Governance 25Management 27Five Year Reveiw 28
GOVERNANCE
05ANNUALCONSOLIDATED FINANCIALSTATEMENTS
ENGEN BOTSWANA LIMITED | ANNUAL REPORT 2015
3
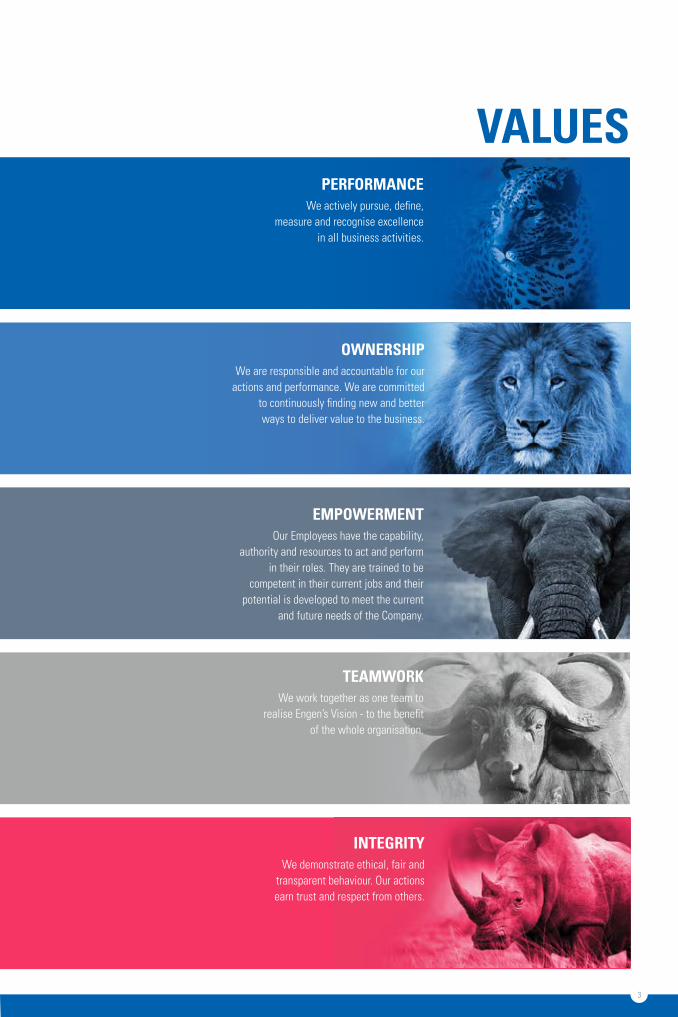
VALUESPERFORMANCE
We actively pursue, define, measure and recognise excellence
in all business activities.
OWNERSHIPWe are responsible and accountable for our
actions and performance. We are committed to continuously finding new and better ways to deliver value to the business.
EMPOWERMENTOur Employees have the capability,
authority and resources to act and perform in their roles. They are trained to be
competent in their current jobs and their potential is developed to meet the current
and future needs of the Company.
TEAMWORKWe work together as one team to
realise Engen’s Vision - to the benefit of the whole organisation.
INTEGRITYWe demonstrate ethical, fair and
transparent behaviour. Our actions earn trust and respect from others.
1
ENGEN BOTSWANA LIMITED | ANNUAL REPORT 2015ENGEN BOTSWANA LIMITED | ANNUAL REPORT 2015
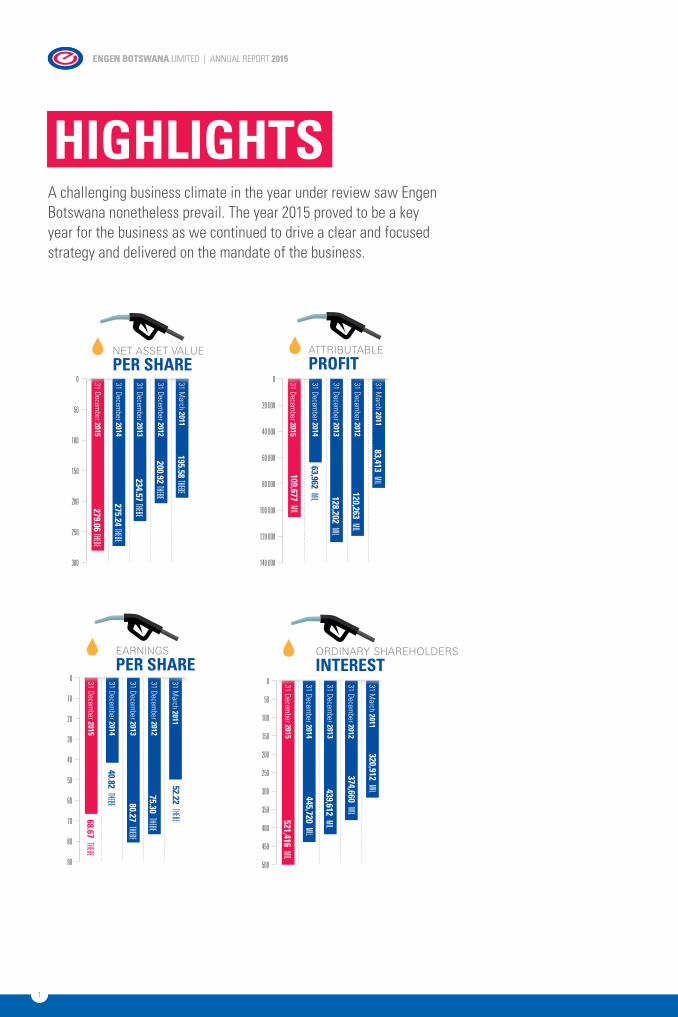
HIGHLIGHTS
Net Asset VAluePER SHARE
AttributAblePROFIT
31 December 2015
31 December 2014
31 December 2013
31 December 2012
31 March 2011
0
20 000
40 000
80 000
140 000
60 000
120 000
100 000
109,677 mil
63,962 mil 128,202 mil
120,263 mil
83,413 mil
31 December 2015
31 December 2014
31 December 2013
31 December 2012
31 March 2011
0
50
100
200
300
150
250
279.06 ThEbE
275.24 ThEbE
234.57 ThEbE
200.92 ThEbE
195.58 ThEbE
500
450
OrdiNAry shArehOldersINTEREST
31 December 2015
31 December 2014
31 December 2013
31 December 2012
31 March 2011
0
50
150
100
350
300
250
200
400
521,416 mil
445,720 mil
439,612 mil
374,660 mil
320,912 mil
eArNiNgsPER SHARE
31 December 2015
31 December 2014
31 December 2013
31 December 2012
31 March 2011
0
20
10
30
50
90
80
40
70
60
68.67 ThEbE
40.82 ThEbE 80.27 ThEbE
75.30 ThEbE
52.22 ThEbE
A challenging business climate in the year under review saw Engen Botswana nonetheless prevail. The year 2015 proved to be a key year for the business as we continued to drive a clear and focused strategy and delivered on the mandate of the business.
2
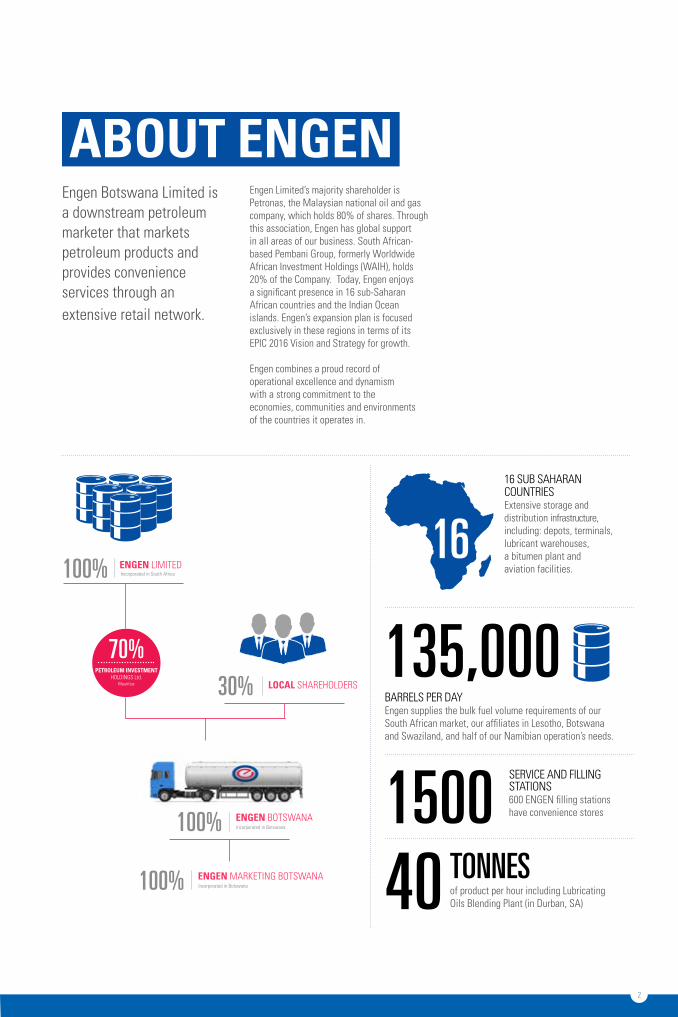
Engen Limited’s majority shareholder is Petronas, the Malaysian national oil and gas company, which holds 80% of shares. Through this association, Engen has global support in all areas of our business. South African-based Pembani Group, formerly Worldwide African Investment Holdings (WAIH), holds 20% of the Company. Today, Engen enjoys a significant presence in 16 sub-Saharan African countries and the Indian Ocean islands. Engen’s expansion plan is focused exclusively in these regions in terms of its EPIC 2016 Vision and Strategy for growth.
Engen combines a proud record of operational excellence and dynamism with a strong commitment to the economies, communities and environments of the countries it operates in.
Engen Botswana Limited is a downstream petroleum marketer that markets petroleum products and provides convenience services through an extensive retail network.
ABOUT ENGEN
100% ENGEN LIMITEDIncorporated in South Africa
70%PETROLEUM INVESTMENT
HOLDINGS Ltd.Mauritius
100% ENGEN BOTSWANAIncorporated in Botswana
30% LOCAL SHAREHOLDERS
100% ENGEN MARKETING BOTSWANAIncorporated in Botswana
1616 SUB SAHARAN COUNTRIESExtensive storage and distribution infrastructure, including: depots, terminals, lubricant warehouses,a bitumen plant and aviation facilities.
135,000BARRELS PER DAYEngen supplies the bulk fuel volume requirements of our South African market, our affiliates in Lesotho, Botswana and Swaziland, and half of our Namibian operation’s needs.
1500SERVICE AND FILLING STATIONS600 ENGEN filling stations have convenience stores
40 TONNESof product per hour including Lubricating Oils Blending Plant (in Durban, SA)
3
ENGEN BOTSWANA LIMITED | ANNUAL REPORT 2015ENGEN BOTSWANA LIMITED | ANNUAL REPORT 2015
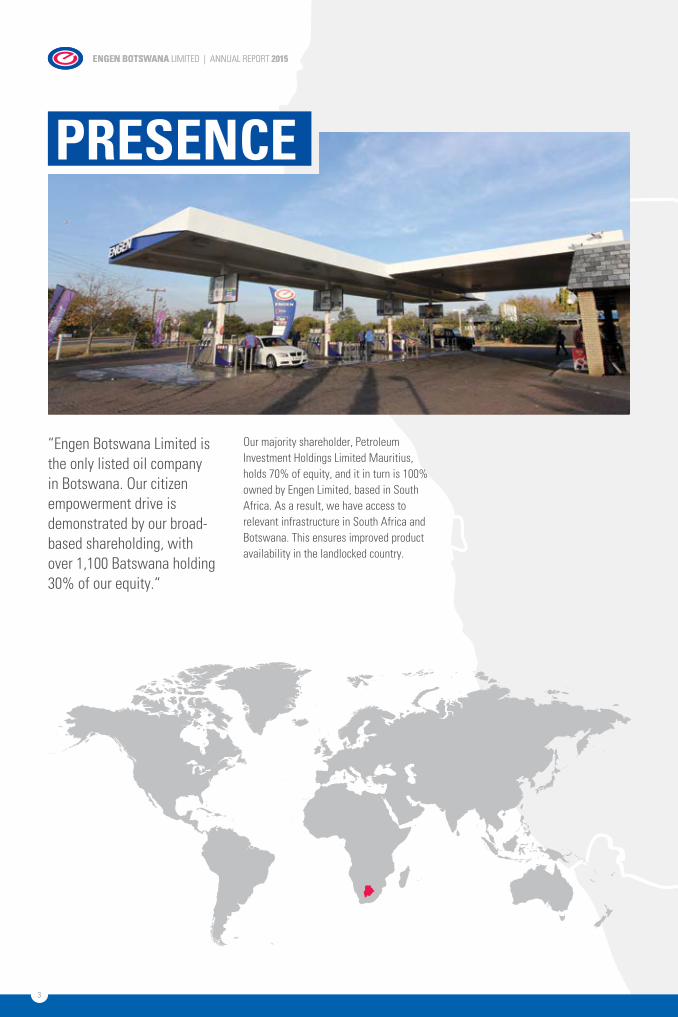
PRESENCE
“Engen Botswana Limited is the only listed oil company in Botswana. Our citizen empowerment drive is demonstrated by our broad-based shareholding, with over 1,100 Batswana holding 30% of our equity.“
Our majority shareholder, Petroleum Investment Holdings Limited Mauritius, holds 70% of equity, and it in turn is 100% owned by Engen Limited, based in South Africa. As a result, we have access to relevant infrastructure in South Africa and Botswana. This ensures improved product availability in the landlocked country.
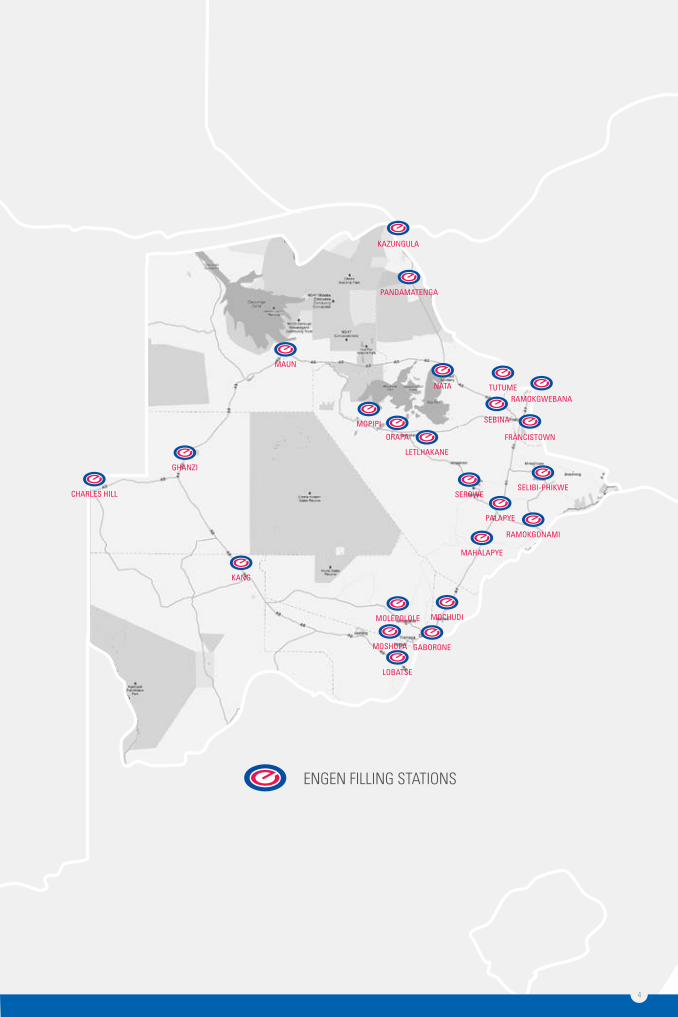
ENGEN FILLING STATIONS
KAZUNGULA
RAMOKGWEBANA
SEBINA
FRANCISTOWN
NATA
MAUN
CHARLES HILL
GHANZI
KANG
MOLEPOLOLE
MAHALAPYE
RAMOKGONAMI
PALAPYE
SELIBI-PHIKWESEROWE
MOPIPI
ORAPA
LETLHAKANE
TUTUME
LOBATSE
MOCHUDI
GABORONE
4
MOSHUPA
PANDAMATENGA

5
ENGEN BOTSWANA LIMITED | ANNUAL REPORT 2015ENGEN BOTSWANA LIMITED | ANNUAL REPORT 2015
DIRECTORS
Shabani is an experienced leader, administrator and academic with over 30 years of work experience. In 2011, he was appointed Deputy Vice Chancellor of Botswana International University of Science and Technology (BIUST), where he was in charge of finance and administration. He executed a similar role at the University of Botswana and previously headed the Business Faculty at that institution. Shabani is a member of several Boards, including Botswana Accountancy College, the Institute of Development Management, and TA Shebube (Proprietary) Limited. He is a former Board Member of Botswana Development Corporation, the University of Botswana and BIUST.
SHABANI NDZINGE (CHAIRMAN)Independent Non-Executive DirectorBA, Dar Es Salaam; MS, Delaware; PhD, Kent
Chimweta studied Accounting and Finance at the University of Zambia and worked briefly as a computer programmer before joining first Citibank and then Caltex. He was rapidly promoted to Managing Director of Caltex Zambia before joining Chevron as a Regional Manager for Commercial Business in Chevron’s associated companies based in South Africa. Chimweta was appointed Managing Director of Engen Botswana in 2012, and has over 25 years’ experience in the oil industry in Southern Africa.
CHIMWETA MONGA (MANAGING DIRECTOR) Executive DirectorMBA University of Lincolnshire and Humberside (UK), Bachelor of Accounting and Finance (Zambia)
Vhulahani joined Engen Petroleum as a Senior Tax Analyst in 2001. He has since been promoted to Trading Manager for Southern Africa. He is responsible for managing Engen’s trading portfolio for all its African affiliates and the marine fuels business in South Africa. He has extensive experience in trading, supply and tax.
VHULAHANI BVUMBINon-Executive DirectorBCom, University of the North; Higher Diploma in Tax Law, UCT
Chwayita has 15 years’ experience in HR and management roles. She is currently the Organisation Development Manager at Engen Petroleum Limited, responsible for managing the learning and development function for Engen and its affiliates in Sub-Saharan Africa. She joined Engen as its Talent Development Manager in 2011, having spent 6 years in various HR roles with the Coega Development Corporation.
CHWAYITA MAREKANon-Executive DirectorChartered HR Practitioner (CHRP); National Diploma in Public Management and Administration, Border Technikon; Management Development Programme (MDP), University of South Africa; Master of Business Administration (MBA), University of South Africa
Directors of Engen Botswana continued to focus on ensuring the business mandate was delivered upon, providing strategic direction at every turn.

6
Anthony has extensive experience in developing and formulating business strategy, economics and finance. He has worked in private equity, venture capital, investment banking, corporate finance and managing consulting, and has developed a thorough understanding of the Southern African region. He is the founder and Managing Director of private equity fund
manager VPB (Proprietary) Limited and founded corporate finance company AMS Capital. He sits on various Boards in Botswana and in the region, including the South African Venture Capital Association and the African Venture Capital
Association. He is a sought-after speaker throughout Africa and the United States.
ANTHONY SIWAWAIndependent Non-Executive Director
BSc Hons, Aston; MBA, Chicago
Frederik is a Director of three Petronas subsidiaries in Malaysia; namely Petronas Ethylene Malaysia, Petronas Polyethylene Malaysia, and Petronas Polypropylene Malaysia. He joined Engen Petroleum in 1993 as a retail pricing executive and has
served in various capacities throughout the group. He is currently the General Manager of the International Business Division.
FREDERIK KOTZENon-Executive Director
Business Science Hons, Stellenbosch: MBA Stellenbosch
Andrew worked briefly as a research chemist before becoming a Chartered Accountant. He joined Engen in 1988 as an internal auditor and has held various positions within the group. He was appointed General Manager for Finance in 2010. His
background in chemistry, coupled with his extensive knowledge of Engen’s business, make him a valued Board Member for Engen Botswana.
ANDREW BRYCENon-Executive Director
BSc University of Natal-Pietermaritzburg. BSc Hons, Stellenbosch, BCompt Hons, UCT; CA (SA)
Robert serves as Chairman on several audit committees of private and public companies, and acts as an Independent Non-Executive Board Member. A retired partner of PricewaterhouseCoopers Gaborone, in charge of audit and business advisory
services, he has gained extensive professional and commercial experience in audit, taxation and business services. He currently offers consulting and advisory services to various organisations.
ROBERT MATTHEWSIndependent Non-Executive Director
Fellow: Botswana Institute of Chartered Accountants (BICA); Fellow: Institute of Chartered Accountants in England and Wales (ICAEW)
7
ENGEN BOTSWANA LIMITED | ANNUAL REPORT 2015ENGEN BOTSWANA LIMITED | ANNUAL REPORT 2015
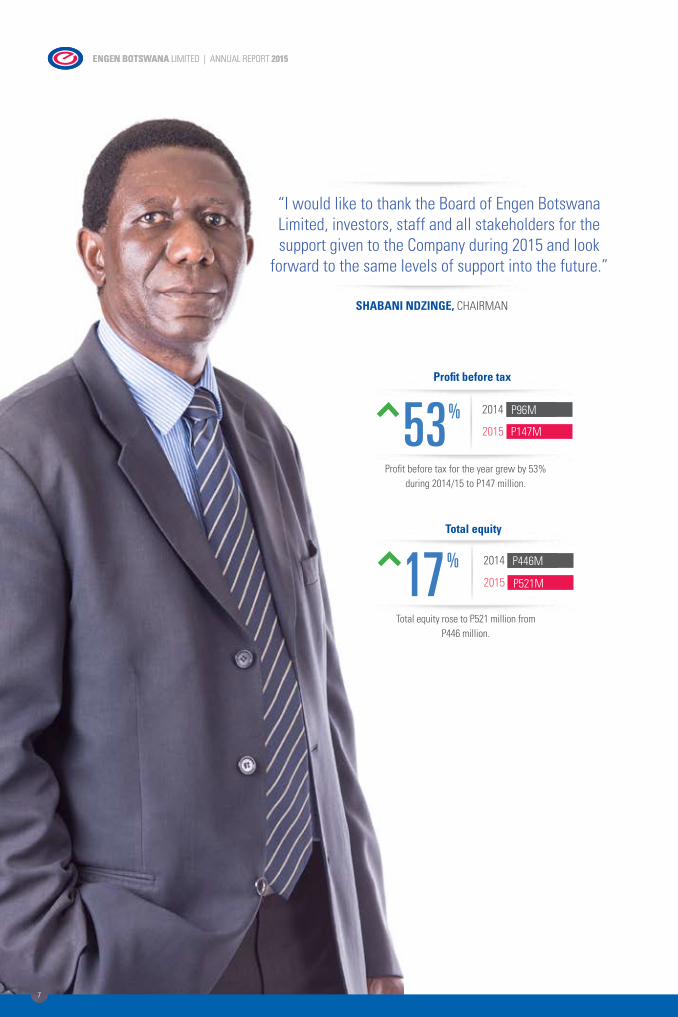
SHABANI NDZINGE, CHAIRMAN
“I would like to thank the Board of Engen Botswana Limited, investors, staff and all stakeholders for the support given to the Company during 2015 and look
forward to the same levels of support into the future.”
53Profit before tax
P96M2014
2015 P147M
Total equity
%
Profit before tax for the year grew by 53% during 2014/15 to P147 million.
Total equity rose to P521 million from P446 million.
17 P446M2014
2015 P521M
%
8
CHAIRMAN’S REPORT
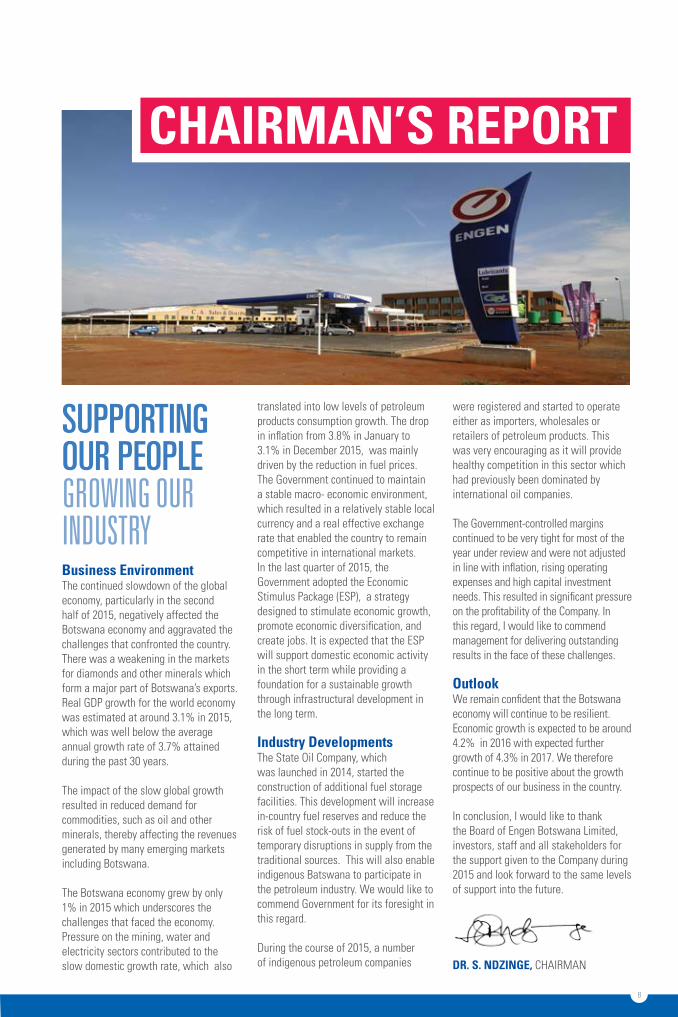
SUppORTING OUR pEOpLEGrOwiNG Our iNduSTryBusiness EnvironmentThe continued slowdown of the global economy, particularly in the second half of 2015, negatively affected the Botswana economy and aggravated the challenges that confronted the country. There was a weakening in the markets for diamonds and other minerals which form a major part of Botswana’s exports. Real GDP growth for the world economy was estimated at around 3.1% in 2015, which was well below the average annual growth rate of 3.7% attained during the past 30 years.
The impact of the slow global growth resulted in reduced demand for commodities, such as oil and other minerals, thereby affecting the revenues generated by many emerging markets including Botswana.
The Botswana economy grew by only 1% in 2015 which underscores the challenges that faced the economy. Pressure on the mining, water and electricity sectors contributed to the slow domestic growth rate, which also
translated into low levels of petroleum products consumption growth. The drop in inflation from 3.8% in January to 3.1% in December 2015, was mainly driven by the reduction in fuel prices. The Government continued to maintain a stable macro- economic environment, which resulted in a relatively stable local currency and a real effective exchange rate that enabled the country to remain competitive in international markets.In the last quarter of 2015, the Government adopted the Economic Stimulus Package (ESP), a strategy designed to stimulate economic growth, promote economic diversification, and create jobs. It is expected that the ESP will support domestic economic activity in the short term while providing a foundation for a sustainable growth through infrastructural development in the long term.
Industry DevelopmentsThe State Oil Company, which was launched in 2014, started the construction of additional fuel storage facilities. This development will increase in-country fuel reserves and reduce the risk of fuel stock-outs in the event of temporary disruptions in supply from the traditional sources. This will also enable indigenous Batswana to participate in the petroleum industry. We would like to commend Government for its foresight in this regard.
During the course of 2015, a number of indigenous petroleum companies
were registered and started to operate either as importers, wholesales or retailers of petroleum products. This was very encouraging as it will provide healthy competition in this sector which had previously been dominated by international oil companies.
The Government-controlled margins continued to be very tight for most of the year under review and were not adjusted in line with inflation, rising operating expenses and high capital investment needs. This resulted in significant pressure on the profitability of the Company. In this regard, I would like to commend management for delivering outstanding results in the face of these challenges.
OutlookWe remain confident that the Botswana economy will continue to be resilient. Economic growth is expected to be around 4.2% in 2016 with expected further growth of 4.3% in 2017. We therefore continue to be positive about the growth prospects of our business in the country.
In conclusion, I would like to thank the Board of Engen Botswana Limited, investors, staff and all stakeholders for the support given to the Company during 2015 and look forward to the same levels of support into the future.
DR. S. NDZINGE, CHAIRMAN
9
ENGEN BOTSWANA LIMITED | ANNUAL REPORT 2015ENGEN BOTSWANA LIMITED | ANNUAL REPORT 2015
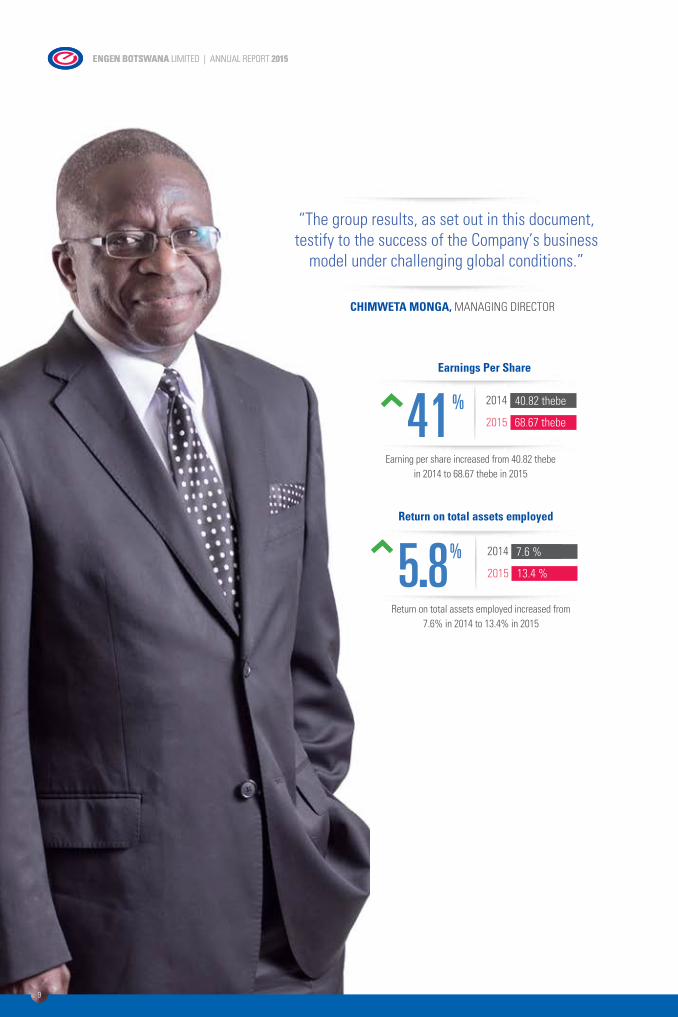
CHIMWETA MONGA, MANAGING DIRECTOR
“The group results, as set out in this document, testify to the success of the Company’s business
model under challenging global conditions.”
41Earnings Per Share
40.82 thebe2014
2015 68.67 thebe
Return on total assets employed
%
Earning per share increased from 40.82 thebe in 2014 to 68.67 thebe in 2015
Return on total assets employed increased from 7.6% in 2014 to 13.4% in 2015
5.8 7.6 %2014
2015 13.4 %
%
10
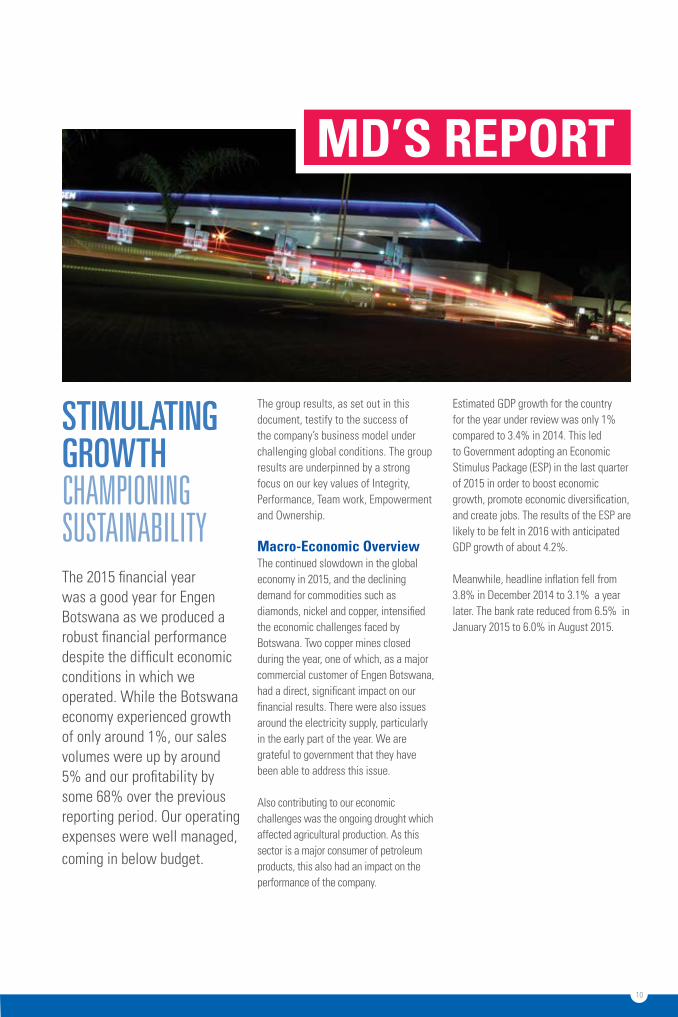
STIMULATING GROwThChampiONiNG SuSTaiNabiliTyThe 2015 financial year was a good year for Engen Botswana as we produced a robust financial performance despite the difficult economic conditions in which we operated. While the Botswana economy experienced growth of only around 1%, our sales volumes were up by around 5% and our profitability by some 68% over the previous reporting period. Our operating expenses were well managed, coming in below budget.
The group results, as set out in this document, testify to the success of the company’s business model under challenging global conditions. The group results are underpinned by a strong focus on our key values of Integrity, Performance, Team work, Empowerment and Ownership.
Macro-Economic OverviewThe continued slowdown in the global economy in 2015, and the declining demand for commodities such as diamonds, nickel and copper, intensified the economic challenges faced by Botswana. Two copper mines closed during the year, one of which, as a major commercial customer of Engen Botswana, had a direct, significant impact on our financial results. There were also issues around the electricity supply, particularly in the early part of the year. We are grateful to government that they have been able to address this issue.
Also contributing to our economic challenges was the ongoing drought which affected agricultural production. As this sector is a major consumer of petroleum products, this also had an impact on the performance of the company.
Estimated GDP growth for the country for the year under review was only 1% compared to 3.4% in 2014. This led to Government adopting an Economic Stimulus Package (ESP) in the last quarter of 2015 in order to boost economic growth, promote economic diversification, and create jobs. The results of the ESP are likely to be felt in 2016 with anticipated GDP growth of about 4.2%.
Meanwhile, headline inflation fell from 3.8% in December 2014 to 3.1% a year later. The bank rate reduced from 6.5% in January 2015 to 6.0% in August 2015.
MD’S REPORT
11
ENGEN BOTSWANA LIMITED | ANNUAL REPORT 2015ENGEN BOTSWANA LIMITED | ANNUAL REPORT 2015
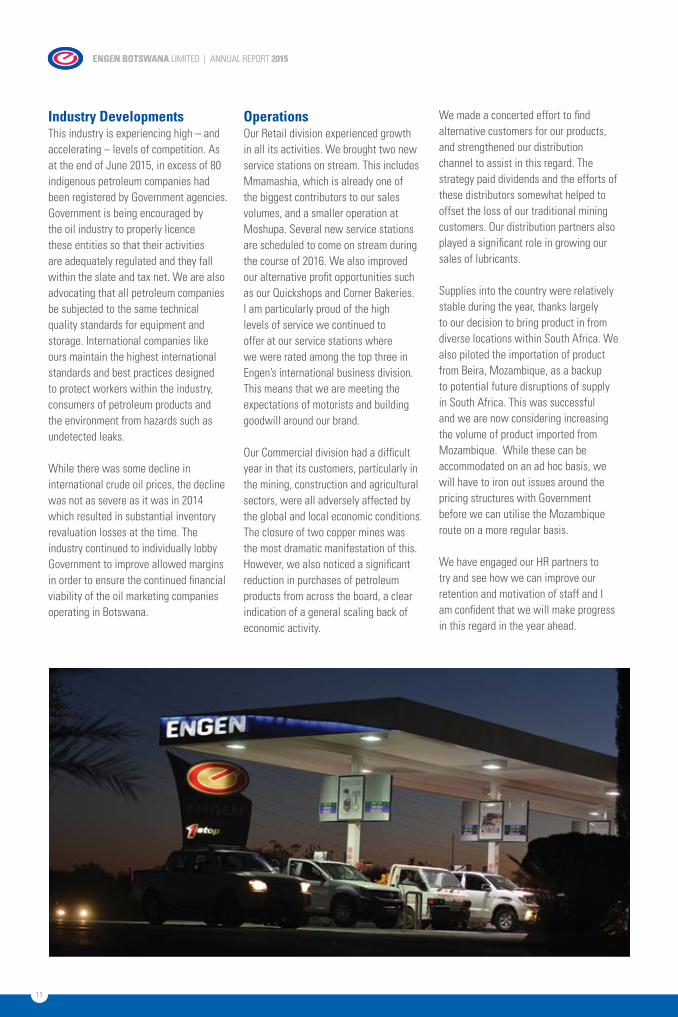
Industry DevelopmentsThis industry is experiencing high – and accelerating – levels of competition. As at the end of June 2015, in excess of 80 indigenous petroleum companies had been registered by Government agencies. Government is being encouraged by the oil industry to properly licence these entities so that their activities are adequately regulated and they fall within the slate and tax net. We are also advocating that all petroleum companies be subjected to the same technical quality standards for equipment and storage. International companies like ours maintain the highest international standards and best practices designed to protect workers within the industry, consumers of petroleum products and the environment from hazards such as undetected leaks.
While there was some decline in international crude oil prices, the decline was not as severe as it was in 2014 which resulted in substantial inventory revaluation losses at the time. The industry continued to individually lobby Government to improve allowed margins in order to ensure the continued financial viability of the oil marketing companies operating in Botswana.
OperationsOur Retail division experienced growth in all its activities. We brought two new service stations on stream. This includes Mmamashia, which is already one of the biggest contributors to our sales volumes, and a smaller operation at Moshupa. Several new service stations are scheduled to come on stream during the course of 2016. We also improved our alternative profit opportunities such as our Quickshops and Corner Bakeries.I am particularly proud of the high levels of service we continued to offer at our service stations where we were rated among the top three in Engen’s international business division. This means that we are meeting the expectations of motorists and building goodwill around our brand.
Our Commercial division had a difficult year in that its customers, particularly in the mining, construction and agricultural sectors, were all adversely affected by the global and local economic conditions. The closure of two copper mines was the most dramatic manifestation of this. However, we also noticed a significant reduction in purchases of petroleum products from across the board, a clear indication of a general scaling back of economic activity.
We made a concerted effort to find alternative customers for our products, and strengthened our distribution channel to assist in this regard. The strategy paid dividends and the efforts of these distributors somewhat helped to offset the loss of our traditional mining customers. Our distribution partners also played a significant role in growing our sales of lubricants.
Supplies into the country were relatively stable during the year, thanks largely to our decision to bring product in from diverse locations within South Africa. We also piloted the importation of product from Beira, Mozambique, as a backup to potential future disruptions of supply in South Africa. This was successful and we are now considering increasing the volume of product imported from Mozambique. While these can be accommodated on an ad hoc basis, we will have to iron out issues around the pricing structures with Government before we can utilise the Mozambique route on a more regular basis.
We have engaged our HR partners to try and see how we can improve our retention and motivation of staff and I am confident that we will make progress in this regard in the year ahead.
12
Looking aheadWe anticipate an improved economic environment for Botswana in 2016. We are confident that the planned growth of our retail network will enable us to conduct a sustainable business going forward. We will continue to realign our strategy to take advantage of opportunities in the retail sector. The uneven playing field in the largely unregulated commercial sector makes it increasingly difficult for international players to remain viable in this space. Nevertheless, while we continue to focus on retail expansion and innovation, we will also seek out commercial customer value adding solutions. Standardisation of our operations in line with international best practices, and prudent management of operating expenses, will remain the cornerstones of our business in Botswana as we strive to maintain our position as one of the leading petroleum companies in the country.
We recognise the commitment of our investors to the Company, and therefore one of our key objectives is to ensure that the Company delivers long term, sustainable and robust performance and value to our shareholders through leverage on technology, people, know-how and strong partnerships.I would like to take this opportunity to thank our valued customers, suppliers, shareholders and all other stakeholders for their on-going support which contributed towards the success of Engen Botswana. My thanks also go to the management and staff for their tremendous effort during the year to ensure that we maintained our position as one of the leading petroleum
companies in Botswana.
“I would like to take this opportunity to thank our valued customers, suppliers, shareholders and all other stakeholders for their on-going support which contributed towards the success of Engen Botswana. My thanks also go to the management and staff for their tremendous effort during the year to ensure that we maintained our position as one of the leading petroleum companies in Botswana.”
ThANkS.
MR. C. MONGA, MANAGING DIRECTOR
13
ENGEN BOTSWANA LIMITED | ANNUAL REPORT 2015ENGEN BOTSWANA LIMITED | ANNUAL REPORT 2015
FINANCIAL RESULTS
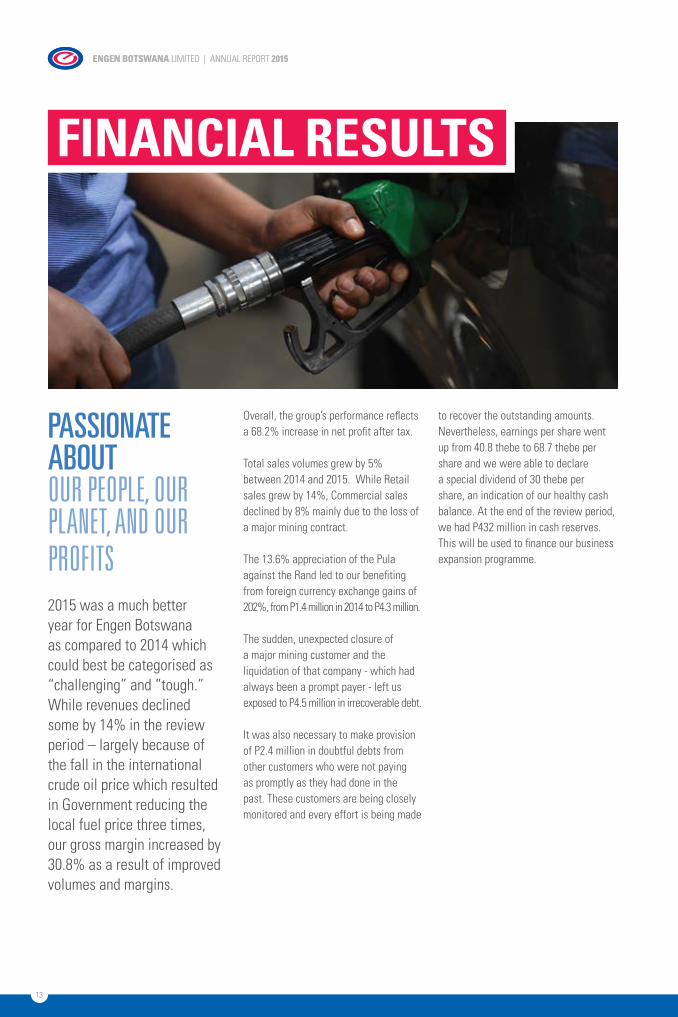
pASSIONATE AbOUTOur pEOplE, Our plaNET, aNd Our prOfiTS2015 was a much better year for Engen Botswana as compared to 2014 which could best be categorised as “challenging” and “tough.” While revenues declined some by 14% in the review period – largely because of the fall in the international crude oil price which resulted in Government reducing the local fuel price three times, our gross margin increased by 30.8% as a result of improved volumes and margins.
Overall, the group’s performance reflects a 68.2% increase in net profit after tax.
Total sales volumes grew by 5% between 2014 and 2015. While Retail sales grew by 14%, Commercial sales declined by 8% mainly due to the loss of a major mining contract.
The 13.6% appreciation of the Pula against the Rand led to our benefiting from foreign currency exchange gains of 202%, from P1.4 million in 2014 to P4.3 million.
The sudden, unexpected closure of a major mining customer and the liquidation of that company - which had always been a prompt payer - left us exposed to P4.5 million in irrecoverable debt.
It was also necessary to make provision of P2.4 million in doubtful debts from other customers who were not paying as promptly as they had done in the past. These customers are being closely monitored and every effort is being made
to recover the outstanding amounts.Nevertheless, earnings per share went up from 40.8 thebe to 68.7 thebe per share and we were able to declare a special dividend of 30 thebe per share, an indication of our healthy cash balance. At the end of the review period, we had P432 million in cash reserves. This will be used to finance our business expansion programme.
14
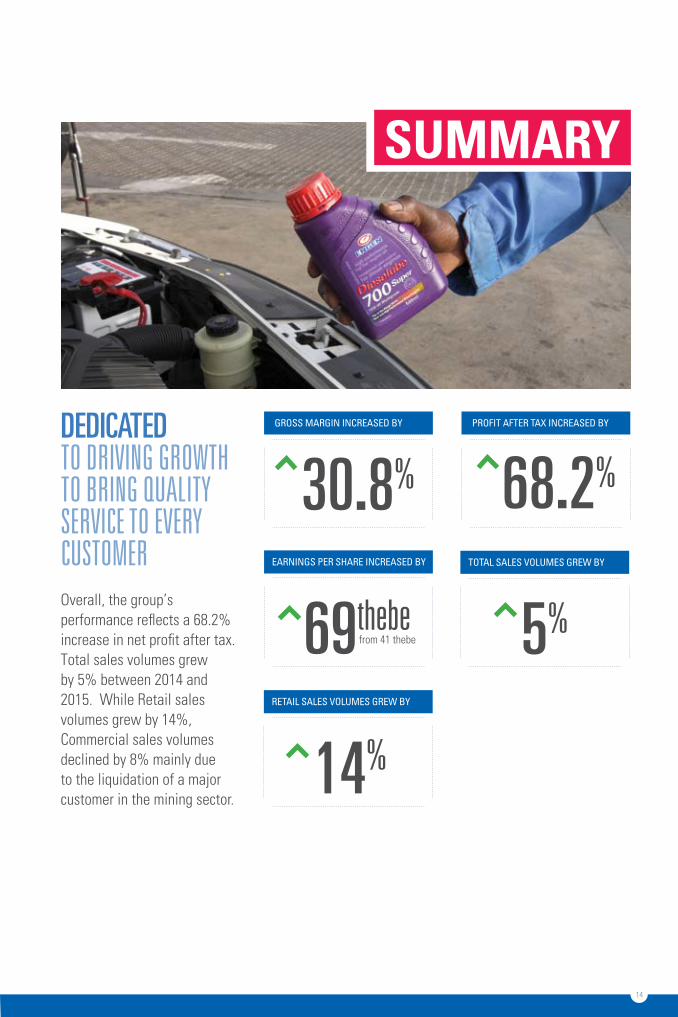
30.8%
GROSS MARGIN INCREASED BY
69thebe
EARNINGS PER SHARE INCREASED BY
from 41 thebe
PROFIT AFTER TAx INCREASED BY
5%
TOTAL SALES vOLUMES GREW BY
14%
RETAIL SALES vOLUMES GREW BY
DEDICATEDTO driviNG GrOwTh TO briNG qualiTy SErviCE TO EvEry CuSTOmErOverall, the group’s performance reflects a 68.2% increase in net profit after tax. Total sales volumes grew by 5% between 2014 and 2015. While Retail sales volumes grew by 14%, Commercial sales volumes declined by 8% mainly due to the liquidation of a major customer in the mining sector.
SUMMARY
68.2%

15
ENGEN BOTSWANA LIMITED | ANNUAL REPORT 2015ENGEN BOTSWANA LIMITED | ANNUAL REPORT 2015
SUSTAINABILITY
MINDFUL OFhEalTh, SafETy, ENvirONmENT, aNd qualiTyHealth, safety and environmental matters continue to hold a central position within Engen Botswana as components of the three main pillars of sustainability: people, planet and profit.
Everything we do, indeed every project we undertake, is referenced against the impact this will have on our people – our employees, our customers and the communities in which we operate; our planet – the environment in which we work and for which we have an inalienable obligation to promote and protect; and our profits – recognising that a sustainable business is not possible without being in harmony with the other two pillars of sustainability.
We strive to ingrain our international parent company’s Health, Safety, Environment and Quality (HSEQ) protocols into our daily activities despite the fact that the financial implications of some of these requirements can be substantial. We recognise that maintaining the very highest health, safety and environment protection standards in the world is non-negotiable for any organisation that regards itself as a good corporate citizen.
The introduction of our LOPC (Loss of Primary Containment) programme in 2014 yielded excellent results in 2015,
with not a single major spill reported. A single accidental contamination incident occurred at one of our service stations, but this was quickly rectified before any significant damage occurred.
Environmental Health and SafetyRecognising that we work in a high-risk industry as far as the health and safety of our employees, suppliers and customers is concerned, we make considerable strides in implementing all the elements of the Mandatory Control Framework (MFC) management system. We employed external consultants to conduct a health risk assessment which was designed to determine the concentration of airborne contaminant concentrations within our operational sites including our depot, warehouse, office and retail sites.
Consultants were also charged with identifying any other potential health hazards in respect of the Occupational Health and Safety Act, as well as developing a comprehensive legal register and protocols for all our operational sites.

16
In addition, all employees who are exposed to airborne contamination underwent two routine health checks during the review period, neither of which produced anything untoward. Similar health checks will be extended to other staff members during the current financial year.
On the safety front, we conducted a Crisis Management exercise at the Dumela depot in Francistown during the year. This simulation exercise also included participants from Botswana Oil, Vivo Energy, Puma, transporters, MedRescue and the Botswana Police. It was designed to test our response to an emergency situation and evaluate how effective our emergency response plan is.
The outcome of this exercise was satisfactory. Training of our people in fire fighting, first aid and other emergency procedures will be ongoing.
The winner of the Mochudi Farmers’ Dream draw receiving the tractor keys.
The winner of the Francistown draw posing with his family.
17
ENGEN BOTSWANA LIMITED | ANNUAL REPORT 2015ENGEN BOTSWANA LIMITED | ANNUAL REPORT 2015
COMMERCIAL
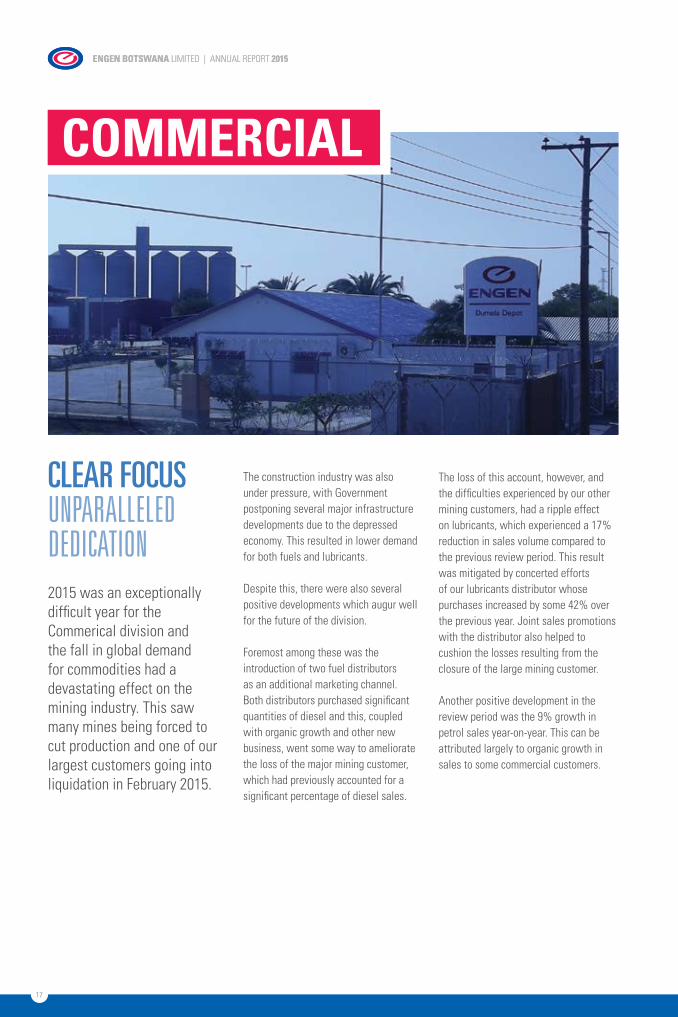
CLEAR FOCUSuNparallElEd dEdiCaTiON2015 was an exceptionally difficult year for the Commerical division and the fall in global demand for commodities had a devastating effect on the mining industry. This saw many mines being forced to cut production and one of our largest customers going into liquidation in February 2015.
The construction industry was also under pressure, with Government postponing several major infrastructure developments due to the depressed economy. This resulted in lower demand for both fuels and lubricants.
Despite this, there were also several positive developments which augur well for the future of the division.
Foremost among these was the introduction of two fuel distributors as an additional marketing channel. Both distributors purchased significant quantities of diesel and this, coupled with organic growth and other new business, went some way to ameliorate the loss of the major mining customer, which had previously accounted for a significant percentage of diesel sales.
The loss of this account, however, and the difficulties experienced by our other mining customers, had a ripple effect on lubricants, which experienced a 17% reduction in sales volume compared to the previous review period. This result was mitigated by concerted efforts of our lubricants distributor whose purchases increased by some 42% over the previous year. Joint sales promotions with the distributor also helped to cushion the losses resulting from the closure of the large mining customer.
Another positive development in the review period was the 9% growth in petrol sales year-on-year. This can be attributed largely to organic growth in sales to some commercial customers.
18
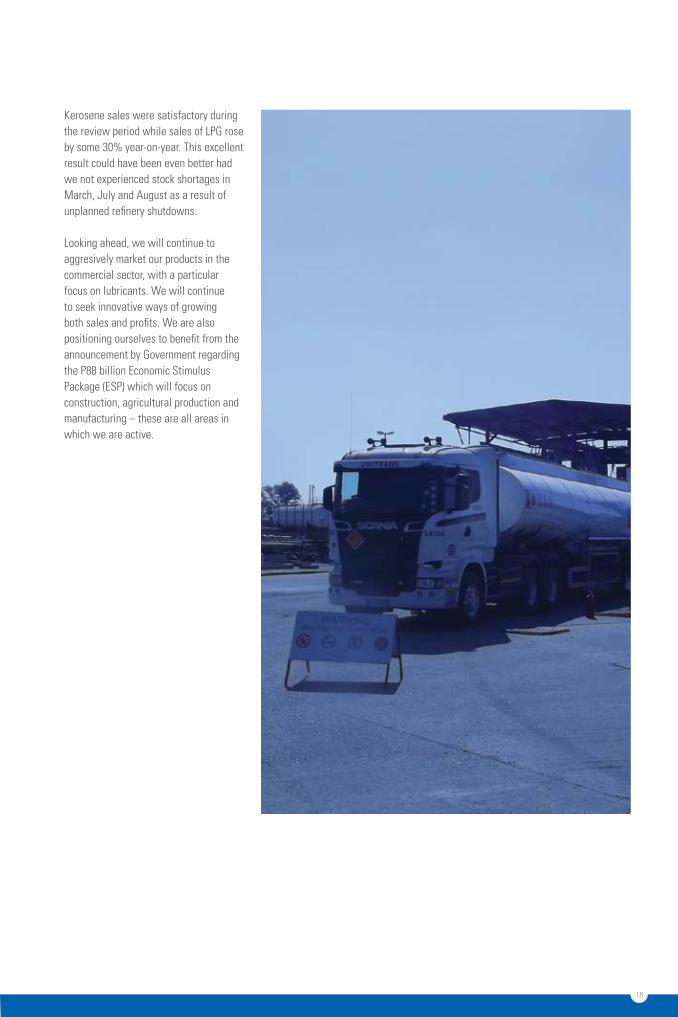
Kerosene sales were satisfactory during the review period while sales of LPG rose by some 30% year-on-year. This excellent result could have been even better had we not experienced stock shortages in March, July and August as a result of unplanned refinery shutdowns.
Looking ahead, we will continue to aggresively market our products in the commercial sector, with a particular focus on lubricants. We will continue to seek innovative ways of growing both sales and profits. We are also positioning ourselves to benefit from the announcement by Government regarding the P88 billion Economic Stimulus Package (ESP) which will focus on construction, agricultural production and manufacturing – these are all areas in which we are active.

19
ENGEN BOTSWANA LIMITED | ANNUAL REPORT 2015ENGEN BOTSWANA LIMITED | ANNUAL REPORT 2015
PROPERTY
SENSITIVE TOwARDSThE ClimaTE wE wOrk iNDuring the year under review, we were able to stream two of our planned developments, one of which, Mmamashia, rapidly rose to become a star performer in our portfolio following its opening in early 2015. The Mmamashia Quickshop and Corner Bakery also did exceptionally well.
A second new service station in Moshupa had a more difficult passage because of a delay in opening the rest of the adjacent shopping centre.
Several of our sites were revamped during the review period:
• Kazungula – upgraded forecourt and new Corner Bakery installed (complete)
• Mopipi – oxygenation of storage tanks (complete)
• Tlokweng – feeder canopies installed (complete)
• Lobatse – feeder canopies installed (complete)
We also took over the Pandamatenga service station early in 2015, but plans to rebrand it as an Engen site were delayed pending the approval of an Environmental Impact Assessment.
Looking ahead, we have several new projects scheduled for completion in 2016. This will include revamping several of our long-term lease sites as well as the opening or acquisition of new service stations.
Our shopping centres in Maun and Palapye both performed extremely well, maintaining 100 percent occupancy throughout the review period.

20
DISTRIBUTION
ExpERTS IN OUR FIELDwiTh a STrONG NETwOrk TO kEEp ThiNGS mOviNG2015 was characterised by fairly stable supplies of bulk product, with product being procured from a wider range of sources both in South Africa – Tarlton and Langlaagte as well as Durban; and from Beira in Mozambique.
These were supplemented by supplies from Botswana Oil when necessary, such as during the Botswana Unified Revenue Services (BURS) strike. This strike negatively affected our road fleet turnaround between Botswana and South
Africa, although rail was not affected.
Most importantly, we were able to continue to supply our Commercial and
Retail customers without interruption.
Our excellent relationship with our transporter continued throughout the year. The number of vehicles was reduced during April to align with business plans, but the transporter increased the number of vehicles in the operation during December to cater for increased demand. Despite the large number of trucks on the road at any one time, there were no serious incidents reported.
There were also very minimal operational losses at our depots and what little there was remained within tolerance.
21
ENGEN BOTSWANA LIMITED | ANNUAL REPORT 2015ENGEN BOTSWANA LIMITED | ANNUAL REPORT 2015
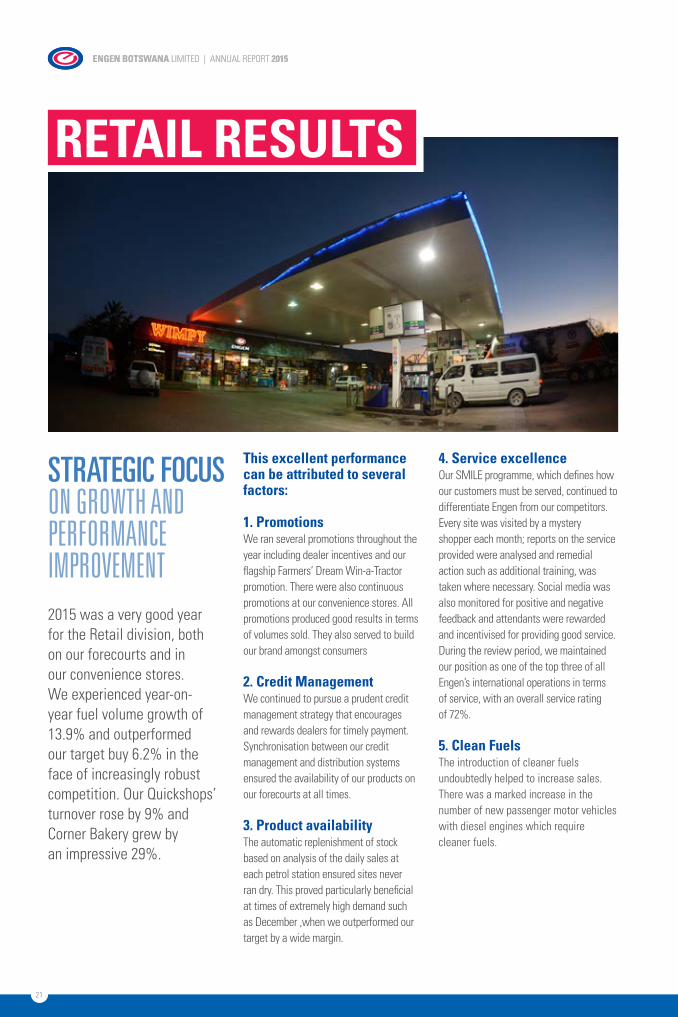
STRATEGIC FOCUSON GrOwTh aNd pErfOrmaNCE imprOvEmENT2015 was a very good year for the Retail division, both on our forecourts and in our convenience stores. We experienced year-on-year fuel volume growth of 13.9% and outperformed our target buy 6.2% in the face of increasingly robust competition. Our Quickshops’ turnover rose by 9% and Corner Bakery grew by an impressive 29%.
This excellent performance can be attributed to several factors:
1. PromotionsWe ran several promotions throughout the year including dealer incentives and our flagship Farmers’ Dream Win-a-Tractor promotion. There were also continuous promotions at our convenience stores. All promotions produced good results in terms of volumes sold. They also served to build our brand amongst consumers
2. Credit ManagementWe continued to pursue a prudent credit management strategy that encourages and rewards dealers for timely payment. Synchronisation between our credit management and distribution systems ensured the availability of our products on our forecourts at all times.
3. Product availabilityThe automatic replenishment of stock based on analysis of the daily sales at each petrol station ensured sites never ran dry. This proved particularly beneficial at times of extremely high demand such as December ,when we outperformed our target by a wide margin.
4. Service excellenceOur SMILE programme, which defines how our customers must be served, continued to differentiate Engen from our competitors. Every site was visited by a mystery shopper each month; reports on the service provided were analysed and remedial action such as additional training, was taken where necessary. Social media was also monitored for positive and negative feedback and attendants were rewarded and incentivised for providing good service. During the review period, we maintained our position as one of the top three of all Engen’s international operations in terms of service, with an overall service rating of 72%.
5. Clean FuelsThe introduction of cleaner fuels undoubtedly helped to increase sales. There was a marked increase in the number of new passenger motor vehicles with diesel engines which require cleaner fuels.
RETAIL RESULTS
22
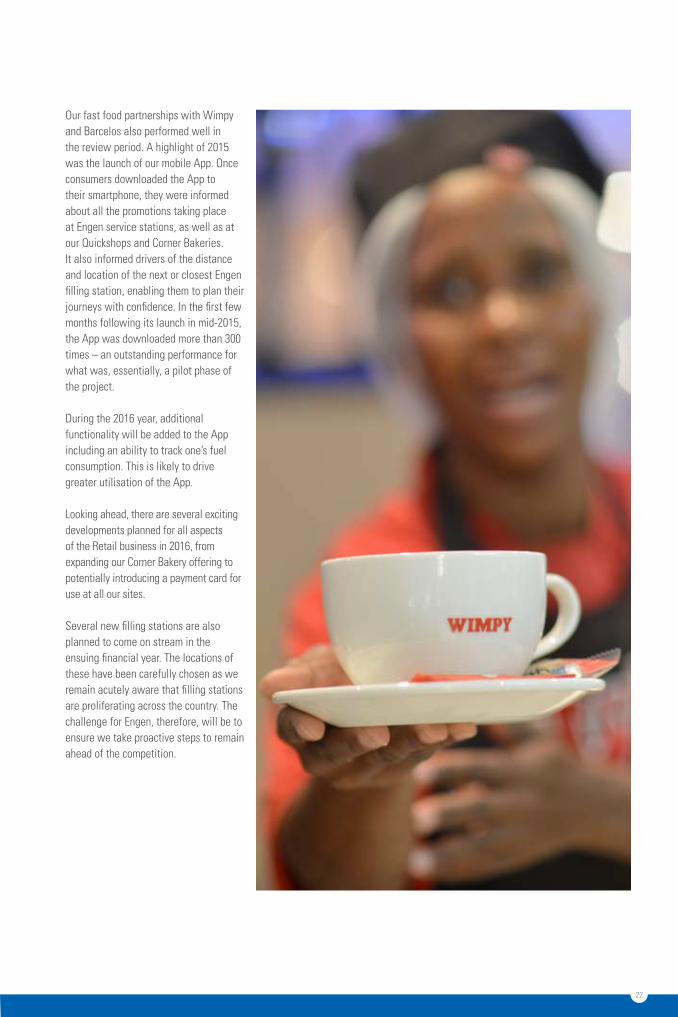
Our fast food partnerships with Wimpy and Barcelos also performed well in the review period. A highlight of 2015 was the launch of our mobile App. Once consumers downloaded the App to their smartphone, they were informed about all the promotions taking place at Engen service stations, as well as at our Quickshops and Corner Bakeries. It also informed drivers of the distance and location of the next or closest Engen filling station, enabling them to plan their journeys with confidence. In the first few months following its launch in mid-2015, the App was downloaded more than 300 times – an outstanding performance for what was, essentially, a pilot phase of the project.
During the 2016 year, additional functionality will be added to the App including an ability to track one’s fuel consumption. This is likely to drive greater utilisation of the App.
Looking ahead, there are several exciting developments planned for all aspects of the Retail business in 2016, from expanding our Corner Bakery offering to potentially introducing a payment card for use at all our sites.
Several new filling stations are also planned to come on stream in the ensuing financial year. The locations of these have been carefully chosen as we remain acutely aware that filling stations are proliferating across the country. The challenge for Engen, therefore, will be to ensure we take proactive steps to remain ahead of the competition.

23
ENGEN BOTSWANA LIMITED | ANNUAL REPORT 2015ENGEN BOTSWANA LIMITED | ANNUAL REPORT 2015
HUMAN RESOURCES
GROwING OUR pEOpLESTrENGThENiNGOur TEamEvery business requires skilled, motivated and well trained people if it is to fulfil its mandate to all its stakeholders. However, in an environment in which competition for skills is fierce, recruiting and retaining the right calibre of employee remains a perpetual challenge.
At the end of the review period, our staff complement stood at 42 permanent employees and a further six on fixed-term contracts.
The challenges we face in retaining and recruiting appropriately skilled personnel are addressed through an integrated Talent Management Programme which incorporates the provision of training and development opportunities. During the review period, virtually every employee underwent at least one training programme, either to ensure their skills remain current within their respective areas of operation, or to prepare them for growth and promotion opportunities within the organisation. New recruits received training on operational and system requirements, improving their productivity and quality of output as quickly as possible.
During the review period, one manager completed the Executive Development Programme at the University of Cape Town Graduate School of Business, while two new members of the management
committee completed a contracting workshop. The latter had previously been completed by other members of the committee.
Despite the fact that our salary structure is largely determined by our international parent company, we strive to ensure that our remuneration is market related while simultaneously offering value-adding employee benefits. Our participation in the Mercer annual salary survey ensured we remained abreast of remuneration trends in Botswana.
Our ongoing focus on wellness – physical, mental and financial – was appreciated by employees. Corporate wellness sessions focusing on education as well as screening for chronic health conditions were held quarterly at all sites during the review period. This was supplemented by a comprehensive Wellness Day that enabled employees to engage with a host of wellness providers offering services in everything from personal hygiene and weight control to substance abuse, oral health and family health.
24
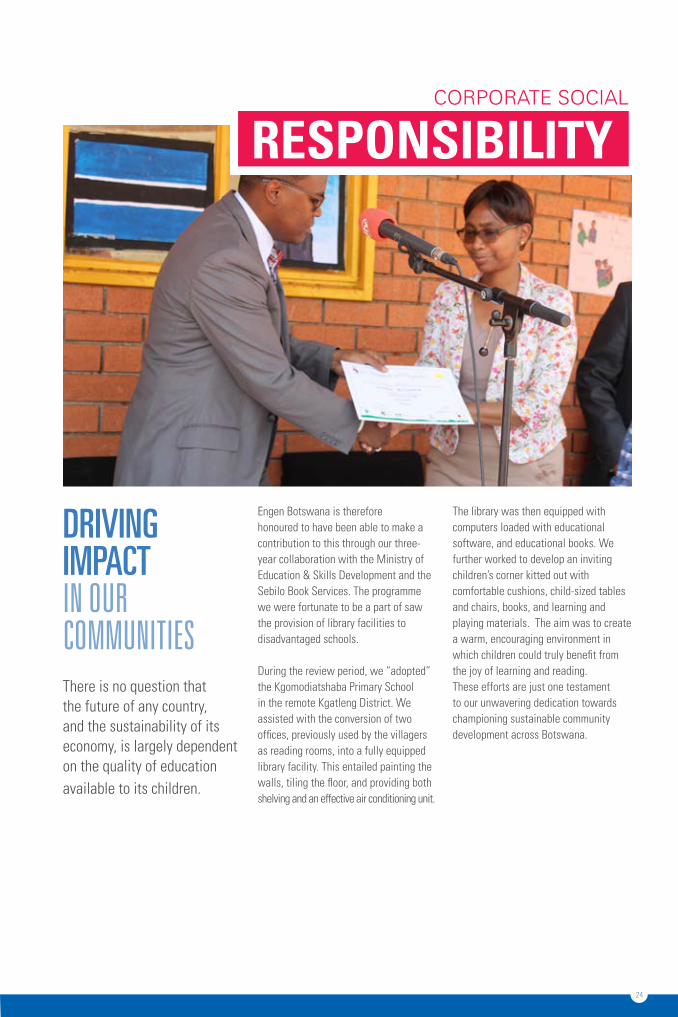
DRIVING IMpACTiN Our COmmuNiTiESThere is no question that the future of any country, and the sustainability of its economy, is largely dependent on the quality of education available to its children.
Engen Botswana is therefore honoured to have been able to make a contribution to this through our three-year collaboration with the Ministry of Education & Skills Development and the Sebilo Book Services. The programme we were fortunate to be a part of saw the provision of library facilities to disadvantaged schools.
During the review period, we “adopted” the Kgomodiatshaba Primary School in the remote Kgatleng District. We assisted with the conversion of two offices, previously used by the villagers as reading rooms, into a fully equipped library facility. This entailed painting the walls, tiling the floor, and providing both shelving and an effective air conditioning unit.
The library was then equipped with computers loaded with educational software, and educational books. We further worked to develop an inviting children’s corner kitted out with comfortable cushions, child-sized tables and chairs, books, and learning and playing materials. The aim was to create a warm, encouraging environment in which children could truly benefit from the joy of learning and reading. These efforts are just one testament to our unwavering dedication towards championing sustainable community development across Botswana.
COrpOrAte sOCiAl
RESPONSIBILITY
25
ENGEN BOTSWANA LIMITED | ANNUAL REPORT 2015
GOVERNANCE
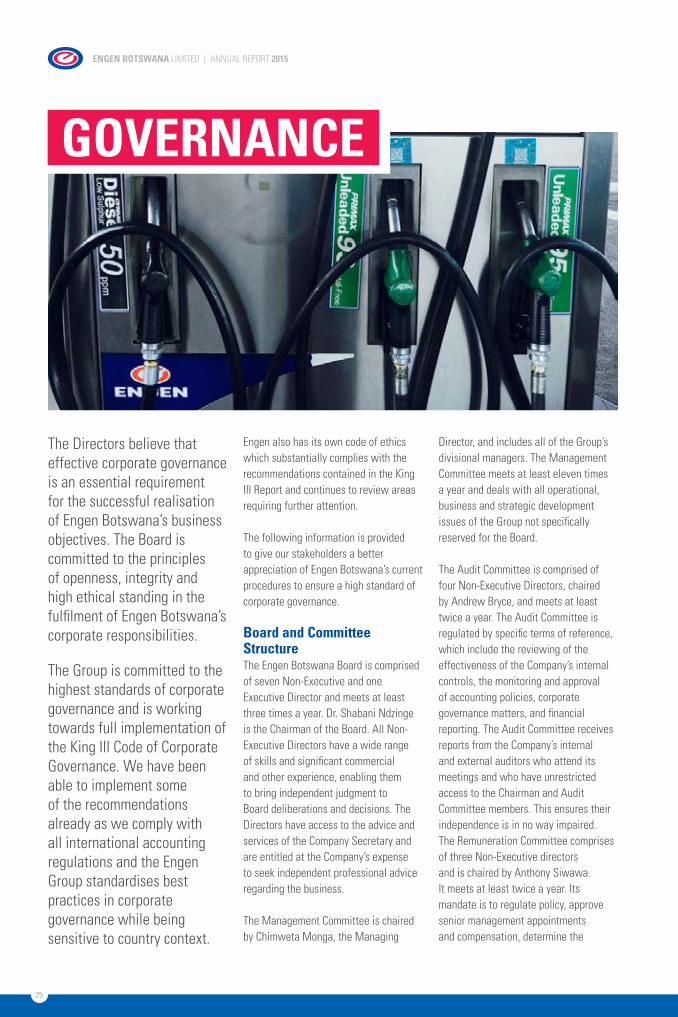
The Directors believe that effective corporate governance is an essential requirement for the successful realisation of Engen Botswana’s business objectives. The Board is committed to the principles of openness, integrity and high ethical standing in the fulfilment of Engen Botswana’s corporate responsibilities.
The Group is committed to the highest standards of corporate governance and is working towards full implementation of the King III Code of Corporate Governance. We have been able to implement some of the recommendations already as we comply with all international accounting regulations and the Engen Group standardises best practices in corporate governance while being sensitive to country context.
Engen also has its own code of ethics which substantially complies with the recommendations contained in the King III Report and continues to review areas requiring further attention.
The following information is provided to give our stakeholders a better appreciation of Engen Botswana’s current procedures to ensure a high standard of corporate governance.
Board and Committee StructureThe Engen Botswana Board is comprised of seven Non-Executive and one Executive Director and meets at least three times a year. Dr. Shabani Ndzinge is the Chairman of the Board. All Non-Executive Directors have a wide range of skills and significant commercial and other experience, enabling them to bring independent judgment to Board deliberations and decisions. The Directors have access to the advice and services of the Company Secretary and are entitled at the Company’s expense to seek independent professional advice regarding the business.
The Management Committee is chaired by Chimweta Monga, the Managing
Director, and includes all of the Group’s divisional managers. The Management Committee meets at least eleven times a year and deals with all operational, business and strategic development issues of the Group not specifically reserved for the Board.
The Audit Committee is comprised of four Non-Executive Directors, chaired by Andrew Bryce, and meets at least twice a year. The Audit Committee is regulated by specific terms of reference, which include the reviewing of the effectiveness of the Company’s internal controls, the monitoring and approval of accounting policies, corporate governance matters, and financial reporting. The Audit Committee receives reports from the Company’s internal and external auditors who attend its meetings and who have unrestricted access to the Chairman and Audit Committee members. This ensures their independence is in no way impaired.The Remuneration Committee comprises of three Non-Executive directors and is chaired by Anthony Siwawa. It meets at least twice a year. Its mandate is to regulate policy, approve senior management appointments and compensation, determine the
26
remuneration levels of staff, including incentives, and ensure appropriate preparation for Management succession.
Accountability and ControlThe Directors are required by the Companies Act to prepare Annual Financial Statements which fairly present the financial position of Engen Botswana at the end of the financial year. The Annual Financial Statements are presented in conformity with the revised Companies Act, the Botswana Stock Exchange (BSE) listing requirements and International Financial Reporting Standards (IFRS).
The Board has put in place a structure with clearly defined lines of responsibility, segregation of duties and delegation of authority. There are also established business procedures for business planning and capital expenditure, and information and reporting systems for monitoring Engen Botswana’s business and performance.
The Directors have delegated to Management the implementation of the Company’s internal controls throughout the business. These are aimed at reducing the risk of error or loss in a cost effective manner. They include financial controls which enable the Board to meet its responsibility to assure the integrity and accuracy of Engen Botswana’s accounting records. The Group’s Annual Report, prepared from these records, complies fully with the Companies Act, the BSE listing requirements, and IFRS regulations.
The risk management approach to audit is adopted in the work of the internal auditors on the areas of greatest risk to Engen Botswana.
EthicsIn line with Engen’s formal Code of Ethics, all employees are required to maintain the highest ethical standards, ensuring that the Company business is conducted in a manner which, in all reasonable circumstances, is above reproach.
Going ConcernThe Directors are of the opinion that the business will be a going concern for the foreseeable future. For this reason they continue to adopt the going concern basis in preparing the Annual Financial Statements.
Directors and Management ShareholdingThe aggregate number of shares held by the Directors and Management is nil. Full details are available at the Group’s registered office.
DirectorsThe names of the Engen Board of Directors appear on page 5 and 6 of this report. During the year under review, Non-Executive director Ms. C. Mareka was appointed to the Board. In addition, Mr. J. F. Kennedy resigned from the board. We thank him for his valuable contribution during his tenure.
The Board thanks Management and staff for the tremendous effort applied in running the company. We would also like to thank our valued customers, suppliers and shareholders and other stakeholders for their ongoing support towards the success of Engen Botswana Limited.
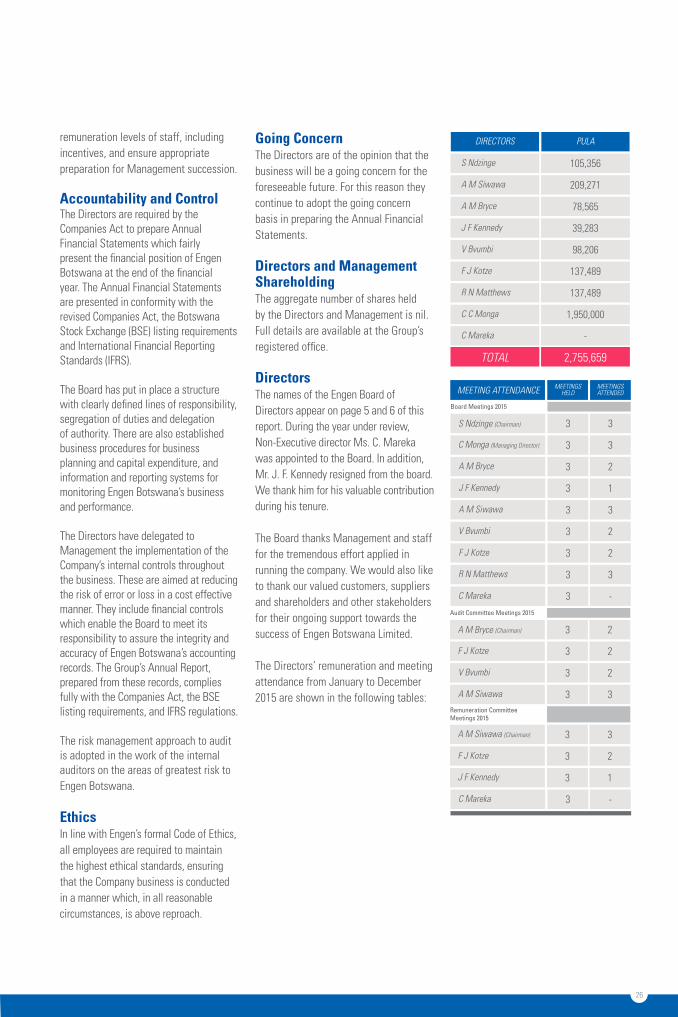
The Directors’ remuneration and meeting attendance from January to December 2015 are shown in the following tables:
MEETING ATTENDANCE MEETINGS MEETINGSHELD ATTENDED
S Ndzinge (Chairman)
Board Meetings 2015
3
3
3
3
3
2
3
1
C Monga (Managing Director)
A M Bryce
J F Kennedy
A M Bryce (Chairman)
A M Siwawa (Chairman)
Audit Committee Meetings 2015
Remuneration CommitteeMeetings 2015
3
3
3
3
3
3
3
3
3
3
2
3
2
1
2
2
3
2
2
3
F J Kotze
F J Kotze
V Bvumbi
J F Kennedy
A M Siwawa
V Bvumbi
F J Kotze
R N Matthews
3 3A M Siwawa
DIRECTORS
S Ndzinge
A M Siwawa
A M Bryce
J F Kennedy
V Bvumbi
F J Kotze
R N Matthews
PULA
105,356
209,271
78,565
39,283
98,206
137,489
137,489
TOTAL 2,755,659
C C Monga 1,950,000
C Mareka -
3 -C Mareka
3 -C Mareka
27
ENGEN BOTSWANA LIMITED | ANNUAL REPORT 2015
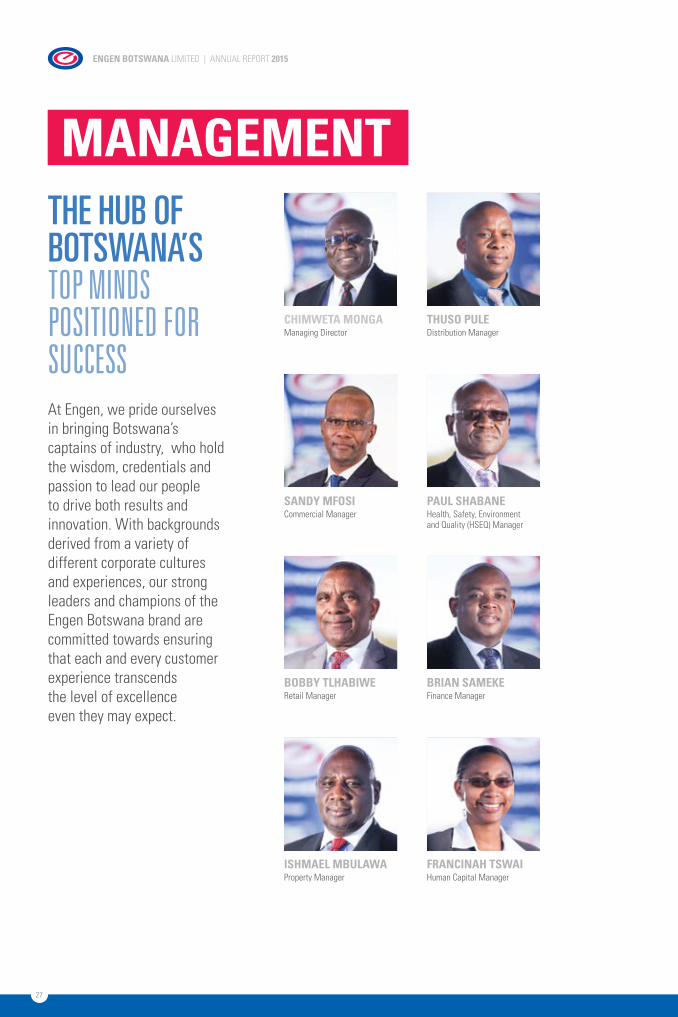
ThE hUb OF bOTSwANA’S TOp miNdS pOSiTiONEd fOr SuCCESSAt Engen, we pride ourselves in bringing Botswana’s captains of industry, who hold the wisdom, credentials and passion to lead our people to drive both results and innovation. With backgrounds derived from a variety of different corporate cultures and experiences, our strong leaders and champions of the Engen Botswana brand are committed towards ensuring that each and every customer experience transcends the level of excellence even they may expect.
MANAGEMENT
THUSO PULEDistribution Manager
PAUL SHABANEHealth, Safety, Environment and Quality (HSEQ) Manager
BRIAN SAMEKEFinance Manager
FRANCINAH TSWAIHuman Capital Manager
CHIMWETA MONGAManaging Director
SANDY MFOSICommercial Manager
BOBBY TLHABIWERetail Manager
ISHMAEL MBULAWAProperty Manager
28
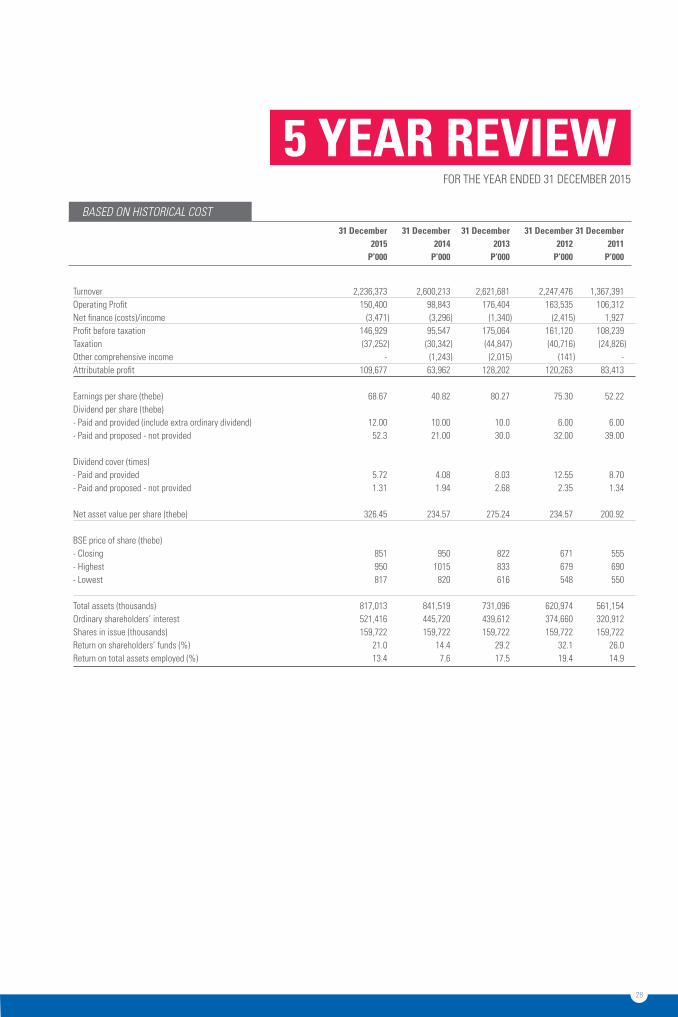
5 YEAR REVIEWBASED ON HISTORICAL COST
Turnover 2,236,373 2,600,213 2,621,681 2,247,476 1,367,391 Operating Profit 150,400 98,843 176,404 163,535 106,312 Net finance (costs)/income (3,471 ) (3,296 ) (1,340 ) (2,415 ) 1,927 Profit before taxation 146,929 95,547 175,064 161,120 108,239 Taxation (37,252 ) (30,342 ) (44,847 ) (40,716 ) (24,826 )Other comprehensive income - (1,243 ) (2,015 ) (141 ) - Attributable profit 109,677 63,962 128,202 120,263 83,413 Earnings per share (thebe) 68.67 40.82 80.27 75.30 52.22 Dividend per share (thebe) - Paid and provided (include extra ordinary dividend) 12.00 10.00 10.0 6.00 6.00 - Paid and proposed - not provided 52.3 21.00 30.0 32.00 39.00 Dividend cover (times) - Paid and provided 5.72 4.08 8.03 12.55 8.70 - Paid and proposed - not provided 1.31 1.94 2.68 2.35 1.34 Net asset value per share (thebe) 326.45 234.57 275.24 234.57 200.92 BSE price of share (thebe) - Closing 851 950 822 671 555- Highest 950 1015 833 679 690- Lowest 817 820 616 548 550 Total assets (thousands) 817,013 841,519 731,096 620,974 561,154 Ordinary shareholders’ interest 521,416 445,720 439,612 374,660 320,912 Shares in issue (thousands) 159,722 159,722 159,722 159,722 159,722 Return on shareholders’ funds (%) 21.0 14.4 29.2 32.1 26.0 Return on total assets employed (%) 13.4 7.6 17.5 19.4 14.9
31 December 31 December 31 December 31 December 31 December 2015 2014 2013 2012 2011 P’000 P’000 P’000 P’000 P’000
FOR THE YEAR ENDED 31 DECEMBER 2015
29
ENGEN BOTSWANA LIMITED | ANNUAL REPORT 2015
SUPPLEMENTARY INCOME STATEMENT
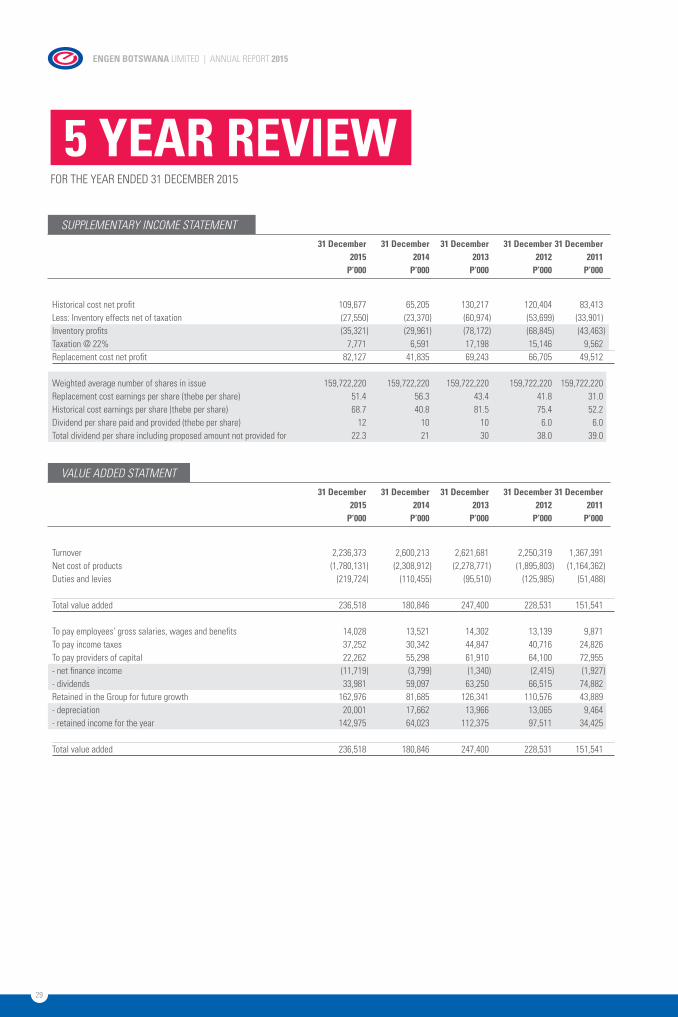
Historical cost net profit 109,677 65,205 130,217 120,404 83,413 Less: Inventory effects net of taxation (27,550 ) (23,370 ) (60,974 ) (53,699 ) (33,901) Inventory profits (35,321 ) (29,961 ) (78,172 ) (68,845 ) (43,463 )Taxation @ 22% 7,771 6,591 17,198 15,146 9,562 Replacement cost net profit 82,127 41,835 69,243 66,705 49,512 Weighted average number of shares in issue 159,722,220 159,722,220 159,722,220 159,722,220 159,722,220 Replacement cost earnings per share (thebe per share) 51.4 56.3 43.4 41.8 31.0 Historical cost earnings per share (thebe per share) 68.7 40.8 81.5 75.4 52.2 Dividend per share paid and provided (thebe per share) 12 10 10 6.0 6.0 Total dividend per share including proposed amount not provided for 22.3 21 30 38.0 39.0
31 December 31 December 31 December 31 December 31 December 2015 2014 2013 2012 2011 P’000 P’000 P’000 P’000 P’000
5 YEAR REVIEWFOR THE YEAR ENDED 31 DECEMBER 2015
VALUE ADDED STATMENT
Turnover 2,236,373 2,600,213 2,621,681 2,250,319 1,367,391 Net cost of products (1,780,131 ) (2,308,912 ) (2,278,771 ) (1,895,803 ) (1,164,362 )Duties and levies (219,724 ) (110,455 ) (95,510 ) (125,985 ) (51,488 ) Total value added 236,518 180,846 247,400 228,531 151,541 To pay employees’ gross salaries, wages and benefits 14,028 13,521 14,302 13,139 9,871 To pay income taxes 37,252 30,342 44,847 40,716 24,826 To pay providers of capital 22,262 55,298 61,910 64,100 72,955 - net finance income (11,719 ) (3,799 ) (1,340 ) (2,415 ) (1,927 )- dividends 33,981 59,097 63,250 66,515 74,882 Retained in the Group for future growth 162,976 81,685 126,341 110,576 43,889 - depreciation 20,001 17,662 13,966 13,065 9,464 - retained income for the year 142,975 64,023 112,375 97,511 34,425 Total value added 236,518 180,846 247,400 228,531 151,541
31 December 31 December 31 December 31 December 31 December 2015 2014 2013 2012 2011 P’000 P’000 P’000 P’000 P’000
30
FINANCIALSANNUAL CONSOLIDATED FINANCIAL STATEMENTS
Directors’ Report
Statement of Profit or Loss and other Comprehensive Income
Statement of Financial Position
Statement of Cash Flows
Statement of Changes in Equity
Notes to the Financial Statements
Report of the Independent Auditors
33
34
35
36
37
39
75
31
Directors: S Ndzinge (Chairman) C C Monga (Managing Director) A M Siwawa A M Bryce F J Kotze V Bvumbi J F Kennedy (Resigned 29 May 2015) R N Matthews C Mareka (Appointed 15 November 2015)
PrinciPal activities: Petrochemical investments and property operations
Parent comPany: Petroleum Investment Holdings Limited Mauritius
Ultimate Parent comPany: Petronas
transfer secretary: PricewaterhouseCoopers FairgroundsOfficePark Plot 50371 P O Box 1453, Gaborone
comPany nUmber 1966/335
registereD office: Plot 54026 Western Bypass P O Box 867 Gaborone aUDitor: Ernst & Young, Botswana
GENERAL INFORMATIONFOR THE YEAR ENDED 31 DECEMBER 2015
32
bankers: First National Bank of Botswana Limited Barclays Bank of Botswana Limited Standard Chartered Bank Botswana Limited Stanbic Bank Botswana Limited coUntry of incorPorationanD Domicile: Botswana
cUrrency: Botswana Pula
aPProval of annUalconsoliDateD financial statements Theannualconsolidatedfinancialstatements for the year ended 31 December 2015 were authorised for issue in accordance with a resolution of the directors and are signed on their behalf by:
Director 17 March 2016
Director
33
financial resUltsRevenue decreased by 14% mainly due to three downward price adjustments during the year. Total sales volumes grew by 5% between 2014 and 2015. While retail sales grew by 14%, commercial sales declined by 8% mainly due to the liquidation of a customer which had a major fuel supply contract.
Foreign exchange gains increased from P 1.4 million at the end of 2014 to P 4.3 million at the end of 2015. This was due to the depreciation of the South African Rand to other trading currencies.
The group exercised good margin management and cost control throughout the year.
Overall the group’s performance reflects a 68.2% increase in net profit after tax.
conclUsionThe Directors would like to thank our valued customers, suppliers, shareholders and all other stakeholders for their ongoing support towards the performance of Engen Botswana Limited.
DIRECTORS’ REPORTFOR THE YEAR ENDED 31 DECEMBER 2015
34
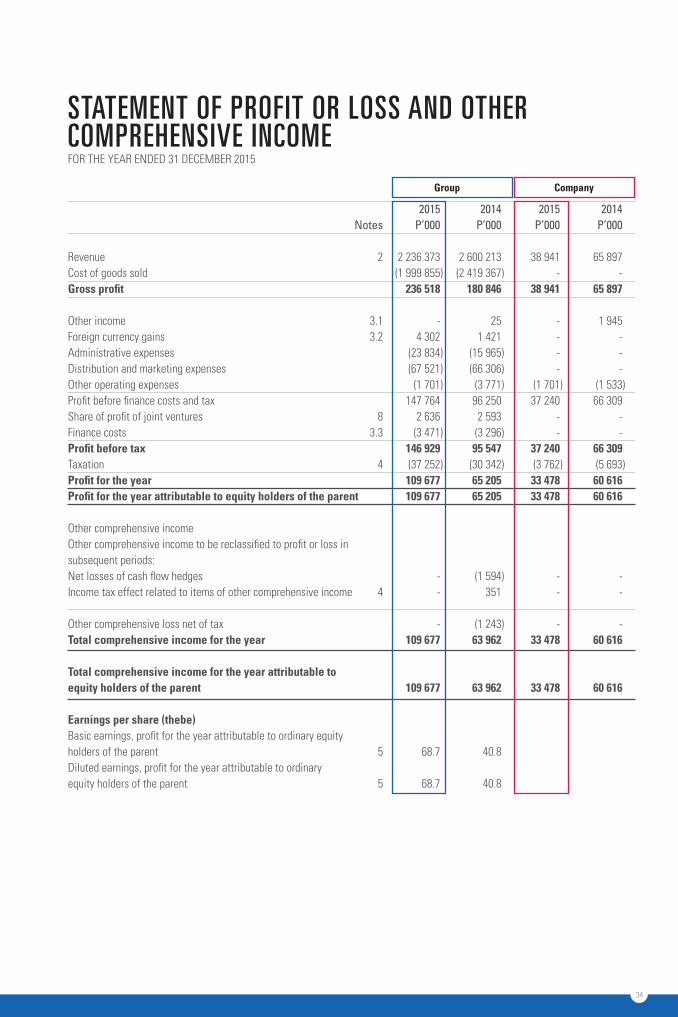
2015 2014 2015 2014 Notes P’000 P’000 P’000 P’000 Revenue 2 2 236 373 2 600 213 38 941 65 897Cost of goods sold (1 999 855 ) (2 419 367 ) - -gross profit 236 518 180 846 38 941 65 897 Other income 3.1 - 25 - 1 945Foreign currency gains 3.2 4 302 1 421 - -Administrative expenses (23 834 ) (15 965 ) - -Distribution and marketing expenses (67 521 ) (66 306 ) - -Other operating expenses (1 701 ) (3 771 ) (1 701 ) (1 533 )Profit before finance costs and tax 147 764 96 250 37 240 66 309Share of profit of joint ventures 8 2 636 2 593 - -Finance costs 3.3 (3 471 ) (3 296 ) - -Profit before tax 146 929 95 547 37 240 66 309Taxation 4 (37 252 ) (30 342 ) (3 762 ) (5 693 )Profit for the year 109 677 65 205 33 478 60 616Profit for the year attributable to equity holders of the parent 109 677 65 205 33 478 60 616 Other comprehensive income Other comprehensive income to be reclassified to profit or loss insubsequent periods: Net losses of cash flow hedges - (1 594 ) - -Income tax effect related to items of other comprehensive income 4 - 351 - -
Other comprehensive loss net of tax - (1 243 ) - -total comprehensive income for the year 109 677 63 962 33 478 60 616
total comprehensive income for the year attributable toequity holders of the parent 109 677 63 962 33 478 60 616
earnings per share (thebe) Basic earnings, profit for the year attributable to ordinary equityholders of the parent 5 68.7 40.8 Diluted earnings, profit for the year attributable to ordinaryequity holders of the parent 5 68.7 40.8
STATEMENT OF PROFIT OR LOSS AND OTHER COMPREHENSIVE INCOMEFOR THE YEAR ENDED 31 DECEMBER 2015
group company
35
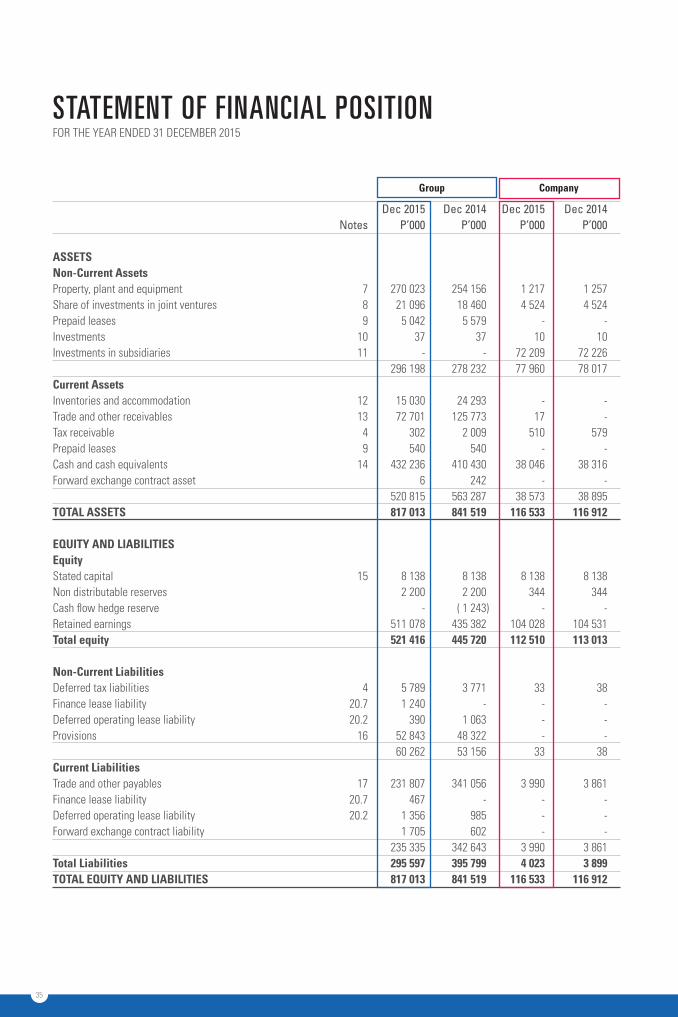
Dec 2015 Dec 2014 Dec 2015 Dec 2014 Notes P’000 P’000 P’000 P’000 assets non-current assets Property, plant and equipment 7 270 023 254 156 1 217 1 257Share of investments in joint ventures 8 21 096 18 460 4 524 4 524Prepaid leases 9 5 042 5 579 - -Investments 10 37 37 10 10Investments in subsidiaries 11 - - 72 209 72 226 296 198 278 232 77 960 78 017current assets Inventories and accommodation 12 15 030 24 293 - -Trade and other receivables 13 72 701 125 773 17 -Tax receivable 4 302 2 009 510 579Prepaid leases 9 540 540 - -Cash and cash equivalents 14 432 236 410 430 38 046 38 316Forward exchange contract asset 6 242 - - 520 815 563 287 38 573 38 895total assets 817 013 841 519 116 533 116 912 eQUity anD liabilities equity Stated capital 15 8 138 8 138 8 138 8 138Non distributable reserves 2 200 2 200 344 344Cash flow hedge reserve - ( 1 243 ) - -Retained earnings 511 078 435 382 104 028 104 531total equity 521 416 445 720 112 510 113 013 non-current liabilities Deferred tax liabilities 4 5 789 3 771 33 38Finance lease liability 20.7 1 240 - - -Deferred operating lease liability 20.2 390 1 063 - -Provisions 16 52 843 48 322 - - 60 262 53 156 33 38current liabilities Trade and other payables 17 231 807 341 056 3 990 3 861Finance lease liability 20.7 467 - - -Deferred operating lease liability 20.2 1 356 985 - -Forward exchange contract liability 1 705 602 - - 235 335 342 643 3 990 3 861total liabilities 295 597 395 799 4 023 3 899total eQUity anD liabilities 817 013 841 519 116 533 116 912
STATEMENT OF FINANCIAL POSITIONFOR THE YEAR ENDED 31 DECEMBER 2015
group company
36
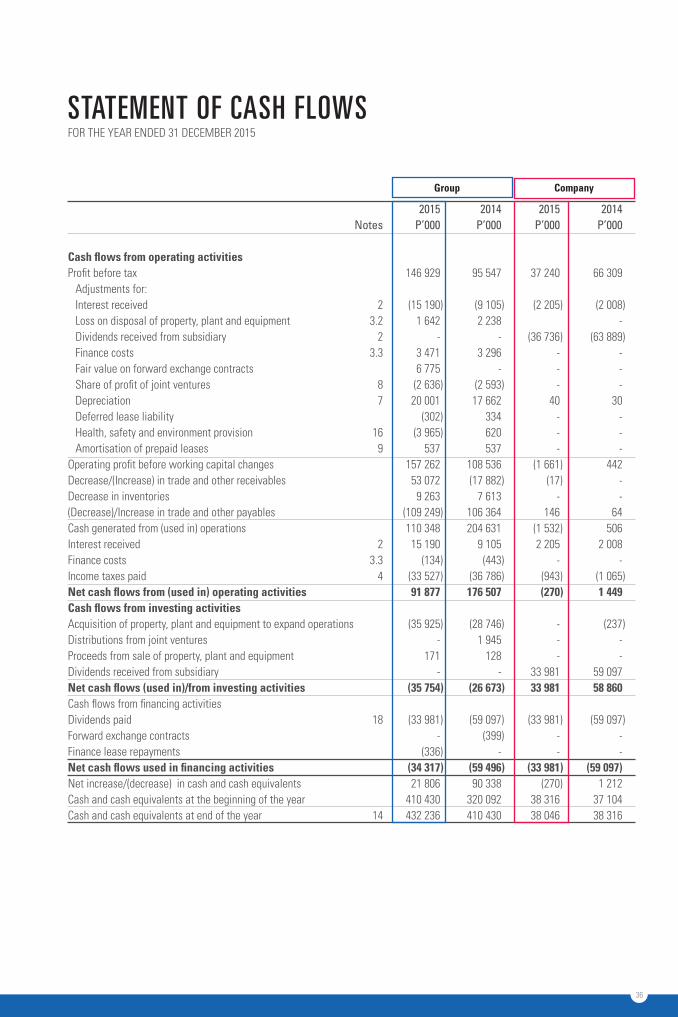
2015 2014 2015 2014 Notes P’000 P’000 P’000 P’000 cash flows from operating activities Profit before tax 146 929 95 547 37 240 66 309
Adjustments for: Interest received 2 (15 190 ) (9 105 ) (2 205 ) (2 008 )Loss on disposal of property, plant and equipment 3.2 1 642 2 238 -Dividends received from subsidiary 2 - - (36 736 ) (63 889 ) Finance costs 3.3 3 471 3 296 - -Fair value on forward exchange contracts 6 775 - - -Share of profit of joint ventures 8 (2 636 ) (2 593 ) - - Depreciation 7 20 001 17 662 40 30 Deferred lease liability (302 ) 334 - -Health, safety and environment provision 16 (3 965 ) 620 - - Amortisation of prepaid leases 9 537 537 - -
Operating profit before working capital changes 157 262 108 536 (1 661 ) 442Decrease/(Increase) in trade and other receivables 53 072 (17 882 ) (17 ) -Decrease in inventories 9 263 7 613 - - (Decrease)/Increase in trade and other payables (109 249 ) 106 364 146 64Cash generated from (used in) operations 110 348 204 631 (1 532 ) 506Interest received 2 15 190 9 105 2 205 2 008Finance costs 3.3 (134 ) (443 ) - -Income taxes paid 4 (33 527 ) (36 786 ) (943 ) (1 065 ) net cash flows from (used in) operating activities 91 877 176 507 (270 ) 1 449cash flows from investing activities Acquisition of property, plant and equipment to expand operations (35 925 ) (28 746 ) - (237 )Distributions from joint ventures - 1 945 - -Proceeds from sale of property, plant and equipment 171 128 - -Dividends received from subsidiary - - 33 981 59 097net cash flows (used in)/from investing activities (35 754 ) (26 673 ) 33 981 58 860Cash flows from financing activities Dividends paid 18 (33 981 ) (59 097 ) (33 981 ) (59 097 )Forward exchange contracts - (399 ) - -Finance lease repayments (336 ) - - -net cash flows used in financing activities (34 317 ) (59 496 ) (33 981 ) (59 097) Net increase/(decrease) in cash and cash equivalents 21 806 90 338 (270 ) 1 212Cash and cash equivalents at the beginning of the year 410 430 320 092 38 316 37 104Cash and cash equivalents at end of the year 14 432 236 410 430 38 046 38 316
STATEMENT OF CASH FLOWSFOR THE YEAR ENDED 31 DECEMBER 2015
group company
37
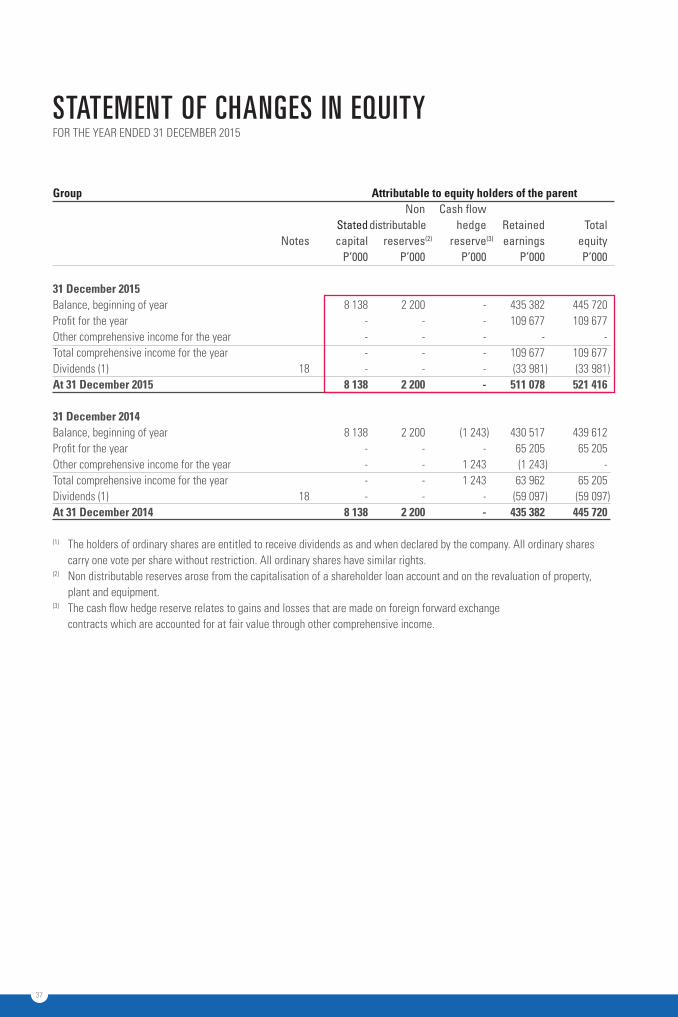
group attributable to equity holders of the parent Non Cash flow Stated distributable hedge Retained Total Notes capital reserves (2) reserve (3) earnings equity P’000 P’000 P’000 P’000 P’000 31 December 2015 Balance, beginning of year 8 138 2 200 - 435 382 445 720Profit for the year - - - 109 677 109 677Other comprehensive income for the year - - - - -Total comprehensive income for the year - - - 109 677 109 677Dividends (1) 18 - - - (33 981 ) (33 981 )at 31 December 2015 8 138 2 200 - 511 078 521 416 31 December 2014 Balance, beginning of year 8 138 2 200 (1 243 ) 430 517 439 612Profit for the year - - - 65 205 65 205Other comprehensive income for the year - - 1 243 (1 243 ) -Total comprehensive income for the year - - 1 243 63 962 65 205Dividends (1) 18 - - - (59 097 ) (59 097 )at 31 December 2014 8 138 2 200 - 435 382 445 720
(1) The holders of ordinary shares are entitled to receive dividends as and when declared by the company. All ordinary shares carry one vote per share without restriction. All ordinary shares have similar rights.
(2) Non distributable reserves arose from the capitalisation of a shareholder loan account and on the revaluation of property, plant and equipment.
(3) The cash flow hedge reserve relates to gains and losses that are made on foreign forward exchange contracts which are accounted for at fair value through other comprehensive income.
STATEMENT OF CHANGES IN EQUITYFOR THE YEAR ENDED 31 DECEMBER 2015
38
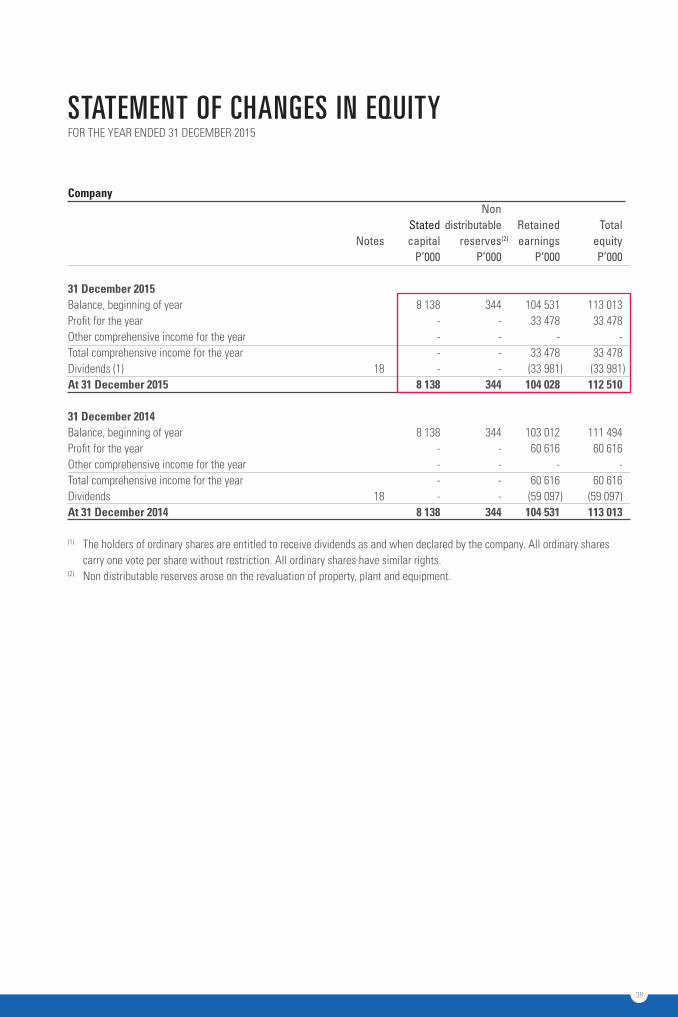
company Non Stated distributable Retained Total Notes capital reserves (2) earnings equity P’000 P’000 P’000 P’000 31 December 2015 Balance, beginning of year 8 138 344 104 531 113 013Profit for the year - - 33 478 33 478Other comprehensive income for the year - - - -Total comprehensive income for the year - - 33 478 33 478Dividends (1) 18 - - (33 981 ) (33 981 )at 31 December 2015 8 138 344 104 028 112 510 31 December 2014 Balance, beginning of year 8 138 344 103 012 111 494Profit for the year - - 60 616 60 616Other comprehensive income for the year - - - -Total comprehensive income for the year - - 60 616 60 616Dividends 18 - - (59 097 ) (59 097)at 31 December 2014 8 138 344 104 531 113 013
(1) The holders of ordinary shares are entitled to receive dividends as and when declared by the company. All ordinary shares carry one vote per share without restriction. All ordinary shares have similar rights.
(2) Non distributable reserves arose on the revaluation of property, plant and equipment.
STATEMENT OF CHANGES IN EQUITYFOR THE YEAR ENDED 31 DECEMBER 2015
39
basis of preparation The financial statements are presented in Botswana Pula. The functional currency is also the Botswana Pula. The amounts in the financial statements have been rounded to the nearest thousand. The financial statements have been prepared on a historical cost basis except as modified by the revaluation of certain financial instruments to fair as indicated in the notes below.
statement of complianceThe financial statements have been prepared in compliance with the International Financial Reporting Standards issued by the International Accounting Standards Board (“IASB”), Interpretations issued by the International Financial Reporting Interpretations Committee of the IASB and the requirements of the Companies Act of Botswana (Companies Act, 2003).
basis of consolidationThe consolidated financial statements comprise the financial statements of the Group and its subsidiaries as at 31 December 2015. Control is achieved when the Group is exposed, or has rights, to variable returns from its involvement with the investee and has the ability to affect those returns through its power over the investee. Specifically, the Group controls an investee if and only if the Group has:• Power over the investee (i.e.
existing rights that give it the current ability to direct the relevant activities of the investee)
• Exposure, or rights, to variable returns from its involvement with the investee, and
• The ability to use its power over the investee to affect its returns
When the Group has less than a majority of the voting or similar rights of an investee, the Group considers allrelevant facts and circumstances in assessing whether it has power over an investee, including:• The contractual arrangement
with the other vote holders of the investee
• Rights arising from other contractual arrangements
• The Group’s voting rights and potential voting rights
The Group re-assesses whether or not it controls an investee if facts and circumstances indicate that there arechanges to one or more of the three elements of control. Consolidation of a subsidiary begins when the Groupobtains control over the subsidiary and ceases when the Group loses control of the subsidiary. Assets, liabilities, income and expenses of a subsidiary acquired or disposed of during the year are included in the statement of profit or loss and other comprehensive income from the date the Group gains control until the date the Group ceases to control the subsidiary.
Profit or loss and each component of other comprehensive income (OCI) are attributed to the equity holders of the parent of the Group and to the non-controlling interests, even if this results in the non-controlling interests having a deficit balance. When necessary, adjustments are made to the financial statements of subsidiaries to bring their accounting policies into line with the Group’s accounting policies. All intra-group assets and liabilities, equity, income, expenses and cash flows relating to transactions between members of the Group are eliminated in full on consolidation.
A change in the ownership interest of a subsidiary, without a loss of control, is accounted for as an equity transaction. If the Group loses control over a subsidiary, it:• Derecognises the assets (including
goodwill) and liabilities of the subsidiary
• Derecognises the carrying amount of any non-controlling interests
• Derecognises the cumulative translation differences recorded in equity
• Recognises the fair value of the consideration received
• Recognises the fair value of any investment retained
• Recognises any surplus or deficit in profit or loss
• Reclassifies the parent’s share of components previously recognised in OCI to profit or loss or retained earnings, as appropriate, as would be required if the Group had directly disposed of the related assets or liabilities.
foreign currency translationfunctional currencyTransactions in foreign currency are initially recorded in the functional currency at a rate of exchange ruling on transaction date. Monetary assets and liabilities designated in foreign currencies are subsequently translated at rates of exchange ruling at the reporting date. Non monetary assets and liabilities that are measured in terms of historical cost in a foreign currency are translated at the exchange rate at the date of the initial transaction.
Foreign exchange translation gains or losses arising on the settlement of monetary items or on translating monetary items at rates different from those used when translating at initial recognition during the period or in
NOTES TO THE FINANCIAL STATEMENTS FOR THE YEAR ENDED 31 DECEMBER 2015
1. sUmmary of significant accoUnting Policies
40
NOTES TO THE FINANCIAL STATEMENTS (continued)FOR THE YEAR ENDED 31 DECEMBER 2015
previous financial statements are taken to the statement of profit or loss and other comprehensive income in the year they arise.
investments in subsidiariesInvestments in subsidiaries are measured at cost in the separate financial statements of the Company.
investments in joint venturesA joint venture is a type of joint arrangement whereby the parties that have joint control of the arrangement have rights to the net assets of the joint venture. Joint control is the contractually agreed sharing of control of an arrangement, which exists only when decisions about the relevant activities require unanimous consent of the parties sharing control. The considerations made in determining joint control are similar to those necessary to determine control over subsidiaries.
The Group’s investments in joint ventures are accounted for using the equity method.
Under the equity method, the investment in a joint venture is initially recognised at cost. The carrying amount of the investment is adjusted to recognise changes in the Group’s share of net assets of the joint venture since the acquisition date. Goodwill relating to the joint venture is included in the carrying amount of the investment and is neither amortised nor individually tested for impairment. The statement of profit or loss reflects the Group’s share of the results of operations of the joint venture. Any change in Other Comprehensive Income (OCI) of those investees is presented as part of the Group’s OCI. In addition, when there has been a change recognised directly in the equity of the joint venture, the Group recognises its share of any changes, when applicable,
in the statement of changes in equity. Unrealised gains and losses resulting from transactions between the Group and the joint venture are eliminated to the extent of the interest in the joint venture.
The aggregate of the Group’s share of profit or loss of a joint venture is shown on the face of the statement of profit or loss and other comprehensive income outside operating profit and represents profit or loss after tax and non-controlling interests in the subsidiaries of the joint venture.
The financial statements of the joint venture are prepared for the same reporting period as the Group. When necessary, adjustments are made to bring the accounting policies in line with those of the Group.
After application of the equity method, the Group determines whether it is necessary to recognise an impairment loss on its investment in its joint venture. At each reporting date, the Group determines whether there is objective evidence that the investment in the joint venture is impaired. If there is such evidence, the Group calculates the amount of impairment as the difference between the recoverable amount of the joint venture and its carrying value, then recognises the loss as ‘Share of loss of a joint venture’ in the statement of profit or loss and other comprehensive income.Upon loss of the joint control over the joint venture, the Group measures and recognises any retained investment at its fair value. Any difference between the carrying amount of the joint venture upon loss of joint control and the fair value of the retained investment and proceeds from disposal is recognised in the statement of profit or loss and other comprehensive income. Joint ventures are carried at cost in the separate financial statements of the company
leasesThe determination of whether an arrangement is, or contains, a lease is based on the substance of the arrangement at inception date: whether fulfilment of the arrangement is dependent on the use of a specific asset or assets or the arrangement conveys a right to use the asset.
finance leasesFinance leases, which transfer to the Group substantially all the risks and benefits incidental to ownership of the leased item, are capitalised at the inception of the lease at the fair value of the leased property or, if lower, at the present value of the minimum lease payments. Lease payments are apportioned between the finance charges and reduction of the lease liability so as to achieve a constant periodic rate of interest on the remaining balance of the liability. Finance charges are reflected in profit or loss.
Capitalised leased assets are depreciated over the shorter of the estimated useful life of the asset and the lease term, if there is no reasonable certainty that the Group will obtain ownership by the end of the lease term. If reasonable certainty exists that ownership will be obtained by the group by the end of the lease term, the leased asset is depreciated over its useful life.
operating leasesLeases where the Group does not transfer or where there is no transfer to it of substantially all the risks and benefits of ownership of the asset are classified as operating leases. Initial direct costs incurred in negotiating an operating lease are added to the carrying amount of the leased asset and recognised over the lease term on the same bases as rental income. Rental
1. sUmmary of significant accoUnting Policies (continued)
41
income or expenses related to minimum lease payments are recognised on a straight line basis over the lease term. Contingent rents are recognised as revenue in the year in which they are incurred.
Property, plant and equipment Property, plant and equipment are stated at historical cost excluding the costs of day to day servicing that are expensed, less accumulated depreciation and any impairment in value. Cost includes the cost of replacing part of such plant and equipment when that cost is incurred if the recognition criteria are met.Costs also include the estimated costs of dismantling and removing the assets where the obligation has been incurred when the asset was acquired or as a consequence of using the asset.Subsequent costs are included in the asset’s carrying amount or recognised as a component, as appropriate, only when it is probable that future economic benefits associated with the item will flow to the Group and the cost of the item can be measured reliably. All other repairs and maintenance expenditures are charged to the statement of comprehensive income during the financial period in which they are incurred.
Depreciation commences when the assets are available for their intended use. Property, plant and equipment are depreciated on a straight-line basis over the expected useful lives of the various classes of assets, after taking into account residual values. Each part of an item of property, plant and equipment with a cost that is significant in relation to the total cost of the item is depreciated separately.
Depreciation of an asset ceases at the earlier of the date that the asset is
classified as held for sale or is included in a disposal group that is classified as held for sale or the date that the asset is derecognised.
The residual value of an asset may increase to an amount equal to or greater than the asset’s carrying amount. If it does, the asset’s depreciation charge is zero until its residual value subsequently decreases to an amount below the asset’s carrying amount.
Useful lives of the property, plant and equipment, the depreciation method, depreciation rates, and residual values are reviewed on an annual basis. Estimated useful lives of the assets are as follows:
Leasehold buildings shorter of period of lease or 50 yearsPlant, equipment, and other 4 – 30 years
Land is not depreciated as it is deemed to have an indefinite life. No depreciation is provided on capital work-in-progress. The carrying amounts of assets are reviewed at each reporting date to assess if there are any indications of impairment. If any such indication exists and where assets are recorded in excess of their recoverable amounts, assets or cash generating units are written down to their recoverable amounts. A cash generating unit is considered only when the recoverable amount for the individual asset cannot be determined.
An item of property, plant and equipment is derecognized upon disposal or when no future economic benefits are expected from its use or disposal. Any gain or loss on derecognition of the asset (calculated as the difference between the net disposal proceeds and the carrying amount of the asset) is included in the statement of profit or loss and other
comprehensive income in the year the asset is derecognized.
Improvements to assets held under operating leases are capitalized and depreciated over the remaining lease term.
Capital work in progress comprises costs incurred in constructing property, plant and equipment that are directly attributable to the construction of the asset. Assets remain in capital work in progress until they are available for use. At that time they are transferred to the appropriate class of property, plant and equipment additions. impairment of non-financial assets The Group assesses, at each reporting date, whether there is an indication that an asset may be impaired. If any indication exists, or when annual impairment testing for an asset is required, the Group estimates the asset’srecoverable amount. An asset’s recoverable amount is the higher of an asset’s or cash-generating unit’s (CGU)fair value less costs of disposal and its value in use. Recoverable amount is determined for an individual asset,unless the asset does not generate cash inflows that are largely independent of those from other assets orgroups of assets. When the carrying amount of an asset or CGU exceeds its recoverable amount, the asset isconsidered impaired and is written down to its recoverable amount.
In assessing value in use, the estimated future cash flows are discounted to their present value using a pre-tax discount rate that reflects current market assessments of the time value of money and the risks specific to the asset. In determining fair value less costs of disposal, recent market
FOR THE YEAR ENDED 31 DECEMBER 2015NOTES TO THE FINANCIAL STATEMENTS (continued)
1. sUmmary of significant accoUnting Policies (continued)
42
NOTES TO THE FINANCIAL STATEMENTS (continued)FOR THE YEAR ENDED 31 DECEMBER 2015
transactions are taken into account. If no such transactions can be identified, an appropriate valuation model is used. These calculations are corroboratedby valuation multiples, quoted share prices for publicly traded companies or other available fair value indicators.The Group bases its impairment calculation on detailed budgets and forecast calculations, which are preparedseparately for each of the Group’s CGUs to which the individual assets are allocated. These budgets and forecast calculations generally cover a period of five years. For longer periods, a long-term growth rate is calculated and applied to project future cash flows after the fifth year.
Impairment losses of continuing operations, including impairment on inventories, are recognised in thestatement of profit or loss and other comprehensive income in expense categories consistent with the function of the impaired asset, except for properties previously revalued with the revaluation taken to OCI. For such properties, the impairment is recognised in OCI up to the amount of any previous revaluation.
For assets excluding goodwill, an assessment is made at each reporting date to determine whether there is anindication that previously recognised impairment losses no longer exist or have decreased. If such indicationexists, the Group estimates the asset’s or CGU’s recoverable amount. A previously recognised impairment loss is reversed only if there has been a change in the assumptions used to determine the asset’s recoverable amount since the last impairment loss was recognised. The reversal is limited so that the carrying amount of the asset does not exceed its recoverable amount, nor exceed the
carrying amount that would have been determined, net of depreciation, had no impairment loss been recognised for the asset in prior years. Such reversal is recognised in the statement of profit or loss and other comprehensive income unless the asset is carried at a revalued amount, in which case, the reversal is treated as a revaluation increase. Decommissioning and rehabilitation of assetsThe expected cost of any committed decommissioning or restoration programme, discounted to its net present value, is provided and capitalised at the beginning of each project. The restoration costs are estimated using estimated cashflows based on current prices. The estimates are discounted at a rate that reflects current market assessments of the time value of money, and the risk specific to the provision. The capitalized cost is depreciated over the expected life of the asset and the increase in the net present value of the provision for the expected cost is included with finance costs.
Subsequent changes in the initial estimates of rehabilitation and decommissioning costs that results from changes in the estimated timing or amount of the outflow of resources embodying economic benefits required to settle the obligation or a change in the discount rate are added to or deducted from the cost of the related asset in the current period. Where the change results in a reduction in the liability, the cost deducted from the asset shall not exceed the carrying amount of the related asset. If a decrease in the liability exceeds the carrying amount of the related asset, the excess is recognised immediately in the statement of profit or loss and other comprehensive income.
Where the change results in an increase in the cost of the asset, the amount is capitalised as part of the cost of the item and depreciated prospectively over the remaining life of the item to which they relate. If there is any indication that the carrying amount of the related asset is not fully recoverable, an impairment test is conducted in accordance with the impairment policy. These estimates are reviewed annually.
The cost of ongoing programmes to prevent and control pollution and to rehabilitate the environment is taken to profit or loss as incurred.
Where a retail site or a depot is disposed of, the unutilised portion of the Disaster, Remediation and Restoration (DRR) costs will be released to the statement of profit or loss and other comprehensive income.
Health, safety and environment costsCosts associated with the remediation of the environment where the company operates retail and commercial sites and depots are recognized in the statement of profit or loss and other comprehensive income. The best estimate of the cost is made taking into account probabilities of the occurrence of spillages.
borrowing costsBorrowing costs directly relating to the acquisition, construction or production of a qualifying capital project under construction are capitalized and added to the project cost during construction until such time the assets are substantially ready for their intended use. Where funds are are borrowed specifically to finance a project, the amount capitalised represents the interest and other costs that the entity incurs in connection with the borrowing of funds. Where surplus funds are available for a short term
1. sUmmary of significant accoUnting Policies (continued)
43
out of money borrowed specifically to finance a project, the income generated from such short term investments is also capitalized and reduced from the total capitalized borrowing cost. Where the funds used to finance a project form part of general borrowings, the amount capitalized is calculated using a weighted average of rates applicable to relevant general borrowings of the Group during the period. All other borrowing costs are recognized in the statement of profit and loss and other comprehensive income in the period in which they are incurred.
inventories Inventories consist of petroleum products and are initially recognised at cost and subsequently measured at the lower of cost and net realisable value. Cost is determined on the first-in-first-out (FIFO) method. The cost of inventories comprises of all costs of purchase, cost of conversion and other costs incurred in bringing the inventories to their present location and condition.
Net realisable value is the estimated selling price in the ordinary course of business, less estimated costs of completion and the estimated costs necessary to make the sale.
The amount of any write-down of inventory to net realisable value and all losses of inventory are recognised as an expense in the period that the write-down or loss occurs.
The carrying value of inventories derecognised is included in the cost of sales in the statement of profit or loss and other comprehensive income.
accommodationA contractual arrangement between two oil companies not constituting a contract of sale, whereby the one oil company
agrees to supply product to another oil company, with the understanding that the specific volume or product is owed to the supplier until a like product and volume is returned to the supplier. Product loaned/borrowed at the accounting date is valued at the most recent product price. The adjustment to most recent product price is included in the cost of sales in the statement of profit or loss and other comprehensive income. cost of goods soldCost of goods sold is normally the carrying value of inventories sold and any net realizable value adjustments. Upon re-measurement product loaned/borrowed is revalued and the corresponding entry is included in the cost of sales in the statement of profit or loss and other comprehensive income.
Dividend distributionDividend distributions to the Group’s shareholders are recognized as a liability in the period in which the dividends are declared by the Group’s shareholders. Dividends distributed are recognized in equity. Tax is withheld on dividends distributed at the statutory rate of 7.5%. employee benefitsDuring the year, employees contributed to the Engen Botswana Pension Fund and the Engen Retirement Fund. Both funds are defined contribution funds. All Funds are governed by the Botswana Pension and Provident Funds Act of 1987. Membership of these funds is compulsory for all employees.
In terms of the rules of the Funds, the company is committed to contribute 9.5% of the employees’ pensionable emoluments. The defined contribution funds are not required to be actuarially valued. The Group’s contributions to the defined contribution plans are charged to
the statement of profit or loss and other comprehensive income in the year to which they relate.
Employee entitlements to annual leave, bonuses, and pension and severance benefits are recognised as incurred. A provision is made for the estimated liability for annual leave as a result of services rendered by employees up to the reporting date. Provision for bonuses is recognised when a present obligation exists to make such payments and a reliable estimate of the amount can be made. revenue recognitionRevenue is recognised at the fair value of the consideration received or receivable net of discounts and related taxes and consists primarily of the sale of products, refinery processing fees, rental income, convenience income, dividends received and interest received.
Revenue is recognised to the extent that it is probable that the economic benefits will flow to the Company and Group and the revenue can be reliably measured. The following specific recognition criteria must also be met before revenue is recognised sale of goodsRevenue is recognised when the significant risks and rewards of ownership of the goods have passed to the buyer and the revenue can be reliably measured. Petroleum product sales are stated net of discounts, rebates, value-added tax, customs duty and government levies and are adjusted for slate under/over recoveries.
The selling prices of certain petroleum products are subject to price control by the authorities. The selling prices are adjusted periodically to provide for the
FOR THE YEAR ENDED 31 DECEMBER 2015NOTES TO THE FINANCIAL STATEMENTS (continued)
1. sUmmary of significant accoUnting Policies (continued)
44
NOTES TO THE FINANCIAL STATEMENTS (continued)FOR THE YEAR ENDED 31 DECEMBER 2015
under or over-recoveries of changes in the various items of landed cost of these products. The price adjustments by the authorities are, for various reasons, not made simultaneously with changes in landed cost and thus the situation arises that oil companies, from time to time, are in a position of over or under-recovery of changes in cost.
An accrual is made at year end for net under or over-recoveries on controlled products.
convenience incomeRevenue is recognised on an accrual basis in accordance with the substance of the relevant agreement. Convenience income comprises of fast food and quick shop income. interestRevenue is recognized as the interest accrues using the effective interest rate method.
operating lease rental incomeRevenue from minimum lease payments is recognised on a straight line basis over the lease term. Contingent rentals received or incurred are accounted for as and when the rentals are received or incurred. DividendsRevenue is recognised when the shareholders’ right to receive the payment is established.
taxes current income taxCurrent income tax assets and liabilities for the current and prior periods are measured at the amount expected to be recovered from or paid to the taxation authorities. The tax rates and tax laws used to compute the amount are those that are enacted or substantively enacted by the reporting date.
Current income tax relating to items recognised directly in other comprehensive income or equity is recognised in other comprehensive income or equity and not in profit or loss. Witholding taxes are paid to the government and they are a portion of the total dividend that is declared. Deferred taxDeferred tax is provided using the liability method on temporary differences at the reporting date between the tax bases of assets and liabilities and their carrying amounts for financial reporting purposes.
Deferred tax liabilities are recognised for all taxable temporary differences, except:• where the deferred tax liability
arises from the initial recognition of goodwill or of an asset or liability in a transaction that is not a business combination and, at the time of the transaction, affects neither the accounting profit nor taxable profit or loss; and
• in respect of taxable temporary differences associated with investments in subsidiaries, associates and interests in joint ventures, where the timing of the reversal of the temporary differences can be controlled and it is probable that the temporary differences will not reverse in the foreseeable future.
Deferred tax assets are recognised for all deductible temporary differences, carry forward of unused tax credits and unused tax losses, to the extent that it is probable that taxable profit will be available against which the deductible temporary differences, and the carry forward of unused tax credits and unused tax losses can be utilised except:• where the deferred tax asset
relating to the deductible temporary difference arises from the initial recognition of an asset or liability in a transaction that is not a business combination and, at the time of the transaction, affects neither the accounting profit nor taxable profit or loss; and
• in respect of deductible temporary differences associated with investments in subsidiaries, associates and interests in joint ventures, deferred tax assets are recognised only to the extent that it is probable that the temporary differences will reverse in the foreseeable future and taxable profit will be available against which the temporary differences can be utilised.
The carrying amount of deferred tax assets is reviewed at each reporting date and reduced to the extent that it is no longer probable that sufficient taxable profit will be available to allow all or part of the deferred tax asset to be utilised. Unrecognised deferred income tax assets are reassessed at each reporting date and are recognised to the extent that it has become probable that future taxable profit will allow the deferred tax asset to be recovered.
Deferred tax assets and liabilities are measured at the tax rates that are expected to apply to the year when the asset is realised or the liability is settled, based on tax rates (and tax laws) that have been enacted or substantively enacted at the reporting date. Also taking into account the manner of recovery of the underlying asset or liability.
Deferred tax relating to items recognised outside profit or loss is recognised outside profit or loss. Deferred
1. sUmmary of significant accoUnting Policies (continued)
45
tax items are recognised in correlation to the underlying transaction either in other comprehensive income or directly in equity.
Deferred tax assets and deferred tax liabilities are offset if a legally enforceable right exists to set off current tax assets against current income tax liabilities and the deferred taxes relate to the same taxable entity and the same taxation authority. ProvisionsProvisions are recognised when the Group has a present obligation (legal or constructive) as a result of a past event, it is probable that an outflow of resources embodying economic benefits will be required to settle the obligation and a reliable estimate can be made of the amount of the obligation. When the Group expects some or all of a provision to be reimbursed, for example, under an insurance contract, the reimbursement is recognised as a separate asset, but only when the reimbursement is virtually certain. The expense relating to a provision is presented in the statement of profit or loss and other comprehensive income net of any reimbursement. financial instrumentsFinancial assets within the scope of IAS 39 are classified as loans and receivables and at fair value through profit or loss financial assets . When financial instruments are recognised initially, they are measured at fair value plus, in the case of a financial asset or financial liability not at fair value through profit or loss, transaction costs that are directly attributable to the acquisition or issue of the financial asset or financial liability. The group and company recognise a financial instrument on its statement of financial position when it becomes a party to the contractual provisions of the instrument.
The Group determines the classification of its financial assets and financial liabilities on initial recognition and, where allowed and appropriate, re-evaluates this designation at each financial year end.
All regular way purchases and sales of financial assets are recognised on the trade date, which is the date that the Group commits to purchase the asset. Regular way purchases or sales are purchases or sales of financial assets that require delivery of assets within the period generally established by regulation or convention in the marketplace. loans and receivablesA loan and receivable financial instrument is one that is a non-derivative financial assets with fixed or determinable payments that are not quoted in an active market.
trade and other receivablesTrade and other receivables are subsequently measured at amortised cost using the effective interest rate method.
Gains and losses are recognised in income when the trade and other receivables are derecognised or impaired, as well as through the amortisation process.Trade and other receivables are included in current assets if they are expected to mature within 12 months of the reporting date.
cash and cash equivalentsFor the purpose of the consolidated statement of cash flows, cash and cash equivalents consist of cash and deposits on call in banks, net of outstanding bank overdrafts. Cash and cash equivalents are subsequently carried at amortised
cost. Due to the short-term nature of these, the amortised cost approximates their fair value.
Unquoted investmentsUnquoted investments are measured at amortised cost as they are loan instruments. These investments are investments in debt instruments which are classified as loans and receivables and therefore measured at amortised cost.
amortised costLoans and receivables are subsequently measured at amortised cost. This is computed using the effective interest method less any allowance for impairment. The calculation takes into account any premium or discount on acquisition and includes transaction costs and fees that are an integral part of the effective interest rate.
fair value through profit or lossForward exchange contracts are derivatives that are classified as financial assets or liabilities at fair value through profit or loss. Financial instruments at fair value through profit or loss are carried in the statement of financial position at fair value with changes in fair value recognised in profit or loss. fair valueThe Group measures derivatives at fair value at each balance sheet date and, for the purposes of impairment testing, uses fair value less costs of disposal to determine the recoverable amount of some of its non-financial assets. Also, fair values of financial instruments measured at amortised cost are disclosed in Note 22.
Fair value is the price that would be received to sell an asset or paid to transfer a liability in an orderly
FOR THE YEAR ENDED 31 DECEMBER 2015NOTES TO THE FINANCIAL STATEMENTS (continued)
1. sUmmary of significant accoUnting Policies (continued)
46
NOTES TO THE FINANCIAL STATEMENTS (continued)FOR THE YEAR ENDED 31 DECEMBER 2015
transaction between market participants at the measurement date. The fair value measurement is based on the presumption that the transaction to sell the asset or transfer the liability takes place either:• In the principal market for the asset
or liability, or• In the absence of a principal
market, in the most advantageous market for the asset or liability
The principal or the most advantageous market must be accessible by the Group.The fair value of an asset or a liability is measured using the assumptions that market participants would use when pricing the asset or liability, assuming that market participants act in their economic best interest.
A fair value measurement of a non-financial asset takes into account a market participant’s ability to generate economic benefits by using the asset in its highest and best use or by selling it to another market participant that would use the asset in its highest and best use.The Group uses valuation techniques that are appropriate in the circumstances and for which sufficient data are available to measure fair value, maximising the use of relevant observable inputs and minimising the use of unobservable inputs.
All assets and liabilities for which fair value is measured or disclosed in the financial statements are categorised within the fair value hierarchy, described as follows, based on the lowest-level input that is significant to the fair value measurement as a whole:• Level 1 — Quoted (unadjusted)
market prices in active markets for identical assets or liabilities
• Level 2 — Valuation techniques for which the lowest-level input
that is significant to the fair value measurement is directly or indirectly observable
• Level 3 — Valuation techniques for which the lowest-level input that is significant to the fair value measurement is unobservable
For assets and liabilities that are recognised in the financial statements on a recurring basis, the Group determines whether transfers have occurred between levels in the hierarchy by reassessing categorisation (based on the lowest-level input that is significant to the fair value measurement as a whole) at the end of each reporting period.
The Group’s audit committee determines the policies and procedures for both recurring fair value measurements, such as derivatives, and non-recurring fair value measurements, such as impairment tests. At each reporting date, the valuation committee analyses the movements in the values of assets and liabilities which are required to be re-measured or reassessed as per the Group’s accounting policies. For this analysis, the valuation committee verifies the major inputs applied in the latest valuation by agreeing the information in the valuation computation to contracts and other relevant documents.On an interim basis, the valuation committee presents the valuation results to the audit committee and theGroup’s independent auditors. This includes a discussion of the major assumptions used in the valuations.For the purpose of fair value disclosures, the Group has determined classes of assets and liabilities based on the nature, characteristics and risks of the asset or liability and the level of the fair value hierarchy as explained above.
trade and other payablesTrade and other payables are subsequently measured at amortised cost using the effective interest rate method. Gains and losses are recognised in the statement of profit or loss and other comprehensive income when the trade and other payables are derecognised as well as through the amortisation process.
Trade and other payables are short term in nature and are categorised as other financial liabilities at amortised cost for measurement purposes.
Interest relating to a financial liability is recognised in the statement of profit or loss and other comprehensive income in the period in which it arises, based on the effective interest rate method. Derecognition of financial assetsA financial asset is derecognised when:• the rights to receive cash flows
from the asset have expired;• the Group has transferred its
rights to receive cash flows from the asset, or has assumed an obligation to pay the received cash flows in full without material delay to a third party under a ‘pass through’ arrangement, and either (a) the group has transferred substantially all the risks and rewards of the asset, or (b) the group has neither transferred nor retained substantially all the risks and rewards of the asset, but has transferred control of the asset.
When the Group has transferred its rights to receive cash flows from an asset and has neither transferred nor retained substantially all the risks and rewards of the asset nor transferred control of the asset, the asset is recognised to the extent of the Group’s continuing
1. sUmmary of significant accoUnting Policies (continued)
47
involvement in the asset. Continuing involvement that takes the form of a guarantee over the transferred asset is measured at the lower of the original carrying amount of the asset and the maximum amount of consideration that the Group could be required to repay.
When continuing involvement takes the form of a written and/or purchased option (including a cash settled option or similar provision) on the transferred asset, the extent of the Group’s continuing involvement is the amount of the transferred asset that the Group may repurchase, except that in the case of a written put option (including a cash settled option or similar provision) on an asset measured at fair value, the extent of the Group’s continuing involvement is limited to the lower of the fair value of the transferred asset and the option exercise price. Derecognition of financial liabilitiesA financial liability is derecognised when the obligation under the liability is discharged or cancelled or expires.
Where an existing financial liability is replaced by another from the same lender on substantially different terms, or the terms of an existing liability are substantially modified, such an exchange or modification is treated as a derecognition of the original liability and the recognition of a new liability, and the difference in the respective carrying amounts is recognised in the statement of profit or loss and other comprehensive income.
impairment of financial assets at amortised costThe group assesses at each reporting date whether a financial asset or group of financial assets is impaired. The group assesses impairment of assets on an individual basis.
If there is objective evidence that an impairment loss on assets carried at amortised cost has been incurred, the amount of the loss is measured as the difference between the asset’s carrying amount and the present value of estimated future cash flows (excluding future expected credit losses that have not been incurred) discounted at the financial asset’s original effective interest rate (i.e. the effective interest rate computed at initial recognition). The carrying amount of the asset is reduced through use of a separate allowance account, namely provision for doubtful debts account. The amount of the loss shall be recognised in profit or loss.
If, in a subsequent period, the amount of the impairment loss decreases and the decrease can be related objectively to an event occurring after the impairment was recognised, the previously recognised impairment loss is reversed. Reversal of impairment losses on financial assets at amortised cost is limited to the level that would have been the amortised cost had the asset not been impaired with the impairment. Any subsequent reversal of an impairment loss is recognised in profit or loss.
In relation to financial assets, a provision for impairment is made when there is objective evidence (such as the probability of insolvency or significant financial difficulties of the debtor) that the Group will not be able to collect all of the amounts due under the original terms of the invoice. The carrying amount of the receivable is reduced through use of an allowance account. Impaired debts are derecognised when they are assessed as uncollectible.
significant accounting judgments and estimatesThe preparation of financial statements in conformity with International Financial Reporting Standards requires the use of certain critical accounting estimates and judgments concerning the future. Estimates and judgments are continually evaluated and are based on historical factors coupled with expectations about future events that are considered reasonable. In the process of applying the groups accounting policies, management has made the following estimates that have a significant risk of causing material adjustment to the carrying amount of assets and liabilities within the next year.
The key assumptions concerning the future and other key sources of estimation uncertainty and judgments at the reporting date, that have a significant risk of causing a material adjustment to the carrying amounts of assets and liabilities within the next financial year as they involve assessments or decisions that are particularly complex or subjective, are discussed below:
allowances for doubtful debtsThis allowance is created where there is objective evidence, for example the probability of insolvency or significant financial difficulties of the debtor, that the group will not be able to collect all the amounts due under the original terms of the invoice based on past experience and debtors ageing at year end. An estimate is made with regard to the probability of insolvency and the estimated amount of debtors who will not be able to pay. The discount rate used to determine the present value of the financial asset is the original effective interest rate of the relevant instrument. Refer to note 13.
FOR THE YEAR ENDED 31 DECEMBER 2015NOTES TO THE FINANCIAL STATEMENTS (continued)
1. sUmmary of significant accoUnting Policies (continued)
48
NOTES TO THE FINANCIAL STATEMENTS (continued)FOR THE YEAR ENDED 31 DECEMBER 2015
allowances for slow moving inventoryBased on prior management practice, inventory that has not moved for a 12-month period is considered to be obsolete. Obsolete and discontinued products are considered to have no value. The provision is raised based on the full cost or net realisable values of the product. Refer to note 12.
allowances for accommodation receivableThis allowance is created where there is objective evidence, for example mismatching of invoices with the other oil company, that the product receivable will not be recovered.
asset retirement and removal obligationsEstimating the future costs of these obligations is complex and requires management to make estimates and judgments regarding future cash flows and discount rates because most of the obligations will only be fulfilled in the future. Changing technologies, political, environmental, safety, business and statutory considerations, could also influence the resulting provisions. Management judgement is exercised when determining the present value of expected future cash flows when the obligation to dismantle or restore the sites arises as well as the estimated useful life of the related asset. The useful lives of the assets are considered to be equal to the remaining lease term under the assumption that the lease will not be renewed, and this impacts on the obligation. The provision for the costs of decommissioning these sites at the end of their economic lives has been estimated using existing technology, at current prices and discounted using a real discount rate of 7.43% (December 2014 – 7.44%).
The Group’s asset retirement obligations are coupled with the estimated remaining useful lives of the asset to which they relate. The carrying value of the dismantling and removal costs provision as at 31 December 2015 is P51 560 756 (December 2014: P43 074 702) (Note 16). There is uncertainty regarding both the amount and timing of incurring these costs allowance for health safety and environmentThis allowance is based on probabilities of spillages of petroleum products occurring at each retail, commercial or fuel depot. The costs are based on the point in time costs and are discounted to present value.
Joint arrangementsThe Group has a 40% and 25% interest in the Engen Palapye Partnership and the Engen Maun Partnership respectively. It has joint control over both entities based on the contractual terms of the partnership agreements. Both arrangements are classified as joint ventures and all parties to the arrangement have rights to the net assets of the entities according to their respective interests.
new and amended standards and interpretationsThe Company applied for the first time certain standards and amendments, which are effective for annual periods beginning on or after 1 July 2014.ias 19 Defined benefit Plans: employee contributions — amendments to ias 19Effective for annual periods beginning on or after 1 July 2014. IAS 19 requires an entity to consider contributions from employees or third parties when accounting for defined benefit plans.
IAS 19 requires such contributions that are linked to service to be attributed to periods of service as a negative benefit. The amendments clarify that, if the amount of the contributions is independent of the number of years of service, an entity is permitted to recognise such contributions as a reduction in the service cost in the period in which the service is rendered, instead of allocating the contributions to the periods of service. Examples of such contributions include those that are a fixed percentage of the employee’s salary, a fixed amount of contributions throughout the service period, or contributions that depend on the employee’s age. This amendment to IAS 19 has no impact on the company as it does not have a defined benefit plan.
standards and interpretations issued and not yet effectiveStandards issued but not yet effective up to the date of issuance of the Company’s financial statements are listed below. This listing of standards and interpretations issued are those that the Company reasonably expects to have an impact on disclosures, financial position or performance when applied at a future date. The Company intends to adopt these standards when they become effective.
ifrs 9 financial instrumentsThe amendment is effective for annual periods beginning on or after 1 January 2018.
Classification and measurement of financial assets. All financial assets are measured at fair value on initial recognition, adjusted for transaction costs, if the instrument is not accounted for at fair value through profit or loss (FVTPL). Debt instruments are subsequently measured at FVTPL,
1. sUmmary of significant accoUnting Policies (continued)
49
amortised cost, or fair value through other comprehensive income (FVOCI), on the basis of their contractual cash flows and the business model under which the debt instruments are held. There is a fair value option (FVO) that allows financial assets on initial recognition to be designated as FVTPL if that eliminates or significantly reduces an accounting mismatch.
Equity instruments are generally measured at FVTPL. However, entities have an irrevocable option on an instrument-by instrument basis to present changes in the fair value of non-trading instruments in other comprehensive income (OCI) without subsequent reclassification to profit or loss. The adoption of this standard is not expected to have a material impact on the group, however, it will assess its impact in future.
ifrs 10, ifrs 12 and ias 28 investment entities: applying the consolidation exception - amendments to ifrs 10, ifrs 12 and ias 28The amendment is effective for annual periods beginning on or after 1 January 2016. The amendments address three issues that have arisen in applying the investment entities exception under IFRS 10. The amendments to IFRS 10 clarify that the exemption in paragraph 4 of IFRS 10 from presenting consolidated financial statements applies to a parent entity that is a subsidiary of an investment entity, when the investment entity measures its subsidiaries at fair value. Furthermore, the amendments to IFRS 10 clarify that only a subsidiary of an investment entity that is not an investment entity itself and that provides support services to the investment entity is consolidated. All other subsidiaries of an investment entity are measured at
fair value. The amendments to IAS 28 allow the investor, when applying the equity method, to retain the fair value measurement applied by the investment entity associate or joint venture to its interests in subsidiaries. The adoption of these standards is not expected to have a material impact on the group, however, it will assess their impact in future.
ifrs 10 and ias 28 sale or contribution of assets between an investor and its associate or Joint venture – amendments to ifrs 10 and ias 28In August 2015, the IASB issued Exposure Draft ED/2015/7 Effective Date of Amendments to IFRS 10 and IAS 28 proposing to defer the effective date of the amendments until such time as it has finalised any amendments that result from its research project on the equity method. The amendments address the conflict between IFRS 10 and IAS 28 in dealing with the loss of control of a subsidiary that is sold or contributed to an associate or joint venture. The amendments clarify that a full gain or loss is recognised when a transfer to an associate or joint venture involves a business as defined in IFRS 3 Business Combinations. Any gain or loss resulting from the sale or contribution of assets that does not constitute a business, however, is recognised only to the extent of unrelated investors’ interests in the associate or joint venture. The adoption of these standards is not expected to have a material impact on the group, however, it will assess their impact in future.ifrs 11 accounting for acquisitions of interests in Joint operations – amendments to ifrs 11Effective for annual periods beginning on or after 1 January 2016. The amendments require an entity acquiring an interest in a joint operation, in which the activity of the joint operation
constitutes a business, to apply, to the extent of its share, all of the principles in IFRS 3 and other IFRSs that do not conflict with the requirements of IFRS 11 Joint Arrangements. Furthermore, entities are required to disclose the information required by IFRS 3 and other IFRSs for business combinations. The amendments also apply to an entity on the formation of ajoint operation if, and only if, an existing business is contributed by one of the parties to the joint operation on its formation. Furthermore, the amendments clarify that, for the acquisition of an additional interest in a joint operation in which the activity of the joint operation constitutes a business, previously held interests in the joint operation must not be remeasured if the joint operator retains joint control. The adoption of this standard is not expected to have a material impact on the group, however, it will assess its impact in future.
ifrs 15 revenue from contracts with customersEffective for annual periods beginning on or after 1 January 2018. IFRS 15 replaces all existing revenue requirements in IFRS (IAS 11 Construction Contracts, IAS 18 Revenue, IFRIC 13 Customer Loyalty Programmes, IFRIC 15 Agreements for the Construction of Real Estate, IFRIC 18 Transfers of Assets from Customers and SIC 31 Revenue – Barter Transactions Involving Advertising Services) and applies to all revenue arising from contracts with customers, unless the contracts are in the scope of other standards, such as IAS 17. Its requirements also provide a model for the recognition and measurement of gains and losses on disposal of certain non-financial assets, including property, equipment and intangible assets. The standard outlines the principles an entity must apply to measure and recognise
FOR THE YEAR ENDED 31 DECEMBER 2015NOTES TO THE FINANCIAL STATEMENTS (continued)
1. sUmmary of significant accoUnting Policies (continued)
50
NOTES TO THE FINANCIAL STATEMENTS (continued)FOR THE YEAR ENDED 31 DECEMBER 2015
revenue. The core principle is that anentity will recognise revenue at an amount that reflects the consideration to which the entity expects to be entitled in exchange for transferring goods or services to a customer. The principles in IFRS 15 will be applied using a five-step model:1. Identify the contract(s) with a
customer2. Identify the performance
obligations in the contract3. Determine the transaction price4. Allocate the transaction price to
the performance obligations in the contract
5. 5. Recognise revenue when (or as) the entity satisfies a performance obligation
The standard requires entities to exercise judgement, taking into consideration all of the relevant facts and circumstances when applying each step of the model to contracts with their customers. The standard also specifies how to account for the incremental costs of obtaining a contract and the costs directly related to fulfilling a contract. Application guidance is provided in IFRS 15 to assist entities in applying its requirements to certain common arrangements, including licences of intellectual property, warranties, rights of return, principal-versus-agent considerations, options for additional goods or services and breakage. The group intends to adopt this standard and will assess its impact in future.
ias 1 Disclosure initiative – amendments to ias 1 Effective for annual periods beginning on or after 1 January 2016. The amendments to IAS 1 Presentation of Financial Statements clarify, rather than significantly change, existing IAS 1 requirements. The amendments clarify:
• The materiality requirements in IAS 1
• That specific line items in the statement(s) of profit or loss and OCI and the statement of financial position may be disaggregated
• That entities have flexibility as to the order in which they present the notes to financial statements
• That the share of OCI of associates and joint ventures accounted for using the equity method must be presented in aggregate as a single line item, and classified between those items that will or will not be subsequently reclassified to profit or loss Furthermore, the amendments clarify the requirements that apply when additional subtotals are presented in the statement of financial position and the statement(s) of profit or loss and OCI. The adoption of this standard is not expected to have a material impact on the group, however, it will assess its impact in future.
ias 16 and ias 38 clarification of acceptable methods of Depreciation and amortisation –amendments to ias 16 and ias 38Effective for annual periods beginning on or after 1 January 2016. The amendments clarify the principle in IAS 16 Property, Plant and Equipment and IAS 38 Intangible Assets that revenue reflects a pattern of economic benefits that are generated from operating a business (of which the asset is part) rather than the economic benefits that are consumed through use of the asset. As a result, the ratio of revenue generated to total revenue expected to be generated cannot be used to depreciate property, plant and equipment and may only be used in very limited circumstances to amortise intangible
assets. The adoption of these standards is not expected to have a material effect of the group, however, it will assess their impact in future.
ias 27 equity method in separate financial statements – amendments to ias 27Effective for annual periods beginning on or after 1 January 2016. The amendments to IAS 27 Separate Financial Statements allow an entity to use the equity method as described in IAS 28 to account for its investments in subsidiaries, joint ventures and associates in its separate financial statements. Therefore, an entity must account for these investments either:• At cost• In accordance with IFRS 9 (or IAS
39)Or• Using the equity method
The entity must apply the same accounting for each category of investment. A consequential amendment was also made to IFRS 1 First-time Adoption of International Financial Reporting Standards. The amendment to IFRS 1 allows a first-time adopter accounting for investments in the separate financial statements using the equity method, to apply the IFRS 1 exemption for past business combinations to the acquisition of the investment. The adoption of this standard is not expected to have a material impact on the group, however, it will assess its impact in future.
1. sUmmary of significant accoUnting Policies (continued)
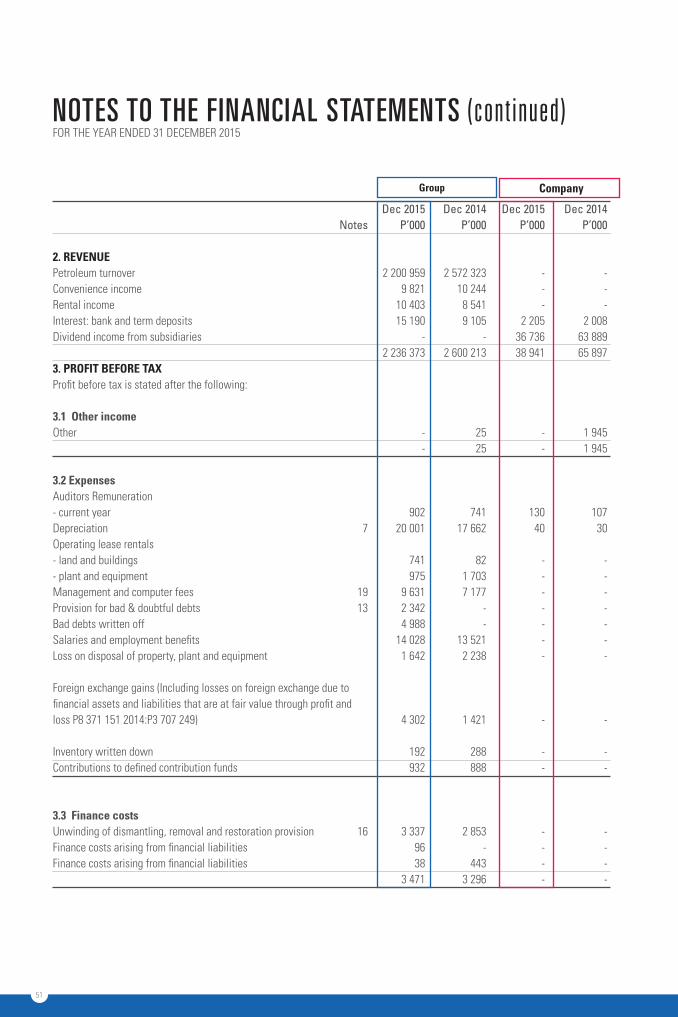
51
NOTES TO THE FINANCIAL STATEMENTS (continued)FOR THE YEAR ENDED 31 DECEMBER 2015
Dec 2015 Dec 2014 Dec 2015 Dec 2014 Notes P’000 P’000 P’000 P’000 2. revenUe Petroleum turnover 2 200 959 2 572 323 - -Convenience income 9 821 10 244 - -Rental income 10 403 8 541 - -Interest: bank and term deposits 15 190 9 105 2 205 2 008Dividend income from subsidiaries - - 36 736 63 889 2 236 373 2 600 213 38 941 65 897 3. Profit before taX Profit before tax is stated after the following: 3.1 other income Other - 25 - 1 945 - 25 - 1 945
3.2 expenses Auditors Remuneration - current year 902 741 130 107Depreciation 7 20 001 17 662 40 30Operating lease rentals - land and buildings 741 82 - -- plant and equipment 975 1 703 - -Management and computer fees 19 9 631 7 177 - -Provision for bad & doubtful debts 13 2 342 - - -Bad debts written off 4 988 - - -Salaries and employment benefits 14 028 13 521 - -Loss on disposal of property, plant and equipment 1 642 2 238 - -
Foreign exchange gains (Including losses on foreign exchange due to financial assets and liabilities that are at fair value through profit and loss P8 371 151 2014:P3 707 249) 4 302 1 421 - -
Inventory written down 192 288 - -Contributions to defined contribution funds 932 888 - -
3.3 finance costs Unwinding of dismantling, removal and restoration provision 16 3 337 2 853 - -Finance costs arising from financial liabilities 96 - - -Finance costs arising from financial liabilities 38 443 - - 3 471 3 296 - -
group company
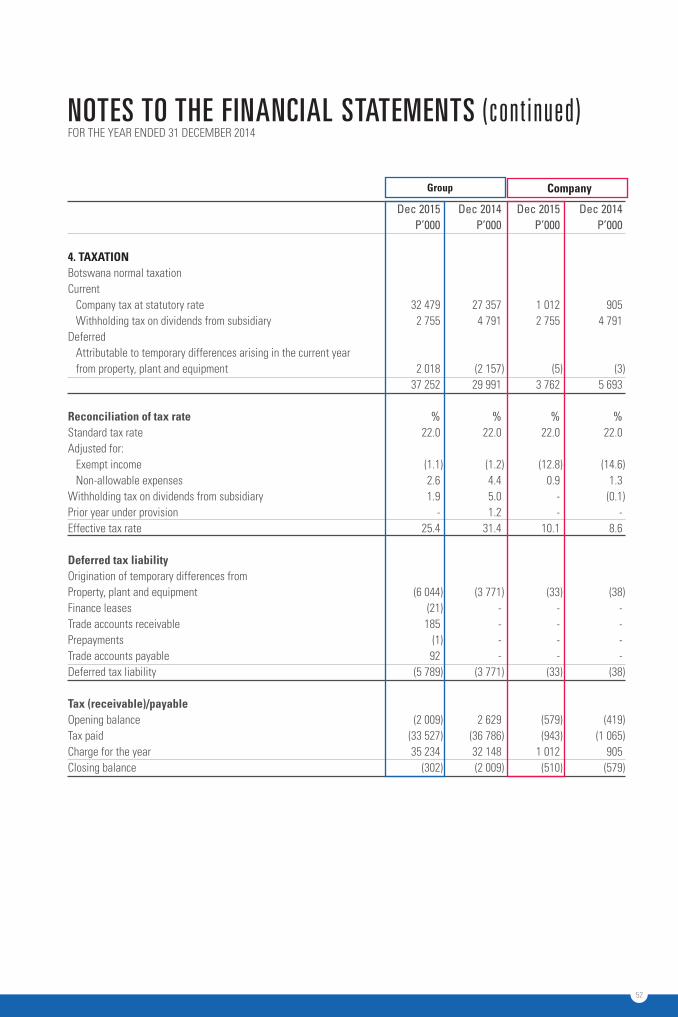
52
Dec 2015 Dec 2014 Dec 2015 Dec 2014 P’000 P’000 P’000 P’000 4. taXation Botswana normal taxation Current
Company tax at statutory rate 32 479 27 357 1 012 905Withholding tax on dividends from subsidiary 2 755 4 791 2 755 4 791
Deferred Attributable to temporary differences arising in the current yearfrom property, plant and equipment 2 018 (2 157 ) (5 ) (3 ) 37 252 29 991 3 762 5 693
reconciliation of tax rate % % % %Standard tax rate 22.0 22.0 22.0 22.0Adjusted for:
Exempt income (1.1 ) (1.2 ) (12.8 ) (14.6 )Non-allowable expenses 2.6 4.4 0.9 1.3
Withholding tax on dividends from subsidiary 1.9 5.0 - (0.1 )Prior year under provision - 1.2 - -Effective tax rate 25.4 31.4 10.1 8.6
Deferred tax liability Origination of temporary differences fromProperty, plant and equipment (6 044 ) (3 771 ) (33 ) (38 )Finance leases (21 ) - - -Trade accounts receivable 185 - - -Prepayments (1 ) - - -Trade accounts payable 92 - - -Deferred tax liability (5 789 ) (3 771 ) (33 ) (38 )
tax (receivable)/payable Opening balance (2 009 ) 2 629 (579 ) (419 )Tax paid (33 527 ) (36 786 ) (943 ) (1 065 )Charge for the year 35 234 32 148 1 012 905Closing balance (302 ) (2 009 ) (510 ) (579 )
NOTES TO THE FINANCIAL STATEMENTS (continued)FOR THE YEAR ENDED 31 DECEMBER 2014
group company
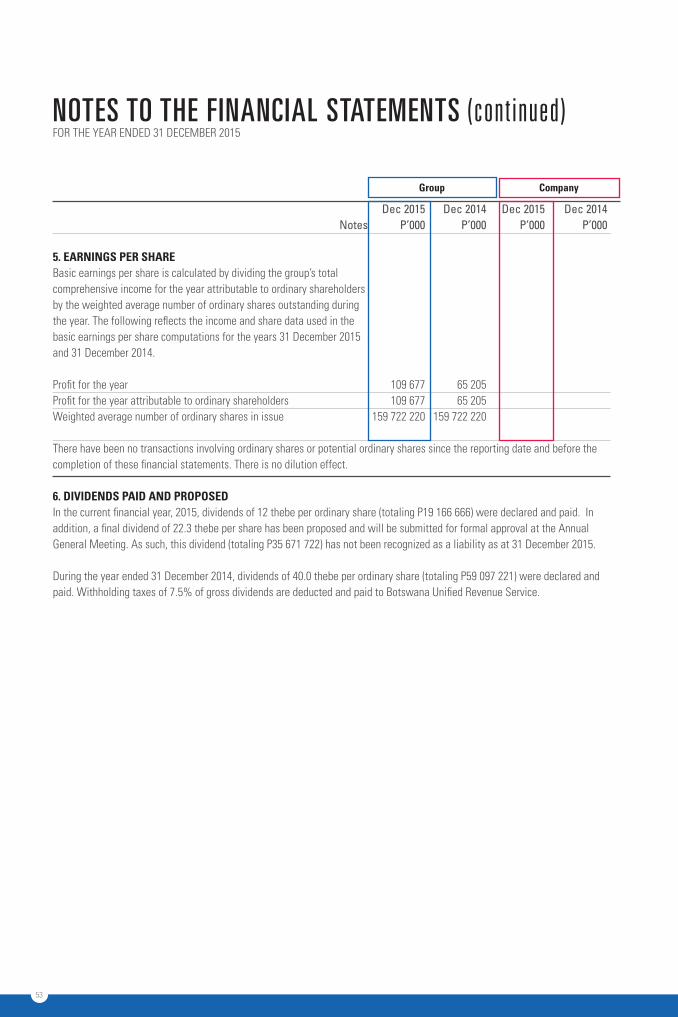
53
Dec 2015 Dec 2014 Dec 2015 Dec 2014 Notes P’000 P’000 P’000 P’000 5. earnings Per sHare Basic earnings per share is calculated by dividing the group’s total comprehensive income for the year attributable to ordinary shareholders by the weighted average number of ordinary shares outstanding during the year. The following reflects the income and share data used in the basic earnings per share computations for the years 31 December 2015 and 31 December 2014. Profit for the year 109 677 65 205 Profit for the year attributable to ordinary shareholders 109 677 65 205 Weighted average number of ordinary shares in issue 159 722 220 159 722 220
There have been no transactions involving ordinary shares or potential ordinary shares since the reporting date and before the completion of these financial statements. There is no dilution effect.
6. DiviDenDs PaiD anD ProPoseD In the current financial year, 2015, dividends of 12 thebe per ordinary share (totaling P19 166 666) were declared and paid. In addition, a final dividend of 22.3 thebe per share has been proposed and will be submitted for formal approval at the Annual General Meeting. As such, this dividend (totaling P35 671 722) has not been recognized as a liability as at 31 December 2015. During the year ended 31 December 2014, dividends of 40.0 thebe per ordinary share (totaling P59 097 221) were declared and paid. Withholding taxes of 7.5% of gross dividends are deducted and paid to Botswana Unified Revenue Service.
group company
NOTES TO THE FINANCIAL STATEMENTS (continued)FOR THE YEAR ENDED 31 DECEMBER 2015
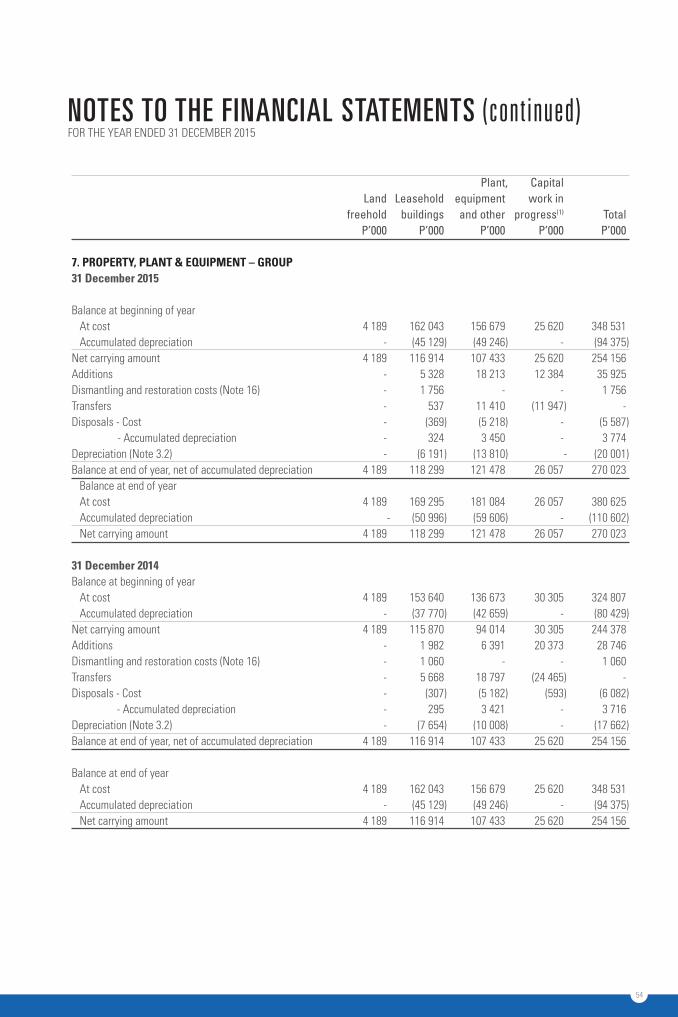
54
Plant , Capital Land Leasehold equipment work in freehold buildings and other progress(1) Total P’000 P’000 P’000 P’000 P’000 7. ProPerty, Plant & eQUiPment – groUP31 December 2015 Balance at beginning of year
At cost 4 189 162 043 156 679 25 620 348 531 Accumulated depreciation - (45 129 ) (49 246 ) - (94 375 )
Net carrying amount 4 189 116 914 107 433 25 620 254 156 Additions - 5 328 18 213 12 384 35 925 Dismantling and restoration costs (Note 16) - 1 756 - - 1 756Transfers - 537 11 410 (11 947 ) - Disposals - Cost - (369 ) (5 218 ) - (5 587 ) - - Accumulated depreciation - 324 3 450 - 3 774 Depreciation (Note 3.2) - (6 191 ) (13 810 ) - (20 001 ) Balance at end of year, net of accumulated depreciation 4 189 118 299 121 478 26 057 270 023
Balance at end of year At cost 4 189 169 295 181 084 26 057 380 625 Accumulated depreciation - (50 996 ) (59 606 ) - (110 602 )Net carrying amount 4 189 118 299 121 478 26 057 270 023
31 December 2014 Balance at beginning of year
At cost 4 189 153 640 136 673 30 305 324 807Accumulated depreciation - (37 770 ) (42 659 ) - (80 429 )
Net carrying amount 4 189 115 870 94 014 30 305 244 378Additions - 1 982 6 391 20 373 28 746Dismantling and restoration costs (Note 16) - 1 060 - - 1 060Transfers - 5 668 18 797 (24 465 ) -Disposals - Cost - (307 ) (5 182 ) (593 ) (6 082 ) - Accumulated depreciation - 295 3 421 - 3 716Depreciation (Note 3.2) - (7 654 ) (10 008 ) - (17 662 )Balance at end of year, net of accumulated depreciation 4 189 116 914 107 433 25 620 254 156
Balance at end of year At cost 4 189 162 043 156 679 25 620 348 531Accumulated depreciation - (45 129 ) (49 246 ) - (94 375 )Net carrying amount 4 189 116 914 107 433 25 620 254 156
NOTES TO THE FINANCIAL STATEMENTS (continued)FOR THE YEAR ENDED 31 DECEMBER 2015
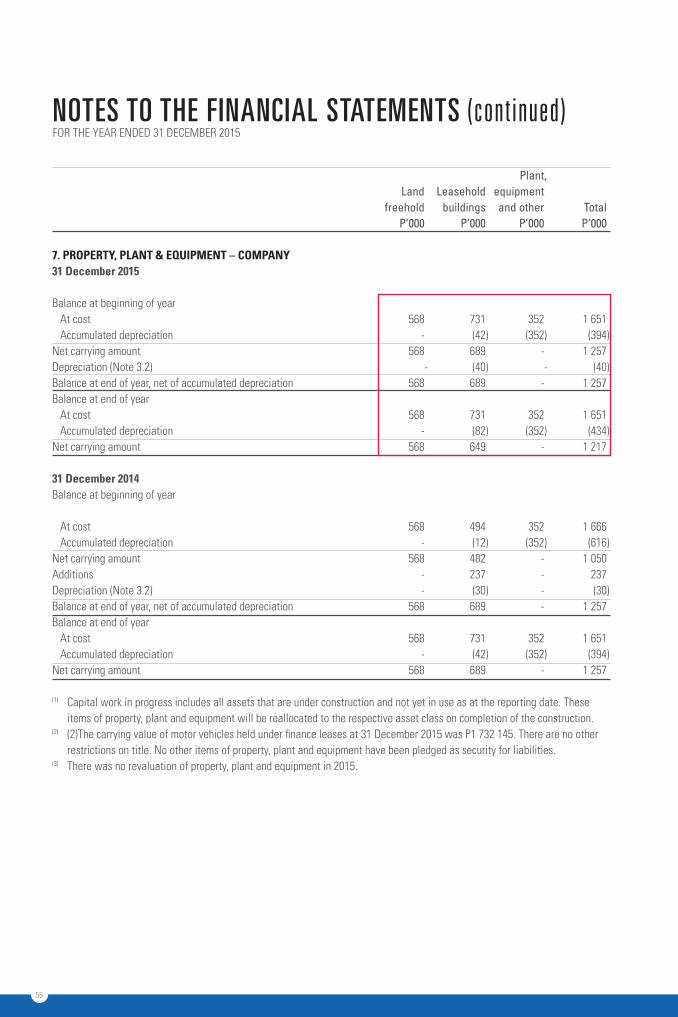
55
NOTES TO THE FINANCIAL STATEMENTS (continued)FOR THE YEAR ENDED 31 DECEMBER 2015
Plant , Land Leasehold equipment freehold buildings and other Total P’000 P’000 P’000 P’000 7. ProPerty, Plant & eQUiPment – comPany31 December 2015 Balance at beginning of year
At cost 568 731 352 1 651Accumulated depreciation - (42 ) (352 ) (394 )
Net carrying amount 568 689 - 1 257 Depreciation (Note 3.2) - (40 ) - (40 )Balance at end of year, net of accumulated depreciation 568 689 - 1 257Balance at end of year
At cost 568 731 352 1 651Accumulated depreciation - (82 ) (352 ) (434 )
Net carrying amount 568 649 - 1 217 31 December 2014 Balance at beginning of year
At cost 568 494 352 1 666Accumulated depreciation - (12 ) (352 ) (616 )
Net carrying amount 568 482 - 1 050 Additions - 237 - 237Depreciation (Note 3.2) - (30 ) - (30 )Balance at end of year, net of accumulated depreciation 568 689 - 1 257Balance at end of year
At cost 568 731 352 1 651Accumulated depreciation - (42 ) (352 ) (394 )
Net carrying amount 568 689 - 1 257
(1) Capital work in progress includes all assets that are under construction and not yet in use as at the reporting date. These items of property, plant and equipment will be reallocated to the respective asset class on completion of the construction.
(2) (2) The carrying value of motor vehicles held under finance leases at 31 December 2015 was P1 732 145. There are no other restrictions on title. No other items of property, plant and equipment have been pledged as security for liabilities.
(3) There was no revaluation of property, plant and equipment in 2015.
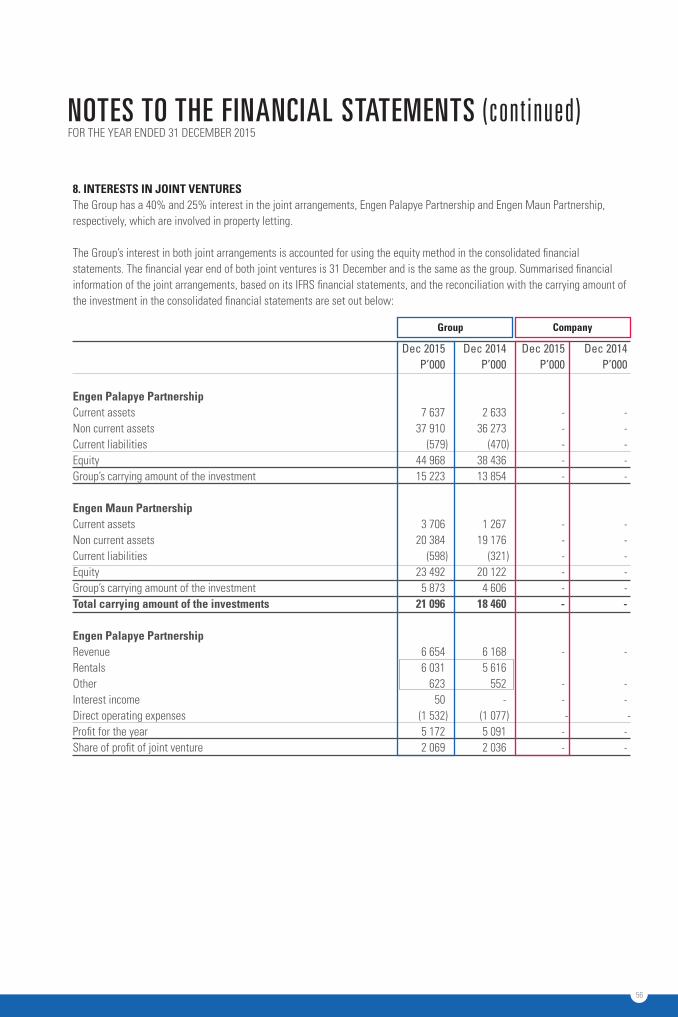
56
NOTES TO THE FINANCIAL STATEMENTS (continued)
8. interests in Joint ventUres The Group has a 40% and 25% interest in the joint arrangements, Engen Palapye Partnership and Engen Maun Partnership, respectively, which are involved in property letting.
The Group’s interest in both joint arrangements is accounted for using the equity method in the consolidated financial statements. The financial year end of both joint ventures is 31 December and is the same as the group. Summarised financial information of the joint arrangements, based on its IFRS financial statements, and the reconciliation with the carrying amount of the investment in the consolidated financial statements are set out below:
Dec 2015 Dec 2014 Dec 2015 Dec 2014 P’000 P’000 P’000 P’000 engen Palapye PartnershipCurrent assets 7 637 2 633 - - Non current assets 37 910 36 273 - -Current liabilities (579 ) (470 ) - -Equity 44 968 38 436 - -Group’s carrying amount of the investment 15 223 13 854 - - engen maun Partnership Current assets 3 706 1 267 - -Non current assets 20 384 19 176 - -Current liabilities (598 ) (321 ) - -Equity 23 492 20 122 - -Group’s carrying amount of the investment 5 873 4 606 - -total carrying amount of the investments 21 096 18 460 - - engen Palapye Partnership Revenue 6 654 6 168 - -Rentals 6 031 5 616Other 623 552 - -Interest income 50 - - -Direct operating expenses (1 532 ) (1 077 ) - -Profit for the year 5 172 5 091 - -Share of profit of joint venture 2 069 2 036 - -
group company
FOR THE YEAR ENDED 31 DECEMBER 2015
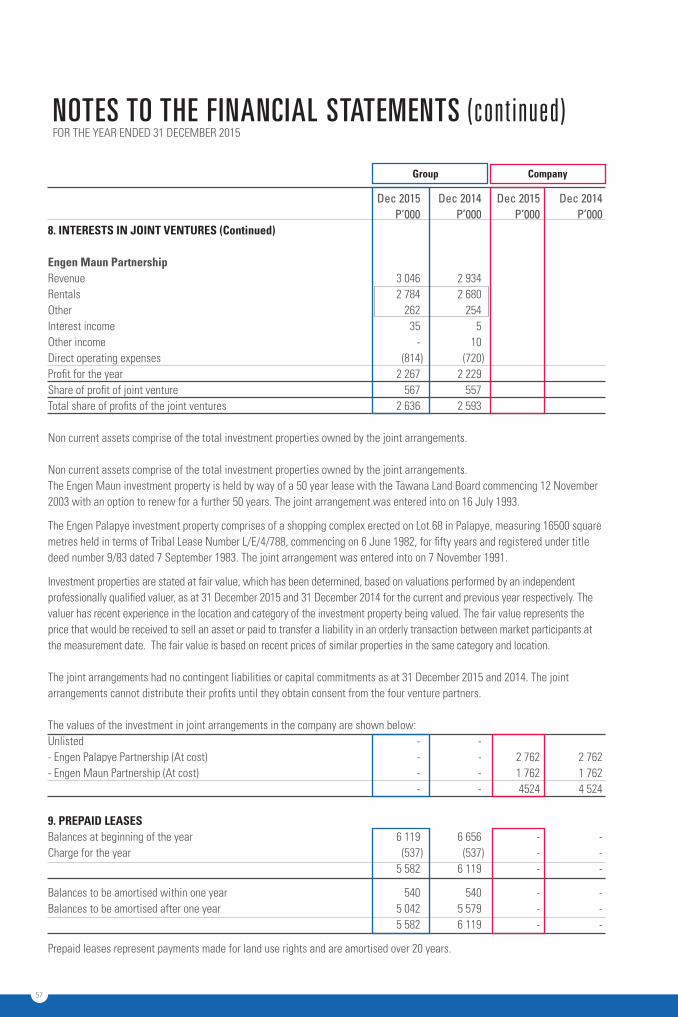
57
NOTES TO THE FINANCIAL STATEMENTS (continued)FOR THE YEAR ENDED 31 DECEMBER 2015
Dec 2015 Dec 2014 Dec 2015 Dec 2014 P’000 P’000 P’000 P’000 8. interests in Joint ventUres (continued)
engen maun Partnership Revenue 3 046 2 934Rentals 2 784 2 680Other 262 254Interest income 35 5Other income - 10Direct operating expenses (814 ) (720 )Profit for the year 2 267 2 229Share of profit of joint venture 567 557 Total share of profits of the joint ventures 2 636 2 593
Non current assets comprise of the total investment properties owned by the joint arrangements.
Non current assets comprise of the total investment properties owned by the joint arrangements. The Engen Maun investment property is held by way of a 50 year lease with the Tawana Land Board commencing 12 November 2003 with an option to renew for a further 50 years. The joint arrangement was entered into on 16 July 1993.
The Engen Palapye investment property comprises of a shopping complex erected on Lot 68 in Palapye, measuring 16500 square metres held in terms of Tribal Lease Number L/E/4/788, commencing on 6 June 1982, for fifty years and registered under title deed number 9/83 dated 7 September 1983. The joint arrangement was entered into on 7 November 1991.
Investment properties are stated at fair value, which has been determined, based on valuations performed by an independent professionally qualified valuer, as at 31 December 2015 and 31 December 2014 for the current and previous year respectively. The valuer has recent experience in the location and category of the investment property being valued. The fair value represents the price that would be received to sell an asset or paid to transfer a liability in an orderly transaction between market participants at the measurement date. The fair value is based on recent prices of similar properties in the same category and location.
The joint arrangements had no contingent liabilities or capital commitments as at 31 December 2015 and 2014. The joint arrangements cannot distribute their profits until they obtain consent from the four venture partners.
The values of the investment in joint arrangements in the company are shown below:Unlisted - - - Engen Palapye Partnership (At cost) - - 2 762 2 762- Engen Maun Partnership (At cost) - - 1 762 1 762 - - 4524 4 524
9. PrePaiD leases Balances at beginning of the year 6 119 6 656 - -Charge for the year (537 ) (537 ) - - 5 582 6 119 - - Balances to be amortised within one year 540 540 - -Balances to be amortised after one year 5 042 5 579 - - 5 582 6 119 - - Prepaid leases represent payments made for land use rights and are amortised over 20 years.
group company
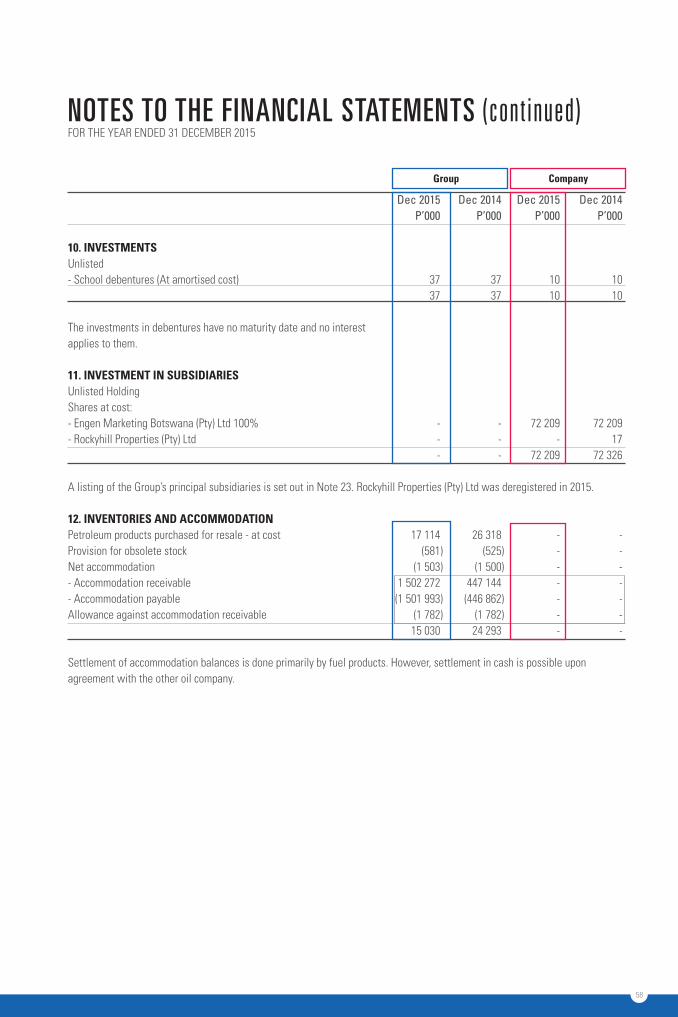
58
NOTES TO THE FINANCIAL STATEMENTS (continued)
Dec 2015 Dec 2014 Dec 2015 Dec 2014 P’000 P’000 P’000 P’000 10. investments Unlisted - School debentures (At amortised cost) 37 37 10 10 37 37 10 10 The investments in debentures have no maturity date and no interest applies to them.
11. investment in sUbsiDiaries Unlisted Holding Shares at cost: - Engen Marketing Botswana (Pty) Ltd 100% - - 72 209 72 209- Rockyhill Properties (Pty) Ltd - - - 17 - - 72 209 72 326
A listing of the Group’s principal subsidiaries is set out in Note 23. Rockyhill Properties (Pty) Ltd was deregistered in 2015. 12. inventories anD accommoDation Petroleum products purchased for resale - at cost 17 114 26 318 - -Provision for obsolete stock (581 ) (525 ) - -Net accommodation (1 503 ) (1 500 ) - -- Accommodation receivable 1 502 272 447 144 - -- Accommodation payable (1 501 993 ) (446 862 ) - -Allowance against accommodation receivable (1 782 ) (1 782 ) - - 15 030 24 293 - -
Settlement of accommodation balances is done primarily by fuel products. However, settlement in cash is possible upon agreement with the other oil company.
group company
FOR THE YEAR ENDED 31 DECEMBER 2015
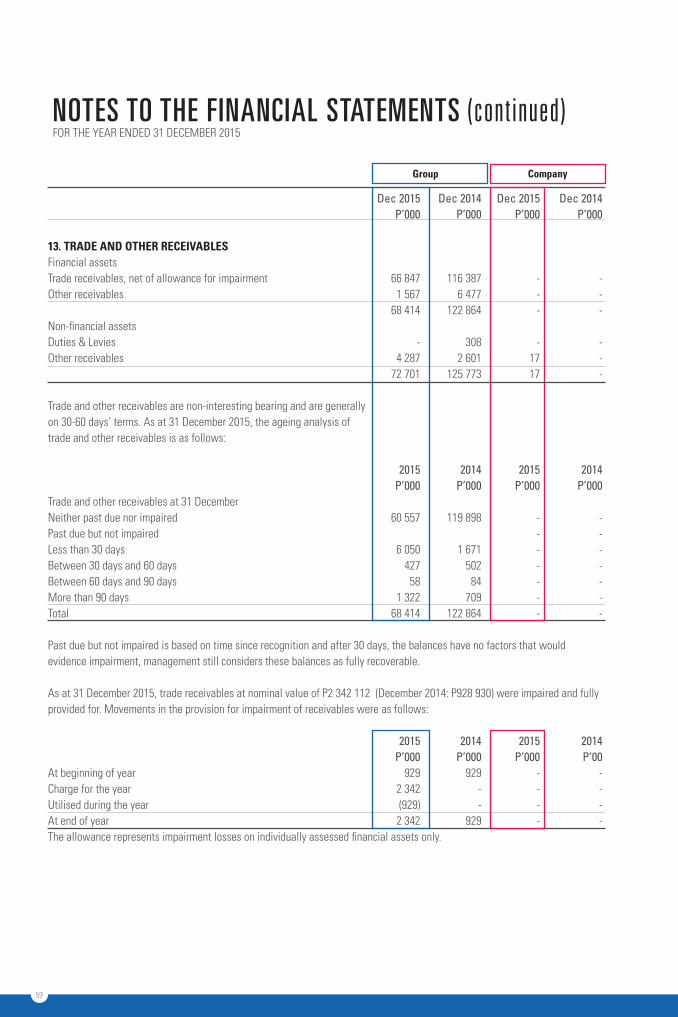
59
NOTES TO THE FINANCIAL STATEMENTS (continued)FOR THE YEAR ENDED 31 DECEMBER 2015
Dec 2015 Dec 2014 Dec 2015 Dec 2014 P’000 P’000 P’000 P’000 13. traDe anD otHer receivables Financial assets Trade receivables, net of allowance for impairment 66 847 116 387 - -Other receivables 1 567 6 477 - - 68 414 122 864 - - Non-financial assets Duties & Levies - 308 - - Other receivables 4 287 2 601 17 - 72 701 125 773 17 -
Trade and other receivables are non-interesting bearing and are generally on 30-60 days’ terms. As at 31 December 2015, the ageing analysis of trade and other receivables is as follows: 2015 2014 2015 2014 P’000 P’000 P’000 P’000Trade and other receivables at 31 December Neither past due nor impaired 60 557 119 898 - -Past due but not impaired - -Less than 30 days 6 050 1 671 - -Between 30 days and 60 days 427 502 - -Between 60 days and 90 days 58 84 - -More than 90 days 1 322 709 - -Total 68 414 122 864 - - Past due but not impaired is based on time since recognition and after 30 days, the balances have no factors that would evidence impairment, management still considers these balances as fully recoverable. As at 31 December 2015, trade receivables at nominal value of P2 342 112 (December 2014: P928 930) were impaired and fully provided for. Movements in the provision for impairment of receivables were as follows:
2015 2014 2015 2014 P’000 P’000 P’000 P’00 At beginning of year 929 929 - - Charge for the year 2 342 - - - Utilised during the year (929) - - -At end of year 2 342 929 - - The allowance represents impairment losses on individually assessed financial assets only.
group company
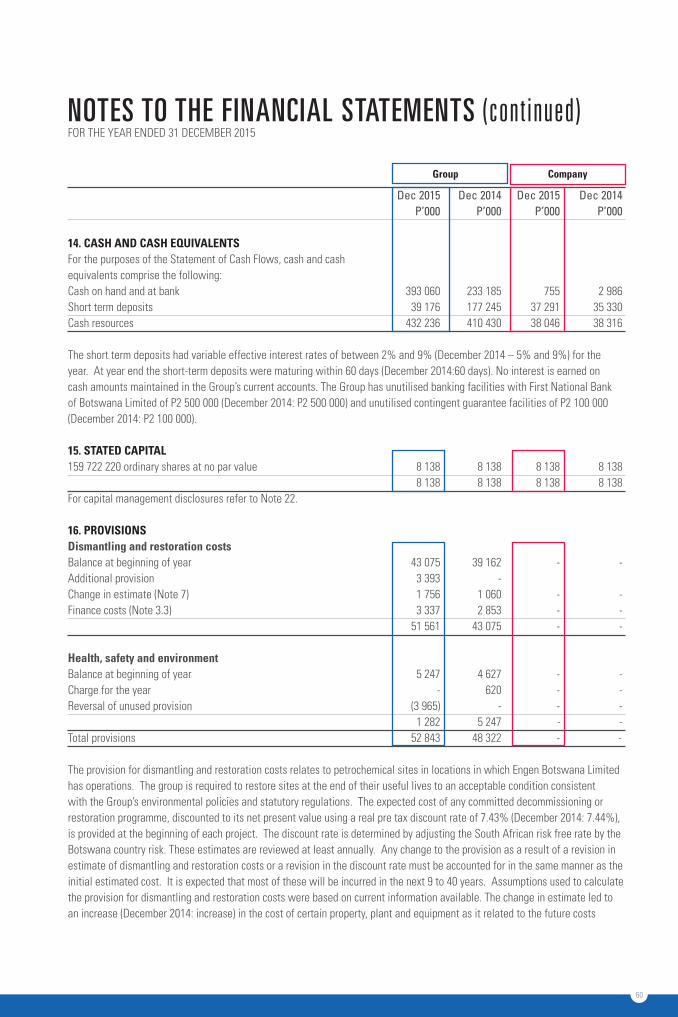
60
NOTES TO THE FINANCIAL STATEMENTS (continued)
Dec 2015 Dec 2014 Dec 2015 Dec 2014 P’000 P’000 P’000 P’000 14. casH anD casH eQUivalents For the purposes of the Statement of Cash Flows, cash and cashequivalents comprise the following: Cash on hand and at bank 393 060 233 185 755 2 986Short term deposits 39 176 177 245 37 291 35 330Cash resources 432 236 410 430 38 046 38 316 The short term deposits had variable effective interest rates of between 2% and 9% (December 2014 – 5% and 9%) for the year. At year end the short-term deposits were maturing within 60 days (December 2014:60 days). No interest is earned on cash amounts maintained in the Group’s current accounts. The Group has unutilised banking facilities with First National Bank of Botswana Limited of P2 500 000 (December 2014: P2 500 000) and unutilised contingent guarantee facilities of P2 100 000 (December 2014: P2 100 000).
15. stateD caPital 159 722 220 ordinary shares at no par value 8 138 8 138 8 138 8 138 8 138 8 138 8 138 8 138For capital management disclosures refer to Note 22. 16. Provisions Dismantling and restoration costs Balance at beginning of year 43 075 39 162 - -Additional provision 3 393 - Change in estimate (Note 7) 1 756 1 060 - - Finance costs (Note 3.3) 3 337 2 853 - - 51 561 43 075 - - Health, safety and environmentBalance at beginning of year 5 247 4 627 - -Charge for the year - 620 - - Reversal of unused provision (3 965) - - - 1 282 5 247 - -Total provisions 52 843 48 322 - - The provision for dismantling and restoration costs relates to petrochemical sites in locations in which Engen Botswana Limited has operations. The group is required to restore sites at the end of their useful lives to an acceptable condition consistent with the Group’s environmental policies and statutory regulations. The expected cost of any committed decommissioning or restoration programme, discounted to its net present value using a real pre tax discount rate of 7.43% (December 2014: 7.44%), is provided at the beginning of each project. The discount rate is determined by adjusting the South African risk free rate by the Botswana country risk. These estimates are reviewed at least annually. Any change to the provision as a result of a revision in estimate of dismantling and restoration costs or a revision in the discount rate must be accounted for in the same manner as the initial estimated cost. It is expected that most of these will be incurred in the next 9 to 40 years. Assumptions used to calculate the provision for dismantling and restoration costs were based on current information available. The change in estimate led to an increase (December 2014: increase) in the cost of certain property, plant and equipment as it related to the future costs
group company
FOR THE YEAR ENDED 31 DECEMBER 2015
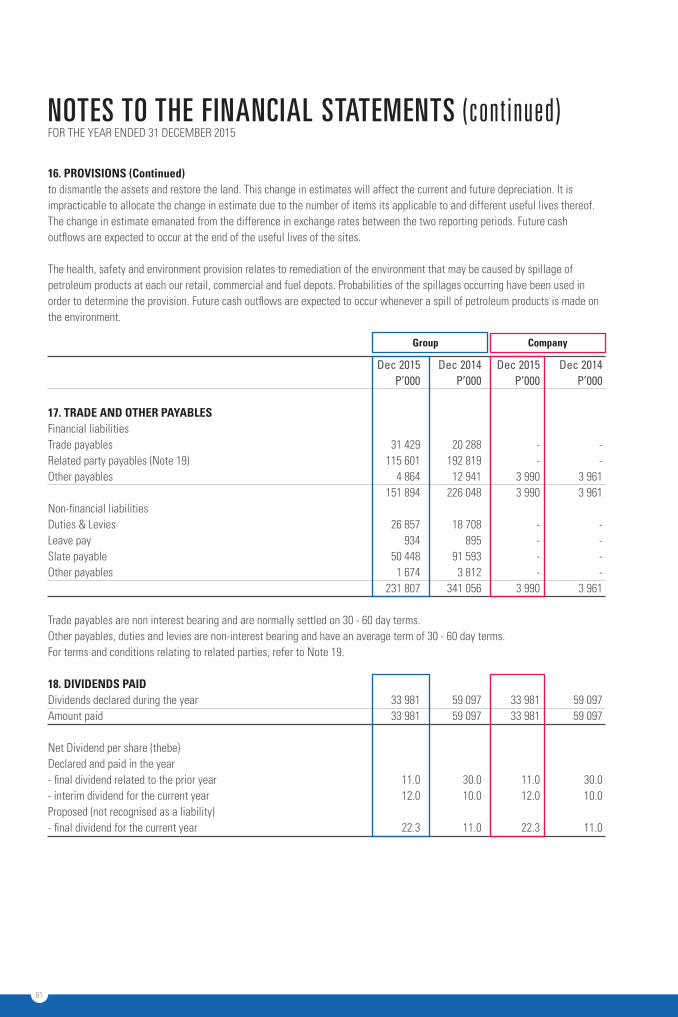
61
16. Provisions (continued)to dismantle the assets and restore the land. This change in estimates will affect the current and future depreciation. It is impracticable to allocate the change in estimate due to the number of items its applicable to and different useful lives thereof. The change in estimate emanated from the difference in exchange rates between the two reporting periods. Future cash outflows are expected to occur at the end of the useful lives of the sites. The health, safety and environment provision relates to remediation of the environment that may be caused by spillage of petroleum products at each our retail, commercial and fuel depots. Probabilities of the spillages occurring have been used in order to determine the provision. Future cash outflows are expected to occur whenever a spill of petroleum products is made on the environment.
Dec 2015 Dec 2014 Dec 2015 Dec 2014 P’000 P’000 P’000 P’000 17. traDe anD otHer Payables Financial liabilities Trade payables 31 429 20 288 - -Related party payables (Note 19) 115 601 192 819 - -Other payables 4 864 12 941 3 990 3 961 151 894 226 048 3 990 3 961 Non-financial liabilities Duties & Levies 26 857 18 708 - -Leave pay 934 895 - -Slate payable 50 448 91 593 - -Other payables 1 674 3 812 - - 231 807 341 056 3 990 3 961 Trade payables are non interest bearing and are normally settled on 30 - 60 day terms. Other payables, duties and levies are non-interest bearing and have an average term of 30 - 60 day terms.For terms and conditions relating to related parties, refer to Note 19.
18. DiviDenDs PaiD Dividends declared during the year 33 981 59 097 33 981 59 097Amount paid 33 981 59 097 33 981 59 097 Net Dividend per share (thebe) Declared and paid in the year - final dividend related to the prior year 11.0 30.0 11.0 30.0- interim dividend for the current year 12.0 10.0 12.0 10.0Proposed (not recognised as a liability) - final dividend for the current year 22.3 11.0 22.3 11.0
NOTES TO THE FINANCIAL STATEMENTS (continued)FOR THE YEAR ENDED 31 DECEMBER 2015
group company
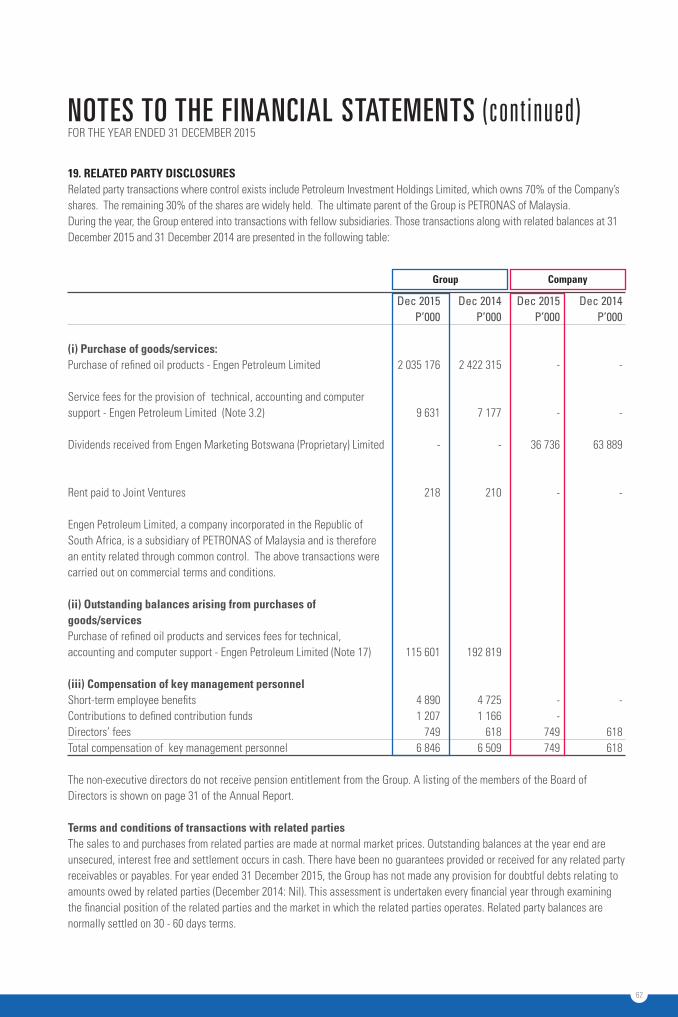
62
NOTES TO THE FINANCIAL STATEMENTS (continued)
19. relateD Party DisclosUres Related party transactions where control exists include Petroleum Investment Holdings Limited, which owns 70% of the Company’s shares. The remaining 30% of the shares are widely held. The ultimate parent of the Group is PETRONAS of Malaysia. During the year, the Group entered into transactions with fellow subsidiaries. Those transactions along with related balances at 31 December 2015 and 31 December 2014 are presented in the following table:
Dec 2015 Dec 2014 Dec 2015 Dec 2014 P’000 P’000 P’000 P’000 (i) Purchase of goods/services:Purchase of refined oil products - Engen Petroleum Limited 2 035 176 2 422 315 - -
Service fees for the provision of technical, accounting and computersupport - Engen Petroleum Limited (Note 3.2) 9 631 7 177 - -
Dividends received from Engen Marketing Botswana (Proprietary) Limited - - 36 736 63 889
Rent paid to Joint Ventures 218 210 - - Engen Petroleum Limited, a company incorporated in the Republic of South Africa, is a subsidiary of PETRONAS of Malaysia and is therefore an entity related through common control. The above transactions were carried out on commercial terms and conditions.
(ii) outstanding balances arising from purchases of goods/servicesPurchase of refined oil products and services fees for technical, accounting and computer support - Engen Petroleum Limited (Note 17) 115 601 192 819
(iii) compensation of key management personnel Short-term employee benefits 4 890 4 725 - -Contributions to defined contribution funds 1 207 1 166 - Directors’ fees 749 618 749 618Total compensation of key management personnel 6 846 6 509 749 618 The non-executive directors do not receive pension entitlement from the Group. A listing of the members of the Board of Directors is shown on page 31 of the Annual Report. terms and conditions of transactions with related parties The sales to and purchases from related parties are made at normal market prices. Outstanding balances at the year end are unsecured, interest free and settlement occurs in cash. There have been no guarantees provided or received for any related party receivables or payables. For year ended 31 December 2015, the Group has not made any provision for doubtful debts relating to amounts owed by related parties (December 2014: Nil). This assessment is undertaken every financial year through examining the financial position of the related parties and the market in which the related parties operates. Related party balances are normally settled on 30 - 60 days terms.
group company
FOR THE YEAR ENDED 31 DECEMBER 2015
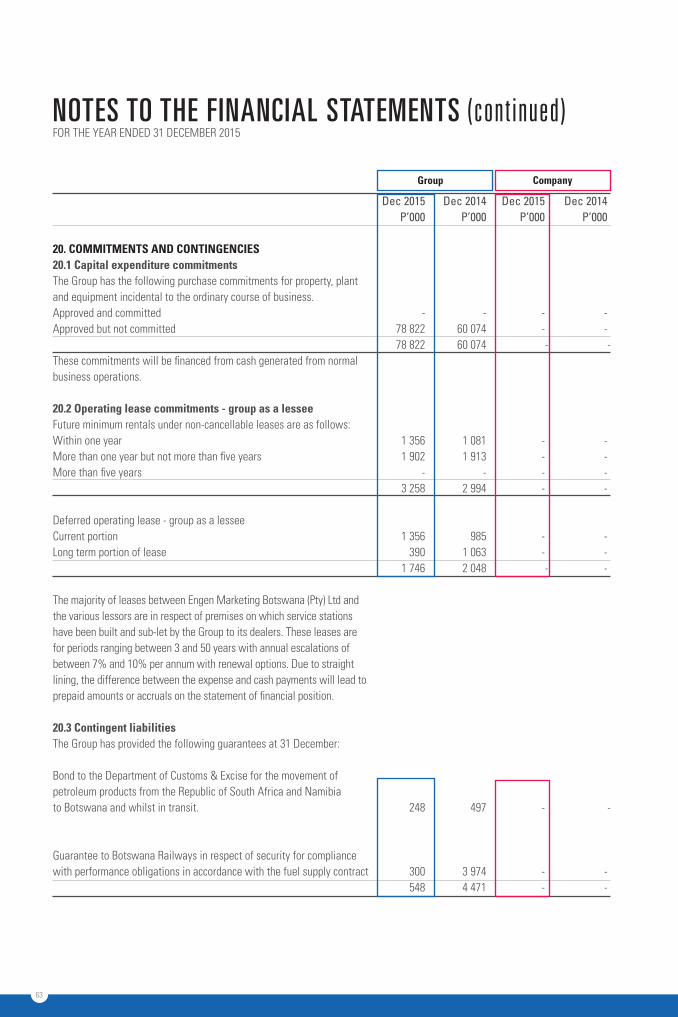
63
NOTES TO THE FINANCIAL STATEMENTS (continued)FOR THE YEAR ENDED 31 DECEMBER 2015
Dec 2015 Dec 2014 Dec 2015 Dec 2014 P’000 P’000 P’000 P’000 20. commitments anD contingencies 20.1 capital expenditure commitments The Group has the following purchase commitments for property, plantand equipment incidental to the ordinary course of business. Approved and committed - - - -Approved but not committed 78 822 60 074 - - 78 822 60 074 - -These commitments will be financed from cash generated from normalbusiness operations. 20.2 operating lease commitments - group as a lessee Future minimum rentals under non-cancellable leases are as follows: Within one year 1 356 1 081 - -More than one year but not more than five years 1 902 1 913 - -More than five years - - - - 3 258 2 994 - - Deferred operating lease - group as a lessee Current portion 1 356 985 - -Long term portion of lease 390 1 063 - - 1 746 2 048 - -
The majority of leases between Engen Marketing Botswana (Pty) Ltd and the various lessors are in respect of premises on which service stations have been built and sub-let by the Group to its dealers. These leases are for periods ranging between 3 and 50 years with annual escalations of between 7% and 10% per annum with renewal options. Due to straight lining, the difference between the expense and cash payments will lead to prepaid amounts or accruals on the statement of financial position.
20.3 contingent liabilities The Group has provided the following guarantees at 31 December:
Bond to the Department of Customs & Excise for the movement ofpetroleum products from the Republic of South Africa and Namibiato Botswana and whilst in transit. 248 497 - - Guarantee to Botswana Railways in respect of security for compliancewith performance obligations in accordance with the fuel supply contract 300 3 974 - - 548 4 471 - -
group company
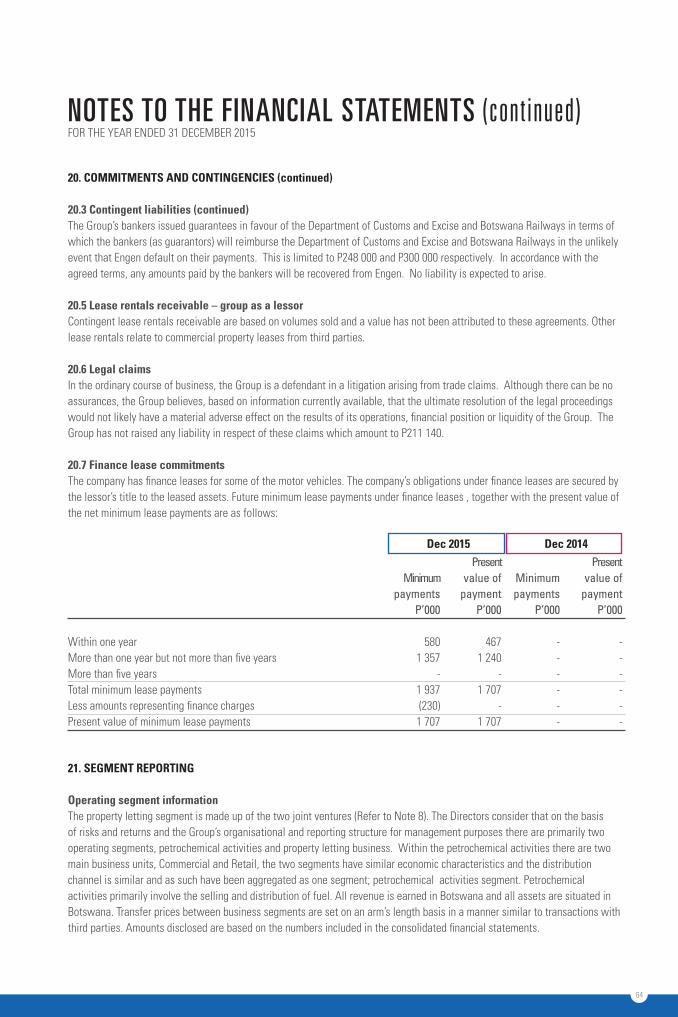
64
NOTES TO THE FINANCIAL STATEMENTS (continued)
20. commitments anD contingencies (continued)
20.3 contingent liabilities (continued)The Group’s bankers issued guarantees in favour of the Department of Customs and Excise and Botswana Railways in terms of which the bankers (as guarantors) will reimburse the Department of Customs and Excise and Botswana Railways in the unlikely event that Engen default on their payments. This is limited to P248 000 and P300 000 respectively. In accordance with the agreed terms, any amounts paid by the bankers will be recovered from Engen. No liability is expected to arise.
20.5 lease rentals receivable – group as a lessor Contingent lease rentals receivable are based on volumes sold and a value has not been attributed to these agreements. Other lease rentals relate to commercial property leases from third parties. 20.6 legal claims In the ordinary course of business, the Group is a defendant in a litigation arising from trade claims. Although there can be no assurances, the Group believes, based on information currently available, that the ultimate resolution of the legal proceedings would not likely have a material adverse effect on the results of its operations, financial position or liquidity of the Group. The Group has not raised any liability in respect of these claims which amount to P211 140.
20.7 finance lease commitments The company has finance leases for some of the motor vehicles. The company’s obligations under finance leases are secured by the lessor’s title to the leased assets. Future minimum lease payments under finance leases , together with the present value of the net minimum lease payments are as follows:
21. segment rePorting
operating segment information The property letting segment is made up of the two joint ventures (Refer to Note 8). The Directors consider that on the basis of risks and returns and the Group’s organisational and reporting structure for management purposes there are primarily two operating segments, petrochemical activities and property letting business. Within the petrochemical activities there are two main business units, Commercial and Retail, the two segments have similar economic characteristics and the distribution channel is similar and as such have been aggregated as one segment; petrochemical activities segment. Petrochemical activities primarily involve the selling and distribution of fuel. All revenue is earned in Botswana and all assets are situated in Botswana. Transfer prices between business segments are set on an arm’s length basis in a manner similar to transactions with third parties. Amounts disclosed are based on the numbers included in the consolidated financial statements.
Present Present Minimum value of Minimum value of payments payment payments payment P’000 P’000 P’000 P’000
Within one year 580 467 - -More than one year but not more than five years 1 357 1 240 - -More than five years - - - -Total minimum lease payments 1 937 1 707 - -Less amounts representing finance charges (230) - - -Present value of minimum lease payments 1 707 1 707 - -
Dec 2015 Dec 2014
FOR THE YEAR ENDED 31 DECEMBER 2015
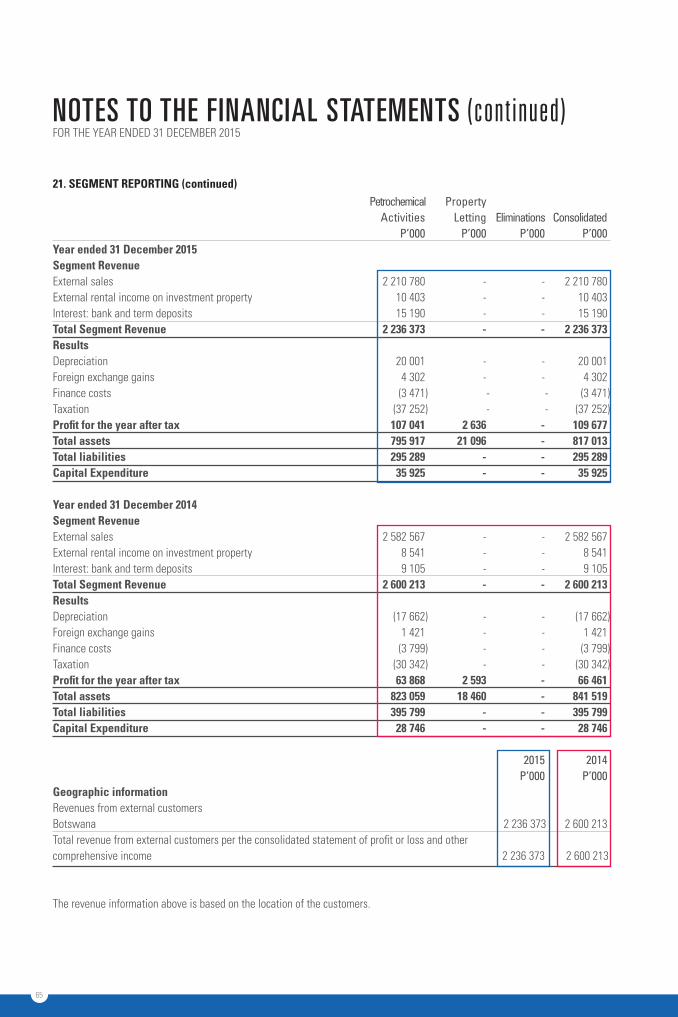
65
NOTES TO THE FINANCIAL STATEMENTS (continued)FOR THE YEAR ENDED 31 DECEMBER 2015
Petrochemical Property Activities Letting Eliminations Consolidated P’000 P’000 P’000 P’000 year ended 31 December 2015 segment revenue External sales 2 210 780 - - 2 210 780External rental income on investment property 10 403 - - 10 403Interest: bank and term deposits 15 190 - - 15 190total segment revenue 2 236 373 - - 2 236 373results Depreciation 20 001 - - 20 001Foreign exchange gains 4 302 - - 4 302Finance costs (3 471 ) - - (3 471 )Taxation (37 252 ) - - (37 252 )Profit for the year after tax 107 041 2 636 - 109 677total assets 795 917 21 096 - 817 013total liabilities 295 289 - - 295 289capital expenditure 35 925 - - 35 925 year ended 31 December 2014 segment revenue External sales 2 582 567 - - 2 582 567External rental income on investment property 8 541 - - 8 541Interest: bank and term deposits 9 105 - - 9 105total segment revenue 2 600 213 - - 2 600 213results Depreciation (17 662 ) - - (17 662 )Foreign exchange gains 1 421 - - 1 421Finance costs (3 799 ) - - (3 799 )Taxation (30 342 ) - - (30 342 )Profit for the year after tax 63 868 2 593 - 66 461total assets 823 059 18 460 - 841 519total liabilities 395 799 - - 395 799capital expenditure 28 746 - - 28 746
2015 2014 P’000 P’000 geographic informationRevenues from external customers Botswana 2 236 373 2 600 213 Total revenue from external customers per the consolidated statement of profit or loss and othercomprehensive income 2 236 373 2 600 213
The revenue information above is based on the location of the customers.
21. segment rePorting (continued)
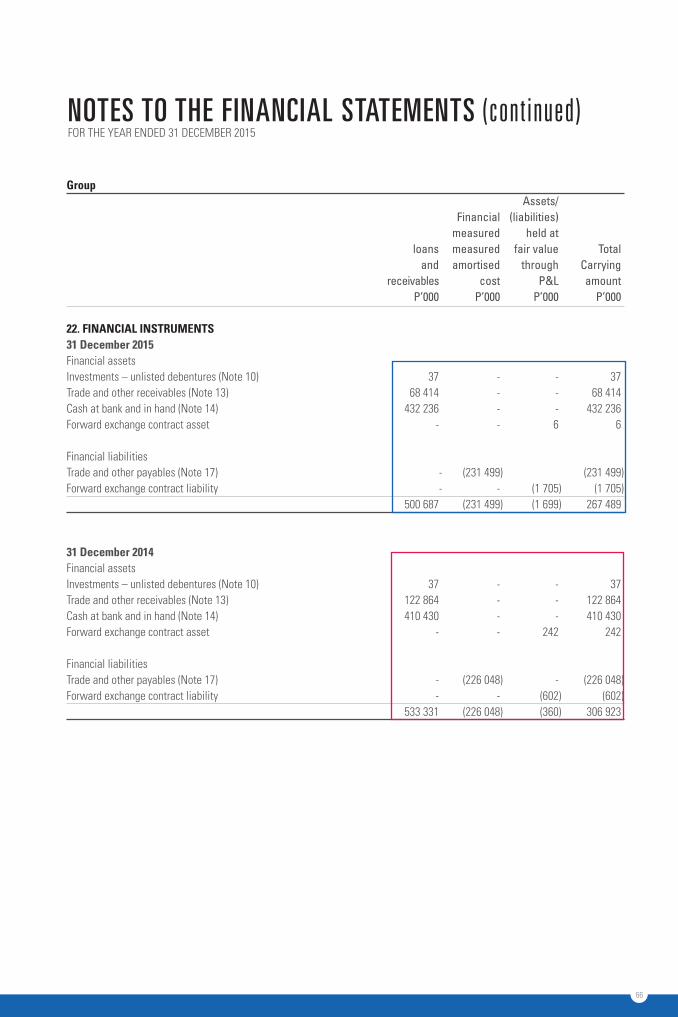
66
NOTES TO THE FINANCIAL STATEMENTS (continued)
group Assets/ Financial (liabilities) measured held at loans measured fair value Total and amortised through Carrying receivables cost P&L amount P’000 P’000 P’000 P’000 22. financial instrUments31 December 2015 Financial assets Investments – unlisted debentures (Note 10) 37 - - 37Trade and other receivables (Note 13) 68 414 - - 68 414Cash at bank and in hand (Note 14) 432 236 - - 432 236 Forward exchange contract asset - - 6 6
Financial liabilities Trade and other payables (Note 17) - (231 499 ) (231 499 ) Forward exchange contract liability - - (1 705 ) (1 705 ) 500 687 (231 499 ) (1 699 ) 267 489
31 December 2014Financial assets Investments – unlisted debentures (Note 10) 37 - - 37Trade and other receivables (Note 13) 122 864 - - 122 864Cash at bank and in hand (Note 14) 410 430 - - 410 430 Forward exchange contract asset - - 242 242
Financial liabilities Trade and other payables (Note 17) - (226 048 ) - (226 048 )Forward exchange contract liability - - (602 ) (602 ) 533 331 (226 048 ) (360 ) 306 923
FOR THE YEAR ENDED 31 DECEMBER 2015
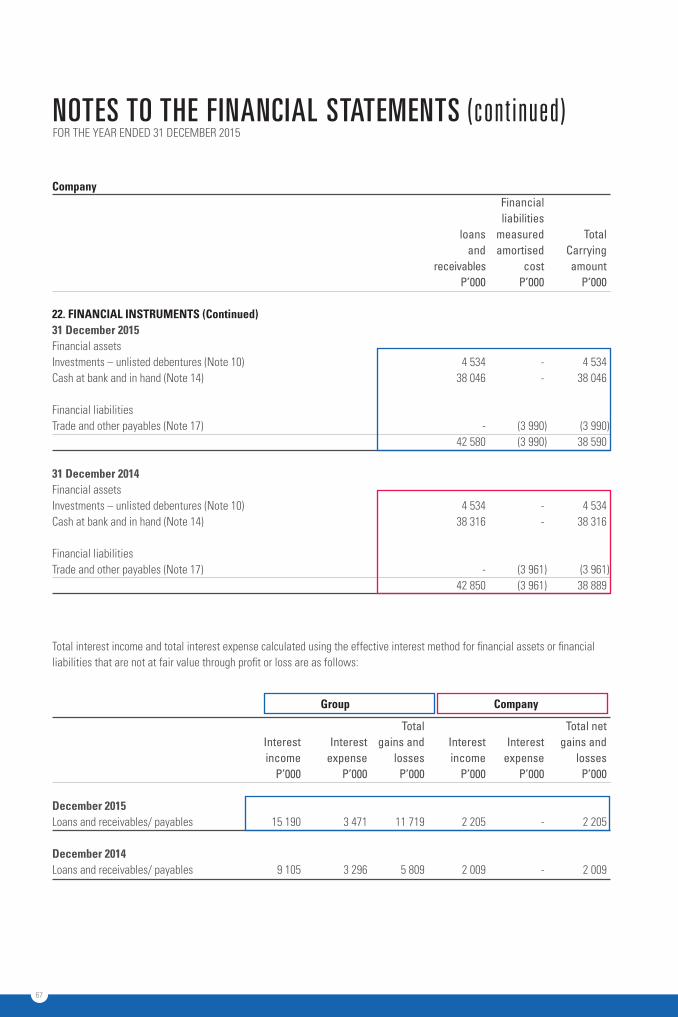
67
NOTES TO THE FINANCIAL STATEMENTS (continued)FOR THE YEAR ENDED 31 DECEMBER 2015
company Financial liabilities loans measured Total and amortised Carrying receivables cost amount P’000 P’000 P’000 22. financial instrUments (continued)31 December 2015 Financial assets Investments – unlisted debentures (Note 10) 4 534 - 4 534Cash at bank and in hand (Note 14) 38 046 - 38 046 Financial liabilities Trade and other payables (Note 17) - (3 990 ) (3 990 ) 42 580 (3 990 ) 38 590
31 December 2014Financial assets Investments – unlisted debentures (Note 10) 4 534 - 4 534Cash at bank and in hand (Note 14) 38 316 - 38 316 Financial liabilities Trade and other payables (Note 17) - (3 961 ) (3 961 ) 42 850 (3 961 ) 38 889
Total interest income and total interest expense calculated using the effective interest method for financial assets or financial liabilities that are not at fair value through profit or loss are as follows:
Total Total net Interest Interest gains and Interest Interest gains and income expense losses income expense losses P’000 P’000 P’000 P’000 P’000 P’000 December 2015 Loans and receivables/ payables 15 190 3 471 11 719 2 205 - 2 205 December 2014 Loans and receivables/ payables 9 105 3 296 5 809 2 009 - 2 009
group company
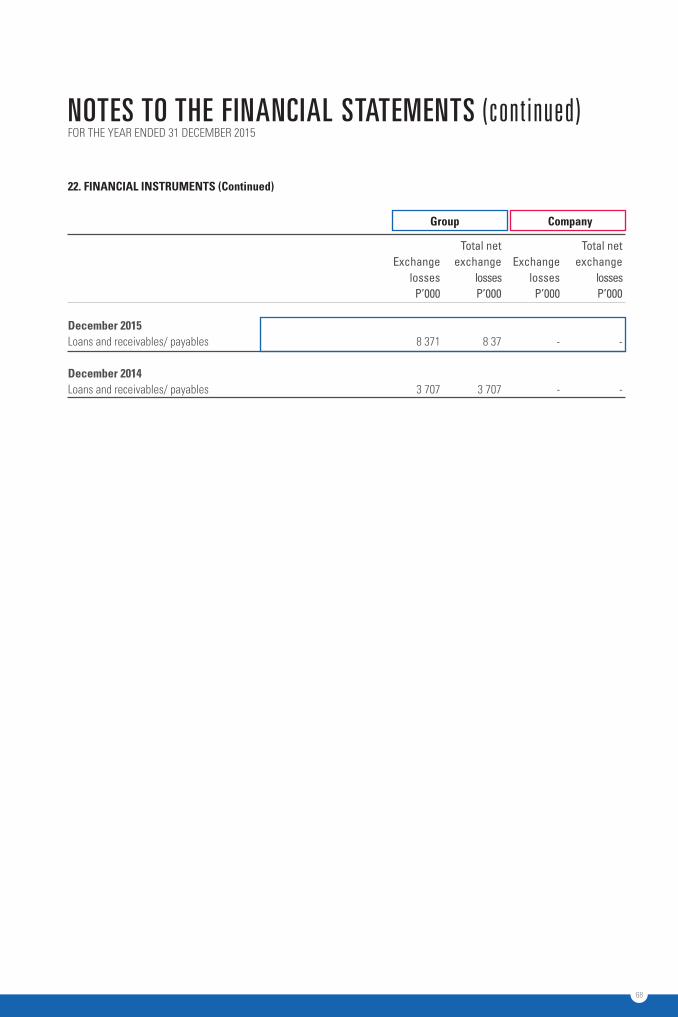
68
NOTES TO THE FINANCIAL STATEMENTS (continued)
22. financial instrUments (continued)
Total net Total net Exchange exchange Exchange exchange losses losses losses losses P’000 P’000 P’000 P’000
December 2015 Loans and receivables/ payables 8 371 8 37 - - December 2014 Loans and receivables/ payables 3 707 3 707 - -
group company
FOR THE YEAR ENDED 31 DECEMBER 2015
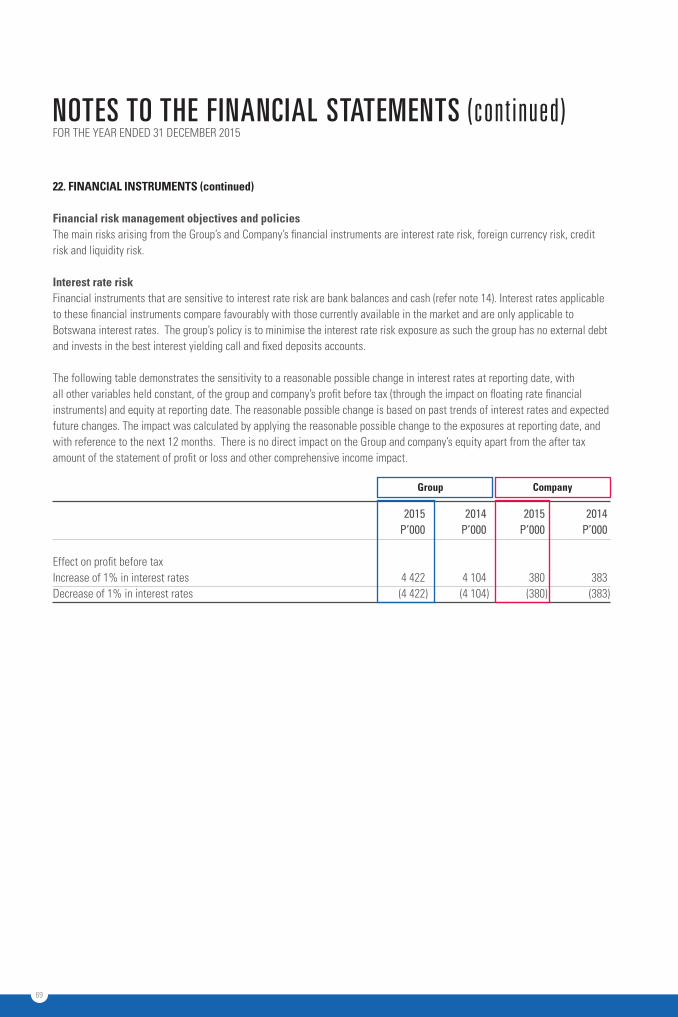
69
NOTES TO THE FINANCIAL STATEMENTS (continued)FOR THE YEAR ENDED 31 DECEMBER 2015
22. financial instrUments (continued)
financial risk management objectives and policies The main risks arising from the Group’s and Company’s financial instruments are interest rate risk, foreign currency risk, credit risk and liquidity risk.
interest rate risk Financial instruments that are sensitive to interest rate risk are bank balances and cash (refer note 14). Interest rates applicable to these financial instruments compare favourably with those currently available in the market and are only applicable to Botswana interest rates. The group’s policy is to minimise the interest rate risk exposure as such the group has no external debt and invests in the best interest yielding call and fixed deposits accounts.
The following table demonstrates the sensitivity to a reasonable possible change in interest rates at reporting date, with all other variables held constant, of the group and company’s profit before tax (through the impact on floating rate financial instruments) and equity at reporting date. The reasonable possible change is based on past trends of interest rates and expected future changes. The impact was calculated by applying the reasonable possible change to the exposures at reporting date, and with reference to the next 12 months. There is no direct impact on the Group and company’s equity apart from the after tax amount of the statement of profit or loss and other comprehensive income impact.
2015 2014 2015 2014 P’000 P’000 P’000 P’000 Effect on profit before tax Increase of 1% in interest rates 4 422 4 104 380 383Decrease of 1% in interest rates (4 422 ) (4 104 ) (380 ) (383 )
group company
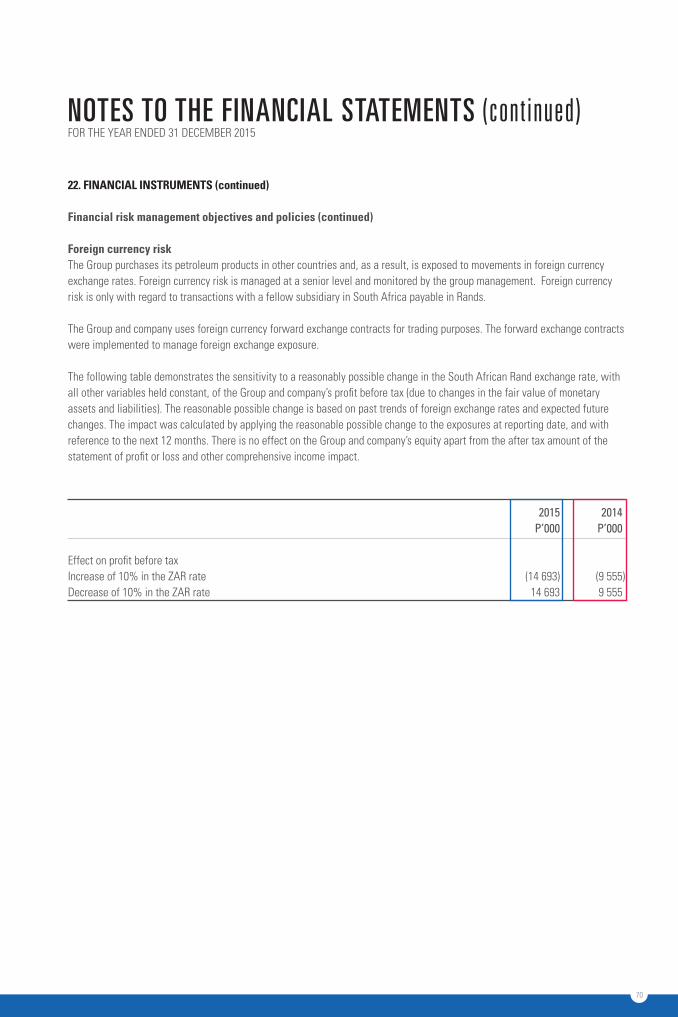
70
NOTES TO THE FINANCIAL STATEMENTS (continued)
2015 2014 P’000 P’000
Effect on profit before tax Increase of 10% in the ZAR rate (14 693) (9 555 )Decrease of 10% in the ZAR rate 14 693 9 555
22. financial instrUments (continued)
financial risk management objectives and policies (continued)
foreign currency risk The Group purchases its petroleum products in other countries and, as a result, is exposed to movements in foreign currency exchange rates. Foreign currency risk is managed at a senior level and monitored by the group management. Foreign currency risk is only with regard to transactions with a fellow subsidiary in South Africa payable in Rands.
The Group and company uses foreign currency forward exchange contracts for trading purposes. The forward exchange contracts were implemented to manage foreign exchange exposure.
The following table demonstrates the sensitivity to a reasonably possible change in the South African Rand exchange rate, with all other variables held constant, of the Group and company’s profit before tax (due to changes in the fair value of monetary assets and liabilities). The reasonable possible change is based on past trends of foreign exchange rates and expected future changes. The impact was calculated by applying the reasonable possible change to the exposures at reporting date, and with reference to the next 12 months. There is no effect on the Group and company’s equity apart from the after tax amount of the statement of profit or loss and other comprehensive income impact.
FOR THE YEAR ENDED 31 DECEMBER 2015
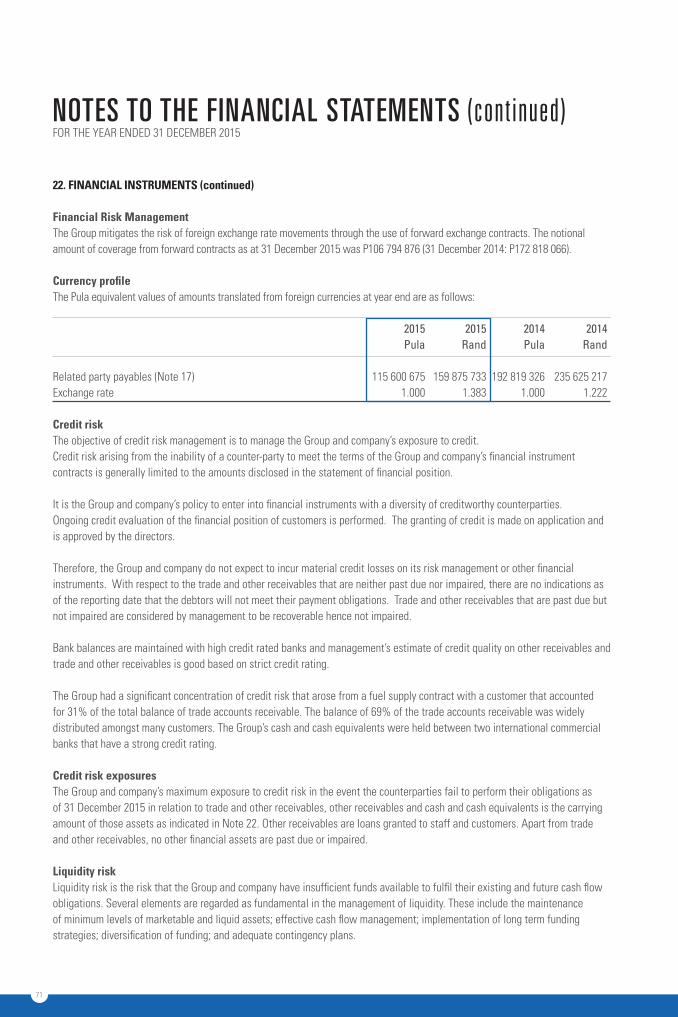
71
NOTES TO THE FINANCIAL STATEMENTS (continued)FOR THE YEAR ENDED 31 DECEMBER 2015
22. financial instrUments (continued)
financial risk management The Group mitigates the risk of foreign exchange rate movements through the use of forward exchange contracts. The notional amount of coverage from forward contracts as at 31 December 2015 was P106 794 876 (31 December 2014: P172 818 066). currency profile The Pula equivalent values of amounts translated from foreign currencies at year end are as follows:
2015 2015 2014 2014 Pula Rand Pula Rand Related party payables (Note 17) 115 600 675 159 875 733 192 819 326 235 625 217 Exchange rate 1.000 1.383 1.000 1.222
credit risk The objective of credit risk management is to manage the Group and company’s exposure to credit. Credit risk arising from the inability of a counter-party to meet the terms of the Group and company’s financial instrument contracts is generally limited to the amounts disclosed in the statement of financial position.
It is the Group and company’s policy to enter into financial instruments with a diversity of creditworthy counterparties. Ongoing credit evaluation of the financial position of customers is performed. The granting of credit is made on application and is approved by the directors.
Therefore, the Group and company do not expect to incur material credit losses on its risk management or other financial instruments. With respect to the trade and other receivables that are neither past due nor impaired, there are no indications as of the reporting date that the debtors will not meet their payment obligations. Trade and other receivables that are past due but not impaired are considered by management to be recoverable hence not impaired.
Bank balances are maintained with high credit rated banks and management’s estimate of credit quality on other receivables and trade and other receivables is good based on strict credit rating.
The Group had a significant concentration of credit risk that arose from a fuel supply contract with a customer that accounted for 31% of the total balance of trade accounts receivable. The balance of 69% of the trade accounts receivable was widely distributed amongst many customers. The Group’s cash and cash equivalents were held between two international commercial banks that have a strong credit rating.
credit risk exposures The Group and company’s maximum exposure to credit risk in the event the counterparties fail to perform their obligations as of 31 December 2015 in relation to trade and other receivables, other receivables and cash and cash equivalents is the carrying amount of those assets as indicated in Note 22. Other receivables are loans granted to staff and customers. Apart from trade and other receivables, no other financial assets are past due or impaired.
liquidity risk Liquidity risk is the risk that the Group and company have insufficient funds available to fulfil their existing and future cash flow obligations. Several elements are regarded as fundamental in the management of liquidity. These include the maintenance of minimum levels of marketable and liquid assets; effective cash flow management; implementation of long term funding strategies; diversification of funding; and adequate contingency plans.
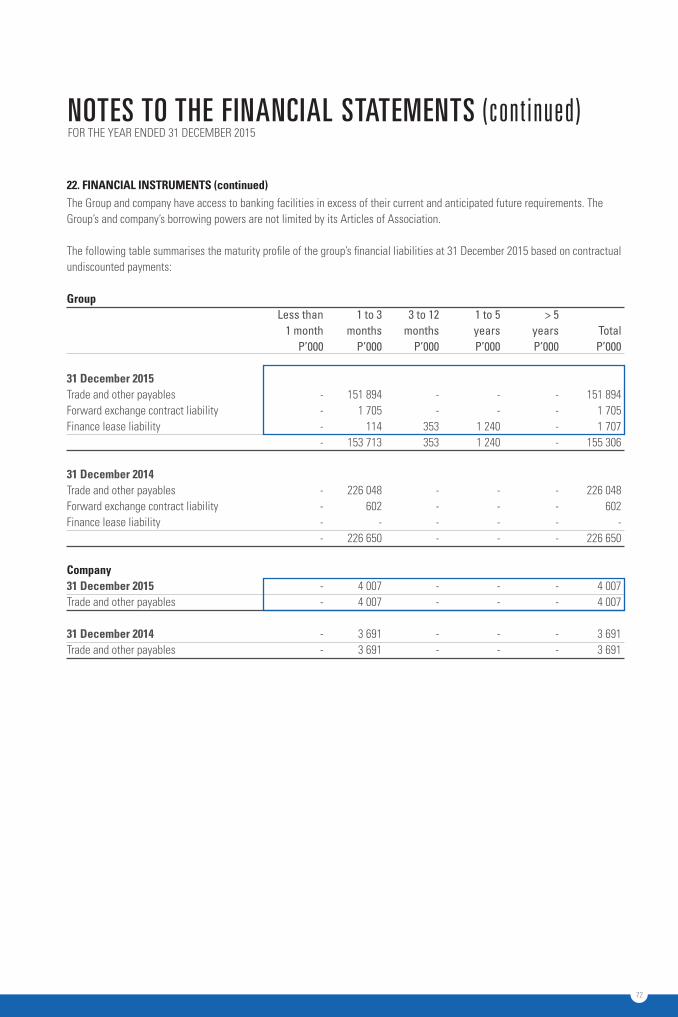
72
NOTES TO THE FINANCIAL STATEMENTS (continued)
The Group and company have access to banking facilities in excess of their current and anticipated future requirements. The Group’s and company’s borrowing powers are not limited by its Articles of Association. The following table summarises the maturity profile of the group’s financial liabilities at 31 December 2015 based on contractual undiscounted payments: group Less than 1 to 3 3 to 12 1 to 5 > 5 1 month months months years years Total P’000 P’000 P’000 P’000 P’000 P’000
31 December 2015 Trade and other payables - 151 894 - - - 151 894 Forward exchange contract liability - 1 705 - - - 1 705Finance lease liability - 114 353 1 240 - 1 707 - 153 713 353 1 240 - 155 306 31 December 2014 Trade and other payables - 226 048 - - - 226 048Forward exchange contract liability - 602 - - - 602Finance lease liability - - - - - - - 226 650 - - - 226 650 company 31 December 2015 - 4 007 - - - 4 007Trade and other payables - 4 007 - - - 4 007 31 December 2014 - 3 691 - - - 3 691Trade and other payables - 3 691 - - - 3 691
22. financial instrUments (continued)
FOR THE YEAR ENDED 31 DECEMBER 2015
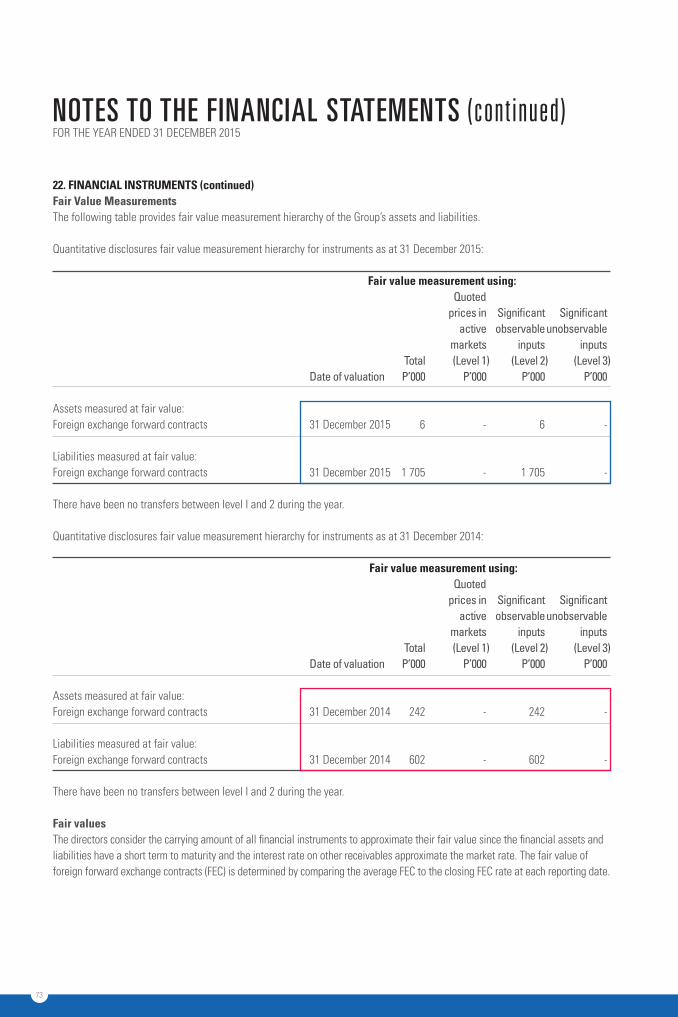
73
NOTES TO THE FINANCIAL STATEMENTS (continued)FOR THE YEAR ENDED 31 DECEMBER 2015
22. financial instrUments (continued)fair value measurements The following table provides fair value measurement hierarchy of the Group’s assets and liabilities.
Quantitative disclosures fair value measurement hierarchy for instruments as at 31 December 2015:
fair value measurement using: Quoted prices in Significant Significant active observable unobservable markets inputs inputs Total (Level 1 ) (Level 2 ) (Level 3 ) Date of valuation P’000 P’000 P’000 P’000
Assets measured at fair value: Foreign exchange forward contracts 31 December 2015 6 - 6 - Liabilities measured at fair value: Foreign exchange forward contracts 31 December 2015 1 705 - 1 705 -
There have been no transfers between level I and 2 during the year.
Quantitative disclosures fair value measurement hierarchy for instruments as at 31 December 2014: fair value measurement using: Quoted prices in Significant Significant active observable unobservable markets inputs inputs Total (Level 1 ) (Level 2 ) (Level 3 ) Date of valuation P’000 P’000 P’000 P’000
Assets measured at fair value: Foreign exchange forward contracts 31 December 2014 242 - 242 - Liabilities measured at fair value: Foreign exchange forward contracts 31 December 2014 602 - 602 -
There have been no transfers between level I and 2 during the year.
fair values The directors consider the carrying amount of all financial instruments to approximate their fair value since the financial assets and liabilities have a short term to maturity and the interest rate on other receivables approximate the market rate. The fair value of foreign forward exchange contracts (FEC) is determined by comparing the average FEC to the closing FEC rate at each reporting date.
74
NOTES TO THE FINANCIAL STATEMENTS (continued)
capital management The Group and company define capital as the total equity of the Group and company as noted in the statement of changes in equity. The Group’s and company’s long-term objective for managing capital is to deliver competitive, secure and sustainable returns to maximise long-term shareholder value. Management is of the view that these objectives are being met. The Group and company are not subject to any externally-imposed capital requirements.
The Group and company aim to maintain capital discipline in relation to investing activities while growing the dividend per share. The Group and company do not have any long term debt. Cash retained in the Group and company is used to self-fund investing activities.
fair valUe measUrements (continued) fair value measurements (continued)
23. sUbsiDiary comPanies Subsidiary companies of Engen Botswana Limited and that of Engen Marketing Botswana (Pty) Ltd, which are all incorporated in Botswana, are as follows:
% Holding Business Description
Subsidiaries of Engen Botswana Limited Engen Marketing Botswana (Pty) Ltd 100 Marketing of petroleum productsSubsidiary of Engen Marketing Botswana (Pty) LimitedEngen Properties (Pty) Ltd* 100 Property owning The major portion of the group’s activities are conducted by Engen Marketing Botswana (Pty) Ltd. The company marked *is in the process of being deregistered.
24. events after tHe rePorting PerioD There are no events that occurred after the reporting period that may require adjustment of or disclosure in the annual financial statements.
FOR THE YEAR ENDED 31 DECEMBER 2015
75
rePort on tHe financial statementsWe have audited the accompanying financial statements and the group financial statements of Engen Botswana Limited, which comprise the statement of financial position as at 31 December 2015, and the statement of comprehensive income, statement of changes in equity and statement of cash flows for the year then ended, and a summary of significant accounting policies and other explanatory information, as set out on pages 34 to 74. Directors’ resPonsibility for tHe financial statements The company’s directors are responsible for the preparation and fair presentation of these financial statements in accordance with International Financial Reporting Standards and in the manner required by the Companies Act of Botswana (Companies Act, 2003) and for such internal control as the directors determine is necessary to enable the preparation of financial statements that are free from material misstatement, whether due to fraud or error.
aUDitors’ resPonsibility Our responsibility is to express an opinion on these financial statements based on our audit. We conducted our audit in accordance with International Standards on Auditing. Those standards require that we comply with ethical requirements and plan and perform the audit to obtain reasonable assurance about whether the financial statements are free from material misstatement. An audit involves performing procedures to obtain audit evidence about the amounts and disclosures in the financial statements. The procedures selected depend on the auditor’s judgment, including the assessment of the risks of material misstatement of the financial statements, whether due to fraud or error. In making those risk assessments, the auditor considers internal control relevant to the entity’s preparation and fair presentation of the financial statements in order to design audit procedures that are appropriate in the circumstances, but not for the purpose of expressing an opinion on the effectiveness of the entity’s internal control. An audit also includes evaluating the appropriateness of accounting policies used and the reasonableness of accounting estimates made by management, as well as evaluating the overall presentation of the financial statements.
We believe that the audit evidence we have obtained is sufficient and appropriate to provide a basis for our audit opinion.
oPinionIn our opinion, the financial statements give a true and fair view of the financial position of the Engen Botswana Limited Group and the Company as at 31 December 2015, and its financial performance and its cash flows for the year then ended in accordance with International Financial Reporting Standards, and in the manner required by the Companies Act of Botswana (Companies Act, 2003).
Ernst & YoungPracticing Member: T. Chitambo (20030022)Certified Auditor
Gaborone17 March 2016
INDEPENDENT AUDITORS’ REPORTTO THE MEMBERS OF ENGEN BOTSWANA LIMITED
76
NOTICE OF ANNUAL GENERAL MEETINGFOR THE YEAR ENDED 31 DECEMBER 2015
share capital: Details of the company’s share capital are set out in note 15 to the financial statements.
results:The annexed financial statements adequately disclose the financial position and the results of the Group of the year ended 31 December 2015.
Holding company: The company’s holding company is Petroleum Investment Holdings Limited and its ultimate holding company is PETRONAS of Malaysia.
subsidiary companies: Details of the company’s subsidiaries are set out in note 23 to the financial statements.
In terms of the company’s articles of association: Messrs:A. M. Bryce, A. M. Siwawa and S. Ndzinge have made themselves available for re-election.
auditors: The auditors, Ernst and Young, retire at the forthcoming annual general meeting and offer themselves for re-appointment.
Gaborone 27 May 2016
notice of meetingNotice is hereby given that the 50th Annual General Meeting of the company will be held at the Gaborone International Convention Centre, on Wednesdy 29 June 2016 at 10h00 for the following business:
agenda1. To read the notice convening the meeting.2. To receive and consider the audited financial statements for
the year ended 31 December 2015.3. To approve the dividends as recommended by the Directors.4. To ratify the appointment of Ms. C Mareka who was
appointed during the year by the Board of Directors.5. Messrs A. M. Bryce, A. M. Siwawa and S. Ndzinge who
retire in accordance with Article 62 of the Constitution, being eligible, offer themselves for re-election.
5a) To confirm the re-election of Mr A. M. Bryce who retires in accordance with Article 62 of the Constitution and being eligible, offers himself for re-election.
5b) To confirm the re-election of Mr. A. M. Siwawa who retires in accordance with Article 62 of the Constitution and being eligible, offers himself for re-election.
5c) To confirm the re-election of Dr S. Ndzinge who retires in accordance with Article 62 of the Constitution and being eligible, offers himself for re-election.
6. To approve the remuneration of the directors for the year ended 31 December 2015 as set out on page 26 of the Annual Report.
7. To appoint auditors for ensuing year and approve the remuneration for the past year’s audit.
8. To transact such other business as may be transacted at an Annual General Meeting.
9. Every member entitled to attend and vote at the meeting may appoint one or more persons as a proxy to attend, speak and vote in his/her stead.
A proxy need not be a member of the company. Proxy forms should be forwarded to reach the company’s transfer offices or registered offices at least 48 hours before the time to meeting. Proxy forms are available from the company secretaries on request.
By order of the Board.
Pricewaterhouse Coopers (Proprietary) LimitedCompany SecretariesGaborone
27 May 2016
the board of Directors has pleasure in submitting its report to the shareholders, together with audited financial statements for the year ended 31 December 2015.
77
FORM OF PROXYFOR THE YEAR ENDED 31 DECEMBER 2015
the 50th annual general meeting of the company will be held at the gaborone international convention centre, on Wednesday 29 June 2016 at 10h00.
I/Weofbeing member/ members of the above named company do hereby appoint:
of or failing him/her
ofthe Chairman of the meeting as my/our proxy to vote for me/ us on my/ our behalf at the 50th Annual General Meeting of the company will be on Wednesday 29 June 2016 at 10h00.Signed this day of 2016
Signature
notes1. Every member entitled to attend and vote at the meeting
is entitled to appoint one or more persons as a proxy to attend, speak and vote in his/ her stead. Such proxy need not be a member of the company.
2. A member may insert the name/s of proxy/ies of the member’s choice in the space provided, with or without deleting the words “the chairman of the annual general meeting”. Any such deletion must be initialed by the member. The person whose name stands first on the form of proxy and has not been deleted shall not be entitled to act a proxy to the exclusive of those whose names follow.
3. A member’s instruction to the proxy must be indicated by the insertion of the relevant number of votes exercisable by that member in the appropriate space provided and by written instruction (if any) regarding the re-election of the specific directors. Failure to comply with the above will be deemed to authorize the proxy to vote or to abstain from voting at the annual general meeting as he/she deems fit in respect of all votes cast and in respect exercisable by the member of his/ her proxy, but the total of the votes cast and in respect whereof abstention is recorded may not exceed the total of the votes exercisable by the member or by his/her proxy.
4. Any alteration or correction made to this form of proxy must be initialed by the signatory/ies.
5. Documentary evidence establishing the authority of a person signing this form of proxy in a representative capacity must be attached to this form unless previously recorded by the transfer secretaries of the company or waived by the chairman of the annual general meeting.
6. The completion of lodging of this form shall not preclude the relevant member from attending the annual general meeting and speaking and voting in person thereat to the exclusion of any proxy appointed in terms hereof, should such member wish to do so, provided that notice of revocation of the proxy is lodged at the company’s transfer secretaries or registered offices before the meeting.
7. Forms of proxy must be lodged at the company’s transfer secretaries or registered office to be received not later than forty-eight hours before the time of the meeting.
transfer secretariesPricewaterhouse Coopers (Pty) LtdFairgrounds Office Park Plot 50371P O Box 1453Gaborone
registereD officePlot 54026Western BypassP O Box 867Gaborone

78
NOTES

79
NOTES