Embed Size (px)
Citation preview
Unclassified ECO/WKP(2009)42 Organisation de Coopération et de Développement Économiques Organisation for Economic Co-operation and Development 05-Jun-2009 ________________________________________________________________________________________________________ English - Or. English ECONOMICS DEPARTMENT
THE ECONOMICS OF CLIMATE CHANGE MITIGATION: HOW TO BUILD THE NECESSARY GLOBAL ACTION IN A COST-EFFECTIVE MANNER ECONOMICS DEPARTMENT WORKING PAPERS No.701
By Jean-Marc Burniaux, Jean Chateau, Rob Dellink, Romain Duval and Stéphanie Jamet
All Economics Department Working Papers are available through OECD's internet web site at www.oecd.org/eco/working_papers
JT03266133 Document complet disponible sur OLIS dans son format d'origine Complete document available on OLIS in its original format
EC
O/W
KP
(2009)42 U
nclassified
English - O
r. English
Cancels & replaces the same document of 02 June 2009
ECO/WKP(2009)42
2
ABSTRACT/RESUMÉ
The economics of climate change mitigation: how to build the necessary global action in a cost-effective manner
This paper examines the cost of a range of national, regional and global mitigation policies and the corresponding incentives for countries to participate in ambitious international mitigation actions. The paper illustrates the scope for available instruments to strengthen these incentives and discusses ways to overcome barriers to the development of an international carbon price, based on the quantitative assessment from two global and sectorially-disaggregated CGE models. Key step towards the emergence of a single international carbon price will most likely involve the phasing out of subsidies of fossil fuel consumption and various forms of linking between regional carbon markets, ranging from direct linking of existing emission trading systems to more indirect forms through the use of crediting mechanisms. The paper discusses regulatory issues raised by the expansion of emission trading and crediting schemes as well as the complementary contribution of R&D policies. Finally, the paper emphasises the importance of incorporating deforestation into a global agreement as well as the key role of international transfers, not least to overcome the relatively strong economic incentives in some countries to free ride on other regions mitigation actions.
JEL classification: H23; H41; O13; O3; Q32; Q43; Q54
Keywords: climate change; climate policy; carbon leakage; linking; crediting mechanism; sectoral approach; energy subsidies; deforestation.
+++++++
L'économie de l'attenuation du changement climatique : comment élaborer l'action nécessaire au niveau mondial avec un rapport coût-efficacité optimal
Cette étude examine le coût d’un éventail de mesures prises au plan national, régional et mondial pour réduire les émissions de gaz à effet de serre, ainsi que les incitations pour les pays à participer à des actions mondiales ambitieuses de mitigation. L’étude illustre la capacité des instruments disponibles à renforcer ces incitations et discute des moyens pour surmonter les barrières au développement d’un prix mondial du carbone, sur la base d’une évaluation quantitative à partir de deux modèles d’équilibre général désagrégés au plan sectoriel. Parmi les étapes essentielles vers l’émergence d’un prix mondial unique du carbone on trouvera vraisemblablement la suppression des subventions à la consommation des combustibles fossiles ainsi que des formes diverses d'intégration des marchés du carbone régionaux, allant des couplages directs des systèmes d’échange de droits d’émission à des formes plus indirectes par le biais d’un mécanisme de crédits d’émission. Cette étude examine enfin les questions de réglementation soulevées par l’expansion des systèmes d’échange de droits et de crédits d’émissions ainsi que le rôle complémentaire politique de R&D.
Classification JEL : H23; H41; O13; O3; Q32; Q43; Q54
Mots-clés : changement climatique ; politique climatique ; fuite carbone ; intégration des marchés du carbone ; subventions à l’énergie ; déforestation.
Copyright OECD 2009
Application for permission to reproduce or translate all, or part of, this material should be made to: Head of Publications Service, OECD, 2 rue André-Pascal, 75775 Paris CEDEX 16.
ECO/WKP(2009)42
3
TABLE OF CONTENTS
THE ECONOMICS OF CLIMATE CHANGE MITIGATION: HOW TO BUILD THE NECESSARY GLOBAL ACTION IN A COST-EFFECTIVE MANNER ........................................................................... 7
1. Introduction and executive summary ...................................................................................................... 7 1.1. Introduction....................................................................................................................................... 7 1.2. The need for broad-based international mitigation and incentives for action ................................... 8 1.3. Removing environmentally-harmful energy subsidies ................................................................... 10 1.4. Achieving global harmonisation and linkages of carbon market .................................................... 10 1.5. The role of crediting mechanisms on the path towards a global carbon market ............................. 12 1.6. The potential and limitations of sectoral approaches ...................................................................... 13 1.7. Incorporating forestry into an international climate policy framework .......................................... 14 1.8. Regulating carbon markets ............................................................................................................. 15 1.9. Building political support for action ............................................................................................... 16
2. The need for broad-based international mitigation and incentives for action ....................................... 17 2.1. How large do international climate coalitions have to be? ............................................................. 17 2.2. Assessing the incentives for countries to join and remain in an international mitigation agreement19
3. Removing environmentally-harmful energy subsidies .......................................................................... 23 4. Building a global carbon market gradually by linking emission trading schemes ................................ 27
4.1. The benefits of linking .................................................................................................................... 28 4.2. Potential risks of linking ................................................................................................................. 30 4.3. Addressing the spread of ETS design features ............................................................................... 36
5. The role of emission crediting mechanisms on the path towards a global carbon market .................... 37 5.1. The potential gains from well-functioning crediting mechanisms.................................................. 37 5.2. Challenges with crediting mechanisms and problems with the current CDM ................................ 38 5.3. CDM reform options ....................................................................................................................... 41
6. The potential and limitations of sectoral approaches ............................................................................ 44 6.1. Forms of sectoral approaches ......................................................................................................... 44 6.2. Increasing emission reductions and lowering mitigation cost through sectoral approaches .......... 45 6.3. Impact of sectoral approaches on carbon leakage and competitiveness concerns .......................... 47 6.4. Limits of sectoral approaches and options going forward .............................................................. 48
7. Incorporating reduction of emissions from deforestation and forest degradation in an international agreement. ................................................................................................................................................. 49
7.1. Emissions from deforestation and forest degradation: past, present and projections ..................... 49 7.2. Abatement potential associated with avoided deforestation ........................................................... 50 7.3. Incorporating REDD into a global carbon agreement: implementation issues ............................... 51
8. Regulatory issues and the role of financial markets .............................................................................. 54 8.1. The risks associated with the development of carbon markets ....................................................... 54 8.2. Institutions and regulations to address carbon market risks ........................................................... 55
9. Building political support for action across countries ........................................................................... 58 9.1. International financial support for mitigation ................................................................................. 59 9.2. Broadening political support for action through R&D, technology transfer and adaptation financing arrangements .......................................................................................................................... 62 9.3. Conclusions: main elements of a global post-2012 international climate policy framework ......... 67

ECO/WKP(2009)42
4
BIBLIOGRAPHY ......................................................................................................................................... 70
Tables
2.1. Potentially effective coalitions (PECs) to meet a 550ppm CO2eq GHG concentration target at the 2050 and 2100 horizons ............................................................................................................................ 81 2.2. Economically feasible coalitions to meet a 550ppm CO2eq GHG concentration target at the 2050 and 2100 horizons ..................................................................................................................................... 82 3.1. Energy price gaps in non-OECD countries ........................................................................................ 83 3.2. Impact of multilateral removal of energy subsidies in non-OECD countries on GHG emissions ..... 84 3.3. Impact of unilateral removal of energy subsidies in non-OECD countries on CO2 emissions, GDP and real income ......................................................................................................................................... 85 3.4. GDP and income impacts of a multilateral removal of energy subsidies in non-OECD countries .... 86 3.5. Impact of removal of energy subsidies in Annex I countries only on their mitigation costs ............. 87 3.6. Impact of multilateral removal of energy subsidies on global mitigation costs (550 ppm GHG concentration stabilisation scenario) ......................................................................................................... 88 3.7. Global GDP cost of a 550 ppm CO2eq concentration stabilisation scenario in different versions of ENV-Linkages and for alternative assumptions regarding energy subsidies ............................................ 89 4.1. Implication of differences in design features between pre-linked schemes on the performance of the linked system ............................................................................................................................................. 90 4.2. Implications of linking to a scheme with cost-containment measures ............................................... 92 8.1. Regulations to address carbon market risks ....................................................................................... 93 9.1. Top 10 inventors of climate-related technologies, 1998-2003 ........................................................... 94 9.2 Simulation of declared or suggested country targets ........................................................................... 95
Figures
2.1. Selected regional and aggregate estimates of the damages from climate change .............................. 96 2.2 WITCH model estimates of regional abatement costs under simple world carbon tax scenarios ....... 97 2.3. Optimal GHG emission and concentration paths in WITCH with and without international co-operation, high-damage/low-discounting case .......................................................................................... 98 2.4. Optimal World GHG emission paths in WITCH with international co-operation, for alternative damage and discounting assumptions ....................................................................................................... 99 2.5. Consumption levels relative to BAU in the WITCH model with and without participation in a world coalition (no international financial transfers, high-damage/low-discounting case) ............................... 100 4.1. The impact of linking Annex I cap-and-trade schemes on the distribution of emission reductions . 101 4.2. Mitigation policy costs under a 50% emission cut in Annex I, with and without direct linking among Annex I emission trading schemes .......................................................................................................... 102 4.3. Projected geographical distribution of permit buyers and sellers under a 50% emission cut in Annex I ............................................................................................................................................................... 103 4.4. Output of energy intensive industries and leakage rates with and without linking across Annex I regional cap-and-trade schemes, 2020 .................................................................................................... 104 5.1. Mitigation policy costs under a 50% emission cut in each Annex I region separately, with and without crediting mechanisms ................................................................................................................. 105 5.2. Carbon prices under a 50% emission cut in each Annex I region separately, with and without crediting mechanisms .............................................................................................................................. 106 5.3. Projected geographical distribution of offset credit buyers and sellers at the 2020 horizon under a 50% emission cut in each Annex I region separately .............................................................................. 107
ECO/WKP(2009)42
5
5.4. The gains from direct linking across Annex I regions when they are already linked through a crediting mechanism................................................................................................................................ 108 5.5. Carbon leakage rate and output of energy-intensive industries under a 50% emission cut in each Annex I region separately, with and without crediting mechanisms, 2020 ............................................. 109 5.6. CERs issued under the crediting mechanism: trends and decomposition by type of project ........... 110 5.7. Mitigation policy costs under a world ETS and equivalent Annex I mitigation action with a crediting mechanism ............................................................................................................................................... 111 6.1. Contribution of energy intensive industries1 and the power sector to world GHG emissions, 2005 112 6.2. The impact of sectoral approaches covering non-Annex I regions on world emission reductions and mitigation costs ....................................................................................................................................... 113 6.3. Mitigation costs under an international ETS in Annex I and binding sectoral caps in non-Annex I regions ..................................................................................................................................................... 114 6.4. The impact of sectoral crediting on mitigation costs in Annex I and non-Annex I regions ............. 115 6.5. The impact of sectoral crediting on carbon leakage rates ................................................................ 116 6.6. Impact of sectoral approaches on the output of energy-intensive industries ................................... 117 7.1. GHG emissions from land-use changes and forestry by region ....................................................... 118 7.2: BAU projections of CO2 emissions from deforestation, 2000-2100 ................................................ 119 7.3: Marginal abatement curves from the ENV-Linkages model in 2020, with and without emissions from deforestation ................................................................................................................................... 120 9.1. Contribution of each world region to cumulative world emissions over 1900-2004 ....................... 121 9.2. The impact of permit allocation rules on the costs of mitigation action, Annex I regions ............... 122 9.3. The impact of permit allocation rules on the costs of mitigation action, non-Annex I regions ....... 123 9.4. International technology transfer trends, 1978-2008 ........................................................................ 124 9.5. Patent rights index, 2005 .................................................................................................................. 125 9.6. Regional costs of an Annex I carbon tax in 2020 ............................................................................. 126
Boxes
Box 1. Analysing climate coalitions: theoretical concepts and implementation in the WITCH model .... 18 Box 2. Improving the specification of the electricity sector in ENV-linkages .......................................... 27 Box 3. Intensity targets and their implications for linking ........................................................................ 34 Box 4. CDM baselines, credits and carbon leakage .................................................................................. 39 Box 5. Estimating the abatement potential associated with avoided deforestation ................................... 50 Box 6. Direct public financing mechanisms for mitigation action in developing countries and options for the future ................................................................................................................................................... 59 Box 7. Comparing mitigation costs and emission reductions across countries ......................................... 68

ECO/WKP(2009)42
6
ECO/WKP(2009)42
7
THE ECONOMICS OF CLIMATE CHANGE MITIGATION: HOW TO BUILD THE NECESSARY GLOBAL ACTION IN A COST-EFFECTIVE MANNER1
1. Introduction and executive summary
1.1. Introduction
1. Considering the costs and risks of inaction, ambitious action to reduce greenhouse gas (GHG) emissions is economically rational. Accordingly, governments have reached consensus on the need to achieve large emission cuts worldwide over the coming decades, and are working towards establishing an international agreement on how to achieve these emission reductions at the UN Framework Convention on Climate Change (UNFCCC) conference in Copenhagen at the end of 2009.
2. The ongoing economic crisis provides no room for complacency. At most, it is expected to reduce global emissions marginally and temporarily, after which an upward trend will resume. Delaying mitigation action in response to the crisis would therefore imply larger cuts at a later stage to achieve the same target, thereby unduly raising costs compared with a more gradual approach. Moreover, well-designed climate mitigation policies should be phased-in gradually over the coming years in order to avoid unnecessary scrapping of capital, and as such they would entail very low initial costs. There may even be scope for stimulating the economy in the current context by bringing forward some low-carbon investment expenditures. The crisis has also created sizeable government funding shortfalls in many OECD countries, which prospective fiscal revenues from carbon pricing could help reduce. As such, the crisis is not an excuse to delay action on climate change.
3. Given the magnitude of emission cuts required to achieve stabilisation of GHG concentrations at a level that would “prevent dangerous anthropogenic interference with the climate system” (IPCC, 2007), it is imperative that mitigation action is achieved at least cost. Previous OECD analyses explored ways to meet this basic requirement for successful post-2012 international climate policies, and assessed the economic and environmental implications of alternative arrangements (Burniaux et al. 2008; OECD, 2008). It confirmed that ambitious GHG abatement is economically rational, and showed that the cost of action would be minimised if a cost-effective set of policy instruments (including, inter alia, price-based instruments, R&D policies and targeted regulations and standards) be applied as broadly as possible across all emission sources (countries, sectors and gases). Against this background, the paper concluded on the
1 The authors are working at the OECD Environment Directorate and the OECD Economics Department
(Email: [email protected];[email protected]; [email protected]; [email protected]; [email protected] ). They want to express gratitude to Christine de la Maisonneuve and Cuauhtemoc Rebolledo-Gómez for invaluable statistical assistance. They are grateful to Fatih Birol and Trevor Morgan from the IEA for valuable collaboration in providing data on fossil fuels subsidies in non-OECD data. They also want to thank Carlo Carraro and William Whitesell for their contributions as well as Jan Corfee-Morlot, Alain de Serres, Jane Ellis, Jorgen Elmeskov, Katia Karousakis, Lorents Lorentsen, Helen Mountford, Giuseppe Nicoletti, Jean-Luc Schneider for helpful comments and Irene Sinha for editing assistance. The authors retain full responsibility for errors and omissions.
ECO/WKP(2009)42
8
need for urgent, credible and comprehensive international mitigation action, along with some degree of decoupling between where abatement takes place and who pays for it.
4. Recognising that broad-based international mitigation action covering all main emitters will be difficult to achieve immediately, reflecting discussions at the last OECD Ministerial Council Meeting in June 2008 and at the joint WP1/WPGSP Meeting in October 2008, the present paper extends previous OECD analysis in a number of directions, including examining:
• The incentives for countries to participate in ambitious international mitigation action and available instruments to enhance these incentives, such as through financial and technology support.
• How to achieve broad-based international carbon pricing – a cornerstone of any least-cost policy mix – gradually in practice, through linking a range of policy instruments including domestic emission trading schemes (ETS), emission crediting mechanisms – such as the Clean Development Mechanism (CDM), including in scaled-up form – and sectoral approaches.
• The implications of alternative policy mixes for world emissions, mitigation policy costs, as well as for carbon leakage and competitiveness concerns.
The paper also covers two important policy issues on which analysis in the previous joint WP1/WPGSP work only briefly touched, namely:
• The potential impact on world emissions and mitigation policy costs of removing existing fossil fuel energy subsidies.
• The abatement potential of the forestry sector and the associated costs, as well as concrete institutional options to incorporate this sector into a future international climate policy framework.
1.2. The need for broad-based international mitigation and incentives for action
5. Ambitious mitigation action at the world level requires building up a coalition of countries that is potentially environmentally effective (i.e. can, in principle, achieve ambitious world targets even if non-participating countries take no mitigation action), economically feasible (i.e. can meet the target without inducing excessive mitigation costs), delivers a net benefit to its member countries as a whole, and provides each member country with sufficient incentives to join. The potential for such a coalition is explored in Section 2, mainly through the use of a global model that incorporates explicitly the economic gains from avoided climate change and captures some of the strategic aspects of international relations, such as co-operation incentives.2 The main findings from this analysis are as follows:
• The benefits of mitigation policies are difficult to quantify and fully monetise. Nevertheless, OECD analysis finds that when non-market impacts and risks of inaction are factored in,
2. These simulations are run using the WITCH model. While the focus of previous OECD work with WITCH
was on exploring technology-related issues, the model also has a game-theoretic structure that allows some analysis of the financial incentives for countries to participate and remain in climate coalitions. The analysis explicitly factors in the impacts of climate change on output and consumption, including non-market impacts and catastrophic risks – keeping in mind that such estimates are subject to wide uncertainties.
ECO/WKP(2009)42
9
ambitious mitigation action is found to be economically rational – i.e. to result in net benefits – at the global level. This is the case even though the analysis does not factor in the co-benefits from mitigation action (e.g. in terms of human health, energy security or biodiversity), which previous OECD analysis estimated to be large (Burniaux et al. 2008).
• Addressing climate change will require enhanced mitigation actions by developing countries over the coming decades. Given the projected "business-as-usual" (BAU) growth in the emissions of a number of developing regions, achieving an overall GHG concentration target equal to (or below) 550 ppm CO2eq implies significant action in all developed countries, as well as China and India by 2050.3 Even by bringing their own emissions down to zero, smaller coalitions would not achieve the target. Furthermore, mitigation costs would become excessively high under very large emission reductions amongst a more limited number of countries. As a result, only coalitions that include many developing regions by 2050, and all world regions with the possible exception of Africa by 2100, would achieve the illustrative 550 ppm CO2eq target at a manageable cost.
• In an economic perspective, ensuring incentives for all emitting regions to participate in action will be challenging, because most of them are found to gain less individually from participating than from staying outside and benefiting from the abatement efforts of others (so-called “free-riding”). In the absence of international financial transfers, participation incentives are likely to be lower where the mitigation costs from a world carbon price are relatively high and/or the expected damages from climate change are relatively low. On this basis, Russia and other carbon-intensive, fossil-fuel producing Eastern-European economies, Middle-Eastern countries and China are found to gain less from a global agreement than Western European countries or, to a somewhat lesser extent, the United States, Japan and India, ceteris paribus.
• One powerful way to broaden country participation is through international financial transfers or other support, which can be achieved through arrangements in the areas of mitigation financing, R&D, technology transfers, international trade and climate change adaptation (see Section 1.9 below). However, even with international transfers, it will be difficult to convince countries who gain the least to participate, while ensuring that nobody else incurs losses. In fact, in order for the incentives to free ride to be broadly overcome, it may be necessary that a set of key regions be willing to accept relatively minor losses.
• As an illustrative example, the model-based analysis suggests that if developed countries as a group accepted to incur a modest consumption loss (relative to BAU) from world mitigation action to overcome free-riding incentives in other regions, the prospects for a broad and stable international coalition to meet a 550 ppm CO2eq long-run concentration stabilisation target would greatly improve. It should be stressed that such losses would most likely be more than offset by various co-benefits (e.g. reduced local air pollution and increased energy security) that are not factored in this calculation. Furthermore, in order to be achieved in a cost-effective manner, transfers of such magnitude would have to be made primarily through market mechanisms, essentially via credits generated to meet binding emission reduction commitments across countries.
3 The analysis presented here aims to shed light on the implications of different approaches to reach a given
stabilisation target. An illustrative scenario of 550 ppm CO2eq for all gases (equivalent to 450 ppm CO2 only) has been used in the analysis, but it is not intended as an endorsement of such a target. The 550 ppm CO2eq level is broadly viewed as the minimum required to limit the costs from climate change, but many countries are discussing more stringent emission reduction targets such as 450 ppm or even 350 ppm.
ECO/WKP(2009)42
10
1.3. Removing environmentally-harmful energy subsidies
6. One way to foster wider international mitigation action is to first implement those measures that yield both climatic and economic benefits, including in particular the removal of fossil fuel energy subsidies. These subsidies amount de facto to a negative carbon price. As such, their removal may be seen as a necessary, albeit politically difficult, step towards broad-based international carbon pricing. In this regard, subsidy removal would free-up budgetary resources that could be used, in turn, to more directly target the social objectives that might have been supported via the subsidies. Analysis of the potential environmental and economic effects of energy subsidy removal in non-OECD countries is carried out in Section 3, using the OECD model ENV-Linkages.4 The main findings are:
• Energy subsidies, as inferred from the gap between domestic and international fossil fuel prices, are currently high in Russia, other non-EU Eastern European countries, and a number of large developing countries, particularly India.
• Closing the gap between domestic and international fossil fuel prices could cut GHG emissions drastically in these countries, in some cases by over 30% relative to BAU levels by 2050. At the same time, broad-based energy subsidy removal would lower the demand for, and thereby the world prices of, fossil fuels. As a result, emissions would rise in other (mainly developed) countries, limiting the decline in world emissions to about 10% by 2050. However, with binding emission caps in developed countries, such “leakage” would be contained, and world emission reductions would be larger.
• Energy subsidy removal would also raise GDP-per-capita levels in most countries concerned, including India and, to a lesser extent, China. However, by lowering world fossil fuel prices, broad-based energy subsidy removal would impose terms-of-trade and output – as supply would be reduced – losses on producing countries.
• Finally, removing energy subsidies would lower the overall GDP cost of meeting a given world emission target. Such gains are however estimated to be small. This is mainly because energy demand is not very sensitive to price, so that the economic costs of energy subsidies and the gains from their removal are limited.
1.4. Achieving global harmonisation and linkages of carbon market
7. Despite the need to achieve broad country participation in international mitigation action over the next decades, implementing a “first-best” framework of a global carbon price in the near future will be politically and institutionally challenging. Less ambitious intermediate arrangements will likely need to be found for the coming years. With domestic/regional ETSs spreading internationally and discussions around CDM reform gaining prominence, a global carbon market may de facto gradually build up through direct linking across domestic/regional ETSs, and/or indirect linking via a scaled up CDM or other crediting
4. Compared with previous OECD work (Burniaux et al. 2008), the model now incorporates a disaggregated
electricity sector that allows for explicit (rather than implicit) substitution across different ways of producing electricity. The resulting flexibility tends to deliver slightly lower estimates of the cost of meeting any given emission reduction target, compared with Burniaux et al. (2008). ENV-Linkages estimates of the economic effects of alternative climate policies do not factor in the gains from avoided climate change. Apart from this modification, the version of the model used for this analysis is the same than in Burniaux et al. (2008). In particular, it does not incorporate Carbon Capture and Storage (CCS) and the mitigation potential from reducing emissions from deforestation. In this respect, the model tends to overestimate mitigation costs.
ECO/WKP(2009)42
11
mechanisms. Progress in this direction raises a number of issues, including the need to take national specificities into considerations. Compared with a fragmented approach under which a number of regions would meet their emission reduction objectives in isolation, such a gradual path towards global carbon pricing has potential beneficial impacts on mitigation costs, and possibly on reducing carbon leakage. Linking can, therefore, play an important role in the short term in the transition towards a comprehensive international mitigation framework.
8. Direct linking between the carbon markets – in particular the domestic ETSs – of countries that commit to binding mitigation action is explored in Section 4, with the following findings:
• Linking could be an important step towards the emergence of a single international carbon price. By equalising carbon prices and, thus, marginal abatement costs across different ETSs, linking lowers the cost of achieving their joint target. Other significant, but difficult to quantify, gains arise from enhanced liquidity of permit markets.
• The greater the pre-linkage heterogeneity in carbon prices across countries, the larger the cost savings from linking, ceteris paribus. Both are found to be small in a “benchmark” scenario examined in this paper where each Annex I region is assumed to cut its GHG emissions unilaterally to 20% below 1990 levels by 2020 and by 50% below 1990 levels by 2050, respectively – an illustrative commitment which alone would fail to reduce world emissions, and would, therefore, need to be rapidly tightened and/or supplemented with further action in non-Annex I countries. In the absence of linking, this scenario is estimated to reduce average Annex I income by 1½% and 2¾% relative to BAU by 2020 and 2050, with linking lowering these cost estimates by less than 10%, or about ¼ percentage points of income. If some degree of carbon price convergence is already achieved through indirect linking of ETSs via the use of crediting mechanisms (see below), the (additional) gains from explicit linking are reduced.
• Like openness to international trade, linking domestic ETSs should benefit all participating countries, albeit to different degrees and with some winners and losers within each country. Countries with higher pre-linking carbon prices gain from abating less and buying cheaper permits. Countries with lower pre-linking prices benefit from abating more and selling permits, although their economy may be negatively affected by the real exchange rate appreciation triggered by the large permit exports (the so-called “Dutch disease” effect). Model simulations suggest that in the event of linking among domestic Annex I ETSs in the benchmark scenario, permit buyers would include Canada, Australia and New Zealand and, to a lesser extent, the EU and Japan. Russia would be the main seller.
• Although direct linking across schemes has potentially large beneficial impacts on mitigation costs, it also creates incentives for participants to relax their target for future compliance periods (in order to become a permit seller), to under-report their GHG emissions, and/or to link with other ETSs or crediting mechanisms with weak environmental integrity. Also, when systems are linked, most design features of one particular scheme (links to other emission trading and crediting schemes, safety valve, banking and borrowing provisions) spread to all others. Limits to linking (discount factors on sellers, allowance import quota or tariffs) for regions with low-quality permits or offsets have been put forward as a way to address the issue of permit quality. They have several drawbacks, including the risk of triggering retaliation, and would need to be progressively removed conditional on improvements in environmental integrity. A more cost-effective approach would be to reach agreement on key issues prior to linking, including on levels and/or procedures for setting future emission caps, the adoption of safety valves, and rules regarding future linking to other ETSs or crediting mechanisms.
ECO/WKP(2009)42
12
• National or even sectoral intensity targets (expressed as emissions levels per unit of output) have been proposed as a way to promote enhanced GHG mitigation action by fast-growing emerging economies as they catch up with developed countries, without constraining their economic growth prospects. They would indeed insure countries against the risk of unexpected increases in mitigations costs in the event of growth shocks. Within a linked system, intensity targets – which would likely require frequent government intervention to be met –would stabilise the carbon price at the cost of greater uncertainty about overall emission abatement. Over the longer term, an alternative way to reflect economic development concerns would be to allocate absolute targets across countries, conditional on expected economic growth rates and to adjust them over time, in the context of a world “ETS”.
1.5. The role of crediting mechanisms on the path towards a global carbon market
9. Indirect linking of domestic carbon markets through the use of crediting mechanisms is another way to gradually build up an integrated world carbon market and lower mitigation costs (Section 5):
• The cost-saving potential for developed countries of well-functioning crediting mechanisms appears to be very large, reflecting the vast low-cost abatement potential available in a number of developing countries. In the benchmark scenario, allowing 20% of Annex I emission reduction commitments to be met through cuts in non-Annex I countries is estimated to nearly halve mitigation costs in Annex I countries. Raising this cap on offset credit use from 20% to 50% would bring further benefits. Cost savings are found to be largest for the more carbon-intensive Annex I economies, such as Australia and New Zealand, Canada and Russia. China has the potential to be by far the largest seller, and the United States the largest buyer in the offset credit market, each of them accounting for about half of transactions by 2020.
• In theory, by lowering the carbon price differential between participating and non-participating countries, crediting mechanisms can also reduce carbon leakage and mitigate competitiveness concerns. However, leakage is in any case estimated to be low in the illustrative benchmark scenario above. Furthermore, whether crediting mechanisms reduce leakage in practice depends in part on appropriate setting of the baseline against which credits are granted. If these baselines are “too high”, as is the case for instance if they are set at the emission levels that prevail in non-Annex I countries after Annex I takes action, crediting mechanisms basically reallocate emission cuts across regions, without addressing the leakage to non-Annex I that occurred in the first place. Nevertheless, even in this case the competitiveness and output losses of energy-intensive industries (EIIs) are found to be reduced.
• These potential gains are unlikely to be reaped under the current CDM, which raises environmental integrity concerns associated with the reality (“additionality”) of emission cuts, and may create perverse incentives to increase emissions in developing countries. Existing proposals to scale up the CDM, such as “programmatic”, “sectoral” or even possibly “policy” CDMs, can reduce transaction costs and bottlenecks, but may not per se address these deeper problems. One step towards well-functioning crediting mechanisms might be to negotiate baselines covering the largest possible number of sectors for a sufficiently long period, whereby these baselines are set below the BAU emission levels that would prevail under no further mitigation action.
• Crediting mechanisms such as the CDM may also reduce the incentives for non-Annex I countries to take on binding targets in the future. This is because most developing countries – not least China – would obtain a larger income gain under a scaled-up CDM than under most rules for allocating emission rights in a world ETS. Agreement on CDM reform could

ECO/WKP(2009)42
13
incorporate built-in phasing-out mechanisms under which developing countries would commit to taking on increasingly stringent actions as their income levels converge to the higher levels of developed countries. For instance, the sectoral and/or national baselines negotiated in the context of scaled-up CDMs might be gradually tightened and converted into binding emission caps, which could then be expanded across sectors and lowered over time.
1.6. The potential and limitations of sectoral approaches
10. In the absence of a binding international mitigation agreement covering all main emitters, and in a context where even very large emission reductions in Annex I countries alone cannot halt climate change, sectoral approaches have been put forward as a way to broaden participation to developing countries. They could lower overall mitigation costs, facilitate international technology transfers, and are likely to require less institutional capacity than nation-wide targets. They are discussed in Section 6, with the following conclusions:
• Two types of sectoral approaches that could play a useful role are: i) sectoral crediting mechanisms, which would reward emission cuts relative to pre-defined baselines; and ii) binding sectoral targets, under which some developing countries could cap the emissions or the emission intensity of key GHG-emitting sectors. Both approaches would need to be ambitious in order to be environmentally effective. For instance, an illustrative scenario in which the emissions of energy-intensive industries (EIIs) and the power sector – which together account for almost half of current world GHG emissions from fossil fuel combustion – are cut in all non-Annex I countries by a little less than 10% by 2020 and 20% by 2050 (relative to 2005 levels), combined with economy-wide emission cuts of 20% and 50% in Annex I countries in 2020 and 2050 (relative to 1990 levels), is estimated to barely stabilise world emissions at these two particular periods in time. International shipping and air transport, due to their transnational character, are two industries where a sectoral approach could also be useful.
• While in principle both types of sectoral approaches can be designed to achieve emission reductions of similar size, they may not be equivalent in practice. Given the rapid projected BAU emission growth in most developing countries, meeting ambitious world targets through sectoral crediting alone would require negative emission rights – i.e. a debt – for developed countries by 2030-2040, along with lax or no constraints on offset credit use so that these targets can effectively be met. Insofar as such an arrangement is implausible, sectoral crediting, if adopted, will have to evolve gradually into more binding arrangements such as sectoral caps, at least for key developing country emitters. In the transitory period during which sectoral crediting operates, baselines could be progressively tightened – i.e. set further below BAU emission levels – from one commitment period to the next.
• By exploiting low-cost abatement opportunities in developing countries, both sectoral caps and sectoral crediting mechanisms have the potential to lower the cost of achieving a given global emissions target. If appropriately designed, they can also curb leakage and the competitiveness and output losses of EIIs in developed countries. Other sectoral initiatives, such as voluntary, technology-oriented approaches can help diffuse cleaner technologies, but are unlikely to provide sufficient emission reduction incentives to individual firms as they put no explicit opportunity cost on carbon.
• The overall cost of sectoral caps could be reduced through international permit trading between developing countries that adopt them. Linking a sectoral scheme covering non-Annex I countries to an Annex I economy-wide ETS would also bring an economic gain to participating countries as a whole, but could generate winners and losers (permit-buying countries in Annex I
ECO/WKP(2009)42
14
and permit-selling countries in non-Annex I prior to linking, and vice versa). In order to ensure that the overall gain from linking is shared widely across participants, permit allocation rules might be adjusted upon linking.
• Compared with binding caps, sectoral crediting would entail lower GDP costs – and in fact typically a gain – to developing countries and may, therefore, be easier to adopt. At the same time, sectoral crediting would raise many of the same limitations as other CDM reform options. If credits are granted to governments, ways would also need to be found to ensure that the price signal is effectively transferred to firms.
1.7. Incorporating forestry into an international climate policy framework
11. Just as incomplete coverage of gases or countries raise the cost of meeting GHG targets, excluding certain sectors will also increase the costs of action. GHG emissions from deforestation amount to almost 20% of global GHG emissions, although this estimate remains subject to wide uncertainty (Section 7). Existing studies suggest that these emissions could be avoided at a relatively low cost. Preliminary estimates suggest that incorporating these emissions in a global GHG mitigation scheme might reduce carbon prices by up to 40% in 2020. However, there are specific difficulties involved in dealing with Reductions of Emissions from Deforestation and Forest Degradation (REDD):
• In practice monitoring emissions is even more difficult for REDD than for other GHG emission sources, especially in developing countries. Although technical capabilities to measure emissions and monitor their reductions have improved since the 1990s, substantial improvements in data quality still need to be achieved in some developing countries. Therefore, country participation in any REDD scheme should be subject to compliance to appropriate and well-defined eligibility criteria.
• Incorporating REDD in a global climate change mitigation framework also raises a number of implementation issues. Proving additionality is more difficult for emissions from deforestation than for other sources. There is also a higher risk of leakage, as deforestation may shift to areas not subject to control, and of non-permanence, as emissions may simply be delayed. Emissions leakage can also have an impact on broader sustainability goals, for example if old growth forests are replaced with plantations. These risks can be better mitigated if a REDD mechanism is implemented at the national rather than at the project level.
• While low cost forest mitigation efforts could help deliver GHG targets at least cost, these difficulties have raised concerns that if the challenges of certifying additionality and permanence are not addressed, a well-functioning international carbon market might be flooded with low-quality REDD credits that would undermine its environmental integrity and, ultimately, its credibility. Enforcement of well-designed eligibility criteria should in principle substantially mitigate these concerns. Therefore, linking a REDD mechanism to the international carbon market will require the development of clear and robust eligibility criteria to ensure environmental integrity and eventual access to the carbon market might be limited to only those countries that meet these well-designed criteria. In a first stage, funding from developed countries could help some developing countries in building the capacities needed to meet such eligibility criteria.
• Several approaches could be envisaged during the transition towards integration of a REDD market in the international carbon market, all of which have pros and cons. Under a segmented-market approach, a REDD market would be kept separate from other carbon markets. Alternatively, a fund-based approach would rely on voluntary or institutionalised contributions
ECO/WKP(2009)42
15
to a Fund from developed country governments and other sources. These funds could then be distributed to governments based on REDD performance, i.e. on reductions below a pre-determined baseline. This approach would further reduce the risk of contaminating a well-performing international carbon market. However, it would require a mechanism that would provide adequate incentives to contribute to the Fund(s), without regulating private sector investments, and therefore may not mobilise sufficient and sustainable levels of REDD financing to have a significant impact on rates of deforestation.
1.8. Regulating carbon markets
12. Although carbon markets are expected to further develop as more and more countries undertake mitigation actions, institutions and rules will be needed to foster their development and to address risks that are expected to emerge within a linked system of multiple independent and heterogeneous cap-and-trade schemes (Section 8):
• In the absence of a binding international mitigation agreement covering all main emitters, the major risk may be the emergence of a framework that delivers insufficient global emission reductions. This environmental risk will ultimately have to be addressed mainly through agreement on longer-term targets. Centralised institutions created to implement the UNFCCC and the Kyoto Protocol have a key role to play in building up consensus, but complementary compliance mechanisms at the national or regional level will also be needed. One example would be a system of performance bonds, under which governments would put some of their own bonds before the start of a compliance period into the hands of a compliance committee, which would then have the right to sell those bonds in the market in the event of compliance failure.
• Another potential incentive for governments to comply would be a system of buyer liability, under which buyers would be liable for the poor quality of the permits or offsets they hold while, as a result, sellers would also face costs in the form of price discounts on future sales. This system ultimately rests on the willingness of (net) buying countries to enforce penalties on their domestic emitters, and would also require an independent international institution to assess permit and offset quality.
• If inadequately regulated, the development of carbon derivative markets could become a source of financial instability. Clear identification of those financial market institutions in charge of monitoring and regulation of these markets is needed. Unlike in other commodity markets, a majority of regulated firms will tend to hedge against the (one-sided) risk of carbon price increases. Therefore, speculators will have to take the reverse position, bearing some of the net risk and playing a major role in the development of derivative markets. At the same time, one open issue is whether existing limits on the size of speculative positions in spot and derivative commodity markets should also be set in emission permit markets, in order to limit the risk of sudden and/or unwarranted carbon price fluctuations. The creation of a working group of regulators could facilitate exchange of information about regulations, risks and harmonisation needs.
• Liquid spot markets and credible commitments on future emission levels or mitigation policies can foster the development of derivative markets, and lower the cost of insurance against carbon price uncertainty. Market liquidity risks could be limited by regular spot sales of permits that could be banked between compliance periods. The emission of longer-dated permits can help signal the strength of government commitment and build a political constituency to support the

ECO/WKP(2009)42
16
continuation of mitigation action. However, it can fragment the market and may, therefore, be considered primarily in case the credibility of the scheme cannot be established otherwise.
• With a large proportion of transactions taking place in over-the-counter markets, the counterparty risk in carbon markets could become significant. Options to address it include expanding access to clearing houses and exchange trading, or specifying penalties for performance failures in contracts. If delivery failures were nevertheless to develop, they might reflect imbalances between supply and demand, which could be addressed though temporary lending of allowances by governments. More broadly, limiting the uncertainty around long-term commitments and the associated supply and demand for permits would also contain this risk.
1.9. Building political support for action
13. Any intermediate international climate policy arrangements will need to evolve gradually to achieve more ambitious world mitigation action, including through enhanced commitments by developing country emitters. One way to facilitate this necessary evolution is through implicit and/or explicit international transfer mechanisms across countries. Such devices include not only market-based mitigation financing tools (e.g. via the crediting mechanisms discussed above), but also direct public funding of mitigation action, international financing arrangements in the areas of R&D, technology transfers and adaptation to climate change, as well as the allocation of binding emission commitments across countries over the longer term (Section 9):
• Direct public funding of mitigation actions in developing countries has gained prominence recently with the creation or "scaling up" of Multilateral Funds and a number of bilateral initiatives. However, these public financing devices remain fragmented and limited in size. In order to be cost-effective, they will need to be rationalised and to target primarily those emission sources and/or market imperfections left unaddressed by other (market-based) financing mechanisms.
• International transfers and deployment of climate-related technologies have been limited to date. A cost-effective way to boost them would be for recipient countries to remove current policy distortions (lack of carbon price, barriers to trade and foreign direct investment in climate-related technologies, weak intellectual property rights) and for the international community to help address relevant market barriers (need for experience with certain technologies before they can become competitive at market prices, lack of access to credit and information). Existing or envisaged Multilateral Funds might be scaled up and rationalised to that purpose, and might also possibly cover some IPR-related costs.
• Compared with technology transfers, R&D policies have received only limited attention in the international context thus far. Yet, previous OECD analysis found the rationale for policy intervention to be particularly strong in this area, due to both their large potential impact on future mitigation costs and the presence of multiple market failures. R&D in developed countries focused on long-term breakthrough technologies could, therefore, be incorporated in the portfolio of activities of existing Multilateral Funds. Country contributions would then need to be designed in a way that avoids crowding out domestic R&D spending.
• Adaptation financing could be increased through a mix of domestic policy reforms (e.g. adequate pricing of water and ecosystems) and higher public spending on relevant local public goods (e.g. sea walls, flood defences, disaster relief). For least developed countries, the latter might partly be financed by the Adaptation Fund. This would require some scaling up of current financing arrangements, along with explicit consideration for potential moral hazard problems.
ECO/WKP(2009)42
17
• Over the longer term, one powerful international transfer mechanism would be the allocation of emission rights across countries, which enables a separation between where action is undertaken – ensuring abatement takes place wherever it is least cost – and who pays for it. For instance, compared with a world carbon tax (or equivalently a full permit auctioning) scenario, developing countries are projected to gain significantly by 2050 from illustrative allocation rules under which their emission rights cover their BAU emissions (“BAU” rule) or are inversely related to their contribution to past cumulative emissions (“historical responsibility” rule). Developing countries would also usually benefit from rules based on population size (“per capita” rule) or GDP per capita (“ability to pay” rule), albeit to a somewhat lesser extent. All four rules – in particular the former two – generally impose significant costs on developed countries and (especially) Russia, although these vary across specific countries.
• Developed countries have indicated that they will take the lead in reducing emissions, and a number of them have already declared or suggested emission reduction targets. Some preliminary assessment of these targets points to a reduction of emissions in Annex I countries of 6% by 2020 relative to 1990 levels. This would on its own be clearly insufficient to put world GHG emissions on a pathway to stabilising concentrations at even moderately ambitious levels (e.g. a 550 ppm CO2eq pathway). The extent to which the costs of these declared targets will vary across countries depends inter alia on whether the schemes will be linked, as well as on the extent to which they will allow access to offsets.
2. The need for broad-based international mitigation and incentives for action
14. Future climate policies will need to meet ambitious mitigation objectives at the world level. To this end, a successful international climate policy framework will ultimately have to build a coalition that: i) is potentially environmentally effective (has the technical potential to achieve a given world target even if non-participating countries take no mitigation action) and economically feasible (can meet the target without entailing excessively high carbon prices and mitigation costs); ii) finds it as a whole welfare-enhancing, and indeed optimal, to deliver an emission cut that is sufficient to achieve ambitious global mitigation action ; and, iii) is stable, i.e. provides each participant with a larger gain from staying in rather than leaving the coalition, possibly after financial transfers are made across member countries. All three issues are explored in this section.
2.1. How large do international climate coalitions have to be?
15. In order to identify potentially effective coalitions (PECs) to achieve a given world target, and then to study the incentives for the main emitting regions to join and remain in them, analysis is carried out here using the World Induced Technological Change Hybrid (WITCH) model (Bosetti et al. 2006, 2007, 2009a, 2009b). WITCH has two major strengths in this specific context: i) it belongs to the class of so-called integrated assessment models (IAMs), i.e. it incorporates explicitly the gains from emission reductions in terms of avoided climate change through regional damage functions that capture the GDP impacts of temperature increases; ii) it has a game-theoretic structure, and can, therefore, capture some of the strategic aspects of international relations (see Box 1 and Bosetti et al. 2009b for details). The "business-as-usual" (BAU) scenario assumes that the 12 regions do not co-operate on emission reductions. A coalition is then defined as a PEC if it can technically achieve the target by reducing its own emissions to zero, even if non-participating regions do not act – i.e. their emissions continue along their BAU path. Being a PEC is a necessary but not sufficient condition for the target to be attainable. This is due both to the assumed – and likely – unfeasibility of zero emissions over the foreseeable future,5 and to the carbon
5. Zero emissions do not strictly represent a technical lower bound, however, because negative emissions
could be achieved in principle through afforestation/reforestation.
ECO/WKP(2009)42
18
leakage and “free-riding incentives” such a large abatement effort would generate, raising emissions in non-participating regions above their BAU levels.
16. The illustrative target simulated here is the world emission path that would be consistent with long-run stabilisation of global GHG concentration at 550 ppm CO2eq. Since meeting more stringent targets would require larger coalitions than the PECs identified below, the latter should be seen as minimum coalitions sizes needed to meet any target equal to or below 550 ppm CO2eq. Based on the IPCC’s Fourth Assessment Report (IPCC, 2007), reaching this target implies an approximate 25% cut in world emissions with respect to 2005 levels by 2050, and a 50% cut by 2100.
Box 1. Analysing climate coalitions: theoretical concepts and implementation in the WITCH model
The WITCH model incorporates a detailed representation of the energy sector into an inter-temporal growth model of the economy. The model covers CO2 emissions from fossil fuel combustion, and now includes CO2 emissions from land use, land-use change and forestry, as well as other GHGs. In this version of the model, a carbon price stimulates R&D in two breakthrough (“backstop”) technologies, which tends to lower mitigation costs compared with a version featuring only incremental technological progress (Bosetti et al. 2009a). While the focus of previous OECD work with the WITCH model was on exploring technology-related issues (Burniaux et al. 2008; Bosetti et al. 2009a), the model also has a game-theoretic structure that allows some analysis of the financial incentives for countries to participate and remain in climate coalitions. Concretely, the model can be run under three alternative assumptions:
• In the non-cooperative framework, each of the 12 regions is assumed to set its future emission path today in order to maximise its own welfare (defined as the present value of the logarithm of per capita consumption), taking other regions’ choices as given.1 This results in a Nash equilibrium, which is also the BAU scenario of the WITCH model. In this scenario, little abatement effort is made because each region only takes into account the future damage it will incur when setting its emission path, but not the damage it will cause on others.
• In the co-operative framework, a coalition bringing together some (or possibly all) regions is assumed to set emissions so as to maximise the joint welfare of the coalition, taking into account the damages incurred by the coalition as a whole. This internalisation of the climate externality induces the coalition to set emissions below the non-cooperative BAU level.2 By contrast, regions that do not participate in the coalition are assumed to behave in a non-cooperative manner, i.e. they do not internalise the global climate externality and “free ride” on the mitigation action taken by the coalition.
• In both the non-cooperative and cooperative frameworks, the model is run in cost-benefit mode, meaning that the emission path chosen by each region or coalition only results from welfare maximisation. Therefore the implied world emission path may or may not meet any particular target, such as the 550 ppm CO2eq GHG concentration target considered throughout this section. However, the model can also be run in cost-effective mode, in which case an exogenous target is assumed, and the coalition considered achieves that target at least cost. An international ETS is assumed to be implemented by the coalition, as well as a specific rule for allocating permits across member regions.
The incentives for countries to participate and the stability of climate change mitigation coalitions can best be examined in cost-benefit mode, although some basic insights regarding individual regions’ gains and losses under participation and non-participation can still be derived in cost-effective mode. Previous literature on international environmental agreements in a non-cooperative framework highlights two important properties that a coalition should meet in order to be stable, i.e. to be self-enforcing (See e.g. Carraro et al. 2006; Chander and Tulkens, 2008):
• It should be profitable, i.e. the welfare of the coalition as a whole should be larger than the sum of its members’ welfare in the non-cooperative (BAU) scenario. This condition will typically be met in cost-benefit mode, where coalitions internalise the climate externality in an optimal manner. Therefore it is not discussed further in this section.3
• It should be stable, or at least potentially stable. The coalition is stable if the welfare of each participating region is larger or equal to the welfare it would obtain from withdrawing from the coalition and “free riding” on other participants’ abatement efforts.4 The coalition is potentially stable if it can be turned into a stable coalition through a set of self-financed – i.e. not greater than the coalitions surplus – financial transfers across participating regions.
In this paper, and unlike in previous literature, the stability property is explored only for coalitions that are both potentially effective – i.e. that have the potential to meet a 550 ppm CO2eq GHG concentration target at the 2050 and/or 2100 horizons – and politically relevant – discarding coalitions that exclude some developed countries. For this

ECO/WKP(2009)42
19
subset of coalitions, the analysis examines not only their stability but also whether they find it optimal (in cost-benefit mode) as whole to deliver an emission cut that is sufficient to meet (at least) the illustrative 550 ppm CO2eq target.
________
1. More precisely, WITCH being an optimal growth model, each region sets the future path of key economic variables (saving, investment in alternative energy inputs, investment in R&D and deployment of low-carbon technologies…etc), which in turn results in an emission path and a (shadow) carbon price (see Bosetti et al. 2009b).
2. Coalitions are also assumed to internalise international energy-related R&D spillovers (see Bosetti et al. 2009b).
3. By contrast, the profitability condition may not necessarily be met in cost-effective mode, where the gains from avoided climate change may or may not exceed the abatement costs incurred to meet the imposed emission constraint. For instance, if assigned an emission target that is vastly more stringent than its optimal one, a coalition might not be profitable.
4. Only internal stability is considered here. Stable coalitions should in fact also be externally stable, i.e. non-participating regions should not have an incentive to join in. If they do, only larger coalitions may be both internally and externally stable.
17. The analysis shows that for a world emissions path consistent with a long-run 550 ppm CO2eq global GHG concentration target to be technically feasible, an international framework must imply emission reductions with respect to BAU by virtually all large emitters during the first half of the century. In particular, all PECs include all developed countries and both China and India by 2050, unless all other developing regions (except Africa) reduce their emissions below BAU levels (Table 2.1, Panel A).6 Furthermore, most developing regions would need to take action in any event during the second half of the century, with the possible exception of Africa (Table 2.1, Panel B).
[Table 2.1. Potentially effective coalitions (PECs) to meet a 550 ppm CO2eq GHG concentration target at the 2050 and 2100 horizons]
18. Given that building a PEC is a necessary but not sufficient condition for the target to be attainable, and since more stringent targets (e.g. a 450 ppm CO2eq target) would require larger global cuts than assumed here, in practice most regions of the world – and definitely all large emitters – will have to reduce their emissions below BAU over the coming decades if ambitious climate mitigation objectives are to be met. This is confirmed by analysis of economically feasible coalitions, i.e. of those coalitions under which the WITCH model can actually meet a 550 ppm CO2eq target through a single (coalition-wide) carbon price, without such price – and mitigation costs – becoming excessively high.7 Even though mitigation costs are typically low in this version of the model due to the gradual emergence of new breakthrough technologies over the coming decades (Box 1 and Bosetti et al. 2009a), economically feasible coalitions include all large emitting regions except either China or India (but not both) by 2050, and all world regions except Africa by 2100.
[Table 2.2. Economically feasible coalitions to meet a 550ppm CO2eq GHG concentration target at the 2050 and 2100 horizons]
2.2. Assessing the incentives for countries to join and remain in an international mitigation agreement
19. In order to effectively achieve a given target, a coalition will need not only to be potentially effective and economically feasible, but also to have incentives as a whole to achieve (at least) the target, and to provide each of its member countries with sufficient incentives to join and stay in the coalition. In both cases, incentives will ultimately depend on a wide range of economic and political factors, not all of which can be captured by a simple economic model. Nevertheless, useful insights can still be gained by 6. Coalitions that exclude some developed countries are not considered in the analysis, as they are assumed to
have little political relevance in practice.
7. Excessively large emission cuts over-stretch the limits of the WITCH model – as well as of any model, including the OECD model ENV-Linkages – and imply “explosive” carbon prices and mitigation costs.
ECO/WKP(2009)42
20
focusing on economic incentives, which in the WITCH model include the damages avoided and the abatement costs incurred both within and outside a coalition.
2.2.1 Basic economic drivers of individual country participation incentives
20. Three major drivers of individual country participation incentives are:
• The expected impacts of climate change. As a general rule, developing countries are expected to be more affected in GDP terms than their developed counterparts (Figure 2.1, Panel A; for more detailed analysis, see Nordhaus and Boyer, 2000, and Jamet and Corfee-Morlot, 2009). Within the group of developing countries, Africa appears to be more exposed than South Asia (including India) which, in turn, would be more affected than China. Within the group of developed countries, Western Europe would suffer greater damage than the United States, which in turn would be more vulnerable than the OECD Asia-Pacific countries and Canada. Finally, non-EU Eastern Europe (including Russia) would be least affected by, and might even benefit from climate change under moderate temperature increases over the coming few decades. However, these estimates are dated and may under-estimate the market impacts from climate change (Hanemann, 2009), and even more so the non-market impacts (e.g. on the environment, to a lesser extent on health) and the risk of catastrophic events, which recent literature identifies as major potential contributions to overall damages (IPCC, 2007; Stern, 2007). Therefore, the analysis below considers not only the baseline (“low case”) WITCH damage function, but also a “high-case” scenario where non-market impacts and the risk of catastrophic events are roughly taken into account by doubling climate impacts relative to the low damage case, raising damage estimates to levels closer to (but still below) those featured in Stern (2007) (Figure 2.1, Panel B).
[Figure 2.1. Selected regional and aggregate estimates of the damages from climate change]
• The influence of distant impacts on current policy decisions. Since most of the impacts of climate change are expected to occur in the future, how current governments value them is an important driver of mitigation action incentives.8 Here, two alternative annual discount rate assumptions are used to value the welfare of future generations, namely 0.1 % (low case) and 3% (high case), in line with Stern (2007) and Nordhaus and Boyer (2000), respectively (Bosetti et al. 2009b).
• The costs of mitigation policies. The higher the overall carbon intensity of output, the flatter the aggregate marginal abatement cost curve, the larger the economy’s abatement efforts and – in general – costs under a global carbon tax (or a world ETS with full permit auctioning), and the
8. The consensual framework for performing such valuation is the so-called Ramsey rule, which states that in
an infinite horizon, one good, deterministic optimal growth model, the rate to be used to discount future consumption is: Social discount rate = µ *g + pure utility discount rate, where µ is the elasticity of the marginal utility of income and g is the future trend growth rate of the economy. Therefore the social discount rate depends on two main factors: i) future economic growth, which lowers the incentive of (poorer) current generations to pay the cost of addressing climate change; and, ii) the weight current generations assign to the welfare of future ones, i.e. the so-called pure utility discount rate. The former implies lower incentives for high-growth emerging countries than for their developed counterparts. The latter shapes the incentives of all. There is a longstanding controversy regarding both, in particular the pure utility discount rate (Weitzman, 2001). Consistent with a long line of economists (e.g. Ramsey, 1928; Harrod, 1948; Solow, 1974), Stern (2007) argues on ethical grounds for a near-zero value, while others dismiss this assumption on the grounds that it is inconsistent with actual individual behaviour (e.g. Nordhaus, 2007; Weitzman, 2007a). Therefore here two values are considered, while µ is set equal to 1.
ECO/WKP(2009)42
21
smaller is a region’s incentive to participate in a climate coalition, ceteris paribus. A summary of regional mitigation costs (in consumption level terms) under a range of world carbon tax scenarios in WITCH indicates that developing regions (China, South-East Asia, Africa and, to a somewhat lesser extent, South Asia (including India) and Latin America) incur larger costs than their developed counterparts in the absence of explicit or implicit financial transfers (Figure 2.2; see also Burniaux et al. 2008).9 Economies that are both carbon-intensive and produce fossil fuels (non-EU Eastern Europe (including Russia), the Middle East and North Africa) face the largest costs from broad-based mitigation action.
[Figure 2.2. WITCH model estimates of regional abatement costs under simple world carbon tax scenarios]
2.2.2 Implications for the incentives to participate in a broad international climate coalition
21. Bringing together the incentive effects associated with damages, discounting and abatement costs, model analysis confirms that ambitious mitigation action is economically rational at the world level in the high-damage/low-discounting case, in line with Stern (2007). A fully co-operative, welfare-maximising “grand coalition” of all regions is found to cut world emissions by over 25% by 2050 relative to 2005 levels, and to keep overall GHG concentration below 550 ppm CO2eq by the end of the century (Figure 2.3). Moreover, a number of factors omitted from the analysis could, if factored in, lead the world to undertake larger cuts, such as the damages expected beyond 2100 – assumed not to shape current policymakers’ choices here – the co-benefits from mitigation action and possibly the risk of catastrophic events – which, although taken into account here, may justify stronger mitigation action upfront for insurance motives (Weitzman, 2007a, 2007b). By contrast, leaving aside these factors, all other (smaller) PECs that do not fully internalise the climate externality might not have sufficient incentives to meet the illustrative target. Moreover, even the grand coalition itself might not deliver – i.e. it might not have sufficient incentives to meet the target – if the welfare of future generations is highly discounted (high-discounting case) or non-market climate impacts and risks are not fully taken into account (low-damage case) (Figure 2.4).
[Figure 2.3. Optimal GHG emission and concentration paths in WITCH with and without international co-operation, high-damage/low-discounting case]
[Figure 2.4. Optimal World GHG emission paths in WITCH with international co-operation, for alternative damage and discounting assumptions]
22. At the same time, the analysis shows that “buying-in” all major emitting regions will be challenging. While profitable to its member countries as a whole, the grand coalition is not found to be stable in WITCH in the absence of financial transfers. Compared with a (non-cooperative) BAU scenario, most world regions gain from being in the grand coalition already by 2050 in the high-damage case, and all benefit by 2100 (Figure 2.5). However, all regions are also found to gain less from participating than from staying outside and “free-riding” on the abatement efforts of others. Ceteris paribus, regions with flatter (steeper) marginal abatement cost curves and/or flatter marginal damage curves have larger incentives to free ride, because they contribute more to the coalition’s abatement effort and/or benefit less. This explains why non-EU Eastern Europe (including Russia), the Middle East and China are found to gain more from staying outside a coalition than Western Europe or, to a somewhat lesser extent, the United States, Japan
9. These regional GDP cost estimates exclude the GDP impact of damages, so as to focus only on abatement
costs.
ECO/WKP(2009)42
22
and South East Asia.10 Russia loses from mitigation action both as a carbon-intensive economy and a fossil fuel producer, while benefiting significantly less than most other countries from avoided climate change impacts.
[Figure 2.5. Consumption levels relative to BAU in the WITCH model with and without participation in a world coalition (no international financial transfers, high-damage/low-discounting
case)]
23. One possible way to broaden international support for mitigation action is through financial transfers from regions that gain most from cooperation to those that gain less or might even lose (see e.g. Carraro et al. 2006; Chander and Tulkens, 2007; Finus et al. 2006; Nagashima et al. 2008). A stable international agreement might ultimately be achieved if a set of transfers could be found that would leave all signatory countries better-off participating than not participating. However, even under the favourable high-damage/low-discounting assumptions, no such set of transfers is found here either for the grand coalition or for any smaller PEC (see Bosetti et al. 2009b for details). Thus, whatever the distribution of mitigation costs across countries, building up a self-enforcing international framework covering all main emitters will likely be complex. This is in line with previous research, which in a similar game-theoretic framework typically finds international climate coalitions to be unstable or, when stable, to deliver only limited emission cuts because they are not PECs and/or have insufficient incentives to undertake large abatement efforts in the absence of broader country participation.
24. These results notwithstanding, further model analysis suggests that that if developed countries as a group were prepared to incur a permanent consumption loss from world mitigation action, the prospects for a broad and stable international coalition would vastly improve. For instance, a 3% permanent loss in (the discounted value of) the consumption levels of advanced economies (relative to BAU) is found to be sufficient to yield a stable grand coalition in the high-damage/low-discounting case, That is, all other participating regions can in such case be fully compensated for their free-riding incentives, thereby bringing them into an agreement. In order to be achieved in a cost-effective manner, transfers of such magnitude would have to be made primarily through market mechanisms, essentially via credits generated to meet binding emission reduction commitments across countries (see Section 9).
25. All these findings should be interpreted with caution, the analysis being subject to a number of limitations:
• Even though some sensitivity analysis has been carried out to assess the robustness of the main results, it should be acknowledged that the model-based analysis relies on strong assumptions, (see Bosetti et al. 2009b). In particular, there are wide uncertainties in practice surrounding future emission trends,11 the market and non-market impacts from climate change, the likelihood and effect of catastrophic risks, and the cross-country distribution of these damages and risks. Furthermore, alternative negotiation processes than assumed here could be envisaged in practice, which might yield different results (see Bosetti et al. 2009b). For instance, a major
10. In such framework, non-EU Eastern Europe (including Russia) and the Middle East lose more from being
highly carbon intensive than from being fossil fuel producers, because they can expect the coalition to cut world emissions significantly – and thereby to exert downward pressure on world fossil fuel prices – regardless of whether they participate. However, an option unexplored here is that fossil fuel producers might instead collude and behave strategically, cutting output and raising fuel prices, thereby internalising de facto the carbon price (see Burniaux et al. 2008).
11. For instance, projected world BAU emission growth is somewhat higher in WITCH than in the OECD model ENV-Linkages (100% versus 85% over the period 2005-2050).
ECO/WKP(2009)42
23
emitting country may have greater participation incentives than found here if it expects its withdrawal to prevent the formation of any coalition.
• The co-benefits from mitigation action, e.g. in terms of human health, energy security or biodiversity, are not taken into account. Previous OECD analysis indeed suggests that such co-benefits are large, although the participation incentives they provide are dampened by the fact that some of these co-benefits could be reaped through direct policy action – in particular, local air pollution might be reduced at a lower cost through direct policy action than through reductions in GHG emissions (Bollen et al. 2009; Burniaux et al. 2008). In any case, the co-benefits may well be sufficient to offset eventual losses that advanced economies might be willing to incur in order to bring about a broad and stable coalition of participating countries.
• Removal of fossil fuel subsidies, one of the few policies to yield potentially both climate and economic benefits (see Section 6), is also omitted from the analysis. Insofar as phasing out subsidies would bring an economic gain and lower the carbon intensity of a number of (mainly developing) countries, incentives to participate in international mitigation action could improve.
• The underlying framework only considers immediate, irreversible and self-enforcing participation to mitigation action, thereby abstracting from other possible bargaining options including e.g. delayed participation, renegotiation, sanctions or joint negotiation in multiple areas (e.g. climate and international trade).
26. Given the need to achieve wide country participation to international mitigation action over the next decades, and the difficulty to reach that ultimate goal immediately, less ambitious intermediate arrangements will likely have to be found for the coming years. In order to be successful, however, such arrangements will need to: i) be environmentally viable, i.e. to effectively start reducing world emissions, and to allow scaling up over time so that ambitious climate change mitigation targets can be met; ii) abate emissions at least cost, both as a stand-alone objective and as a pre-condition for the adoption of increasingly stringent emission targets by participating countries; and, iii) include explicit or implicit international financial transfer mechanisms, in order to increase the likelihood that broader and increasingly ambitious country participation to international mitigation action is effectively achieved over time. Against this background, the rest of this paper proceeds in two main steps. The next sections analyse the various possible policy tools that contribute to a successful intermediate international climate policy framework for the coming years, including linking existing and/or future ETS, scaling up crediting mechanisms, implementing sectoral approaches, bringing forestry into an international climate policy framework and removing harmful energy subsidies. A final section examines available international transfer devices to effectively broaden participation to mitigation action, including the allocation of emission reduction commitments across countries, as well as financing arrangements in the areas of R&D, technology transfers and adaptation to climate change.
3. Removing environmentally-harmful energy subsidies12
27. There are currently large subsidies to the consumption of fossil fuels in many non-OECD countries. These subsidies contribute to keeping fossil fuel consumption, and hence GHGs emissions, at
12. This section focuses on subsidies affecting the demand for fossil fuels – including indirectly through
electricity subsidies – in non-OECD countries only. Though subsidizing energy production and consumption in OECD countries exists under indirect and often not transparent forms (the analysis of which is beyond the scope of this section), direct subsidies to fossil fuel consumptions in OECD countries are small in comparison to non-OECD countries. Subsidies targeted to renewable energy sources in OECD countries are not covered.

ECO/WKP(2009)42
24
high levels. Furthermore, to the extent that they imply some decoupling of domestic energy prices relative to world prices, they prevent price signals sent through world energy markets to pass through into domestic markets. Removing these subsidies represents an obvious initial step in pricing carbon worldwide. In addition to environmental benefits, it would yield economic gains resulting from a more efficient allocation of resources in countries which remove these subsidies, hence having the potential of being one of the few “no regret” options for contributing to climate stabilisation. This section assesses these potential environmental and economic benefits using the OECD model ENV-Linkages, based on a dataset assembled and provided by the IEA for this project.
28. Very few studies have attempted to quantify the impact of removing these subsidies in non-OECD countries, and none of them are recent. In its 1999 World Energy Outlook, the IEA provides partial equilibrium estimates of the impact of removing energy subsidies in eight non-OECD countries (IEA, 1999). On average, for this sample of countries CO2 emissions are estimated to fall by 16%, translating into a reduction of 5% in world emissions. Corresponding gains accruing to these countries amount to 0.7% of their GDP on average, reaching approximately 2% in some cases. Using a general equilibrium approach, OECD (1999) finds that removing energy subsidies in Annex I countries reduces the costs of achieving the Kyoto Protocol, albeit only by a modest amount. Taken together, Annex I countries would benefit from such subsidy cuts, and the efficiency gains achieved in those that remove their subsidies (Russia and Eastern European countries) benefit the others (mainly the United States and the EU), as they are entirely “exported” through the simulated Annex I-wide ETS.
29. Energy subsidies take many different forms, some of which are not transparent. They involve both direct and indirect subsidies, with the latter being more difficult to measure. Some subsidies aim at increasing fossil fuel consumption while others have as an objective to support domestic production. A common way to subsidise energy consumption is through exempting some energy consumptions from normal taxation (IEA, 1999). While each of these forms of subsidies should ideally be modelled explicitly in order to quantify their impact, it was not possible to adopt such approach in the following analysis. Instead, it is assumed that different forms of subsidies result in a lower domestic energy price relative to a reference price. It is then assumed that removing subsidies should in principle eliminate this price gap, given that the energy goods considered are relatively homogenous. Accordingly, various forms of subsidies are summarised by a single statistic, namely the observed price gap, possibly differentiated across different types of end-use consumers (households, power generation, manufactures and services). Although this approach has a number of well-known limitations13 it is the only one that can be applied, given the information currently available on these subsidies in non-OECD countries.
30. The IEA has estimated price gaps corresponding to energy subsidies for 2005 and 2007 in 20 non-OECD countries and accounting for about 40% of world energy consumption. These gaps are estimated after adjustments are made to take into account market exchange rates, transportation margins and domestic taxes (including VAT). For fossil fuels, the reference price is the corresponding international price. As electricity is little traded, the reference price corresponds to an estimation of the production cost in the country considered (expressed in local currency).
13. In particular, the estimated wedge may reflect other market imperfections than subsidies, such as
differences in quality or uses, imperfectly competitive behaviour or a lack of representativeness of the chosen reference price. Although this approach treats all subsidies as if they were consumer subsidies, removing a producer subsidy will have, in practice, a different impact from removing a consumer subsidy, even if both types of subsidies ultimately contribute to lower the price and increase the consumption of the corresponding energy source. See IEA (1999) for a discussion of the pros and cons of the “price gap” approach.

ECO/WKP(2009)42
25
31. Table 3.1 reports the price wedges estimated for 2007 by energy sources and for the countries/regions of the current version of the OECD ENV-Linkages model. To the extent that the pass-through of international energy prices on domestic markets is incomplete,14 these wedges are likely to have changed following the 2008 oil price spike and then again when oil prices fell. The first column shows the average wedges for all demands that are effectively subsidized in each country/region, thereby illustrating the magnitude of the wedges. The second column reports the average wedge across all demands, so that the gap between both columns reflects the coverage of the subsidies across demands. Countries not covered in the IEA database are included in regional aggregates (for instance, the Rest of the World region) by assuming zero wedges. This assumption is fairly conservative as it is likely that some of these countries also subsidize part of their energy consumption. The energy wedges differ across energy sources and countries/regions. Energy tends to be subsidised more heavily in Russia (especially for natural gas), India and non-EU Eastern European countries. By contrast, the subsidy rates estimated by the IEA for China are rather moderate. The subsidy rates in the Middle East and Rest of the World regional aggregates appear to be relatively low, but they are understated due to the incomplete country coverage of IEA estimates.
[Table 3.1. Energy price gaps in non-OECD countries]
32. Table 3.2 shows the impact on GHG emissions of removing existing energy subsidies gradually in non-OECD countries during the period 2013 to 2020, in the absence of any other mitigation action.15 The resulting drop of emissions of CO2 from fossil fuels combustion is quite substantial in some countries/regions, amounting to around 40% or more in non-EU Eastern European countries, Russia and the Middle East. While CO2 emissions from fossil fuels combustion fall by 20% in non-Annex I countries in 2050, they remain almost unchanged in Annex I countries. This is because reductions in Russia and non-EU Eastern European countries are offset by increases in those Annex I countries that do not subsidise their energy demand, reflecting leakages induced by falling world energy prices. Of the 7.7 GtCO2 emission reduction achieved by removing energy subsidies in non-OECD countries in 2050 (corresponding to a reduction of their emissions by 22%), around one-fifth is offset by an increase of emissions in OECD countries. As a result, world CO2 emissions are reduced by 13% in 2050, and total GHG emissions by 10%.16 With binding emission caps in OECD countries, carbon leakages would be contained, and the environmental benefits from subsidy removal would be larger.
[Table 3.2. Impact of multilateral removal of energy subsidies in non-OECD countries on GHG emissions]
33. Table 3.3 illustrates the magnitude of the efficiency gains achieved if each non-OECD country/region removes its energy subsidies unilaterally.17 All countries/regions (with the exception of 14. This is the case for instance when energy prices are set administratively.
15. This analysis assumes that the subsidy wedges remain constant in the BAU scenario. Alternatively, assuming some decoupling of domestic energy prices relative to world energy prices would lead to an increase in subsidy wedges over time, given the projected rise in world energy prices in the BAU scenario. The impact of subsidy removal on emissions would therefore be larger under that alternative assumption.
16. These reductions are comparable with those reported in IEA (1999), taking into account that the sample of countries for which subsidy data have been collected here covers a much larger share of world energy demand.
17 It is often argued that subsidies are justified on equity grounds, for instance, to alleviate poverty. In this simulation, the budgetary saving obtained from the subsidy removal is entirely refunded to households in a lump-sum (non-distorting) way. This implies that subsidies to the consumption of fossil fuel are replaced by a direct and larger transfer to households. Alternatively, this transfer could be used to reduce other distorting taxes, which would increase the real income gain from subsidy removal, or to reduce poverty in a more targeted and efficient way than through a uniform subsidy to fossil fuel consumption.
ECO/WKP(2009)42
26
non-EU Eastern European countries18) report real income gains ranging from 0.1% in Brazil to over 2% in India and Russia in 2050. However, these gains would differ in the case of a multilateral – as opposed to unilateral – removal of energy subsidies in all non-OECD countries together (Table 3.4). In such a scenario, some of the non-OECD countries that remove their subsidies would no longer enjoy real income gains, such as Russia, the Middle East and non-EU Eastern European countries. This is because the efficiency gains from improved resource allocation would be more than offset by the terms-of-trade losses associated with the sharp fall in world energy prices that a multilateral removal of subsidies would induce. Energy-importing OECD countries, not least the EU and Japan, would enjoy significant terms-of-trade and income gains. Overall, GDP and real income gains at the world level would be small, amounting to just 0.1% relative to BAU. This primarily reflects the fact that demand for energy goods is little sensitive to price, so that the distortive impact of energy subsidies and the gain from their removal are limited.19
[Table 3.3. Impact of unilateral removal of energy subsidies in non-OECD countries on CO2 emissions, GDP and real income]
[Table 3.4. GDP and income impacts of a multilateral removal of energy subsidies in non-OECD countries]
34. A post-2012 agreement might involve the removal of energy subsidies in Annex I countries. The cost savings associated with such an Annex I mitigation action are estimated to be small, in line with the results reported in OECD (1999). Table 3.5 reports the estimated economic costs of Annex I countries cutting their emissions by 20% and 50% by 2020 and 2050 respectively (relative to 1990 levels), with and without a removal of their energy subsidies. Overall, the cost savings are concentrated in Russia and the EU, reflecting some efficiency gains and a terms-of-trade improvement, respectively.
[Table 3.5. Impact of removal of energy subsidies in Annex I countries only on their mitigation costs]
35. Table 3.6 shows the impact of removing energy subsidies in the context of a world carbon tax policy to stabilise overall GHG concentration below 550 ppm CO2 eq. The emission pathway to achieve this stabilisation scenario is the same as the “550 ppm-base” pathway in previous OECD analysis (Burniaux et al. 2008), although the specification of the model used here is somewhat different (see Box 2). In this scenario, emission reductions are phased in very gradually, implying very small economic costs by 2020. Assuming that energy subsidies are kept in place, this stabilisation effort is estimated to reduce world GDP by 3.4% in 2050, compared with a BAU scenario. The removal of energy subsidies generates a slight GDP gain and reduces emissions, making the stabilisation target easier to achieve. As a result, the world GDP loss from mitigation action is reduced from 3.4% to 3.2% in 2050 when energy subsidies are removed. India and, to a lesser extent, China and OECD countries benefit from the removal, while mitigation costs increase in energy-exporting countries. Cost savings at the world level are relatively small for two reasons. First and foremost, as noted above the economic distortion from energy subsidies is limited. Second, their presence implies that pricing carbon reduces the distortion in resource allocation
18. This regional aggregate consists of very heterogeneous economies (Armenia, Azerbaijan, Belarus, Croatia,
Georgia, Kazakhstan, Kyrgyzstan, Moldova, Tajikistan, Turkmenistan, Ukraine, Uzbekistan), where the removal of the subsidies induces a dramatic shift in the economic structure towards low-productivity sectors. The resulting overall productivity loss more than offsets the welfare gains from the subsidy removal.
19. An additional explanation for the small magnitude of world real income gains is that the fall in world fossil fuel prices induces producers to reduce their supply, leaving more of their reserves in the ground. This leads to a GDP loss, ceteris paribus.
ECO/WKP(2009)42
27
induced by the subsidies, generating a (so-called “second-best”) GDP gain (see Box 2). This gain is lost when subsidies are removed.
[Table 3.6. Impact of multilateral removal of energy subsidies on global mitigation costs (550 ppm GHG concentration stabilisation scenario)]
Box 2. Improving the specification of the electricity sector in ENV-linkages
Compared with previous OECD work (Burniaux et al. 2008), the specification of the ENV-Linkages model has been modified by disaggregating the electricity sector. This allows for explicit (rather than implicit) substitution across five different ways of producing electricity: fossil fuels, nuclear, wind, solar and hydroelectric. As the products delivered by these alternative technologies are almost perfect substitutes, this change implies a higher degree of substitution between fossil fuels and capital.
The resulting increase in flexibility tends to deliver slightly lower estimates of the cost of meeting any given emission target (Table 3.7). In previous OECD work (Burniaux et al. 2008), stabilising overall GHG concentration below 550 ppm CO2eq following the “550 ppm-base” emission pathway implied a 4.8% world GDP loss relative to BAU in 2050. Running the same simulation with the improved model specification lowers this cost to 3.8%. Table 3.6 reports a somewhat lower world GDP cost estimate of 3.4% because it incorporates energy subsidies explicitly in the BAU scenario. Indeed, in a second-best environment, reducing the share of a sector subject to large distortions generate welfare gains. As a result, the world GDP loss is 0.4% lower in a scenario where GHG concentration is stabilised below 550 ppm without removing energy subsidies than in the same scenario where energy subsidies are not explicitly incorporated.1 Finally, a removal of world energy subsidies lowers global mitigation costs from 3.4% to 3.2% in 2050
[Table 3.7. Global GDP cost ofa 550 ppm CO2eq concentration stabilisation scenario in adifferent versions of ENV-Linkages and for alternative assumptions regarding energy subsidies]
________
1. In Burniaux et al. (2008), distortions affecting the energy sectors were those reported in the 2001 GTAP database and implied much smaller (or even positive) price gaps relative to reference prices in the non-OECD countries.
36. In conclusion, the removal of existing energy subsidies in non-OECD countries would contribute to reduce world emissions. Part (almost one-fifth) of the environmental benefit of this reform would be lost unless emissions are under a cap in OECD countries. As theory suggests, removal of these subsidies would generate real income gains in the countries where this reform is applied, as well as in OECD countries. As a result, incorporating the removal of energy subsidies into a global mitigation action reduces the economic costs of this action.
4. Building a global carbon market gradually by linking emission trading schemes
37. Among the range of policy instruments needed to abate world emissions at least cost, previous OECD work emphasised the importance of broad-based, homogenous international carbon pricing across countries, sectors and gases (Burniaux et al. 2008). In practice, with the emergence of domestic/regional ETSs internationally and discussions around CDM reform gaining prominence, a global carbon market may de facto gradually build up through: i) direct linking across domestic/regional ETSs; ii) indirect linking via a crediting mechanism, such as a scaled up CDM; and, iii) sectoral approaches. Direct linking occurs if the tradable permit system’s authority allows regulated entities to use emission allowances from another ETS in order to meet their domestic compliance obligations. Direct linking can be “two ways” if there is a mutual recognition of allowances, or “one way” if one system recognises the other system’s allowances but the other does not reciprocate. “Indirect” linking via common use of offsets, such as through the CDM, could also occur (see Section 5).
38. Several domestic/regional ETSs are already in place or emerging, but at present there are virtually no direct links. There is significant heterogeneity across these schemes, including in terms of
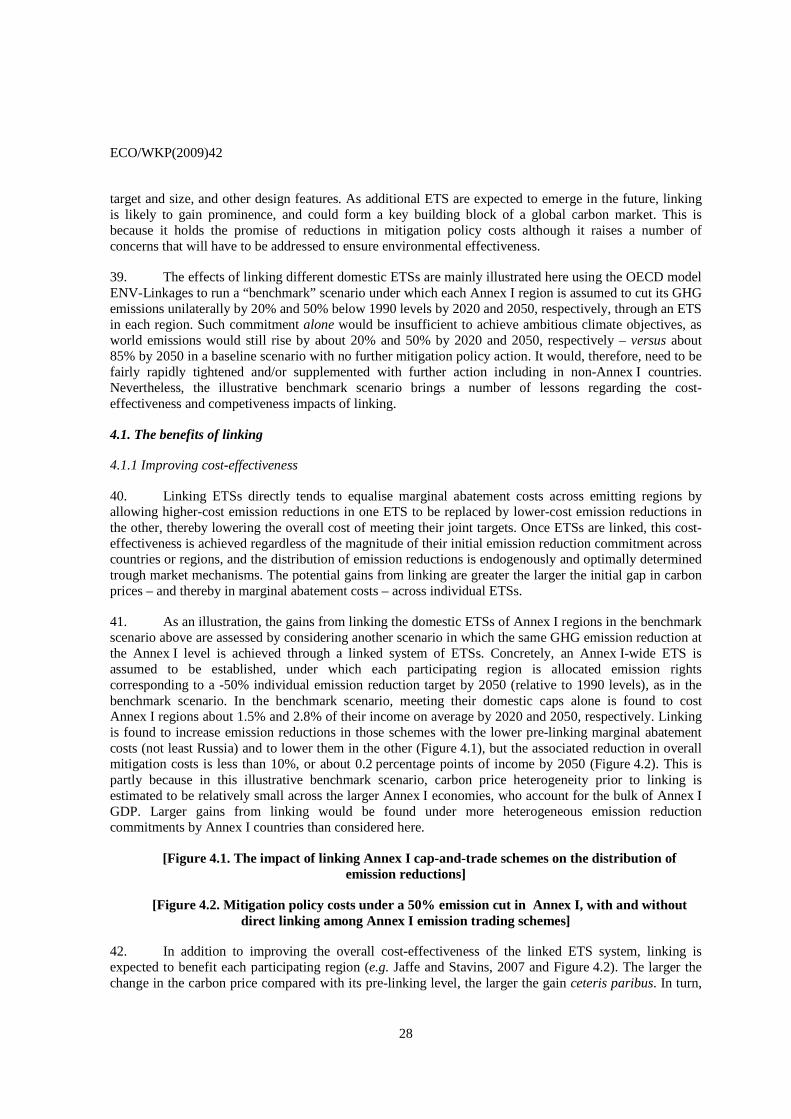
ECO/WKP(2009)42
28
target and size, and other design features. As additional ETS are expected to emerge in the future, linking is likely to gain prominence, and could form a key building block of a global carbon market. This is because it holds the promise of reductions in mitigation policy costs although it raises a number of concerns that will have to be addressed to ensure environmental effectiveness.
39. The effects of linking different domestic ETSs are mainly illustrated here using the OECD model ENV-Linkages to run a “benchmark” scenario under which each Annex I region is assumed to cut its GHG emissions unilaterally by 20% and 50% below 1990 levels by 2020 and 2050, respectively, through an ETS in each region. Such commitment alone would be insufficient to achieve ambitious climate objectives, as world emissions would still rise by about 20% and 50% by 2020 and 2050, respectively – versus about 85% by 2050 in a baseline scenario with no further mitigation policy action. It would, therefore, need to be fairly rapidly tightened and/or supplemented with further action including in non-Annex I countries. Nevertheless, the illustrative benchmark scenario brings a number of lessons regarding the cost-effectiveness and competiveness impacts of linking.
4.1. The benefits of linking
4.1.1 Improving cost-effectiveness
40. Linking ETSs directly tends to equalise marginal abatement costs across emitting regions by allowing higher-cost emission reductions in one ETS to be replaced by lower-cost emission reductions in the other, thereby lowering the overall cost of meeting their joint targets. Once ETSs are linked, this cost-effectiveness is achieved regardless of the magnitude of their initial emission reduction commitment across countries or regions, and the distribution of emission reductions is endogenously and optimally determined trough market mechanisms. The potential gains from linking are greater the larger the initial gap in carbon prices – and thereby in marginal abatement costs – across individual ETSs.
41. As an illustration, the gains from linking the domestic ETSs of Annex I regions in the benchmark scenario above are assessed by considering another scenario in which the same GHG emission reduction at the Annex I level is achieved through a linked system of ETSs. Concretely, an Annex I-wide ETS is assumed to be established, under which each participating region is allocated emission rights corresponding to a -50% individual emission reduction target by 2050 (relative to 1990 levels), as in the benchmark scenario. In the benchmark scenario, meeting their domestic caps alone is found to cost Annex I regions about 1.5% and 2.8% of their income on average by 2020 and 2050, respectively. Linking is found to increase emission reductions in those schemes with the lower pre-linking marginal abatement costs (not least Russia) and to lower them in the other (Figure 4.1), but the associated reduction in overall mitigation costs is less than 10%, or about 0.2 percentage points of income by 2050 (Figure 4.2). This is partly because in this illustrative benchmark scenario, carbon price heterogeneity prior to linking is estimated to be relatively small across the larger Annex I economies, who account for the bulk of Annex I GDP. Larger gains from linking would be found under more heterogeneous emission reduction commitments by Annex I countries than considered here.
[Figure 4.1. The impact of linking Annex I cap-and-trade schemes on the distribution of emission reductions]
[Figure 4.2. Mitigation policy costs under a 50% emission cut in Annex I, with and without direct linking among Annex I emission trading schemes]
42. In addition to improving the overall cost-effectiveness of the linked ETS system, linking is expected to benefit each participating region (e.g. Jaffe and Stavins, 2007 and Figure 4.2). The larger the change in the carbon price compared with its pre-linking level, the larger the gain ceteris paribus. In turn,
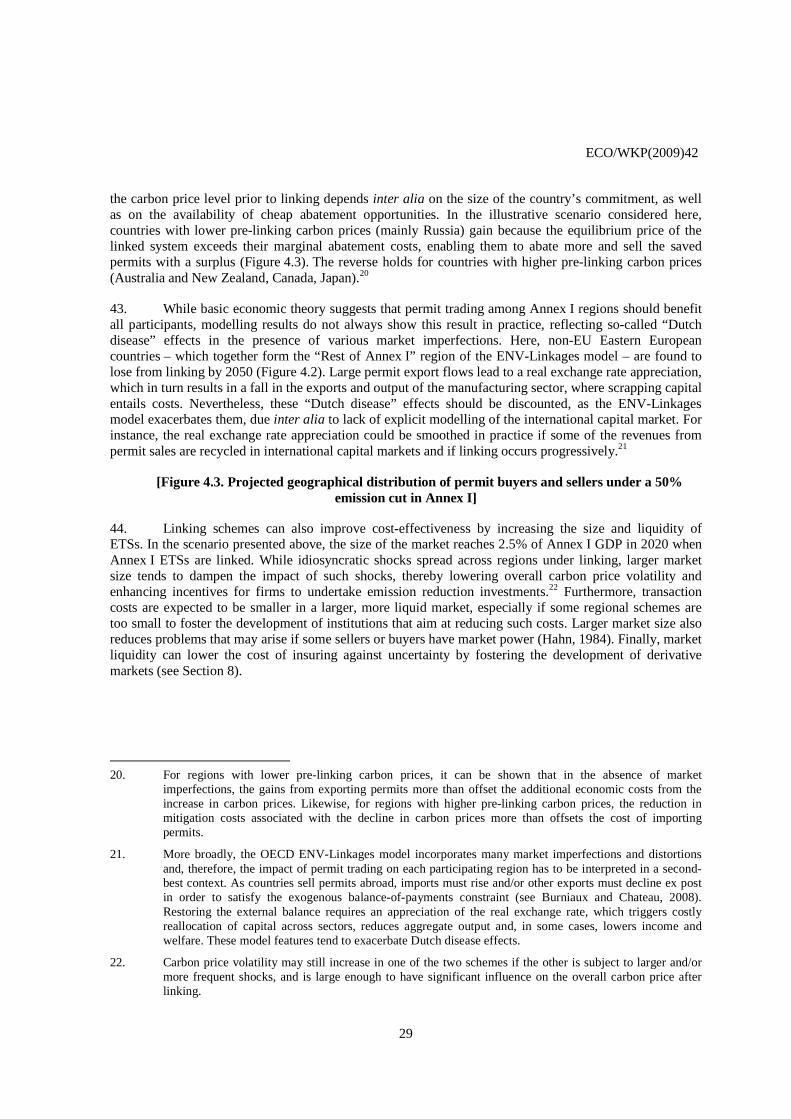
ECO/WKP(2009)42
29
the carbon price level prior to linking depends inter alia on the size of the country’s commitment, as well as on the availability of cheap abatement opportunities. In the illustrative scenario considered here, countries with lower pre-linking carbon prices (mainly Russia) gain because the equilibrium price of the linked system exceeds their marginal abatement costs, enabling them to abate more and sell the saved permits with a surplus (Figure 4.3). The reverse holds for countries with higher pre-linking carbon prices (Australia and New Zealand, Canada, Japan).20
43. While basic economic theory suggests that permit trading among Annex I regions should benefit all participants, modelling results do not always show this result in practice, reflecting so-called “Dutch disease” effects in the presence of various market imperfections. Here, non-EU Eastern European countries – which together form the “Rest of Annex I” region of the ENV-Linkages model – are found to lose from linking by 2050 (Figure 4.2). Large permit export flows lead to a real exchange rate appreciation, which in turn results in a fall in the exports and output of the manufacturing sector, where scrapping capital entails costs. Nevertheless, these “Dutch disease” effects should be discounted, as the ENV-Linkages model exacerbates them, due inter alia to lack of explicit modelling of the international capital market. For instance, the real exchange rate appreciation could be smoothed in practice if some of the revenues from permit sales are recycled in international capital markets and if linking occurs progressively.21
[Figure 4.3. Projected geographical distribution of permit buyers and sellers under a 50% emission cut in Annex I]
44. Linking schemes can also improve cost-effectiveness by increasing the size and liquidity of ETSs. In the scenario presented above, the size of the market reaches 2.5% of Annex I GDP in 2020 when Annex I ETSs are linked. While idiosyncratic shocks spread across regions under linking, larger market size tends to dampen the impact of such shocks, thereby lowering overall carbon price volatility and enhancing incentives for firms to undertake emission reduction investments.22 Furthermore, transaction costs are expected to be smaller in a larger, more liquid market, especially if some regional schemes are too small to foster the development of institutions that aim at reducing such costs. Larger market size also reduces problems that may arise if some sellers or buyers have market power (Hahn, 1984). Finally, market liquidity can lower the cost of insuring against uncertainty by fostering the development of derivative markets (see Section 8).
20. For regions with lower pre-linking carbon prices, it can be shown that in the absence of market
imperfections, the gains from exporting permits more than offset the additional economic costs from the increase in carbon prices. Likewise, for regions with higher pre-linking carbon prices, the reduction in mitigation costs associated with the decline in carbon prices more than offsets the cost of importing permits.
21. More broadly, the OECD ENV-Linkages model incorporates many market imperfections and distortions and, therefore, the impact of permit trading on each participating region has to be interpreted in a second-best context. As countries sell permits abroad, imports must rise and/or other exports must decline ex post in order to satisfy the exogenous balance-of-payments constraint (see Burniaux and Chateau, 2008). Restoring the external balance requires an appreciation of the real exchange rate, which triggers costly reallocation of capital across sectors, reduces aggregate output and, in some cases, lowers income and welfare. These model features tend to exacerbate Dutch disease effects.
22. Carbon price volatility may still increase in one of the two schemes if the other is subject to larger and/or more frequent shocks, and is large enough to have significant influence on the overall carbon price after linking.
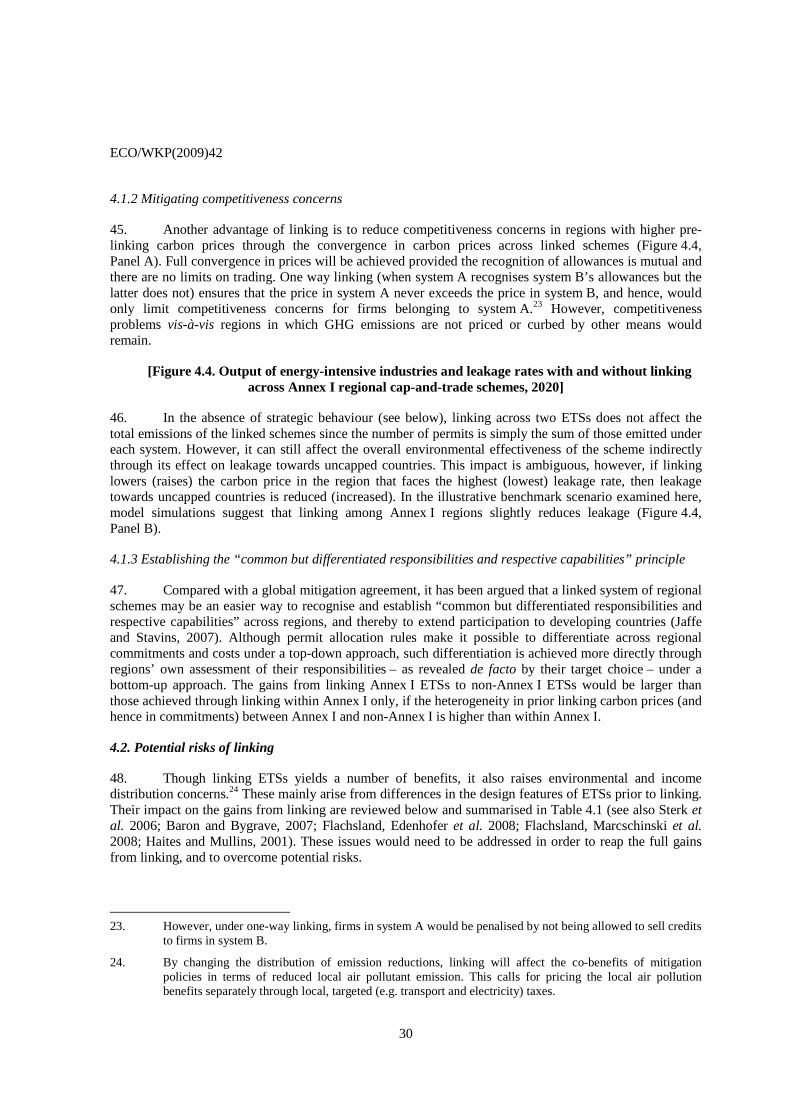
ECO/WKP(2009)42
30
4.1.2 Mitigating competitiveness concerns
45. Another advantage of linking is to reduce competitiveness concerns in regions with higher pre-linking carbon prices through the convergence in carbon prices across linked schemes (Figure 4.4, Panel A). Full convergence in prices will be achieved provided the recognition of allowances is mutual and there are no limits on trading. One way linking (when system A recognises system B’s allowances but the latter does not) ensures that the price in system A never exceeds the price in system B, and hence, would only limit competitiveness concerns for firms belonging to system A.23 However, competitiveness problems vis-à-vis regions in which GHG emissions are not priced or curbed by other means would remain.
[Figure 4.4. Output of energy-intensive industries and leakage rates with and without linking across Annex I regional cap-and-trade schemes, 2020]
46. In the absence of strategic behaviour (see below), linking across two ETSs does not affect the total emissions of the linked schemes since the number of permits is simply the sum of those emitted under each system. However, it can still affect the overall environmental effectiveness of the scheme indirectly through its effect on leakage towards uncapped countries. This impact is ambiguous, however, if linking lowers (raises) the carbon price in the region that faces the highest (lowest) leakage rate, then leakage towards uncapped countries is reduced (increased). In the illustrative benchmark scenario examined here, model simulations suggest that linking among Annex I regions slightly reduces leakage (Figure 4.4, Panel B).
4.1.3 Establishing the “common but differentiated responsibilities and respective capabilities” principle
47. Compared with a global mitigation agreement, it has been argued that a linked system of regional schemes may be an easier way to recognise and establish “common but differentiated responsibilities and respective capabilities” across regions, and thereby to extend participation to developing countries (Jaffe and Stavins, 2007). Although permit allocation rules make it possible to differentiate across regional commitments and costs under a top-down approach, such differentiation is achieved more directly through regions’ own assessment of their responsibilities – as revealed de facto by their target choice – under a bottom-up approach. The gains from linking Annex I ETSs to non-Annex I ETSs would be larger than those achieved through linking within Annex I only, if the heterogeneity in prior linking carbon prices (and hence in commitments) between Annex I and non-Annex I is higher than within Annex I.
4.2. Potential risks of linking
48. Though linking ETSs yields a number of benefits, it also raises environmental and income distribution concerns.24 These mainly arise from differences in the design features of ETSs prior to linking. Their impact on the gains from linking are reviewed below and summarised in Table 4.1 (see also Sterk et al. 2006; Baron and Bygrave, 2007; Flachsland, Edenhofer et al. 2008; Flachsland, Marcschinski et al. 2008; Haites and Mullins, 2001). These issues would need to be addressed in order to reap the full gains from linking, and to overcome potential risks.
23. However, under one-way linking, firms in system A would be penalised by not being allowed to sell credits
to firms in system B.
24. By changing the distribution of emission reductions, linking will affect the co-benefits of mitigation policies in terms of reduced local air pollutant emission. This calls for pricing the local air pollution benefits separately through local, targeted (e.g. transport and electricity) taxes.
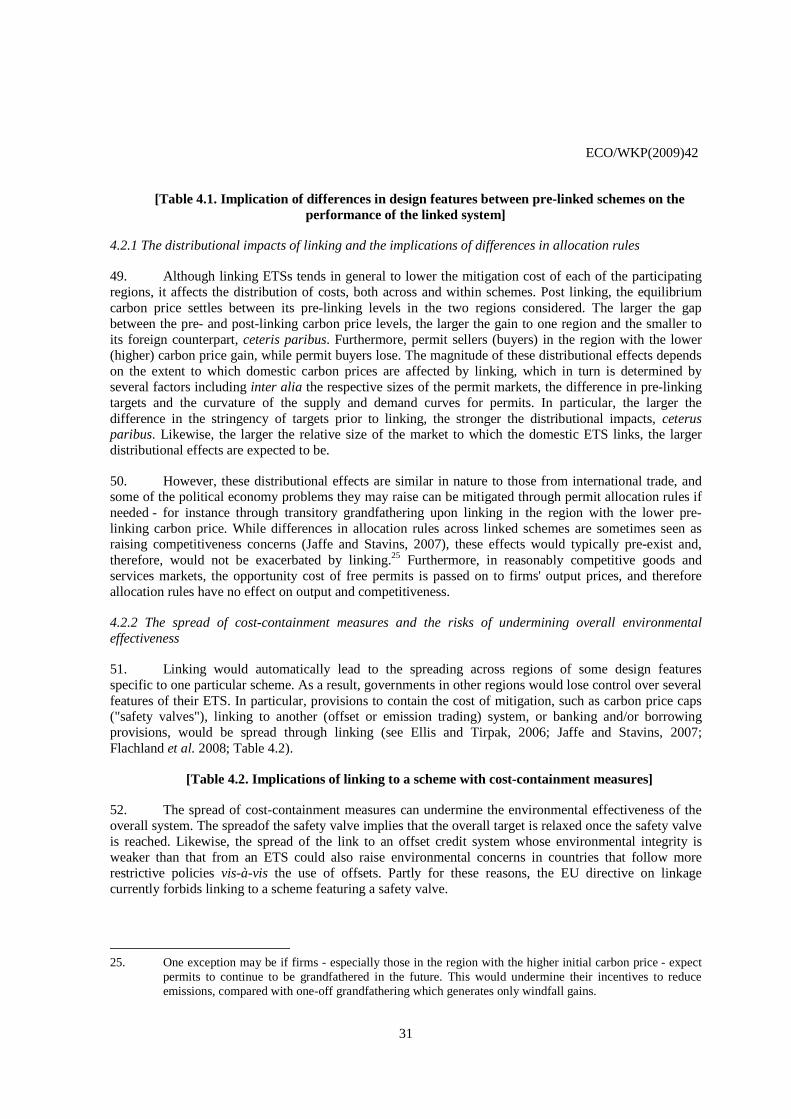
ECO/WKP(2009)42
31
[Table 4.1. Implication of differences in design features between pre-linked schemes on the performance of the linked system]
4.2.1 The distributional impacts of linking and the implications of differences in allocation rules
49. Although linking ETSs tends in general to lower the mitigation cost of each of the participating regions, it affects the distribution of costs, both across and within schemes. Post linking, the equilibrium carbon price settles between its pre-linking levels in the two regions considered. The larger the gap between the pre- and post-linking carbon price levels, the larger the gain to one region and the smaller to its foreign counterpart, ceteris paribus. Furthermore, permit sellers (buyers) in the region with the lower (higher) carbon price gain, while permit buyers lose. The magnitude of these distributional effects depends on the extent to which domestic carbon prices are affected by linking, which in turn is determined by several factors including inter alia the respective sizes of the permit markets, the difference in pre-linking targets and the curvature of the supply and demand curves for permits. In particular, the larger the difference in the stringency of targets prior to linking, the stronger the distributional impacts, ceterus paribus. Likewise, the larger the relative size of the market to which the domestic ETS links, the larger distributional effects are expected to be.
50. However, these distributional effects are similar in nature to those from international trade, and some of the political economy problems they may raise can be mitigated through permit allocation rules if needed - for instance through transitory grandfathering upon linking in the region with the lower pre-linking carbon price. While differences in allocation rules across linked schemes are sometimes seen as raising competitiveness concerns (Jaffe and Stavins, 2007), these effects would typically pre-exist and, therefore, would not be exacerbated by linking.25 Furthermore, in reasonably competitive goods and services markets, the opportunity cost of free permits is passed on to firms' output prices, and therefore allocation rules have no effect on output and competitiveness.
4.2.2 The spread of cost-containment measures and the risks of undermining overall environmental effectiveness
51. Linking would automatically lead to the spreading across regions of some design features specific to one particular scheme. As a result, governments in other regions would lose control over several features of their ETS. In particular, provisions to contain the cost of mitigation, such as carbon price caps ("safety valves"), linking to another (offset or emission trading) system, or banking and/or borrowing provisions, would be spread through linking (see Ellis and Tirpak, 2006; Jaffe and Stavins, 2007; Flachland et al. 2008; Table 4.2).
[Table 4.2. Implications of linking to a scheme with cost-containment measures]
52. The spread of cost-containment measures can undermine the environmental effectiveness of the overall system. The spreadof the safety valve implies that the overall target is relaxed once the safety valve is reached. Likewise, the spread of the link to an offset credit system whose environmental integrity is weaker than that from an ETS could also raise environmental concerns in countries that follow more restrictive policies vis-à-vis the use of offsets. Partly for these reasons, the EU directive on linkage currently forbids linking to a scheme featuring a safety valve.
25. One exception may be if firms - especially those in the region with the higher initial carbon price - expect
permits to continue to be grandfathered in the future. This would undermine their incentives to reduce emissions, compared with one-off grandfathering which generates only windfall gains.
ECO/WKP(2009)42
32
4.2.3 Creating a link between an ETS and a carbon tax
53. To some extent, similar concerns would be raised by creating a link between a domestic ETS price and a foreign carbon tax by allowing domestic firms to pay the foreign carbon tax rather than purchase a domestic permit. This would de facto introduce a safety valve equal to the foreign carbon tax, or even imply switching to the foreign carbon tax if the latter is lower than the domestic permit price.26 The region with the carbon tax might find it easier to allow firms to switch from the carbon tax to ETS permits, although fiscal revenues would be lost insofar as firms that buy (cheaper) foreign permits are exempted from the tax. Under this one-way linking, the region with the carbon tax would gain insofar as its tax is higher than the foreign permit price. The region with the ETS would benefit from permit sales to foreign firms, which would more than offset the higher mitigation costs arising from the rise in permit prices towards the foreign carbon tax level.
54. One-way link between a carbon tax system and an ETS could also emerge if a government that took on binding commitments to set a carbon tax, and to buy (be granted and sell) permits at the end of the compliance period if emissions turned out to be lower (higher) than its commitment. Such a link would benefit each participant and enhance the cost effectiveness of the global system. In theory, the overall gain would be maximised if the carbon tax were set at the level that would prevail if the country had instead opted for an ETS, and linked it to the foreign ETS. This would mimic full linking of two ETSs, but may have little practical feasibility and relevance.
4.2.4 Linking level and intensity target schemes
55. Another way to contain costs is to adopt "intensity targets" (as opposed to absolute targets), which are expressed in terms of emissions per unit of output. Such targets may be seen as an insurance policy against the risk of high costs in case of higher-than-expected GDP growth. The impact of linking an ETS with intensity targets to an ETS with absolute targets depends on permit allocation rules (Box 3). If the cap on emissions in the system with the intensity target is set ex ante on the basis of projected GDP growth, then that scheme is de facto equivalent to an ETS with an absolute cap, and linking does not affect overall emissions.27 By contrast, if the permit authority of the intensity target scheme regularly adjusts the supply of permits in order to meet its intensity target, overall emissions will fluctuate. Within a linked system, such adjustments need to be more frequent and larger than within an independent one because emissions from any particular region are determined endogenously by market forces, and depend on all shocks to the system – including those specific to other regions (e.g. a cold winter in a large participating region). Furthermore, the impact of permit supply adjustments on domestic emission intensity will depend in part on the extent to which some of the newly emitted permits are bought by foreign firms.
56. Permit supply adjustments by one region to meet its intensity target would increase carbon price stability within the linked system, at the cost of greater uncertainty about overall emissions. Overall environmental performance does not have to be undermined if emissions merely fluctuate around the level that would prevail under absolute caps, but it could be affected if positive growth shocks prevail, or if intensity targets create an incentive to increase production and emissions in order to obtain additional credits. One way to ensure the predictability of total emissions within a linked system would be for participating regions with absolute targets to agree to adjust their caps so as to offset changes in the supply
26. It should be noted that under a system that combines a carbon tax and an ETS, regardless of whether
systems are linked or not, the overall amount of emissions is not fixed, unless the cap of the ETS and/or the carbon tax are adjusted in order to achieve a given joint target.
27. Linking may still increase emissions if the cap is set on the basis of a strongly overestimated GDP and turns not to be binding ex post, as extra permits could then be sold to other schemes upon linking. This problem is a “hot air” issue (see below).

ECO/WKP(2009)42
33
of allowances from regions with intensity targets. Under such an arrangement, the latter regions would in effect transfer some of the risk of unexpected changes in their mitigation costs to the former regions, which would lose the carbon price stabilisation gains from linking to an intensity target scheme.

ECO/WKP(2009)42
34
Box 3. Intensity targets and their implications for linking
Why intensity targets?
Uncertainty about future economic growth can be an obstacle in adopting emission caps because it translates into greater uncertainty about compliance costs. Intensity targets, under which permit allocations would be linked to future GDP, and would automatically adjust to unexpected growth shocks, have been proposed to reduce carbon price and mitigation cost uncertainty (Marcu and Pizer, 2002; Kolstad, 2006; Gupta et al. 2007; Jotzo and Pezzey, 2007). They may be more acceptable than absolute caps for developing countries that experiment strong but nevertheless uncertain long-term economic growth prospects (Fischer and Morgenstern, 2008). This is the case even though intensity targets increase (lower) mitigation costs when GDP is unexpectedly low (high), which might be seen as an undesirable insurance property. Also, ways would need to be found to make such targets compatible with the need for fast-growing emerging economies to take on more (rather than less) stringent mitigation action as they catch up with developed countries.
Intensity targets would deal with uncertainty about future GDP, but not with uncertainty about future emission intensity or about structural abatement costs (Jotzo and Pezzey, 2007, Marschinski and Lecocq, 2006). Furthermore, the extent to which intensity target can limit mitigation cost uncertainty depends on the share of GHG emissions that are linked to GDP. Intensity targets are expected to be an effective insurance device in countries where emissions mainly come from fossil fuel combustion, which are strongly correlated with GDP. They would be less effective for countries where a significant part of emissions comes from land-use and land use changes. It has been shown that there is an optimal degree of indexation of emission targets to GDP, which depends positively on the share of emissions linked to GDP and on the stringency of the target.
Under intensity targets, uncertainty is shifted to some extent away from costs onto emissions levels, since the overall amount of emission reductions is not fixed (Dudek and Golub 2003). However, the overall environmental performance of an intensity target scheme may not necessarily be weaker than under an absolute cap, for three reasons (Jotzo and Pezzey, 2007). First, insofar as they lower mitigation costs, intensity targets can induce countries to take on more stringent commitments. Second, the impact on long-term emissions depends on the nature of shocks. Prevalence of unexpected positive (negative) growth shocks would increase (lower) emissions ceteris paribus, but insofar as such shocks are uniformly distributed around an average, they would be expected to at least partly offset each other over a long time period. Finally, if it concerns only a limited number of emitters, temporary relaxation of the target as a result of medium-term indexation of emissions to GDP is expected to have only a small effect on the stock of GHGs in the atmosphere.
Ways of implementing intensity targets
There are basically two ways of implementing an intensity target: An ex ante permit allocation rule, under which the amount of emission credits is set once and for all in order to meet an intensity target, conditional on a pre-specified projected GDP path; and an updating allocation rule, under which the amount of emission credits is adjusted over time based on the actual GDP path, in order to meet the intensity target ex post. While the former rule is ultimately equivalent to an absolute target, the latter is not since the cap is adjusted upward in order to allow firms to emit more when GDP is higher than projected. In practice, there would necessarily be some delay between GDP growth developments and the adjustment of emission credits under the latter rule, making it difficult to meet the intensity target strictly.
Implications for linking
From a technical perspective, linking a scheme with an absolute cap to another with an intensity target is feasible under both types of allocation rule since in both cases governments will have, to translate the target into a fixed quantity of assigned units in order to allow emission trading (Philibert, 2005).1 From an environmental perspective, the impact of having one system with an intensity target depends on the allocation rule. Insofar as the intensity target scheme has an ex ante rule, linking to other schemes with absolute targets should not affect total emissions. The only risk would be that, if GDP growth turns to be lower than projected, the emission quota may turn out to exceed business as usual emissions, in which case the surplus would be sold to absolute target schemes, thereby increasing total emissions. However, this problem is in fact similar to a “hot air issue”, and could also be encountered with an absolute target.
If the amount of emission credits is updated with GDP growth so as to meet an intensity target within a linked system, governments would have to intervene frequently in order to adjust the supply of permits. This is because once
ECO/WKP(2009)42
35
systems are linked, the distribution of emissions reductions across participating regions is endogenously determined and is affected by any shocks to the system (e.g. a cold winter in a large participating region). In the case of a positive growth shock, a larger number of permits will have to be emitted under a linked system than under a system in which ETSs are not linked, since some of the newly-emitted permits would be bought by foreign firms. This would tend to stabilise the carbon price in the linked system at the cost of more uncertain emissions. One way to ensure the predictability of total emissions within the linked system would be for participating regions with absolute targets to agree to adjust their caps so as to offset changes in the supply of allowances from regions with intensity targets. Under such an arrangement, the latter regions would in effect transfer some of the risk of unexpected changes in their mitigation costs to the former regions, which would then lose the carbon price stabilisation gains from linking to an intensity target scheme.
When applied at the firm – or even possibly at the sector, but probably not at the national – level, and under grandfathering, intensity targets may yield perverse incentives for firms to increase their output and thus, their emissions, in order to obtain more credits. This incentive is reinforced by linking, since firms then have the possibility to export these permits. One possible answer to such concerns is to introduce a “gateway” in order to limit the net permit sales from the intensity rate-based programme, as is the case in the UK system, although such restrictions also impose economic costs on the overall system.
________
1. With an absolute target, the number of credits is determined directly by the cap. With an intensity target, the government must set the intensity target, derive the corresponding emissions on the basis of a GDP projection, and compute the amount of credits accordingly.
57. Linking may raise some environmental concerns that would need to be addressed by appropriate institutions and regulations (see Section 8):
• The region with the lower carbon price ex ante has an incentive to relax its cap in order to generate additional revenue from exporting allowances – and a larger gain from linking more broadly once systems are linked (Helm, 2003; Rehdanz and Tol, 2005). In order to alleviate this, the region with the higher carbon price may also relax its target, thereby triggering a "race to the bottom". This problem may be most acute for countries that face only limited damages from climate change (Helm, 2003).28
• Another source of environmental concern associated with linking is the so-called "hot air" issue. It arises if the aggregate emissions cap in one of the schemes exceeds its business as usual emissions. In the absence of linking, and if this scheme does not allow banking, the surplus of allowances would be lost after the trading period. By contrast, with linking, the surplus is sold to relax the cap in the scheme with the binding target, thereby increasing the emissions of the overall system.
4.2.5 Addressing heterogeneity in sectoral, gas and time coverage
58. Differences in sectoral, gas and time coverage across schemes increase the complexity of the overall system (see Section 5) but in themselves are no source for concern in general:
• Differences in sector coverage may be seen as raising competitiveness concerns when firms covered in one scheme compete with firms that are exempted from binding commitments in the other, but this problem already exists in the absence of linking. The same holds for the risk of double taxation associated with linking upstream and downstream schemes, which in any event can always be addressed by exempting from carbon pricing in downstream ETSs those fossil fuel imports from the upstream ETS.
28. Once schemes are linked, there is also an incentive for net permit seller countries to issue more permits.
However, this can be addressed through an appropriate regulatory framework (see Section 8).
ECO/WKP(2009)42
36
• Differences in the lifetime of permits (the period during which they can be used for compliance) would be expected to be reflected in price differentials, with the market putting a higher price on credits with a higher lifetime, all the more so as future permit issuances are expected to be low and uncertainty is high.
• Differences in the compliance period are unlikely to be a source of institutional incompatibility, but if permits cannot be banked between compliance periods, they may unnecessarily multiply permit vintages, lower market liquidity and thereby increase price volatility.
4.3. Addressing the spread of ETS design features
59. Three main options have been put forward to prevent linking from weakening the environmental integrity of the overall system and to contain the spreading of one particular scheme's design features to the others (Rehdanz and Tol, 2005): i) Discounting permit imports from that particular scheme, meaning that an imported emission credit normally worth one unit of CO2 counts for less than unity by the permit authority in the purchasing country; ii) Setting permit import quotas, i.e. imposing that a certain amount or percentage of emission reduction be achieved domestically; and iii) applying tariffs on permit imports, which unlike quotas would bring fiscal revenues to the importing country. By limiting trading, these instruments have the potential to reduce exposure to shocks to other schemes, and they can also limit the spreading of specific foreign scheme design features, such as safety valves or links to offset credit systems.
60. However, one major drawback of such limits to trading between schemes is to hinder the full convergence in carbon prices and thereby to lower the cost-effectiveness gains from linking. Both countries lose: the "protectionist" country because it has to achieve more of its emission reduction domestically at a higher price; and the other country because permit export revenues fall. Moreover, these instruments would lower market liquidity and increase its complexity. They would also only contain, but may not fully prevent, the importation of the foreign scheme's design features. The only way to do so would be one-way linking, under which trades with one of the domestic schemes is not allowed, but again this would limit the cost-effectiveness gains from linking. Finally, limits to international trading may run the risk of triggering retaliation by affected countries.
61. In light of these drawbacks, these instruments may best be seen as emergency measures rather than as permanent provisions. A more cost-effective approach to address environmental integrity and design feature spreading concerns would be for regions to reach an agreement on key issues prior to linking, notably on:
• The level, or the procedures for setting emission caps in future compliance periods. This would remove governments' incentives to adjust future domestic caps in a way that maximises domestic gains from linking, improve the environmental integrity of the overall scheme, and provide greater certainty to and thereby enhance the incentives for clean investment by market participants.
• Whether to include a safety valve, given the spreading of this feature.
• The metric of the overall target (absolute or relative) and the allocation rule. In the long run, as fast-growing emerging economies catch up with developed countries in terms of income levels, they should probably switch from intensity to absolute targets as the latter would entail lower environmental uncertainty. In the context of a world ETS featuring absolute targets, one way to reflect economic development concerns would be to allocate commitments across countries conditional on expected economic growth rates, and to adjust them over time.

ECO/WKP(2009)42
37
• Agreements on procedures to assess future expansion linking (to emission trading and offset systems). Given the potentially large distributional and environmental impacts of an expansion of the linked system, the rules applying to future linking of one participating region to other, non-participating schemes should if possible be set ex ante.
5. The role of emission crediting mechanisms on the path towards a global carbon market
5.1. The potential gains from well-functioning crediting mechanisms
62. The CDM, one of the flexibility mechanisms of the Kyoto Protocol, allows emission reduction projects in non-Annex I countries – i.e. those not subject to GHG emission constraints – to earn certified emission reduction (CER) credits, each equivalent to one ton of CO2eq. These CERs can be purchased and used by Annex I countries to meet part of their emission reduction commitments. In principle, insofar as developing country emitters do not take on binding emission commitments in the near future, well-functioning crediting mechanisms could play three important roles: i) improve the cost-effectiveness of GHG mitigation policies in developed countries, both directly and indirectly through partial linking of their ETS; ii) mitigate carbon leakage and competitiveness concerns by lowering the carbon price in developed countries; and, iii) boost clean technology transfers to developing countries, and facilitate the implementation of explicit carbon pricing policies at a later stage by putting an opportunity cost on their GHG emissions.
63. The cost-saving potential of well-functioning crediting mechanisms appears to be very large, reflecting the vast low-cost abatement potential existing in a number of developing countries, particularly China. As an illustration, the same hypothetical “benchmark” scenario as in Section 4 is considered, under which each Annex I region of the ENV-Linkages model is assumed to establish a regional ETS that caps GHG emissions at 20% and 50% below 1990 levels by 2020 and 2050, respectively. As stressed earlier, such a scenario should be seen as an illustrative and at best transitory arrangement as it is not compatible with meeting ambitious climate change mitigation targets. Compared with that benchmark scenario, allowing Annex I regions to meet 20% of their commitments through reductions in non-Annex I countries is estimated to nearly halve their mitigation costs (Figure 5.1). Raising the cap on offset use from 20% to 50% would bring further benefits. Cost savings are found to be largest for those Annex I regions that otherwise face the highest marginal abatement costs – and, therefore, the highest carbon price levels (Figure 5.2) – and/or are most carbon-intensive. Australia, New Zealand, and Canada fall in both categories, while Russia falls in the latter. Non-Annex I regions enjoy a slight income gain from exploiting cheap abatement opportunities and selling them profitably in the form of offset credits. In this illustrative scenario, China would be by far the largest seller and the United States the largest buyer in the offset credit market, accounting for about half of worldwide sales and purchases by 2020, respectively (Figure 5.3).
64. However, these cost saving and trade flow estimates should be seen as upper bounds, because they assume a crediting mechanism with no transaction costs and no uncertainty on delivery, as is apparent from the very low projected offset prices in these simulations (Figure 5.2). Abstraction is made here from the numerous market imperfections and policy distortions which may prevent some of the non-Annex I abatement potential from being fully reaped in practice, such as transaction costs and bottlenecks (see below), information barriers, credit market constraints, or institutional and regulatory barriers to investment in host countries (see Section 9).29 The well-functioning crediting mechanism modelled here
29. For instance, under a $US20 carbon price in Annex I countries, Bakker et al. (2007) tentatively estimate
that the amount of emissions abated through crediting projects in non-Annex I countries might be reduced by a factor of up to 2 if these barriers were taken into account.
ECO/WKP(2009)42
38
comes close to an international (asymmetric) ETS covering all non-Annex I countries, where each of them is assigned a target equal to their baseline emissions.
[Figure 5.1. Mitigation policy costs under a 50% emission cut in each Annex I region separately, with and without crediting mechanisms]
[Figure 5.2. Carbon prices under a 50% emission cut in each Annex I region separately, with and without crediting mechanisms]
[Figure 5.3. Projected geographical distribution of offset credit buyers and sellers at the 2020 horizon under a 50% emission cut in each Annex I region separately]
65. Crediting mechanisms also indirectly link the ETSs of countries covered by binding emission caps, even in the absence of explicit linking between them, if credits from a single mechanism (e.g. the CDM) are accepted in several different ETSs. Indeed, they result in partial convergence of carbon prices and marginal abatement costs across the different ETSs, and thereby in an improvement of their cost-effectiveness as a whole. In the illustrative scenario run here, the variance in carbon prices across Annex I regions is found to decline dramatically as the cap on the use of offsets is relaxed, becoming fairly small for instance under a 50% cap (Figure 5.2). As a result, once schemes are indirectly linked through crediting mechanisms, the additional gains from direct linking are smaller than discussed in Section 4. They depend on the degree of carbon price convergence already achieved through indirect linking, which in turn depends in part on limits to the use of offset credits. The looser the constraints on the use of credits, the stronger the indirect linkage between systems, and the smaller the additional gains from explicit linking. For instance, ENV-Linkages simulations suggest that if Annex I regions are allowed to meet up to 50% of their domestic commitments through the use of offsets, the overall additional gain from direct linking would be close to zero, although some countries would still benefit significantly (Figure 5.4).
[Figure 5.4. The gains from direct linking across Annex I regions when they are already linked through a crediting mechanism]
5.2. Challenges with crediting mechanisms and problems with the current CDM
66. In theory, crediting mechanisms may also reduce carbon leakage and mitigate competitiveness concerns. Compared with a counterfactual where countries covered by binding caps cut their emissions unilaterally, the availability of credits lowers the carbon price differential with non-participating countries, which is an important driver of leakage. However, whether leakage is actually reduced partly hinges, in practice, on the definition of the baseline against which credits are granted (Kallbekken et al. 2007a). A baseline corresponding to the BAU level in non-Annex I countries under action in Annex I but without any crediting mechanism – an approach close to that followed de facto under the CDM up to now, and adopted in the modelling work undertaken for this paper – already incorporates some leakage, i.e. it is “too high”. As a result, the reduction in leakage from emission crediting can turn out to be small, or even inexistent (Box 4, and Kallbekken et al. 2007b).30 For instance, in the illustrative 50% Annex I emission cut scenario above, although simulated carbon price levels in Annex I countries fall drastically when emitters are
30. At a more basic level, the CDM may increase leakage if changes in the whole supply chain of the product
considered are not fully taken into account when granting the emission credits. For example a company can use a more efficient technology which however is built from materials that are produced in a highly energy-intensive way, in which case the net impact of the project on emissions is less than the gross impact. For a discussion of such leakage effects and the elaboration of a methodology to account for them, see Geres and Michaelowa (2002).
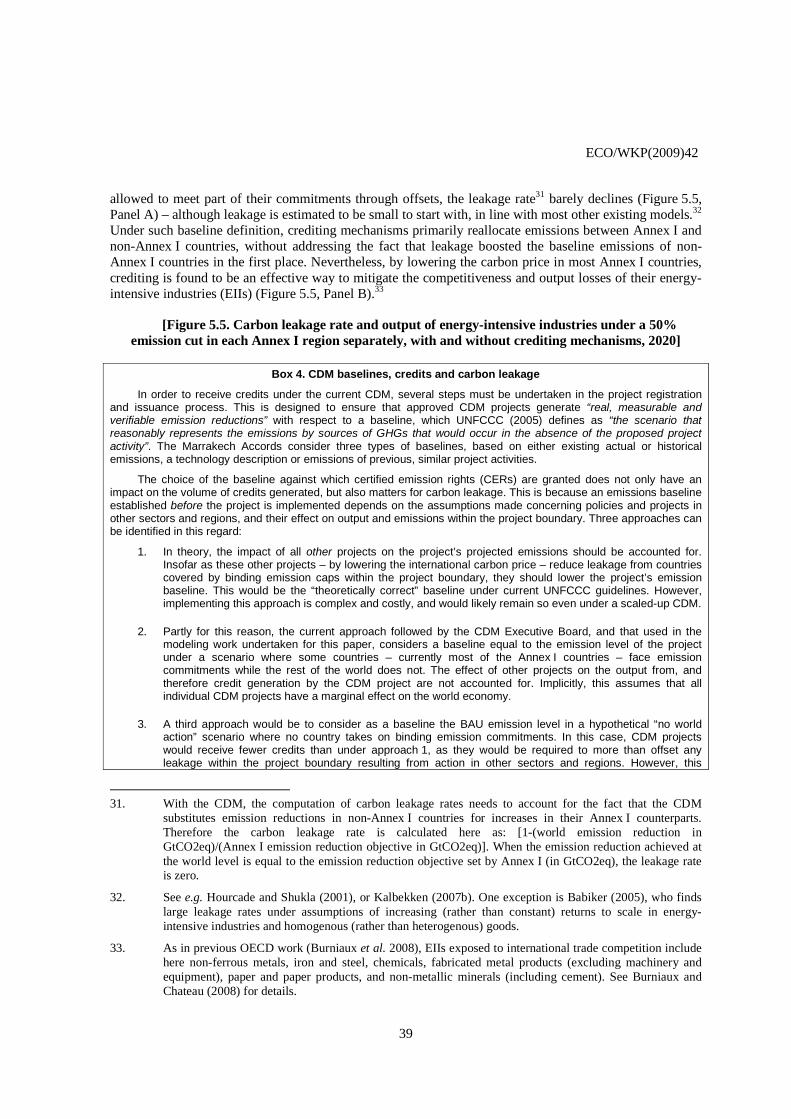
ECO/WKP(2009)42
39
allowed to meet part of their commitments through offsets, the leakage rate31 barely declines (Figure 5.5, Panel A) – although leakage is estimated to be small to start with, in line with most other existing models.32 Under such baseline definition, crediting mechanisms primarily reallocate emissions between Annex I and non-Annex I countries, without addressing the fact that leakage boosted the baseline emissions of non-Annex I countries in the first place. Nevertheless, by lowering the carbon price in most Annex I countries, crediting is found to be an effective way to mitigate the competitiveness and output losses of their energy-intensive industries (EIIs) (Figure 5.5, Panel B).33
[Figure 5.5. Carbon leakage rate and output of energy-intensive industries under a 50% emission cut in each Annex I region separately, with and without crediting mechanisms, 2020]
Box 4. CDM baselines, credits and carbon leakage
In order to receive credits under the current CDM, several steps must be undertaken in the project registration and issuance process. This is designed to ensure that approved CDM projects generate “real, measurable and verifiable emission reductions” with respect to a baseline, which UNFCCC (2005) defines as “the scenario that reasonably represents the emissions by sources of GHGs that would occur in the absence of the proposed project activity”. The Marrakech Accords consider three types of baselines, based on either existing actual or historical emissions, a technology description or emissions of previous, similar project activities.
The choice of the baseline against which certified emission rights (CERs) are granted does not only have an impact on the volume of credits generated, but also matters for carbon leakage. This is because an emissions baseline established before the project is implemented depends on the assumptions made concerning policies and projects in other sectors and regions, and their effect on output and emissions within the project boundary. Three approaches can be identified in this regard:
1. In theory, the impact of all other projects on the project’s projected emissions should be accounted for. Insofar as these other projects – by lowering the international carbon price – reduce leakage from countries covered by binding emission caps within the project boundary, they should lower the project’s emission baseline. This would be the “theoretically correct” baseline under current UNFCCC guidelines. However, implementing this approach is complex and costly, and would likely remain so even under a scaled-up CDM.
2. Partly for this reason, the current approach followed by the CDM Executive Board, and that used in the modeling work undertaken for this paper, considers a baseline equal to the emission level of the project under a scenario where some countries – currently most of the Annex I countries – face emission commitments while the rest of the world does not. The effect of other projects on the output from, and therefore credit generation by the CDM project are not accounted for. Implicitly, this assumes that all individual CDM projects have a marginal effect on the world economy.
3. A third approach would be to consider as a baseline the BAU emission level in a hypothetical “no world action” scenario where no country takes on binding emission commitments. In this case, CDM projects would receive fewer credits than under approach 1, as they would be required to more than offset any leakage within the project boundary resulting from action in other sectors and regions. However, this
31. With the CDM, the computation of carbon leakage rates needs to account for the fact that the CDM
substitutes emission reductions in non-Annex I countries for increases in their Annex I counterparts. Therefore the carbon leakage rate is calculated here as: [1-(world emission reduction in GtCO2eq)/(Annex I emission reduction objective in GtCO2eq)]. When the emission reduction achieved at the world level is equal to the emission reduction objective set by Annex I (in GtCO2eq), the leakage rate is zero.
32. See e.g. Hourcade and Shukla (2001), or Kalbekken (2007b). One exception is Babiker (2005), who finds large leakage rates under assumptions of increasing (rather than constant) returns to scale in energy-intensive industries and homogenous (rather than heterogenous) goods.
33. As in previous OECD work (Burniaux et al. 2008), EIIs exposed to international trade competition include here non-ferrous metals, iron and steel, chemicals, fabricated metal products (excluding machinery and equipment), paper and paper products, and non-metallic minerals (including cement). See Burniaux and Chateau (2008) for details.
ECO/WKP(2009)42
40
approach would imply a lower credit volume than the approach implied by current UNFCCC guidelines, and indeed it does not appear to fit current practice whereby “market leakage” is not taken into account for CDM baselines. For example, the CDM Executive Board does not quantify the impact of the EU-ETS on emissions in non-Annex I countries.
Under all three approaches, Kallbeken et al. (2007b) find that the CDM lowers the carbon price differential between countries that face binding emissions caps and others, and thereby reduces leakage, ceteris paribus. However, these reductions in leakage are typically smaller under the second, yet perhaps most plausible approach above. This is because it does not account for the fact that implementation of all other CDM projects together reduces international carbon prices, leakage and thereby the projected emissions of any other project considered. Consequently, the volume of credits that are granted for each project is higher than both in the “theoretically correct” approach and – to an even greater extent – in the “no world action” approach. As a result, “too” many CERs are granted, and the more so the higher the number of projects that are implemented, i.e. the larger the share of recipient countries’ emissions that benefits from CERs.1 In the extreme, in the absence of any constraint on the use of CERs in Annex I countries, the effect of the CDM under such a baseline would be simply to reallocate emissions between Annex I and non-Annex I countries, without addressing the fact that actions in Annex I boosted the emissions of non-Annex I countries before implementation of the CDM.
In practice, the effects of these alternative approaches have been found to be limited under moderate mitigation action scenarios – and, therefore, fairly low carbon prices and leakage – and limited CDM use (Kallbeken et al. 2007b).2 One open question, which calls for further research, is whether this still holds in the context of the ongoing boom in CDM projects, and – even more so – whether this would still hold under more stringent commitments and a scaled up CDM, especially if fairly lax – i.e. high – bounds are put on CDM use in countries covered by binding emission commitments.
________
1. Alternatively, if the total volume of credits is fixed (e.g. because of demand constraints), this will imply that fewer projects can be undertaken.
2. Vöhringer et al. (2006) stress the difference between the marginal impact of an individual project and the combined effect of all projects together, which can lead to significant leakage, and propose to attribute leakage proportionally to individual projects.
67. More importantly, in its current form the CDM raises a number of issues which, if not addressed, will undermine its ability to deliver the expected benefits:
• Additionality, transaction costs and bottlenecks. Key to ensuring the environmental integrity of the CDM is the so-called additionality criterion, under which only emission reductions that would not have taken place otherwise should give rise to certified emission rights (CERs). If not additional, CERs amount to a mere income transfer to recipient countries without reducing GHG emissions. The large transaction costs and bottlenecks associated with ensuring that CERs are indeed “real, additional and verifiable” are well documented (Capoor and Ambrosi, 2008; Ellis and Kamel, 2007). They have increased as the CDM has been victim of its own success, with more than 4000 projects currently in the pipeline. Despite these costs, it has been argued that a large share of CDM projects do not reflect actual reductions in emissions (ECCP, 2007; Schneider, 2007; Wara and Victor, 2008). These strains on the system have emerged even though the supply of CERs remains lower than its future potential level under increasingly stringent emission targets in Annex I countries. For instance, the annual volume of CERs issued was about 0.25 Gt of CO2eq in 2008, and based on the number of projects currently in the pipeline and projected, it is expected to reach about 1.4 Gt of CO2eq in 2012 (Figure 5.6). Under the illustrative 50% Annex I cut scenario presented above, the simulated supply is estimated to reach over 3 Gt of CO2eq in 2020 if up to 50% of domestic commitments can be made through the use of offset credits.
[Figure 5.6. CERs issued under the crediting mechanism: trends and decomposition by type of project]

ECO/WKP(2009)42
41
• Perverse incentives to raise emissions. The CDM is asymmetric by nature, as it rewards emission reductions but does not penalise increases. As such, the CDM comes close to an emission reduction subsidy, and is subject to the so-called dynamic inefficiency issue (Baumol and Oates, 1988). By reducing firms’ total expected investment costs, the CDM can create perverse incentives to raise investment and output in carbon-intensive equipment in a first stage, so as to get emission credits for reducing emissions in a second stage, depending on expectations about how future baselines will be set.34 The larger the gap between the market price of CERs and the abatement cost, the greater such perverse incentives. This may be seen as a form of “intertemporal leakage”, whereby expected action tomorrow increases emissions today.
• Reduced incentives for non-Annex I countries to take ambitious mitigation action. Another incentive problem is that the large financial inflows developing countries may benefit from under a future CDM may undermine their willingness to take on binding emission commitments at a later stage. This is because most of them obtain a larger income gain under a well-functioning crediting mechanism than under most rules for allocating emission rights in a world ETS, except for most favourable ones. For example, non-Annex I countries as a whole gain more in the illustrative benchmark scenario above (50% emission reduction in Annex I, with Annex I countries using here up to 50% of offsets to meet their commitments), than in a scenario where the same world emission reduction (in Gt CO2eq) is achieved through a global ETS with a per-capita allocation rule, under which every human being is granted the same amount of allowances. In particular, China loses from moving to such a world ETS (Figure 5.7).
[Figure 5.7. Mitigation policy costs under a world ETS and equivalent Annex I mitigation action with a crediting mechanism]
• The permanence problem. In the future, some types of projects could potentially raise a risk of non-permanence, i.e. CERs may be unduly issued for emission reductions made at one point in time but that might be offset by increases in the more distant future. The permanence issue could be significant if sequestration projects such as carbon capture and storage or avoided deforestation became eligible to the CDM.35 For instance, carbon storage capacities might not be maintained, and deforestation might be simply delayed rather than permanently avoided. This problem could be compounded by the difficulty for firms to commit, and for insurance companies to cover the risk of non-compliance over very long periods.
5.3. CDM reform options
68. Despite these drawbacks, crediting mechanisms have the potential to significantly lower the future mitigation costs incurred by regions covered by emission caps. Therefore, in the absence of a global permit trading architecture involving all main emitters, the CDM will have to be scaled up. A number of proposals have been made in that regard, i.e. to move from a project-by-project to a wholesale approach in order to reduce drastically transaction costs and bottlenecks (e.g. Bosi and Ellis, 2005). These approaches are not mutually exclusive, although potential overlap – in particular risks of double counting – would need to be carefully addressed. They may also complement, rather than replace the project-by-project approach, which may have to continue in sectors with dispersed emission sources (e.g. agriculture), or where 34. As an extreme example, Schwank (2004) estimates that producers of chlorodifluoromethane (HCFC-22) in
non-Annex I countries could expand output indefinitely, give that output away, and still make a profit simply by implementing process changes to reduce emissions of trifluoromethane (HFC-23) – a very potent GHG and a by-product of HCFC-22 manufacture – and selling the corresponding CERs.
35. Reforestation/afforestation projects are eligible to the CDM but avoided deforestation is not.
ECO/WKP(2009)42
42
emission reductions are clearly additional (e.g. CCS, or some non-CO2 projects such as N2O destruction activities, which bring no other revenues than the CERs).36 The three main CDM scaling-up options are:
• Bundling and “programmes of activities”. Some degree of scaling up is already in the pipeline in these two forms, which have been eligible to CDM since a 2005 decision (4/CMP.1) at the Meeting of the Parties to the Kyoto Protocol (COP/MOP1) on “further guidance to the CDM”.37 Under the former approach, credits are obtained for bundled projects. Under the latter, they may be granted for a range of projects that differ in timing or geographical location (see e.g. Hinostroza et al. 2007). This may be especially useful in the area of energy efficiency, where the CDM is currently under-developed38 while bundling together small dispersed projects with prohibitively high transaction costs could ultimately lead to large emission reductions. It may also help expand CDM use to geographic regions where it is currently negligible partly due to the relatively small scale of potential projects, such as in Africa.
• Sectoral crediting mechanisms, which would further scale up the CDM by allowing emission reductions at the sector level with respect to a pre-defined baseline to yield credits after validation by the UNFCC (see e.g. Baron and Ellis, 2006). Such a “sectoral CDM” would require setting up sectoral baselines for at least selected industries in each potential recipient country, which would raise a number of methodological issues in practice. In particular, standardised baselines for a given industry across countries may not be appropriate, as there are good economic reasons for cross-country differences in emission levels and intensity within a given industry (e.g. heterogeneity in goods characteristics and/or production processes, factor prices, or natural resource endowments),39 including to some extent EIIs and the power sector (Baron and Ellis, 2006). Intensity baselines (emissions per output) are often considered as easier to establish than baselines in levels. However, the associated sectoral intensity targets might be met through increases in output rather than through emission cuts, and would be more complex to monitor and enforce as they would require measures of both output and emissions.This approach is also discussed below in the broader context of sectoral approaches (Section 6).
• “Policy CDM”, an option under which specific government policies would deliver CERs (see e.g. Aldy and Stavins, 2008). Eligible policies could be sectoral – in which case they would be equivalent to sectoral crediting mechanisms (see Section 6) – or cross-sectoral in nature, and might include for instance renewable energy standards (e.g. a policy of installing energy-efficient light bulbs), building codes or even possibly the implementation of carbon taxes or a removal of energy subsidies. One advantage of a policy CDM is that additionality may be easier to check for. However, this approach would share the drawbacks of technology standards, i.e. it would run the risk of pick up ex ante technologies that could turn out to be costlier than alternatives ex post, and might as well undermine innovation incentives. Furthermore, setting a baseline at a “policy” level and – even more so – monitoring and verifying the emission
36. For some discussion of the permanence and liability issues associated with incorporating CCS in the CDM,
and how these could be addressed, see Philibert et al. (2007). While additionality would not be an issue in general, one possible exception is enhanced oil recovery projects.
37. For some discussion of differences and possible overlap between bundling and “programmes of activities”, see Ellis (2006).
38. For evidence on such under development, see e.g. Arquit Niederberger and Fecher (2006). For details on how to set up programmatic CDMs to enhance energy efficiency, see Figueres and Philips (2007).
39. One additional problem is the existence of linkages across different activities. For instance, in industries where the emission-intensive component of the production process can be outsourced (e.g. cement), the whole supply chain may have to be considered in order to avoid leakage.
ECO/WKP(2009)42
43
reductions achieved from a policy could raise major methodological difficulties and affect the environmental integrity of the scheme. Also, one open issue is whether electorates in developed countries would support the large, transparent payments that would likely be involved if that option were to be used extensively.
69. While these options could achieve drastic cuts in transaction costs and thereby vastly increase the volume of credits issued, they would not per se address the deeper problems of additionality, leakage and perverse incentives. One way to mitigate these concerns might be to negotiate today long-run baselines for the largest possible number of sectors for a sufficiently long time period (e.g. a decade), and to set these baselines below BAU emission levels expected without further world mitigation action efforts. Establishing long-term baselines would address the perverse incentive issue by ruling out the possibility that any future increase in emissions might, if offset by subsequent reductions, deliver CERs. It would also minimise the risk of leakage, all the more so as the number of countries and sectors covered would be large. Setting baselines below BAU levels might be seen as an insurance against the risk of over-estimation of baseline emissions – and thereby of excess supply of CERs – although it may come at the cost of some potential low-cost abatement opportunities being lost. The main weakness of such an approach is that estimating and negotiating baselines simultaneously across a wide range of countries and sectors would require overcoming significant methodological and political obstacles.
70. An international agreement on CDM reform could also incorporate built-in “graduation mechanisms”, under which developing countries would take on increasing GHG mitigation actions or commitments as their income levels converge to the higher levels of developed countries, and/or discontinue hosting crediting projects under certain conditions or after a given period of time. This would: i) address environmental integrity concerns; ii) reduce the disincentive for recipient countries to take on binding commitments once scaled-up CDMs are in place; iii) help put world emissions on a path that allows ambitious long-run global targets to be met. For instance, the sectoral and/or country baselines negotiated in the context of scaled-up CDM might be gradually tightened, along with some relaxation of restrictions on their use in countries covered by ETSs, as additionality would then become less of a concern. This would induce some convergence between “hard” permit and credit prices, albeit at some cost to developed countries. Over the longer run, the tighter baselines might in turn be converted into binding emission caps, which could then be gradually lowered (see also Section 6).
71. As a radical alternative, some have suggested moving away from a strict accounting, “tonne-for-tonne” logic towards direct support to actions that create progress toward mitigation in developing countries (Keeler and Thompson, 2008). However, such relaxation of the additionality criterion may only reinforce the difficulty to gather political support in developed countries for the large and transparent international financial transfers that would be associated with a policy CDM. Another radical alternative to scaling up the CDM would be to replace it by a Fund to finance emission reductions in developing countries. Compared with scaled-up CDMs, this would have three main advantages from the perspective of buying countries: i) it would shelter their ETS from any environmental integrity problems with CERs, as these could no longer be used by individual emitters to meet their domestic commitments; ii) it would give them direct control over the amount of emissions to abate through CERs, over and above their own domestic cuts; iii) insofar as the Fund is a large enough – or possibly the only – buyer, it might purchase credits at different prices depending on their (perceived) marginal abatement cost, thereby maximising the emission reduction achieved for a given financial transfer. However, this option would also imply direct, transparent financial transfers. This may lead to a lower level of funding than under a well-functioning CDM and, therefore, to a loss of cost-effectiveness as the gap in marginal abatement costs between recipient and buying countries would then remain larger. Furthermore, the risk of monopsonistic behaviour by a Fund may raise some reluctance from developing countries.

ECO/WKP(2009)42
44
6. The potential and limitations of sectoral approaches
72. Given that even large emission reductions in Annex I countries alone cannot arrest climate change (see Section 2 above), sectoral approaches are being proposed as a way to broaden participation to developing countries, and therefore to expand the potential for emission reductions and/or lower its cost. They are also expected to mitigate leakage and competiveness issues.
6.1. Forms of sectoral approaches
73. A range of sector-based mitigation policies has been discussed in the policy debate and the literature (Baron et al. 2008). They can be classified in three main groups, depending on the extent to which they impose binding commitment on countries:
• Binding sectoral targets. Quantitative emission targets would be negotiated at a national or international level for specific sectors.40 A cost-effective way to achieve them would then be to set up national or international sectoral cap-and-trade systems, under which allowances would be allocated to firms on the basis of usual rules (e.g. auctioning or grandfathering).41 Allowances might be traded within one or several sectoral markets, and possibly between them and some economy-wide ETSs. The system would involve a cap setting process, as well as monitoring, reporting and verifying (MRV) procedures. Binding sectoral targets could also be achieved through the development and transfer of technologies.
• Sectoral crediting mechanisms. Another option is to establish sectoral emission baselines (e.g. in EIIs) at a national or international level, and emission reductions relative to this baseline would generate credits that could be sold in international carbon markets. That option would involve an ex ante baseline setting process, MRV procedures, and an ex post crediting mechanism once emission reductions relative to the pre-defined baseline are verified.
• Non-binding technology-oriented approaches. The focus here would be on voluntary agreements to promote more efficient or cleaner technologies, with no reward from the international community of the possible emission cuts achieved. However, this approach would put neither a price nor an opportunity cost on carbon, unlike the previous two options. As a result, it would be unlikely to provide emission reduction incentives to firms in the sectors covered, and for this reason it is not considered further in the analysis below.
74. While sectoral approaches could, in principle, be applied across a wide range of sectors and countries, special emphasis might be placed in practice on the largest emitting sectors and, within those, possibly on key country players. The argument is that a narrowly-focused agreement covering firms that share some characteristics and compete among themselves may be easier to achieve than broader agreements. Indeed, a relatively small number of sectors account for a large share of world emissions. In particular, EIIs and the power sector account for almost half of current world GHG emissions (excluding emissions from land use, land use change and forestry), over half of which in non-Annex I countries (Figure 6.1). International shipping and air transport are two other industries where a sectoral approach could also be useful, due to both their significant contribution to world emissions and their transnational character.42
40. International caps might be easier to negotiate in more concentrated sectors, such as aluminum.
41. Another cost-effective way to achieve binding sectoral targets would be through a carbon tax, but this option has not gained much interest in practice.
42. For instance, air transport is planned to be included in the EU ETS by 2011.
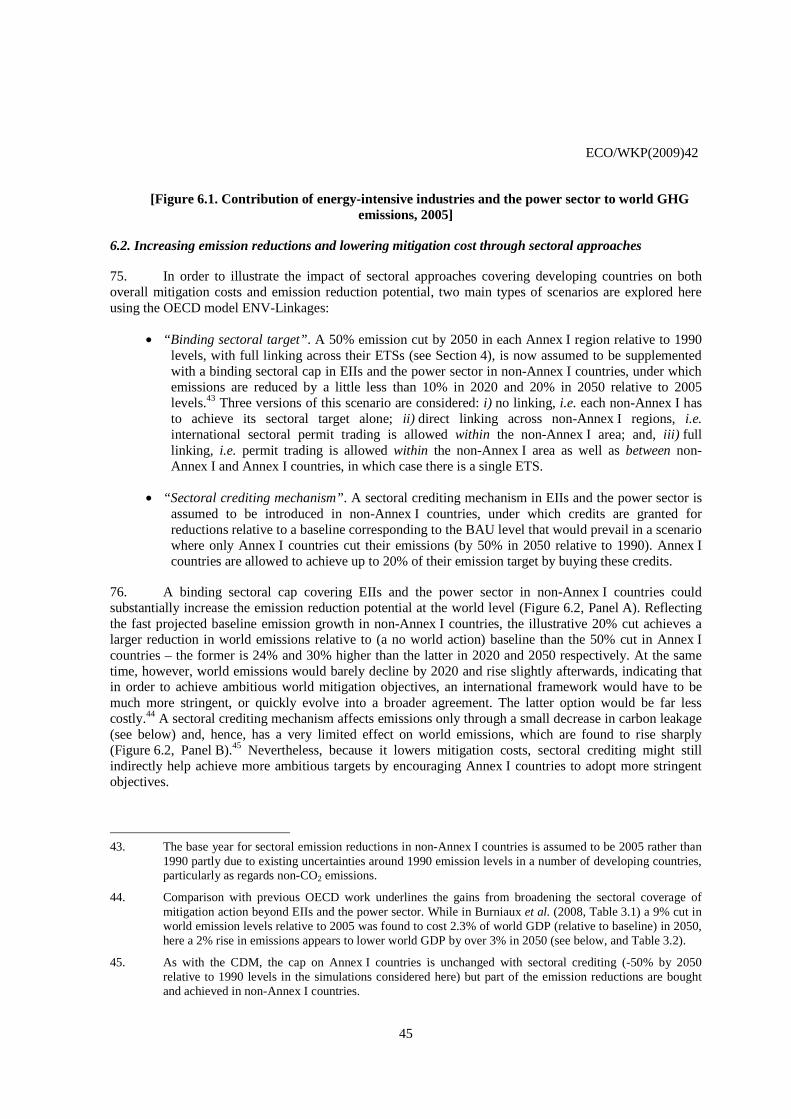
ECO/WKP(2009)42
45
[Figure 6.1. Contribution of energy-intensive industries and the power sector to world GHG emissions, 2005]
6.2. Increasing emission reductions and lowering mitigation cost through sectoral approaches
75. In order to illustrate the impact of sectoral approaches covering developing countries on both overall mitigation costs and emission reduction potential, two main types of scenarios are explored here using the OECD model ENV-Linkages:
• “Binding sectoral target”. A 50% emission cut by 2050 in each Annex I region relative to 1990 levels, with full linking across their ETSs (see Section 4), is now assumed to be supplemented with a binding sectoral cap in EIIs and the power sector in non-Annex I countries, under which emissions are reduced by a little less than 10% in 2020 and 20% in 2050 relative to 2005 levels.43 Three versions of this scenario are considered: i) no linking, i.e. each non-Annex I has to achieve its sectoral target alone; ii) direct linking across non-Annex I regions, i.e. international sectoral permit trading is allowed within the non-Annex I area; and, iii) full linking, i.e. permit trading is allowed within the non-Annex I area as well as between non-Annex I and Annex I countries, in which case there is a single ETS.
• “Sectoral crediting mechanism”. A sectoral crediting mechanism in EIIs and the power sector is assumed to be introduced in non-Annex I countries, under which credits are granted for reductions relative to a baseline corresponding to the BAU level that would prevail in a scenario where only Annex I countries cut their emissions (by 50% in 2050 relative to 1990). Annex I countries are allowed to achieve up to 20% of their emission target by buying these credits.
76. A binding sectoral cap covering EIIs and the power sector in non-Annex I countries could substantially increase the emission reduction potential at the world level (Figure 6.2, Panel A). Reflecting the fast projected baseline emission growth in non-Annex I countries, the illustrative 20% cut achieves a larger reduction in world emissions relative to (a no world action) baseline than the 50% cut in Annex I countries – the former is 24% and 30% higher than the latter in 2020 and 2050 respectively. At the same time, however, world emissions would barely decline by 2020 and rise slightly afterwards, indicating that in order to achieve ambitious world mitigation objectives, an international framework would have to be much more stringent, or quickly evolve into a broader agreement. The latter option would be far less costly.44 A sectoral crediting mechanism affects emissions only through a small decrease in carbon leakage (see below) and, hence, has a very limited effect on world emissions, which are found to rise sharply (Figure 6.2, Panel B).45 Nevertheless, because it lowers mitigation costs, sectoral crediting might still indirectly help achieve more ambitious targets by encouraging Annex I countries to adopt more stringent objectives.
43. The base year for sectoral emission reductions in non-Annex I countries is assumed to be 2005 rather than
1990 partly due to existing uncertainties around 1990 emission levels in a number of developing countries, particularly as regards non-CO2 emissions.
44. Comparison with previous OECD work underlines the gains from broadening the sectoral coverage of mitigation action beyond EIIs and the power sector. While in Burniaux et al. (2008, Table 3.1) a 9% cut in world emission levels relative to 2005 was found to cost 2.3% of world GDP (relative to baseline) in 2050, here a 2% rise in emissions appears to lower world GDP by over 3% in 2050 (see below, and Table 3.2).
45. As with the CDM, the cap on Annex I countries is unchanged with sectoral crediting (-50% by 2050 relative to 1990 levels in the simulations considered here) but part of the emission reductions are bought and achieved in non-Annex I countries.
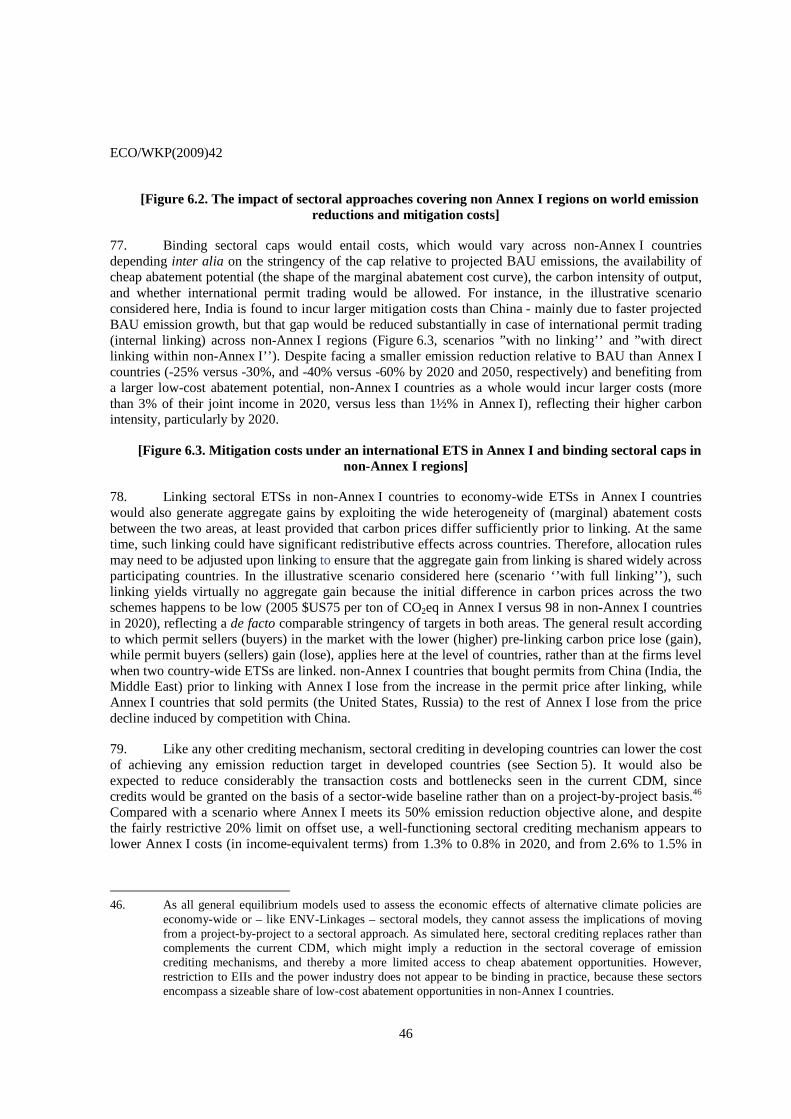
ECO/WKP(2009)42
46
[Figure 6.2. The impact of sectoral approaches covering non Annex I regions on world emission reductions and mitigation costs]
77. Binding sectoral caps would entail costs, which would vary across non-Annex I countries depending inter alia on the stringency of the cap relative to projected BAU emissions, the availability of cheap abatement potential (the shape of the marginal abatement cost curve), the carbon intensity of output, and whether international permit trading would be allowed. For instance, in the illustrative scenario considered here, India is found to incur larger mitigation costs than China - mainly due to faster projected BAU emission growth, but that gap would be reduced substantially in case of international permit trading (internal linking) across non-Annex I regions (Figure 6.3, scenarios ”with no linking’’ and ”with direct linking within non-Annex I’’). Despite facing a smaller emission reduction relative to BAU than Annex I countries (-25% versus -30%, and -40% versus -60% by 2020 and 2050, respectively) and benefiting from a larger low-cost abatement potential, non-Annex I countries as a whole would incur larger costs (more than 3% of their joint income in 2020, versus less than 1½% in Annex I), reflecting their higher carbon intensity, particularly by 2020.
[Figure 6.3. Mitigation costs under an international ETS in Annex I and binding sectoral caps in non-Annex I regions]
78. Linking sectoral ETSs in non-Annex I countries to economy-wide ETSs in Annex I countries would also generate aggregate gains by exploiting the wide heterogeneity of (marginal) abatement costs between the two areas, at least provided that carbon prices differ sufficiently prior to linking. At the same time, such linking could have significant redistributive effects across countries. Therefore, allocation rules may need to be adjusted upon linking to ensure that the aggregate gain from linking is shared widely across participating countries. In the illustrative scenario considered here (scenario ‘’with full linking’’), such linking yields virtually no aggregate gain because the initial difference in carbon prices across the two schemes happens to be low (2005 $US75 per ton of CO2eq in Annex I versus 98 in non-Annex I countries in 2020), reflecting a de facto comparable stringency of targets in both areas. The general result according to which permit sellers (buyers) in the market with the lower (higher) pre-linking carbon price lose (gain), while permit buyers (sellers) gain (lose), applies here at the level of countries, rather than at the firms level when two country-wide ETSs are linked. non-Annex I countries that bought permits from China (India, the Middle East) prior to linking with Annex I lose from the increase in the permit price after linking, while Annex I countries that sold permits (the United States, Russia) to the rest of Annex I lose from the price decline induced by competition with China.
79. Like any other crediting mechanism, sectoral crediting in developing countries can lower the cost of achieving any emission reduction target in developed countries (see Section 5). It would also be expected to reduce considerably the transaction costs and bottlenecks seen in the current CDM, since credits would be granted on the basis of a sector-wide baseline rather than on a project-by-project basis.46 Compared with a scenario where Annex I meets its 50% emission reduction objective alone, and despite the fairly restrictive 20% limit on offset use, a well-functioning sectoral crediting mechanism appears to lower Annex I costs (in income-equivalent terms) from 1.3% to 0.8% in 2020, and from 2.6% to 1.5% in
46. As all general equilibrium models used to assess the economic effects of alternative climate policies are
economy-wide or – like ENV-Linkages – sectoral models, they cannot assess the implications of moving from a project-by-project to a sectoral approach. As simulated here, sectoral crediting replaces rather than complements the current CDM, which might imply a reduction in the sectoral coverage of emission crediting mechanisms, and thereby a more limited access to cheap abatement opportunities. However, restriction to EIIs and the power industry does not appear to be binding in practice, because these sectors encompass a sizeable share of low-cost abatement opportunities in non-Annex I countries.
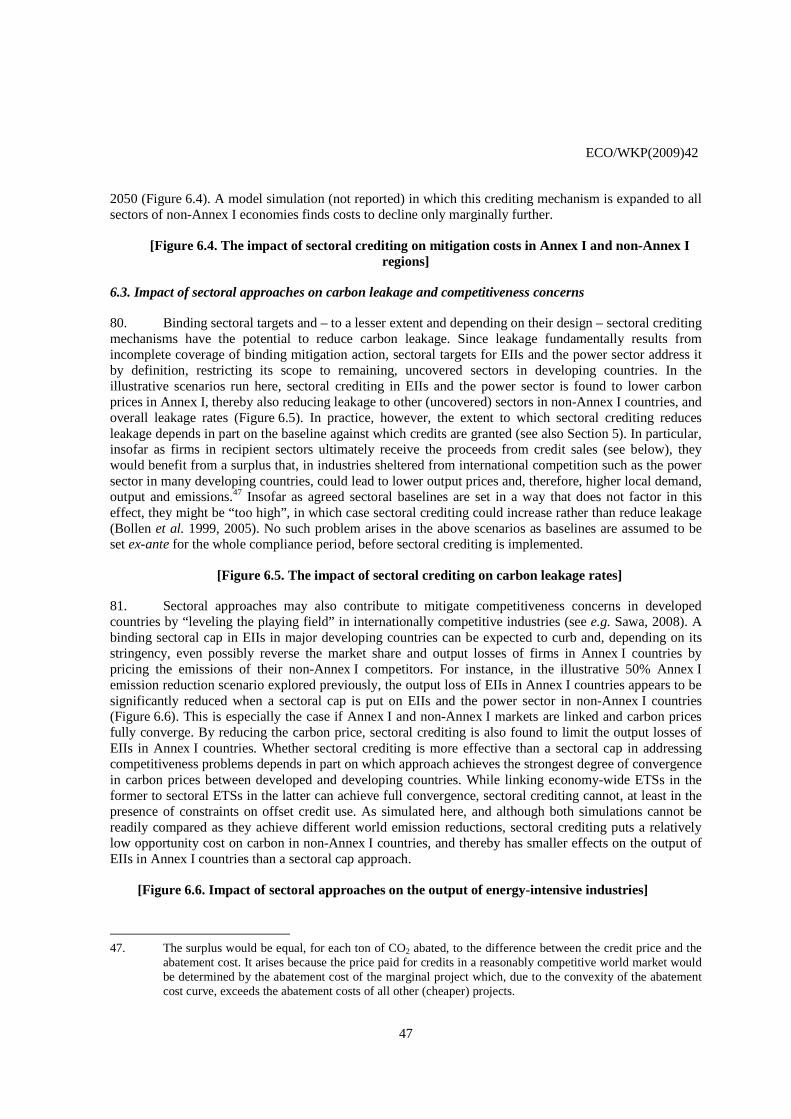
ECO/WKP(2009)42
47
2050 (Figure 6.4). A model simulation (not reported) in which this crediting mechanism is expanded to all sectors of non-Annex I economies finds costs to decline only marginally further.
[Figure 6.4. The impact of sectoral crediting on mitigation costs in Annex I and non-Annex I regions]
6.3. Impact of sectoral approaches on carbon leakage and competitiveness concerns
80. Binding sectoral targets and – to a lesser extent and depending on their design – sectoral crediting mechanisms have the potential to reduce carbon leakage. Since leakage fundamentally results from incomplete coverage of binding mitigation action, sectoral targets for EIIs and the power sector address it by definition, restricting its scope to remaining, uncovered sectors in developing countries. In the illustrative scenarios run here, sectoral crediting in EIIs and the power sector is found to lower carbon prices in Annex I, thereby also reducing leakage to other (uncovered) sectors in non-Annex I countries, and overall leakage rates (Figure 6.5). In practice, however, the extent to which sectoral crediting reduces leakage depends in part on the baseline against which credits are granted (see also Section 5). In particular, insofar as firms in recipient sectors ultimately receive the proceeds from credit sales (see below), they would benefit from a surplus that, in industries sheltered from international competition such as the power sector in many developing countries, could lead to lower output prices and, therefore, higher local demand, output and emissions.47 Insofar as agreed sectoral baselines are set in a way that does not factor in this effect, they might be “too high”, in which case sectoral crediting could increase rather than reduce leakage (Bollen et al. 1999, 2005). No such problem arises in the above scenarios as baselines are assumed to be set ex-ante for the whole compliance period, before sectoral crediting is implemented.
[Figure 6.5. The impact of sectoral crediting on carbon leakage rates]
81. Sectoral approaches may also contribute to mitigate competitiveness concerns in developed countries by “leveling the playing field” in internationally competitive industries (see e.g. Sawa, 2008). A binding sectoral cap in EIIs in major developing countries can be expected to curb and, depending on its stringency, even possibly reverse the market share and output losses of firms in Annex I countries by pricing the emissions of their non-Annex I competitors. For instance, in the illustrative 50% Annex I emission reduction scenario explored previously, the output loss of EIIs in Annex I countries appears to be significantly reduced when a sectoral cap is put on EIIs and the power sector in non-Annex I countries (Figure 6.6). This is especially the case if Annex I and non-Annex I markets are linked and carbon prices fully converge. By reducing the carbon price, sectoral crediting is also found to limit the output losses of EIIs in Annex I countries. Whether sectoral crediting is more effective than a sectoral cap in addressing competitiveness problems depends in part on which approach achieves the strongest degree of convergence in carbon prices between developed and developing countries. While linking economy-wide ETSs in the former to sectoral ETSs in the latter can achieve full convergence, sectoral crediting cannot, at least in the presence of constraints on offset credit use. As simulated here, and although both simulations cannot be readily compared as they achieve different world emission reductions, sectoral crediting puts a relatively low opportunity cost on carbon in non-Annex I countries, and thereby has smaller effects on the output of EIIs in Annex I countries than a sectoral cap approach.
[Figure 6.6. Impact of sectoral approaches on the output of energy-intensive industries]
47. The surplus would be equal, for each ton of CO2 abated, to the difference between the credit price and the
abatement cost. It arises because the price paid for credits in a reasonably competitive world market would be determined by the abatement cost of the marginal project which, due to the convexity of the abatement cost curve, exceeds the abatement costs of all other (cheaper) projects.
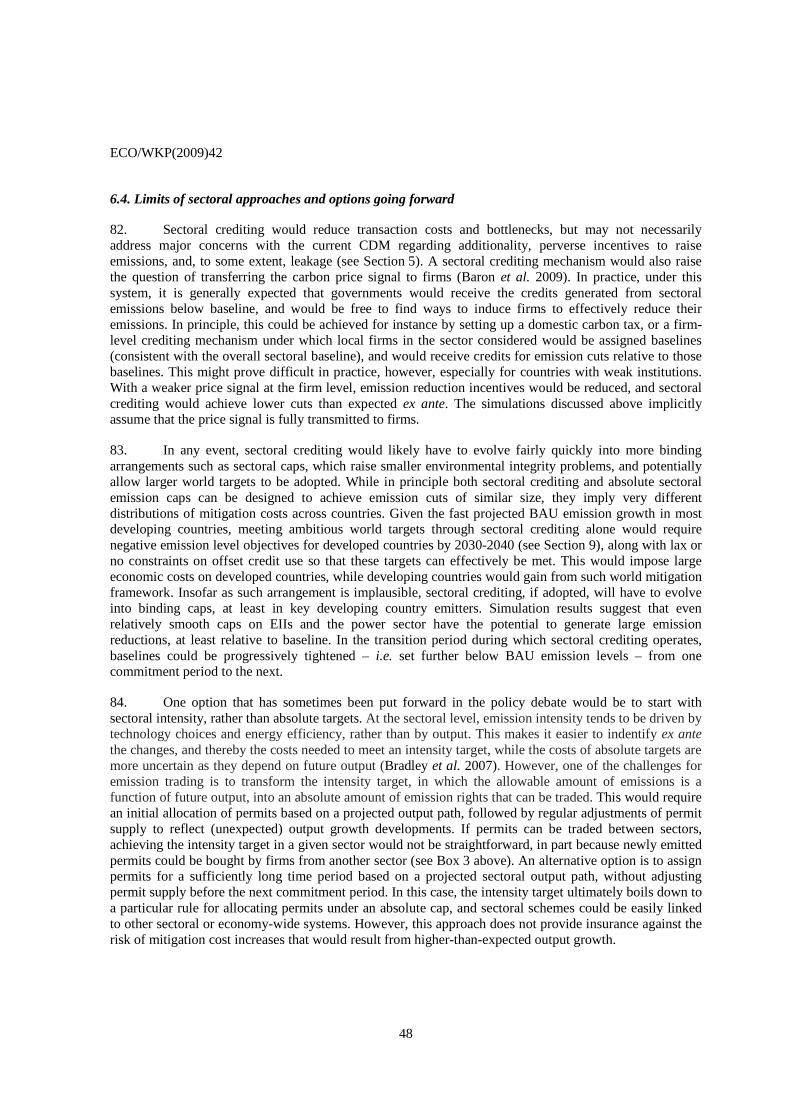
ECO/WKP(2009)42
48
6.4. Limits of sectoral approaches and options going forward
82. Sectoral crediting would reduce transaction costs and bottlenecks, but may not necessarily address major concerns with the current CDM regarding additionality, perverse incentives to raise emissions, and, to some extent, leakage (see Section 5). A sectoral crediting mechanism would also raise the question of transferring the carbon price signal to firms (Baron et al. 2009). In practice, under this system, it is generally expected that governments would receive the credits generated from sectoral emissions below baseline, and would be free to find ways to induce firms to effectively reduce their emissions. In principle, this could be achieved for instance by setting up a domestic carbon tax, or a firm-level crediting mechanism under which local firms in the sector considered would be assigned baselines (consistent with the overall sectoral baseline), and would receive credits for emission cuts relative to those baselines. This might prove difficult in practice, however, especially for countries with weak institutions. With a weaker price signal at the firm level, emission reduction incentives would be reduced, and sectoral crediting would achieve lower cuts than expected ex ante. The simulations discussed above implicitly assume that the price signal is fully transmitted to firms.
83. In any event, sectoral crediting would likely have to evolve fairly quickly into more binding arrangements such as sectoral caps, which raise smaller environmental integrity problems, and potentially allow larger world targets to be adopted. While in principle both sectoral crediting and absolute sectoral emission caps can be designed to achieve emission cuts of similar size, they imply very different distributions of mitigation costs across countries. Given the fast projected BAU emission growth in most developing countries, meeting ambitious world targets through sectoral crediting alone would require negative emission level objectives for developed countries by 2030-2040 (see Section 9), along with lax or no constraints on offset credit use so that these targets can effectively be met. This would impose large economic costs on developed countries, while developing countries would gain from such world mitigation framework. Insofar as such arrangement is implausible, sectoral crediting, if adopted, will have to evolve into binding caps, at least in key developing country emitters. Simulation results suggest that even relatively smooth caps on EIIs and the power sector have the potential to generate large emission reductions, at least relative to baseline. In the transition period during which sectoral crediting operates, baselines could be progressively tightened – i.e. set further below BAU emission levels – from one commitment period to the next.
84. One option that has sometimes been put forward in the policy debate would be to start with sectoral intensity, rather than absolute targets. At the sectoral level, emission intensity tends to be driven by technology choices and energy efficiency, rather than by output. This makes it easier to indentify ex ante the changes, and thereby the costs needed to meet an intensity target, while the costs of absolute targets are more uncertain as they depend on future output (Bradley et al. 2007). However, one of the challenges for emission trading is to transform the intensity target, in which the allowable amount of emissions is a function of future output, into an absolute amount of emission rights that can be traded. This would require an initial allocation of permits based on a projected output path, followed by regular adjustments of permit supply to reflect (unexpected) output growth developments. If permits can be traded between sectors, achieving the intensity target in a given sector would not be straightforward, in part because newly emitted permits could be bought by firms from another sector (see Box 3 above). An alternative option is to assign permits for a sufficiently long time period based on a projected sectoral output path, without adjusting permit supply before the next commitment period. In this case, the intensity target ultimately boils down to a particular rule for allocating permits under an absolute cap, and sectoral schemes could be easily linked to other sectoral or economy-wide systems. However, this approach does not provide insurance against the risk of mitigation cost increases that would result from higher-than-expected output growth.
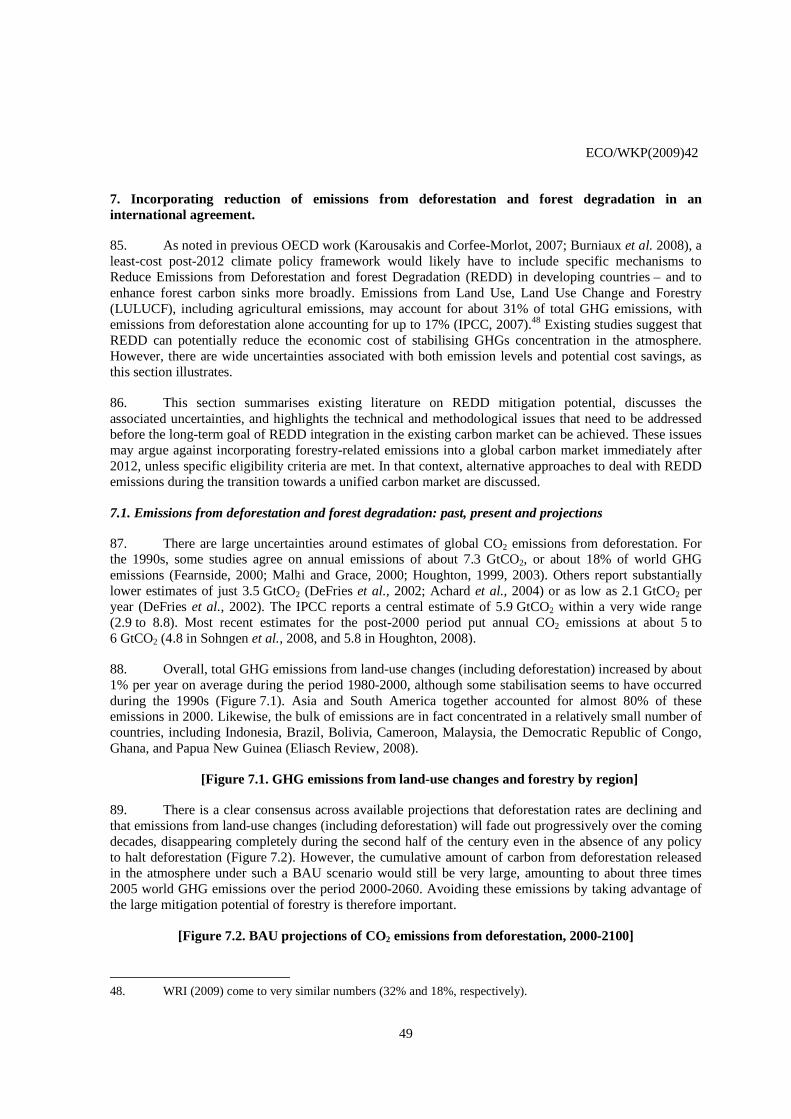
ECO/WKP(2009)42
49
7. Incorporating reduction of emissions from deforestation and forest degradation in an international agreement.
85. As noted in previous OECD work (Karousakis and Corfee-Morlot, 2007; Burniaux et al. 2008), a least-cost post-2012 climate policy framework would likely have to include specific mechanisms to Reduce Emissions from Deforestation and forest Degradation (REDD) in developing countries – and to enhance forest carbon sinks more broadly. Emissions from Land Use, Land Use Change and Forestry (LULUCF), including agricultural emissions, may account for about 31% of total GHG emissions, with emissions from deforestation alone accounting for up to 17% (IPCC, 2007).48 Existing studies suggest that REDD can potentially reduce the economic cost of stabilising GHGs concentration in the atmosphere. However, there are wide uncertainties associated with both emission levels and potential cost savings, as this section illustrates.
86. This section summarises existing literature on REDD mitigation potential, discusses the associated uncertainties, and highlights the technical and methodological issues that need to be addressed before the long-term goal of REDD integration in the existing carbon market can be achieved. These issues may argue against incorporating forestry-related emissions into a global carbon market immediately after 2012, unless specific eligibility criteria are met. In that context, alternative approaches to deal with REDD emissions during the transition towards a unified carbon market are discussed.
7.1. Emissions from deforestation and forest degradation: past, present and projections
87. There are large uncertainties around estimates of global CO2 emissions from deforestation. For the 1990s, some studies agree on annual emissions of about 7.3 GtCO2, or about 18% of world GHG emissions (Fearnside, 2000; Malhi and Grace, 2000; Houghton, 1999, 2003). Others report substantially lower estimates of just 3.5 GtCO2 (DeFries et al., 2002; Achard et al., 2004) or as low as 2.1 GtCO2 per year (DeFries et al., 2002). The IPCC reports a central estimate of 5.9 GtCO2 within a very wide range (2.9 to 8.8). Most recent estimates for the post-2000 period put annual CO2 emissions at about 5 to 6 GtCO2 (4.8 in Sohngen et al., 2008, and 5.8 in Houghton, 2008).
88. Overall, total GHG emissions from land-use changes (including deforestation) increased by about 1% per year on average during the period 1980-2000, although some stabilisation seems to have occurred during the 1990s (Figure 7.1). Asia and South America together accounted for almost 80% of these emissions in 2000. Likewise, the bulk of emissions are in fact concentrated in a relatively small number of countries, including Indonesia, Brazil, Bolivia, Cameroon, Malaysia, the Democratic Republic of Congo, Ghana, and Papua New Guinea (Eliasch Review, 2008).
[Figure 7.1. GHG emissions from land-use changes and forestry by region]
89. There is a clear consensus across available projections that deforestation rates are declining and that emissions from land-use changes (including deforestation) will fade out progressively over the coming decades, disappearing completely during the second half of the century even in the absence of any policy to halt deforestation (Figure 7.2). However, the cumulative amount of carbon from deforestation released in the atmosphere under such a BAU scenario would still be very large, amounting to about three times 2005 world GHG emissions over the period 2000-2060. Avoiding these emissions by taking advantage of the large mitigation potential of forestry is therefore important.
[Figure 7.2. BAU projections of CO2 emissions from deforestation, 2000-2100]
48. WRI (2009) come to very similar numbers (32% and 18%, respectively).
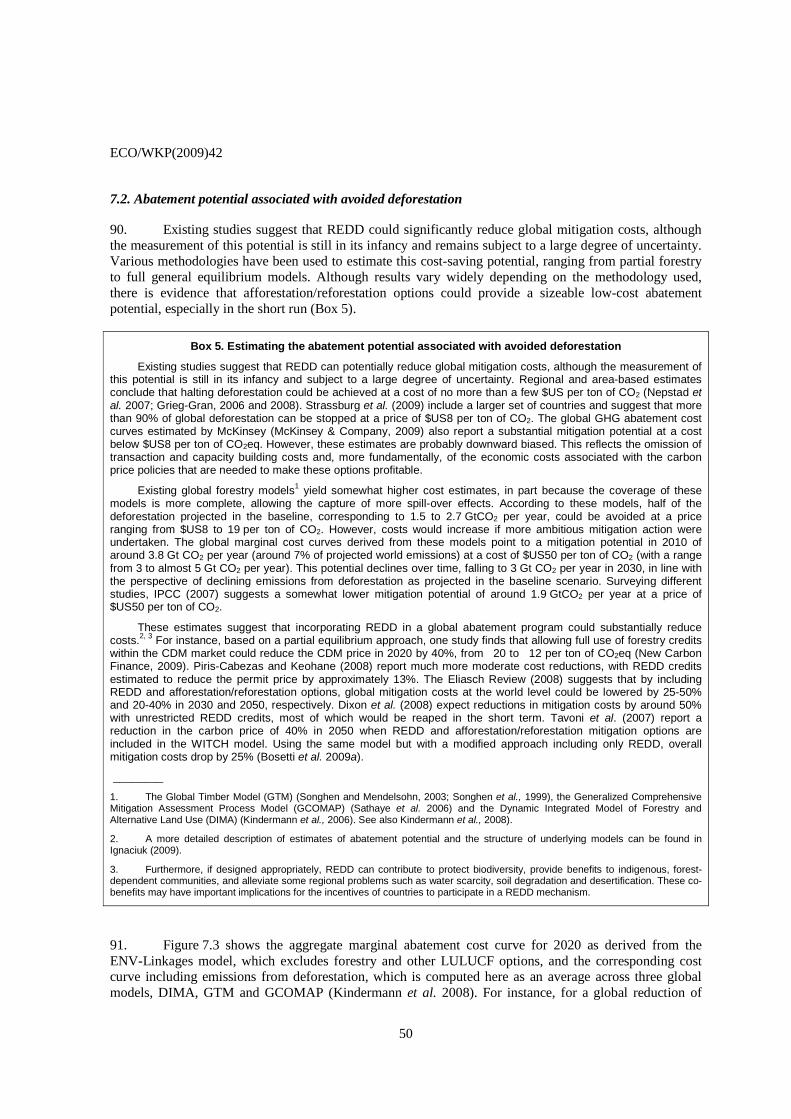
ECO/WKP(2009)42
50
7.2. Abatement potential associated with avoided deforestation
90. Existing studies suggest that REDD could significantly reduce global mitigation costs, although the measurement of this potential is still in its infancy and remains subject to a large degree of uncertainty. Various methodologies have been used to estimate this cost-saving potential, ranging from partial forestry to full general equilibrium models. Although results vary widely depending on the methodology used, there is evidence that afforestation/reforestation options could provide a sizeable low-cost abatement potential, especially in the short run (Box 5).
Box 5. Estimating the abatement potential associated with avoided deforestation
Existing studies suggest that REDD can potentially reduce global mitigation costs, although the measurement of this potential is still in its infancy and subject to a large degree of uncertainty. Regional and area-based estimates conclude that halting deforestation could be achieved at a cost of no more than a few $US per ton of CO2 (Nepstad et al. 2007; Grieg-Gran, 2006 and 2008). Strassburg et al. (2009) include a larger set of countries and suggest that more than 90% of global deforestation can be stopped at a price of $US8 per ton of CO2. The global GHG abatement cost curves estimated by McKinsey (McKinsey & Company, 2009) also report a substantial mitigation potential at a cost below $US8 per ton of CO2eq. However, these estimates are probably downward biased. This reflects the omission of transaction and capacity building costs and, more fundamentally, of the economic costs associated with the carbon price policies that are needed to make these options profitable.
Existing global forestry models1 yield somewhat higher cost estimates, in part because the coverage of these models is more complete, allowing the capture of more spill-over effects. According to these models, half of the deforestation projected in the baseline, corresponding to 1.5 to 2.7 GtCO2 per year, could be avoided at a price ranging from $US8 to 19 per ton of CO2. However, costs would increase if more ambitious mitigation action were undertaken. The global marginal cost curves derived from these models point to a mitigation potential in 2010 of around 3.8 Gt CO2 per year (around 7% of projected world emissions) at a cost of $US50 per ton of CO2 (with a range from 3 to almost 5 Gt CO2 per year). This potential declines over time, falling to 3 Gt CO2 per year in 2030, in line with the perspective of declining emissions from deforestation as projected in the baseline scenario. Surveying different studies, IPCC (2007) suggests a somewhat lower mitigation potential of around 1.9 GtCO2 per year at a price of $US50 per ton of CO2.
These estimates suggest that incorporating REDD in a global abatement program could substantially reduce costs.2, 3 For instance, based on a partial equilibrium approach, one study finds that allowing full use of forestry credits within the CDM market could reduce the CDM price in 2020 by 40%, from 20 to 12 per ton of CO2eq (New Carbon Finance, 2009). Piris-Cabezas and Keohane (2008) report much more moderate cost reductions, with REDD credits estimated to reduce the permit price by approximately 13%. The Eliasch Review (2008) suggests that by including REDD and afforestation/reforestation options, global mitigation costs at the world level could be lowered by 25-50% and 20-40% in 2030 and 2050, respectively. Dixon et al. (2008) expect reductions in mitigation costs by around 50% with unrestricted REDD credits, most of which would be reaped in the short term. Tavoni et al. (2007) report a reduction in the carbon price of 40% in 2050 when REDD and afforestation/reforestation mitigation options are included in the WITCH model. Using the same model but with a modified approach including only REDD, overall mitigation costs drop by 25% (Bosetti et al. 2009a).
________
1. The Global Timber Model (GTM) (Songhen and Mendelsohn, 2003; Songhen et al., 1999), the Generalized Comprehensive Mitigation Assessment Process Model (GCOMAP) (Sathaye et al. 2006) and the Dynamic Integrated Model of Forestry and Alternative Land Use (DIMA) (Kindermann et al., 2006). See also Kindermann et al., 2008).
2. A more detailed description of estimates of abatement potential and the structure of underlying models can be found in Ignaciuk (2009).
3. Furthermore, if designed appropriately, REDD can contribute to protect biodiversity, provide benefits to indigenous, forest-dependent communities, and alleviate some regional problems such as water scarcity, soil degradation and desertification. These co-benefits may have important implications for the incentives of countries to participate in a REDD mechanism.
91. Figure 7.3 shows the aggregate marginal abatement cost curve for 2020 as derived from the ENV-Linkages model, which excludes forestry and other LULUCF options, and the corresponding cost curve including emissions from deforestation, which is computed here as an average across three global models, DIMA, GTM and GCOMAP (Kindermann et al. 2008). For instance, for a global reduction of
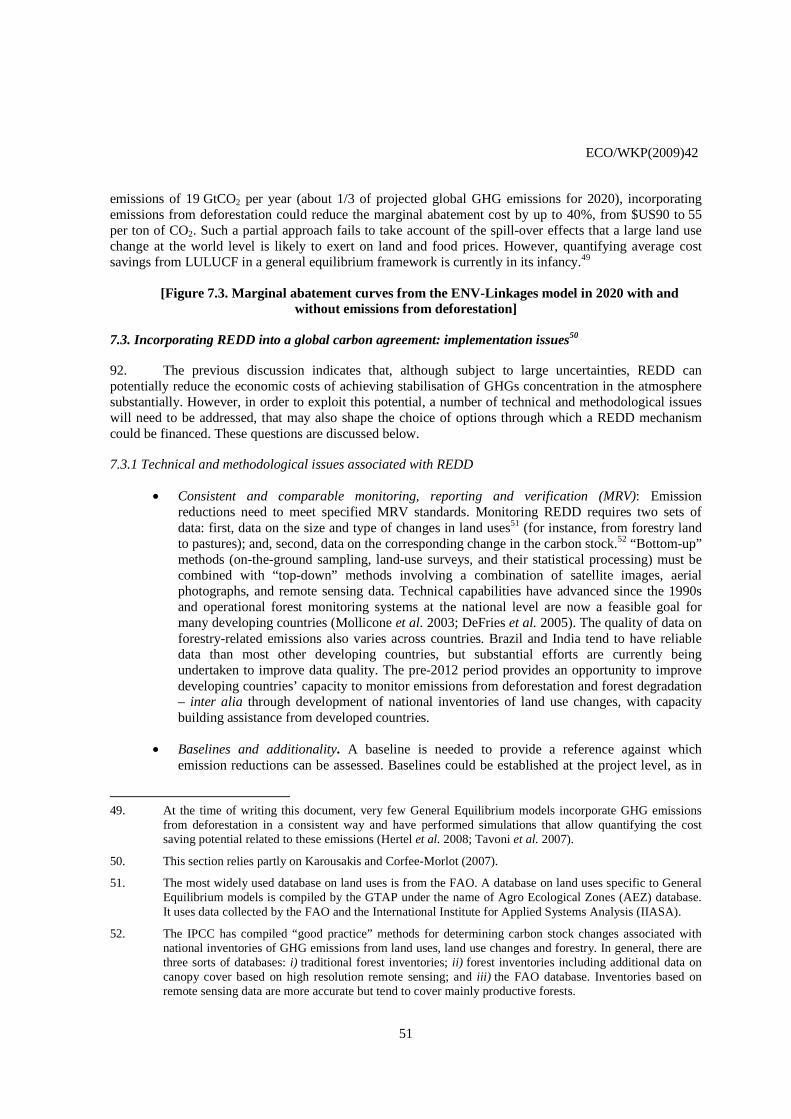
ECO/WKP(2009)42
51
emissions of 19 GtCO2 per year (about 1/3 of projected global GHG emissions for 2020), incorporating emissions from deforestation could reduce the marginal abatement cost by up to 40%, from $US90 to 55 per ton of CO2. Such a partial approach fails to take account of the spill-over effects that a large land use change at the world level is likely to exert on land and food prices. However, quantifying average cost savings from LULUCF in a general equilibrium framework is currently in its infancy.49
[Figure 7.3. Marginal abatement curves from the ENV-Linkages model in 2020 with and without emissions from deforestation]
7.3. Incorporating REDD into a global carbon agreement: implementation issues50
92. The previous discussion indicates that, although subject to large uncertainties, REDD can potentially reduce the economic costs of achieving stabilisation of GHGs concentration in the atmosphere substantially. However, in order to exploit this potential, a number of technical and methodological issues will need to be addressed, that may also shape the choice of options through which a REDD mechanism could be financed. These questions are discussed below.
7.3.1 Technical and methodological issues associated with REDD
• Consistent and comparable monitoring, reporting and verification (MRV): Emission reductions need to meet specified MRV standards. Monitoring REDD requires two sets of data: first, data on the size and type of changes in land uses51 (for instance, from forestry land to pastures); and, second, data on the corresponding change in the carbon stock.52 “Bottom-up” methods (on-the-ground sampling, land-use surveys, and their statistical processing) must be combined with “top-down” methods involving a combination of satellite images, aerial photographs, and remote sensing data. Technical capabilities have advanced since the 1990s and operational forest monitoring systems at the national level are now a feasible goal for many developing countries (Mollicone et al. 2003; DeFries et al. 2005). The quality of data on forestry-related emissions also varies across countries. Brazil and India tend to have reliable data than most other developing countries, but substantial efforts are currently being undertaken to improve data quality. The pre-2012 period provides an opportunity to improve developing countries’ capacity to monitor emissions from deforestation and forest degradation – inter alia through development of national inventories of land use changes, with capacity building assistance from developed countries.
• Baselines and additionality. A baseline is needed to provide a reference against which emission reductions can be assessed. Baselines could be established at the project level, as in
49. At the time of writing this document, very few General Equilibrium models incorporate GHG emissions
from deforestation in a consistent way and have performed simulations that allow quantifying the cost saving potential related to these emissions (Hertel et al. 2008; Tavoni et al. 2007).
50. This section relies partly on Karousakis and Corfee-Morlot (2007).
51. The most widely used database on land uses is from the FAO. A database on land uses specific to General Equilibrium models is compiled by the GTAP under the name of Agro Ecological Zones (AEZ) database. It uses data collected by the FAO and the International Institute for Applied Systems Analysis (IIASA).
52. The IPCC has compiled “good practice” methods for determining carbon stock changes associated with national inventories of GHG emissions from land uses, land use changes and forestry. In general, there are three sorts of databases: i) traditional forest inventories; ii) forest inventories including additional data on canopy cover based on high resolution remote sensing; and iii) the FAO database. Inventories based on remote sensing data are more accurate but tend to cover mainly productive forests.
ECO/WKP(2009)42
52
the current CDM, or at the sectoral level.53 One way to address the large uncertainties associated with monitoring emission reductions and to ensure the environmental integrity of a REDD mechanism would be to develop conservative baselines, although this may come at the cost of some potential low-cost abatement opportunities being lost.
• Perverse incentives to speed up deforestation. A baseline based on most recent trends may provide countries with perverse incentives to accelerate deforestation before the base year in order to benefit from a baseline against which it would then be easier to make emission reductions. Alternatively, the baseline could be negotiated ex-ante on the basis of a BAU forecast. Once decided, this baseline could not be modified until the next negotiation round. This approach would avoid making the (possibly) erroneous assumptions that future trends will resemble past trends. It would also make reduce perverse incentives and adverse selection problems,54 and allow addressing equity issues through the negotiation process. A prerequisite for establishing a baseline is to have time-series data for forest areas and corresponding carbon stocks.
• Intranational and international carbon leakage. If the coverage of accounting is not wide enough, emission leakage can occur as deforestation and forest degradation shifts from covered to non-covered areas. National baselines are therefore better able to address intranational leakage than project-by-project baselines (Plantinga and Richards, 2008). Broad international participation in a REDD mechanism would help alleviate international leakage.
• Permanence. It is important to ensure that emission reductions are permanent and do not merely reflect delayed deforestation. A REDD mechanism should be designed to address this risk, for instance through the issuance of temporary credits, insurance mechanisms and/or reserves with debits from future credits (Karousakis and Corfee Morlot, 2007).
7.3.2 Financing mechanisms for REDD
93. Performance criteria for designing an appropriate financing mechanism include: i) the achievement of effective reductions of emissions from deforestation within the 2020-2030 timeframe; ii) achieving such reductions in a way that improves the cost-effectiveness of global GHG emission reductions; iii) the provision of sufficient and sustainable financing for REDD; and, iv) a fair access and distribution of this financing to all countries with a high potential for REDD. Two key options have been proposed for financing REDD: the market-based crediting approach and the (non-market) fund-based approach. Other, “hybrid” proposals have some elements of both approaches.
The market-based crediting approach
94. In principle, a market-based REDD mechanism could be introduced either via a sectoral cap-and-trade scheme or via a baseline-and-credit scheme. One advantage of the cap-and-trade approach is that it ensures compliance with the cap, and thus also provides a greater degree of certainty with regard to the emission reductions that would be achieved. However, contrary to a baseline-and-credit scheme, a cap-and-trade would imply a mitigation commitment from developing countries. At this stage, only crediting schemes are being considered in the ongoing REDD negotiations for the post-2012 commitment period.
53. In the REDD terminology used in the UNFCCC, the sectoral baseline here refers to “national”
approaches/baselines.
54. Adverse selection problems would be reduced because countries with historically declining carbon stocks would have lower incentives to participate.
ECO/WKP(2009)42
53
95. The market-based crediting approach would allow developing countries that reduce their emissions from deforestation and forest degradation below a pre-determined baseline to generate carbon credits which they could sell in a post-2012 carbon market. In principle, these REDD credits would be equivalent to, and fully fungible with, other credits such as those generated through the CDM or the allowances from Annex I ETS. This approach would then lead to a cost-effective allocation between REDD and other GHG emission reductions, and would generate sustainable and long-term finances to compensate developing countries for REDD below the baseline.
96. A commonly raised concern with the market-based approach is that the environmental integrity, and ultimately the credibility, of the international carbon market could be undermined if it were to be flooded with low-quality REDD credits. One option to limit this risk is to control the supply of REDD credits through a price floor (Weitzman, 1974; Baumol and Oates, 1988), or by imposing maximum limits on supply. The supply limit could be adjusted upward if the carbon market price becomes too high – in which case REDD credits would become “offset safety valves” – or when the REDD market becomes safer and more mature. Therefore, although a global cap-and-trade system including REDD credits should be aimed for as a medium term objective, adequate monitoring capabilities and capacity building are prerequisites for its implementation. Until these capabilities are in place, fungibility of REDD credits with other carbon credits should be avoided. On the other hand, once a country meets pre-defined eligibility criteria,55 linking to the international carbon market could be allowed, possibly subject to a transition period over which supply restrictions would be gradually phased out.
The segmented-market approach
97. Another way to contain the risk of low-quality REDD credits undermining the environmental integrity of the international is to keep REDD and other carbon markets separate (Ogonowski et al. 2007). Under this proposal, a new market for REDD credits only would be created, with no link to the international carbon market. Each Annex I country would commit to meet a given share of its own reduction target by purchasing GHG reductions for REDD actions in developing countries, subject to a maximum established by the Conference of Parties. In order to be effective, this commitment would be a firm pledge, acting both as a minimum and a maximum. Commitments could not be modified before the next commitment period. REDD credits would be tradable but could not be exchanged against CDM credits or permits.56 As with the market-based approach, such restrictions on the tradability of credits could be lifted gradually as countries meet pre-defined environmental integrity criteria. Although this approach has a number of advantages, it does not per se eliminate the sources of uncertainties associated with REDD actions (difficulty to prove additionality, problems of leakages and permanence). Furthermore, whether this approach guarantees a complete segmentation of the REDD and carbon markets depends on how it is implemented in practice.
The fund-based approach
98. Yet another, non-market-based alternative would be a fund-based approach that would rely on voluntary or institutionalised contributions to a Fund from developed country governments and other sources. A number of funding sources have been proposed, including Official Development Assistance (ODA), international financial institutions, and earmarking of revenues from permit auctions under ETSs. These funds could then be distributed to governments based on REDD performance, i.e. on reductions below a pre-determined baseline. Performance-based payments to governments would provide incentives
55. Eligibility requirements for the participation of developing countries in a REDD market mechanism have
yet to be established.
56. However, some indirect linking would still be possible, for instance if many Annex I countries use the carbon market to offset shortfalls in their REDD commitments.
ECO/WKP(2009)42
54
for the latter to address the domestic imperfections that induce deforestation and forest degradation. Governments could also provide payments directly to individual landowners and communities to compensate them directly for the foregone opportunity costs of forest conversion (e.g. similar to Payments for Ecosystem Services schemes). Fund-based and market-based schemes could be combined over time in a phased approach, with a first phase primarily fund-based to ensure capacity building and subsequent phases in which REDD credits are gradually integrated to a carbon market under appropriate conditions.
99. The major advantage of the fund-based approach is to reduce the risk of contaminating a well-performing carbon market even more than a segmented-market approach would. Therefore, it may not require the same (high) MRV standards as market-based approaches. It also provides a framework for directly financing capacity building, as well as supporting stabilisation of standing forests. However, an approach based on voluntary contributions lacks a mechanism that would provide adequate incentives to contribute to the Fund(s), and therefore may be unlikely to provide sufficient and sustainable levels of funding. It thus runs the risk of leaving cheap abatement opportunities unexploited. If funding were sufficient, the cost-effectiveness of this approach could be improved by linking the amount of transfers to international carbon prices (Burniaux et al. 2008). In addition, if not appropriately designed, a fund-based approach could reduce the potential role of the private sector.
8. Regulatory issues and the role of financial markets
100. Carbon markets will naturally develop as more and more countries undertake mitigation actions. The size of carbon markets is expected to become large, reaching 1% of world GDP by 2050 if Annex I countries alone reduce their emissions by 50% (relative to 1990 levels), and 5% of world GDP under a global carbon price scenario that stabilises overall GHG concentration below 550 ppm CO2eq.57 Institutions and rules would be needed to foster their development and to address risks that are expected to emerge within a linked system of multiple independent and heterogeneous cap-and-trade schemes. These risks and the required regulations are summarised in Table 8.1.
[Table 8.1. Regulations to address carbon market risks]
8.1. The risks associated with the development of carbon markets
101. The development of carbon markets raises four main risks:
• An environmental risk, which may be the major risk expected to emerge within a linked system of several independent and heterogeneous ETS and crediting mechanisms (see Sections 4 and 5).
• A liquidity risk. Lack of market liquidity is another potential risk. Liquid primary markets foster the emergence of derivative instruments (futures, forwards, options, and swaps) that would lower the cost for firms to insure against future carbon price uncertainty.58 Liquid markets would also reduce the opportunities for market manipulation. Markets can become illiquid for several reasons. If the treatment of two types of allowances differs across two systems – e.g. due to limits on the use of the other system's allowances, or the use of a discount rate for allowances whose environmental quality is perceived to be low – the allowances would be imperfect substitutes and traded at different prices in spot markets,
57 By comparison, for instance, the US sub-prime mortgage market (total outstanding amount of sub-prime
loans) amounted to about 9½% of US GDP, or about 3% of world GDP at current exchange rates, in 2007 (OECD, 2007).
58. In particular, carbon price uncertainty discourages investment (Jamet, 2009).

ECO/WKP(2009)42
55
thereby leading to market fragmentation. Likewise, if some credits entail specific risks, as is the case under the current CDM, they will be traded at prices that are different from those of other units in the primary market.59 For instance, the price spread between future EU allowances (EUA) and high-quality – i.e. those with the higher price – forward CER contracts on the primary market was around 10 in the course of 2008 (World Bank, 2008). These differences disappear in secondary markets once the CER has been traded once. Differences in permit design features in terms of lifetime or banking possibilities would also lower the liquidity of markets. Such differences would also propagate to futures and other derivatives carbon markets. Investors might hold different expectations for possible programme changes in the various cap-and trade systems, thereby making allowance futures imperfect substitutes and fragmenting the derivatives market. Nonetheless, market liquidity concerns could be reduced in the future, as the size of carbon markets increases with broader country participation and more stringent objectives.
• Risk associated with the development of derivative markets. Speculation is expected to play an important role in the development of carbon derivative markets. This is because, unlike in other commodity markets, if permits are mainly auctioned, most regulated firms will tend to hedge the cost of their compliance obligation by buying allowance futures and speculators will have to take most of the invert position, selling allowance futures, thereby taking part of the net risk.60 The role of speculation is expected to be reflected in futures prices in the form of speculators' risk premia.61
• A counterparty risk. With 70% of carbon trading in Europe being conducted through bilateral negotiations between participants, the "over-the-counter" (OTC) markets, and with most of this trading being for deferred delivery (Point Carbon, 2007), the counterparty risk is significant in current carbon markets. As markets develop, this risk could increase if transactions continue to operate mainly through OTC markets, but could be reduced if organised exchanges expand. In the latter case, counterparty risk is reduced through the intermediation of clearinghouses that verifies trade orders and nets out offsetting contracts by the same clearing member.
8.2. Institutions and regulations to address carbon market risks
8.2.1 Policies aiming at environmental integrity
102. Given the various incentives for countries to free ride and to increase their emissions, it has sometimes been suggested that an independent international institution acting as a Central Bank could help achieve mitigation targets at least cost, preserving environmental integrity and anchoring carbon price expectations (e.g. Grubb and Neuhoff, 2006; Yohe, 2007 and Endofer et al. 2007). Indeed, the comparison between emission credits and money has often been made. In practice, however, countries are unlikely to 59. These risks include registration risks, risks coming from the financial situation of the project leader and its
access to credits, and several host country risks (Point Carbon, 2007).
60. The sellers of allowances (governments) have no interest in hedging and therefore, hedging is expected to be one-sided in the carbon market. In most other commodity markets, hedging is two-sided (producers of the commodity hedge by selling futures while processing firms hedge by buying futures), hedging demands are at least partly offsetting and speculation is less needed for the development of derivative markets. If permits are allocated for free, the market will be more two-sided, since firms undertaking investment to reduce emissions would hedge against the risk of a decrease in the future carbon price.
61. Other types of hedging costs (fees, bid-ask spreads, and the costs of maintaining margin) should be comparatively small.
ECO/WKP(2009)42
56
accept such a transfer of their decision power, and attempting to create a new global institution would run the risk of further delaying mitigation action (Mc Kibbin, 2007). Therefore, the following discussion tries, as far as possible, to build on existing institutions and rules.
103. Given the difficulty of enforcing international rules against sovereign states, negotiations and consensus building would have to be at the core of the development of the carbon market. In order to facilitate future linking and to maximise its market liquidity benefits, participating governments should seek mutual recognition of their targets and agreement on cap-and-trade design features that will need to be harmonised prior to linking, including cost containment measures (see Section 4), decisions to link to another system, and the coordination of monitoring, reporting and verification efforts (Haites and Wang, 2006). However, this has not happened so far in practice, as existing ETSs have very different rules on inter alia allocation methodologies, non-compliance provisions, and allowable offsets (e.g. Ellis and Tirpak 2006; Reinaud and Philibert 2007). Centralised institutions created to implement the UNFCCC, the Kyoto Protocol, and any successor protocol could also help by providing a framework to discuss issues of linking national and regional ETS. In particular, a centralised permit registry has already been created, as well as centralised management of the Kyoto Protocol’s project-based mechanisms (CDM and Joint Implementation).
104. A number of options exist to mitigate risks of non compliance and the incentives to relax the target in future compliance periods once systems are linked, although none of them would fully address the issue of enforcing international commitment of sovereign governments, which will ultimately require the provision of adequate participation incentives (see Section 9). As a general principle, longer-term agreements on well-defined emission caps would help limit the need and room for frequent re-negotiations. One possible complementary compliance mechanism could be the emission of performance bonds. Under this approach, governments would put some of their own bonds before the start of a compliance period into the hands of a compliance committee (e.g. a UNFCCC body), which would then have the right to sell those bonds in the open market if the country was determined to have failed to meet its commitment or would return them to governments otherwise. International agreement on such a system may be hard to find. Nevertheless, it could mark an improvement over the penalty system embedded in the Kyoto protocol (a make-up of excess emissions in the next period with a 30% penalty), which has proved to be weak in the absence of a long term framework. A reserve, such as the existing ‘’commitment period reserve’’ under the Kyoto protocol which requires governments to keep a certain percentage (90%) of their assigned amount units in a Fund, would also limit the risk of " overselling" by participants that do not meet their targets. However, this could come at the cost of imposing limits on trading and weakening the cost-effectiveness of the scheme (OECD, 2001). Yet another alternative would be to use trade sanctions, but these have been found to be costly and might trigger trade retaliation rather than greater country cooperation (Burniaux et al. 2008).
105. An alternative to explicit enforcement mechanisms would be to give governments incentives to comply, e.g. through a system of buyer liability, under which buyers would be liable for the poor quality of the permits or offsets they hold (Baron, 2000; Victor, 2001; Keohane and Raustiala, 2008).62 The validity of permits or offsets emitted by a given country would be assessed on a regular basis, and all of them would then be discounted on a national basis. Under this system, (net) selling countries would be induced to improve the quality of their permits so as to increase export revenues, while buyers have similar incentives to gather information ex ante -and possibly buy at a discount price low-quality permits - as on
62. Under this system, buyers would be liable to make up the difference between invalid permits that do not
represent the full amount of carbon reduction their face value implies, and valid ones. In the case of offsets, the additionality would have to be assessed while in the case of allowances, the validity could be assessed on a broader range of criteria including the validity of monitoring, reporting and verification (MRV) procedures and the stringency of the country’s allocation of permits during the compliance period.
ECO/WKP(2009)42
57
the international sovereign bond market. One major weakness of the proposal, however, is that quality checks would probably have to be performed by an independent agency,63 which may thus face the same problems as the CDM executive board under the current CDM. Furthermore, improved environmental integrity would come at the cost of reduced market liquidity, because permits would be differentiated through price differentials according to their quality and country of issuance. Also, the system ultimately rests on the willingness of (net) buying countries to enforce penalties on their domestic emitters. If buyers were reluctant to endorse such an approach, they could instead apply the ex post penalty in the form of discounts on all permit imports from the selling country concerned (see Section 4).
106. Finding agreement on standards and procedures for validating and verifying the domestic and/or international offset credits accepted within ETS is also essential since the use of such offsets propagates across linked systems even if only one of these formally recognises them (see Sections 4 and 5). The easiest way to achieve this would be through the use of a common centralised institution to manage the offset verification program, such as for the CDM. An alternative would be to share full information about standards and procedures in order to achieve mutual confidence on offsets’ environmental integrity. Reforming the CDM in ways that mitigate the additionality issue and lower transaction costs and bottlenecks would contribute to make allowances from ETS and CERSs closer substitutes, thereby also increasing market liquidity.
8.2.2. Policies aiming at market functioning
107. Some permit design features can foster the development of derivative markets and lower the cost of hedging. Permits are usually valid for only one single ton of carbon (so-called “short-term” permits), and the lifetime during which they can be used can be fixed (a particular year or compliance period) or undefined, which will de facto applies if permits can be banked. Liquid spot markets (through regular spot sales of short-term permits), banking and credible commitments on future mitigation policies may be the most effective way to foster the development of least cost derivatives. Some imperfect substitutes for futures contracts have also been proposed to help the formation of future prices, such as the emission of future vintages of allowances (if permits cannot be banked), or of long-term permits that grant the holder the right to emit one ton of carbon annually (see e.g. McKibbin and Wilcoxen, 2006).64 However, each of these instruments has its own characteristics, risk and price. Their multiplication, for instance if credits cannot be banked between compliance periods and multiple vintages are traded in spot markets alongside derivative contracts, for future delivery, can also fragment the market and possibly reduce liquidity in particular instruments. For these reasons, short-term permits that can be banked between compliance periods seem preferable. Long-term permits can be considered to show governments’ commitment and to create a constituency (permit holders) that supports mitigation policies, but they run also the risk to fragment the market. Therefore they may be primarily considered in cases where the credibility of the scheme could be weak otherwise, or once carbon markets have reached a sufficiently large size.
108. Carbon market regulation will need to strike the right balance between environmental integrity, stability and liquidity objectives. In particular, one open issue is whether position limits on speculators in
63. In the international bond market, the quality of sovereign bonds is priced by markets. No independent
international agency is needed to rate bonds because buyers have a clear financial incentive to assess the risk of default ex ante. By contrast, in the international permit/credit market, neither buyers nor sellers would have a financial incentive to assess the environmental quality of permits or credits ex ante, unless an independent authority has the power to enforce a penalty ex post in case of environmental integrity problems.
64. Compared with a future contract, future vintages of allowances or long term allowances have the advantage of being more flexible, as they can be used to meet compliance obligations if needed, before the future contract maturity date.

ECO/WKP(2009)42
58
spot and derivative commodity markets should also be set in permit markets in order to limit the risk of sudden or unwarranted carbon price fluctuations. One option in that respect might be to impose limits on banking for speculators, in order to prevent them from possibly banking large amounts of allowances in response to changes in expectations and thereby being able to manipulate and cause large fluctuations in spot markets. Such restrictions would have to be weighed against the fact that speculators will provide liquidity and firms will need derivative markets to hedge against price uncertainty. Since within a linked system limits on the positions of speculators in derivatives markets would spread across schemes, national and/or regional regulators would also have to coordinate and possibly harmonise regulatory frameworks. The supervision of carbon markets will typically fall under existing financial market authorities, but for countries with multiple financial market authorities the ones responsible for carbon markets will have to be clearly identified. Broad regulations that already exist or will be developed in response to the recent financial crisis will also apply, and as such they should incorporate the carbon market dimension.
109. In the short run, it will remain a major challenge to devise regulations that generate confidence among participants and that protect against sources of future market fragility, while not impeding innovation and market development. Given the wide variety of possible permit design and regulatory features in cap-and-trade schemes, best practice may emerge only gradually and harmonisation is likely to take time. During that transitory period, in order to avoid the risk that linking creates significant market disruptions, limits to trading between schemes could be set up that would then be gradually phased out as knowledge about best practice builds up and scheme design features are harmonised. The creation of a carbon market working group made up of international regulators, perhaps as part of the Financial Stability Board, could facilitate exchange of information about regulations, risks and harmonisation needs.
110. Finally, there are several ways to address the counterparty risk that arises from the fact that a large part of transactions take place in OTC markets. Contracts could specify penalties for performance failures and allow the seller or buyer to complete the transaction with another party after a specified short number of days. It is also possible to let participants access a clearing house even though transactions are OTC, as it is the case under the EU ETS for small players or to require transactions above a certain size to be passed through clearinghouses (Point Carbon, 2007). If there is concern that delivery failures may occur because the number of allowances is smaller than the demand coming from speculators with short futures positions, limits on futures positions could be tightened, although this may also increase the cost of hedging. Limiting the uncertainty on long term emission reduction commitments -and the associated amount of allowances- as well as extending ETS to other countries will also be crucial to address the counterparty risk.
9. Building political support for action across countries
111. Achieving the ultimate objective of the UNFCCC – i.e. to stabilise GHG concentrations in the atmosphere at a level that would prevent dangerous anthropogenic interference with the climate system – will require ambitious emissions cuts in both developed and developing countries. As shown in Section 2, however, the large coalitions of countries needed to achieve sufficient emission reductions will be difficult to establish immediately. Intermediate, transitory arrangements will need to be developed in the interim. As such, Sections 3-8 have highlighted the instruments that could be used to contribute to the gradual emergence of a global carbon price across countries and sectors, in order to increase participation in mitigation action to sufficient levels. Over time, actions to reduce emissions will need to be scaled-up across all countries, including through increasingly ambitious mitigation actions by developing country emitters. Eventually, many of the intermediate arrangements described in the preceding chapters might develop into caps covering large parts of global emissions.
112. A necessary, although not sufficient, condition for enhancing mitigation action in developing countries will be the establishment of implicit and/or explicit international transfers to support this action.
ECO/WKP(2009)42
59
Indeed, the Bali Action Plan explicitly refers to support for GHG mitigation actions in terms of finance, technology and capacity building. This section discusses the framework conditions that can help support action by developing countries and secure broader political engagement in global mitigation, including financing to support mitigation, international technology transfers, R&D and adaptation in countries vulnerable to the impacts of climate change. It then highlights in broad terms the main elements that might shape a global post-2012 international climate policy framework.
9.1. International financial support for mitigation
9.1.1. Mitigation financing support today and for the coming years
113. Several of the market instruments already discussed in this paper, such as scaled-up CDM options, would provide private financing and/or technological support for mitigation action in developing countries. The market value of CERs transferred reached over $US8 billion in 2007. This amount is estimated to rise to over $US12 billion under the illustrative scenario discussed in Section 5 where Annex I countries cut their emissions by 20% by 2020, and 50% of offset credits are used to meet their domestic commitments. This simulation provides a lower bound estimate, since it assumes a low price of future CERs as a result of the implementation of “perfect” scaled-up CDM.
114. Further international financial support already exists through direct public funding of mitigation actions in developing countries, not least in the form of Funds (Box 6). However, these public financing devices remain fragmented and limited in size, in comparison to the amount of funding generated by the CDM and, even more so, with future financing needs in ambitious world mitigation scenarios. As a result, a number of proposals have been made recently to scale up public finances for mitigation (Box 6). The required increase in public funding is hard to determine a priori, for two reasons. First, it will ultimately reflect countries’ incentives and willingness to distribute the costs of global action via such Funds, rather than through other, possibly more cost-effective devices (see below).65 Second, in theory the (optimal) amount of financing would depend on the degree of ambition and effectiveness of market mechanisms such as ETS, a scaled-up CDM and/or sectoral approaches. The smaller the coverage of emission sources and/or the larger the market imperfections left unaddressed by market mechanisms – e.g. in the areas of R&D and technology transfers (see below), the greater the case for increasing public mitigation funding. Rationalising existing Funds, and targeting primarily areas that are unlikely to benefit from adequate private financing, will be needed to ensure that public funds are spent in a cost-effective manner.
Box 6. Direct public financing mechanisms for mitigation action in developing countries and options for the future
Direct public funding to support mitigation actions in developing countries already exists in different forms:
• A number of Multilateral Funds are currently operating, mostly under the UNFCCC or in the form of special climate change funds run by multilateral development banks, primarily the World Bank. Current annual funding available for mitigation under the UNFCCC is about $US1 billion. In particular, the Global Environmental Facility (GEF) is the UNFCCC’s key financial mechanism for both mitigation and adaptation, and finances mitigation activities through three specific funds (UNFCCC, 2009): i) the Trust Fund, which is accessible to all countries; ii) the Special Climate Change Fund, accessible to non-Annex I countries only; and, iii) the Least-Developed Countries Fund, specifically dedicated to least- developed countries. The World Bank currently has over $US2 billion under management in ten carbon funds and facilities, and over $US6 billion in its recently launched Climate Investment Funds.1 Together,
65. The governance structure may matter in this regard, with developing (developed) countries possibly more
(less) likely to support global than bilateral Funds, over which donor countries typically have greater control (Hall et al. 2008). In any event, non-Annex I countries may have only limited incentives to contribute, at least insofar as such Funds substitute for – rather than complement – emission reductions that might have been achieved through the CDM and other possible crediting mechanisms.
ECO/WKP(2009)42
60
these Funds are expected to provide annual funding in the order of $US1.5 billion over the period 2009-2012.
• An increasing number of bilateral initiatives have also been taken recently, such as Japan’s Cool Earth Partnership which is expected to deliver $US2 billion in annual funding over the coming years, essentially for mitigation actions in developing countries.2 In REDD-related activities, on current plans bilateral funding is projected to substantially exceed multilateral financing.3
• Finally, some support to mitigation action and capacity building in developing countries is currently provided through bilateral and multilateral assistance. Climate-change specific bilateral official development assistance by the 23 members of the OECD’s Development Assistance Committee amounted to slightly less than $US4 billion in 2006, accounting for about 5% of overall public aid (OECD-CRS database).
A number of proposals have been made recently to scale up public finances for mitigation. Switzerland proposed a $US 2 uniform global carbon tax for all annual emissions in excess of 1.5t CO2, whose revenues would be partly remitted to an international fund depending on GDP per capita. Norway suggested that a small portion of Assigned Amount Units could be auctioned by an appropriate international institution. Developing countries have also been active in this area, with China recently suggesting to set up a Multilateral Technology Acquisition Fund that would be mainly financed by developed countries through their R&D budgets, energy taxes and/or fiscal revenues from carbon pricing (China, 2009), and Mexico proposing to create a World Fund of at least $US10 billion in capital – an amount that would exceed the combined size of the GEF and the Clean Technology Fund – that would gather and scale up existing funds in both the technology transfer and adaptation areas (Mexico, 2008).
One open issue is whether earmarking fiscal revenues levied on the carbon market – e.g. from permit auctioning in regions covered by emission trading schemes or from the CDM, as would be the case under some proposals, would be an appropriate way to scale up Multilateral Funds. On the one hand, there is no reason a priori to expect that linking funding to the (nominal) size of carbon markets over a few years horizon would deliver optimal and predictable financial flows, especially in a context where carbon prices could remain volatile. On the other hand, compared with direct funding by governments, such financing mechanism may be seen as less discretionary – and, therefore, more credible – and more acceptable to the electorates of developing countries. Should earmarking be pursued, one option might be to phase it out gradually as other financing arrangements through the overall budgets of governments in developed countries are put in place.4
________
1. The Climate Investment Funds were launched with financial contribution from the United States, the United Kingdom and Japan. They comprise two funds that will operate in the areas of mitigation, technology transfers and – to a lesser extent – adaptation: i) the Clean Technology Fund, to support the demonstration, deployment and transfer of technologies to cut emissions of GHGs and other pollutants; and, ii) the Strategic Climate Fund, which will include programmes for climate resilience, greening energy access and sustainable forest\significant bilateral initiatives have been taken by the United Kingdom (ETF-IW), Germany (International Climate Initiative), Australia (IFCI), Spain (UNDP-Spain MDG Achievement Fund) and the European Commission (GCCA). See UNFCCC (2009) for details.
3. The largest recent bilateral initiatives in this area include Norway’s Climate and Forest Initiative and the Brazilian Development Bank’s Amazon Fund, which combined have over $US2 and 1 billion under management, respectively, and have pledged over $US0.4 and 0.1 billion in annual funding for the coming years. Multilateral financing through the UN-REDD Programme and the World Bank’s Forest Carbon Partnership Facility is comparatively very small (less than $US0.35 billion under management overall).
4. Another issue which has been raised in the context of the Mexico Proposal is whether emission cuts achieved through the Fund should yield CERs. This might raise serious additionality concerns, however, as the certification authority would have to check additionality not with respect to business-as-usual emissions, but rather relative to a situation where these cuts might have been partly achieved via the CDM – which will itself continue to raise an additionality issue, even in a scaled-up form.
9.1.2. Ensuring continued support for developing countries as mitigation actions are enhanced over time
115. Over time, international financing mechanisms will have to evolve in a way that encourages developing countries take on enhanced GHG mitigation actions. Such actions may include, for instance, some gradual tightening of the sectoral and/or national baselines negotiated in the context of scaled-up CDMs, followed by their conversion into binding sectoral caps. This evolution could be supported by international financial flows if little ambitious sectoral caps were set initially, and were met through the creation of domestic sectoral ETS that would be linked to economy-wide ETS in developed countries.
ECO/WKP(2009)42
61
116. A further step towards enhanced mitigation actions in emerging countries would be the adoption of national caps. Financial incentives for such evolution could be shaped through the allocation of emission reduction commitments across countries, which creates a disconnection between who takes action – ensuring mitigation action takes place wherever it is least cost – and who pays for that action. Allocation rules could therefore be designed to shift at least some of the burden of the costs of action away from developing countries and/or countries that may have only limited participation incentives. To explore how the gains from participation in a world agreement could vary across alternative rules, the illustrative 550 ppm CO2eq scenario considered earlier in this paper is run using the WITCH model under six simple rules: i) full permit auctioning (equivalent to a world carbon tax); ii) grandfathering, under which emission rights are allocated based on each country’s share of global emissions in 2005; iii) a per capita rule, under which the same amount of allowances is granted to every human being; iv) an ability-to-pay rule that allocates allowances every year to each human being in inverse proportion to its GDP per capita ratio vis-à-vis the world average;66 v) a “historical responsibility“ rule that grants allowances to each region in inverse proportion to its contribution (in per cent) to cumulative world CO2 emissions over the period 1900-2004 (Figure 9.1);67 and, vi) a “BAU” rule under which the amount of allowances allocated to non-Annex I regions covers their projected BAU emissions, close to what would happen under a well-functioning crediting mechanism with generous baselines. The latter rule implies that Annex I regions set their cap at whatever level is required to meet the 550 ppm CO2eq target – implying a negative emission level objective by 2035, given the fast projected BAU emission growth in most developing countries.68
[Figure 9.1. Contribution of each world region to cumulative world emissions over 1900-2004]
117. The costs and gains from international mitigation action are found to vary drastically across alternative allocation rules for each world region, reflecting the wide variance in the sign and magnitude of their net permit exports (Figures 9.2 and 9.3). By 2050, compared with a full permit auctioning (or equivalent to a world carbon tax) scenario, developed regions and non-EU Eastern Europe (including Russia) are projected to lose significantly under the historical responsibility and (even more so) “BAU” allocation rules (Figure 9.2, Panel A). Both rules also become increasingly stringent over time (Figure 9.2, Panel B). By contrast, developed regions and non-EU Eastern Europe (including Russia) gain from grandfathering (relative to full permit auctioning).
[Figure 9.2. The impact of permit allocation rules on the costs of mitigation action, Annex I regions]
118. Conversely, developing countries gain most from ”BAU” and (to a lesser extent) historical responsibility allocation rules, with the exception of Africa which benefits most from an ability-to-pay rule, due to low-income-per capita levels. An equal-per-capita rule benefits South Asia (including India) but not China, reflecting faster projected demographic growth and lower carbon intensity in the former region.69 Overall, given the heterogeneity of outcomes across alternative scenarios, there may be room for
66. There is not straightforward way to implement an ability-to-pay rule in practice. Here, this is achieved in
three steps. In a first step, the amount Xi of world allowances that each region i would receive if allocation was proportional to the ratio of GDP per capita to the world average is computed as (total world allowances/world population)*(GDP per capita of region i / average world GDP per capita)*(population of region i). In a second step, the inverse (1/ Xi) of this amount is computed for each region. Unlike the sum of Xi, the sum of (1/ Xi) is not equal to total world emissions. Therefore, in a third step, a normalisation is applied, i.e. each region’s share (in %) of total world allowances is computed as (1/ Xi)/[�i(1/ Xi)].
67. This also requires a “normalisation” along the lines of that used for the ability-to-pay rule.
68. The overall Annex I cap is assumed to be then allocated across Annex I regions on a per-capita basis.
69. One result not shown here is that compared with a BAU scenario, developing regions incur smaller mitigation costs (as a per cent of BAU consumption, broadly defined to include the market and non-market
ECO/WKP(2009)42
62
achieving a given set of transfers – and, therefore, a given distribution of mitigation costs across countries – through a combination of these simple allocation rules.
[Figure 9.3. The impact of permit allocation rules on the costs of mitigation action, non-Annex I regions]
9.2. Broadening political support for action through R&D, technology transfer and adaptation financing arrangements
119. Other tools available to support and build wider participation in global mitigation action include support for R&D, frameworks to support international technology transfer and deployment, and financing for adaptation.
9.2.1. Building a framework to support technology transfer and diffusion
120. Scaling up the demonstration, transfer and deployment of emission-reducing technologies across countries will be needed both to mitigate climate change at least cost. Three major channels through which technologies diffuse internationally are international trade, FDI and licensing (Maskus, 2000, 2004).70 While data on international transfers of low-carbon technologies through each of these three channels are scarce or inexistent, one indirect, imperfect but fairly comprehensive indicator can be derived from international patent data, on the ground that an innovating firm patents its invention only where it plans to exploit it commercially (for some discussion and justification, see OECD, 2008a). Recent OECD work in this area highlights two main stylised facts (Dechezleprêtre et al. 2008; OECD, 2008a):
• Developed countries account for the bulk of innovation in low-carbon technologies, with the United States, Japan and Germany patenting over two-thirds of world inventions. However, large emerging countries such as China are already among the leaders in some areas (Table 9.1, and Brewer, 2007). By contrast, least-developed countries are neither inventors nor recipients, and appear to face the most acute barriers to technology transfers (see below). There is, therefore, wide heterogeneity across developing countries themselves.
• International transfers of patented low-carbon technologies have yet to pick up significantly. While the rate of technology transfer for climate mitigation technologies – as measured by the share of inventions that are patented at least in two countries (for some justification of this indicator, see OECD, 2008a) – has picked up since the mid-1990s, this has merely reflected the general trend towards technology internationalisation (Figure 9.4, Panel A). Furthermore, despite some significant increase since the late 1990s, north-south technology transfers remain small compared with north-north flows (Figure 9.4, Panel B).
impacts of climate change and catastrophic risks) on average across alternative rules than their developed counterparts. This reflects the larger benefits from avoided climate change in developing countries, especially in the high-damage case considered here. By 2100, all developing regions are even found to gain from international mitigation action regardless of the allocation rule, compared with a BAU scenario. However, as stressed in Section 2, countries might gain from an agreement but still not have sufficient incentives to participate if the gain from opting out is perceived to be larger. Such free-riding incentives cannot be explored under alternative permit allocation rules, because the WITCH model can only be run in cost-effective mode in this case (see Box 1 and Bosetti et al. 2009b). Free-riding analysis requires the model to be run in cost-benefit mode, because one determinant of a country’s decision to join a coalition is the optimal emission target the (remaining) coalition would set if it decided to stay outside.
70. Other important channels include inter alia: uncompensated imitation, e.g. through reverse engineering; the international mobility of qualified personnel; information collected from patent applications, professional journals etc.
ECO/WKP(2009)42
63
[Table 9.1. Top 10 inventors of climate-related technologies, 1998-2003]
[Figure 9.4. International technology transfer trends, 1978-2008]
121. The case for public intervention to facilitate international technology transfer and deployment rests on two main grounds: i) a number of market imperfections and policy distortions in recipient countries may prevent profitable technological opportunities from being taken up; and, ii) financial support to technology transfers and deployment is one among several policy devices available to lower the mitigation policy costs incurred by developing countries, and thereby to facilitate their participation to an international agreement. However, policy makers should proceed carefully in this area, as forcing technology diffusion through policy is not necessarily a cost-effective way to reduce GHG emissions (see e.g. Stoneman and Diederen, 1994). Cross-country differences in the take-up of advanced technologies partly reflect structural factors, including firm size, expected returns and risks from the technology adopted, market structure, access to information, production factor quantities and prices (e.g. existence of natural resources that allow penetration of renewables), human capital, the existence of complementary infrastructure (e.g. gas or CO2 transport pipelines) and/or R&D (for a survey and some analysis of policy implications in a climate mitigation policy context, see e.g. Blackman, 1999). For instance, lower prices of labour relative to capital justify at least to some extent the more limited use of labour-saving technologies in developing countries.
122. Three main types of policy distortions could be removed to facilitate international technology transfer and deployment, particularly in developing countries:
• Lack of carbon price: removing fossil fuel subsidies and pricing carbon in recipient countries would boost the adoption incentives of local firms, for instance as regards technologies such as carbon capture and storage that yield no private return and are therefore unlikely to be transferred and deployed otherwise. Pricing carbon would also encourage governments themselves to undertake measures that facilitate technology transfers, such as investment in infrastructure, human capital, or enforcement of IPRs (see below). One way – albeit an imperfect one – to provide such price incentives is through the CDM. From this perspective, scaling up the CDM along the lines discussed in Section 5 would increase financial flows and transfer technologies to developing countries on a much larger scale than under the current framework. Already today, preliminary OECD cross-country time-series analysis for 13 climate mitigation technologies and 100 countries over the period 1985-2004 finds a significant positive impact on technology transfers of the overall size of CDM projects implemented in the recipient country (Hascic and Johnstone, 2009).
• International trade and foreign direct investment barriers to climate change technology transfers: openness to international trade can facilitate the transfer and deployment of technologies embodied in goods – especially capital goods. There is room for lower tariffs – which typically exceed 15% on an ad-valorem basis for energy-efficient electrical appliances or renewable-energy products and technologies – on a wide range of goods and technologies relevant to climate change mitigation in developing countries, and for lower non-tariff barriers – at least via greater harmonisation of criteria and tests for energy-efficiency requirements – in their OECD counterparts (Steenblik, 2005; Steenblik et al. 2006).71 Furthermore, technical barriers to trade exist in a number of areas that may be reduced through harmonisation of technical standards (IEA, 2007a). Also of importance are barriers to trade in services, as the
71. Preliminary OECD research points to significant negative effects of import tariffs on international transfers
of climate mitigation technologies (Dechezleprêtre et al. 2008). More indirect evidence is in World Bank (2007), which finds that removing barriers would have large effects on international trade between developed and developing countries in renewables, “clean” coal and efficient lighting.
ECO/WKP(2009)42
64
deployment of many mitigation technologies requires a wide range of consulting, engineering or construction services (e.g. renewable power generation or energy-efficient buildings), and FDI restrictions, as multinational firms play a major role in international technology transfers. An opportunity to liberalise trade in some climate-friendly goods and services currently exists at the multilateral level within the context of the Doha Round.
• Absence or lack of enforcement of Intellectual Property Rights (IPRs): establishing and enforcing IPRs is key to providing adequate incentives for private firms to invest in climate-friendly R&D. The impact of IPRs on technology transfers is more ambiguous a priori. On the one hand, by reducing imitation, stricter IPRs have a market expansion effect, i.e. they increase patent holders’ perceived demand for their technology and therefore their incentives to license and/or undertake FDI (see e.g. Arora et al. 2001). On the other hand, overly stringent IPRs have a market power effect through which they may induce inventors to raise prices, thereby discouraging transfers (see e.g. Correa, 2005). In practice, cross-country time-series evidence suggests that stricter IPRs in recipient countries increase incoming technology transfers (see e.g. Maskus, 2004; Park and Lippoldt, 2008), including in the area of low-carbon technologies (Dechezleprêtre et al. 2008). Patent rights are currently less protected in most developing countries than in their developed counterparts (Figure 9.5). Some strengthening, along with technical assistance and financial support from developed countries, might be envisaged, e.g. in the context of international sector-wide agreements, and/or through existing or new Multilateral Funds (see Box 6 above).72 An alternative that would still maintain adequate R&D incentives might be for developed countries to cover IPR-related costs (licensing fees, royalties etc) or even buy out patents on key transferable technologies (see e.g. Newell, 2008).73
[Figure 9.5. Patent rights index, 2005]
123. International technology transfer and deployment may be hampered not only by policy distortions but also by genuine market imperfections. Therefore there seems to be a case for international support, over and above the incentives created through the international carbon market and the reduction of barriers to trade and FDI in climate-friendly goods, services and technologies. Relevant market imperfections to be addressed include:
• Learning spillovers and network externalities in the deployment of existing technologies, not least in the electricity sector (for further details, see Burniaux et al. 2008). Partly as a result, there might be a risk of locking-in high-carbon energy systems in the absence of policy intervention, as major long-term infrastructure investments are expected over the coming years in power generation, transport and buildings, notably in large developing countries (IEA, 2006, 2007b; OECD, 2008b). While renewable electricity is already heavily subsidised across most OECD countries, there may be a case for providing subsidies in key developing countries, which in some cases enjoy lower deployment costs and/or greater potential for cost declines through learning-by-doing – e.g. in solar power generation (IEA, 2005). However, in order to be cost-effective, such redeployment would have to be associated with a removal by developing countries of their existing subsidies to fossil fuel power generation.
72. This may require enhanced coordination between the UNFCCC, the World Trade Organization (WTO) –
through its Agreement on Trade-Related Aspects of Intellectual Property Rights (TRIPS) – and the World Intellectual Property Organization (WIPO).
73. Compulsory licensing has sometimes been put forward as yet another alternative in the policy debate, but compared with a strengthening of IPRs this approach would likely be more detrimental to R&D and innovation.
ECO/WKP(2009)42
65
• Information asymmetries between technology providers and recipients regarding the characteristics of the technology, which may prevent profitable transfers from being made. Buyers’ access to information might be improved through a mix of demonstration projects, advertising campaigns, labelling schemes or subsidies to technological consulting services.
• Financial market imperfections, such as short term credit constraints and the incompleteness of insurance markets to cover investment risks. These problems are magnified by existing uncertainty about future climate policy at both local and global levels, which unduly raises the costs and risks of low-carbon technology adoption. This might justify loan guarantees, which along with concessional loans and grants will for instance be one of the main financing mechanisms under the Clean Technology Fund. However, identifying financial market imperfections is not straightforward, and policy design in this area can be subject to government failure (see e.g. Adams and Von Pischke, 1992).
124. Multilateral Funds to support international technology transfers (see Box 6) may be scaled up and rationalised to address well-identified market imperfections in a technology-neutral way. Insofar as the deployment of particular technologies is to be subsidised, there is some evidence from experience with the GEF that targeting fairly mature technologies has the largest impact on international technology diffusion, possibly reflecting greater absorptive capacity for such technologies (Christoffersen et al. 2002). There may also be a (second-best) case for subsidising primarily technology diffusion to least developed countries insofar as these do not price carbon and continue to have limited access to CDM financing in the near future.
125. Finally, as a burden-sharing device, public support to international technology transfer and deployment may also go beyond addressing policy distortions and market imperfections. For instance, it might support actions that enhance framework conditions for foreign investment in developing countries, such as boosting human capital (e.g. nuclear engineer or reservoir geologist university and training programmes), infrastructure (e.g. pipeline support infrastructure to transport natural gas, biofuels or CO2, promotion of grid interconnection schemes that support renewable power generation, modal shift to public transportation in urban areas) and/or complementary R&D in the energy production sector (e.g. by offering firms in developed countries similar fiscal incentives to carry out R&D in climate mitigation technologies at home and abroad).74 One challenge with such an approach is to provide cost-effective and technology-neutral support, given the risks of government failure.
9.2.2. Support for R&D
126. Past OECD work highlights the large potential impact on global mitigation costs of R&D policies – at least of basic R&D dedicated to major new abatement options, primarily in the non-electricity sector (Burniaux et al. 2008; Bosetti et al. 2009a). While pricing carbon and setting up appropriate innovation and regulatory frameworks are key to providing the necessary incentives, this is unlikely to be enough given the magnitude of the market imperfections involved in climate change mitigation. Therefore, there is a case for specific policies aimed at boosting climate-friendly basic R&D, and given the global public good nature of mitigation, some coordination at the international level would be justified. Yet, that issue has received only limited attention thus far, at least compared with other international climate policy areas such as technology transfers and adaptation, where international policy devices have already been set up and proposals for scaling them up have proliferated. This may reflect to some extent the priority put by countries on domestic (as opposed to international collaborative) R&D policies, as well as two unfavourable political economy features of such policies: i) benefits would be reaped in the distant future
74. For recent empirical evidence on the effectiveness of such policies, see Dechezleprêtre et al. (2008).

ECO/WKP(2009)42
66
while costs would be borne upfront; and, ii) countries’ basic R&D efforts are hard to value, and thereby difficult to incorporate in the context of a global climate policy agreement.
127. Long-term and large-scale transformative technologies that entail sizeable costs and risks, and have low near-term commercial value, seem well-suited for international cost and/or task sharing, as existing collaboration in the areas of fusion power (the International Thermonuclear Experimental Reactor project) and hydrogen fuel cells (the International Partnership for the Hydrogen Economy) illustrates (see e.g. De Conninck et al. 2008).75 Such international collaboration also already exists in the form of IEA Implementing Agreements, which cover a range of climate-related technologies. These experiences could be scaled up and/or expanded to a range of other basic research fields. As regards applied R&D, one option might be to supplement the usual R&D subsidies and grants with internationally co-ordinated – e.g. through a dedicated global Fund or as an additional activity of existing Multilateral Funds – innovation inducement prizes. These would offer financial rewards to inventors for achieving pre-specified innovation objectives (Burniaux et al. 2008; National Research Council, 2007; Newell and Wilson, 2005). In any event, ways may need to be found to ensure that any increase in R&D spending at the international level is not offset by domestic R&D spending cuts. One option to avoid such crowding out might be to set country targets in terms of aggregate climate-related R&D spending levels (e.g. a given share of GDP), rather than as an increment to existing investment, and possibly to exclude private sector R&D, which may be difficult to distinguish from research in other areas (De Coninck et al. 2008).76
9.2.3. Support for developing countries to adapt to climate change
128. Some degree of climate change is already locked in due to cumulative past emissions and technologies currently in place. Countries and individuals will need to put in place approaches to adapt to these changes – i.e. to lower the damages from climate change impacts, and to take advantage of any new opportunities it presents. Least-developed countries are particularly vulnerable, both because their economies are more directly dependant on climate sensitive natural resources and due to their limited capacity to adapt to the impacts of climate change.
129. Financing the costs of adaptation of least-developed countries will likely be an important element of a post-2012 climate change agreement, and will help engage these countries in mitigation action over the longer run. A consensus around the magnitude of the overall adaptation costs, however, remains somewhat premature. This reflects serious methodological issues (e.g. lack of integrated cost-benefit analysis, including some accounting for risk, to determine optimal adaptation spending) and data limitations (e.g. lack of explicit mapping between cost estimates and specific adaptation activities, incomplete coverage, extrapolations at the global level based on local evidence) (OECD, 2008c). Bearing these caveats in mind, available estimates nevertheless point to annual adaptation costs in the developing world in the tens of billions of dollars annually over the coming decades, the bulk of which would be incurred at the time of capital stock renewal (World Bank, 2006; Stern, 2006; UNDP, 2007; UNFCCC, 2007).
130. To bridge the gap between available resources committed to adaptation and future adaptation costs, considerable efforts are being made to scale up international financing for adaptation. The operationalisation of the Adaptation Fund, whose creation was confirmed at the 2008 United Nations
75. Examples in other areas include for instance the International Space Station or the European particules
accelerator (Large Hadron Collider).
76. Provided this crowding-out effect is addressed, Barrett (2005, 2006, 2007) argues in a game-theoretic framework that international cooperation may actually be far easier to achieve in R&D than in mitigation, for instance through a built-in rule that ties each country’s contribution to a coordinated international R&D effort to that of others.
ECO/WKP(2009)42
67
Climate Change Conference in Poznan, is a significant step in this direction. The Fund is financed through a 2% levy on the sale of emission credits generated by emission-saving projects undertaken in developing countries under the CDM. The future size of the Fund will therefore partly depend on the extent to which the CDM is scaled up. While the Adaptation Fund is expected to significantly increase available resources, it may nevertheless remain small compared with adaptation financing needs. For instance, under the illustrative scenario already discussed above where Annex I countries cut their emissions by 20% by 2020, with the possibility of using up to 50% of offset credits to meet their domestic commitments, the 2% tax is found to yield just about 2005 $US 250 million by 2020, reflecting the likely low price of future CERs under successful scaling up. At the time of writing a variety of other innovative mechanisms to scale up adaptation financing are also being proposed, with many of them relying on earmarking of some share of proceeds from auction revenues from greenhouse gas emissions permits.
131. In parallel with efforts to scale up dedicated adaptation financing, significant efforts are also being made to better integrate adaptation consideration within development aid efforts, national policy and budgetary processes, sectoral and local policies (for some OECD guidance in this area, see OECD, 2009a). Although mitigation involves a clearer public good than adaptation, there is also some local – and, in some cases, even global – public good component involved in many key adaptation actions, such as the preservation of ecosystems, the protection of coastal areas and rivers, water management and supply systems, or agricultural crop research. As a result, the private sector is unlikely to deliver adequate spending on adaptation, and there is a case for government intervention. Some interventions should primarily focus on setting up market incentives for, and/or removing existing policy distortions to efficient adaptation. Examples include inter alia developing water markets and removing water use subsidies, and pricing – explicitly or, where unfeasible, implicitly through regulation – the adaptation benefits of forests (for example in terms of soil quality and watershed protection) and the services provided by ecosystems (biodiversity, landscape preservation) (OECD, 2008c). In other cases, government intervention may primarily involve increased public spending, for instance in terms of physical infrastructure investment (e.g. sea walls, flood defences), or in the context of particular institutional arrangements (e.g. catastrophe bonds to insure extreme risks, disaster relief).
132. One policy challenge at both local and international levels will be to scale up adaptation financing for least-developed countries while at the same time alleviating potential moral hazard problems. These may arise if firms, households and/or governments under-invest in adaptation action either because their climate-related risks are fully insured, or because they expect to be bailed out in the event of disaster. In an international policy context, such concerns might be alleviated for instance through fixed, “lump sum” transfers to co-finance local public spending on adaptation (infrastructure investment, catastrophe bond emissions, etc.), along with explicit “no bail-out” clauses.
9.3. Conclusions: main elements of a global post-2012 international climate policy framework
133. Countries are working together to agree how they might address climate change internationally in the post-2012 period. A broad framework for international action is expected to be agreed at the UNFCCC Conference in Copenhagen in December 2009. The main elements of the post-2012 framework will likely include:
• Enhanced actions to reduce GHG emissions by both developed countries and developing countries, reflecting the principle of common but differentiated responsibilities and respective capabilities.
• Support for appropriate GHG mitigation action in developing countries, including finance, technology and capacity development.
ECO/WKP(2009)42
68
• Measures to help countries to adapt to the climate change that is already locked-in, especially the most vulnerable least developed countries.
134. Ensuring significant and cost-effective emission reductions in a post-2012 framework will require a mix of policy instruments. A carbon price should be applied as widely as possible across the major emitting countries and sectors, preferably starting with the removal of fossil fuel subsidies. This paper has discussed the instruments and approaches that can be used to build gradually such an international carbon price, as well as the financing and support that might be provided to assist developing countries in their efforts to reduce emissions. But other policies will also be needed, such as support for R&D and technology diffusion, or targeted standards and regulations to help address market and information barriers.
135. The post-2012 international framework will need to evolve over time to reflect changes in emission sources as well as the capability of different countries to undertake mitigation action. Developed countries have indicated that they will take the lead in reducing emissions, and a number of them have already declared or suggested emission reduction targets (Box 7). As their national circumstances evolve, developing countries will need to take on enhanced mitigation action and reduce their reliance on external financing. These changing national circumstances will need to be reflected in the international framework to address climate change over time, either through mechanisms directly agreed in the post-2012 framework for the evolution of commitments, actions and support over time, or through future negotiating rounds. The future framework will need to be sufficiently flexible to adjust over time to reflect changing national circumstances, sectoral developments, and the developing understanding of the science of climate change.
136. The actions that different countries might take on, and the support that they might receive for action, are key issues that climate negotiators are discussing with respect to a post-2012 framework. To ensure the political acceptability of any agreement, it will be essential to ensure a distribution of the burden of action that addresses free-riding incentives while being perceived as fair and equitable. This may imply that support for action is prioritised to those areas where it has the largest impact on world emissions and to those that need it most.
Box 7. Comparing mitigation costs and emission reductions across countries
“Common but differentiated responsibilities and respective capabilities” are a key principle of the UNFCCC and undoubtedly will guide decision-making on the commitments and actions that different countries take on to address climate change. Against this background, the aim of this box is to assess the environmental and economic impacts of different emission reduction targets or carbon prices for Annex I countries.
Based on numerical simulations with the ENV-Linkages model, Figure 9.6 shows the emissions reductions that can be achieved in a given Annex I country or region (in terms of percentage change compared to 1990 emission levels) for a series of carbon prices applied across all Annex I countries, plotted against the total cost of this action in terms of GDP loss for each country/ region.1 This exercise facilitates a comparison of the economic costs of different mitigation efforts across countries, assuming a cost-effective distribution of efforts (i.e. a uniform carbon price). It may, therefore, help inform the discussion of allocation of country commitments, along with a number of other indicators that may be relevant for deciding the distribution of the costs of global mitigation action across countries.2 Both total costs and emission reductions achieved for a given uniform carbon price vary substantially across regions. For several countries/regions (Australia and New Zealand, Canada, the United States), carbon prices of at least $US 50 per ton of CO2eq are required to have emissions return to 1990 levels by 2020. The curves reported in the Figure 9.6 diagrams show that comparability of effort across countries will depend upon the choice of metric and might imply quite different emission targets.
A similar analysis can also be used to assess the targets that Annex 1 countries have already announced or suggested.3 Table 9.2 presents two simulations showing the consequences of simulating these targets, assuming that there is limited access to CDM offsets (up to 20% of emission reduction requirements).4 The two panels indicate the results of the simulation, first without any linking between ETSs in the countries concerned (Panel A), and second with linking (Panel B, whereby carbon prices are equalised across countries at $US 44 per ton of CO2eq by 2020). Implementing these emission targets with no further action internationally would lead to a reduction in emissions in
ECO/WKP(2009)42
69
2020 of 18% in Annex I countries compared with BAU, or almost 6% below their 1990 levels.5 However, given the projected growth in BAU emissions in non-Annex I countries, world emissions in 2020 would still rise to about 23% above their 2005 levels, compared with 35% in the BAU projection. These reductions are insufficient to put emissions onto a concentration stabilisation pathway of 550 ppm CO2eq or below. Indeed, the IPCC 2007 mitigation assessment suggests that Annex I reductions of at least 10% with respect to 1990 levels would be required for such a pathway, assuming no action in non-Annex I countries before 2020 (Gupta et al. 2007). Although inter-temporal flexibility in the pathways and overshooting options might make this stabilisation target still achievable, it would be at a much higher cost after 2020.
The EU has indicated that it will take on a 20% emission reduction target compared to 1990 levels, and a -30% target if other countries take on “comparable efforts”. Although the concept of comparable effort has not yet been operationalised by the EU, the higher carbon price and associated cost in the EU, assuming no linking (Table 9.2, Panel A), suggest that the efforts made by the EU under a -30% target might be interpreted as more substantial than those of the other Annex I regions. If the EU was to apply a target of -20% emission reductions by 2020 (keeping the targets for the other regions unchanged), their resulting economic losses in 2020 would be cut to one-third compared with the -30% target scenario. This would place the EU amongst the Annex I regions with the lowest total costs of action, with marginal costs that would be comparable to the other regions. However, for the sake of comparability, the overall cost estimated for the EU should be increased to reflect the GDP loss incurred from the operation of the ETS, given that the impact of the latter over the simulation period is already incorporated into the baseline. Linking ETSs among the regions involved can also lead to similar cost savings in the EU, as the EU would import permits and thereby move a substantial part of the effort to the other regions (Table 9.2, Panel B). Linking equalises marginal costs of mitigation, and to some extent smoothes emission reductions (with respect to 1990 levels) across participating regions.
[Table 9.2 Simulation of declared or suggested country targets]
[Figure 9.6 Regional costs of an Annex I carbon tax in 2020]
________
1. This was simulated through a multilateral carbon tax in all Annex I regions and varying the level of the tax. Therefore the costs for any individual Annex I region are computed under the assumption that all other Annex I regions implement the same carbon tax and there is no carbon tax in the non-Annex I regions. Relaxing that assumption, i.e. assuming different carbon prices across countries, would generate different costs. This is because the cost of mitigation action in one particular country depends in part on the actions taken in other countries. However, further simulations show that these second-order impacts of actions by other regions are limited, and do not change the qualitative insights.
2. For an analysis of such indicators, see Karousakis et al. (2008).
3. This reflects the following assumptions regarding changes in emissions in 2020 from 1990 levels: Australia and New Zealand = 0% change in 2020 from 1990 levels [based on a weighted average of the Australian target of -60% and the New Zealand one of -50% by 2050, with an assumed linear pathway from 2005-2050]; Japan = -10% [middle estimate of the 6 scenarios of +4% to -25% being considered by the government]; Canada = 0% [equivalent to target of -20% below 2006 levels by 2020]; US = 0% [target to return to 1990 levels by 2020]; EU27 and EFTA = -30% [reflecting EU and Norwegian targets, if others take on comparable efforts]; no targets assumed for other regions.
4. In line with the other simulations it is assumed that the CDM is scaled up to include all sectors and transaction costs are ignored, i.e. the results assume a cost-effective supply of CERs.
5. The availability of the CDM implies that reductions achieved domestically are smaller than the imposed target. Linking also affects regional reductions.
ECO/WKP(2009)42
70
BIBLIOGRAPHY
Achard, F., H. Eva, P. Mayaux, H. Stibig and A. Belward (2004), “Improved Estimates of net Carbon Emissions from Land Cover Change in the Tropics for the 1990s”, Global Biogeochemical Cycles, Vol. 18, No. 2.
Adams, D. and J. von Pischke (1992), “Microenterprise Credit Programs: Déjà Vu”, World Development, Vol. 20, No. 1.
Aldy, E. and R. Stavins (2008), “Economic Incentives in a New Climate Agreement”, Issue Paper, The Harvard Project on International Climate Agreements.
Arora, A., A. Fosfuri and A. Gambardella (2001), Markets for Technology: The Economics of Innovation and Corporate Strategy, MIT Press, Cambridge, Massachussets.
Arquit Niederberger, A. and R. Fecher (2006), “Demand-side Energy Efficiency Promotion under the Clean Development Mechanism: Lessons Learned and Future Prospects”, Energy for Sustainable Development, Vol. 10, No. 4.
Babiker, M. (2005), “Climate Change Policy, Market Structure and Carbon Leakage”, Journal of International Economics, Vol. 65, No. 2.
Bakker, A., A. Arvanitakis, T. Bole, E. van de Brug, C. Doets and A. Gilbert (2007), “Carbon Credit Supply Potential Beyond 2012: A Bottom-up Assessment of Mitigation Options”, Energy Research Centre of the Netherlands Report ECN-E—07-090.
Baron, R. and S. Bygrave (2007), "Linking Tradable Permit Systems for Greenhouse Gas Emissions: Opportunities, Implications and Challenges," International Emissions Trading Association.
Baron, R. and J. Ellis (2006), “Sectoral Crediting Mechanisms for Greenhouse Gas Mitigation: Institutional and Operational Issues”, COM/ENV/EPOC/IEA/SLT(2006)4.
Baron, R., and S. Bygrave (2002), “Towards International Emissions Trading: Design Implications for Linkages”, OECD/IEA Information Paper, http://www.oecd.org/dataoecd/46/35/2766158.pdf.
Baron, R. (2000), "An Assessment of Liability Rules for International GHG Emissions Trading," OECD/IEA.
Baron, R., B. Buchner and J. Ellis (2009), “Sectoral Approaches and the Carbon Market”, OECD/IEA, Forthcoming.
Barrett, S. (2007), “A Multitrack Climate Treaty System”, in J. Aldy and R. Stavins (eds), Architectures for Agreement: Addressing Global Climate Change in the Post-Kyoto World, Cambridge University Press, Cambridge.
ECO/WKP(2009)42
71
Barrett, S. (2006), “Climate Treaties and “Breakthrough” Technologies”, American Economic Review, Vol. 96, No. 2.
Baumol, W. and W. Oates (1988), The Theory of Environmental Policy, Cambridge University Press, Cambridge.
Blackman, A. (1999), “The Economics of Technology Diffusion: Implications for Climate Policy in Developing Countries”, Resources for the Future Discussion Paper No. 99-42.
Bollen, J., B. Guay, S. Jamet and J. Corfee-Morlot (2009), “Co-benefits of Climate change Mitigation Policies: Literature Review and New Results”, OECD Economics Department Working Paper, No. 692.
Bollen, J., T. Manders and P. Veenendaal (2005): “Caps and Fences in Climate Change Policies, Trade-offs in Shaping Post-Kyoto”, MNP report 500035003/2005, Bilthoven, Netherlands.
Bollen, J., A. Gielen and H. Timmer (1999), “Clubs, Ceilings and CDM: Macroeconomics of Compliance with the Kyoto Protocol”, Energy Journal, Vol. 20, Special Issue.
Bosetti, V., C. Carraro, M. Galeotti and E. Massetti (2006), “A World Induced Technical Change Hybrid Model”, The Energy Journal, Hybrid Modeling of Energy Environment Policies: Reconciling Bottom-up and Top-down, Special Issue.
Bosetti, V., C. Carraro, R. Duval and M. Tavoni (2009a), “The Role of R&D and Technology Diffusion in Climate Change Mitigation: New Perspectives Using the WITCH Model”, OECD Economics Department Working Paper, No. 664.
Bosetti, V., C. Carraro, E. De Cian, R. Duval, E. Massetti and M. Tavoni (2009b), “The Incentives to Participate in and the Stability of International Climate Coalitions: A Game-Theoretic Analysis Using the WITCH Model”, OECD Economics Department Working Paper, Forthcoming.
Bosetti, V., E. Massetti and M. Tavoni (2007), “The WITCH Model. Structure, Baseline, Solutions”, FEEM Working Paper, 10-2007.
Bosi, M. and J. Ellis (2005), “Exploring Options for Sectoral Crediting Mechanisms”, COM/ENV/EPOC/IEA/SLT(2005)1.
Bradley, R., K. Baumert, B. Childs, T. Herzog, and J. Pershing (2007), Slicing the Pie: Sector-Based Approaches to International Climate Arrangements, Issues and Options, World Resources Institute, Washington D.C.
Brewer, T. (2007), “Climate Change Technology Transfer: International Trade and Investment Policy Issues in the G8+5 Countries”, Paper prepared for the G8+5 Climate Change Dialogue.
Brown, S., T. Pearson, D. Slaymaker, S. Ambagis, N. Moore, D. Novelleo and W. Sabido (2005), “Creating a Virtual Tropical Forest from Three Dimentional Aerial Imagery: Application for Estimating Carbon Stocks”, Ecological Applications, Vol. 15, No. 3.
Burniaux, J-M. and J. Chateau (2008), “An Overview of the OECD ENV-Linkages Model”, OECD Economics Department Working Paper No. 653, Paris.
ECO/WKP(2009)42
72
Burniaux, J-M. J. Chateau, R. Duval and S. Jamet (2008), “The Economics of Climate Change Mitigation: Policies and Options for the Future”, OECD Economics Department Working Paper, No. 658.
Capoor, K. and P. Ambrosi (2008), State and Trends of the Carbon Market 2008, The World Bank, Washington.
Carraro, C., J. Eyckmans and M. Finus (2006), “Optimal Transfers and Participation Decisions in International Environmental Agreements”, Review of International Organisations, Vol. 1, No. 4.
Chander, P. and H. Tulkens (2008), “Cooperation, Stability and Self-Enforcement in International Environmental Agreements: A Conceptual Discussion”, in R. Guesnerie (ed.) The Design of Climate Policy, MIT Press, Cambridge, Massachussets.
Chander, P. and H. Tulkens (2007), “Climate Coalitions: A Theoretical and Computational Appraisal”, Département des Sciences Économiques de l’Université Catholique de Louvain Discussion Paper No. 2007-6.
China (2009), “China’s Views in the Fulfillment of the Bali Action Plan and the Components of the Agreed Outcome to be Adopted by the Conference of the Parties at its 15th Session”, Working Paper, February.
Christoffersen, L., O. Davidson, M. Donoso, J. Fargher, A. Hammond, E. Hooper, T. Mathew and J. Seyani (2002), The First Decade of the GEF: Second Overall Performance Study, Global Environment Facility, Washington D.C.
Correa, C. (2005), “Can the TRIPS Agreement Foster Technology Transfer to Developing Countries? “, in K. Maskus and J. Reichman (eds), International Public Goods and Transfer of Technology under a Globalized Intellectual Property Regime, Cambridge University Press, Cambridge.
De Bruin, K., R. Dellink and S. Agrawala (2009), “Economic Aspects of Adaptation to Climate Change: Integrated Assessment Modelling of Adaptation Costs and Benefits”, OECD Environment Working Paper, No. 6.
Dechezleprêtre, A., M. Glachant, I. Hascic, N. Johnstone and Y. Menière (2008), “Invention and Transfer of Climate Change Mitigation Technologies on a Global Scale: A Study Drawing on Patent Data”, mimeo, Mines ParisTech / CERNA / Agence Française de Developpment.
De Conninck, H., C. Fischer, R. Newell and T. Ueno (2008), “International Technology-Oriented Agreements to Address Climate Change”, Energy Policy, Vol. 36, No. 1.
De Fries, R., M. Hanssen, C. Field, D. Skole and J. Townshend (2002), “Carbon Emissions from Tropical Deforestation and Regrowth Based on Satelite Observations for the 1980s and 1990s” PNAS, Vol. 99, No. 22.
De Fries, R., G. Asner, F. Achard, C. Justice, N. LaPorte, K. Price, C. Small and J. Townshend (2005), “Monitoring tropical deforestation for emerging carbon markets” in P. Mountinho and S. Schwartzman (Editors), Tropical Deforestation and Climate Change, IPAM and Environmental Defense, Belem, Brasil and Washington D.C., USA.
Dixon, A., N. Anger, R. Holden and E. Livengood (2008), Integration of REDD into International Carbon Market: Implications for Future Commitments and Market Regulations, Report prepared for the New Zealand Ministry of Agriculture and Forestry.
ECO/WKP(2009)42
73
ECCP (2007), European Climate Change Platform Meeting Report, October.
Edenhofer, O., Flachsland, C. and R. Marschinski (2007), “Towards a Global CO2 Market: An Economic Analysis”, Potsdam Institute for Climate Impact Research.
Eliasch, J. (2008), Eliasch Review - Climate Change: Financing Global Forest, The Stationery Office Limited on behalf of the Controller of Her Majesty's Stationery Office Surrey.
Ellis, J. and S. Kamel (2007), “Overcoming Barriers to Clean Development Mechanism Projects”, COM/ENV/EPOC/IEA/SLT(2007)3.
Ellis, J. and D. Tirpak (2006), “Linking GHG Emission Trading Systems and Markets,” OECD/IEA, http://www.oecd.org/dataoecd/45/35/37672298.pdf.
Ellis, J (2006), “Issues Related to a Programme of Activities under the CDM”, COM/ENV/EPOC/IEA/SLT(2006)3.
Fearnside, P. (2000), “Global Warming and Tropical Land-Use Change: Greenhouse Gas Emissions from Biomass Burning, Decomposition and Soils in Forest Conversion, Shifting Cultivations and Secondary Vegetation”, Climatic Change, Vol. 46, No. 1.
Figueres, C. and M. Philips (2007), “Scaling up Demand-side energy Efficiency Improvements through Programmatic CDM”, ESMAP Technical Paper No. 120/07, Carbon Finance Unit, World Bank.
Finus, M., E. van Ierland and R. Dellink (2006), “Stability of Climate Coalitions in a Cartel Formation Game”, Economics of Governance, Vol. 7, No. 3.
Fischer, C., H. Jacoby and R. Morgenstern (2005), “Comparing National Commitments in a Fragmented Policy World: A Draft Research Outline”, Paper presented at the Climate Policy Network Meeting, 12-14 September, Sardinia, Italy.
Flachsland, C., R. Marschinski, and O. Edenhofer (2008), "Global Trading versus Linking: Architectures for Internation Emissions Trading," Potsdam Institute for Climate Impact Research.
Flachsland, C., O. Edenhofer, M. Jakob, and J. Steckel (2008), "Developing the International Carbon Market: Linking Options for the EU ETS," Potsdam Institute for Climate Impact Research.
Geres, R. and A. Michaelowa (2002), “A Qualitative Method to Consider Leakage Effects from CDM and JI projects”, Energy Policy, Vol. 30, No. 6.
Gollier, C. (2002), “Discounting an Uncertain Future”, Journal of Public Economics, Vol. 85, No. 2.
Grieg-Gran, M. (2006), “The Costs of Avoiding Deforestation”, Report prepared for the Stern Review of the Economics of Climate Change, International Institute for Environment and Development, London.
Grieg-Gran, M. (2008), “The Cost of Avoiding Deforestation”, Update of the Report prepared for the Stern Review of the Economics of Climate Change International Institute for Environment and Development, London.
Grubb, M. and K. Neuhoff (2006), “Allocation and Competitiveness in the EU Emissions Trading Scheme: Policy Overview”, Climate Policy No. 6, Vol. 1.
ECO/WKP(2009)42
74
Gupta, S., D. Tirpak, N. Burger, J. Gupta, N. Höhne, C. Kolstad, J. Kruger, A. Michaelowa, S. Murase, J. Pershing, T. Saijo, and A. Sari (2007), “Policies, Instruments and Co-operative arrangements”, in B. Metz, O. Davidson, P. Bosch, R. Dave and L. Meyer (eds.), Climate Change 2007: Mitigation. Contribution of Working Group III to the Fourth Assessment Report of the Inter-governemental Panel on Climate Change, Cambridge University Press, Cambridge. Grainger, A. (2008), “Difficulties in Tracking the Long-Term Global Trend in Tropical Forest Area”, PNAS, Vol. 105, No. 2.
Hahn, R. W. (1984), “Market Power and Transferable Property Rights.” Quarterly Journal of Economics, Vol.99, No.4.
Haites, E., and F. Mullins (2001), “Linking Domestic and Industry Greenhouse Gas Emission Trading Systems”, EPRI, IEA and IETA report.
Haites, Erik, and Xueman Wang (2006), “Ensuring the Environmental Effectiveness of Linked Emissions Trading Schemes”, http://www.margaree.ca/papers/Linking%20Trading%20Schemes-2006-05.pdf.
Hall, D., M. Levi, W. Pizer and T. Ueno (2008), “Policies for Developing Country Engagement”, Harvard Project on International Climate Agreements Discussion Paper No. 2008-15, Cambridge, Massachussets.
Hanemann, M. (2009), “The Economics of Climate Change Reconsidered”, mimeo.
Harrod, R. (1948), Towards a Dynamic Economics: Some Recent Developments of Economic Theory and Their Application to Policy, London: MacMillan.
Hascic, I. and N. Johnstone (2009), “The Kyoto Protocol and International Technology Transfer: An Empirical Analysis Using Patent Data”, mimeo.
Helm, C. (2003), “International Emissions Trading with Endogenous Allowance Choices”, Journal of Public Economics Vol. 87.
Hertel, T., S. Rose and R. Tol (2008), “Land Use in Computable General Equilibrium Models: An Overview” In: T. Hertel, S. Rose and R. Tol (eds.), Economic Analysis of Land Use in Global Climate Change Policy.
Hinostroza, M., C. Cheng, X. Zhu, J. Fenham, C. Figueres and F. Avendano (2007), « Potentials and Barriers for End-Use Energy Efficiency Under Programmatic CDM”, CD4CDM Working Paper No. 3, UNEP RISO Centre.
Hourcade, J.C. and P. Shukla (2001), “Global, Regional and National Costs and Ancillary Benefits of Mitigation”, in IPCC (eds.), Third Assessment Report of the Intergovernmental Panel on Climate Change, Cambridge University Press, New-York.
Houghton, R.(1999), “The Annual Net Flux of Carbon to the Atmosphere from Changes in Land Use 1850-1990”, Tellus B, Vol. 51, No. 2.
Houghton, R. (2003), “Revised Estimates of the Annual Net Flux of Carbon to the Atmosphere from Changes in Land Use and Land Management 1850-2000”, Tellus B, Vol. 55, No. 2.
Houghton, R. (2008), “Carbon Flux to the Atmosphere from Land-Use Changes: 1850-2005”, in TRENDS: A Compendium of Data on Global Change. Carbon Dioxide Information Analysis Center, Oak Ridge National Laboratory, U.S. Department of Energy, Oak Ridge, Tenn., USA.
ECO/WKP(2009)42
75
IEA (2007a), International Standards to Develop and Promote Energy Efficiency and Renewable Energy Sources, Paris.
IEA (2007b), World Energy Outlook, Paris.
IEA (2006), World Energy Outlook, Paris.
IEA (2005), Deploying Climate-Friendly Technologies through Collaboration with Developing Countries, Paris.
IEA(1999), World Energy Outlook, Looking at Energy Subsidies: Getting the Prices Right, OECD/IEA, 1999.
Ignaciuk A. (2009), “Emissions from Deforestation and Forest Degradation and their Abatement Potentials”, forthcoming, OECD, Paris.
IPCC (2007), “Climate Change 2007: Mitigation of Climate Change”, Summary for policymakers, Intergovernmental Panel on Climate Change.
IPCC (2007), Fourth Assessment Report of the Intergovernmental Panel on Climate Change, Cambridge University Press, New-York.
ITTO (2002), “ITTO Guidelines for Restoration, Management and Rehabilitation of Degraded and Secondary Tropical Forests”, PS-13, International Tropical Timber Organization ITTO, Yokohama.
Jaffe, J. and R. Stavins (2007), “Linking Tradable Permit Systems for Greenhouse Gas Emissions: Opportunities, Implications, and Challenges”, IETA report.
Jamet S. and J. Corfee-Morlot (2009), “Assessing the Impacts of Climate Change: A Literature Review”, OECD Economics Department Working Papers No.693, Paris.
Jamet, S. (2009), “Carbon Price Uncertainty and Firms’ Investment Decisions: A Theoretical Analysis”, OECD Economics Department Working Papers, forthcoming, Paris.
Jotzo, F. and J. Pezzey (2007), “Optimal Intensity Targets for Greenhouse Gas Emissions Trading Under Uncertainty”, Environmental and Resource Economics, Vol. 38, No. 2.
Kallbekken, S., L. Flottorp and N. Rive (2007a), “CDM Baseline Approaches and Carbon Leakage”, Energy Policy, Vol. 35, No. 8.
Kallbekken, S. (2007b), “Why the CDM will Reduce Carbon Leakage”, Climate Policy, Vol. 7, No. 3.
Karousakis, K., B. Guay and C. Philibert (2008), “Differentiating Countries in terms of Mitigation Commitments, Actions and Support”, COM/ENV/EPOC/IEA/SLT(2008)2.
Karousakis, K. and J. Corfee-Morlot (2007), “Financing Mechanisms to Reduce Emissions from Deforestation: Issues in Design and Implementation”, OECD/IEA, Paris.
Keeler, A. and A. Thompson (2008), “Industrialized-Country Mitigation Policy and Resource Transfers to Developing Countries: Improving and Expanding Greenhouse Gas Offsets”, Discussion Paper 2008-05, Harvard Project on International Climate Agreements, Cambridge, Massachussets.

ECO/WKP(2009)42
76
Keohane, R. and K. Raustiala (2008), “Toward a Post-Kyoto Climate Change Architecture: a Political Analysis”, The Harvard Project on International Climate Agreements Discussion Paper No. 08-01.
Kindermann, G., M. Obersteiner, E. Rametsteiner and I. McCallum (2006), “Predicting the Deforestation Trend under Different Carbon Prices”, Carbon Balance and Management, Vol. 1, No. 15.
Kindermann, G., M. Obersteiner, B. Sohngen, J. Sathaye, K. Andrasko, E. Rametsteiner, B. Schlamadinger, S. Wunder and R. Beach (2008), “Global Cost Estimates of Reducing Carbon Emissions through Avoided Deforestation”, PNAS, Vol. 105, No. 30.
Kolstad, C. (2006), “The Simple Analytics of Greenhouse Gas Emission Intensity Reduction Targets”, Energy Policy, Vol. 33, No. 17.
Malhi, Y. and J. Grace (2000), “Tropical Forest and Atmospheric Carbon Dioxide”, Trends in Ecology and Evolution, Vol. 15, No. 8.
Marcu, M. and W. Pizer (eds.) (2003), “Special Supplement on Defining and Trading Emission Targets”, Climate Policy, Vol. 3, Supplement 2.
Maskus, K. (2004), “Encouraging International Technology Transfer”, ICSTD/UNCTAD Issue Paper No. 7, UNCTAD-ICSTD Project on IPRs and Sustainable Development.
Maskus, K. (2000), Intellectual Property Rights in the Global Economy, Institute for International Economics, Washington D.C.
McKibbin W (2007),“Climate Change Policy: From National to International”, 2006 Sir Lesley Melville Lecture. Lowy Institute for International Policy Perspectives.
McKibbin, W. and P. Wilcoxen (2006), "A Credible Foundation for Long-Term International Cooperation on Climate Change," Lowy Institute.
McKinsey & Company (2009), “Pathways to a Low-Carbon Economy: Version 2 of the Global Greenhouse Gas Abatement Cost Curve”, McKinsey & Company.
Mexico (2008), “World Climate Change Fund (Green Fund): Mexico’s Proposal under the Bali Action Plan”, Working Paper, 5 June.
Mollicone, D., F. Archard, H. Eva, A. Belward, S. Federici, A. Lumicisi, V. Risso, H-J. Stibig and R. Valentini (2003), “Land Use Change Monitoring in the Framework of the UNFCCC and its Kyoto Protocol”, Report on Current Capabilities of Satellite Remote Sensing Technology, European Community Luxembourg.
Müller, B. (2008), “International Adaptation Finance: The Need for an Innovative and Strategic Approach”, Oxford Institute for Energy Studies EV42.
Nagashima, M., R. Dellink, E. van Ierland and H-P. Weikard (2008), “Stability of International Climate Coalitions – A Comparison for Transfer Schemes”, Ecological Economics, Vol. 8, No. 4.
National Research Council (2007), Innovation inducement prizes at the National Science Foundation, National Academies Press, Washington D.C.
ECO/WKP(2009)42
77
Nepstad, D., B. Soares-Filho, F. Merry, P. Moutinho, H. Rodrigues, M. Bowman, S. Schwartzman, O. Almeida and S. Riviero (2007), “The Costs and Benefits of Reducing Carbon Emissions from Deforestation and Forest Degradation in the Brazilian Amazon”, Woods Hole Research, Falmouth, MA.
New Carbon Finance (2009), “The Impact of Forestry on the Global Carbon Market”, 25th February 2009.
Newell, R. (2008), “International Climate Technology Strategies”, Harvard Project on International Climate Agreements Discussion Paper No. 2008-12, Cambridge, Massachussets.
Newell, R. and N. Wilson (2005), “Technology Prizes for Climate change Mitigation”, Resources for the Future Discussion Paper No. 05-33.
Nordhaus, W. (2007), “A Review of the Stern Review on the Economics of Climate Change”, Journal of Economic Literature, Vol. 45, No. 3.
Nordhaus, W. and J. Boyer (2000), Warming the World: Economic Models of Global Warming, MIT Press, Cambridge, Massachussets.
OECD (2008), Climate Change Mitigation: What Do We Do?
OECD (2008a), “Eco-innovation: Environmental Policy Design and Technology Transfer”, ENV/EPOC/WPNEP(2008)6.
OECD (2008b), “Infrastructure Investment: Links to Growth and the Role of Public Policies”, ECO/CPE/WP1(2008)17.
OECD (2008c), “Economic Aspects of Adaptation to Climate Change: An Assessment of Costs, Benefits and Policy Instruments”, ENV/EPOC/GSP(2008)7.
OECD (2008d), “Draft OECD Guidance on Integrating Climate Change Adaptation into Development Co-operation”, COM/ENV/EPOC/DCD/DAC(2008)2/REV1.
OECD (2007), Financial Market Trends, No. 94, Paris.
OECD (2001), “The Commitment Period Reserve”, Information Paper, COM/ENV/EPOC/IEA/SLT(2001)13, http://www.oecd.org/dataoecd/50/20/2468753.pdf.
OECD(1999), Action Against Climate Change: The Kyoto Protocol and Beyond, OECD, 1999.
Ogonowski M., N. Helme, D. Movius and J. Schmidt (2007), “Reducing Emissions from Deforestation and Degradation: The Dual Markets Approach”, Center for Clear Air Policy, August.
Park, W., and D. Lippoldt (2008), “Technology Transfer and the Economic Implications of the Strengthening of Intellectual Property Rights in Developing Countries”, OECD Trade Policy Working Papers No. 62.
Philibert, C., J. Ellis and J. Podkanski (2007), “Carbon Capture and Storage in the CDM”, COM/ENV/EPOC/IEA/SLT(2007)10.
Point Carbon (2007), “Issues in the International Carbon Market, 2008-2012 and beyond”, Study for New Zealand Emissions Trading Group.
ECO/WKP(2009)42
78
Pris-Cabezas, P. and N. Keohane (2008), “Reducing Emissions from Deforestation and Forest Degradation: Implications for Carbon Market”, Environmental Defense Fund, Washington D.C.
Platinga, J. and K. Richards (2008), “International Carbon Sequestration in a Post Kyoto Agreement”, Harward Kennedy School, Cambridge Massachusetts.
Ramsey, F. (1928), “A Mathematical Theory of Saving”, Economic Journal, Vol. 38, No. 152.
Rehdanz, K. and R. S.J. Tol (2005), “Unilateral Regulation of Bilateral Trade in Greenhouse Gas Emission Permits”, Ecological Economics, 54 397-416.
Reinaud, J. and C. Philibert, (2007), “Emissions trading: Trends and Prospects”, OECD/IEA, http://www.oecd.org/dataoecd/60/38/39725657.pdf.
Sathaye, J., W. Macundi, L. Dale, P. Chan and K. Andrasko (2006), “GHG Mitigation Potential Costs and Benefits of Global Forests”, Energy Journal, Vol. 27 (Multi-Greenhouse Gas Special Issue).
Sawa, (2008), “A Sectoral Approach as an Option for a Post-Kyoto Framework”, Discussion Paper 08-23, The Harvard Project on International Climate Agreements.
Schneider, L. (2007), Is the CDM Fulfilling its Environmental and Sustainable Development Objectives? An Evaluation of the CDM and Options for Improvement, Report prepared for WWF, Öko-Institut, Berlin.
Schwank, O. (2004), Concerns about CDM Projects Based on Decomposition of HFC-23 from HCFC-22 Production Sites, Infras, Zurich.
Sohngen, B., A. Golub and T. Hertel (2008), “The Role of Forestry in Carbon Sequestration in General Equlibrium Models” in: T. Hertel, S. Rose and R. Tol (eds.), Economic Analysis of Land Use in Global Climate Change Policy.
Sohngen, B. and R. Mendelsohn (2003), “An Optimal Control Model of Forest Carbon Sequestration”, Americal Journal of Agricultural Economics, Vol. 85, No. 2.
Sohngen, B., R. Mendelsohn and R. Sedjo (1999), “Forest Management, Conservation and Global Timber Market”, Americal Journal of Agricultural Economics, 81(1).
Solow, R.M. (1974), “The Economics of Resources or the Resources of Economics”, American Economic Review, Vol. 64, No. 2.
Sterk, W., M. Braun, C. Haug, K. Korytarova, and A. Scholten (2006), "Ready to Link Up? Implications of Design Differences for Linking Emissions Trading Schemes," Jet-Set Working Paper I/06; Wuppertal Institute.
Stern, N. (2007), The Economics of Climate Change: The Stern Review, Cambridge University Press, Cambridge.
Stoneman, P. and P. Diederen (1994), “Technology Diffusion and Public Policy”, Economic Journal, Vol. 104, No. 425.

ECO/WKP(2009)42
79
Strassburg, B., K. Turner, B. Fisher, R. Schaeffer and A. Lovett (2009), “Reducing Emissions from Deforestation: The ‘Combined Incentives’ Mechanism and empirical simulations”, Global Environmental Change, in press (DOI 10.1016/j.gloenvcha.2008.11.004).
Tavoni, M., B. Sohngen and V. Bossetti (2007), “Forestry and the Carbon Market Response to Stabilize Climate”. Energy Policy, Vol. 35, No. 11.
UNDP (2007), Human Development Report 2007/2008: Fighting Climate Change: Human Solidarity in a Divided World, Washington D.C.
UNFCCC (2009), Investment and Financial Flows to Address Climate Change: An Update.
UNFCCC (2007), Investment and Financial Flows to Address Climate Change: Background Paper, Bonn.
UNFCCC (2005), “Decision -/CMP.1, Modalities and Procedures for a Clean Development Mechanism as Defined in Article 12 of the Kyoto Protocol”, in UNFCCC Secretariat, COP11/MOP1, UNFCCC, Montreal.
Victor, D. G. (2001). The Collapse of the Kyoto Protocol and the Struggle to Slow Global Warming. Princeton: Princeton University Press.
Vöhringer, F., T. Kuosmanen and R. Dellink, (2006), “How to Attribute Market Leakage to CDM Projects”, Climate Policy, Vol. 5, No. 5.
Wara, W. and D. Victor, “A Realistic Policy on International Carbon Offsets”, Working Paper no.°74, Stanford University.
Weitzman, M. (2007a), “A Review of the Stern Review on the Economics of Climate Change”, Journal of Economic Literature, Vol. 45, No. 3.
Weitzman, M. (2001), “Gamma Discounting”, American Economic Review, Vol. 91, No. 1.
Weitzman, M. (1976), “The Optimal Development of Resource Pools”, Journal of Economic Theory, Vol. 12, No. 3.
Weitzman, M. (2007b), “Structural Uncertainty and the Value of Statistical Life in the Economics of Catastrophic Climate Change”, NBER Working Paper No. 13490.
Weitzman, M. (1974), "Prices vs. Quantities", Review of Economic Studies, Vol. 41(4).
World Bank (2008), “State and Trends of the Carbon Market 2008”, World Bank Institute, Washington D.C.
World Bank (2007), International Trade and Climate Change: Economic, Legal and Institutional Perspectives, The World Bank, Washington D.C.
World Bank (2006), Clean Energy and Development: Towards an Investment Framework, The World Bank, Washington D.C.
WRI (2009), Climate Analysis Indicators Tool (CAIT) Version 6.0, World Resources Institute, Washington, DC.
ECO/WKP(2009)42
80
Yohe, G. (2007), “Prepared Statement of Gary W. Yohe”, Weslyan University. U.S. Senate Committee on Resources and Energy, Full Committee Hearing: Stern Review of the Economics of Climate Change.
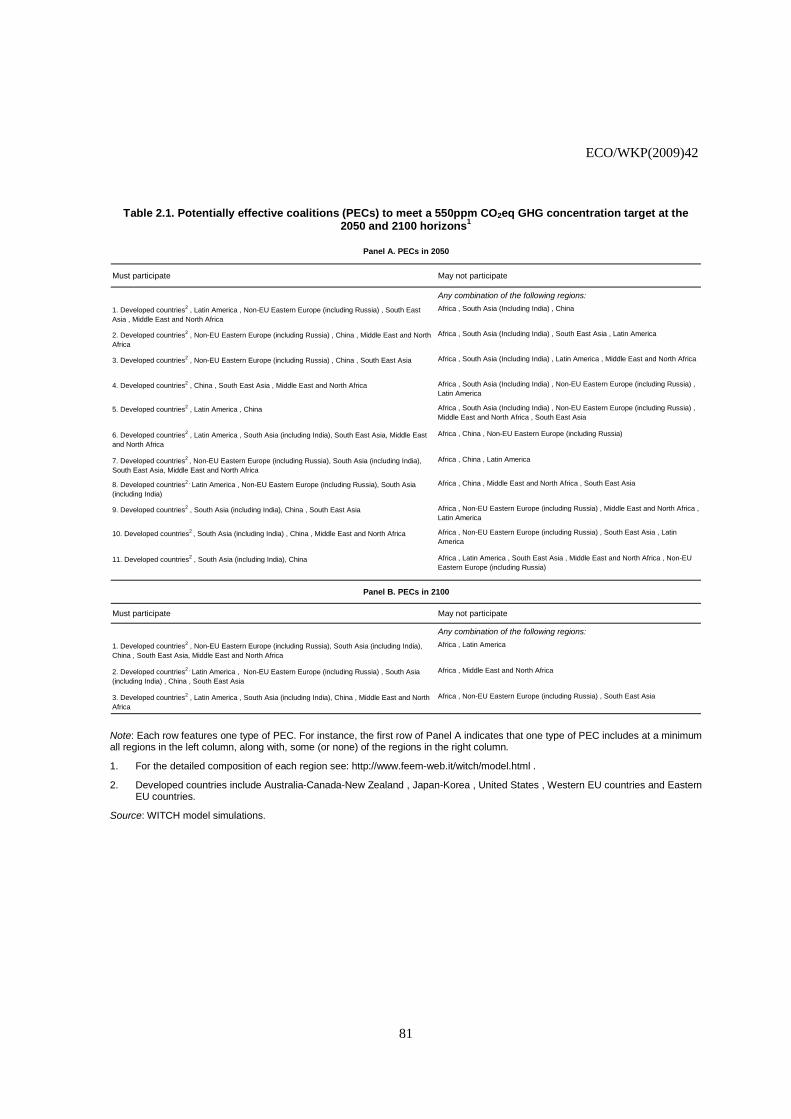
ECO/WKP(2009)42
81
Table 2.1. Potentially effective coalitions (PECs) to meet a 550ppm CO2eq GHG concentration target at the
2050 and 2100 horizons1
Panel A. PECs in 2050
Must participate May not participate
Any combination of the following regions:
1. Developed countries2 , Latin America , Non-EU Eastern Europe (including Russia) , South East Asia , Middle East and North Africa
Africa , South Asia (Including India) , China
2. Developed countries2 , Non-EU Eastern Europe (including Russia) , China , Middle East and North Africa
Africa , South Asia (Including India) , South East Asia , Latin America
3. Developed countries2 , Non-EU Eastern Europe (including Russia) , China , South East Asia Africa , South Asia (Including India) , Latin America , Middle East and North Africa
4. Developed countries2 , China , South East Asia , Middle East and North Africa Africa , South Asia (Including India) , Non-EU Eastern Europe (including Russia) , Latin America
5. Developed countries2 , Latin America , China Africa , South Asia (Including India) , Non-EU Eastern Europe (including Russia) , Middle East and North Africa , South East Asia
6. Developed countries2 , Latin America , South Asia (including India), South East Asia, Middle East and North Africa
Africa , China , Non-EU Eastern Europe (including Russia)
7. Developed countries2 , Non-EU Eastern Europe (including Russia), South Asia (including India), South East Asia, Middle East and North Africa
Africa , China , Latin America
8. Developed countries2 , Latin America , Non-EU Eastern Europe (including Russia), South Asia (including India)
Africa , China , Middle East and North Africa , South East Asia
9. Developed countries2 , South Asia (including India), China , South East Asia Africa , Non-EU Eastern Europe (including Russia) , Middle East and North Africa , Latin America
10. Developed countries2 , South Asia (including India) , China , Middle East and North Africa Africa , Non-EU Eastern Europe (including Russia) , South East Asia , Latin America
11. Developed countries2 , South Asia (including India), China Africa , Latin America , South East Asia , Middle East and North Africa , Non-EU Eastern Europe (including Russia)
Panel B. PECs in 2100
Must participate May not participate
Any combination of the following regions:
1. Developed countries2 , Non-EU Eastern Europe (including Russia), South Asia (including India), China , South East Asia, Middle East and North Africa
Africa , Latin America
2. Developed countries2 , Latin America , Non-EU Eastern Europe (including Russia) , South Asia (including India) , China , South East Asia
Africa , Middle East and North Africa
3. Developed countries2 , Latin America , South Asia (including India), China , Middle East and North Africa
Africa , Non-EU Eastern Europe (including Russia) , South East Asia
Note: Each row features one type of PEC. For instance, the first row of Panel A indicates that one type of PEC includes at a minimum all regions in the left column, along with, some (or none) of the regions in the right column.
1. For the detailed composition of each region see: http://www.feem-web.it/witch/model.html .
2. Developed countries include Australia-Canada-New Zealand , Japan-Korea , United States , Western EU countries and Eastern EU countries.
Source: WITCH model simulations.
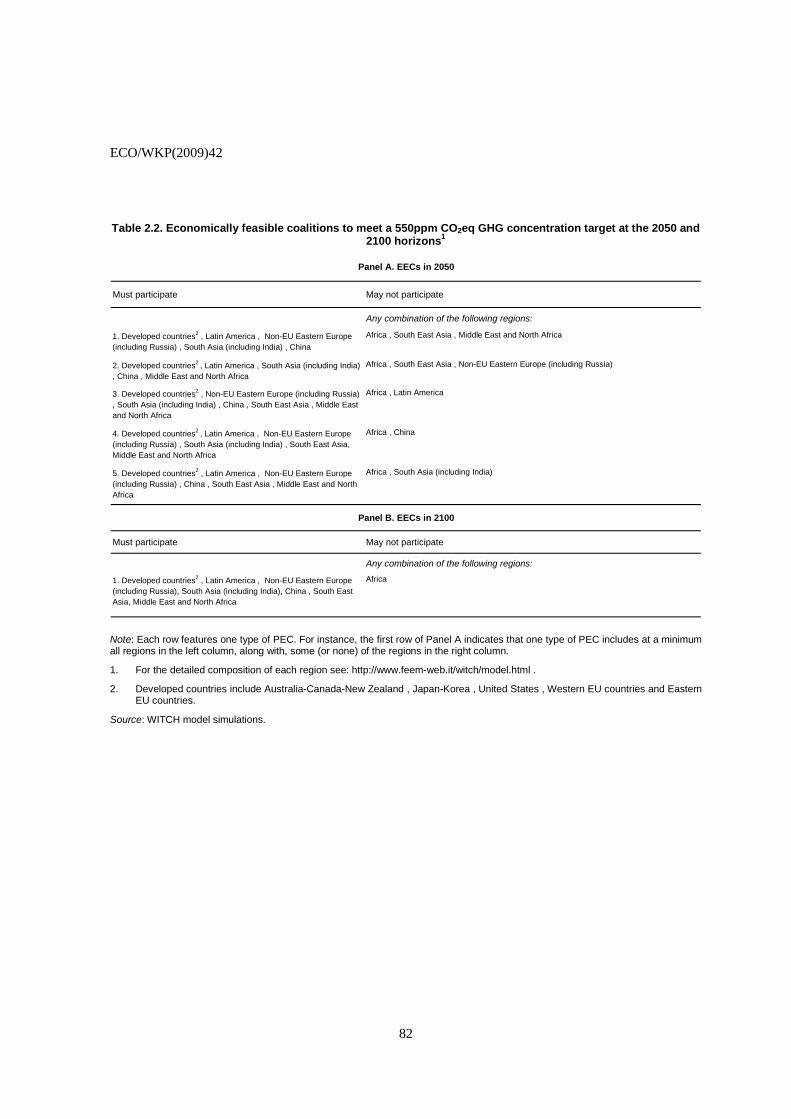
ECO/WKP(2009)42
82
Table 2.2. Economically feasible coalitions to meet a 550ppm CO2eq GHG concentration target at the 2050 and 2100 horizons1
Panel A. EECs in 2050
Must participate May not participate
Any combination of the following regions:
1. Developed countries2 , Latin America , Non-EU Eastern Europe (including Russia) , South Asia (including India) , China
Africa , South East Asia , Middle East and North Africa
2. Developed countries2 , Latin America , South Asia (including India) , China , Middle East and North Africa
Africa , South East Asia , Non-EU Eastern Europe (including Russia)
3. Developed countries2 , Non-EU Eastern Europe (including Russia) , South Asia (including India) , China , South East Asia , Middle East and North Africa
Africa , Latin America
4. Developed countries2 , Latin America , Non-EU Eastern Europe (including Russia) , South Asia (including India) , South East Asia, Middle East and North Africa
Africa , China
5. Developed countries2 , Latin America , Non-EU Eastern Europe (including Russia) , China , South East Asia , Middle East and North Africa
Africa , South Asia (including India)
Panel B. EECs in 2100
Must participate May not participate
Any combination of the following regions:
1. Developed countries2 , Latin America , Non-EU Eastern Europe (including Russia), South Asia (including India), China , South East Asia, Middle East and North Africa
Africa
Note: Each row features one type of PEC. For instance, the first row of Panel A indicates that one type of PEC includes at a minimum all regions in the left column, along with, some (or none) of the regions in the right column.
1. For the detailed composition of each region see: http://www.feem-web.it/witch/model.html .
2. Developed countries include Australia-Canada-New Zealand , Japan-Korea , United States , Western EU countries and Eastern EU countries.
Source: WITCH model simulations.
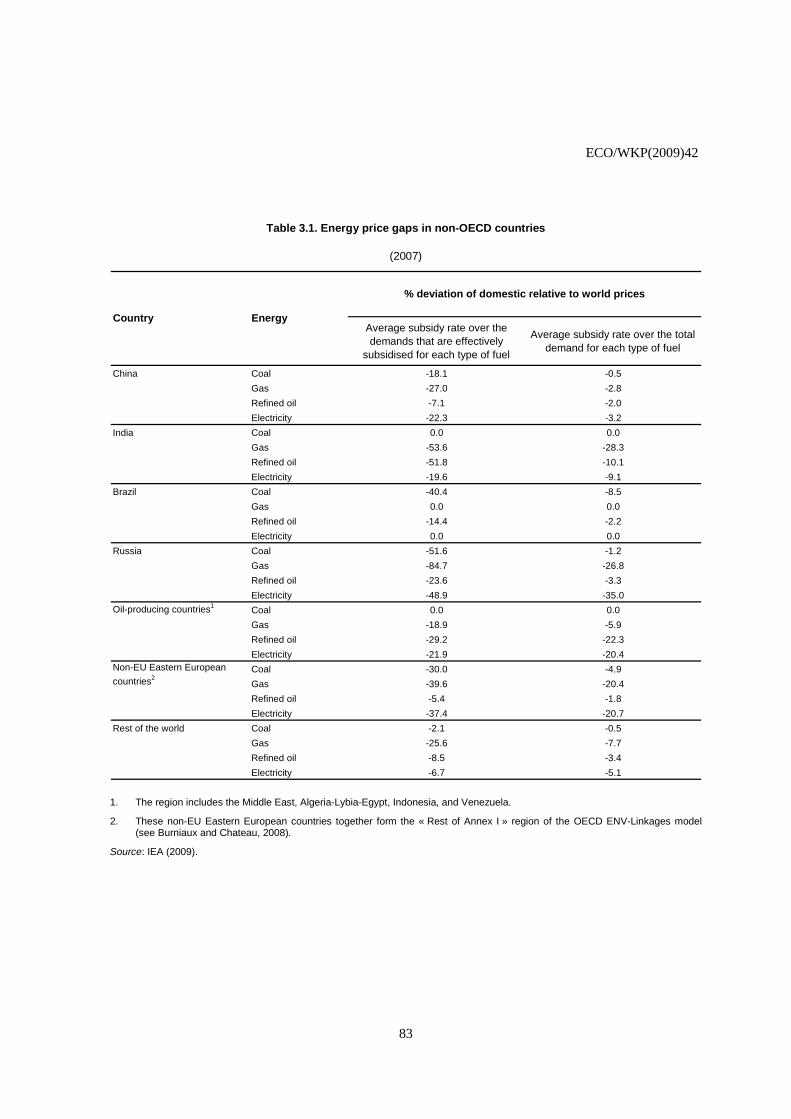
ECO/WKP(2009)42
83
Table 3.1. Energy price gaps in non-OECD countries
(2007)
Average subsidy rate over the demands that are effectively
subsidised for each type of fuel
Average subsidy rate over the total demand for each type of fuel
China Coal -18.1 -0.5
Gas -27.0 -2.8
Refined oil -7.1 -2.0
Electricity -22.3 -3.2
India Coal 0.0 0.0
Gas -53.6 -28.3
Refined oil -51.8 -10.1
Electricity -19.6 -9.1
Brazil Coal -40.4 -8.5
Gas 0.0 0.0
Refined oil -14.4 -2.2
Electricity 0.0 0.0
Russia Coal -51.6 -1.2
Gas -84.7 -26.8
Refined oil -23.6 -3.3
Electricity -48.9 -35.0
Oil-producing countries1Coal 0.0 0.0
Gas -18.9 -5.9
Refined oil -29.2 -22.3
Electricity -21.9 -20.4
Coal -30.0 -4.9
Gas -39.6 -20.4
Refined oil -5.4 -1.8
Electricity -37.4 -20.7
Rest of the world Coal -2.1 -0.5
Gas -25.6 -7.7
Refined oil -8.5 -3.4
Electricity -6.7 -5.1
Country Energy
% deviation of domestic relative to world prices
Non-EU Eastern European
countries2
1. The region includes the Middle East, Algeria-Lybia-Egypt, Indonesia, and Venezuela.
2. These non-EU Eastern European countries together form the « Rest of Annex I » region of the OECD ENV-Linkages model (see Burniaux and Chateau, 2008).
Source: IEA (2009).
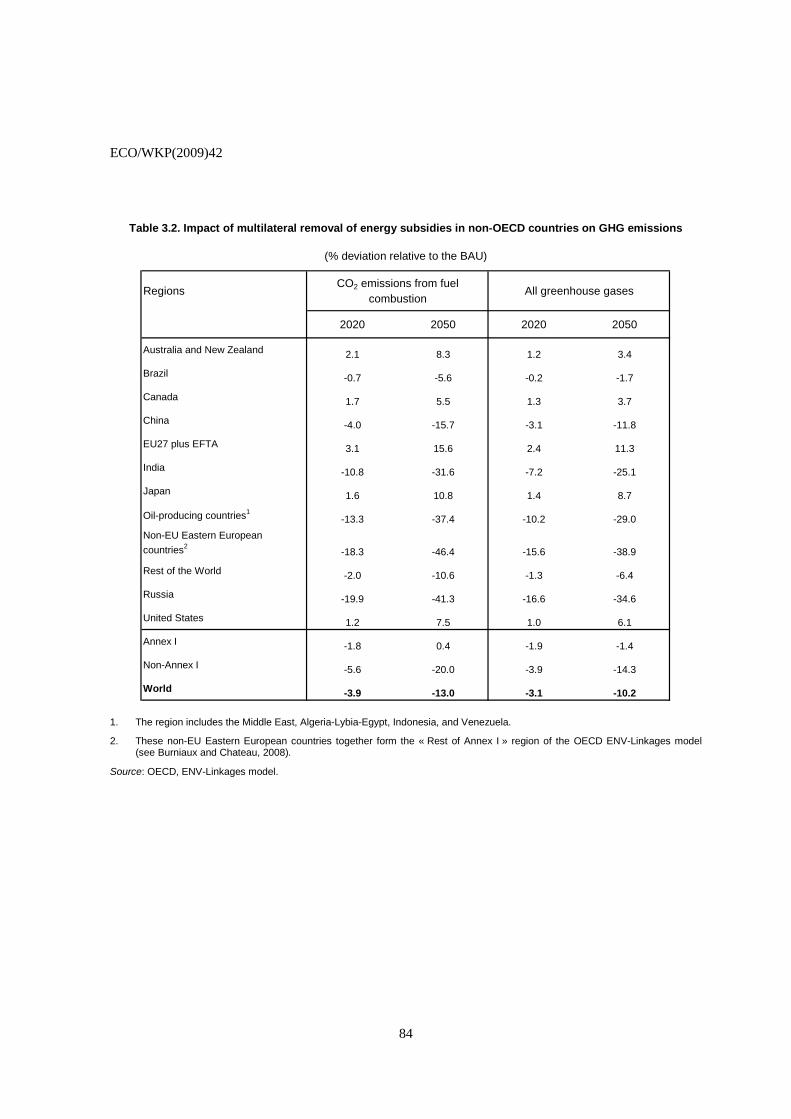
ECO/WKP(2009)42
84
Table 3.2. Impact of multilateral removal of energy subsidies in non-OECD countries on GHG emissions
(% deviation relative to the BAU)
RegionsCO2 emissions from fuel
combustionAll greenhouse gases
2020 2050 2020 2050
Australia and New Zealand 2.1 8.3 1.2 3.4
Brazil -0.7 -5.6 -0.2 -1.7
Canada 1.7 5.5 1.3 3.7
China -4.0 -15.7 -3.1 -11.8
EU27 plus EFTA 3.1 15.6 2.4 11.3
India -10.8 -31.6 -7.2 -25.1
Japan 1.6 10.8 1.4 8.7
Oil-producing countries1-13.3 -37.4 -10.2 -29.0
Non-EU Eastern European
countries2-18.3 -46.4 -15.6 -38.9
Rest of the World -2.0 -10.6 -1.3 -6.4
Russia -19.9 -41.3 -16.6 -34.6
United States 1.2 7.5 1.0 6.1
Annex I -1.8 0.4 -1.9 -1.4
Non-Annex I -5.6 -20.0 -3.9 -14.3
World -3.9 -13.0 -3.1 -10.2
1. The region includes the Middle East, Algeria-Lybia-Egypt, Indonesia, and Venezuela.
2. These non-EU Eastern European countries together form the « Rest of Annex I » region of the OECD ENV-Linkages model (see Burniaux and Chateau, 2008).
Source: OECD, ENV-Linkages model.
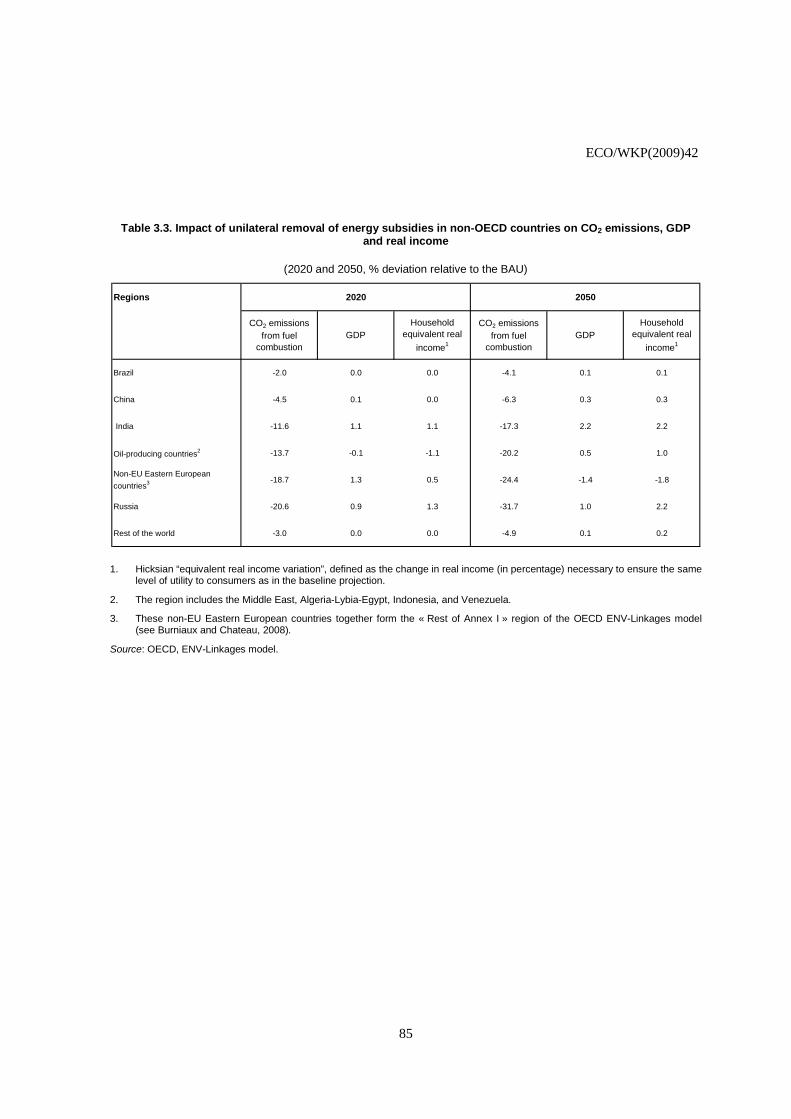
ECO/WKP(2009)42
85
Table 3.3. Impact of unilateral removal of energy subsidies in non-OECD countries on CO2 emissions, GDP and real income
(2020 and 2050, % deviation relative to the BAU)
Regions 2020 2050
CO2 emissions from fuel
combustion GDP
Household equivalent real
income1
CO2 emissions from fuel
combustion GDP
Household equivalent real
income1
Brazil -2.0 0.0 0.0 -4.1 0.1 0.1
China -4.5 0.1 0.0 -6.3 0.3 0.3
India -11.6 1.1 1.1 -17.3 2.2 2.2
Oil-producing countries2 -13.7 -0.1 -1.1 -20.2 0.5 1.0
Non-EU Eastern European
countries3 -18.7 1.3 0.5 -24.4 -1.4 -1.8
Russia -20.6 0.9 1.3 -31.7 1.0 2.2
Rest of the world -3.0 0.0 0.0 -4.9 0.1 0.2
1. Hicksian “equivalent real income variation”, defined as the change in real income (in percentage) necessary to ensure the same level of utility to consumers as in the baseline projection.
2. The region includes the Middle East, Algeria-Lybia-Egypt, Indonesia, and Venezuela.
3. These non-EU Eastern European countries together form the « Rest of Annex I » region of the OECD ENV-Linkages model (see Burniaux and Chateau, 2008).
Source: OECD, ENV-Linkages model.
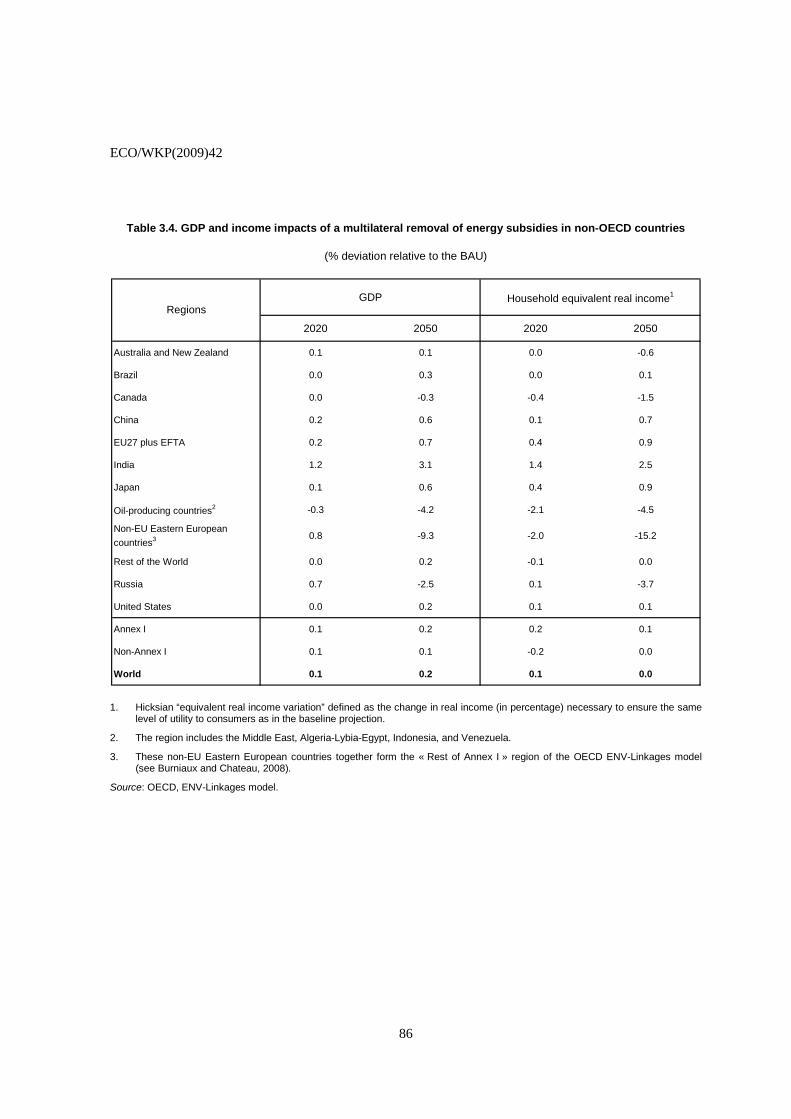
ECO/WKP(2009)42
86
Table 3.4. GDP and income impacts of a multilateral removal of energy subsidies in non-OECD countries
(% deviation relative to the BAU)
GDP Household equivalent real income1
2020 2050 2020 2050
Australia and New Zealand 0.1 0.1 0.0 -0.6
Brazil 0.0 0.3 0.0 0.1
Canada 0.0 -0.3 -0.4 -1.5
China 0.2 0.6 0.1 0.7
EU27 plus EFTA 0.2 0.7 0.4 0.9
India 1.2 3.1 1.4 2.5
Japan 0.1 0.6 0.4 0.9
Oil-producing countries2 -0.3 -4.2 -2.1 -4.5
Non-EU Eastern European
countries3 0.8 -9.3 -2.0 -15.2
Rest of the World 0.0 0.2 -0.1 0.0
Russia 0.7 -2.5 0.1 -3.7
United States 0.0 0.2 0.1 0.1
Annex I 0.1 0.2 0.2 0.1
Non-Annex I 0.1 0.1 -0.2 0.0
World 0.1 0.2 0.1 0.0
Regions
1. Hicksian “equivalent real income variation” defined as the change in real income (in percentage) necessary to ensure the same level of utility to consumers as in the baseline projection.
2. The region includes the Middle East, Algeria-Lybia-Egypt, Indonesia, and Venezuela.
3. These non-EU Eastern European countries together form the « Rest of Annex I » region of the OECD ENV-Linkages model (see Burniaux and Chateau, 2008).
Source: OECD, ENV-Linkages model.
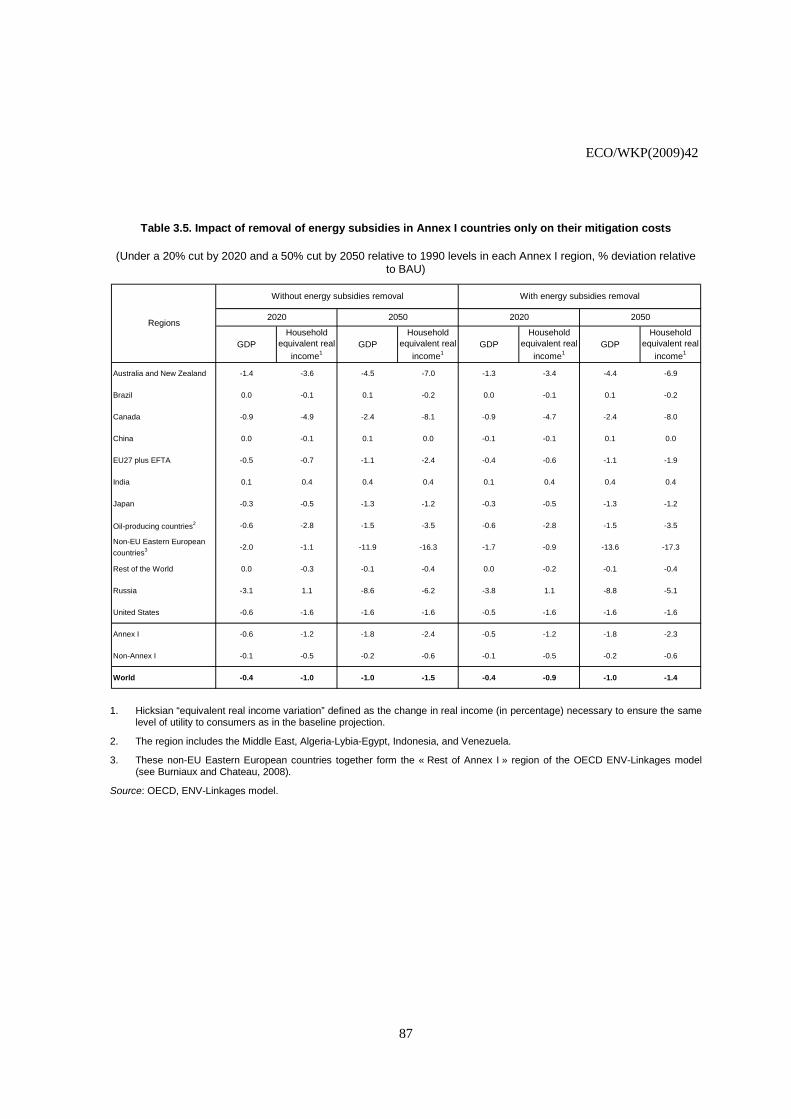
ECO/WKP(2009)42
87
Table 3.5. Impact of removal of energy subsidies in Annex I countries only on their mitigation costs
(Under a 20% cut by 2020 and a 50% cut by 2050 relative to 1990 levels in each Annex I region, % deviation relative to BAU)
GDPHousehold
equivalent real
income1 GDP
Household equivalent real
income1 GDP
Household equivalent real
income1 GDP
Household equivalent real
income1
Australia and New Zealand -1.4 -3.6 -4.5 -7.0 -1.3 -3.4 -4.4 -6.9
Brazil 0.0 -0.1 0.1 -0.2 0.0 -0.1 0.1 -0.2
Canada -0.9 -4.9 -2.4 -8.1 -0.9 -4.7 -2.4 -8.0
China 0.0 -0.1 0.1 0.0 -0.1 -0.1 0.1 0.0
EU27 plus EFTA -0.5 -0.7 -1.1 -2.4 -0.4 -0.6 -1.1 -1.9
India 0.1 0.4 0.4 0.4 0.1 0.4 0.4 0.4
Japan -0.3 -0.5 -1.3 -1.2 -0.3 -0.5 -1.3 -1.2
Oil-producing countries2 -0.6 -2.8 -1.5 -3.5 -0.6 -2.8 -1.5 -3.5
Non-EU Eastern European
countries3 -2.0 -1.1 -11.9 -16.3 -1.7 -0.9 -13.6 -17.3
Rest of the World 0.0 -0.3 -0.1 -0.4 0.0 -0.2 -0.1 -0.4
Russia -3.1 1.1 -8.6 -6.2 -3.8 1.1 -8.8 -5.1
United States -0.6 -1.6 -1.6 -1.6 -0.5 -1.6 -1.6 -1.6
Annex I -0.6 -1.2 -1.8 -2.4 -0.5 -1.2 -1.8 -2.3
Non-Annex I -0.1 -0.5 -0.2 -0.6 -0.1 -0.5 -0.2 -0.6
World -0.4 -1.0 -1.0 -1.5 -0.4 -0.9 -1.0 -1.4
With energy subsidies removal
2020 2050 2020 2050Regions
Without energy subsidies removal
1. Hicksian “equivalent real income variation” defined as the change in real income (in percentage) necessary to ensure the same level of utility to consumers as in the baseline projection.
2. The region includes the Middle East, Algeria-Lybia-Egypt, Indonesia, and Venezuela.
3. These non-EU Eastern European countries together form the « Rest of Annex I » region of the OECD ENV-Linkages model (see Burniaux and Chateau, 2008).
Source: OECD, ENV-Linkages model.

ECO/WKP(2009)42
88
Table 3.6. Impact of multilateral removal of energy subsidies on global mitigation costs (550 ppm GHG concentration stabilisation scenario) 1
(% deviation relative to the BAU)
GDPHousehold equivalent
real income2 GDP
Household equivalent
real income2 GDP
Household equivalent
real income2 GDP
Household equivalent
real income2
Australia and New Zealand 0.0 0.0 -5.7 -6.3 0.0 -0.1 -5.5 -6.0
Brazil 0.0 0.0 -2.3 -3.7 0.0 0.0 -2.1 -3.5
Canada 0.0 -0.1 -3.3 -8.8 0.0 -0.4 -3.3 -8.9
China -0.1 -0.1 -8.7 -10.0 0.1 0.0 -8.2 -9.5
EU27 plus EFTA 0.0 0.0 -0.9 -1.6 0.2 0.4 -0.8 -1.4
India 0.0 0.0 -4.0 -4.8 1.2 1.4 -2.7 -3.8
Japan 0.0 0.0 -1.3 -0.4 0.1 0.4 -1.1 -0.2
Oil-producing countries3 -0.1 -0.2 -11.1 -17.8 -0.6 -2.5 -11.9 -18.6
Non-EU Eastern European
countries4 0.0 -0.2 -13.0 -21.4 0.8 -2.2 -16.0 -25.1
Rest of the World 0.0 0.0 -1.9 -3.3 0.0 -0.1 -1.8 -3.2
Russia 0.0 0.0 -11.3 -22.7 0.7 0.0 -12.2 -22.6
United States 0.0 0.0 -2.0 -2.0 0.0 0.1 -2.0 -2.0
Annex I 0.0 0.0 -2.1 -2.8 0.1 0.2 -2.0 -2.7
Non-Annex I 0.0 -0.1 -4.7 -6.5 0.1 -0.2 -4.5 -6.3
World 0.0 0.0 -3.4 -4.7 0.1 0.1 -3.2 -4.5
Regions
Without energy subsidies removal With energy subsidies removal
2020 2050 2020 2050
1. The pathway of emissions corresponds to a stabilisation below 550ppm (all gases) identical to the "550 ppm-base" case described in Burniaux et al.(2008), Table 3.1.
2. Hicksian “equivalent real income variation” defined as the change in real income (in percentage) necessary to ensure the same level of utility to consumers as in the baseline projection.
3. The region includes the Middle East, Algeria-Lybia-Egypt, Indonesia, and Venezuela.
4. These non-EU Eastern European countries together form the « Rest of Annex I » region of the OECD ENV-Linkages model (see Burniaux and Chateau, 2008).
Source: OECD, ENV-Linkages model.
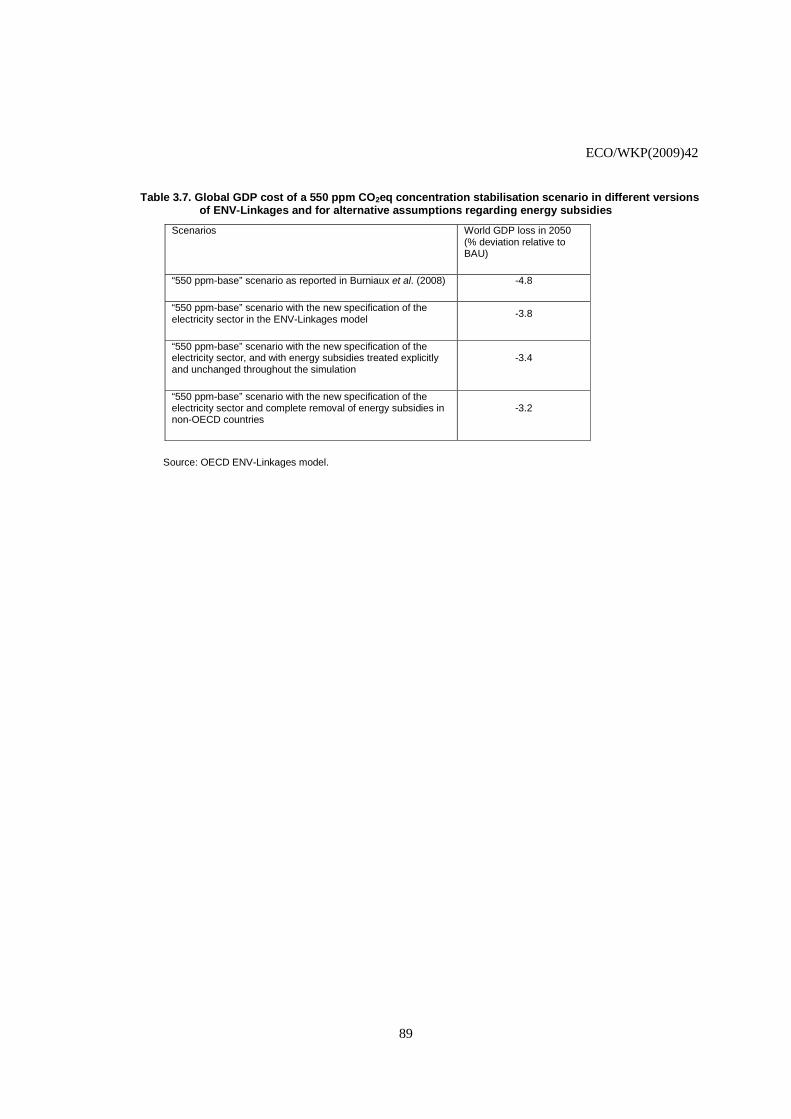
ECO/WKP(2009)42
89
Table 3.7. Global GDP cost of a 550 ppm CO2eq concentration stabilisation scenario in different versions of ENV-Linkages and for alternative assumptions regarding energy subsidies
Scenarios World GDP loss in 2050 (% deviation relative to BAU)
“550 ppm-base” scenario as reported in Burniaux et al. (2008) -4.8
“550 ppm-base” scenario with the new specification of the electricity sector in the ENV-Linkages model -3.8
“550 ppm-base” scenario with the new specification of the electricity sector, and with energy subsidies treated explicitly and unchanged throughout the simulation
-3.4
“550 ppm-base” scenario with the new specification of the electricity sector and complete removal of energy subsidies in non-OECD countries
-3.2
Source: OECD ENV-Linkages model.
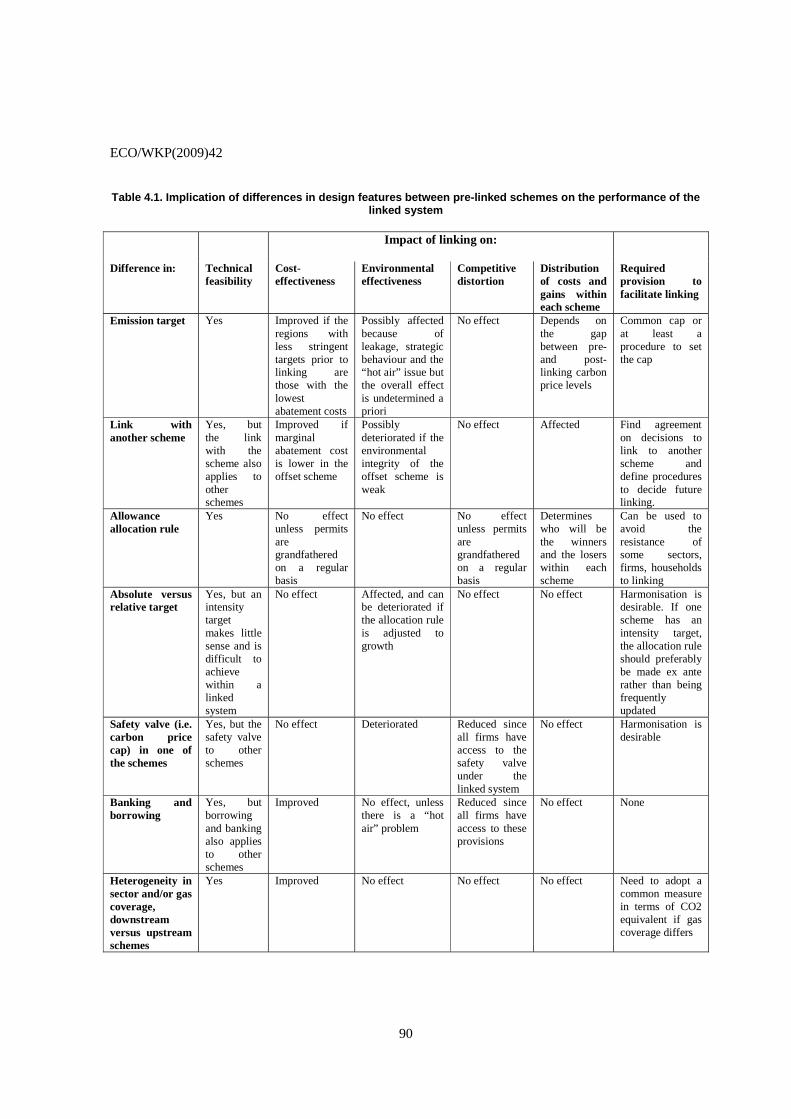
ECO/WKP(2009)42
90
Table 4.1. Implication of differences in design features between pre-linked schemes on the performance of the linked system
Impact of linking on:
Difference in: Technical feasibility
Cost-effectiveness
Environmental effectiveness
Competitive distortion
Distribution of costs and gains within each scheme
Required provision to facilitate linking
Emission target Yes Improved if the regions with less stringent targets prior to linking are those with the lowest abatement costs
Possibly affected because of leakage, strategic behaviour and the “hot air” issue but the overall effect is undetermined a priori
No effect Depends on the gap between pre- and post-linking carbon price levels
Common cap or at least a procedure to set the cap
Link with another scheme
Yes, but the link with the scheme also applies to other schemes
Improved if marginal abatement cost is lower in the offset scheme
Possibly deteriorated if the environmental integrity of the offset scheme is weak
No effect Affected Find agreement on decisions to link to another scheme and define procedures to decide future linking.
Allowance allocation rule
Yes No effect unless permits are grandfathered on a regular basis
No effect No effect unless permits are grandfathered on a regular basis
Determines who will be the winners and the losers within each scheme
Can be used to avoid the resistance of some sectors, firms, households to linking
Absolute versus relative target
Yes, but an intensity target makes little sense and is difficult to achieve within a linked system
No effect Affected, and can be deteriorated if the allocation rule is adjusted to growth
No effect No effect Harmonisation is desirable. If one scheme has an intensity target, the allocation rule should preferably be made ex ante rather than being frequently updated
Safety valve (i.e. carbon price cap) in one of the schemes
Yes, but the safety valve to other schemes
No effect Deteriorated Reduced since all firms have access to the safety valve under the linked system
No effect Harmonisation is desirable
Banking and borrowing
Yes, but borrowing and banking also applies to other schemes
Improved No effect, unless there is a “hot air” problem
Reduced since all firms have access to these provisions
No effect None
Heterogeneity in sector and/or gas coverage, downstream versus upstream schemes
Yes Improved No effect No effect No effect Need to adopt a common measure in terms of CO2 equivalent if gas coverage differs
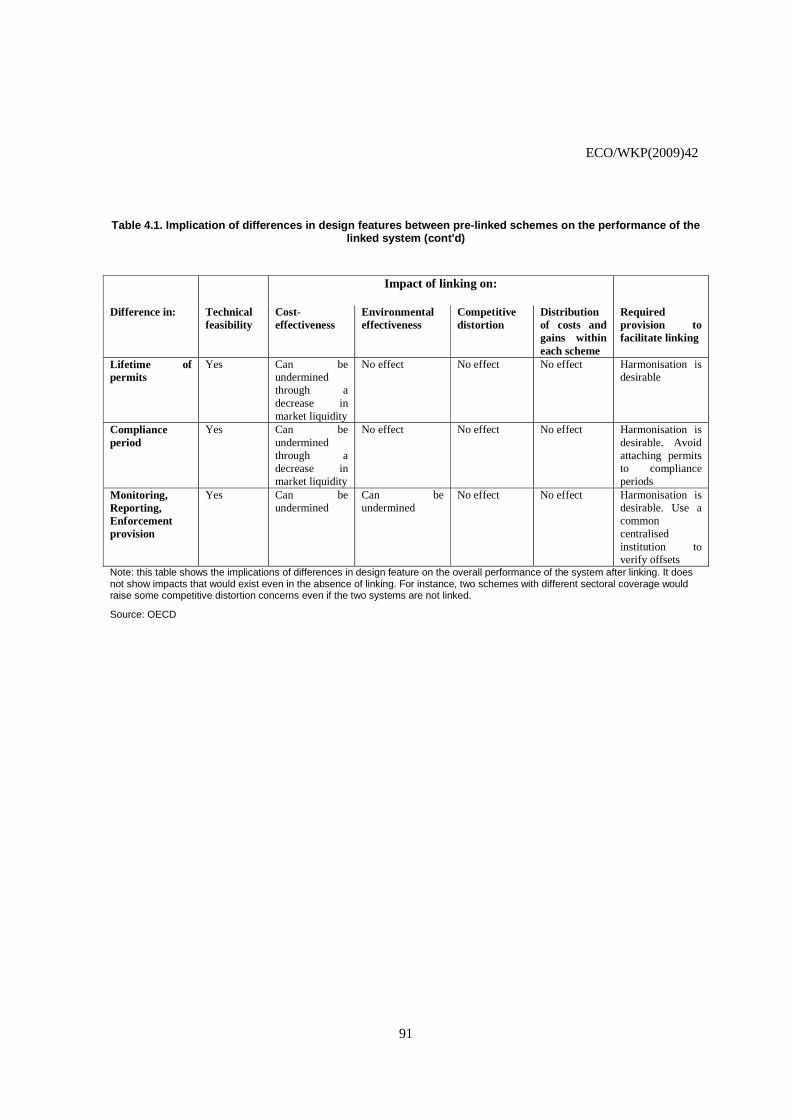
ECO/WKP(2009)42
91
Table 4.1. Implication of differences in design features between pre-linked schemes on the performance of the linked system (cont'd)
Impact of linking on:
Difference in: Technical feasibility
Cost-effectiveness
Environmental effectiveness
Competitive distortion
Distribution of costs and gains within each scheme
Required provision to facilitate linking
Lifetime of permits
Yes Can be undermined through a decrease in market liquidity
No effect No effect No effect Harmonisation is desirable
Compliance period
Yes Can be undermined through a decrease in market liquidity
No effect No effect No effect Harmonisation is desirable. Avoid attaching permits to compliance periods
Monitoring, Reporting, Enforcement provision
Yes Can be undermined
Can be undermined
No effect No effect Harmonisation is desirable. Use a common centralised institution to verify offsets
Note: this table shows the implications of differences in design feature on the overall performance of the system after linking. It does not show impacts that would exist even in the absence of linking. For instance, two schemes with different sectoral coverage would raise some competitive distortion concerns even if the two systems are not linked.
Source: OECD
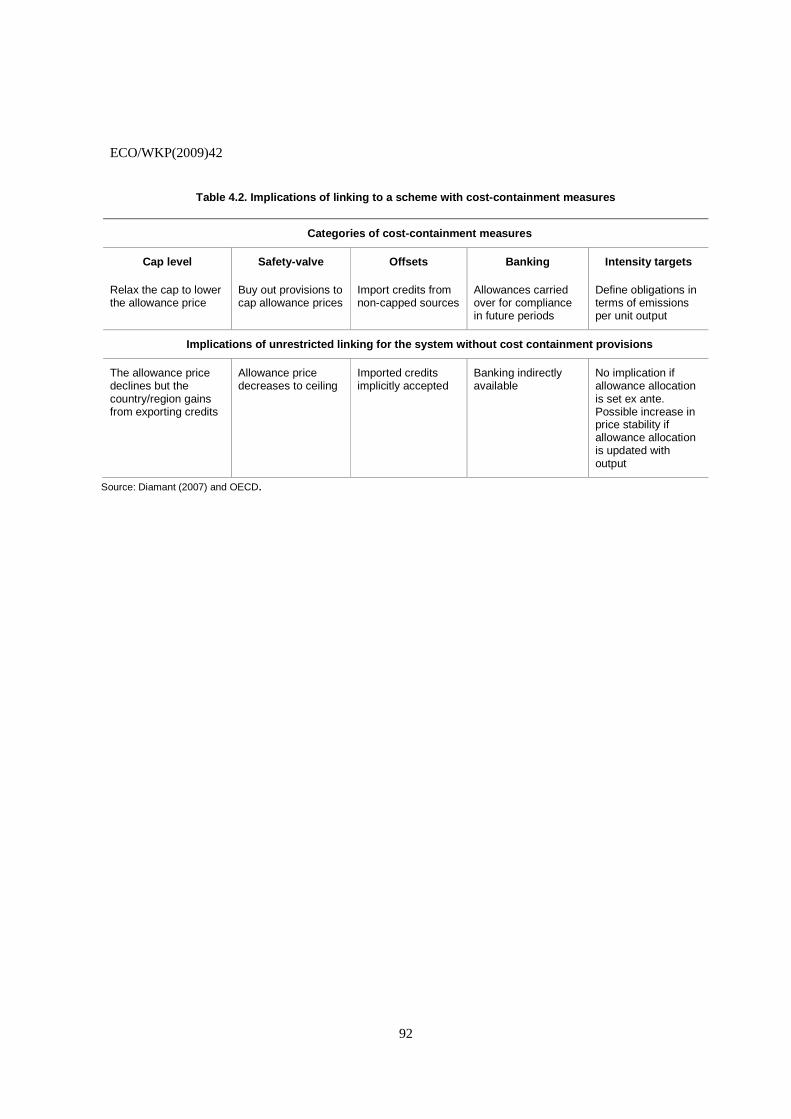
ECO/WKP(2009)42
92
Table 4.2. Implications of linking to a scheme with cost-containment measures
Categories of cost-containment measures
Cap level Safety-valve Offsets Banking Intensity targets
Relax the cap to lower the allowance price
Buy out provisions to cap allowance prices
Import credits from non-capped sources
Allowances carried over for compliance in future periods
Define obligations in terms of emissions per unit output
Implications of unrestricted linking for the system without cost containment provisions
The allowance price declines but the country/region gains from exporting credits
Allowance price decreases to ceiling
Imported credits implicitly accepted
Banking indirectly available
No implication if allowance allocation is set ex ante. Possible increase in price stability if allowance allocation is updated with output
Source: Diamant (2007) and OECD.

ECO/WKP(2009)42
93
Table 8.1. Regulations to address carbon market risks
Carbon market risks Consequences Provisions/ Recommendations
Environmental risk The system (international or emerging from regional initiatives) does not achieve its stated emission target
Negotiations within a centralised institution (e.g. UNFCC body) to reach agreement on emission target, cap-and-trade design features, cost-containment measures, link to other systems, and MRV procedures
Use of complementary compliance mechanism such as a system of emission of performance bonds
Liquidity risk Lack of liquidity would imply:
• Larger carbon price volatility
• Higher transaction costs
• Risk of market power problems
• Higher cost of derivatives
Regular spot sales of short-term permits
Allowing banking
Credible commitments on future mitigation policies (to foster the development of derivative markets)
Risk associated with the development of derivative markets
Source of financial market instability Harmonisation of regulations on position limits for speculators
Eventually introduce limits on banking for speculators
Identification of financial market authorities responsible for carbon markets
Counterparty risk Market dysfunctioning, reduced cost-effectiveness
Extension of the access to clearinghouses or introduction of penalties for performance failure in contracts
Credible commitments on future mitigation policies (to limit the risk of imbalances between allowances supply and demand)
Source: OECD
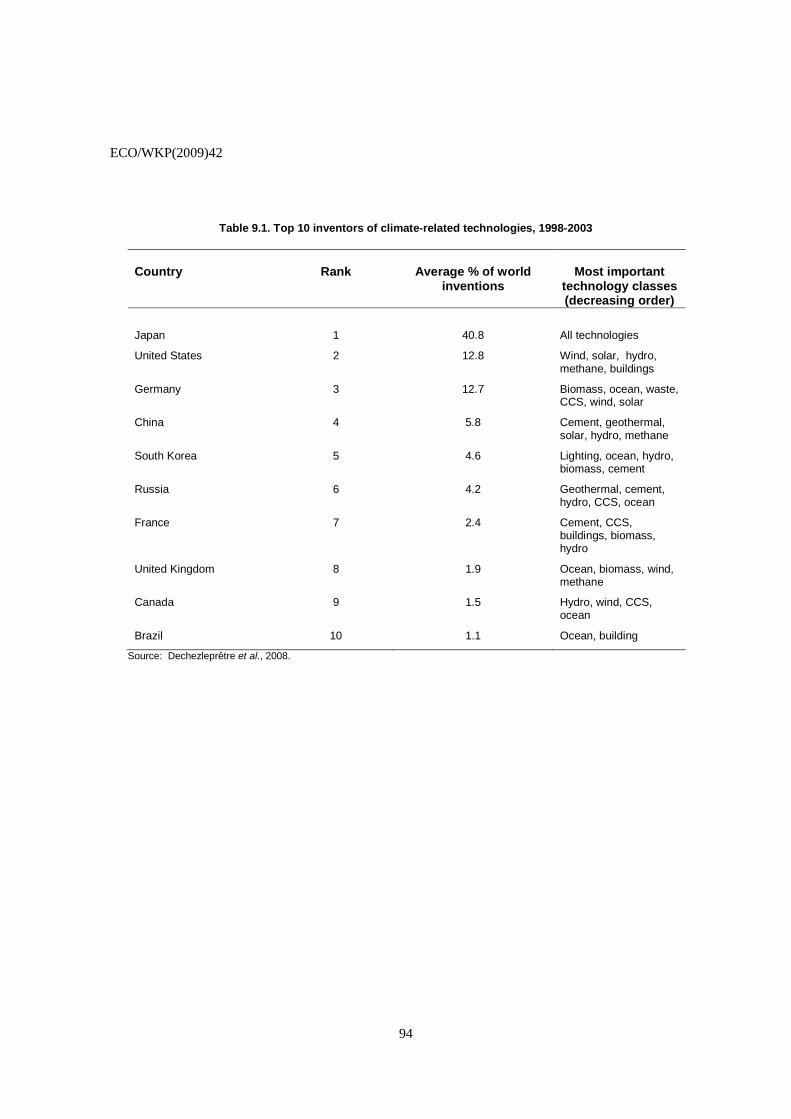
ECO/WKP(2009)42
94
Table 9.1. Top 10 inventors of climate-related technologies, 1998-2003
Country
Rank
Average % of world
inventions
Most important
technology classes (decreasing order)
Japan
1
40.8
All technologies
United States 2 12.8 Wind, solar, hydro, methane, buildings
Germany 3 12.7 Biomass, ocean, waste, CCS, wind, solar
China 4 5.8 Cement, geothermal, solar, hydro, methane
South Korea 5 4.6 Lighting, ocean, hydro, biomass, cement
Russia 6 4.2 Geothermal, cement, hydro, CCS, ocean
France 7 2.4 Cement, CCS, buildings, biomass, hydro
United Kingdom 8 1.9 Ocean, biomass, wind, methane
Canada 9 1.5 Hydro, wind, CCS, ocean
Brazil 10 1.1 Ocean, building
Source: Dechezleprêtre et al., 2008.
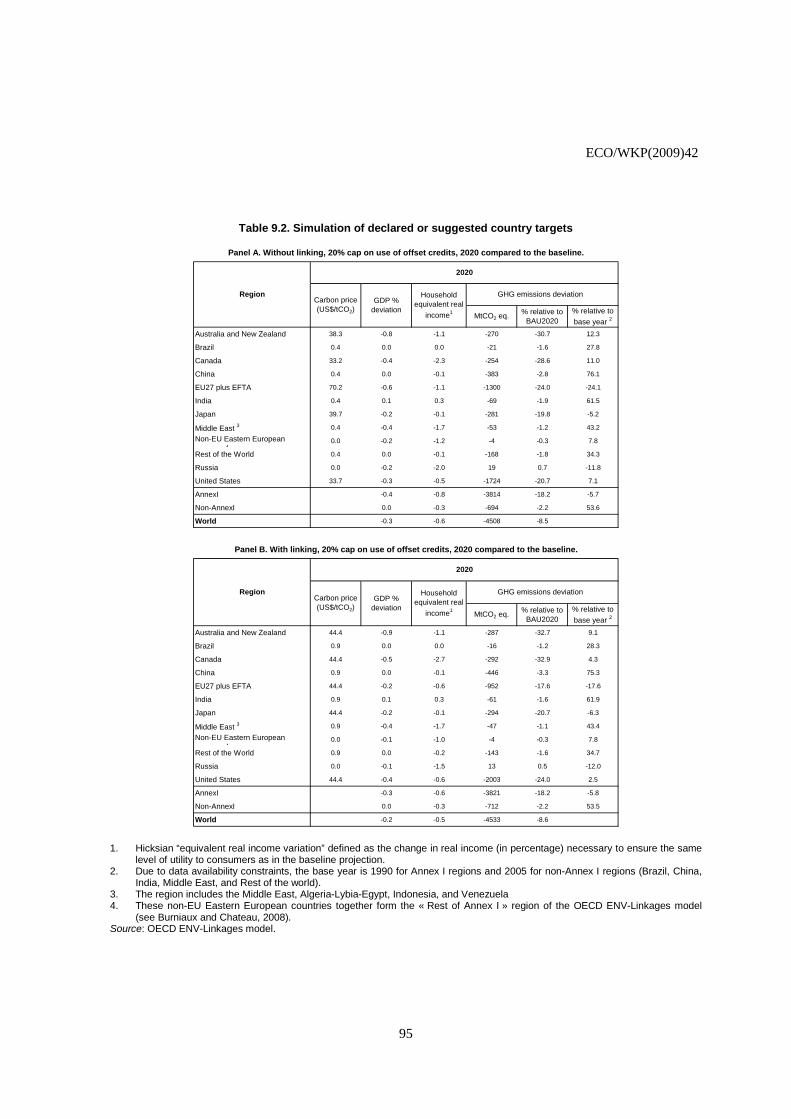
ECO/WKP(2009)42
95
Table 9.2. Simulation of declared or suggested country targets
Panel A. Without linking, 20% cap on use of offset credits, 2020 compared to the baseline.
MtCO2 eq. % relative to BAU2020
% relative to
base year 2
Australia and New Zealand 38.3 -0.8 -1.1 -270 -30.7 12.3
Brazil 0.4 0.0 0.0 -21 -1.6 27.8
Canada 33.2 -0.4 -2.3 -254 -28.6 11.0
China 0.4 0.0 -0.1 -383 -2.8 76.1
EU27 plus EFTA 70.2 -0.6 -1.1 -1300 -24.0 -24.1
India 0.4 0.1 0.3 -69 -1.9 61.5
Japan 39.7 -0.2 -0.1 -281 -19.8 -5.2
Middle East 3 0.4 -0.4 -1.7 -53 -1.2 43.2
Non-EU Eastern European
countries40.0 -0.2 -1.2 -4 -0.3 7.8
Rest of the World 0.4 0.0 -0.1 -168 -1.8 34.3
Russia 0.0 -0.2 -2.0 19 0.7 -11.8
United States 33.7 -0.3 -0.5 -1724 -20.7 7.1
AnnexI -0.4 -0.8 -3814 -18.2 -5.7
Non-AnnexI 0.0 -0.3 -694 -2.2 53.6
World -0.3 -0.6 -4508 -8.5
Panel B. With linking, 20% cap on use of offset credits, 2020 compared to the baseline.
MtCO2 eq. % relative to BAU2020
% relative to
base year 2
Australia and New Zealand 44.4 -0.9 -1.1 -287 -32.7 9.1
Brazil 0.9 0.0 0.0 -16 -1.2 28.3
Canada 44.4 -0.5 -2.7 -292 -32.9 4.3
China 0.9 0.0 -0.1 -446 -3.3 75.3
EU27 plus EFTA 44.4 -0.2 -0.6 -952 -17.6 -17.6
India 0.9 0.1 0.3 -61 -1.6 61.9
Japan 44.4 -0.2 -0.1 -294 -20.7 -6.3
Middle East 3 0.9 -0.4 -1.7 -47 -1.1 43.4
Non-EU Eastern European
countries40.0 -0.1 -1.0 -4 -0.3 7.8
Rest of the World 0.9 0.0 -0.2 -143 -1.6 34.7
Russia 0.0 -0.1 -1.5 13 0.5 -12.0
United States 44.4 -0.4 -0.6 -2003 -24.0 2.5
AnnexI -0.3 -0.6 -3821 -18.2 -5.8
Non-AnnexI 0.0 -0.3 -712 -2.2 53.5
World -0.2 -0.5 -4533 -8.6
Region
Region
2020
Carbon price (US$/tCO2)
GDP % deviation
Household equivalent real
income1
GHG emissions deviation
2020
Carbon price (US$/tCO2)
GDP % deviation
Household equivalent real
income1
GHG emissions deviation
1. Hicksian “equivalent real income variation” defined as the change in real income (in percentage) necessary to ensure the same level of utility to consumers as in the baseline projection.
2. Due to data availability constraints, the base year is 1990 for Annex I regions and 2005 for non-Annex I regions (Brazil, China, India, Middle East, and Rest of the world).
3. The region includes the Middle East, Algeria-Lybia-Egypt, Indonesia, and Venezuela 4. These non-EU Eastern European countries together form the « Rest of Annex I » region of the OECD ENV-Linkages model
(see Burniaux and Chateau, 2008). Source: OECD ENV-Linkages model.
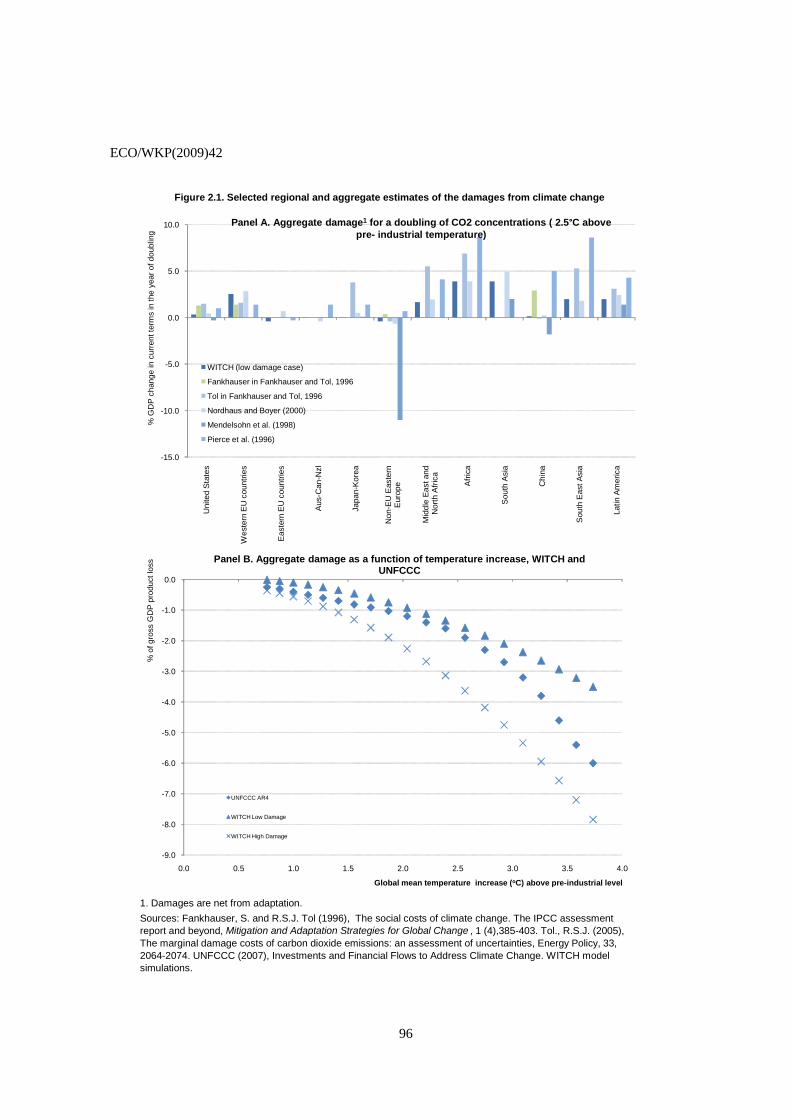
ECO/WKP(2009)42
96
Figure 2.1. Selected regional and aggregate estimates of the damages from climate change
1. Damages are net from adaptation.
Sources: Fankhauser, S. and R.S.J. Tol (1996), The social costs of climate change. The IPCC assessment report and beyond, Mitigation and Adaptation Strategies for Global Change , 1 (4),385-403. Tol., R.S.J. (2005), The marginal damage costs of carbon dioxide emissions: an assessment of uncertainties, Energy Policy, 33, 2064-2074. UNFCCC (2007), Investments and Financial Flows to Address Climate Change. WITCH model simulations.
-15.0
-10.0
-5.0
0.0
5.0
10.0
Uni
ted
Sta
tes
Wes
tern
EU
cou
ntrie
s
Eas
tern
EU
cou
ntrie
s
Aus
-Can
-Nzl
Japa
n-K
orea
Non
-EU
Eas
tern
Eur
ope
Mid
dle
Eas
t and
Nor
th A
fric
a
Afr
ica
Sou
th A
sia
Chi
na
Sou
th E
ast A
sia
Latin
Am
eric
a
% G
DP
cha
nge
in c
urre
nt te
rms
in th
e ye
ar o
f dou
blin
g
Panel A. Aggregate damage1 for a doubling of CO2 concentrations ( 2.5°C above pre- industrial temperature)
WITCH (low damage case)
Fankhauser in Fankhauser and Tol, 1996
Tol in Fankhauser and Tol, 1996
Nordhaus and Boyer (2000)
Mendelsohn et al. (1998)
Pierce et al. (1996)
-9.0
-8.0
-7.0
-6.0
-5.0
-4.0
-3.0
-2.0
-1.0
0.0
0.0 0.5 1.0 1.5 2.0 2.5 3.0 3.5 4.0
% o
f gro
ss G
DP
pro
duct
loss
Global mean temperature increase (oC) above pre-industrial level
Panel B. Aggregate damage as a function of temperature increase, WITCH and UNFCCC
UNFCCC AR4
WITCH Low Damage
WITCH High Damage
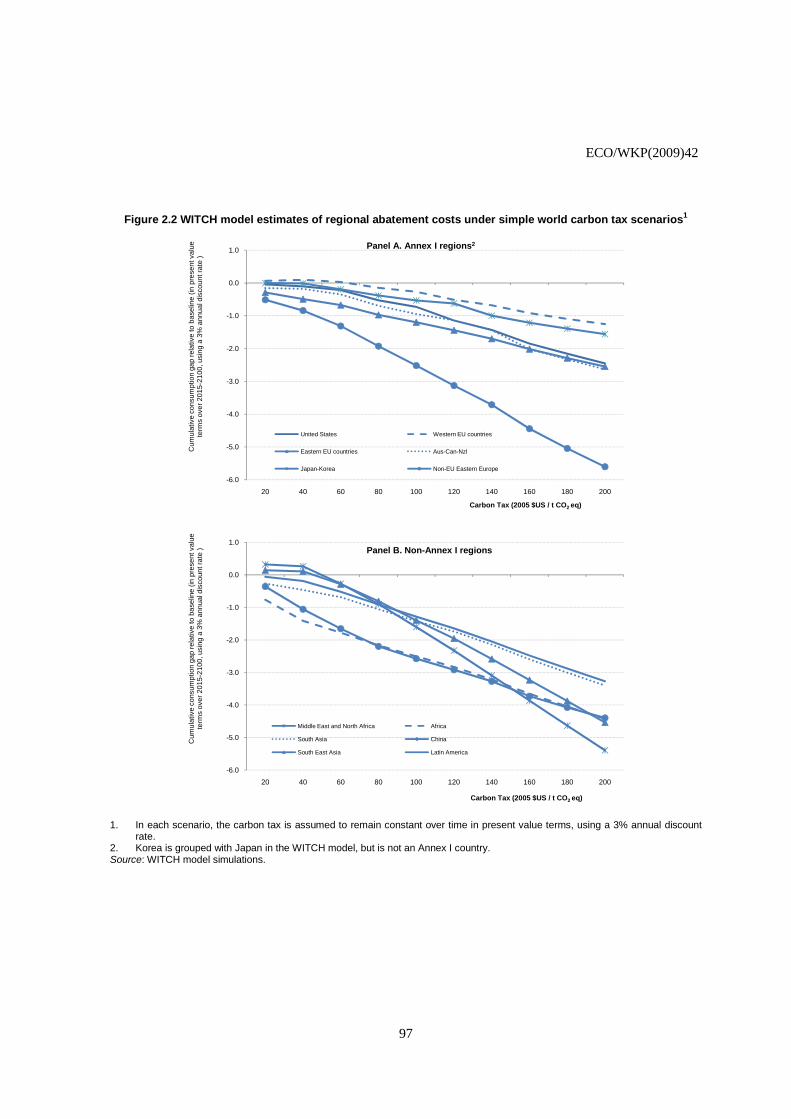
ECO/WKP(2009)42
97
Figure 2.2 WITCH model estimates of regional abatement costs under simple world carbon tax scenarios1
-6.0
-5.0
-4.0
-3.0
-2.0
-1.0
0.0
1.0
20 40 60 80 100 120 140 160 180 200
Cum
ulat
ive
cons
umpt
ion
gap
rela
tive
to b
asel
ine
(in p
rese
nt v
alue
te
rms
over
201
5-21
00, u
sing
a 3
% a
nnua
l dis
coun
t rat
e )
Carbon Tax (2005 $US / t CO2 eq)
Panel A. Annex I regions2
United States Western EU countries
Eastern EU countries Aus-Can-Nzl
Japan-Korea Non-EU Eastern Europe
1.0
sent
val
ue
t rat
e ) Panel B. Non-Annex I regions
-6.0
-5.0
-4.0
-3.0
-2.0
-1.0
0.0
1.0
20 40 60 80 100 120 140 160 180 200
Cum
ulat
ive
cons
umpt
ion
gap
rela
tive
to b
asel
ine
(in p
rese
nt v
alue
te
rms
over
201
5-21
00, u
sing
a 3
% a
nnua
l dis
coun
t rat
e )
Carbon Tax (2005 $US / t CO2 eq)
Panel A. Annex I regions2
United States Western EU countries
Eastern EU countries Aus-Can-Nzl
Japan-Korea Non-EU Eastern Europe
-6.0
-5.0
-4.0
-3.0
-2.0
-1.0
0.0
1.0
20 40 60 80 100 120 140 160 180 200
Cum
ulat
ive
cons
umpt
ion
gap
rela
tive
to b
asel
ine
(in p
rese
nt v
alue
te
rms
over
201
5-21
00, u
sing
a 3
% a
nnua
l dis
coun
t rat
e )
Carbon Tax (2005 $US / t CO2 eq)
Panel B. Non-Annex I regions
Middle East and North Africa Africa
South Asia China
South East Asia Latin America
1. In each scenario, the carbon tax is assumed to remain constant over time in present value terms, using a 3% annual discount rate.
2. Korea is grouped with Japan in the WITCH model, but is not an Annex I country. Source: WITCH model simulations.
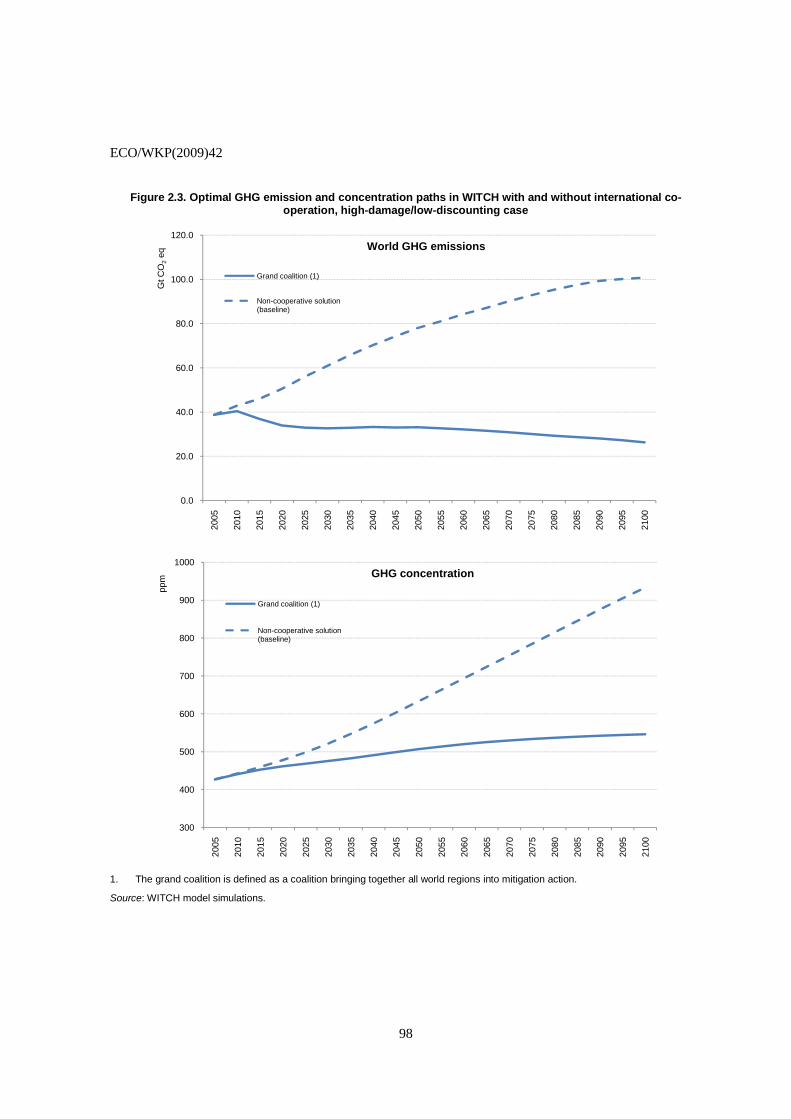
ECO/WKP(2009)42
98
Figure 2.3. Optimal GHG emission and concentration paths in WITCH with and without international co-operation, high-damage/low-discounting case
0.0
20.0
40.0
60.0
80.0
100.0
120.0
2005
2010
2015
2020
2025
2030
2035
2040
2045
2050
2055
2060
2065
2070
2075
2080
2085
2090
2095
2100
Gt C
O2
eq
World GHG emissions
Grand coalition (1)
Non-cooperative solution (baseline)
900
1000
ppm
GHG concentration
Grand coalition (1)
Non-cooperative solution
0.0
20.0
40.0
60.0
80.0
100.0
120.0
2005
2010
2015
2020
2025
2030
2035
2040
2045
2050
2055
2060
2065
2070
2075
2080
2085
2090
2095
2100
Gt C
O2
eq
World GHG emissions
Grand coalition (1)
Non-cooperative solution (baseline)
300
400
500
600
700
800
900
1000
2005
2010
2015
2020
2025
2030
2035
2040
2045
2050
2055
2060
2065
2070
2075
2080
2085
2090
2095
2100
ppm
GHG concentration
Grand coalition (1)
Non-cooperative solution (baseline)
1. The grand coalition is defined as a coalition bringing together all world regions into mitigation action.
Source: WITCH model simulations.
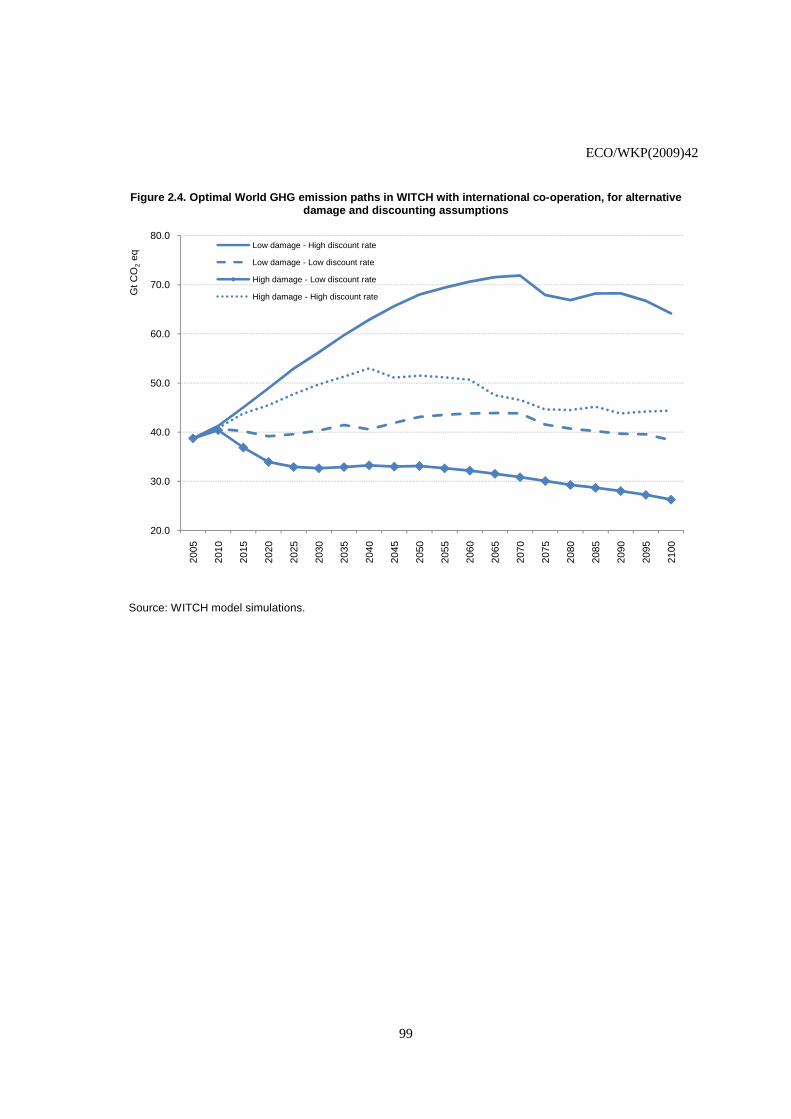
ECO/WKP(2009)42
99
Figure 2.4. Optimal World GHG emission paths in WITCH with international co-operation, for alternative damage and discounting assumptions
Source: WITCH model simulations.
20.0
30.0
40.0
50.0
60.0
70.0
80.0
2005
2010
2015
2020
2025
2030
2035
2040
2045
2050
2055
2060
2065
2070
2075
2080
2085
2090
2095
2100
Gt C
O2
eq
Low damage - High discount rate
Low damage - Low discount rate
High damage - Low discount rate
High damage - High discount rate
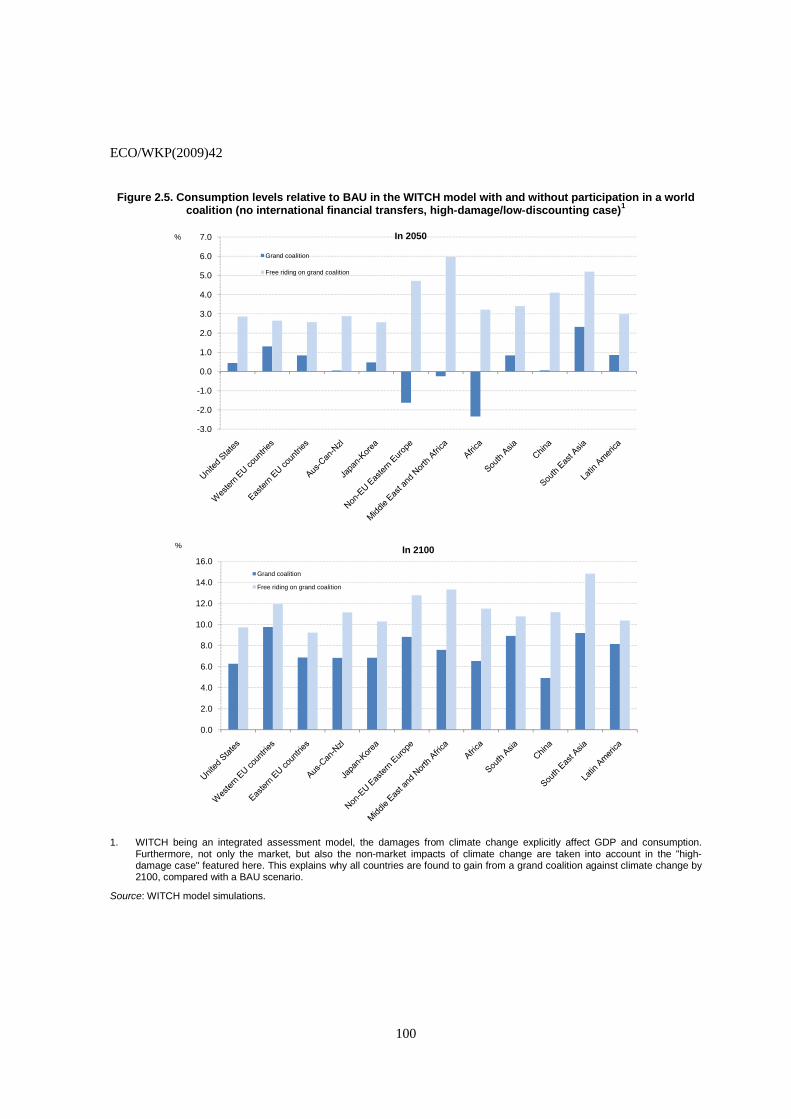
ECO/WKP(2009)42
100
Figure 2.5. Consumption levels relative to BAU in the WITCH model with and without participation in a world coalition (no international financial transfers, high-damage/low-discounting case)1
-3.0
-2.0
-1.0
0.0
1.0
2.0
3.0
4.0
5.0
6.0
7.0% In 2050
Grand coalition
Free riding on grand coalition
14.0
16.0
% In 2100
Grand coalition
Free riding on grand coalition
-3.0
-2.0
-1.0
0.0
1.0
2.0
3.0
4.0
5.0
6.0
7.0% In 2050
Grand coalition
Free riding on grand coalition
0.0
2.0
4.0
6.0
8.0
10.0
12.0
14.0
16.0
% In 2100
Grand coalition
Free riding on grand coalition
1. WITCH being an integrated assessment model, the damages from climate change explicitly affect GDP and consumption. Furthermore, not only the market, but also the non-market impacts of climate change are taken into account in the "high-damage case" featured here. This explains why all countries are found to gain from a grand coalition against climate change by 2100, compared with a BAU scenario.
Source: WITCH model simulations.
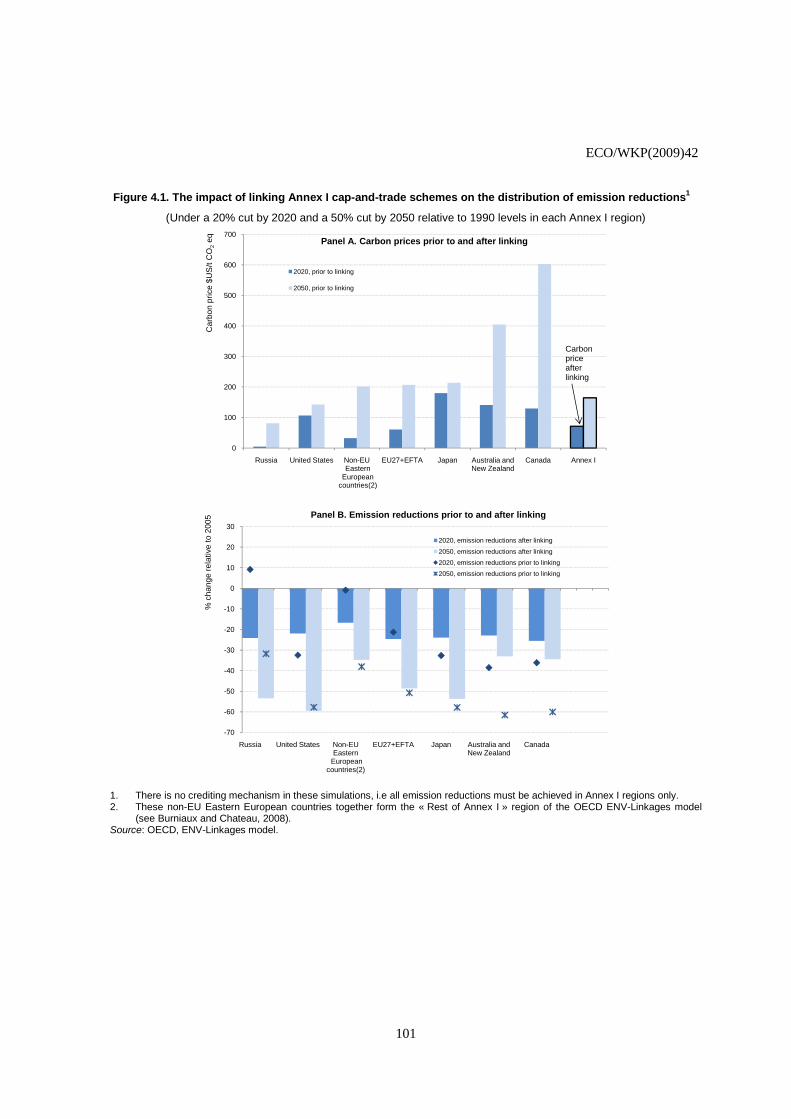
ECO/WKP(2009)42
101
Figure 4.1. The impact of linking Annex I cap-and-trade schemes on the distribution of emission reductions1
(Under a 20% cut by 2020 and a 50% cut by 2050 relative to 1990 levels in each Annex I region)
0
100
200
300
400
500
600
700
Russia United States Non-EUEastern
Europeancountries(2)
EU27+EFTA Japan Australia and New Zealand
Canada Annex I
Car
bon
pric
e $U
S/t
CO
2eq Panel A. Carbon prices prior to and after linking
2020, prior to linking
2050, prior to linking
Carbon price after linking
20
30
elat
ive
to 2
005 Panel B. Emission reductions prior to and after linking
2020, emission reductions after linking
2050, emission reductions after linking
2020, emission reductions prior to linking
0
100
200
300
400
500
600
700
Russia United States Non-EUEastern
Europeancountries(2)
EU27+EFTA Japan Australia and New Zealand
Canada Annex I
Car
bon
pric
e $U
S/t
CO
2eq Panel A. Carbon prices prior to and after linking
2020, prior to linking
2050, prior to linking
Carbon price after linking
-70
-60
-50
-40
-30
-20
-10
0
10
20
30
Russia United States Non-EU Eastern
European countries(2)
EU27+EFTA Japan Australia and New Zealand
Canada
% c
hang
e re
lativ
e to
200
5 Panel B. Emission reductions prior to and after linking
2020, emission reductions after linking
2050, emission reductions after linking
2020, emission reductions prior to linking
2050, emission reductions prior to linking
1. There is no crediting mechanism in these simulations, i.e all emission reductions must be achieved in Annex I regions only. 2. These non-EU Eastern European countries together form the « Rest of Annex I » region of the OECD ENV-Linkages model
(see Burniaux and Chateau, 2008). Source: OECD, ENV-Linkages model.
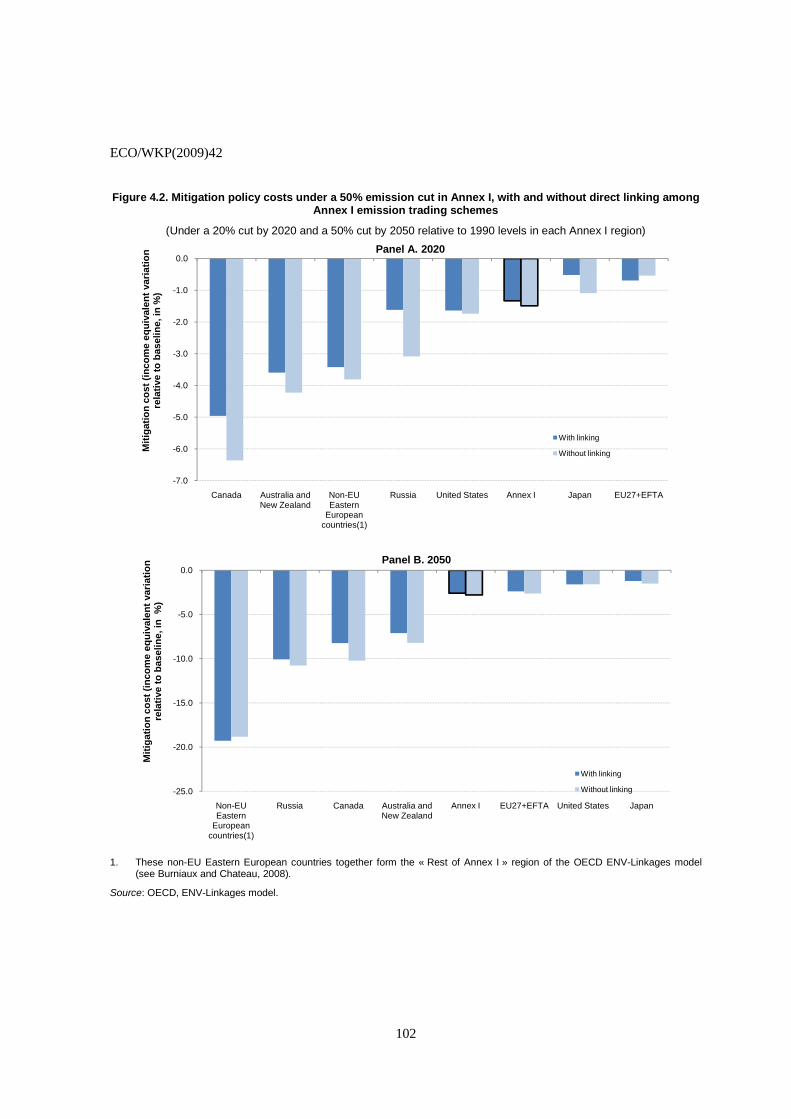
ECO/WKP(2009)42
102
Figure 4.2. Mitigation policy costs under a 50% emission cut in Annex I, with and without direct linking among Annex I emission trading schemes
(Under a 20% cut by 2020 and a 50% cut by 2050 relative to 1990 levels in each Annex I region)
-7.0
-6.0
-5.0
-4.0
-3.0
-2.0
-1.0
0.0
Canada Australia and New Zealand
Non-EU Eastern
European countries(1)
Russia United States Annex I Japan EU27+EFTA
Mit
igat
ion
co
st (
inco
me
equ
ival
ent
vari
atio
n
rela
tive
to
bas
elin
e, in
%)
Panel A. 2020
With linking
Without linking
-5.0
0.0
equ
ival
ent
vari
atio
n
line,
in %
)
Panel B. 2050
-7.0
-6.0
-5.0
-4.0
-3.0
-2.0
-1.0
0.0
Canada Australia and New Zealand
Non-EU Eastern
European countries(1)
Russia United States Annex I Japan EU27+EFTA
Mit
igat
ion
co
st (
inco
me
equ
ival
ent
vari
atio
n
rela
tive
to
bas
elin
e, in
%)
Panel A. 2020
With linking
Without linking
-25.0
-20.0
-15.0
-10.0
-5.0
0.0
Non-EU Eastern
European countries(1)
Russia Canada Australia and New Zealand
Annex I EU27+EFTA United States Japan
Mit
igat
ion
co
st (
inco
me
equ
ival
ent
vari
atio
n
rela
tive
to
bas
elin
e, in
%)
Panel B. 2050
With linking
Without linking
1. These non-EU Eastern European countries together form the « Rest of Annex I » region of the OECD ENV-Linkages model (see Burniaux and Chateau, 2008).
Source: OECD, ENV-Linkages model.
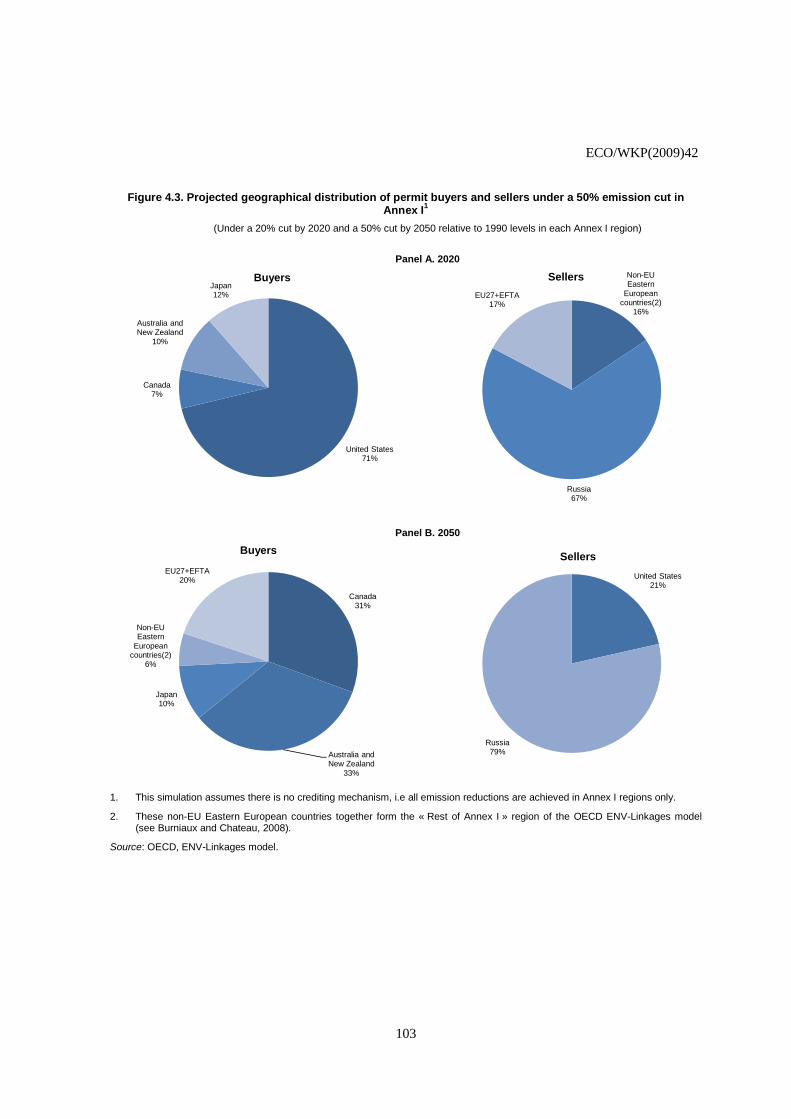
ECO/WKP(2009)42
103
Figure 4.3. Projected geographical distribution of permit buyers and sellers under a 50% emission cut in Annex I1
(Under a 20% cut by 2020 and a 50% cut by 2050 relative to 1990 levels in each Annex I region)
Panel A. 2020
Panel B. 2050
United States71%
Canada7%
Australia and New Zealand
10%
Japan12%
Buyers Non-EU Eastern
European countries(2)
16%
Russia67%
EU27+EFTA17%
Sellers
Canada31%
Non-EU Eastern
European countries(2)
6%
EU27+EFTA20%
Buyers
United States21%
Sellers
United States71%
Canada7%
Australia and New Zealand
10%
Japan12%
Buyers Non-EU Eastern
European countries(2)
16%
Russia67%
EU27+EFTA17%
Sellers
Canada31%
Australia and New Zealand
33%
Japan10%
Non-EU Eastern
European countries(2)
6%
EU27+EFTA20%
Buyers
United States21%
Russia79%
Sellers
1. This simulation assumes there is no crediting mechanism, i.e all emission reductions are achieved in Annex I regions only.
2. These non-EU Eastern European countries together form the « Rest of Annex I » region of the OECD ENV-Linkages model (see Burniaux and Chateau, 2008).
Source: OECD, ENV-Linkages model.
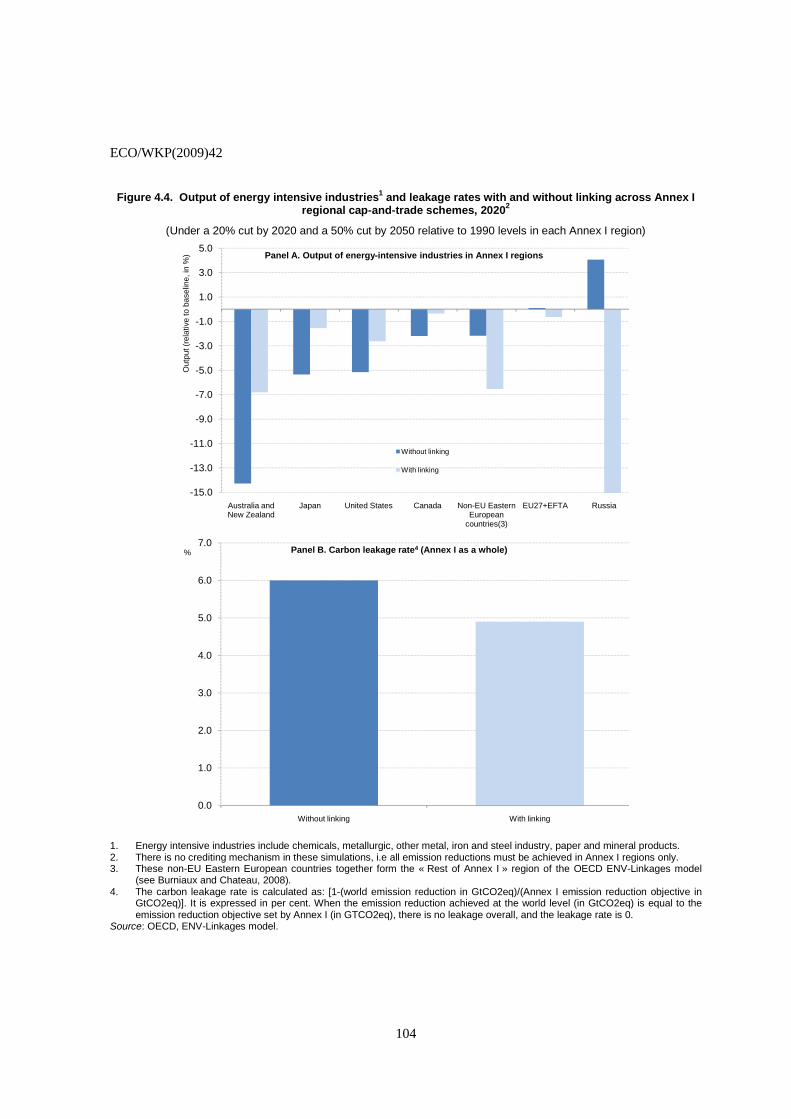
ECO/WKP(2009)42
104
Figure 4.4. Output of energy intensive industries1 and leakage rates with and without linking across Annex I regional cap-and-trade schemes, 20202
(Under a 20% cut by 2020 and a 50% cut by 2050 relative to 1990 levels in each Annex I region)
-15.0
-13.0
-11.0
-9.0
-7.0
-5.0
-3.0
-1.0
1.0
3.0
5.0
Australia and New Zealand
Japan United States Canada Non-EU Eastern European
countries(3)
EU27+EFTA Russia
Out
put (
rela
tive
to b
asel
ine,
in %
) Panel A. Output of energy-intensive industries in Annex I regions
Without linking
With linking
6.0
7.0% Panel B. Carbon leakage rate4 (Annex I as a whole)
-15.0
-13.0
-11.0
-9.0
-7.0
-5.0
-3.0
-1.0
1.0
3.0
5.0
Australia and New Zealand
Japan United States Canada Non-EU Eastern European
countries(3)
EU27+EFTA Russia
Out
put (
rela
tive
to b
asel
ine,
in %
) Panel A. Output of energy-intensive industries in Annex I regions
Without linking
With linking
0.0
1.0
2.0
3.0
4.0
5.0
6.0
7.0
Without linking With linking
% Panel B. Carbon leakage rate4 (Annex I as a whole)
1. Energy intensive industries include chemicals, metallurgic, other metal, iron and steel industry, paper and mineral products. 2. There is no crediting mechanism in these simulations, i.e all emission reductions must be achieved in Annex I regions only. 3. These non-EU Eastern European countries together form the « Rest of Annex I » region of the OECD ENV-Linkages model
(see Burniaux and Chateau, 2008). 4. The carbon leakage rate is calculated as: [1-(world emission reduction in GtCO2eq)/(Annex I emission reduction objective in
GtCO2eq)]. It is expressed in per cent. When the emission reduction achieved at the world level (in GtCO2eq) is equal to the emission reduction objective set by Annex I (in GTCO2eq), there is no leakage overall, and the leakage rate is 0.
Source: OECD, ENV-Linkages model.

ECO/WKP(2009)42
105
Figure 5.1. Mitigation policy costs under a 50% emission cut in each Annex I region separately, with and without crediting mechanisms
(Under a 20% cut by 2020 and a 50% cut by 2050 relative to 1990 levels in each Annex I region)
-7.0
-6.0
-5.0
-4.0
-3.0
-2.0
-1.0
0.0
Canada Australia and New Zealand
Non-EU Eastern
European countries(1)
Russia United States Annex 1 Japan EU27+EFTA
Miti
gatio
n co
st (
inco
me
equi
vale
nt v
aria
tion
rela
tive
to
base
line,
in %
)
Panel A. 2020
Without crediting mechanism
With crediting mechanism, 20% cap on use of offset credits
With crediting mechanism, 50% cap on use of offset credits
-8.0
-6.0
-4.0
-2.0
0.0
ival
ent v
aria
tion
rel
ativ
e to
, i
n %
)
Panel B. 2050
-7.0
-6.0
-5.0
-4.0
-3.0
-2.0
-1.0
0.0
Canada Australia and New Zealand
Non-EU Eastern
European countries(1)
Russia United States Annex 1 Japan EU27+EFTA
Miti
gatio
n co
st (
inco
me
equi
vale
nt v
aria
tion
rela
tive
to
base
line,
in %
)
Panel A. 2020
Without crediting mechanism
With crediting mechanism, 20% cap on use of offset credits
With crediting mechanism, 50% cap on use of offset credits
-20.0
-18.0
-16.0
-14.0
-12.0
-10.0
-8.0
-6.0
-4.0
-2.0
0.0
Non-EU Eastern
European countries(1)
Russia Canada Australia and New Zealand
Annex 1 EU27+EFTA United States Japan
Miti
gatio
n co
st (
inco
me
equi
vale
nt v
aria
tion
rel
ativ
e to
ba
selin
e, in
%)
Panel B. 2050
Without crediting mechanism
With crediting mechanism, 20% cap on use of offset credits
With crediting mechanism, 50% cap on use of offset credits
1. These non-EU Eastern European countries together form the « Rest of Annex I » region of the OECD ENV-Linkages model (see Burniaux and Chateau, 2008).
Source: OECD, ENV-Linkages model.

ECO/WKP(2009)42
106
Figure 5.2. Carbon prices under a 50% emission cut in each Annex I region separately, with and without crediting mechanisms
(Under a 20% cut by 2020 and a 50% cut by 2050 relative to 1990 levels in each Annex I region)
0.0
20.0
40.0
60.0
80.0
100.0
120.0
140.0
160.0
180.0
200.0
Non
-Ann
ex 1
Rus
sia
Non
-EU
E
aste
rn
Eur
opea
n co
untr
ies(
1)
EU
27+
EF
TA
Uni
ted
Sta
tes
Can
ada
Aus
tral
ia a
nd
New
Zea
land
Japa
n
$US
/ t C
O2
eq
Panel A. 2020
Without crediting mechanism
With crediting mechanism, 20% cap on use of offset credits
With crediting mechanism, 50% cap on use of offset credits
500.0
600.0
700.0
$US
/ t C
O2
eq
Panel B. 2050
Without crediting mechanism
With crediting mechanism, 20% cap on use of offset credits
With crediting mechanism, 50% cap on use of offset credits
0.0
20.0
40.0
60.0
80.0
100.0
120.0
140.0
160.0
180.0
200.0
Non
-Ann
ex 1
Rus
sia
Non
-EU
E
aste
rn
Eur
opea
n co
untr
ies(
1)
EU
27+
EF
TA
Uni
ted
Sta
tes
Can
ada
Aus
tral
ia a
nd
New
Zea
land
Japa
n
$US
/ t C
O2
eq
Panel A. 2020
Without crediting mechanism
With crediting mechanism, 20% cap on use of offset credits
With crediting mechanism, 50% cap on use of offset credits
0.0
100.0
200.0
300.0
400.0
500.0
600.0
700.0
Non
-Ann
ex
1 Rus
sia
Uni
ted
Sta
tes
Non
-EU
E
aste
rn
Eur
opea
n co
untr
ies(
1)
EU
27+
EF
TA
Japa
n
Aus
tral
ia
and
New
Z
eala
nd
Can
ada
$US
/ t C
O2
eq
Panel B. 2050
Without crediting mechanism
With crediting mechanism, 20% cap on use of offset credits
With crediting mechanism, 50% cap on use of offset credits
1. These non-EU Eastern European countries together form the « Rest of Annex I » region of the OECD ENV-Linkages model (see Burniaux and Chateau, 2008).
Source: OECD, ENV-Linkages model.

ECO/WKP(2009)42
107
Figure 5.3. Projected geographical distribution of offset credit buyers and sellers at the 2020 horizon under a 50% emission cut in each Annex I region separately
(Under a 20% cut by 2020 and a 50% cut by 2050 relative to 1990 levels in each Annex I region)
Panel A. With a 20% cap on use of offset credits in Annex I countries
Panel B. With a 50% cap on use of offset credits in Annex I countries
Brazil4%
India10%
China49%
Oil-producing countries
7%
Rest of the world30%
Sellers
United States53%
Canada7%
Australia and New Zealand
7%
Japan7%
Non-EU Eastern
European countries(1)
6%
Russia3%
EU27+EFTA17%
Buyers
Brazil4% India
10%
Oil-producing countries
Rest of the world27%
Sellers
United States53%
Japan7%
Non-EU Eastern
European countries(1)
6%
Russia3%
EU27+EFTA17%
Buyers
Brazil4%
India10%
China49%
Oil-producing countries
7%
Rest of the world30%
Sellers
United States53%
Canada7%
Australia and New Zealand
7%
Japan7%
Non-EU Eastern
European countries(1)
6%
Russia3%
EU27+EFTA17%
Buyers
Brazil4% India
10%
China52%
Oil-producing countries
7%
Rest of the world27%
Sellers
United States53%
Canada7%
Australia and New Zealand
7%
Japan7%
Non-EU Eastern
European countries(1)
6%
Russia3%
EU27+EFTA17%
Buyers
1. These non-EU Eastern European countries together form the « Rest of Annex I » region of the OECD ENV-Linkages model (see Burniaux and Chateau, 2008).
Source: OECD, ENV-Linkages model.
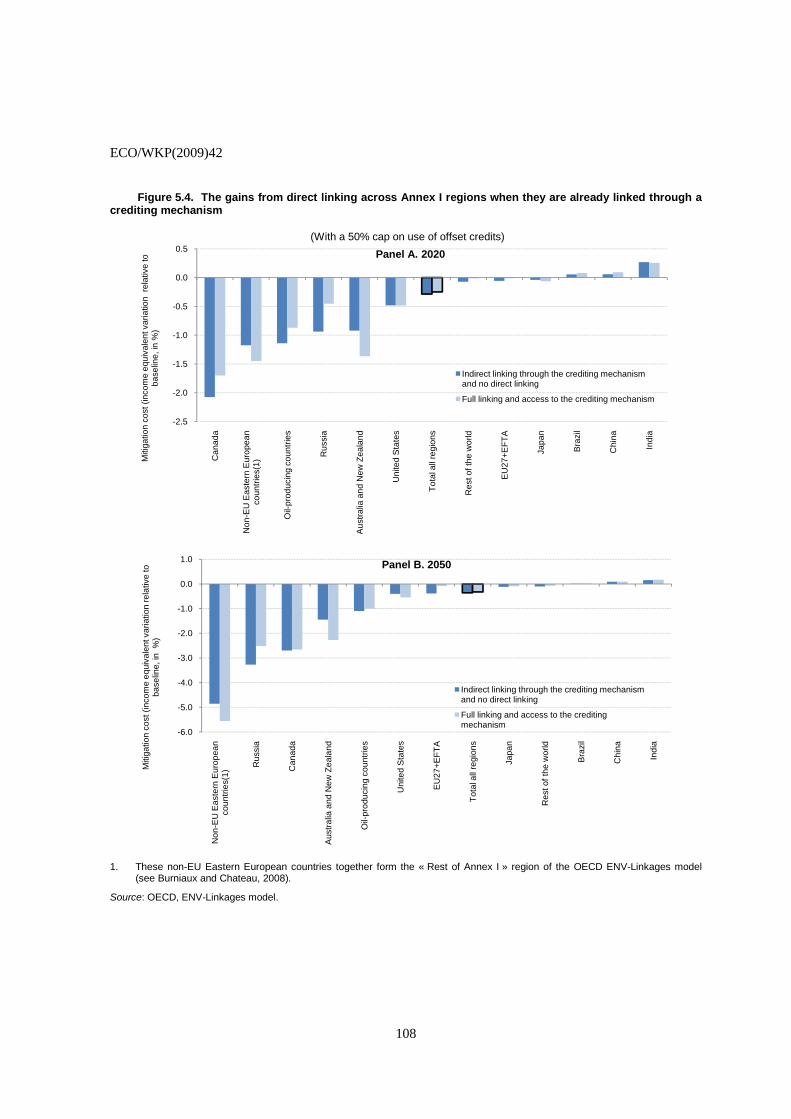
ECO/WKP(2009)42
108
Figure 5.4. The gains from direct linking across Annex I regions when they are already linked through a crediting mechanism
(With a 50% cap on use of offset credits)
-2.5
-2.0
-1.5
-1.0
-0.5
0.0
0.5
Can
ada
Non
-EU
Eas
tern
Eur
opea
n co
untr
ies(
1)
Oil-
prod
ucin
g co
untr
ies
Rus
sia
Aus
tral
ia a
nd N
ew Z
eala
nd
Uni
ted
Sta
tes
Tot
al a
ll re
gion
s
Res
t of t
he w
orld
EU
27+
EF
TA
Japa
n
Bra
zil
Chi
na
Indi
a
Miti
gatio
n co
st (
inco
me
equi
vale
nt v
aria
tion
rel
ativ
e to
ba
selin
e, in
%)
Panel A. 2020
Indirect linking through the crediting mechanism and no direct linking
Full linking and access to the crediting mechanism
-2.0
-1.0
0.0
1.0
lent
var
iatio
n re
lativ
e to
%
)
Panel B. 2050
-2.5
-2.0
-1.5
-1.0
-0.5
0.0
0.5
Can
ada
Non
-EU
Eas
tern
Eur
opea
n co
untr
ies(
1)
Oil-
prod
ucin
g co
untr
ies
Rus
sia
Aus
tral
ia a
nd N
ew Z
eala
nd
Uni
ted
Sta
tes
Tot
al a
ll re
gion
s
Res
t of t
he w
orld
EU
27+
EF
TA
Japa
n
Bra
zil
Chi
na
Indi
a
Miti
gatio
n co
st (
inco
me
equi
vale
nt v
aria
tion
rel
ativ
e to
ba
selin
e, in
%)
Panel A. 2020
Indirect linking through the crediting mechanism and no direct linking
Full linking and access to the crediting mechanism
-6.0
-5.0
-4.0
-3.0
-2.0
-1.0
0.0
1.0
Non
-EU
Eas
tern
Eur
opea
n co
untr
ies(
1)
Rus
sia
Can
ada
Aus
tral
ia a
nd N
ew Z
eala
nd
Oil-
prod
ucin
g co
untr
ies
Uni
ted
Sta
tes
EU
27+
EF
TA
Tot
al a
ll re
gion
s
Japa
n
Res
t of t
he w
orld
Bra
zil
Chi
na
Indi
a
Miti
gatio
n co
st (
inco
me
equi
vale
nt v
aria
tion
rela
tive
to
base
line,
in %
)
Panel B. 2050
Indirect linking through the crediting mechanism and no direct linking
Full linking and access to the crediting mechanism
1. These non-EU Eastern European countries together form the « Rest of Annex I » region of the OECD ENV-Linkages model (see Burniaux and Chateau, 2008).
Source: OECD, ENV-Linkages model.

ECO/WKP(2009)42
109
Figure 5.5. Carbon leakage rate and output of energy-intensive industries1 under a 50% emission cut in each Annex I region separately, with and without crediting mechanisms, 2020
1.0
3.0
5.0
base
line,
in %
) Panel B. Output of energy-intensive industries in Annex I regions
0.0
1.0
2.0
3.0
4.0
5.0
6.0
7.0
Without crediting mechanism With a 20% cap on use of offset credits
With a 50% cap on use of offset credits
% Panel A. Carbon leakage rate2 (Annex I as a whole)
-15.0
-13.0
-11.0
-9.0
-7.0
-5.0
-3.0
-1.0
1.0
3.0
5.0
Australia and New Zealand
Japan United States Canada Non-EU Eastern European
countries(3)
EU27+EFTA Russia
Out
put (
chan
ge r
elat
ive
to b
asel
ine,
in %
) Panel B. Output of energy-intensive industries in Annex I regions
Without crediting mechanism
With a 20% cap on use of offset credits
With a 50% cap on use of offset credits
0.0
1.0
2.0
3.0
4.0
5.0
6.0
7.0
Without crediting mechanism With a 20% cap on use of offset credits
With a 50% cap on use of offset credits
% Panel A. Carbon leakage rate2 (Annex I as a whole)
1. Energy intensive industries include chemicals, metallurgic, other metal, iron and steel industry, paper and mineral products. 2. The carbon leakage rate is calculated as: [1-(world emission reduction in GtCO2eq)/(Annex I emission reduction objective in
GtCO2eq)]. It is expressed in per cent. When the emission reduction achieved at the world level (in GtCO2eq) is equal to the emission reduction objective set by Annex I (in GTCO2eq), there is no leakage overall, and the leakage rate is 0.
3. These non-EU Eastern European countries together form the « Rest of Annex I » region of the OECD ENV-Linkages model (see Burniaux and Chateau, 2008).
Source: OECD, ENV-Linkages model.

ECO/WKP(2009)42
110
Figure 5.6. CERs issued under the crediting mechanism: trends and decomposition by type of project
0
200
400
600
800
1000
1200
1400
1600
31-12-2004 31-12-2006 31-12-2008 31-12-2010 31-12-2012
Mill
ion
CE
Rs Panel A. Volume of CERs
Already issued
Projected
Fuel switch7.0%
Demand-side energy efficiency
1.3%
Afforestation & Reforestation
0.4%Transport
0.2%
Panel B. Decomposition of expected CERs in 2012 by type of project(based only on CERs already issued)
0
200
400
600
800
1000
1200
1400
1600
31-12-2004 31-12-2006 31-12-2008 31-12-2010 31-12-2012
Mill
ion
CE
Rs Panel A. Volume of CERs
Already issued
Projected
HFCs, PFCs & N2O reduction
26.0%
Renewables35.2%
CH4 reduction & Cement & Coal mine/bed
methane18.8%
Supply-side energy efficiency
11.1%
Fuel switch7.0%
Demand-side energy efficiency
1.3%
Afforestation & Reforestation
0.4%Transport
0.2%
Panel B. Decomposition of expected CERs in 2012 by type of project(based only on CERs already issued)
Note: A project has to go through four stages before the associated CERs can be issued: validation, verification, registration and issuance. The future volume of CERs is projected based on assumptions over the 2009-2012 period regarding the number of projects that will be submitted to validation, the share of projects currently at the validation stage that will be validated, the share of projects that will successfully go through the registration stage, and the amount of CERs registered projects will effectively generate (issuance success).
Source: UNEP RISØ Center.

ECO/WKP(2009)42
111
Figure 5.7. Mitigation policy costs under a world ETS and equivalent Annex I mitigation action with a crediting mechanism
-3.0
-2.0
-1.0
0.0
1.0
2.0
3.0
4.0
Can
ada
Non
-EU
Eas
tern
Eur
opea
n co
untr
ies(
1)
Oil-
prod
ucin
g co
untr
ies
Rus
sia
Aus
tral
ia a
ndN
ew Z
eala
nd
Uni
ted
Sta
tes
Ann
ex I
Non
-Ann
ex I
Res
t of t
he w
orld
EU
27+
EF
TA
Japa
n
Bra
zil
Chi
na
Indi
a
Miti
gatio
n co
st (
inco
me
equi
vale
nt v
aria
tion
rela
tive
to
base
line,
in %
)
Panel A. 2020
Under Annex I mitigation action only with a 50% cap on use of offset credits
Under a world ETS with per capita allocation rule
-1.0
0.0
1.0
2.0
lent
var
iatio
n r
elat
ive
to
%)
Panel B. 2050
-3.0
-2.0
-1.0
0.0
1.0
2.0
3.0
4.0
Can
ada
Non
-EU
Eas
tern
Eur
opea
n co
untr
ies(
1)
Oil-
prod
ucin
g co
untr
ies
Rus
sia
Aus
tral
ia a
ndN
ew Z
eala
nd
Uni
ted
Sta
tes
Ann
ex I
Non
-Ann
ex I
Res
t of t
he w
orld
EU
27+
EF
TA
Japa
n
Bra
zil
Chi
na
Indi
a
Miti
gatio
n co
st (
inco
me
equi
vale
nt v
aria
tion
rela
tive
to
base
line,
in %
)
Panel A. 2020
Under Annex I mitigation action only with a 50% cap on use of offset credits
Under a world ETS with per capita allocation rule
-6.0
-5.0
-4.0
-3.0
-2.0
-1.0
0.0
1.0
2.0
Non
-EU
Eas
tern
Eur
opea
n co
untr
ies(
1)
Rus
sia
Can
ada
Aus
tral
ia a
ndN
ew Z
eala
nd
Oil-
prod
ucin
g co
untr
ies
Ann
ex I
Uni
ted
Sta
tes
EU
27+
EF
TA
Non
-Ann
ex I
Japa
n
Res
t of t
he w
orld
Bra
zil
Chi
na
Indi
a
Miti
gatio
n co
st (
inco
me
equi
vale
nt v
aria
tion
rel
ativ
e to
ba
selin
e, in
%)
Panel B. 2050
Under Annex I mitigation action only with a 50% cap on use of offset credits
Under a world ETS with per capita allocation rule
1. These non-EU Eastern European countries together form the « Rest of Annex I » region of the OECD ENV-Linkages model (see Burniaux and Chateau, 2008).
Source: OECD, ENV-Linkages model.
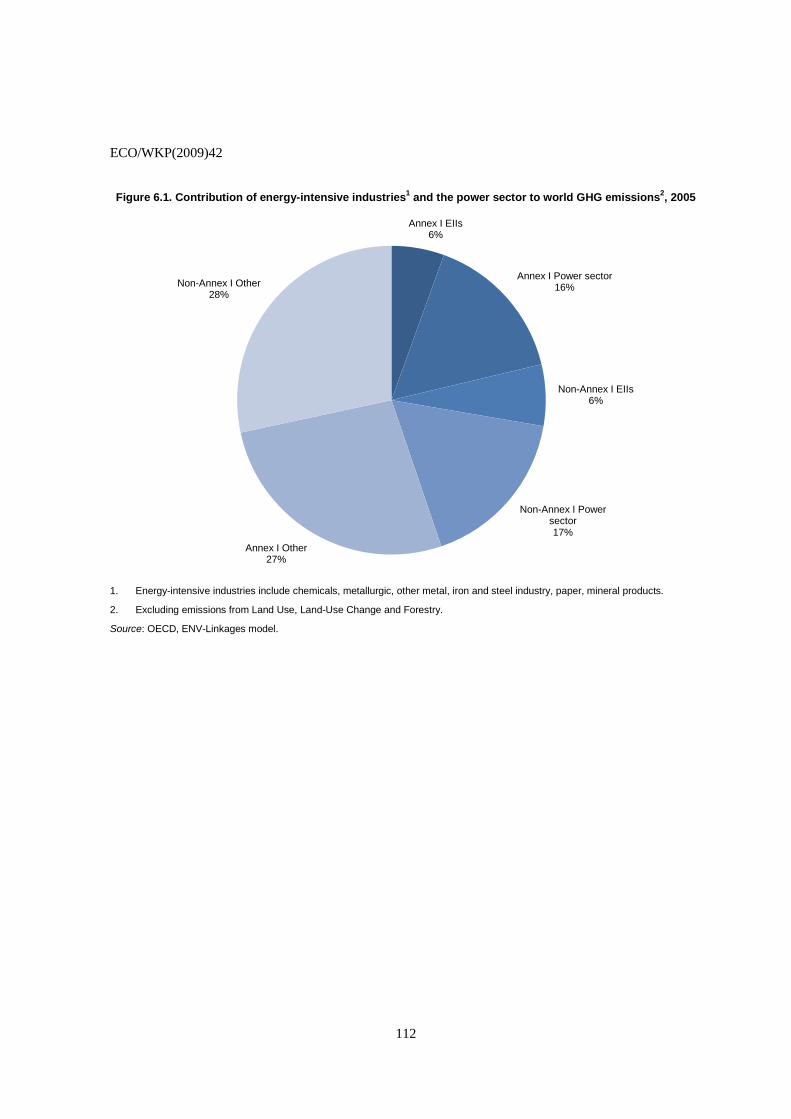
ECO/WKP(2009)42
112
Figure 6.1. Contribution of energy-intensive industries1 and the power sector to world GHG emissions2, 2005
Annex I EIIs6%
Annex I Power sector16%
Non-Annex I EIIs6%
Non-Annex I Power sector17%
Annex I Other27%
Non-Annex I Other28%
1. Energy-intensive industries include chemicals, metallurgic, other metal, iron and steel industry, paper, mineral products.
2. Excluding emissions from Land Use, Land-Use Change and Forestry.
Source: OECD, ENV-Linkages model.
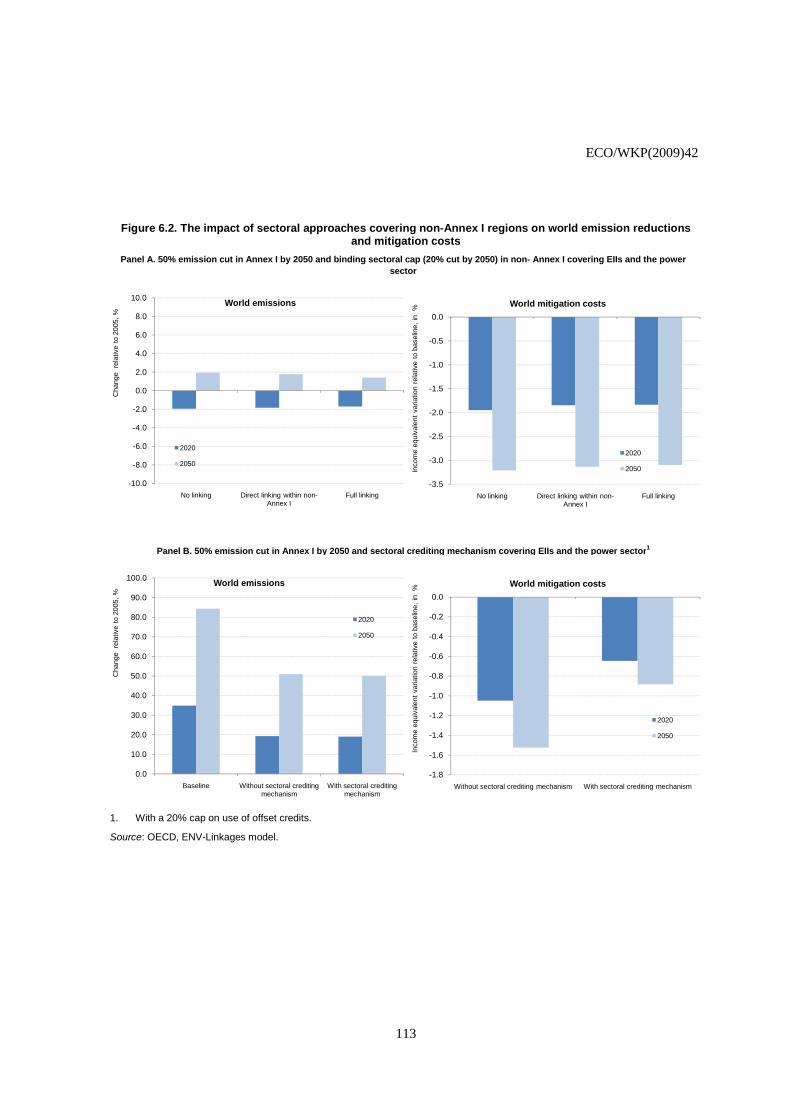
ECO/WKP(2009)42
113
Figure 6.2. The impact of sectoral approaches covering non-Annex I regions on world emission reductions and mitigation costs
Panel A. 50% emission cut in Annex I by 2050 and binding sectoral cap (20% cut by 2050) in non- Annex I covering EIIs and the power sector
Panel B. 50% emission cut in Annex I by 2050 and sectoral crediting mechanism covering EIIs and the power sector1
50.0
60.0
70.0
80.0
90.0
100.0
Cha
nge
rel
ativ
e to
200
5, %
World emissions
2020
2050
-0.8
-0.6
-0.4
-0.2
0.0
iatio
n re
lativ
e to
bas
elin
e, in
%
World mitigation costs
-10.0
-8.0
-6.0
-4.0
-2.0
0.0
2.0
4.0
6.0
8.0
10.0
No linking Direct linking within non-Annex I
Full linking
Cha
nge
rel
ativ
e to
200
5, %
World emissions
2020
2050
-3.5
-3.0
-2.5
-2.0
-1.5
-1.0
-0.5
0.0
No linking Direct linking within non-Annex I
Full linking
Inco
me
equi
vale
nt v
aria
tion
rela
tive
to b
asel
ine,
in
%
World mitigation costs
2020
2050
0.0
10.0
20.0
30.0
40.0
50.0
60.0
70.0
80.0
90.0
100.0
Baseline Without sectoral crediting mechanism
With sectoral crediting mechanism
Cha
nge
rel
ativ
e to
200
5, %
World emissions
2020
2050
-1.8
-1.6
-1.4
-1.2
-1.0
-0.8
-0.6
-0.4
-0.2
0.0
Without sectoral crediting mechanism With sectoral crediting mechanism
Inco
me
equi
vale
nt v
aria
tion
rela
tive
to b
asel
ine,
in
%
World mitigation costs
2020
2050
-10.0
-8.0
-6.0
-4.0
-2.0
0.0
2.0
4.0
6.0
8.0
10.0
No linking Direct linking within non-Annex I
Full linking
Cha
nge
rel
ativ
e to
200
5, %
World emissions
2020
2050
-3.5
-3.0
-2.5
-2.0
-1.5
-1.0
-0.5
0.0
No linking Direct linking within non-Annex I
Full linking
Inco
me
equi
vale
nt v
aria
tion
rela
tive
to b
asel
ine,
in
%
World mitigation costs
2020
2050
1. With a 20% cap on use of offset credits.
Source: OECD, ENV-Linkages model.

ECO/WKP(2009)42
114
Figure 6.3. Mitigation costs under an international ETS in Annex I and binding sectoral caps in non-Annex I regions
(50% cut in Annex I regions and 20% cut in EEIs and power sector in non-Annex I regions by 2050)
-10.0
-9.0
-8.0
-7.0
-6.0
-5.0
-4.0
-3.0
-2.0
-1.0
0.0
Indi
a
Oil-
prod
ucin
g co
untr
ies
Can
ada
Aus
tral
ia a
nd
New
Zea
land
Chi
na
Non
-EU
Eas
tern
Eur
opea
n co
untr
ies(
1)
Non
-Ann
ex I
Rus
sia
Uni
ted
Sta
tes
Ann
ex I
Res
t of t
he W
orld
Bra
zil
EU
27+
EF
TA
Japa
n
Miti
gatio
n co
st (
inco
me
equi
vale
nt v
aria
tion
rel
ativ
e to
ba
selin
e, in
%)
Panel A. 2020
Without any linking
With direct linking within non-Annex I sectoral schemes
With full linking between Annex I economy-wide and non-Annex I sectoral schemes
-10.0
-5.0
0.0
lent
var
iatio
n r
elat
ive
to
%)
Panel B. 2050
-10.0
-9.0
-8.0
-7.0
-6.0
-5.0
-4.0
-3.0
-2.0
-1.0
0.0
Indi
a
Oil-
prod
ucin
g co
untr
ies
Can
ada
Aus
tral
ia a
nd
New
Zea
land
Chi
na
Non
-EU
Eas
tern
Eur
opea
n co
untr
ies(
1)
Non
-Ann
ex I
Rus
sia
Uni
ted
Sta
tes
Ann
ex I
Res
t of t
he W
orld
Bra
zil
EU
27+
EF
TA
Japa
n
Miti
gatio
n co
st (
inco
me
equi
vale
nt v
aria
tion
rel
ativ
e to
ba
selin
e, in
%)
Panel A. 2020
Without any linking
With direct linking within non-Annex I sectoral schemes
With full linking between Annex I economy-wide and non-Annex I sectoral schemes
-25.0
-20.0
-15.0
-10.0
-5.0
0.0
Non
-EU
Eas
tern
Eur
opea
n co
untr
ies(
1)
Rus
sia
Oil-
prod
ucin
g co
untr
ies
Can
ada
Aus
tral
ia a
ndN
ew Z
eala
nd
Indi
a
Non
-Ann
ex I
Chi
na
Ann
ex I
EU
27+
EF
TA
Uni
ted
Sta
tes
Res
t of t
he W
orld
Japa
n
Bra
zil
Miti
gatio
n co
st (
inco
me
equi
vale
nt v
aria
tion
rel
ativ
e to
ba
selin
e, in
%)
Panel B. 2050
Without any linking
With direct linking within non-Annex I sectoral schemes
With full linking between Annex I economy-wide and non-Annex I sectoral schemes
Note: All scenarios combine a 50% emission cut in Annex I (relative to 1990 levels) and a 20% cut in EIIs and the power sector in non-Annex I (relative to 2005 levels) by 2050.
1. These non-EU Eastern European countries together form the « Rest of Annex I » region of the OECD ENV-Linkages model (see Burniaux and Chateau, 2008).
Source: OECD, ENV-Linkages model.
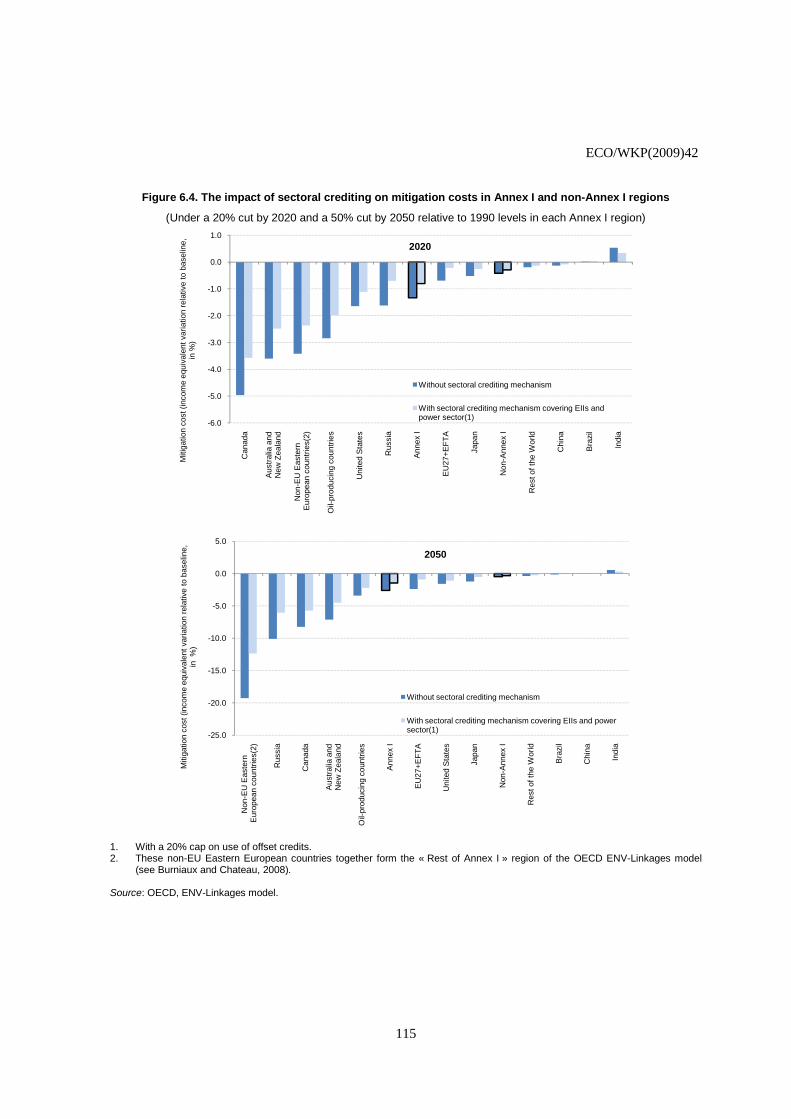
ECO/WKP(2009)42
115
Figure 6.4. The impact of sectoral crediting on mitigation costs in Annex I and non-Annex I regions
(Under a 20% cut by 2020 and a 50% cut by 2050 relative to 1990 levels in each Annex I region)
-6.0
-5.0
-4.0
-3.0
-2.0
-1.0
0.0
1.0C
anad
a
Aus
tral
ia a
nd
New
Zea
land
Non
-EU
Eas
tern
Eur
opea
n co
untr
ies(
2)
Oil-
prod
ucin
g co
untr
ies
Uni
ted
Sta
tes
Rus
sia
Ann
ex I
EU
27+
EF
TA
Japa
n
Non
-Ann
ex I
Res
t of t
he W
orld
Chi
na
Bra
zil
Indi
a
Miti
gatio
n co
st (
inco
me
equi
vale
nt v
aria
tion
rela
tive
to b
asel
ine,
in
%)
2020
Without sectoral crediting mechanism
With sectoral crediting mechanism covering EIIs and power sector(1)
0.0
5.0
to b
asel
ine,
2050
-6.0
-5.0
-4.0
-3.0
-2.0
-1.0
0.0
1.0C
anad
a
Aus
tral
ia a
nd
New
Zea
land
Non
-EU
Eas
tern
Eur
opea
n co
untr
ies(
2)
Oil-
prod
ucin
g co
untr
ies
Uni
ted
Sta
tes
Rus
sia
Ann
ex I
EU
27+
EF
TA
Japa
n
Non
-Ann
ex I
Res
t of t
he W
orld
Chi
na
Bra
zil
Indi
a
Miti
gatio
n co
st (
inco
me
equi
vale
nt v
aria
tion
rela
tive
to b
asel
ine,
in
%)
2020
Without sectoral crediting mechanism
With sectoral crediting mechanism covering EIIs and power sector(1)
-25.0
-20.0
-15.0
-10.0
-5.0
0.0
5.0
Non
-EU
Eas
tern
Eur
opea
n co
untr
ies(
2)
Rus
sia
Can
ada
Aus
tral
ia a
nd
New
Zea
land
Oil-
prod
ucin
g co
untr
ies
Ann
ex I
EU
27+
EF
TA
Uni
ted
Sta
tes
Japa
n
Non
-Ann
ex I
Res
t of t
he W
orld
Bra
zil
Chi
na
Indi
a
Miti
gatio
n co
st (
inco
me
equi
vale
nt v
aria
tion
rela
tive
to b
asel
ine,
in
%)
2050
Without sectoral crediting mechanism
With sectoral crediting mechanism covering EIIs and power sector(1)
1. With a 20% cap on use of offset credits. 2. These non-EU Eastern European countries together form the « Rest of Annex I » region of the OECD ENV-Linkages model
(see Burniaux and Chateau, 2008). Source: OECD, ENV-Linkages model.

ECO/WKP(2009)42
116
Figure 6.5. The impact of sectoral crediting on carbon leakage rates1
(Carbon leakage rate for Annex I as a whole, under a scenario where emissions in Annex I regions are cut by 20% by 2020 and 50% by 2050 relative to 1990 levels)
0.0
1.0
2.0
3.0
4.0
5.0
6.0
7.0
50% emission reduction in Annex I by 2050, with sectoral crediting mechanism (2)
50% emission reduction in Annex I by 2050, without sectoral crediting mechanism
%2020
2050
1. The carbon leakage rate is calculated as: [1-(world emission reduction in GtCO2eq)/(Annex I emission reduction objective in GtCO2eq)]. It is expressed in per cent. When the emission reduction achieved at the world level (in GtCO2eq) is equal to the emission reduction objective set by Annex I (in GTCO2eq), there is no leakage overall, and the leakage rate is 0.
2. With a 20% cap on use of offset credits.
Source: OECD, ENV-Linkages model.
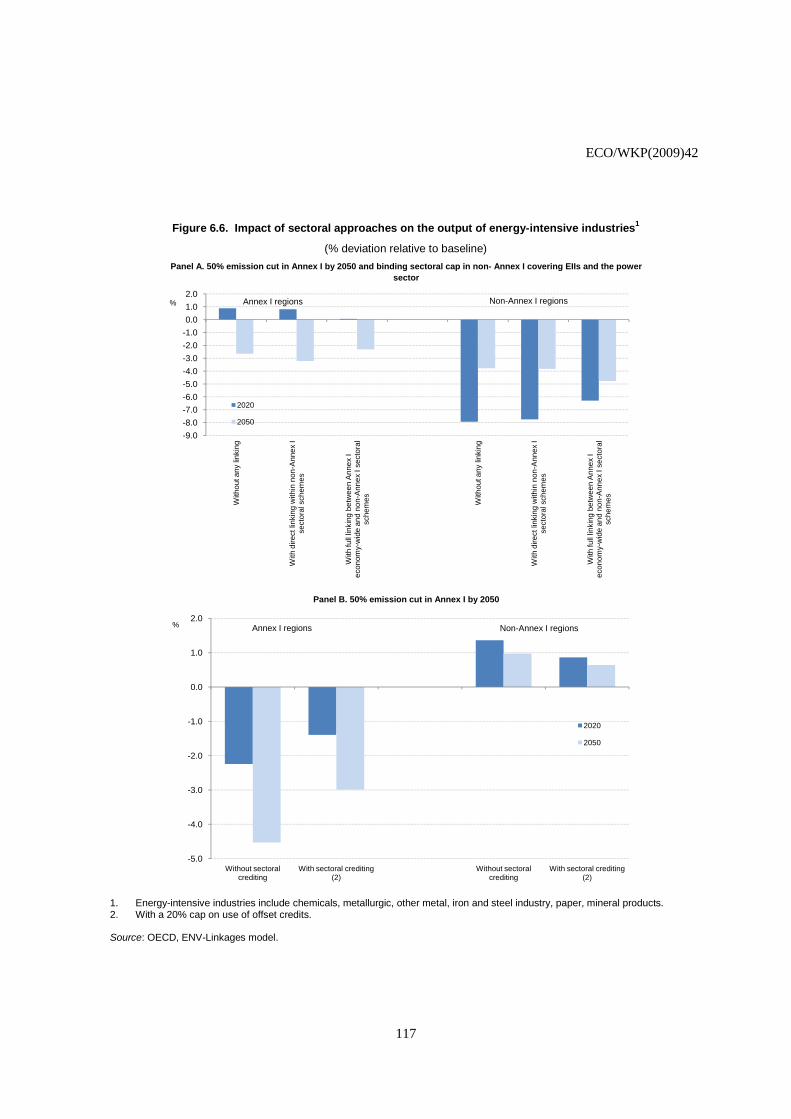
ECO/WKP(2009)42
117
Figure 6.6. Impact of sectoral approaches on the output of energy-intensive industries1
(% deviation relative to baseline)
Panel A. 50% emission cut in Annex I by 2050 and binding sectoral cap in non- Annex I covering EIIs and the power sector
Panel B. 50% emission cut in Annex I by 2050
2.0
-9.0
-8.0
-7.0
-6.0
-5.0
-4.0
-3.0
-2.0
-1.0
0.0
1.0
2.0
With
out a
ny li
nkin
g
With
dire
ct li
nkin
g w
ithin
non
-Ann
ex I
sect
oral
sch
emes
With
full
linki
ng b
etw
een
Ann
ex I
econ
omy-
wid
e an
d no
n-A
nnex
I se
ctor
al
sche
mes With
out a
ny li
nkin
g
With
dire
ct li
nkin
g w
ithin
non
-Ann
ex I
sect
oral
sch
emes
With
full
linki
ng b
etw
een
Ann
ex I
econ
omy-
wid
e an
d no
n-A
nnex
I se
ctor
al
sche
mes
%
2020
2050
Annex I regions Non-Annex I regions
-5.0
-4.0
-3.0
-2.0
-1.0
0.0
1.0
2.0
Without sectoral crediting
With sectoral crediting (2)
Without sectoral crediting
With sectoral crediting (2)
%
2020
2050
Annex I regions Non-Annex I regions
-9.0
-8.0
-7.0
-6.0
-5.0
-4.0
-3.0
-2.0
-1.0
0.0
1.0
2.0
With
out a
ny li
nkin
g
With
dire
ct li
nkin
g w
ithin
non
-Ann
ex I
sect
oral
sch
emes
With
full
linki
ng b
etw
een
Ann
ex I
econ
omy-
wid
e an
d no
n-A
nnex
I se
ctor
al
sche
mes With
out a
ny li
nkin
g
With
dire
ct li
nkin
g w
ithin
non
-Ann
ex I
sect
oral
sch
emes
With
full
linki
ng b
etw
een
Ann
ex I
econ
omy-
wid
e an
d no
n-A
nnex
I se
ctor
al
sche
mes
%
2020
2050
Annex I regions Non-Annex I regions
1. Energy-intensive industries include chemicals, metallurgic, other metal, iron and steel industry, paper, mineral products. 2. With a 20% cap on use of offset credits. Source: OECD, ENV-Linkages model.
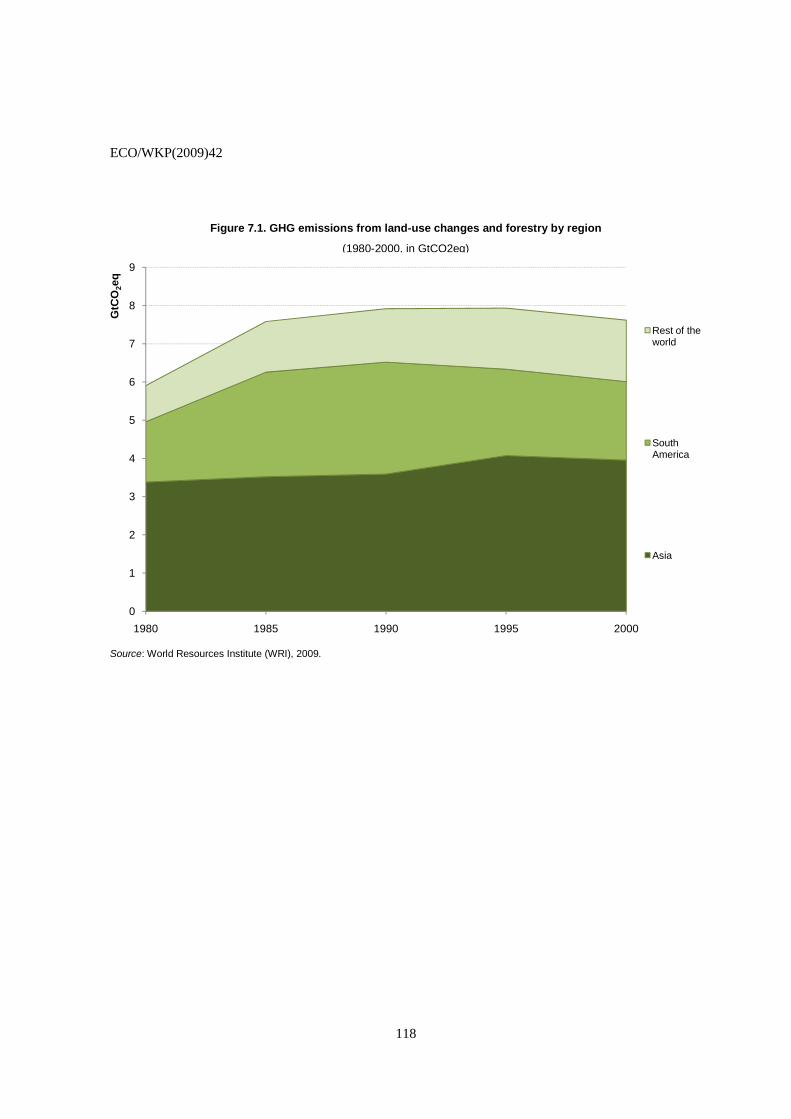
ECO/WKP(2009)42
118
Figure 7.1. GHG emissions from land-use changes and forestry by region
(1980-2000, in GtCO2eq)
4
5
6
7
8
9
GtC
O2e
q
Rest of the world
South America
0
1
2
3
4
5
6
7
8
9
1980 1985 1990 1995 2000
GtC
O2e
q
Rest of the world
South America
Asia
Source: World Resources Institute (WRI), 2009.
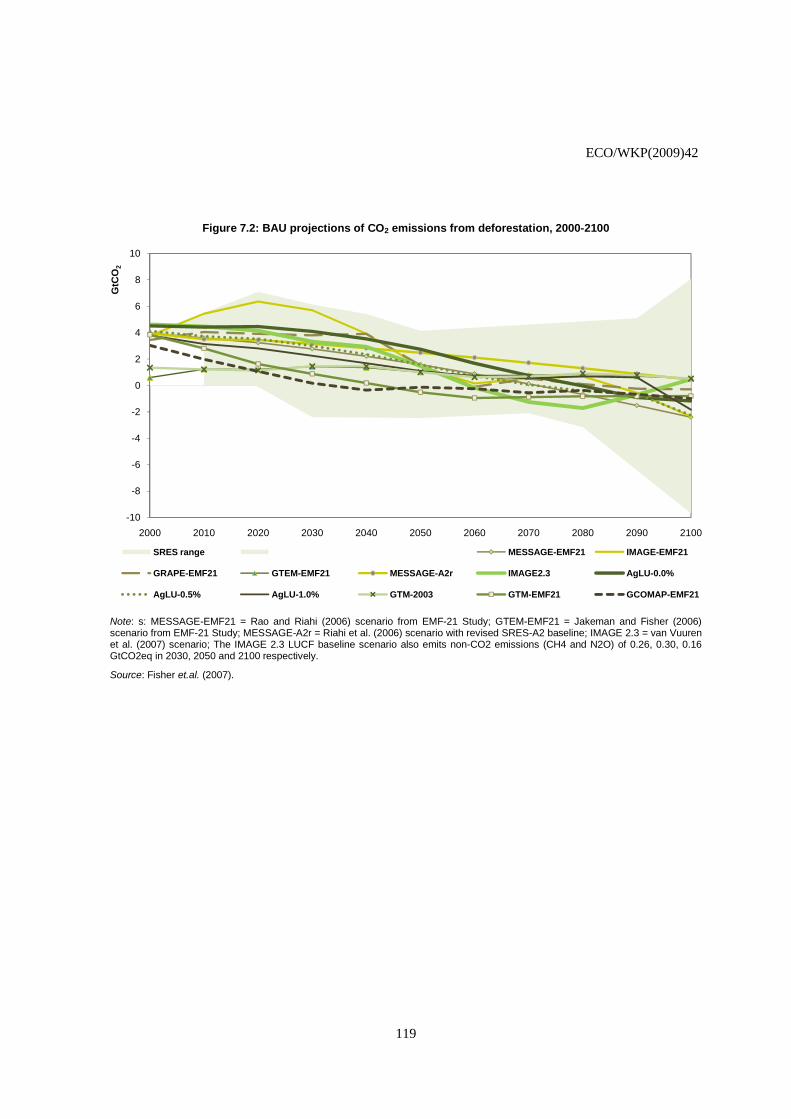
ECO/WKP(2009)42
119
Figure 7.2: BAU projections of CO2 emissions from deforestation, 2000-2100
-4
-2
0
2
4
6
8
10
GtC
O2
-10
-8
-6
-4
-2
0
2
4
6
8
10
2000 2010 2020 2030 2040 2050 2060 2070 2080 2090 2100
GtC
O2
SRES range MESSAGE-EMF21 IMAGE-EMF21
GRAPE-EMF21 GTEM-EMF21 MESSAGE-A2r IMAGE2.3 AgLU-0.0%
AgLU-0.5% AgLU-1.0% GTM-2003 GTM-EMF21 GCOMAP-EMF21
Note: s: MESSAGE-EMF21 = Rao and Riahi (2006) scenario from EMF-21 Study; GTEM-EMF21 = Jakeman and Fisher (2006) scenario from EMF-21 Study; MESSAGE-A2r = Riahi et al. (2006) scenario with revised SRES-A2 baseline; IMAGE 2.3 = van Vuuren et al. (2007) scenario; The IMAGE 2.3 LUCF baseline scenario also emits non-CO2 emissions (CH4 and N2O) of 0.26, 0.30, 0.16 GtCO2eq in 2030, 2050 and 2100 respectively.
Source: Fisher et.al. (2007).
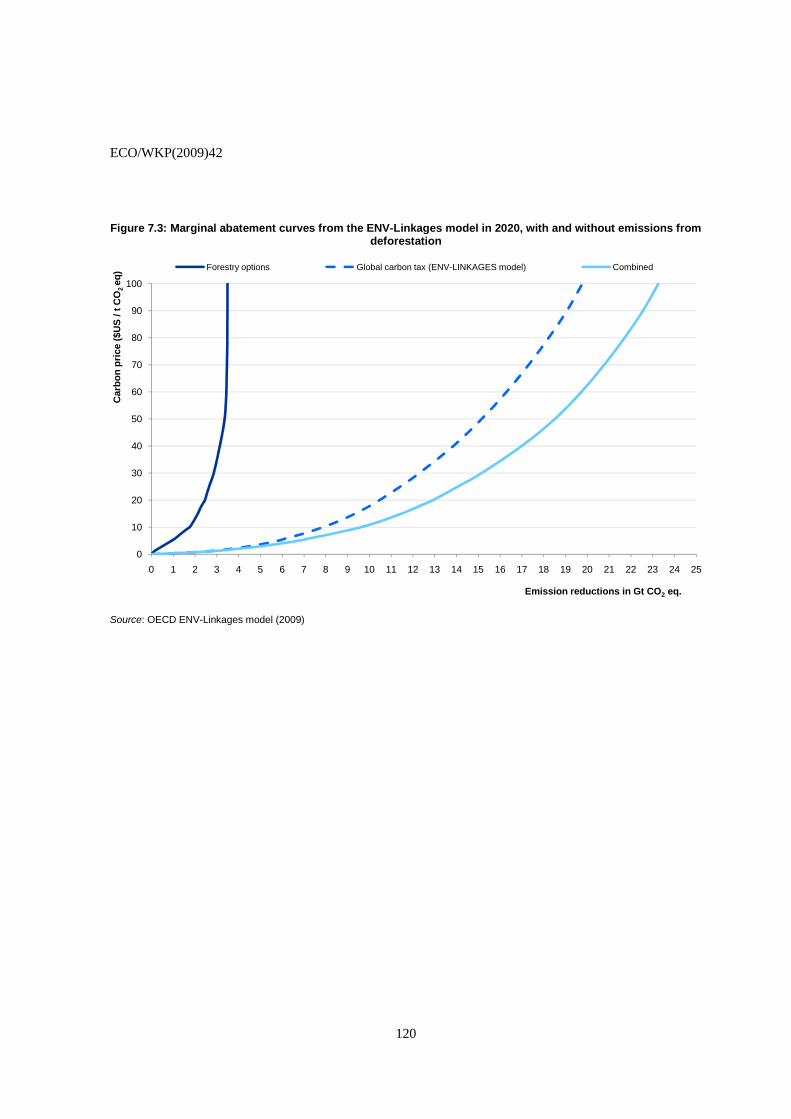
ECO/WKP(2009)42
120
Figure 7.3: Marginal abatement curves from the ENV-Linkages model in 2020, with and without emissions from deforestation
50
60
70
80
90
100
Car
bo
n p
rice
($U
S /
t C
O2 eq
) Forestry options Global carbon tax (ENV-LINKAGES model) Combined
0
10
20
30
40
50
60
70
80
90
100
0 1 2 3 4 5 6 7 8 9 10 11 12 13 14 15 16 17 18 19 20 21 22 23 24 25
Car
bo
n p
rice
($U
S /
t C
O2 eq
)
Emission reductions in Gt CO2 eq.
Forestry options Global carbon tax (ENV-LINKAGES model) Combined
Source: OECD ENV-Linkages model (2009)
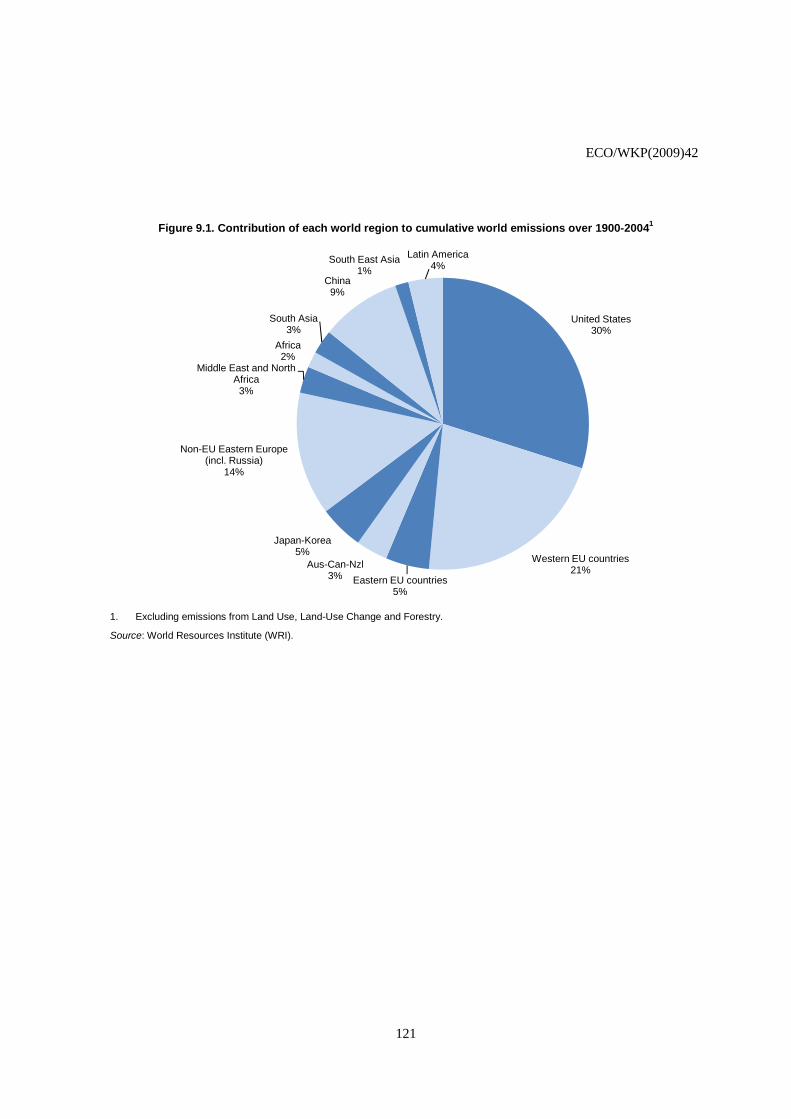
ECO/WKP(2009)42
121
Figure 9.1. Contribution of each world region to cumulative world emissions over 1900-20041
United States30%
Western EU countries21%
Eastern EU countries5%
Aus-Can-Nzl3%
Japan-Korea5%
Non-EU Eastern Europe (incl. Russia)
14%
Middle East and North Africa3%
Africa2%
South Asia3%
China9%
South East Asia1%
Latin America4%
1. Excluding emissions from Land Use, Land-Use Change and Forestry.
Source: World Resources Institute (WRI).
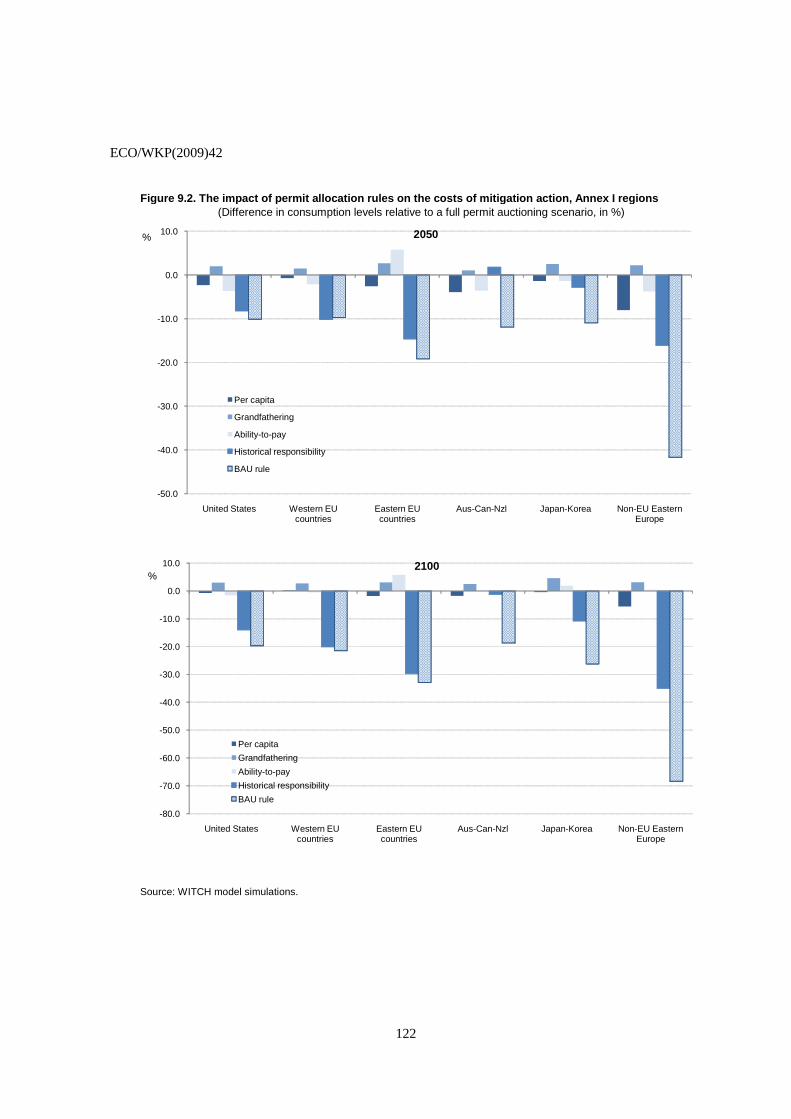
ECO/WKP(2009)42
122
Figure 9.2. The impact of permit allocation rules on the costs of mitigation action, Annex I regions(Difference in consumption levels relative to a full permit auctioning scenario, in %)
Source: WITCH model simulations.
-50.0
-40.0
-30.0
-20.0
-10.0
0.0
10.0
United States Western EU countries
Eastern EU countries
Aus-Can-Nzl Japan-Korea Non-EU Eastern Europe
% 2050
Per capita
Grandfathering
Ability-to-pay
Historical responsibility
BAU rule
-80.0
-70.0
-60.0
-50.0
-40.0
-30.0
-20.0
-10.0
0.0
10.0
United States Western EU countries
Eastern EU countries
Aus-Can-Nzl Japan-Korea Non-EU Eastern Europe
%2100
Per capita
Grandfathering
Ability-to-pay
Historical responsibility
BAU rule
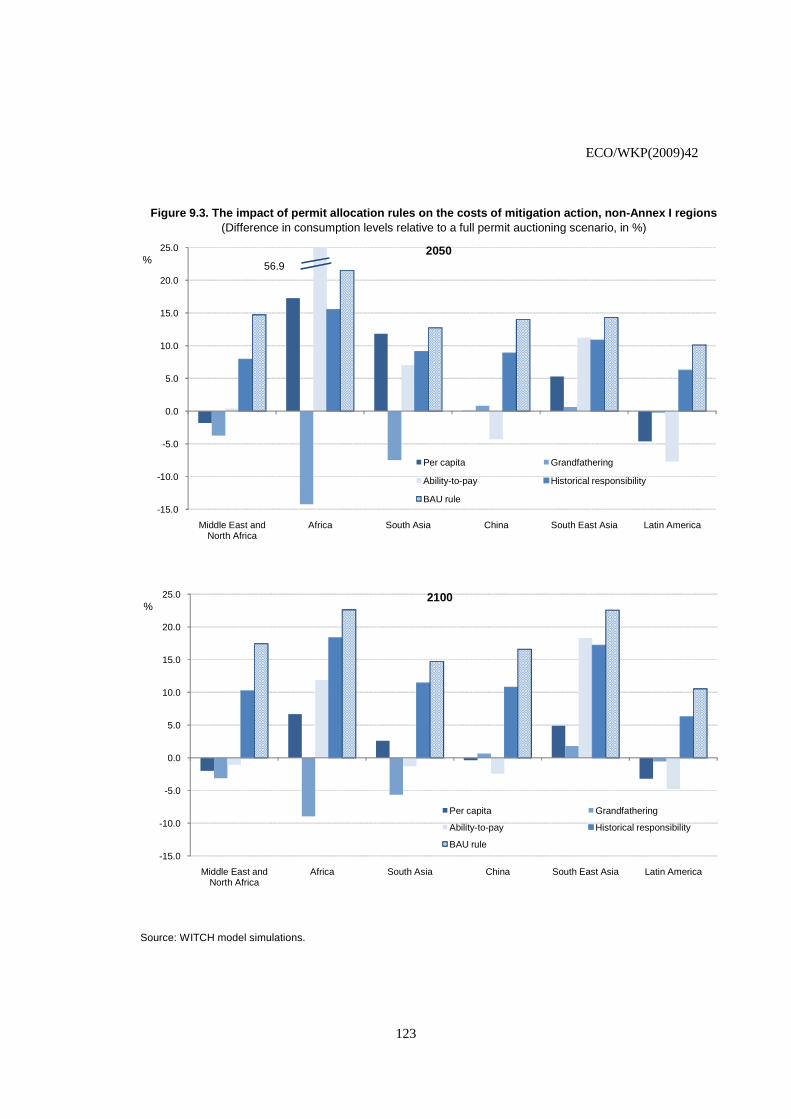
ECO/WKP(2009)42
123
Figure 9.3. The impact of permit allocation rules on the costs of mitigation action, non-Annex I regions(Difference in consumption levels relative to a full permit auctioning scenario, in %)
Source: WITCH model simulations.
-15.0
-10.0
-5.0
0.0
5.0
10.0
15.0
20.0
25.0
Middle East and North Africa
Africa South Asia China South East Asia Latin America
%2050
Per capita Grandfathering
Ability-to-pay Historical responsibility
BAU rule
56.9
-15.0
-10.0
-5.0
0.0
5.0
10.0
15.0
20.0
25.0
Middle East and North Africa
Africa South Asia China South East Asia Latin America
%2100
Per capita Grandfathering
Ability-to-pay Historical responsibility
BAU rule

ECO/WKP(2009)42
124
Figure 9.4. International technology transfer trends, 1978-2008
10.0
12.0
14.0
16.0
18.0
20.0
22.0
24.0
26.0
28.0
30.019
78
1979
1980
1981
1982
1983
1984
1985
1986
1987
1988
1989
1990
1991
1992
1993
1994
1995
1996
1997
1998
1999
2000
2001
2002
2003
Exp
ort r
ate
(%) Rate of export of climate mitigation technologies1
Climate mitigation technologies
All sectors
(As measured by the share of inventions that are patented in at least two countries, in %)
7000
entio
ns International technology transfer flows2
(Number of climate mitigation technologies exported, as measured by the
10.0
12.0
14.0
16.0
18.0
20.0
22.0
24.0
26.0
28.0
30.019
78
1979
1980
1981
1982
1983
1984
1985
1986
1987
1988
1989
1990
1991
1992
1993
1994
1995
1996
1997
1998
1999
2000
2001
2002
2003
Exp
ort r
ate
(%) Rate of export of climate mitigation technologies1
Climate mitigation technologies
All sectors
(As measured by the share of inventions that are patented in at least two countries, in %)
0
1000
2000
3000
4000
5000
6000
7000
1978
1979
1980
1981
1982
1983
1984
1985
1986
1987
1988
1989
1990
1991
1992
1993
1994
1995
1996
1997
1998
1999
2000
2001
2002
2003
Num
ber o
f exp
orte
d in
vent
ions International technology transfer flows2
North_North
North_South
South_North
South_South
(Number of climate mitigation technologies exported, as measured by the number of inventions that are patented in at least two countries)
1. Climate mitigation technologies cover 13 fields: 6 renewable energy technologies (wind, solar, geothermal, ocean energy, biomass and hydropower), waste use and recovery, methane destruction, climate-friendly cement, energy conservation in buildings, motor vehicle fuel injection, energy-efficient lighting and carbon capture & storage (CCS).
2. North and south countries denote Annex I and non-Annex I countries, respectively.
Source: Dechezleprêtre et al. (2008).
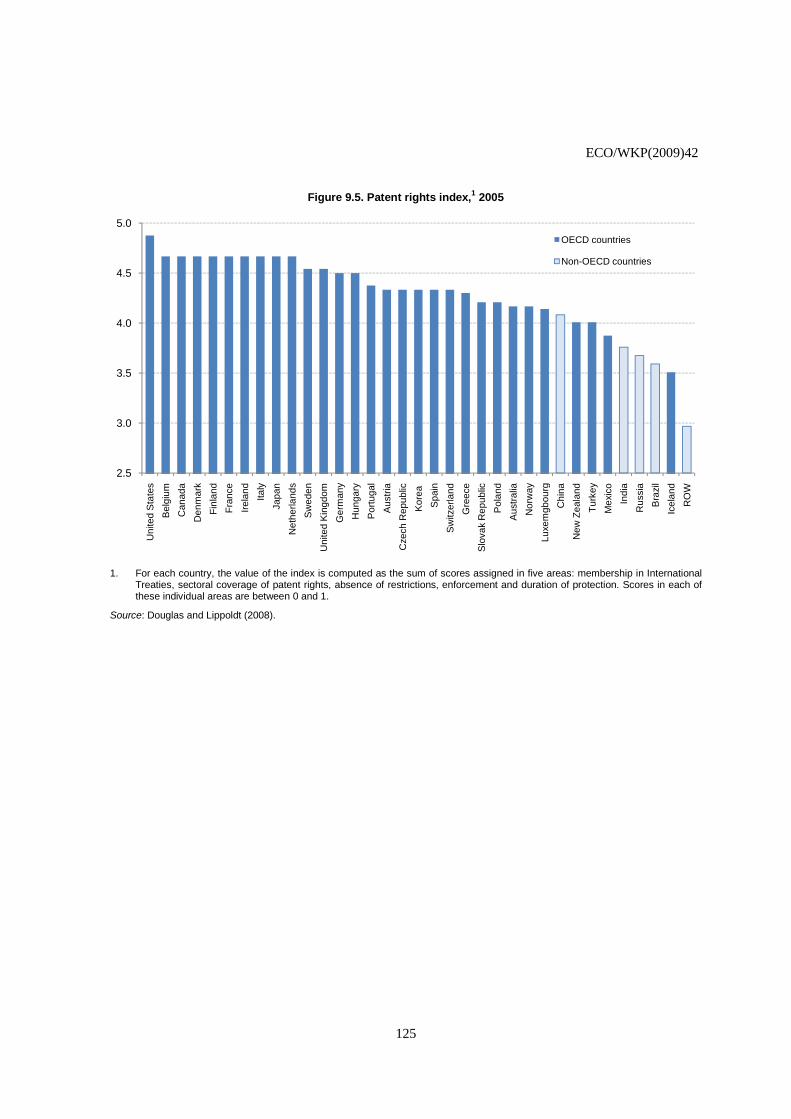
ECO/WKP(2009)42
125
Figure 9.5. Patent rights index,1 2005
2.5
3.0
3.5
4.0
4.5
5.0
Uni
ted
Sta
tes
Bel
gium
Can
ada
Den
mar
k
Fin
land
Fra
nce
Irel
and
Italy
Japa
n
Net
herla
nds
Sw
eden
Uni
ted
Kin
gdom
Ger
man
y
Hun
gary
Por
tuga
l
Aus
tria
Cze
ch R
epub
lic
Kor
ea
Spa
in
Sw
itzer
land
Gre
ece
Slo
vak
Rep
ublic
Pol
and
Aus
tral
ia
Nor
way
Luxe
mgb
ourg
Chi
na
New
Zea
land
Tur
key
Mex
ico
Indi
a
Rus
sia
Bra
zil
Icel
and
RO
W
OECD countries
Non-OECD countries
1. For each country, the value of the index is computed as the sum of scores assigned in five areas: membership in International Treaties, sectoral coverage of patent rights, absence of restrictions, enforcement and duration of protection. Scores in each of these individual areas are between 0 and 1.
Source: Douglas and Lippoldt (2008).
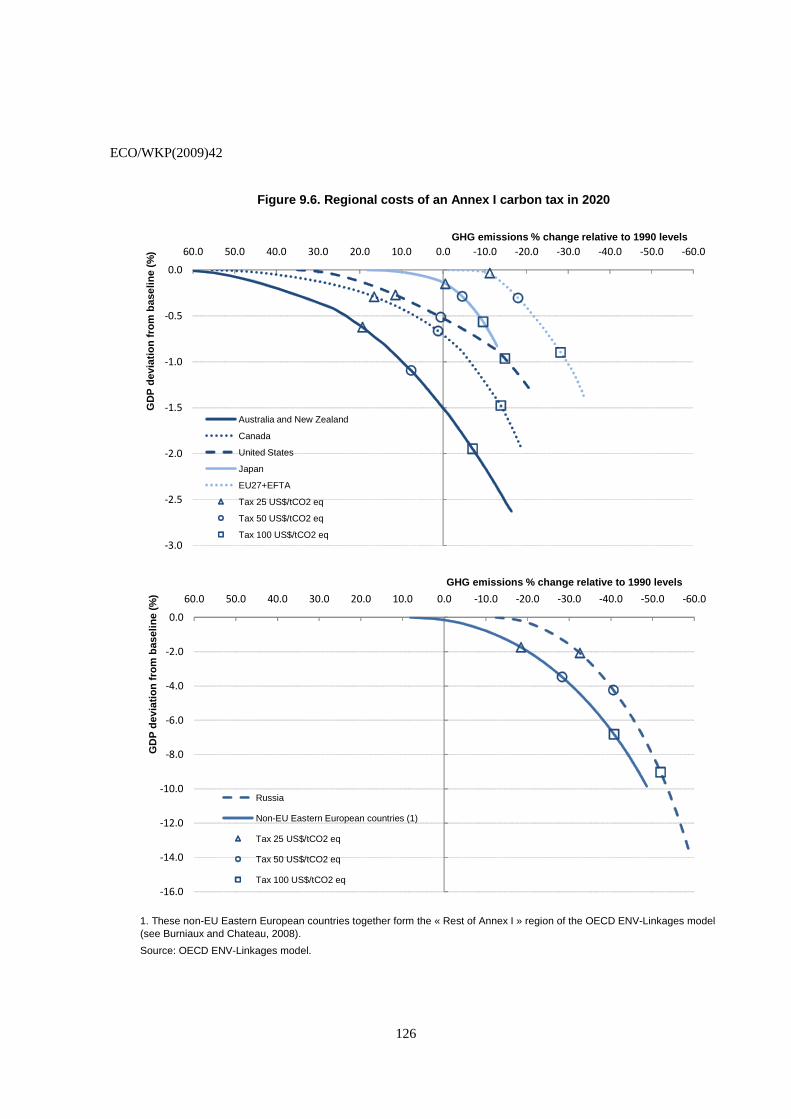
ECO/WKP(2009)42
126
Figure 9.6. Regional costs of an Annex I carbon tax in 2020
Source: OECD ENV-Linkages model.
1. These non-EU Eastern European countries together form the « Rest of Annex I » region of the OECD ENV-Linkages model (see Burniaux and Chateau, 2008).
-3.0
-2.5
-2.0
-1.5
-1.0
-0.5
0.0
-60.0-50.0-40.0-30.0-20.0-10.00.010.020.030.040.050.060.0
GD
P d
evia
tio
n f
rom
bas
elin
e (%
)
GHG emissions % change relative to 1990 levels
Australia and New Zealand
Canada
United States
Japan
EU27+EFTA
Tax 25 US$/tCO2 eq
Tax 50 US$/tCO2 eq
Tax 100 US$/tCO2 eq
-16.0
-14.0
-12.0
-10.0
-8.0
-6.0
-4.0
-2.0
0.0
-60.0-50.0-40.0-30.0-20.0-10.00.010.020.030.040.050.060.0
GD
P d
evia
tio
n f
rom
bas
elin
e (%
)
GHG emissions % change relative to 1990 levels
Russia
Non-EU Eastern European countries (1)
Tax 25 US$/tCO2 eq
Tax 50 US$/tCO2 eq
Tax 100 US$/tCO2 eq

ECO/WKP(2009)42
127
WORKING PAPERS
The full series of Economics Department Working Papers can be consulted at www.oecd.org/eco/working_papers/
700. Capital inflows, household debt and the boom bust cycle in Estonia (May 2009) Zuzana Brixiova, Laura Vartia and Andreas Wörgötter
699. The effect of financial crises on potential output: new empirical evidence from OECD countries
(May 2009) Davide Furceri and Annabelle Mourougane 698. Employment - productivity trade-off and labour composition
(May 2009) Hervé Boulhol and Laure Turner 697. Labour market flexibility in Estonia: what more can be done? (May 2009) Zuzana Brixiova 696. Structural policies to overcome geographic barriers and create prosperity in New Zealand (April 2009) Yvan Guillemette 695. Ten years of product market reform in OECD countries – insights from a revised PMR indicator (April 2009) Anita Wölfl, Isabelle Wanner, Tomasz Kozluk and Giuseppe Nicoletti 694. Structural reforms and the benefits of the enlarged eu internal market (April 2009) Jens Arnold, Peter Höller, Margaret Morgan and Andreas Wörgötter 693. Co-benefits of climate change mitigation policies: literature review and new results (April 2009) Johannes Bollen, Bruno Guay, Stéphanie Jamet and Jan Corfee-Morlot 692. The impact of monetary and commodity fundamentals, macro news and central bank communication
on the exchange rate: Evidence from South Africa (April 2009) Balázs Égert 691. Assessing the impacts of climate change: a literature review (April 2009) Stéphanie Jamet and Jan Corfee-Morlot 690. The determinants of employment and earnings in Indonesia: a multinomial selection approach (April 2009) Margherita Comola and Luiz de Mello 689. Inflation responses to recent shocks: do G7 countries behave differently (April 2009) Lukas Vogel, Elena Rusticelli, Pete Richardson, Stéphanie Guichard and Christian
Gianella 688. Infrastructure investment in network industries: the role of incentive regulation and regulatory
independence (March 2009) Balázs Égert 687. Government consumption volatility and the size of nations (March 2009) Davide Furceri and Marcos Poplawski Ribeiro 686. Infrastructure investment: links to growth and the role of public policies
ECO/WKP(2009)42
128
(March 2009) Balázs Égert and Tomasz Kozluk and Douglas Sutherland 685. Infrastructure and growth: empirical evidence (March 2009) Balázs Égert and Tomasz Kozluk and Douglas Sutherland 684. The effects of population structure on employment and productivity (March 2009) Hervé Boulhol 683. The macroeconomic consequences of banking crises in OECD countries (March 2009) David Haugh, Patrice Ollivaud and David Turner 682. Adjusting housing policies in Slovakia in light of euro adoption (March 2009) Felix Hüfner 681. Achieving fiscal flexibility and safeguarding sustainabilit - The case of Slovakia (March 2009) Isabell Koske 680. Raising the flexibility of the Slovak economy during the catch-up phaseDo Latin American central
bankers behave non-linearly? The experience of Brazil, Chile, Colombia and Mexico (March 2009) Isabell Koske 679. Do Latin American central bankers behave non-linearly? The experience of Brazil, Chile, Colombia
and Mexico (February 2009) Luiz de Mello, Diego Moccero and Matteo Mogliani 678. Enhancing educational performance in Australia (February 2009) Vassiliki Koutsogeorgopoulou 677. Quantifying the effect of financial conditions in the euro area, Japan, United Kingdom and United
States (February 2009) Stéphanie Guichard, David Haugh et David Turner 676. Taking stock of existing structural policy and outcome indicators/ Un inventaire des indicateurs
structurels de politique et de performance (February 2009) Davide Furceri and Annabelle Mourougane 675. Stabilization Effects of Social Spending: Empirical Evidence from a Panel of OECD Countries (February 2009) Davide Furceri 674. Fiscal Convergence, Business Cycle Volatility and Growth (February 2009) Davide Furceri 673. Boosting Productivity in Korea’s service sector (February 2009) Randall S. Jones 672. Sustaining growth in Korea by reforming the labour market and improving the education system (February 2009) Randall S. Jones and Masahiko Tsutsumi 671. Reforming the tax system to promote economic growth and cope with rapid population ageing (February 2009) Randall S. Jones


![English for Lawyers ภรั๠ภภี๠๕7KLV 1RWLILFDWLRQ VKDOO FRPH LQWR IRUFH DV IURP WKH GD\ IROORZLQJ GDWH RI LWV SXEOLFDWLRQLQ WKH *RYHUQPHQW *D]HWWH](https://img.pdfslide.tips/doc/110x75/60e222f1a7f71653db6434a9/english-for-lawyers-a7klv-1rwlilfdwlrq.jpg)


![General English (CC-105) [English Medium]](https://img.pdfslide.tips/doc/110x75/625a657d90c17759815f7665/general-english-cc-105-english-medium.jpg)