Embed Size (px)
Citation preview
International Review of Business Research Papers Vol. 4 No.2 March 2008 Pp.26-50
Entrepreneurs’ Economic Success Index and Its Influencing Factors: An Empirical Analysis
Bashir Ahmed Bhuiyan* and Mahmood Osman Imam**
The present study employs Akhouri’s entrepreneurs’ economic success index (EESI) to investigate the success or failure of the 100 sampled small enterprises in Bangladesh. Using EESI, the study empirically estimates the success score of these sampled enterprises and relates the score with various characteristics and behavior of the entrepreneurs so that contributing factors in the achievement of success can be identified. The study endeavored to have identified four determinants of success for the sampled enterprises. These are taking risk to venture a new pursuit, sensing opportunity and mobilizing resources, managing enterprises efficiently to generate profit and finally achievement orientations for continuous expansion and improvement of the business. A number of phenomena have been observed in the study that entrepreneurs in the young and middle age group with unique family status are more successful. When comparison is made in terms of sources of ownership, self initiators are found to be most successful. Entrepreneurs having multiple businesses are more successful comparing to entrepreneurs having single business unit. When type and nature of operations of the enterprises are studied, enterprises having simple technology and easy operational procedure, in growing sectors of the economy and manufacturing sector tend to be much successful. The analysis of contingency table between age of the entrepreneurs and training status evidences no specific patterns. In studying the gender and marital status, female and married entrepreneurs are found to be more successful and when gender is compared to the educational background the positive impact of education is found in both the genders but highest impact of education is reflected in the women entrepreneurs. Meanwhile in studying the relationship between training and experience it is found that training substitutes the experience of the entrepreneurs rather than becomes complementary to each other. For training and educational background, training is found supplementary to the moderate educational background and alternative to the high educational background. Comparison of experience and educational background produces no specific pattern rather the mixed impact on the entrepreneurs’ performance. However, the effectiveness of training does not vary with respect to gender. The above-mentioned findings related to training suggest that training program for entrepreneurship development be need based with specific duration and contents to ensure expected benefits. The analysis of the size of the enterprise and nature of operations suggests that enterprises in the manufacturing sectors with less than 10 employees, having less than one million taka as asset employed, and less than 20 million taka of annual sales tend to be more successful. This indicates that the smaller the size of the enterprise, the higher is the degree of operating the firm efficiently to become successful. The overall study concludes that the young entrepreneurs with moderate age and smaller size of the enterprises having training with moderate education prone to be successful. The other major findings of the paper provide policy implication that enterprise having higher network and enterprise that does have access to credit with one or more support services (i.e. Credit++, Credit+) would be successful. So, the policy issues should be considered while designing small enterprise development initiatives.
Field of Research: Small Business Entrepreneurship ________________________________ *Bashir Ahmed Bhuiyan, Assistant Professor, Department of Business Administration, Leading University, Sylhet. **Dr. Mahmood Osman Imam, Professor of Finance, School of Business, Independent University, Bangladesh, 83Sharwardy Avenue, Baridhara, Email: [email protected]; [email protected].
Both the authors have equal contribution to the paper.
Bhuiyan & Imam
27
Introduction The important goals of a business enterprise are to realize profit, achieve growth, and obtain sustainability in the market through successful business operations over the competitors. The achievement of all these objectives necessitate for the entrepreneurs to serve the customers in a better way than the competitors. This in turn requires choosing the appropriate product, managing the enterprise in an effective and efficient manner, doing all the marketing activities aimed at satisfying the customer needs and finally acquiring and utilizing finance so as to maximize the firms value in the long-term. Therefore, to measure the success of an entrepreneur various measurement tools can be used in the light of gauging previously stated different categories of goals. To measure the success status of the entrepreneurs’ present study aimed to capture the four success criteria: risk taking, resource mobilization, generating of profit and achievement orientation. Risk taking has been calculated through measuring the entrepreneurs’ equity contribution in the business. For resource mobilization entrepreneurs’ ability to obtain resources through borrowed and raised capital is considered. Efficiency in utilization of resources is evaluated by measuring profit generating ability. As a proxy of the achievement orientation capability of entrepreneurs to reinvest portion of his or her capital for further proliferation of present business has been taken into the consideration. Success criteria of the entrepreneurs have been measured by employing Akhouri’s success index model. Based on the results of the study important policy options have been suggested after measurement of the success index. The study is conducted on 100 small enterprises based on purposive sampling method. Basically data were collected through direct interview method using semi structured interview schedule. Enterprises were selected from different sectors of the nature of operations. Major findings of the study are focused on the issue of how entrepreneurial characteristics and functions related variables influence the success index of the entrepreneurs. Impact of informal network relationship and support services have also been focused to draw the conclusion and to suggest policy implication for the study. The study is started with literature survey to find out the critical aspects related with the measurement of the entrepreneurship economic success index and then identified important success criteria. Akhouri’s success index model is then modified relevant to this study. Afterwards empirical analysis was done by keeping consistency with research objectives. Finally the study completed with major findings, conclusion and policy options suggested from the study. Literature Review on Entrepreneurs Success Measurement Regarding entrepreneurial success measurement in the small enterprise sector plenty of research has been done in international context although research studies are scanty in the context of Bangladesh. But all the studies are full with debates in terms of methods of measurements and components to be included in measuring the success of the entrepreneurs. Peter Resseeuw (1994) in his study indicates that in analyzing entrepreneurial success one has to be careful in making assumptions about the
Bhuiyan & Imam
28
behavior of firms and entrepreneurs. A debate in entrepreneurial success between the School of Industrial Organization and The School of Strategic Management is that whether industry structure or firm competencies and behavior will determine the entrepreneurial success. Birley and Westhead (1994) confirm that very small firms are completely dependent on their environment. In samples containing data from firms in different industries or operating in heterogeneous markets, market related variables have a dominant effect. This is acceptable or even desired if one works at the industry level, but undesirable if one works at the level of individual firm. To overcome the problems created from choosing the different industries some suggested conducting the study on one particular industry and making use of a large and detailed multi year data set. Resseeuw in this line conducted his study by selecting only real estate industry with sampled firms that compete on regionally different but comparable markets to distinguish local market circumstances like competition, growth of regional markets etc. But these variables could not dominate the analysis because of the strong degree of homogeneity among firms and markets. By doing so he neutralizes for industry effects and reduces the relation Performance = f (industry structure, firm & strategy) to Performance = f (firm & strategy | industry). Age of the enterprise can be another factor for determining firm’s efficiency. As Resseeuw (undated) states that age has a cycle of growth and decline. Newly established firms have an enthusiastic and energetic crew, which should enhance performance. Besides, young firms are confronted with startups problems (Cromie, 1991). Older firms by overcoming these problems can rely on experience and a network of existing suppliers and customers, which enhances efficiency. As Birley and Westhead (1990) finds mature firms are better performer. According to Jovanovic’s (1982) model, surviving firms and their managers learn, and thus improve strategies in time. So, as a result it helps to improve the performance of the enterprise. The Giessen-Amsterdam model of entrepreneurial success is an interdisciplinary model, which takes into consideration most areas that have been studied in entrepreneurship research. According to this model entrepreneurial success is the result of action. And actions are determined by the goals and strategies. So, the concepts of action are central to this model and strategies and tactics of actions is the bottleneck through which all entrepreneurial success is accomplished or not accomplished. All strategies and tactics are goal oriented and, hence, all entrepreneurial success has to start to look at these variables. All of the influences of personality, human capital, and environment on success have to be mediated by strategies and tactics for actions. Rauch and Frese (2000) in their study find positive relationship between personality characteristics and entrepreneurial success. They used most frequently studied characteristics like need for achievement, risk taking and internal locus of control. Other studies also corroborated the relationship of entrepreneurial success and these three personality characteristics as need for achievement (Mc Clelland, 1961; Frey, 1984; Mirron and McClelland, 1979), risk taking (Chell, et. al., 1991; Begeley and Boyed, 1987) and locus of control (Rotter, 1966; Goebel and Frese, 1999; Brand Staetter,
Bhuiyan & Imam
29
1997). However, Rauch and Frese in their study found that psychological variables are consistently related with entrepreneurial entry and success. Moreover, psychological variables (most notably action related concepts) function as necessary mediators in the process leading to success (e.g. strategies). But magnitude of impacts of these variables on enterprise is changing over the changes of its developmental stage. Factors related to success are: need for achievement, locus of control, low risk taking, human capital, planning and strategies, innovation, entrepreneurial orientation, and tough environmental conditions. All of these variables have significant but small correlation with entrepreneurial success as found by the study of Rauch and Frese. The small correlations and the large variance suggest that moderators should be included into the future entrepreneurial success model. The important moderators are environmental conditions, life cycle stages, growth vs. lifestyle goals and culture. But critiques were of the disagreements in personality-success relationship research. Gartner (1985) argued theoretically, that the diversity among entrepreneurs is much larger than differences between entrepreneurs and non entrepreneurs. Hence, he recommended behavioral rather than traits approach for successful enterprise creation. In stead of evaluating entrepreneurial traits, behavioral approach emphasizes on specific level of entrepreneurial efforts for making enterprise successful. Economists of different ages also tried to define the criteria of successful entrepreneurship. Say (1971) states that entrepreneurship requires qualities of judgment, perseverance and knowledge of the world as well as business. Marshal (1930) equated it with command over general and special abilities and also over capital and good fortune. Schumpeter (1934) found success of entrepreneurship in the function of innovation. Meanwhile Knight (1921) indicates power of self control i.e. self confidence and the disposition to act on one’s own opinion with venturesome-ness and foresightedness as the qualities of a successful entrepreneur. Fertala (2006) conducted a study on the ‘Determinants of Successful Immigrant Entrepreneurship in the Federal Republic of Germany’. He suggested three important determinants of entrepreneurship are: experience of the entrepreneurs in running and executing the enterprise, ability of collecting the information and utilizing them to learn about the trading environment and the nominal volume of sales per employee as operational measures which again indicates the operational efficiency of the enterprise. From the review of the literature in above section it is evident that measuring success of the entrepreneurship is a matter filled with un-resolvable debates. These debates are surrounded by many issues like methods of measurements, variables to be used, measurable or non measurable variables or criteria, variables related with the micro issues and macro issues etc. So, present study endeavored to provide a functional relationship between the success of the entrepreneur and its influencing factors in an integrated manner. As the present study aimed at studying success criteria of entrepreneurs and measuring them through quantitative variables, here, four characteristics like risk taking, resource mobilizing and sensing the opportunities, generating profits and achievement orientation has been considered as vital to the entrepreneurial success. These four determinants of success again have been measured through four process of entrepreneurial performance like taking risk by equity
Bhuiyan & Imam
30
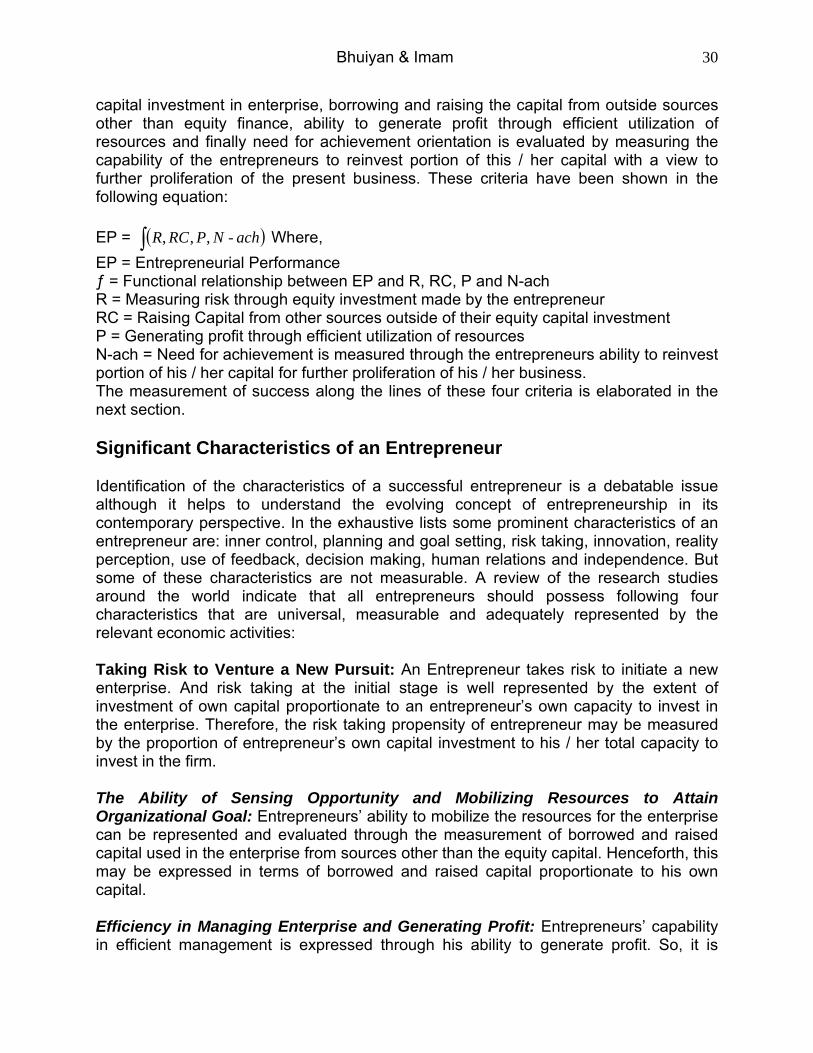
capital investment in enterprise, borrowing and raising the capital from outside sources other than equity finance, ability to generate profit through efficient utilization of resources and finally need for achievement orientation is evaluated by measuring the capability of the entrepreneurs to reinvest portion of this / her capital with a view to further proliferation of the present business. These criteria have been shown in the following equation: EP = ( )∫ achNPRCR -,,, Where, EP = Entrepreneurial Performance ƒ = Functional relationship between EP and R, RC, P and N-ach R = Measuring risk through equity investment made by the entrepreneur RC = Raising Capital from other sources outside of their equity capital investment P = Generating profit through efficient utilization of resources N-ach = Need for achievement is measured through the entrepreneurs ability to reinvest portion of his / her capital for further proliferation of his / her business. The measurement of success along the lines of these four criteria is elaborated in the next section. Significant Characteristics of an Entrepreneur Identification of the characteristics of a successful entrepreneur is a debatable issue although it helps to understand the evolving concept of entrepreneurship in its contemporary perspective. In the exhaustive lists some prominent characteristics of an entrepreneur are: inner control, planning and goal setting, risk taking, innovation, reality perception, use of feedback, decision making, human relations and independence. But some of these characteristics are not measurable. A review of the research studies around the world indicate that all entrepreneurs should possess following four characteristics that are universal, measurable and adequately represented by the relevant economic activities: Taking Risk to Venture a New Pursuit: An Entrepreneur takes risk to initiate a new enterprise. And risk taking at the initial stage is well represented by the extent of investment of own capital proportionate to an entrepreneur’s own capacity to invest in the enterprise. Therefore, the risk taking propensity of entrepreneur may be measured by the proportion of entrepreneur’s own capital investment to his / her total capacity to invest in the firm. The Ability of Sensing Opportunity and Mobilizing Resources to Attain Organizational Goal: Entrepreneurs’ ability to mobilize the resources for the enterprise can be represented and evaluated through the measurement of borrowed and raised capital used in the enterprise from sources other than the equity capital. Henceforth, this may be expressed in terms of borrowed and raised capital proportionate to his own capital. Efficiency in Managing Enterprise and Generating Profit: Entrepreneurs’ capability in efficient management is expressed through his ability to generate profit. So, it is
Bhuiyan & Imam
31
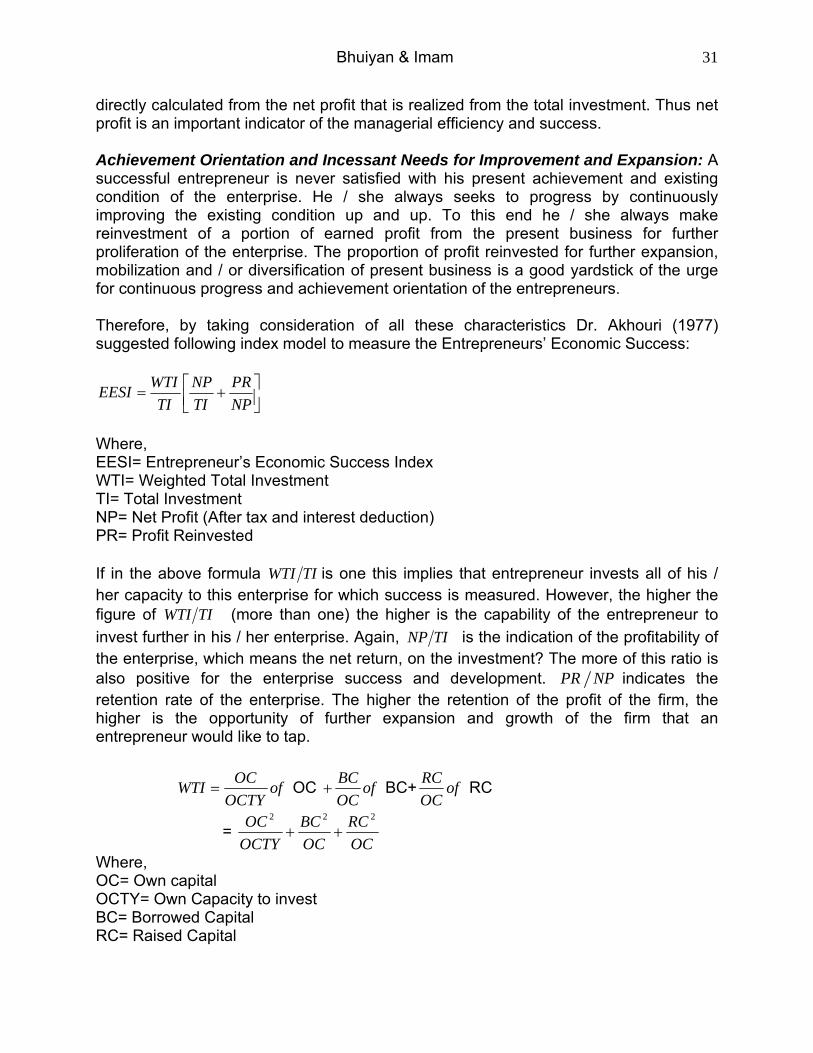
directly calculated from the net profit that is realized from the total investment. Thus net profit is an important indicator of the managerial efficiency and success. Achievement Orientation and Incessant Needs for Improvement and Expansion: A successful entrepreneur is never satisfied with his present achievement and existing condition of the enterprise. He / she always seeks to progress by continuously improving the existing condition up and up. To this end he / she always make reinvestment of a portion of earned profit from the present business for further proliferation of the enterprise. The proportion of profit reinvested for further expansion, mobilization and / or diversification of present business is a good yardstick of the urge for continuous progress and achievement orientation of the entrepreneurs. Therefore, by taking consideration of all these characteristics Dr. Akhouri (1977) suggested following index model to measure the Entrepreneurs’ Economic Success:
⎥⎦⎤
⎢⎣⎡ +=
NPPR
TINP
TIWTIEESI
Where, EESI= Entrepreneur’s Economic Success Index WTI= Weighted Total Investment TI= Total Investment NP= Net Profit (After tax and interest deduction) PR= Profit Reinvested If in the above formula TIWTI is one this implies that entrepreneur invests all of his / her capacity to this enterprise for which success is measured. However, the higher the figure of TIWTI (more than one) the higher is the capability of the entrepreneur to invest further in his / her enterprise. Again, TINP is the indication of the profitability of the enterprise, which means the net return, on the investment? The more of this ratio is also positive for the enterprise success and development. NPPR indicates the retention rate of the enterprise. The higher the retention of the profit of the firm, the higher is the opportunity of further expansion and growth of the firm that an entrepreneur would like to tap.
ofOCTY
OCWTI = OC ofOCBC
+ BC+ ofOCRC RC
= OCRC
OCBC
OCTYOC 222
++
Where, OC= Own capital OCTY= Own Capacity to invest BC= Borrowed Capital RC= Raised Capital
Bhuiyan & Imam
32
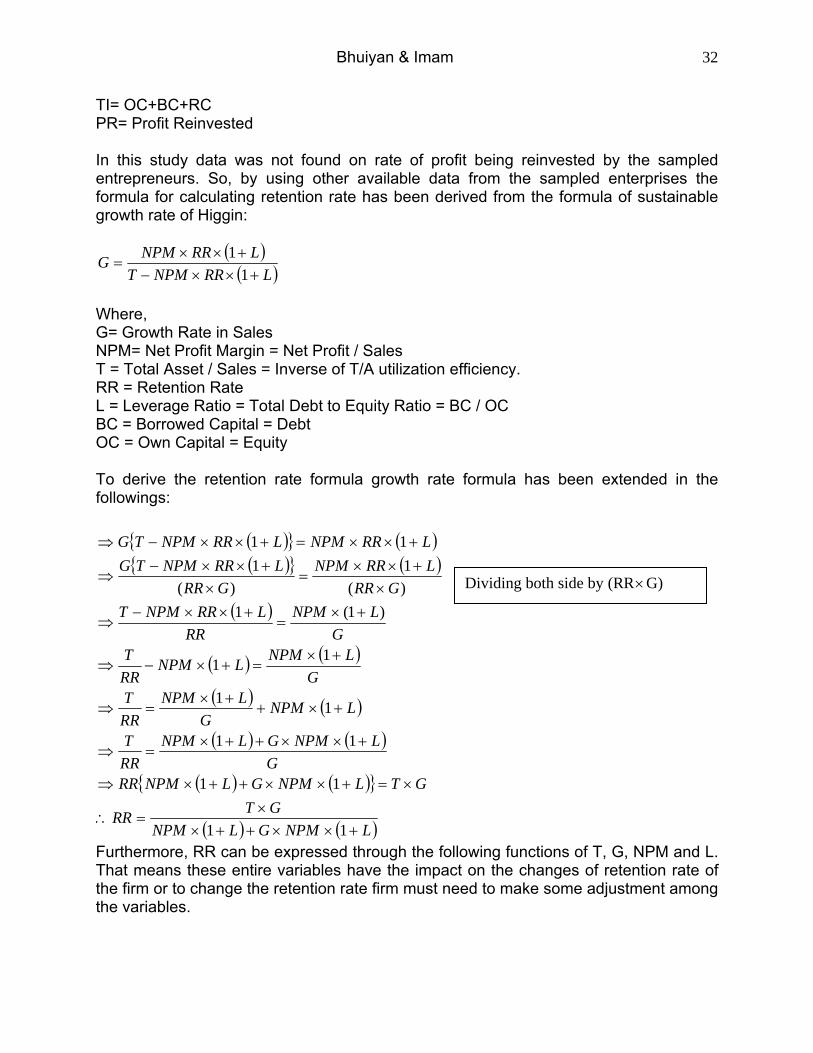
TI= OC+BC+RC PR= Profit Reinvested In this study data was not found on rate of profit being reinvested by the sampled entrepreneurs. So, by using other available data from the sampled enterprises the formula for calculating retention rate has been derived from the formula of sustainable growth rate of Higgin:
( )( )LRRNPMT
LRRNPMG+××−
+××=
11
Where, G= Growth Rate in Sales NPM= Net Profit Margin = Net Profit / Sales T = Total Asset / Sales = Inverse of T/A utilization efficiency. RR = Retention Rate L = Leverage Ratio = Total Debt to Equity Ratio = BC / OC BC = Borrowed Capital = Debt OC = Own Capital = Equity To derive the retention rate formula growth rate formula has been extended in the followings:
Furthermore, RR can be expressed through the following functions of T, G, NPM and L. That means these entire variables have the impact on the changes of retention rate of the firm or to change the retention rate firm must need to make some adjustment among the variables.
( ){ } ( )( ){ } ( )
( )
( ) ( )
( ) ( )
( ) ( )
( ) ( ){ }
( ) ( )LNPMGLNPMGTRR
GTLNPMGLNPMRRG
LNPMGLNPMRRT
LNPMG
LNPMRRT
GLNPMLNPM
RRT
GLNPM
RRLRRNPMT
GRRLRRNPM
GRRLRRNPMTG
LRRNPMLRRNPMTG
+××++××
=∴
×=+××++×⇒
+××++×=⇒
+×++×
=⇒
+×=+×−⇒
+×=
+××−⇒
×+××
=×
+××−⇒
+××=+××−⇒
11
11
11
11
11
)1(1)(1
)(1
11
Dividing both side by (RR×G)
Bhuiyan & Imam
33
( )∫= LNPMGTRR ,,, The higher the growth of a firm, the higher is the retention rate. However, the higher growth rate of firm is partly offset by the higher profitability and greater leverage being used. As the positive effect of G on RR dominates over negative effect of G on RR hence, the net effect of G on RR is positive implying that the growth of a firm need to be tapped the higher new retention and more profit is required. However, the effect of T on RR is also positive. Because, the increase in the figure of T indicates the amount of resources required for generating a certain amount of sale, which on the other hand means the asset utilization efficiency. So, increase in the efficiency of the firm helps to increase the retention rate of that firm. Therefore, to calculate the Entrepreneurial Economic Success Index ultimately the formula that has been derived in the present study is as follows:
⎟⎠⎞
⎜⎝⎛ += RR
TINP
TIWTIEESI
Empirical Results of EESI and Other Influencing Factors Research review in the previous section shows that entrepreneurial performance is determined by various factors. Among the set of factors some are related with their personal characteristics, while others are related with their behavior which is again described as activity related factors in their personal life and enterprise operations. In this section the important factors have been identified that are related with the creation of entrepreneurial performance. It is also endeavored to measure the extent of impact on the performance of entrepreneurs through measuring the average of the entrepreneurs’ economic success index. Followings are the analyses: Age of the Entrepreneurs and Average Score of EESI: Table: 1 shows the age wise distribution of the sampled entrepreneurs and impact of each age group in creating entrepreneurail economic success index. In this study 65 % of the entrepreneurs are young who belongs to the age group of below 30-40 years, 21 percent entrepreneurs are in the 40-50 years of age group. Meanwhile, only 14 entrepreneurs are in the age group of 50 and above years. The findings of Khan (1996, P. 71-72) found 43 years as the median age in conducting the industrial entrepreneurial performance in Dhaka City. Altaf (1983, P.12) studied Pakistani entrepreneurs and found a similar pattern of age group. About 68 percent of the respondent entrepreneurs in his study of industrial entrepreneurs were around 40 years of age group. However, the maturity of age generally indicates the role of entrepreneurial performance in different phases of the enterprise operations.
Bhuiyan & Imam
34
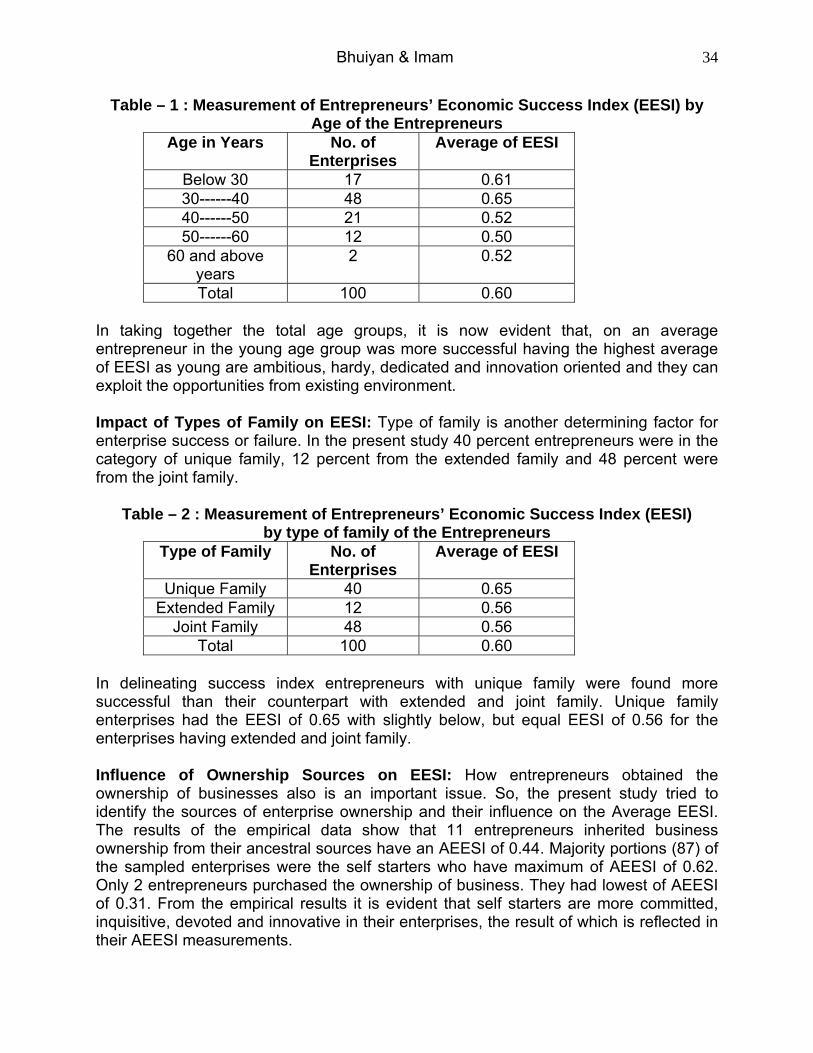
Table – 1 : Measurement of Entrepreneurs’ Economic Success Index (EESI) by Age of the Entrepreneurs
Age in Years No. of Enterprises
Average of EESI
Below 30 17 0.61 30------40 48 0.65 40------50 21 0.52 50------60 12 0.50
60 and above years
2 0.52
Total 100 0.60 In taking together the total age groups, it is now evident that, on an average entrepreneur in the young age group was more successful having the highest average of EESI as young are ambitious, hardy, dedicated and innovation oriented and they can exploit the opportunities from existing environment. Impact of Types of Family on EESI: Type of family is another determining factor for enterprise success or failure. In the present study 40 percent entrepreneurs were in the category of unique family, 12 percent from the extended family and 48 percent were from the joint family.
Table – 2 : Measurement of Entrepreneurs’ Economic Success Index (EESI)
by type of family of the Entrepreneurs Type of Family No. of
Enterprises Average of EESI
Unique Family 40 0.65 Extended Family 12 0.56
Joint Family 48 0.56 Total 100 0.60
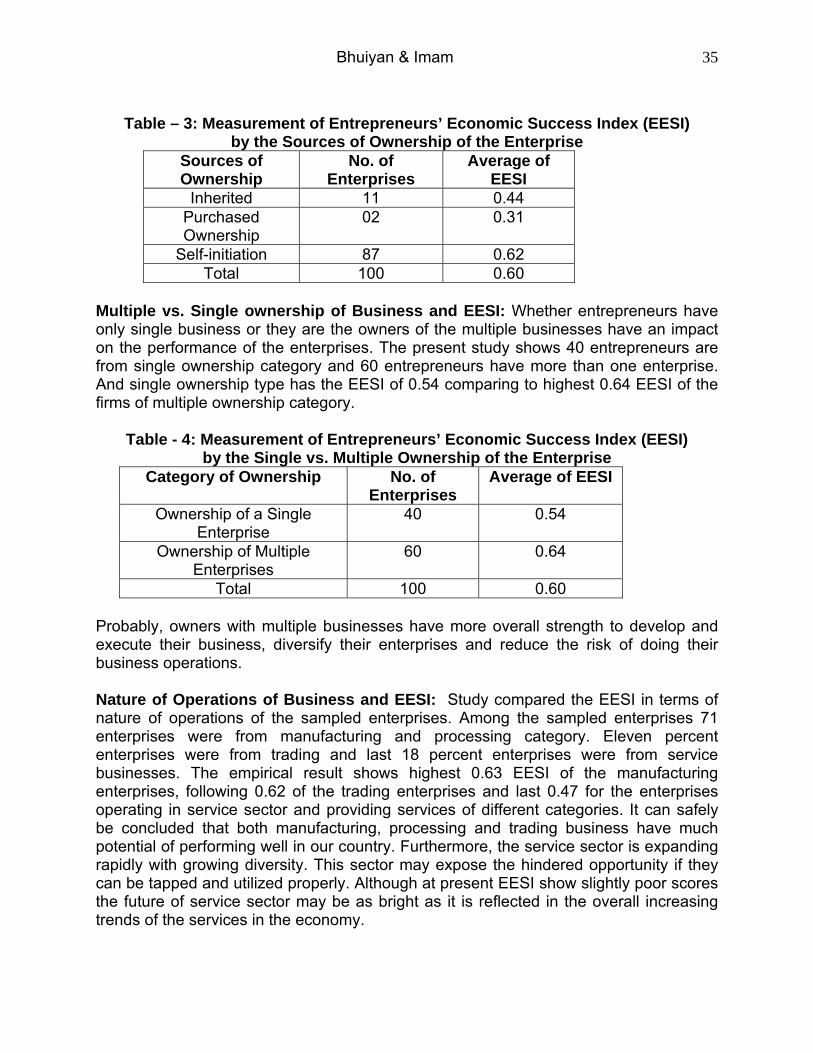
In delineating success index entrepreneurs with unique family were found more successful than their counterpart with extended and joint family. Unique family enterprises had the EESI of 0.65 with slightly below, but equal EESI of 0.56 for the enterprises having extended and joint family. Influence of Ownership Sources on EESI: How entrepreneurs obtained the ownership of businesses also is an important issue. So, the present study tried to identify the sources of enterprise ownership and their influence on the Average EESI. The results of the empirical data show that 11 entrepreneurs inherited business ownership from their ancestral sources have an AEESI of 0.44. Majority portions (87) of the sampled enterprises were the self starters who have maximum of AEESI of 0.62. Only 2 entrepreneurs purchased the ownership of business. They had lowest of AEESI of 0.31. From the empirical results it is evident that self starters are more committed, inquisitive, devoted and innovative in their enterprises, the result of which is reflected in their AEESI measurements.
Bhuiyan & Imam
35
Table – 3: Measurement of Entrepreneurs’ Economic Success Index (EESI)
by the Sources of Ownership of the Enterprise Sources of Ownership
No. of Enterprises
Average of EESI
Inherited 11 0.44 Purchased Ownership
02 0.31
Self-initiation 87 0.62 Total 100 0.60
Multiple vs. Single ownership of Business and EESI: Whether entrepreneurs have only single business or they are the owners of the multiple businesses have an impact on the performance of the enterprises. The present study shows 40 entrepreneurs are from single ownership category and 60 entrepreneurs have more than one enterprise. And single ownership type has the EESI of 0.54 comparing to highest 0.64 EESI of the firms of multiple ownership category.
Table - 4: Measurement of Entrepreneurs’ Economic Success Index (EESI)
by the Single vs. Multiple Ownership of the Enterprise Category of Ownership No. of
Enterprises Average of EESI
Ownership of a Single Enterprise
40 0.54
Ownership of Multiple Enterprises
60 0.64
Total 100 0.60 Probably, owners with multiple businesses have more overall strength to develop and execute their business, diversify their enterprises and reduce the risk of doing their business operations. Nature of Operations of Business and EESI: Study compared the EESI in terms of nature of operations of the sampled enterprises. Among the sampled enterprises 71 enterprises were from manufacturing and processing category. Eleven percent enterprises were from trading and last 18 percent enterprises were from service businesses. The empirical result shows highest 0.63 EESI of the manufacturing enterprises, following 0.62 of the trading enterprises and last 0.47 for the enterprises operating in service sector and providing services of different categories. It can safely be concluded that both manufacturing, processing and trading business have much potential of performing well in our country. Furthermore, the service sector is expanding rapidly with growing diversity. This sector may expose the hindered opportunity if they can be tapped and utilized properly. Although at present EESI show slightly poor scores the future of service sector may be as bright as it is reflected in the overall increasing trends of the services in the economy.
Bhuiyan & Imam
36
Table – 5 : Measurement of Entrepreneurs’ Economic Success Index (EESI) by the Nature of Operations of the Enterprises
Nature of Operations No. of Enterprises
Average of EESI
Manufacturing and Processing 71
0.63
Services 18 0.47 Trading 11 0.62
Total 100 0.60
Average of EESI by Age of the Entrepreneurs and Training Status: From previous description it is evident that young entrepreneurs are more successful in their business operations, which is reflected through the EESI calculated. Here, in this table the relationship between age of the entrepreneurs and training status of the entrepreneurs on entrepreneurial success has been presented.
Table – 6 : EESI by Age of the Entrepreneurs and Training Status
Training Status Age of the Entrepreneurs
Received Training
No Training Received
Total
≤30 years 0.63*** (14)
0.53** (03)
0.61 (17)
30<Age≤40 years 0.62*** (33)
0.72*** (15)
0.65 (48)
40<Age≤50 years 0.58*** (11)
0.45*** (10)
0.52 (21)
≥50 years 0.57*** (07)
0.44** (07)
0.51 (14)
Total 0.61 (65)
0.57 (35)
0.60 (100)
Note: 1. Figure in the table shows the average score of entrepreneur’s economic success index (EESI) and number in the parentheses represents the number of entrepreneurs. *** Significant at 1 percent level of significance; ** Significant at 5 percent level of significance. The above table shows that among 100 entrepreneurs 65 percent belongs in the category of below 40 years of age group from which 47 percent received training of different categories and 18 percent didn’t receive any training. Here, no significant pattern has been found between trained and non-trained entrepreneurs in terms of EESI. The reason may that age is confounded with the experience of entrepreneurs. Her it is evident that training is more receptive in the lower age of the entrepreneurs than the old age group. In all it is shown that from young to the old age group average success score of the entrepreneurs has been reduced. Among the total entrepreneurs 65 percent who received training had the average score of EESI of 0.61, which is greater than the score of 35 percent non-receiving entrepreneurs who had the score of 0.57. Another conclusion may be made that if training is provided with more preplanned need based and consistent manner these might bring more significant results in creating entrepreneurial success among the training receiving enterprises.
Bhuiyan & Imam
37
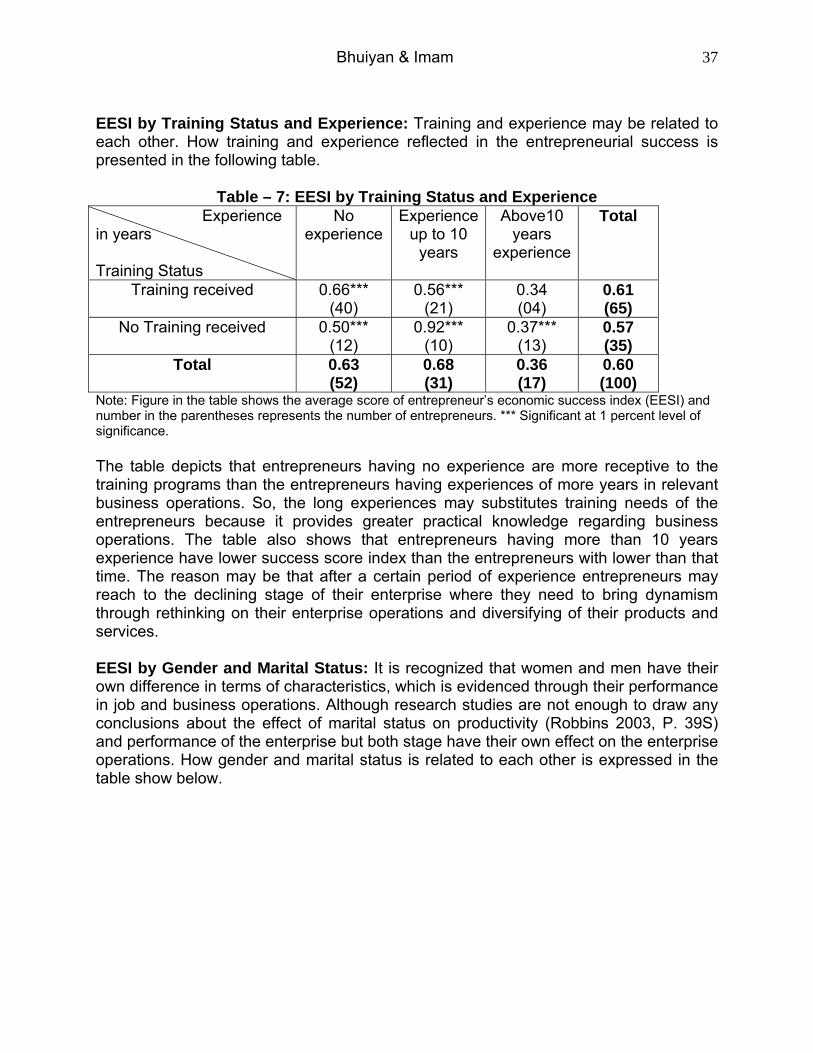
EESI by Training Status and Experience: Training and experience may be related to each other. How training and experience reflected in the entrepreneurial success is presented in the following table.
Table – 7: EESI by Training Status and Experience
Experience in years Training Status
No experience
Experience up to 10
years
Above10 years
experience
Total
Training received 0.66*** (40)
0.56*** (21)
0.34 (04)
0.61 (65)
No Training received 0.50*** (12)
0.92*** (10)
0.37*** (13)
0.57 (35)
Total 0.63 (52)
0.68 (31)
0.36 (17)
0.60 (100)
Note: Figure in the table shows the average score of entrepreneur’s economic success index (EESI) and number in the parentheses represents the number of entrepreneurs. *** Significant at 1 percent level of significance. The table depicts that entrepreneurs having no experience are more receptive to the training programs than the entrepreneurs having experiences of more years in relevant business operations. So, the long experiences may substitutes training needs of the entrepreneurs because it provides greater practical knowledge regarding business operations. The table also shows that entrepreneurs having more than 10 years experience have lower success score index than the entrepreneurs with lower than that time. The reason may be that after a certain period of experience entrepreneurs may reach to the declining stage of their enterprise where they need to bring dynamism through rethinking on their enterprise operations and diversifying of their products and services. EESI by Gender and Marital Status: It is recognized that women and men have their own difference in terms of characteristics, which is evidenced through their performance in job and business operations. Although research studies are not enough to draw any conclusions about the effect of marital status on productivity (Robbins 2003, P. 39S) and performance of the enterprise but both stage have their own effect on the enterprise operations. How gender and marital status is related to each other is expressed in the table show below.
Bhuiyan & Imam
38
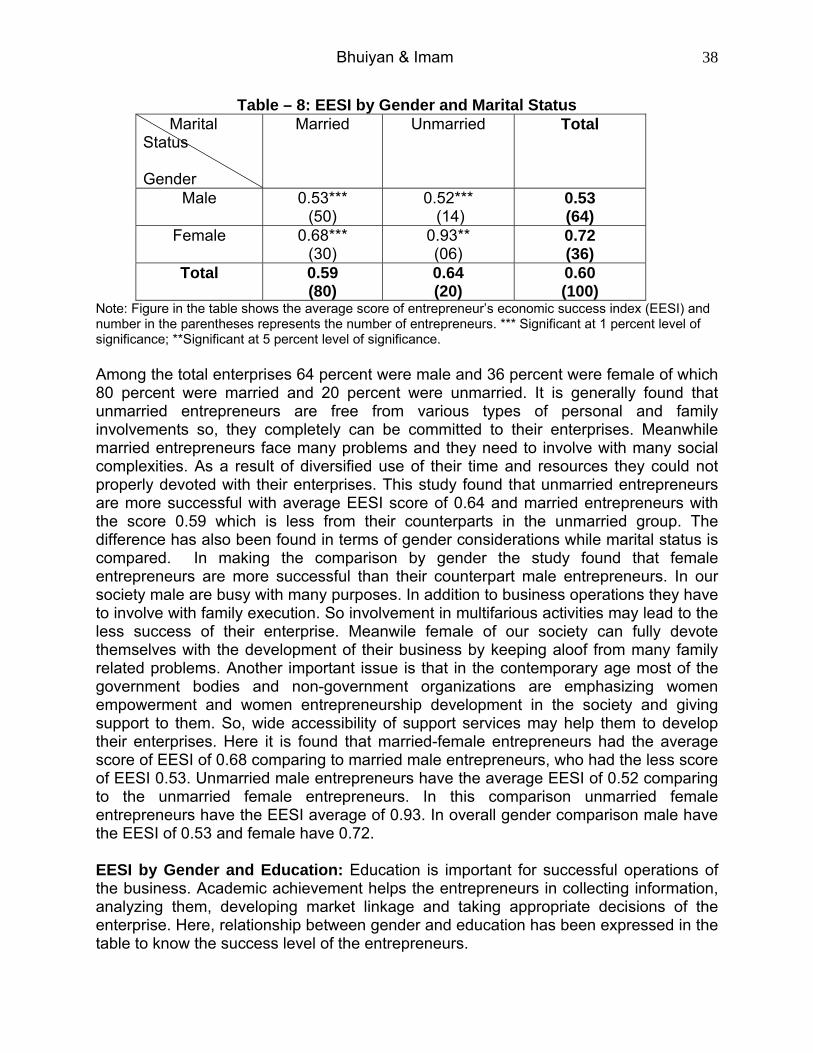
Table – 8: EESI by Gender and Marital Status Marital Status Gender
Married Unmarried Total
Male 0.53*** (50)
0.52*** (14)
0.53 (64)
Female 0.68*** (30)
0.93** (06)
0.72 (36)
Total 0.59 (80)
0.64 (20)
0.60 (100)
Note: Figure in the table shows the average score of entrepreneur’s economic success index (EESI) and number in the parentheses represents the number of entrepreneurs. *** Significant at 1 percent level of significance; **Significant at 5 percent level of significance. Among the total enterprises 64 percent were male and 36 percent were female of which 80 percent were married and 20 percent were unmarried. It is generally found that unmarried entrepreneurs are free from various types of personal and family involvements so, they completely can be committed to their enterprises. Meanwhile married entrepreneurs face many problems and they need to involve with many social complexities. As a result of diversified use of their time and resources they could not properly devoted with their enterprises. This study found that unmarried entrepreneurs are more successful with average EESI score of 0.64 and married entrepreneurs with the score 0.59 which is less from their counterparts in the unmarried group. The difference has also been found in terms of gender considerations while marital status is compared. In making the comparison by gender the study found that female entrepreneurs are more successful than their counterpart male entrepreneurs. In our society male are busy with many purposes. In addition to business operations they have to involve with family execution. So involvement in multifarious activities may lead to the less success of their enterprise. Meanwile female of our society can fully devote themselves with the development of their business by keeping aloof from many family related problems. Another important issue is that in the contemporary age most of the government bodies and non-government organizations are emphasizing women empowerment and women entrepreneurship development in the society and giving support to them. So, wide accessibility of support services may help them to develop their enterprises. Here it is found that married-female entrepreneurs had the average score of EESI of 0.68 comparing to married male entrepreneurs, who had the less score of EESI 0.53. Unmarried male entrepreneurs have the average EESI of 0.52 comparing to the unmarried female entrepreneurs. In this comparison unmarried female entrepreneurs have the EESI average of 0.93. In overall gender comparison male have the EESI of 0.53 and female have 0.72. EESI by Gender and Education: Education is important for successful operations of the business. Academic achievement helps the entrepreneurs in collecting information, analyzing them, developing market linkage and taking appropriate decisions of the enterprise. Here, relationship between gender and education has been expressed in the table to know the success level of the entrepreneurs.
Bhuiyan & Imam
39
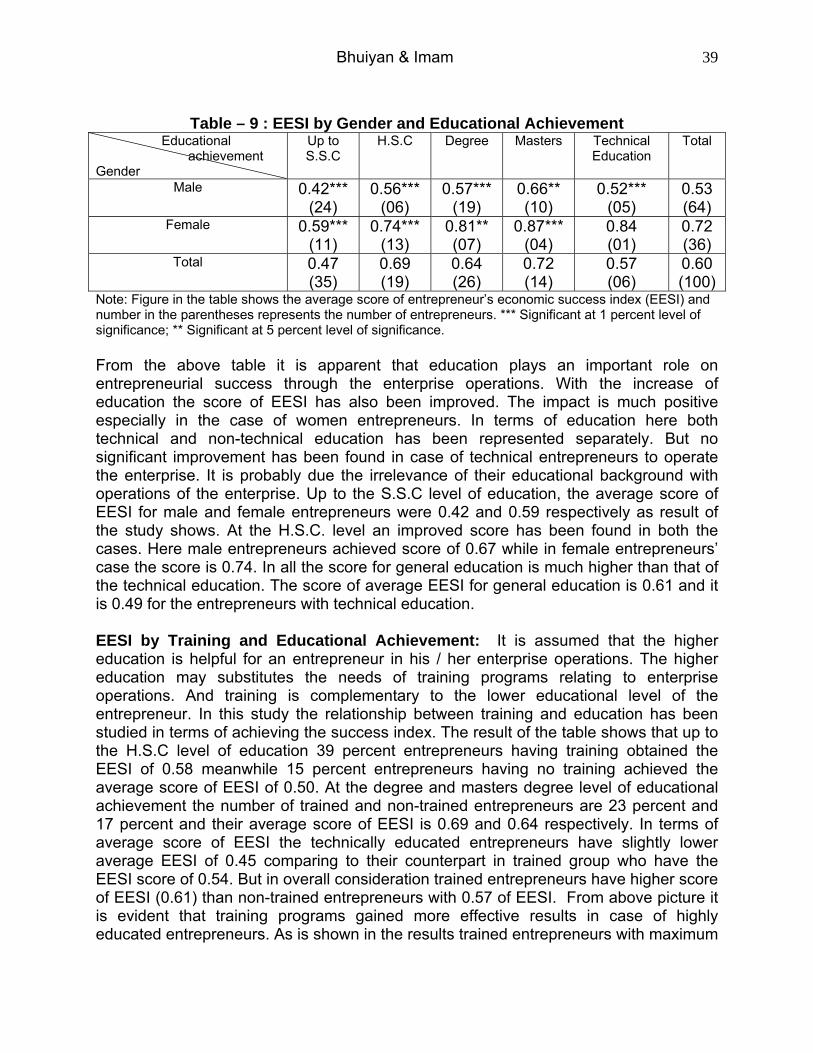
Table – 9 : EESI by Gender and Educational Achievement
Educational achievement Gender
Up to S.S.C
H.S.C Degree Masters Technical Education
Total
Male 0.42*** (24)
0.56*** (06)
0.57*** (19)
0.66** (10)
0.52*** (05)
0.53 (64)
Female 0.59*** (11)
0.74*** (13)
0.81** (07)
0.87*** (04)
0.84 (01)
0.72 (36)
Total 0.47 (35)
0.69 (19)
0.64 (26)
0.72 (14)
0.57 (06)
0.60 (100)
Note: Figure in the table shows the average score of entrepreneur’s economic success index (EESI) and number in the parentheses represents the number of entrepreneurs. *** Significant at 1 percent level of significance; ** Significant at 5 percent level of significance. From the above table it is apparent that education plays an important role on entrepreneurial success through the enterprise operations. With the increase of education the score of EESI has also been improved. The impact is much positive especially in the case of women entrepreneurs. In terms of education here both technical and non-technical education has been represented separately. But no significant improvement has been found in case of technical entrepreneurs to operate the enterprise. It is probably due the irrelevance of their educational background with operations of the enterprise. Up to the S.S.C level of education, the average score of EESI for male and female entrepreneurs were 0.42 and 0.59 respectively as result of the study shows. At the H.S.C. level an improved score has been found in both the cases. Here male entrepreneurs achieved score of 0.67 while in female entrepreneurs’ case the score is 0.74. In all the score for general education is much higher than that of the technical education. The score of average EESI for general education is 0.61 and it is 0.49 for the entrepreneurs with technical education. EESI by Training and Educational Achievement: It is assumed that the higher education is helpful for an entrepreneur in his / her enterprise operations. The higher education may substitutes the needs of training programs relating to enterprise operations. And training is complementary to the lower educational level of the entrepreneur. In this study the relationship between training and education has been studied in terms of achieving the success index. The result of the table shows that up to the H.S.C level of education 39 percent entrepreneurs having training obtained the EESI of 0.58 meanwhile 15 percent entrepreneurs having no training achieved the average score of EESI of 0.50. At the degree and masters degree level of educational achievement the number of trained and non-trained entrepreneurs are 23 percent and 17 percent and their average score of EESI is 0.69 and 0.64 respectively. In terms of average score of EESI the technically educated entrepreneurs have slightly lower average EESI of 0.45 comparing to their counterpart in trained group who have the EESI score of 0.54. But in overall consideration trained entrepreneurs have higher score of EESI (0.61) than non-trained entrepreneurs with 0.57 of EESI. From above picture it is evident that training programs gained more effective results in case of highly educated entrepreneurs. As is shown in the results trained entrepreneurs with maximum
Bhuiyan & Imam
40
of higher secondary level of education have lower average score of EESI comparing to the entrepreneurs having the degree and master’s degree. Therefore, if training institutions designed the tailor-made training by considering the educational level and potential and present entrepreneurs’ level of receptiveness they might get the better results.
Table – 10 : EESI by Training and Educational Achievement
Educational Achievement Training Status
Up to S.S.C
H.S.C Degree Masers Technical Education
Total
Training Received 0.47*** (22)
0.69*** (17)
0.73*** (15)
0.61*** (08)
0.60*** (03)
0.61 (65)
No Training Received 0.48*** (13)
0.61 (02)
0.51*** (11)
0.88*** (06)
0.54* (03)
0.57 (35)
Total 0.47 (35)
0.69 (19)
0.64 (26)
0.72 (14)
0.57 (06)
0.60 (100)
Note: Figure in the table shows the average score of entrepreneur’s economic success index (EESI) and number in the parentheses represents the number of entrepreneurs. *** Significant at 1 percent level of significance; * Significant at 10 percent level of significance. EESI by Experience and Academic Achievement: Academic achievement and experience may have influence on the performance of the enterprise as well as on the success index of the entrepreneurs. The following table shows the relationship between them.
Table – 11 : EESI by Experience and Educational Achievement Educational Achievement Experience
Up to S.S.C
H.S.C Degree Masters Technical Education
Total
No Experience 0.56***
(16)
0.81***
(10)
0.72***
(13)
0.49*** (10)
0.43** (03)
0.63 (52)
Up to 10 years 0.34***
(12)
0.60***
(06)
0.82***
(08)
2.33 (02)
0.71*** (03)
0.68 (31)
Above 10 years 0.52**(07)
0.46 (03)
0.12* (05)
0.26 (02)
---- (00)
0.36 (17)
Total 0.47 (35)
0.69 (19)
0.64 (26)
0.72 (14)
0.57 (06)
0.60 (100)
Note: Figure in the table shows the average score of entrepreneur’s economic success index (EESI) and number in the parentheses represents the number of entrepreneurs. *** Significant at 1 percent level of significance; ** Significant at 5 percent level of significance; * Significant at 10 percent level of significance. The above table depicts that the highest scorer in the category of no experience group are the entrepreneurs with H.S.C level of education the average of EESI of which is 0.81, the number of entrepreneurs this category is 10. On the other hand at the level of experience up to 10 years 8 percent enterprises having degree level of education
Bhuiyan & Imam
41
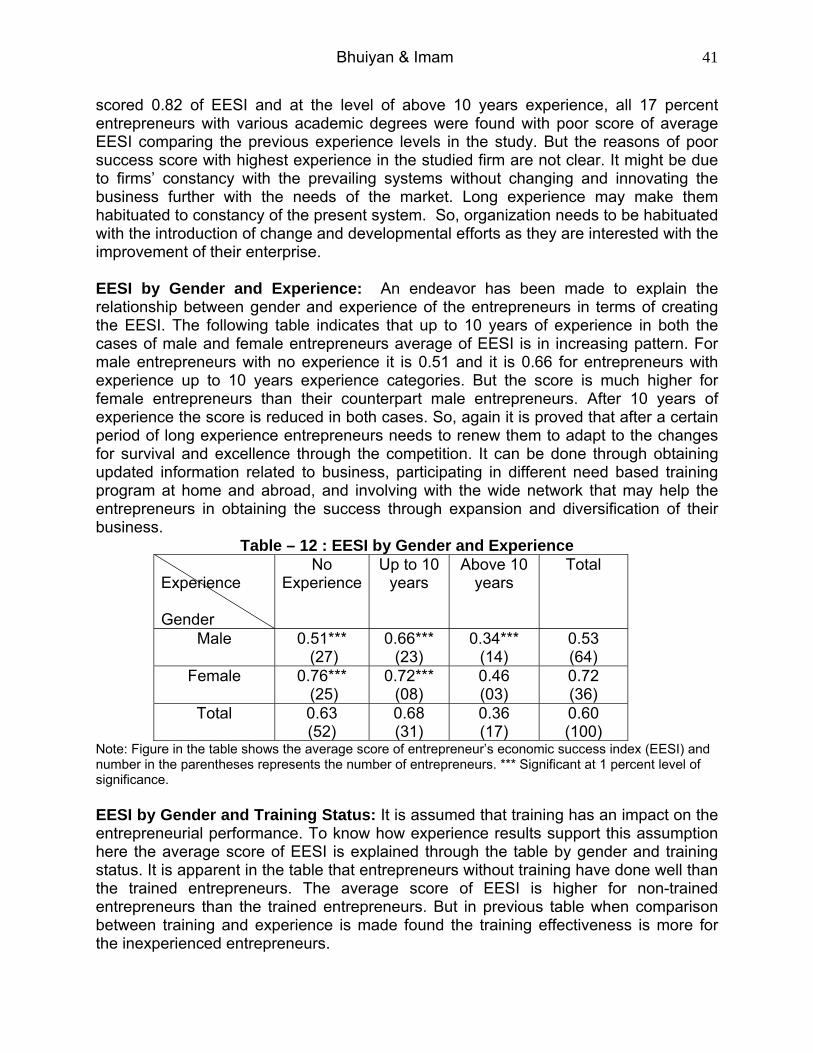
scored 0.82 of EESI and at the level of above 10 years experience, all 17 percent entrepreneurs with various academic degrees were found with poor score of average EESI comparing the previous experience levels in the study. But the reasons of poor success score with highest experience in the studied firm are not clear. It might be due to firms’ constancy with the prevailing systems without changing and innovating the business further with the needs of the market. Long experience may make them habituated to constancy of the present system. So, organization needs to be habituated with the introduction of change and developmental efforts as they are interested with the improvement of their enterprise. EESI by Gender and Experience: An endeavor has been made to explain the relationship between gender and experience of the entrepreneurs in terms of creating the EESI. The following table indicates that up to 10 years of experience in both the cases of male and female entrepreneurs average of EESI is in increasing pattern. For male entrepreneurs with no experience it is 0.51 and it is 0.66 for entrepreneurs with experience up to 10 years experience categories. But the score is much higher for female entrepreneurs than their counterpart male entrepreneurs. After 10 years of experience the score is reduced in both cases. So, again it is proved that after a certain period of long experience entrepreneurs needs to renew them to adapt to the changes for survival and excellence through the competition. It can be done through obtaining updated information related to business, participating in different need based training program at home and abroad, and involving with the wide network that may help the entrepreneurs in obtaining the success through expansion and diversification of their business.
Table – 12 : EESI by Gender and Experience Experience Gender
No Experience
Up to 10 years
Above 10 years
Total
Male 0.51*** (27)
0.66*** (23)
0.34*** (14)
0.53 (64)
Female 0.76*** (25)
0.72*** (08)
0.46 (03)
0.72 (36)
Total 0.63 (52)
0.68 (31)
0.36 (17)
0.60 (100)
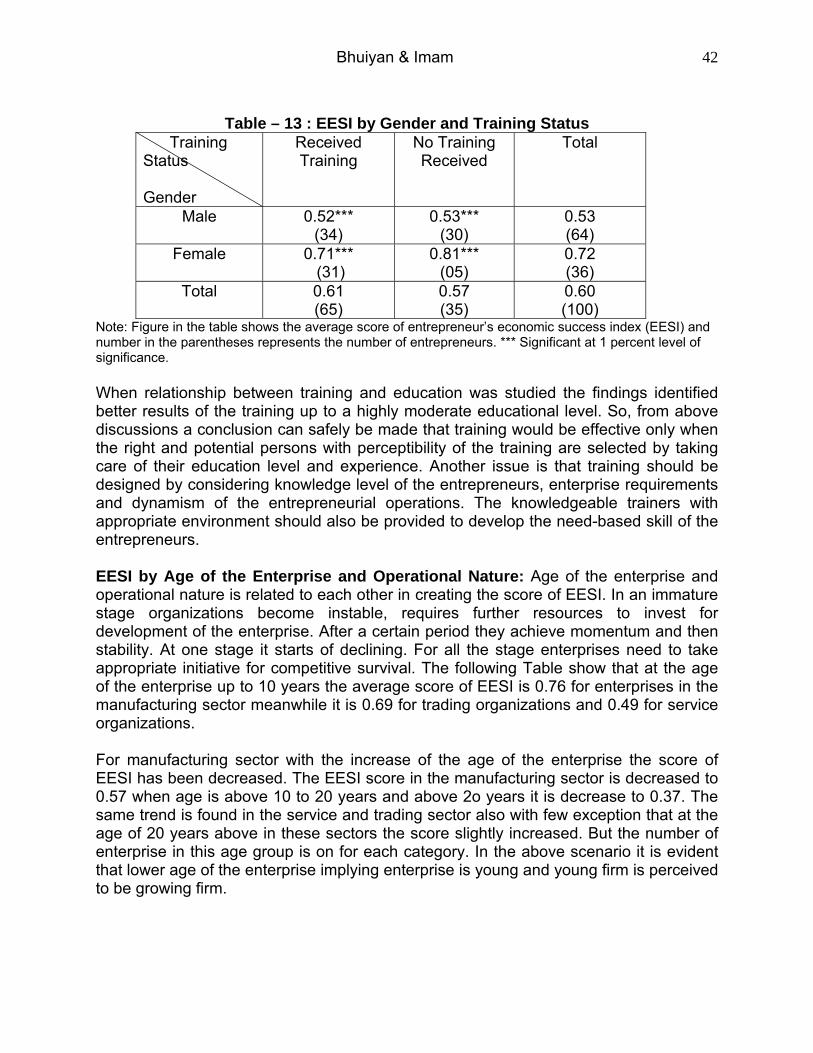
Note: Figure in the table shows the average score of entrepreneur’s economic success index (EESI) and number in the parentheses represents the number of entrepreneurs. *** Significant at 1 percent level of significance. EESI by Gender and Training Status: It is assumed that training has an impact on the entrepreneurial performance. To know how experience results support this assumption here the average score of EESI is explained through the table by gender and training status. It is apparent in the table that entrepreneurs without training have done well than the trained entrepreneurs. The average score of EESI is higher for non-trained entrepreneurs than the trained entrepreneurs. But in previous table when comparison between training and experience is made found the training effectiveness is more for the inexperienced entrepreneurs.
Bhuiyan & Imam
42
Table – 13 : EESI by Gender and Training Status
Training Status Gender
Received Training
No Training Received
Total
Male 0.52*** (34)
0.53*** (30)
0.53 (64)
Female 0.71*** (31)
0.81*** (05)
0.72 (36)
Total 0.61 (65)
0.57 (35)
0.60 (100)
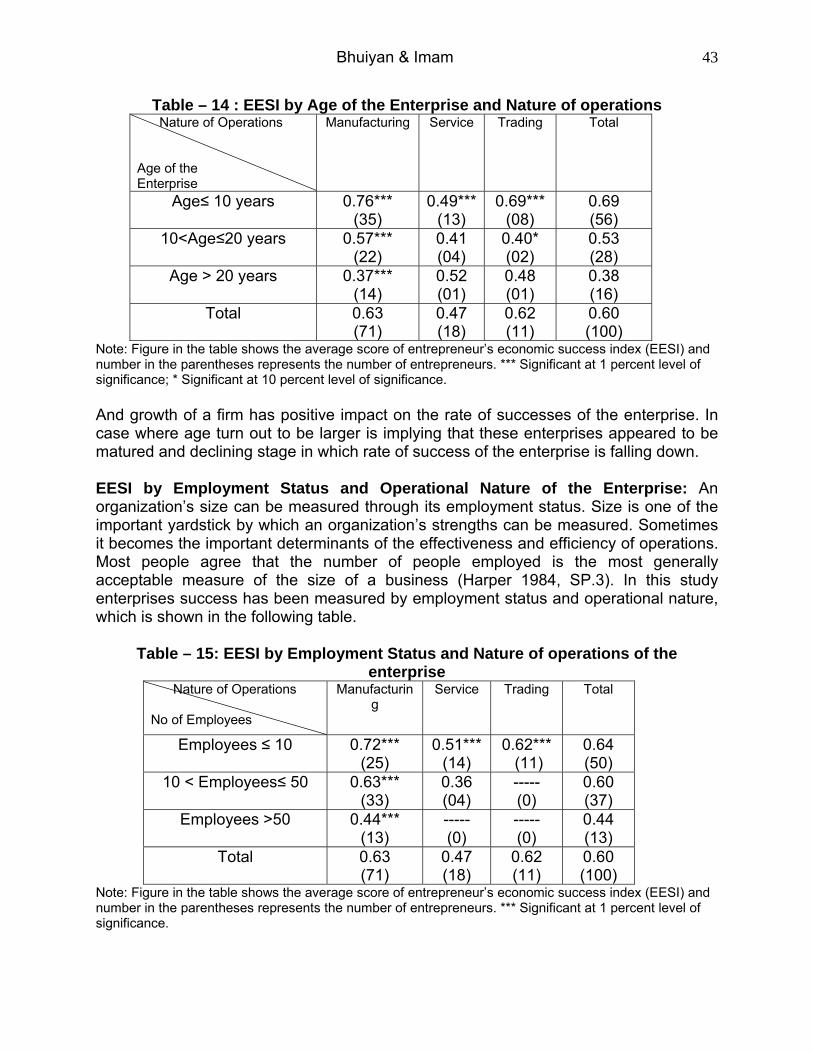
Note: Figure in the table shows the average score of entrepreneur’s economic success index (EESI) and number in the parentheses represents the number of entrepreneurs. *** Significant at 1 percent level of significance. When relationship between training and education was studied the findings identified better results of the training up to a highly moderate educational level. So, from above discussions a conclusion can safely be made that training would be effective only when the right and potential persons with perceptibility of the training are selected by taking care of their education level and experience. Another issue is that training should be designed by considering knowledge level of the entrepreneurs, enterprise requirements and dynamism of the entrepreneurial operations. The knowledgeable trainers with appropriate environment should also be provided to develop the need-based skill of the entrepreneurs. EESI by Age of the Enterprise and Operational Nature: Age of the enterprise and operational nature is related to each other in creating the score of EESI. In an immature stage organizations become instable, requires further resources to invest for development of the enterprise. After a certain period they achieve momentum and then stability. At one stage it starts of declining. For all the stage enterprises need to take appropriate initiative for competitive survival. The following Table show that at the age of the enterprise up to 10 years the average score of EESI is 0.76 for enterprises in the manufacturing sector meanwhile it is 0.69 for trading organizations and 0.49 for service organizations. For manufacturing sector with the increase of the age of the enterprise the score of EESI has been decreased. The EESI score in the manufacturing sector is decreased to 0.57 when age is above 10 to 20 years and above 2o years it is decrease to 0.37. The same trend is found in the service and trading sector also with few exception that at the age of 20 years above in these sectors the score slightly increased. But the number of enterprise in this age group is on for each category. In the above scenario it is evident that lower age of the enterprise implying enterprise is young and young firm is perceived to be growing firm.
Bhuiyan & Imam
43
Table – 14 : EESI by Age of the Enterprise and Nature of operations Nature of Operations Age of the Enterprise
Manufacturing Service Trading Total
Age≤ 10 years 0.76*** (35)
0.49***(13)
0.69*** (08)
0.69 (56)
10<Age≤20 years 0.57*** (22)
0.41 (04)
0.40* (02)
0.53 (28)
Age > 20 years 0.37*** (14)
0.52 (01)
0.48 (01)
0.38 (16)
Total 0.63 (71)
0.47 (18)
0.62 (11)
0.60 (100)
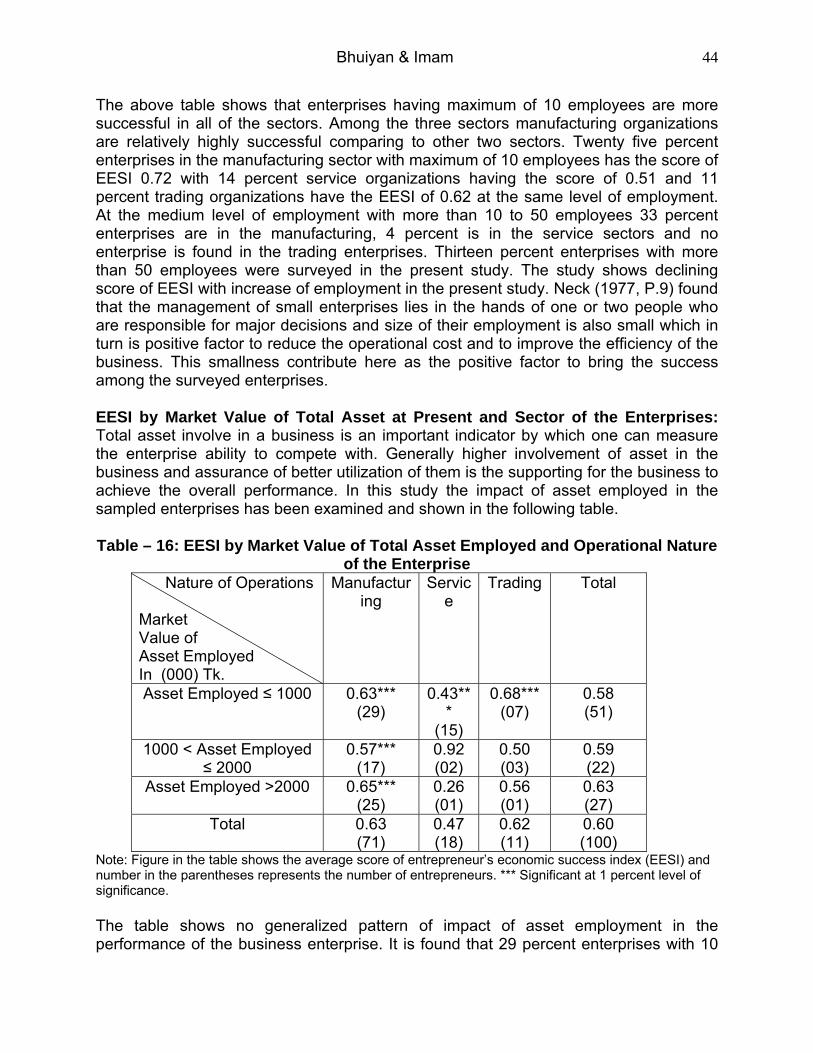
Note: Figure in the table shows the average score of entrepreneur’s economic success index (EESI) and number in the parentheses represents the number of entrepreneurs. *** Significant at 1 percent level of significance; * Significant at 10 percent level of significance. And growth of a firm has positive impact on the rate of successes of the enterprise. In case where age turn out to be larger is implying that these enterprises appeared to be matured and declining stage in which rate of success of the enterprise is falling down. EESI by Employment Status and Operational Nature of the Enterprise: An organization’s size can be measured through its employment status. Size is one of the important yardstick by which an organization’s strengths can be measured. Sometimes it becomes the important determinants of the effectiveness and efficiency of operations. Most people agree that the number of people employed is the most generally acceptable measure of the size of a business (Harper 1984, SP.3). In this study enterprises success has been measured by employment status and operational nature, which is shown in the following table.
Table – 15: EESI by Employment Status and Nature of operations of the enterprise
Nature of Operations No of Employees
Manufacturing
Service Trading Total
Employees ≤ 10 0.72*** (25)
0.51*** (14)
0.62*** (11)
0.64 (50)
10 < Employees≤ 50 0.63*** (33)
0.36 (04)
----- (0)
0.60 (37)
Employees >50 0.44*** (13)
----- (0)
----- (0)
0.44 (13)
Total 0.63 (71)
0.47 (18)
0.62 (11)
0.60 (100)
Note: Figure in the table shows the average score of entrepreneur’s economic success index (EESI) and number in the parentheses represents the number of entrepreneurs. *** Significant at 1 percent level of significance.
Bhuiyan & Imam
44
The above table shows that enterprises having maximum of 10 employees are more successful in all of the sectors. Among the three sectors manufacturing organizations are relatively highly successful comparing to other two sectors. Twenty five percent enterprises in the manufacturing sector with maximum of 10 employees has the score of EESI 0.72 with 14 percent service organizations having the score of 0.51 and 11 percent trading organizations have the EESI of 0.62 at the same level of employment. At the medium level of employment with more than 10 to 50 employees 33 percent enterprises are in the manufacturing, 4 percent is in the service sectors and no enterprise is found in the trading enterprises. Thirteen percent enterprises with more than 50 employees were surveyed in the present study. The study shows declining score of EESI with increase of employment in the present study. Neck (1977, P.9) found that the management of small enterprises lies in the hands of one or two people who are responsible for major decisions and size of their employment is also small which in turn is positive factor to reduce the operational cost and to improve the efficiency of the business. This smallness contribute here as the positive factor to bring the success among the surveyed enterprises. EESI by Market Value of Total Asset at Present and Sector of the Enterprises: Total asset involve in a business is an important indicator by which one can measure the enterprise ability to compete with. Generally higher involvement of asset in the business and assurance of better utilization of them is the supporting for the business to achieve the overall performance. In this study the impact of asset employed in the sampled enterprises has been examined and shown in the following table.
Table – 16: EESI by Market Value of Total Asset Employed and Operational Nature
of the Enterprise Nature of Operations Market Value of Asset Employed In (000) Tk.
Manufacturing
Service
Trading Total
Asset Employed ≤ 1000 0.63*** (29)
0.43***
(15)
0.68*** (07)
0.58 (51)
1000 < Asset Employed ≤ 2000
0.57*** (17)
0.92 (02)
0.50 (03)
0.59 (22)
Asset Employed >2000 0.65*** (25)
0.26 (01)
0.56 (01)
0.63 (27)
Total 0.63 (71)
0.47 (18)
0.62 (11)
0.60 (100)
Note: Figure in the table shows the average score of entrepreneur’s economic success index (EESI) and number in the parentheses represents the number of entrepreneurs. *** Significant at 1 percent level of significance.
The table shows no generalized pattern of impact of asset employment in the performance of the business enterprise. It is found that 29 percent enterprises with 10
Bhuiyan & Imam
45
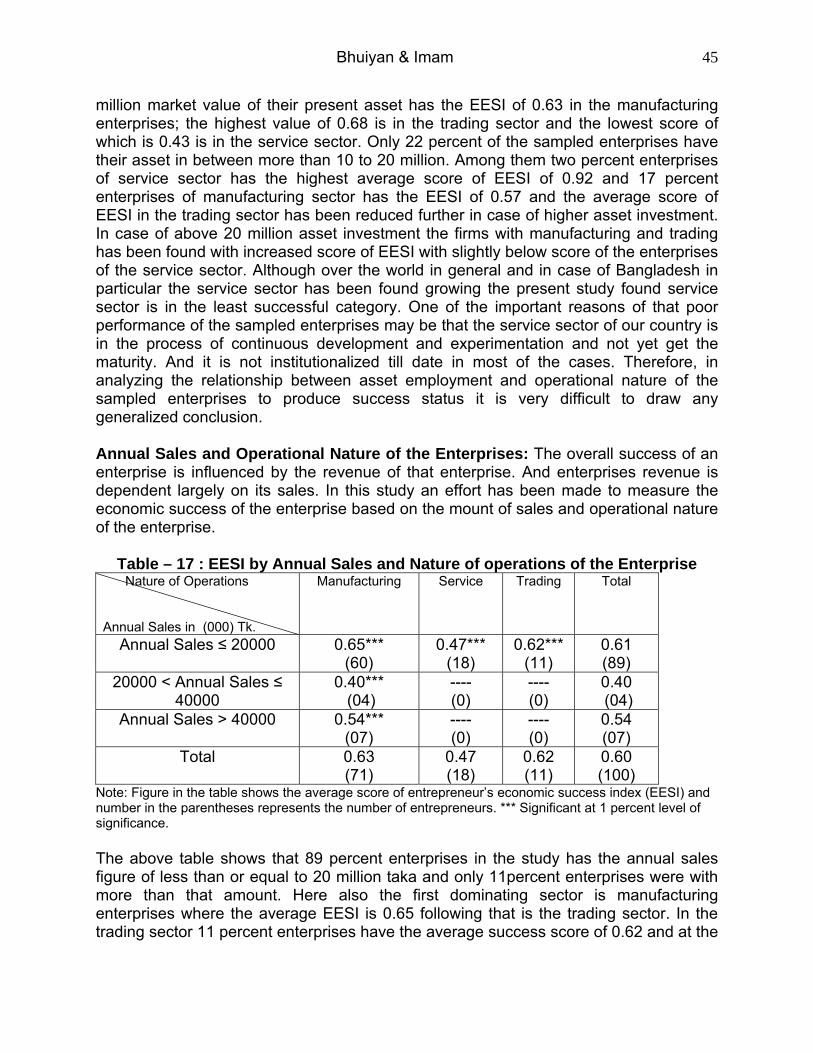
million market value of their present asset has the EESI of 0.63 in the manufacturing enterprises; the highest value of 0.68 is in the trading sector and the lowest score of which is 0.43 is in the service sector. Only 22 percent of the sampled enterprises have their asset in between more than 10 to 20 million. Among them two percent enterprises of service sector has the highest average score of EESI of 0.92 and 17 percent enterprises of manufacturing sector has the EESI of 0.57 and the average score of EESI in the trading sector has been reduced further in case of higher asset investment. In case of above 20 million asset investment the firms with manufacturing and trading has been found with increased score of EESI with slightly below score of the enterprises of the service sector. Although over the world in general and in case of Bangladesh in particular the service sector has been found growing the present study found service sector is in the least successful category. One of the important reasons of that poor performance of the sampled enterprises may be that the service sector of our country is in the process of continuous development and experimentation and not yet get the maturity. And it is not institutionalized till date in most of the cases. Therefore, in analyzing the relationship between asset employment and operational nature of the sampled enterprises to produce success status it is very difficult to draw any generalized conclusion. Annual Sales and Operational Nature of the Enterprises: The overall success of an enterprise is influenced by the revenue of that enterprise. And enterprises revenue is dependent largely on its sales. In this study an effort has been made to measure the economic success of the enterprise based on the mount of sales and operational nature of the enterprise.
Table – 17 : EESI by Annual Sales and Nature of operations of the Enterprise
Nature of Operations Annual Sales in (000) Tk.
Manufacturing Service Trading Total
Annual Sales ≤ 20000 0.65*** (60)
0.47*** (18)
0.62*** (11)
0.61 (89)
20000 < Annual Sales ≤ 40000
0.40*** (04)
---- (0)
---- (0)
0.40 (04)
Annual Sales > 40000 0.54*** (07)
---- (0)
---- (0)
0.54 (07)
Total 0.63 (71)
0.47 (18)
0.62 (11)
0.60 (100)
Note: Figure in the table shows the average score of entrepreneur’s economic success index (EESI) and number in the parentheses represents the number of entrepreneurs. *** Significant at 1 percent level of significance. The above table shows that 89 percent enterprises in the study has the annual sales figure of less than or equal to 20 million taka and only 11percent enterprises were with more than that amount. Here also the first dominating sector is manufacturing enterprises where the average EESI is 0.65 following that is the trading sector. In the trading sector 11 percent enterprises have the average success score of 0.62 and at the
Bhuiyan & Imam
46
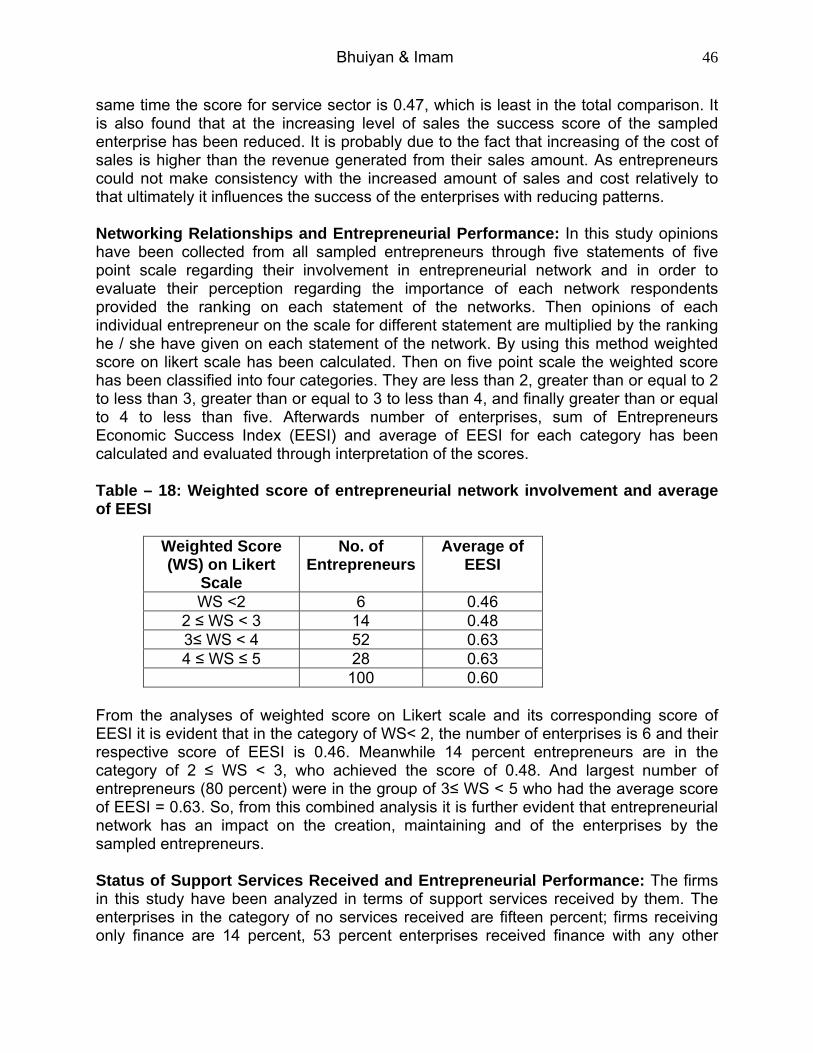
same time the score for service sector is 0.47, which is least in the total comparison. It is also found that at the increasing level of sales the success score of the sampled enterprise has been reduced. It is probably due to the fact that increasing of the cost of sales is higher than the revenue generated from their sales amount. As entrepreneurs could not make consistency with the increased amount of sales and cost relatively to that ultimately it influences the success of the enterprises with reducing patterns. Networking Relationships and Entrepreneurial Performance: In this study opinions have been collected from all sampled entrepreneurs through five statements of five point scale regarding their involvement in entrepreneurial network and in order to evaluate their perception regarding the importance of each network respondents provided the ranking on each statement of the networks. Then opinions of each individual entrepreneur on the scale for different statement are multiplied by the ranking he / she have given on each statement of the network. By using this method weighted score on likert scale has been calculated. Then on five point scale the weighted score has been classified into four categories. They are less than 2, greater than or equal to 2 to less than 3, greater than or equal to 3 to less than 4, and finally greater than or equal to 4 to less than five. Afterwards number of enterprises, sum of Entrepreneurs Economic Success Index (EESI) and average of EESI for each category has been calculated and evaluated through interpretation of the scores. Table – 18: Weighted score of entrepreneurial network involvement and average of EESI
Weighted Score (WS) on Likert
Scale
No. of Entrepreneurs
Average of EESI
WS <2 6 0.46 2 ≤ WS < 3 14 0.48 3≤ WS < 4 52 0.63 4 ≤ WS ≤ 5 28 0.63
100 0.60 From the analyses of weighted score on Likert scale and its corresponding score of EESI it is evident that in the category of WS< 2, the number of enterprises is 6 and their respective score of EESI is 0.46. Meanwhile 14 percent entrepreneurs are in the category of 2 ≤ WS < 3, who achieved the score of 0.48. And largest number of entrepreneurs (80 percent) were in the group of 3≤ WS < 5 who had the average score of EESI = 0.63. So, from this combined analysis it is further evident that entrepreneurial network has an impact on the creation, maintaining and of the enterprises by the sampled entrepreneurs. Status of Support Services Received and Entrepreneurial Performance: The firms in this study have been analyzed in terms of support services received by them. The enterprises in the category of no services received are fifteen percent; firms receiving only finance are 14 percent, 53 percent enterprises received finance with any other
Bhuiyan & Imam
47
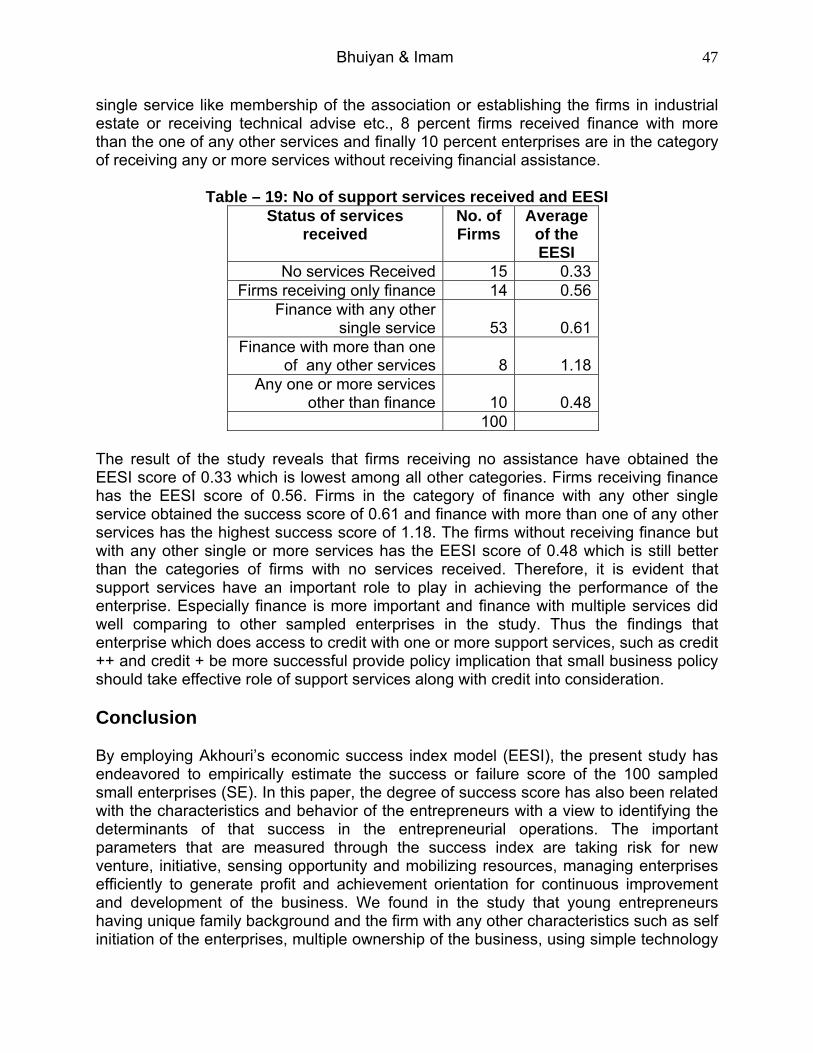
single service like membership of the association or establishing the firms in industrial estate or receiving technical advise etc., 8 percent firms received finance with more than the one of any other services and finally 10 percent enterprises are in the category of receiving any or more services without receiving financial assistance.
Table – 19: No of support services received and EESI Status of services
received No. of Firms
Average of the EESI
No services Received 15 0.33 Firms receiving only finance 14 0.56
Finance with any other single service 53 0.61
Finance with more than one of any other services 8 1.18
Any one or more services other than finance 10 0.48
100 The result of the study reveals that firms receiving no assistance have obtained the EESI score of 0.33 which is lowest among all other categories. Firms receiving finance has the EESI score of 0.56. Firms in the category of finance with any other single service obtained the success score of 0.61 and finance with more than one of any other services has the highest success score of 1.18. The firms without receiving finance but with any other single or more services has the EESI score of 0.48 which is still better than the categories of firms with no services received. Therefore, it is evident that support services have an important role to play in achieving the performance of the enterprise. Especially finance is more important and finance with multiple services did well comparing to other sampled enterprises in the study. Thus the findings that enterprise which does access to credit with one or more support services, such as credit ++ and credit + be more successful provide policy implication that small business policy should take effective role of support services along with credit into consideration. Conclusion By employing Akhouri’s economic success index model (EESI), the present study has endeavored to empirically estimate the success or failure score of the 100 sampled small enterprises (SE). In this paper, the degree of success score has also been related with the characteristics and behavior of the entrepreneurs with a view to identifying the determinants of that success in the entrepreneurial operations. The important parameters that are measured through the success index are taking risk for new venture, initiative, sensing opportunity and mobilizing resources, managing enterprises efficiently to generate profit and achievement orientation for continuous improvement and development of the business. We found in the study that young entrepreneurs having unique family background and the firm with any other characteristics such as self initiation of the enterprises, multiple ownership of the business, using simple technology
Bhuiyan & Imam
48
and easy operational procedure in running the enterprise and chosen the growing sector especially the manufacturing sector for doing the business are more successful. In analyzing the relationship between age and training no specific pattern are found. When classified by gender and marital status, it is observed that female but married entrepreneurs turned out to be more successful. An analysis of cross-relationship between educational background and gender testifies positive impact of education on the performance of both the genders. However, highest impact is reflected on the female entrepreneurs. The study also identifies training as a substitute of the experience, a supplement to the moderate educational background and an alternative to the high educational background of the entrepreneurs. The findings related to training indicate no specific variations in respect of genders. The study also identifies the necessity of designing need based training program with specific duration and contents to exploit the expected benefits. In analyzing the impact of size and nature of the enterprise upon the success score, enterprises in the manufacturing sector having less than 10 employees or possessing less than 10 million taka as assets or less than 20 million taka of annual sales are tend to be more successful. One of the major findings is that enterprises having higher informal network relationship tend to be successful. The more important findings that enterprises, which have access to credit with one or more support services (credit++, Credit+) are more successful than that of any other category suggest that small business development policy be formulated with the consideration of this findings.
References Altaf, Z. (1983) Pakistani Entrepreneurs: Their Development, Characteristics and
Attitudes, Croom Helm, London Begley, T. M., & Boyd, D. B. (1987). Psychological characteristics associated with
performance in entrepreneurial firms and small businesses. Journal of Business Venturing(2), 79-93.
Birley, S. and P. Westhead (1990), ‘Growth and performance contrasts between ‘types’
of small firms’, Strategic Management Journal 11, 535–557 Birley, S. and P. Westhead, (1994), ‘A taxonomy of business start-up reasons and their
impact on firm growth and size’, Journal of Business Venturing 9, 7–31 Brandstaetter, H. (1997). Becoming an entrepreneur - a question of personality
structure? Journal of Economic Psychology, 18, 157-177 Chell, E., Haworth, J., & Brearley, S. (1991). The entrepreneurial personality: Concepts,
cases, and categories. London, New York: Routledge.
Bhuiyan & Imam
49
Cromie, S. (1991), ‘The problems experienced by young firms’, International Small Business Journal 3, 43–61.
Cooper, A. C. & Gimeno-Gascon, F. J. (1992). Entrepreneurs, process of founding, and
new-firm performance. In D. L. Sexton & J. D. Kasarda (Eds.). The state of the art of Entrepreneurship, 301-340. Boston.
Frey, R. S. (1984). Does n-Achievement cause economic development? A cross lagged
panel analysis of the McClellant thesis. The Journal of Social Psychology, 122, 67-70.
Gartner, W.B. (1985). A conceptual framework for describing the phenomenon of new
venture creation. Academy of Management Review, 10, 4, 696-706. Goebel, S., & Frese, M. (1999). Persoenlichkeit, Strategien und Erfolg bei
Kleinunternehmern. In K. Moser, B. Batinic, J. Zempel. Unternehmerisch erfolgreiches Handeln. Goettingen: Hogrefe.
Knight, F. H. (1921). Risk, Uncertainty and Profit, New York: Houghton-Miffin Kotha, S. and A. Nair, 1995, ‘Strategy and Environment as Determinants of
Performance: Evidence from the Japanese Machine Tool Industry’, Strategic management journal 16, 497–518.
Marshall, A. (1930). Principles of Economics, London: MacMillan. McClelland, D.C. (1961), The achieving society. Princeton, NJ: Van Nostrand Co. Mirron, D., & McClelland, D. C. (1979). The impact of achievement motivation training
on small businesses, California Management Review, 21(4), 13-28. Rahman, A.H.M.H., and Associates, (1979) Entrepreneurship and small Enterprise
Development of Bangladesh, Bureau of Business Research, Dhaka University, Rauch, A., & Frese, M. (1997,). Does planning matter? Relations between planning and
success in small enterprises in Ireland and in Germany. Paper presented at the 42nd World Conference of the ICSB International Council for Small Business, San Francisco.
Rauch, A., & Frese, M. (2000). Psychological approaches to entrepreneurial success. A
general model and an overview of findings. In C.L. Cooper & I.T. Robertson (Eds.), International Review of Industrial and Organizational Psychology (pp. 101-142). Chichester: Wiley.
Risseeuw, P.A. and E. Masurel (1994), ‘The role of planning in small firms: empirical
evidence from a typical service industry’, Small Business Economics 6, 313–322.
Bhuiyan & Imam
50
Resseeuw, P.A. (undated) “Estimating the Determinants of Financial Performance of
Very Small Service Firms”, Economics and social Institute, Vrige universiteit, The Netherlands.
Rotter, J. B. (1966) Generalized expectancies for internal versus external control of
Reinforcement. Psychological Monographs, 609(80), 1. Say, J. B. (1971). A Treatise on Political Economy or the Production, Distribution and
Consumption of Wealth, A. M. Kelley Publishers: New York. Schumpeter, J. A. (1934). The Theory of Economic Development, Cambridge, MA:
Harvard University Press. Simon, H.A. (1982), Models of bounded rationality: behavioral economics and business
organizations, Cambridge, Mass: MIT Press.

![Jonojuddher Gonojoddha by Major Qamrul Hassan Bhuiyan [amarboi… · 2019. 12. 29. · Jonojuddher Gonojoddha by Major Qamrul Hassan Bhuiyan [amarboi.com] Author: Jonojuddher Gonojoddha](https://img.pdfslide.tips/doc/110x75/60c57875778cca0a96064de4/jonojuddher-gonojoddha-by-major-qamrul-hassan-bhuiyan-amarboi-2019-12-29-jonojuddher.jpg)