Embed Size (px)
Citation preview
ENV02 WP1 D1.1.1.docx Page 1 of 44
EMRP ENV02 PartEmission
WP1 Task 1.1
Deliverable 1.1.1
Calibration service for mobility measurements based on reference material for monodisperse
spherical particles in aerosols
2012-07-23
Egbert Buhr, Tobias Klein, Anke Jordan-Gerkens (PTB)1
Jürg Schlatter, Felix Lüönd (METAS)2
Anastasios Melas, Athanasios Mamakos (JRC-IE)3
Kai Dirscherl (DFM)4
Thomas Tuch, Alfred Wiedensohler (IfT)5
1 Physikalisch Technische Bundesanstalt (PTB), Germany 2 Bundesamt für Metrologie METAS, Switzerland 3 Joint Research Centre – Institute for Energy and Transport (JRC-IE), EC 4 Dansk Fundamental Metrologi (DFM), Denmark 5 Leibniz-Institut für Troposphärenforschung e.V. (IfT), Germany (REG)
ENV02 WP1 D1.1.1.docx Page 2 of 44
CONTENT 1 Scope ............................................................................................................................. 3
2 Reference Aerosol from Suspensions ............................................................................ 3
2.1 Supply of suspensions (METAS) ................................................................................ 4
2.2 Size calibration of suspension particles using TSEM (PTB) ....................................... 4
2.2.1 Measurement procedure .................................................................................. 4
2.2.2 Measurement uncertainty ................................................................................. 5
2.2.3 Results ............................................................................................................. 6
2.3 Size calibration of suspension particles using AFM (DFM) ........................................10
2.3.1 Measurement procedure .................................................................................10
2.3.2 Uncertainty ......................................................................................................11
2.3.3 Results ............................................................................................................11
2.4 Aerosolisation from suspensions (METAS) ...............................................................13
2.5 Mobility measurement and calibration results (METAS) ............................................15
2.5.1 Measurement procedure .................................................................................15
2.5.2 Measurement uncertainty ................................................................................16
2.5.3 Results and comparison with TSEM ................................................................16
3 Reference Aerosol from Silver Oven .............................................................................17
3.1 Generation of primary Ag aerosol (IfT) ......................................................................18
3.2 Collection of particles from aerosol (METAS, IfT) ......................................................21
3.3 Size calibration with TSEM (PTB) .............................................................................23
3.4 Exemplary calibration results (IfT) .............................................................................25
4 Calibration Services ......................................................................................................27
4.1 DFM (particle size, AFM) ..........................................................................................27
4.2 PTB (particle size, TSEM) .........................................................................................27
4.3 JRC-IET (aerosol particle size, DMA) ........................................................................28
4.3.1 Experimental setup .........................................................................................28
4.3.2 Singlets results ................................................................................................30
4.3.3 PSL doublet results .........................................................................................33
4.4 METAS (aerosol particle sizers) ................................................................................35
4.5 PTB 3.2 (aerosol particle sizers) ...............................................................................35
4.6 IfT (aerosol particle sizers) ........................................................................................40
5 Conclusions ...................................................................................................................42
6 References ....................................................................................................................43
ENV02 WP1 D1.1.1.docx Page 3 of 44
1 SCOPE Concerns related to the adverse health effects of automotive exhaust aerosols have
driven the regulatory authorities worldwide to limit the particulate emissions of diesel vehicles. The particulate emission performance at a certification stage is traditionally monitored gravimetrically, by means of collecting samples from a Constant Volume Sampler (CVS). Recognizing that the gravimetric procedure would not be sensitive enough to discriminate between the very efficient wall flow Diesel Particulate Filters (DPFs) and flow through particulate filters, a particle number limit was also introduced which became effective at a Euro 5b stage (9/2011 – [1] [2]).
Introducing particle number measurements the procedures for instrument validation and calibration was issued. These procedures are based on the measurement of particles with defined mobility diameters between 23 nm and 100 nm [3]. The traceable and reliable measurement of the geometric diameter from spherical particles is mandatory for this task. The result from work package 3 of the iMERA-Plus project T3.J1.1 – “Traceable characterization of nanoparticles” [4] shall be applied and tuned to the requirements of WP1 of ENV02 “PartEmission”. On one hand the diameter of spherical particles shall be determined in order to use the particles as a size reference material, on the other hand the particles shall be used as calibration aerosols for the mobility particle sizers.
The purpose of this report is to summarize the actions of the project partners in order to prepare reference materials and measurement services. These are the first deliverables from the Work package 1 “Automotive combustion particle metrics” of the EMRP project ENV02 “PartEmission”. The EMRP is jointly funded by the EMRP participating countries within EURAMET and the European Union.
2 REFERENCE AEROSOL FROM SUSPENSIONS Reference nanoparticles are commonly delivered and stored as suspensions. One
reason is that agglomeration of the nanoparticles can be avoided or strongly reduced using appropriate additives in the suspensions. To use nanoparticle suspensions for the calibration of mobility analysers, the suspensions must be aerosolized, dried and diluted. And, of course, the size of the nanoparticles needs to be known with sufficient uncertainty.
For the calibration of the particle size, or, more precisely, the particle size distribution, two methods have been applied in this study. One method uses a Transmission Scanning Electron Microscope (TSEM) and the other makes use of Atomic Force Microscopy (AFM). Both methods require that the particles are deposited on surfaces.
The advantage of this procedure is that the calibration of the particle sizer can be repeated with the same size standard several times, as long the suspension is not soiled or the particles are not agglomerated in the suspension. The risk or disadvantage of this method is that the measured diameter of deposited particles may differ from the diameter after aerosolisation.
ENV02 WP1 D1.1.1.docx Page 4 of 44
2.1 Supply of suspensions (METAS) Suspensions of solid spherical nanoparticles for calibration purposes are commercially
available. Some of the suppliers offer the suspensions with a factory certificate, but not as a certified reference material [5]. A wide range of particle materials was discussed: PSL (polystyrene), gold, silver, TiO2, SiO2, etc. Discussions within the project partners lead to selection criteria as existing experience, availability of the diameters, particle roundness, width of the size distribution and tendency to agglomerate.
Finally gold and PSL particles were proposed to give the best results and thus were used in this study. Some initial tests of roundness and agglomeration were performed with silver particles.
Each partner was asked to purchase 6 units from the same lot of suspension and distribute them to the other partners (Table 1).
Table 1: Summary of suspensions with spherical particles.
Particle material
Size Manufacturer Product Number
Quantity per unit
Buyer
Gold 20 nm TedPella 15705-1 100ml PTB
Gold 30 nm TedPella 15706-1 100ml PTB
Gold 40 nm TedPella 15707-1 100ml METAS
Silver 40 nm TedPella 15707-1SC 20ml DFM
Gold 100 nm TedPella 15708-9 100ml IfT
PSL 200 nm ThermoScientific 3200A 15 ml JRC-IE
2.2 Size calibration of suspension particles using TSEM (PTB)
2.2.1 MEASUREMENT PROCEDURE
Aiming for reliable size measurements of nanoparticles, a special SEM technique using a transmission electron detector (“Transmission Scanning Electron Microscopy”, TSEM) has been proven to be valuable [6]. Compared to secondary electron imaging often used in SEM, TSEM measurements exhibit a number of advantages like improved resolution and decreased sensitivity regarding specimen charging. Moreover, accurate simulation of TSEM image formation is less complex than comparable simulations of secondary electron imaging. These advantages may be exploited for an improved localization of particle boundaries and to achieve traceable size measurements [7].
The measurement setup consists of a standard SEM (Zeiss Supra 35 VP) equipped with a transmission detector placed underneath the sample. The detector collects the electrons which have passed the sample within a small angular cone. To determine the pixel size in the TSEM images we used 2D-pitch standards which have been calibrated at PTB using a deep UV laser diffractometer [8]. The samples were prepared under clean-room conditions by giving a droplet of the suspension on a thin carbon film fixed on a TEM grid. The samples
ENV02 WP1 D1.1.1.docx Page 5 of 44
were stored for a while in an atmosphere with saturated water and thereafter the remaining suspension was removed by means of a clean room tissue.
Accurate size measurement requires accurate detection of the particle boundary. We used a gray level threshold approach to determine the particle boundary in the TSEM images. The threshold levels were obtained from simulations of the image formation process. These simulations rely on physical models describing the electron diffusion in solid state taking into account relevant characteristics of the instrument. For given instrument settings, the TSEM threshold levels depend on particle size and material. Consequently, an iteration procedure is necessary during image analysis to adapt the threshold level for every single particle under test.
For every particle, the number of pixels belonging to the particle are counted and multiplied with the area (in nm2) of a single pixel. The final particle size is defined as the diameter of a circle exhibiting the same area. In order to distinguish isolated nanoparticles from particle clusters or artefacts, like e.g. impurities, objects which do not fit within a certain size range or which possess a ‘circularity’ (quantitative parameter describing the departure of a given shape from roundness) smaller than a certain minimum are rejected. A precise tuning of three parameters (minimal and maximum size as well as circularity) is therefore necessary. Despite this effort, a thorough characterization of a sample can be achieved surprisingly fast by means of automated image acquisition as well as automated analysis of some thousand particles overcoming the drawback of insufficient statistics often associated with electron microscopy.
2.2.2 MEASUREMENT UNCERTAINTY
For the evaluation of the uncertainty associated with the measured particle size we applied the internationally accepted rules described in the ‘Guide to the expression of uncertainty in measurement’ (GUM) [9]. The analysis showed that the uncertainty contribution resulting from the x/y - calibration of the TSEM instrument plays only a minor role compared with the other uncertainty components discussed below.
The uncertainty of the simulated threshold level is an important contribution because it directly determines the position of the particle boundary and thus the particle size. There is an uncertainty attributed to this threshold level because the relevant input quantities used for the simulation can only be determined within certain limits. Furthermore, some assumptions like that of spherical particles are only approximately valid.
Other uncertainty contributions arise from the analysis of the recorded TSEM images. The images may be affected by image noise and by further effects like, e.g. unwanted additional signals caused by inhomogeneities of the carbon support film or possibly dried-up residuals of the dispersion liquid. Because circular objects are represented in a digital image as a number of square pixels, digitalization errors occur. The resultant uncertainty contribution is reduced considerably by interpolating the original image before determining the size.
A reasonable number of particles have to be analysed in order to get statistically meaningful results. No assumptions for the particle size distribution are made and hence the associated statistical uncertainty component is given by the experimental standard deviation of the sample mean. Since a sufficient number of particles (some thousands) have been analysed and since the particle size distributions are comparably narrow, the statistical
ENV02 WP1 D1.1.1.docx Page 6 of 44
uncertainty portion is small compared to the combined effect of the systematic uncertainty contributions.
Sample preparation should guarantee that a representative subsample of the suspended particles is present on the substrate. At the time being an uncertainty contribution due to possibly imperfect sample preparation is not included in the uncertainty budget. The stated data like the spread of the size distribution and its mean value describe the nanoparticles present on the substrate.
From the resulting combined uncertainty the expanded measurement uncertainty of the mean particle size is derived (coverage factor k=2). For the nanoparticle samples studied here, the expanded uncertainties are estimated to be in the range of about 2 to 7 nm, details see below in 2.2.3.
2.2.3 RESULTS
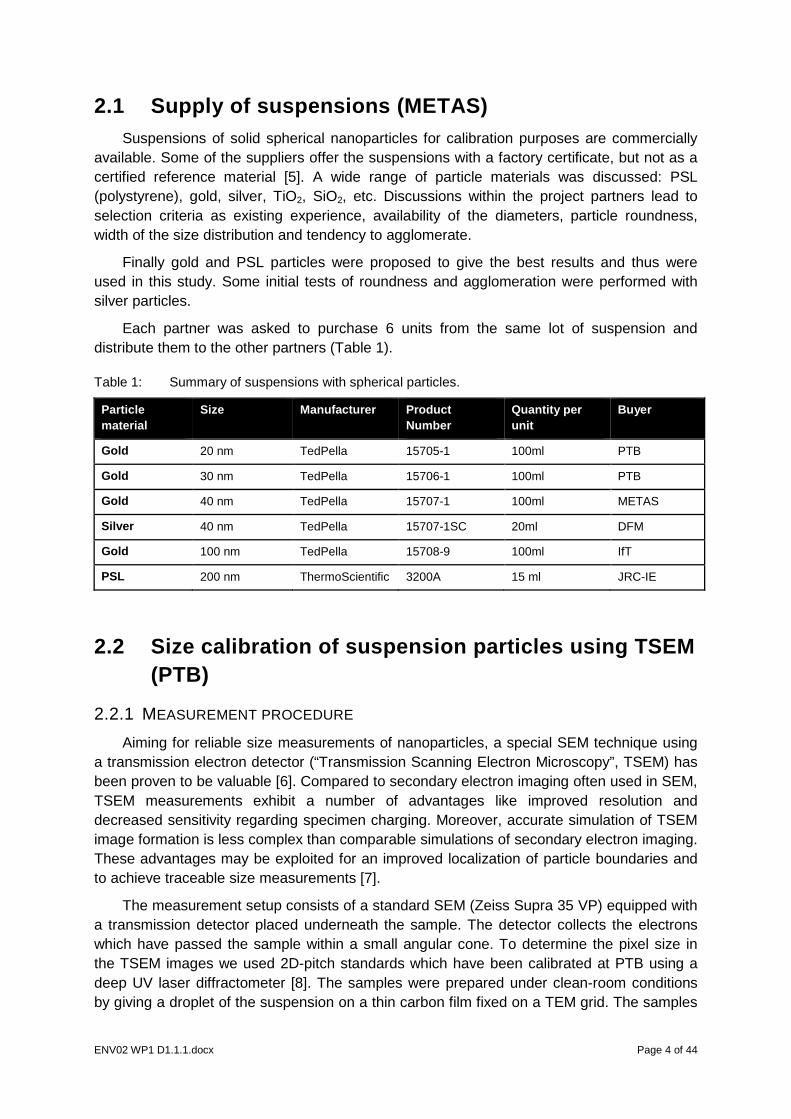
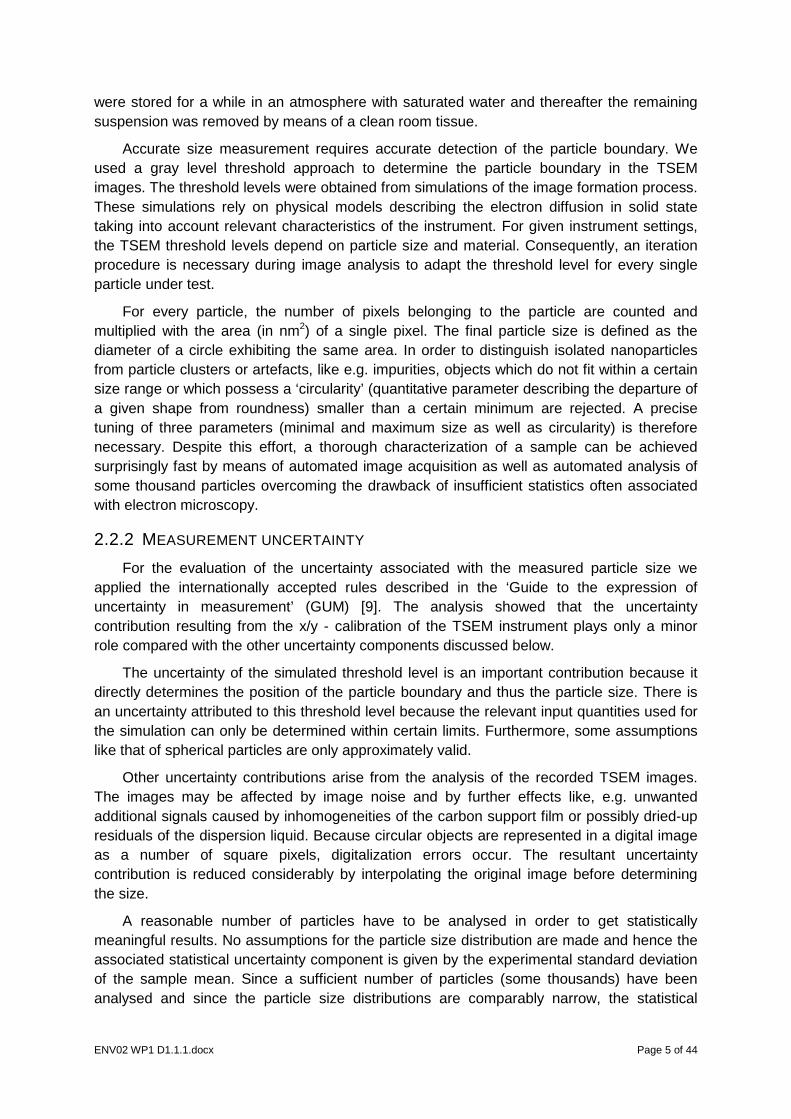
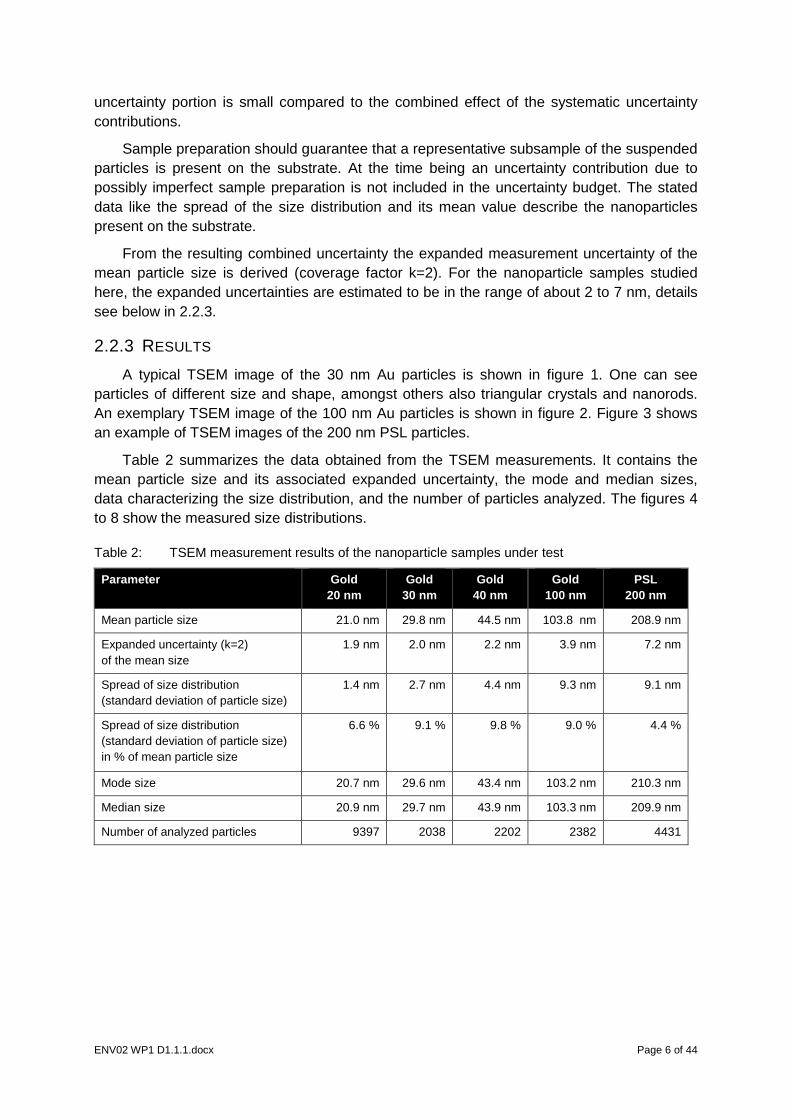
A typical TSEM image of the 30 nm Au particles is shown in figure 1. One can see particles of different size and shape, amongst others also triangular crystals and nanorods. An exemplary TSEM image of the 100 nm Au particles is shown in figure 2. Figure 3 shows an example of TSEM images of the 200 nm PSL particles.
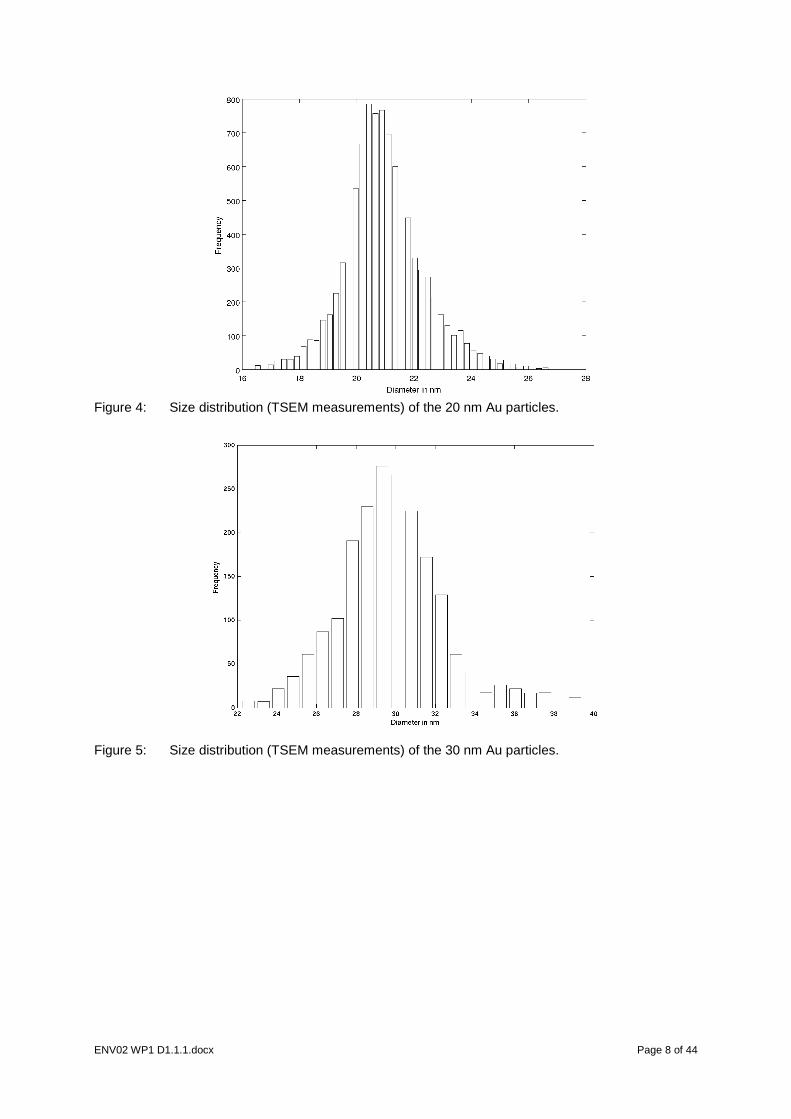
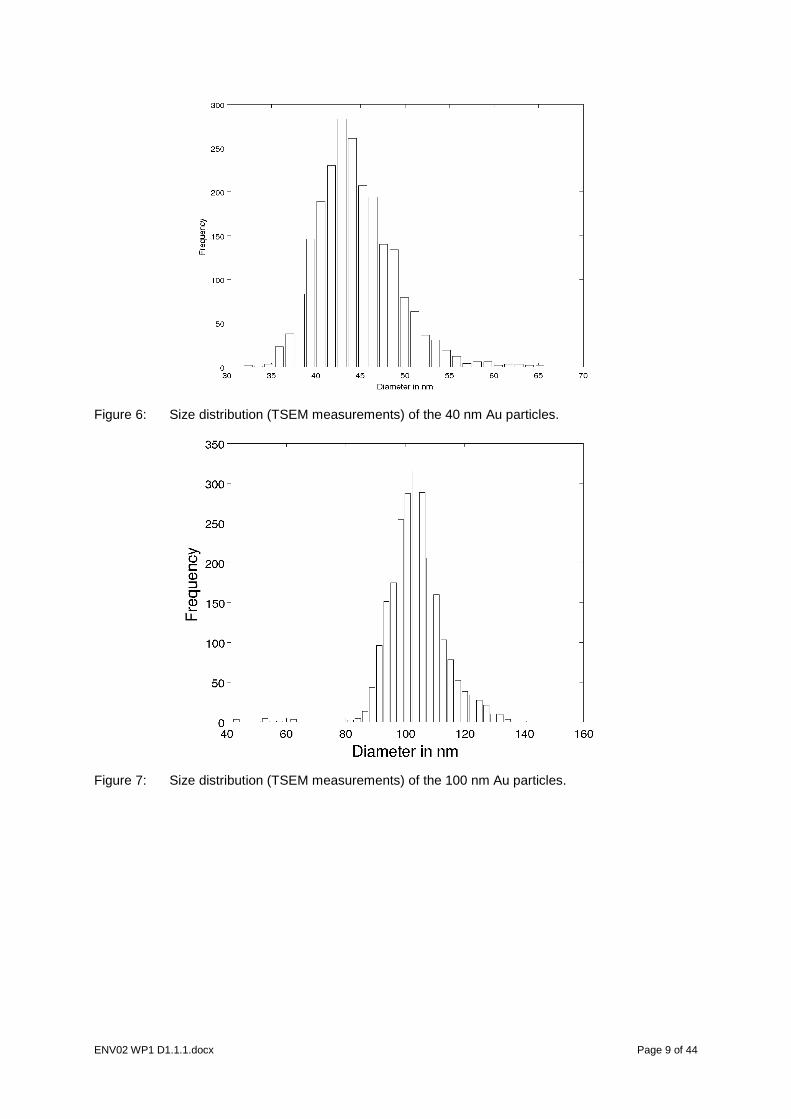
Table 2 summarizes the data obtained from the TSEM measurements. It contains the mean particle size and its associated expanded uncertainty, the mode and median sizes, data characterizing the size distribution, and the number of particles analyzed. The figures 4 to 8 show the measured size distributions.
Table 2: TSEM measurement results of the nanoparticle samples under test
Parameter Gold 20 nm
Gold 30 nm
Gold 40 nm
Gold 100 nm
PSL 200 nm
Mean particle size 21.0 nm 29.8 nm 44.5 nm 103.8 nm 208.9 nm
Expanded uncertainty (k=2) of the mean size
1.9 nm 2.0 nm 2.2 nm 3.9 nm 7.2 nm
Spread of size distribution (standard deviation of particle size)
1.4 nm 2.7 nm 4.4 nm 9.3 nm 9.1 nm
Spread of size distribution (standard deviation of particle size) in % of mean particle size
6.6 % 9.1 % 9.8 % 9.0 % 4.4 %
Mode size 20.7 nm 29.6 nm 43.4 nm 103.2 nm 210.3 nm
Median size 20.9 nm 29.7 nm 43.9 nm 103.3 nm 209.9 nm
Number of analyzed particles 9397 2038 2202 2382 4431
ENV02 WP1 D1.1.1.docx Page 7 of 44
Figure 1: Example of a TSEM image of the 30 nm Au particles.
Figure 2: Example of a TSEM image of the 100 nm Au particles.
Figure 3: Example of a TSEM image of the 200 nm PSL particles.
ENV02 WP1 D1.1.1.docx Page 8 of 44
Figure 4: Size distribution (TSEM measurements) of the 20 nm Au particles.
Figure 5: Size distribution (TSEM measurements) of the 30 nm Au particles.
ENV02 WP1 D1.1.1.docx Page 9 of 44
Figure 6: Size distribution (TSEM measurements) of the 40 nm Au particles.
Figure 7: Size distribution (TSEM measurements) of the 100 nm Au particles.
ENV02 WP1 D1.1.1.docx Page 10 of 44
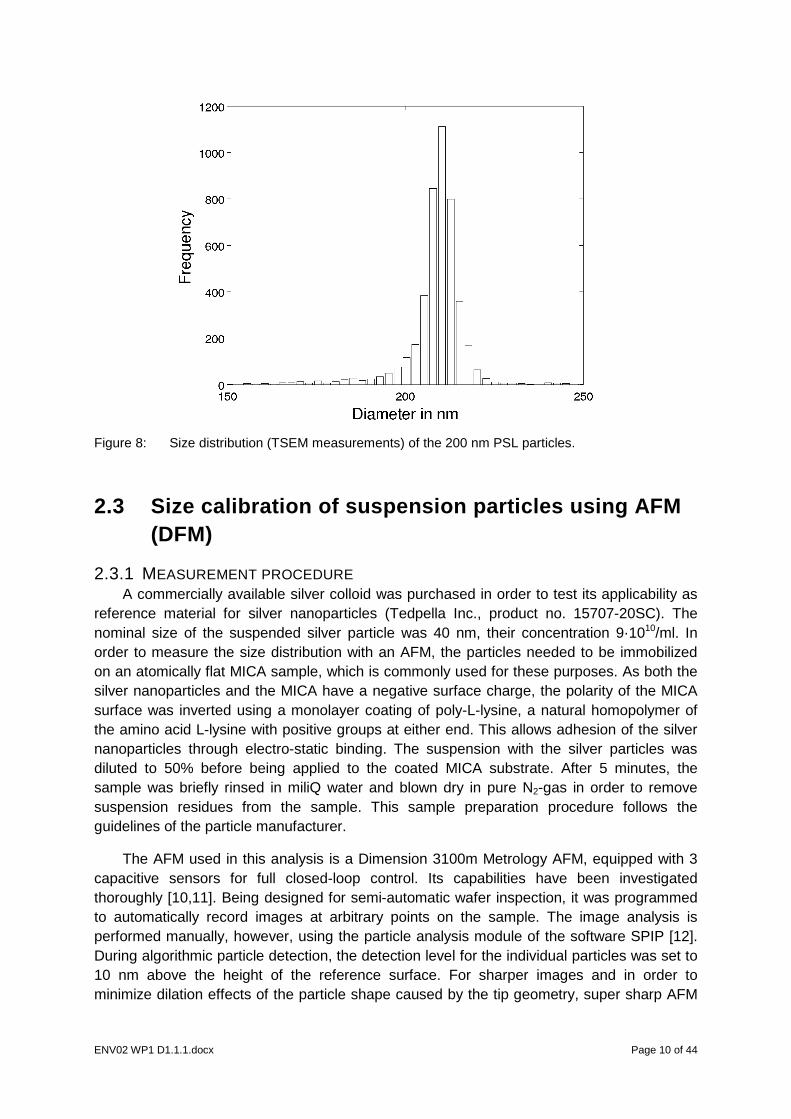
Figure 8: Size distribution (TSEM measurements) of the 200 nm PSL particles.
2.3 Size calibration of suspension particles using AFM (DFM)
2.3.1 MEASUREMENT PROCEDURE A commercially available silver colloid was purchased in order to test its applicability as
reference material for silver nanoparticles (Tedpella Inc., product no. 15707-20SC). The nominal size of the suspended silver particle was 40 nm, their concentration 9·1010/ml. In order to measure the size distribution with an AFM, the particles needed to be immobilized on an atomically flat MICA sample, which is commonly used for these purposes. As both the silver nanoparticles and the MICA have a negative surface charge, the polarity of the MICA surface was inverted using a monolayer coating of poly-L-lysine, a natural homopolymer of the amino acid L-lysine with positive groups at either end. This allows adhesion of the silver nanoparticles through electro-static binding. The suspension with the silver particles was diluted to 50% before being applied to the coated MICA substrate. After 5 minutes, the sample was briefly rinsed in miliQ water and blown dry in pure N2-gas in order to remove suspension residues from the sample. This sample preparation procedure follows the guidelines of the particle manufacturer.
The AFM used in this analysis is a Dimension 3100m Metrology AFM, equipped with 3 capacitive sensors for full closed-loop control. Its capabilities have been investigated thoroughly [10,11]. Being designed for semi-automatic wafer inspection, it was programmed to automatically record images at arbitrary points on the sample. The image analysis is performed manually, however, using the particle analysis module of the software SPIP [12]. During algorithmic particle detection, the detection level for the individual particles was set to 10 nm above the height of the reference surface. For sharper images and in order to minimize dilation effects of the particle shape caused by the tip geometry, super sharp AFM
ENV02 WP1 D1.1.1.docx Page 11 of 44
tip were applied with a tip radius of typically 2 nm or better with a half-cone angle <10° at a distance of 200 nm from the tip apex.
The metric applied in order determine sphere-equivalent diameters of the particles was chosen to be the maximum height dh of the particle above the level of the atomically flat reference surface. Assuming a round and undeformed particle, its apex height equals its diameter. As an additional advantage, the choice of dh as the measurand eliminates the need for considering tip-shape dependent scan artifacts.
2.3.2 UNCERTAINTY For the height equivalent diameter, the shape of the tip is not relevant, as long as its
length remains constant during the scan. Any sudden variation of the tip length, e.g. by contamination with particle material, can be immediately be observed as offsets of the reference level. The images where these occured have been discarded.
For the measurement of the height equivalent diameter dh, the uncertainty budget was set up according to GUM, including contributions from the AFM calibration, roughness of the reference surface and measurement noise, pixilation of the image, tilting of the reference surface, temporal drift and contribution from the averaging.
2.3.3 RESULTS After scanning 248 AFM images with a total of 364 particles suitable for analysis, the
results are shown in Table 3 below.
Table 3: AFM measurement results of the nanoparticle sample under test, silver 40 nm
Parameters for a population of 364 measured particles
Height eq. diameter dh
Mean value 31.8 nm
Expanded uncertainty (k=2) of the mean height 1.6 nm
Spread of height distribution (standard deviation of particle height)
8.2 nm
Spread of size distribution in % of mean height 26 %
Median height 31.0 nm
Mode height 27.9 nm
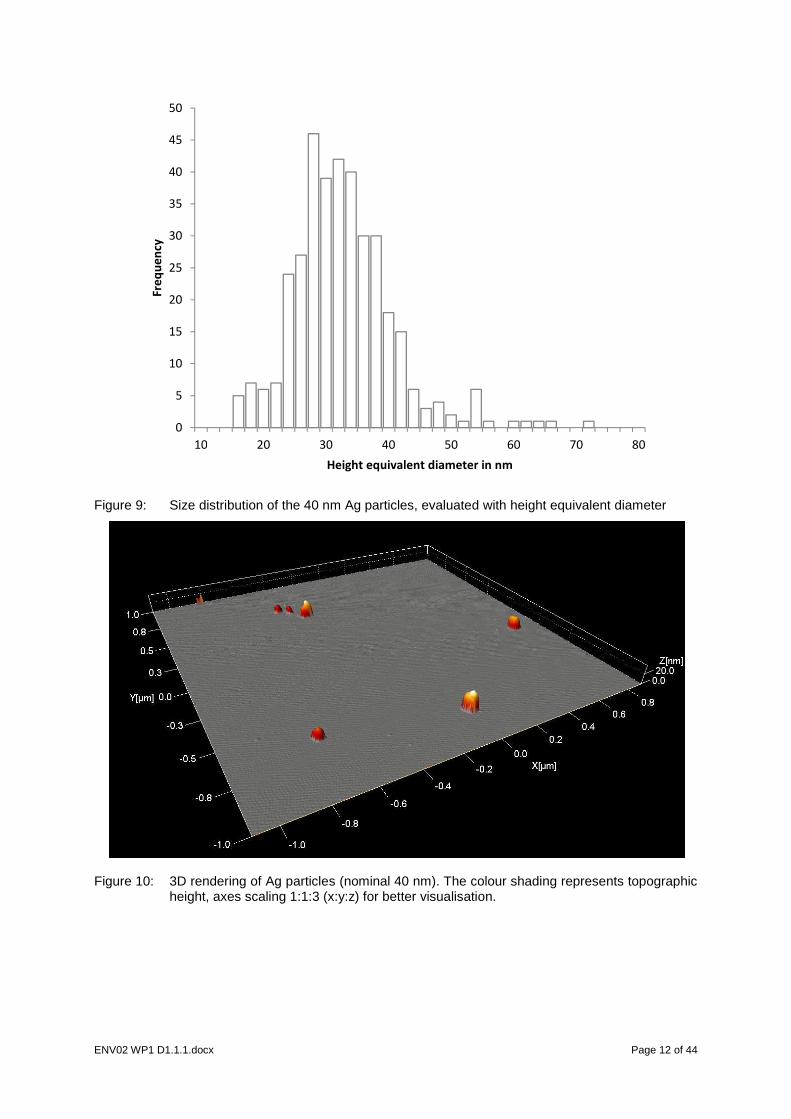
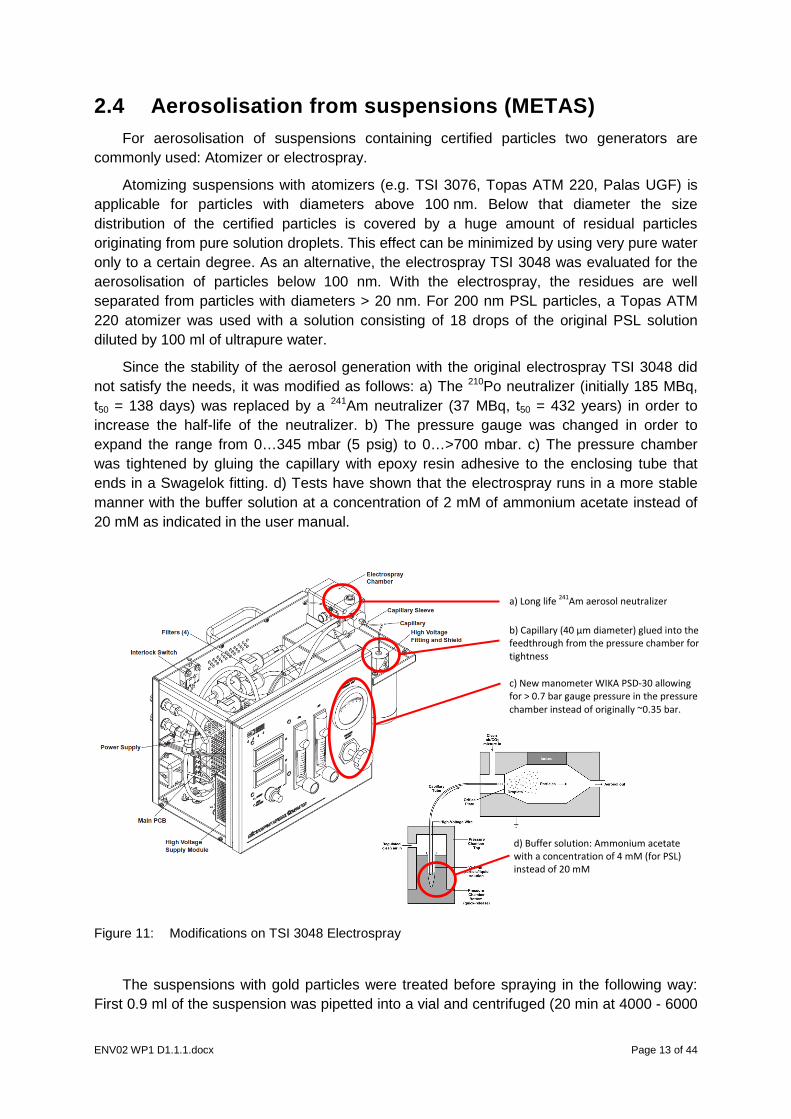
The size distribution is shown in Figure 9. Figure 10 shows a 3D rendering of AFM measurement data for a typical set of particles. Note that the z-scale in Figure 10 is enlarged by a factor of three relative to the x- and y-scale for better visualization.
The ratio of the standard deviation of the size distribution and its mean value, also called the Coefficient of Variation CV, is much larger than 10% (>20%). This large spread of the size distribution of the particle population calls the applicability as reference material particles into question.
ENV02 WP1 D1.1.1.docx Page 12 of 44
Figure 9: Size distribution of the 40 nm Ag particles, evaluated with height equivalent diameter
Figure 10: 3D rendering of Ag particles (nominal 40 nm). The colour shading represents topographic height, axes scaling 1:1:3 (x:y:z) for better visualisation.
0
5
10
15
20
25
30
35
40
45
50
10 20 30 40 50 60 70 80
Fre
qu
en
cy
Height equivalent diameter in nm
ENV02 WP1 D1.1.1.docx Page 13 of 44
2.4 Aerosolisation from suspensions (METAS) For aerosolisation of suspensions containing certified particles two generators are
commonly used: Atomizer or electrospray.
Atomizing suspensions with atomizers (e.g. TSI 3076, Topas ATM 220, Palas UGF) is applicable for particles with diameters above 100 nm. Below that diameter the size distribution of the certified particles is covered by a huge amount of residual particles originating from pure solution droplets. This effect can be minimized by using very pure water only to a certain degree. As an alternative, the electrospray TSI 3048 was evaluated for the aerosolisation of particles below 100 nm. With the electrospray, the residues are well separated from particles with diameters > 20 nm. For 200 nm PSL particles, a Topas ATM 220 atomizer was used with a solution consisting of 18 drops of the original PSL solution diluted by 100 ml of ultrapure water.
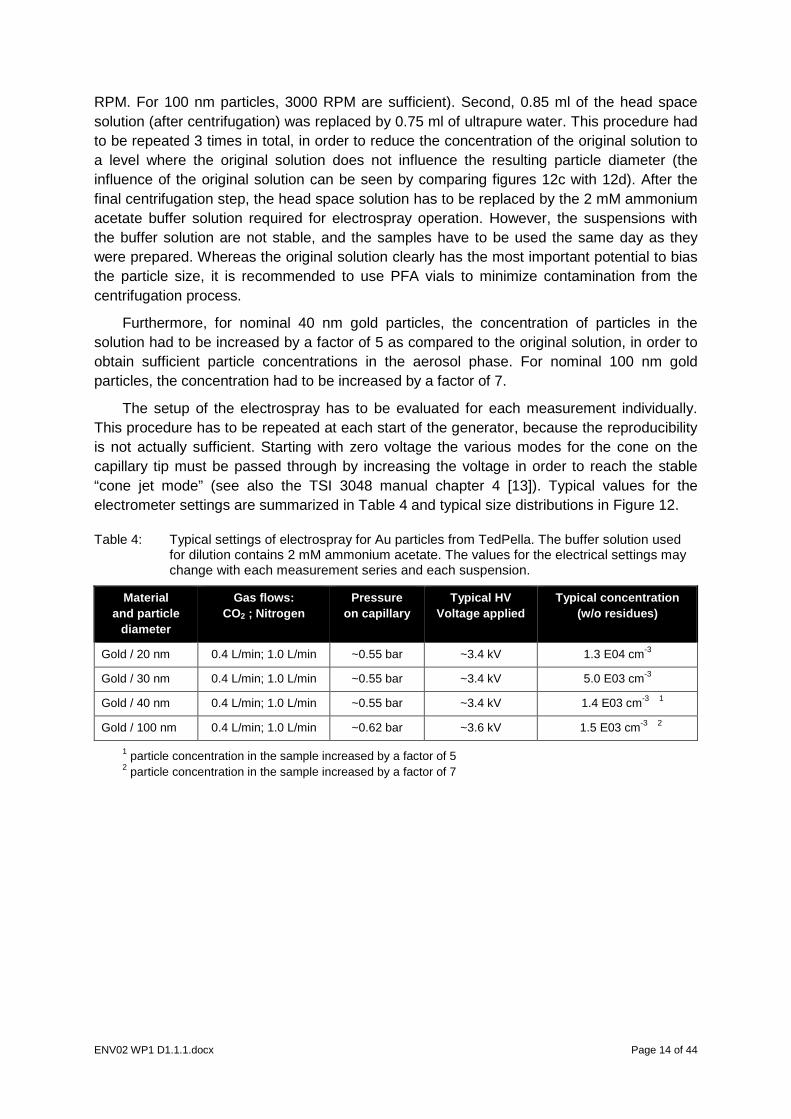
Since the stability of the aerosol generation with the original electrospray TSI 3048 did not satisfy the needs, it was modified as follows: a) The 210Po neutralizer (initially 185 MBq, t50 = 138 days) was replaced by a 241Am neutralizer (37 MBq, t50 = 432 years) in order to increase the half-life of the neutralizer. b) The pressure gauge was changed in order to expand the range from 0…345 mbar (5 psig) to 0…>700 mbar. c) The pressure chamber was tightened by gluing the capillary with epoxy resin adhesive to the enclosing tube that ends in a Swagelok fitting. d) Tests have shown that the electrospray runs in a more stable manner with the buffer solution at a concentration of 2 mM of ammonium acetate instead of 20 mM as indicated in the user manual.
Figure 11: Modifications on TSI 3048 Electrospray
The suspensions with gold particles were treated before spraying in the following way: First 0.9 ml of the suspension was pipetted into a vial and centrifuged (20 min at 4000 - 6000
a) Long life 241
Am aerosol neutralizer
b) Capillary (40 μm diameter) glued into the
feedthrough from the pressure chamber for
tightness c) New manometer WIKA PSD-30 allowing
for > 0.7 bar gauge pressure in the pressure
chamber instead of originally ~0.35 bar.
d) Buffer solution: Ammonium acetate
with a concentration of 4 mM (for PSL)
instead of 20 mM
ENV02 WP1 D1.1.1.docx Page 14 of 44
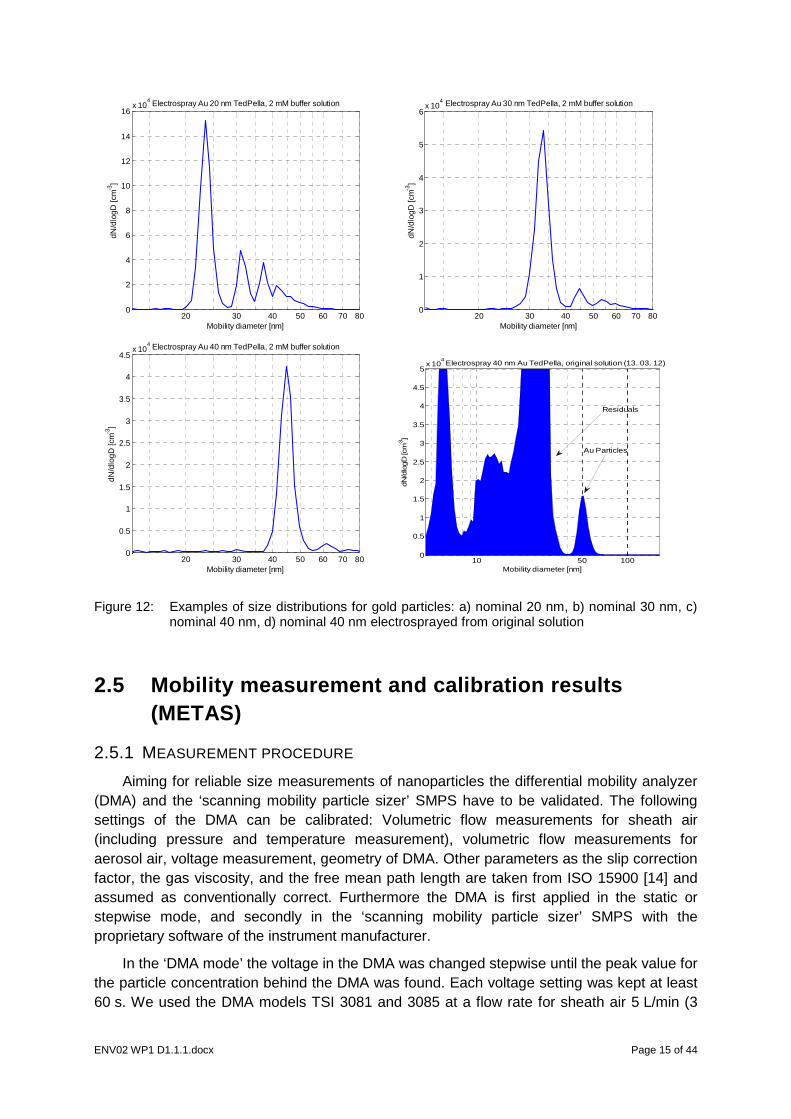
RPM. For 100 nm particles, 3000 RPM are sufficient). Second, 0.85 ml of the head space solution (after centrifugation) was replaced by 0.75 ml of ultrapure water. This procedure had to be repeated 3 times in total, in order to reduce the concentration of the original solution to a level where the original solution does not influence the resulting particle diameter (the influence of the original solution can be seen by comparing figures 12c with 12d). After the final centrifugation step, the head space solution has to be replaced by the 2 mM ammonium acetate buffer solution required for electrospray operation. However, the suspensions with the buffer solution are not stable, and the samples have to be used the same day as they were prepared. Whereas the original solution clearly has the most important potential to bias the particle size, it is recommended to use PFA vials to minimize contamination from the centrifugation process.
Furthermore, for nominal 40 nm gold particles, the concentration of particles in the solution had to be increased by a factor of 5 as compared to the original solution, in order to obtain sufficient particle concentrations in the aerosol phase. For nominal 100 nm gold particles, the concentration had to be increased by a factor of 7.
The setup of the electrospray has to be evaluated for each measurement individually. This procedure has to be repeated at each start of the generator, because the reproducibility is not actually sufficient. Starting with zero voltage the various modes for the cone on the capillary tip must be passed through by increasing the voltage in order to reach the stable “cone jet mode” (see also the TSI 3048 manual chapter 4 [13]). Typical values for the electrometer settings are summarized in Table 4 and typical size distributions in Figure 12.
Table 4: Typical settings of electrospray for Au particles from TedPella. The buffer solution used for dilution contains 2 mM ammonium acetate. The values for the electrical settings may change with each measurement series and each suspension.
Material and particle
diameter
Gas flows: CO2 ; Nitrogen
Pressure on capillary
Typical HV Voltage applied
Typical concentration (w/o residues)
Gold / 20 nm 0.4 L/min; 1.0 L/min ~0.55 bar ~3.4 kV 1.3 E04 cm-3
Gold / 30 nm 0.4 L/min; 1.0 L/min ~0.55 bar ~3.4 kV 5.0 E03 cm-3
Gold / 40 nm 0.4 L/min; 1.0 L/min ~0.55 bar ~3.4 kV 1.4 E03 cm-3 1
Gold / 100 nm 0.4 L/min; 1.0 L/min ~0.62 bar ~3.6 kV 1.5 E03 cm-3 2
1 particle concentration in the sample increased by a factor of 5 2 particle concentration in the sample increased by a factor of 7
ENV02 WP1 D1.1.1.docx Page 15 of 44
Figure 12: Examples of size distributions for gold particles: a) nominal 20 nm, b) nominal 30 nm, c) nominal 40 nm, d) nominal 40 nm electrosprayed from original solution
2.5 Mobility measurement and calibration results (METAS)
2.5.1 MEASUREMENT PROCEDURE
Aiming for reliable size measurements of nanoparticles the differential mobility analyzer (DMA) and the ‘scanning mobility particle sizer’ SMPS have to be validated. The following settings of the DMA can be calibrated: Volumetric flow measurements for sheath air (including pressure and temperature measurement), volumetric flow measurements for aerosol air, voltage measurement, geometry of DMA. Other parameters as the slip correction factor, the gas viscosity, and the free mean path length are taken from ISO 15900 [14] and assumed as conventionally correct. Furthermore the DMA is first applied in the static or stepwise mode, and secondly in the ‘scanning mobility particle sizer’ SMPS with the proprietary software of the instrument manufacturer.
In the ‘DMA mode’ the voltage in the DMA was changed stepwise until the peak value for the particle concentration behind the DMA was found. Each voltage setting was kept at least 60 s. We used the DMA models TSI 3081 and 3085 at a flow rate for sheath air 5 L/min (3
20 30 40 50 60 70 800
2
4
6
8
10
12
14
16x 10
4
Mobility diameter [nm]
dN/d
logD
[cm
-3]
Electrospray Au 20 nm TedPella, 2 mM buffer solution
20 30 40 50 60 70 800
1
2
3
4
5
6x 10
4
Mobility diameter [nm]
dN/d
logD
[cm
-3]
Electrospray Au 30 nm TedPella, 2 mM buffer solution
20 30 40 50 60 70 800
0.5
1
1.5
2
2.5
3
3.5
4
4.5x 10
4
Mobility diameter [nm]
dN/d
logD
[cm
-3]
Electrospray Au 40 nm TedPella, 2 mM buffer solution
10 50 1000
0.5
1
1.5
2
2.5
3
3.5
4
4.5
5x 10
4
Mobility diameter [nm]
dN/d
logD
[cm
-3]
Electrospray 40 nm Au TedPella, original solution (13. 03. 12)
Residuals
Au Particles
ENV02 WP1 D1.1.1.docx Page 16 of 44
L/min for 100 nm Au), no excess air, aerosol air: 0.3 L/min. For the gold nanoparticles, TSI 3085 was used, while the larger 200 nm PSL spheres could only be studied with the TSI 3081 DMA. The size evaluation is performed according to ISO 15900.
In the ‘SMPS mode’ the particle size distribution is evaluated after scanning the voltage over the whole range applicable by the SMPS software from the instrument manufacturer. The settings of the SMPS are: Flowrates as above, ‘upscan time’ 240 s, ‘downscan time’ 15 s, wait time between scans 105 s, Software AIM 8.1.0.0, activated corrections: multiple charge, diffusion losses. The viscosity and mean free path length are calculated according to ISO 15900 for 21°C and 95 kPa. The result is calculated considering only the main peak in the size distribution, this means that particle multiplets do not contribute to the resulting mean and mode diameter. Also, possible deviations between the experimental charge distribution and the charge distribution implemented in AIM 8.1.0.0 are neglected.
2.5.2 MEASUREMENT UNCERTAINTY
For the evaluation of the uncertainty associated with the measured particle size the rules from the ‘Guide to the expression of uncertainty in measurement’ (GUM) were applied. This calculation is valid only for the ‘DMA mode’. This procedure results in the mode of the particle size distribution in the current case of monodisperse size distribution. Note that for nominal 100 nm gold particles, no sample-to-sample variation could be assessed, as the available quantity of particle solution was only sufficient for one sample.
Using the DMA in the ‘SMPS mode’ the calculation of the particle diameter cannot be reconstructed by the user because the manufacturer has incorporated intransparent correction algorithms in the software. The uncertainty cannot be calculated according to the rules of GUM. Accordingly, the indicated uncertainties only account for the reproducibility of the measurement (i.e. variations within one sample and sample-to-sample variations)
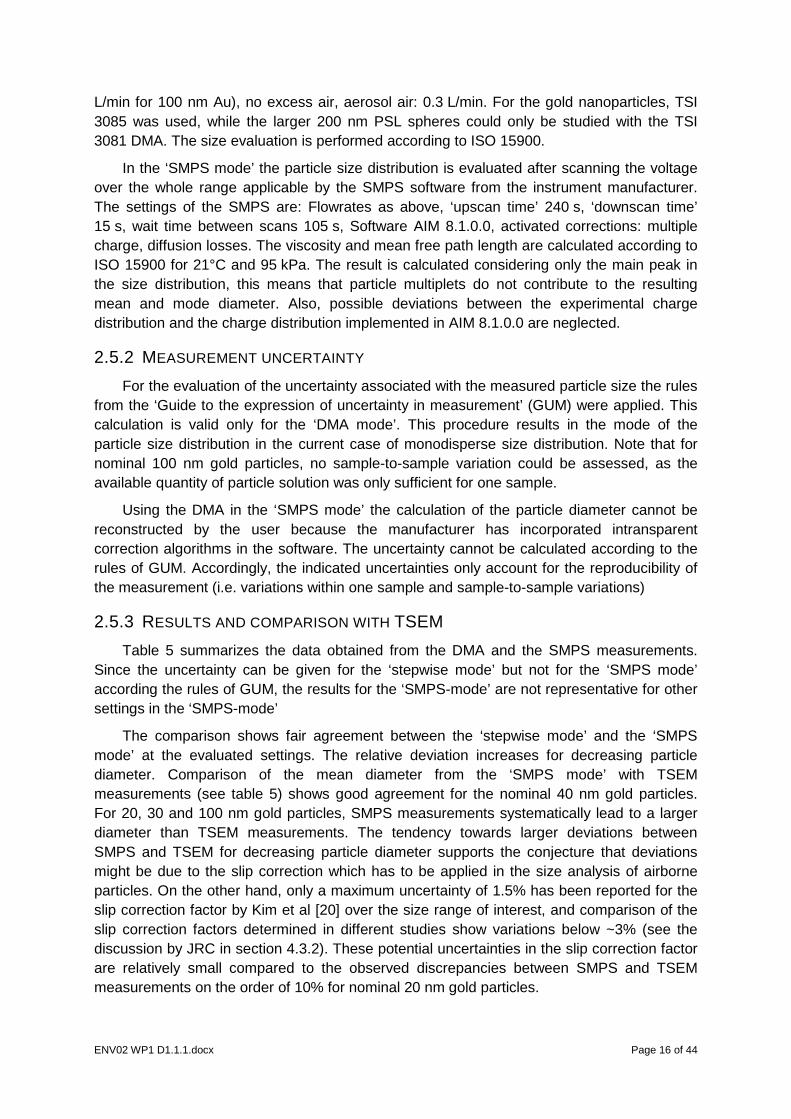
2.5.3 RESULTS AND COMPARISON WITH TSEM
Table 5 summarizes the data obtained from the DMA and the SMPS measurements. Since the uncertainty can be given for the ‘stepwise mode’ but not for the ‘SMPS mode’ according the rules of GUM, the results for the ‘SMPS-mode’ are not representative for other settings in the ‘SMPS-mode’
The comparison shows fair agreement between the ‘stepwise mode’ and the ‘SMPS mode’ at the evaluated settings. The relative deviation increases for decreasing particle diameter. Comparison of the mean diameter from the ‘SMPS mode’ with TSEM measurements (see table 5) shows good agreement for the nominal 40 nm gold particles. For 20, 30 and 100 nm gold particles, SMPS measurements systematically lead to a larger diameter than TSEM measurements. The tendency towards larger deviations between SMPS and TSEM for decreasing particle diameter supports the conjecture that deviations might be due to the slip correction which has to be applied in the size analysis of airborne particles. On the other hand, only a maximum uncertainty of 1.5% has been reported for the slip correction factor by Kim et al [20] over the size range of interest, and comparison of the slip correction factors determined in different studies show variations below ~3% (see the discussion by JRC in section 4.3.2). These potential uncertainties in the slip correction factor are relatively small compared to the observed discrepancies between SMPS and TSEM measurements on the order of 10% for nominal 20 nm gold particles.
ENV02 WP1 D1.1.1.docx Page 17 of 44
For 200 nm PSL spheres, the particle diameter measured with the SMPS is smaller than the corresponding TSEM diameter.
Table 5: Measurements of the nanoparticle samples under test in the ‘DMA-mode’ and ‘SMPS-mode’
Parameter Gold 20 nm
Gold 30 nm
Gold 40 nm
Gold 100 nm
PSL 200 nm
DMA voltage at peak concentration
469 ± 3 V 904 ± 9 V 1536 ± 25 V 4685 ± 45 V2 2564 ±10 V1
Mode particle size calculated according to ISO 15900
24.0 ± 0.4 nm 33.8 ± 0.6
nm 44.6 ± 1.0
nm 107.4 ± 1.5
nm 201 ± 3 nm
Expanded uncertainty (k=2) of the mode size from DMA
0.8 nm 1.2 nm 2.0 nm 3.0 nm 6 nm
Number concentration at peak ~ 200 cm-3 ~ 200 cm-3 ~ 100 cm-3 ~ 60 cm-3 ~ 300 cm-3
Mean particle size SMPS 23.5 ± 0.1 nm
33.0 ± 0.4 nm
44.2 ± 0.4 nm
107.3 ± 0.4 nm
197 ± 1 nm
Mode particle size SMPS 23.4 ± 0.1 nm
32.9 ± 0.4 nm
44.1 ± 0.4 nm
106.7 ± 1.2 nm
196 ± 1 nm
Number concentration (integral) ~ 9000 cm-3 ~ 4000 cm-3 ~ 6000 cm-3 ~ 2000 cm-3 ~ 5000 cm-3
1 Long DMA TSI 3081 2 Sheath flow 3 L/min
3 REFERENCE AEROSOL FROM SILVER OVEN Aerosol generators producing a test aerosol at high concentrations with small GSD of
the size distribution and good long-term stability of the generation process are needed for the calibration of aerosol measuring instruments. Methods for the generation of aerosol particles smaller than 10 µm in diameter are e.g. nebulization of mono-disperse primary particles from solutions, condensational growth of seed particles (e.g. Sinclair-LaMer generators) or controlled burning of various fuels in specialized burners (e.g CAST generators). All above types of generators are not well suited for the generation of particles smaller than 100 nm in diameter.
Scheibel and Porstendörfer [15] have described a condensation particle generator for Ag- and NaCl aerosols capable of producing calibration particles with the required characteristics in the size range from 2 nm to 300 nm. In their setup the primary material is evaporated in a temperature controlled tube furnace into a flow of nitrogen. The particle formation starts at furnace temperatures above 600 °C for NaCL and above 920 °C for Ag. The evaporated material starts to condense as soon as the temperature drops. Particle size of the generated particles depends on material, position of the material in the oven, temperature of the oven and the flow rate of the carrier gas. In addition to these parameters the surface structure of the material for evaporation influences the size distribution of the generator. Silver melts at 960.8 °C under atmospheric pressure conditions. Below the melting temperature originally round silver granules provide a larger surface for the evaporation of silver. If the furnace is heated above this melting temperature the silver the surface for evaporation is reduced. Because the melting temperature is typically exceeded
ENV02 WP1 D1.1.1.docx
during a calibration routine necessary temperatures for the generation of test aerosols may change from calibration to calibration. It is therefore necessary to measure the oven size distribution prior and during each calibration sess
The silver generator at IfT is based on this original design but has been improved with respect to control of the particle size and the long term stability of the generator.
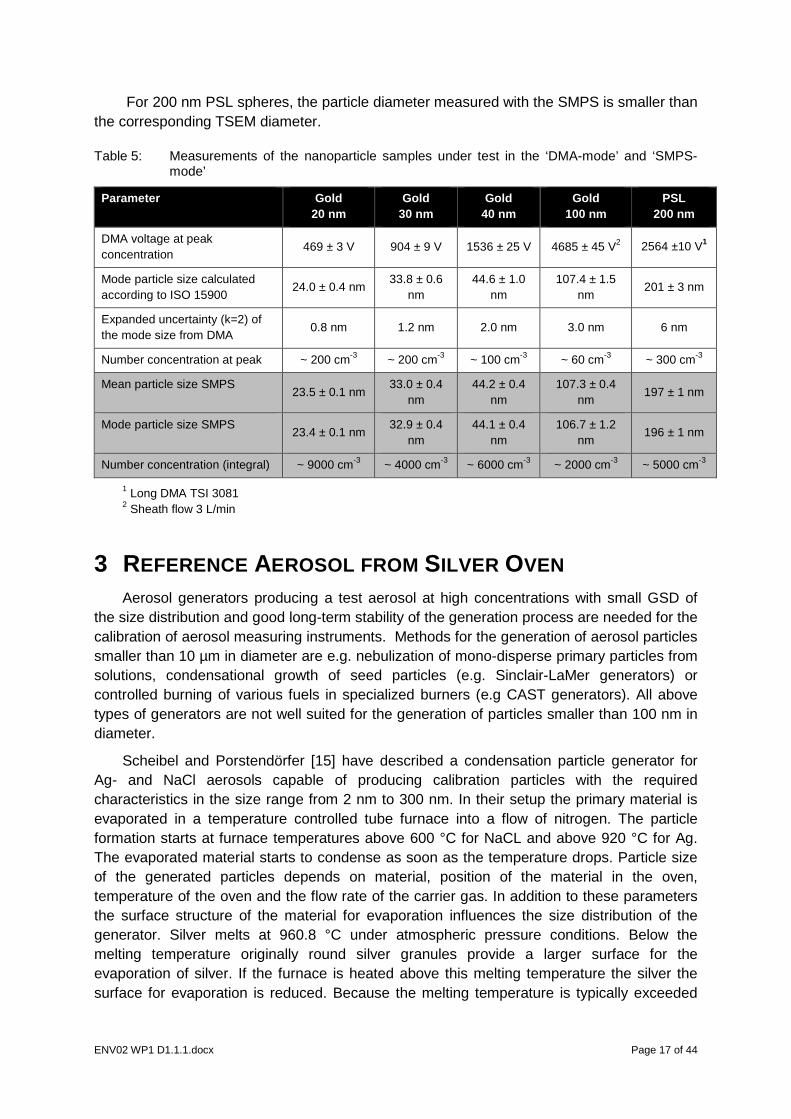
3.1 Generation of primary Ag aThe IfT silver aerosol generator (fig
cooling of the newly formed particles. In addition the quench flow dilutes the aerosol from the oven to minimize coagulation of primary particles after generation. Both oven flow and quench flow are controlled by mass flow controllers (MKS model 1179AX14CS1BV, MKS Instruments Deutschland GmbH, Munich, Germany) to ensure better stability of the size distribution of the silver particles and better repeatability of calibration settings.
Figure 13: Schematic view of the IfT Ag aerosol generator.
We use a tube furnace with 3 temperature controlled heating zones (Linn model FRH70/750/1250, Linn High Therm GmbH, Eschenfelden, Germany). The sample material for evaporation is located a boat in the center ofDirectly after the tube oven flow and quench flow are mixed. A dilution system consisting of a filter and a manual bypass valve allows for adjustment of the concentration.
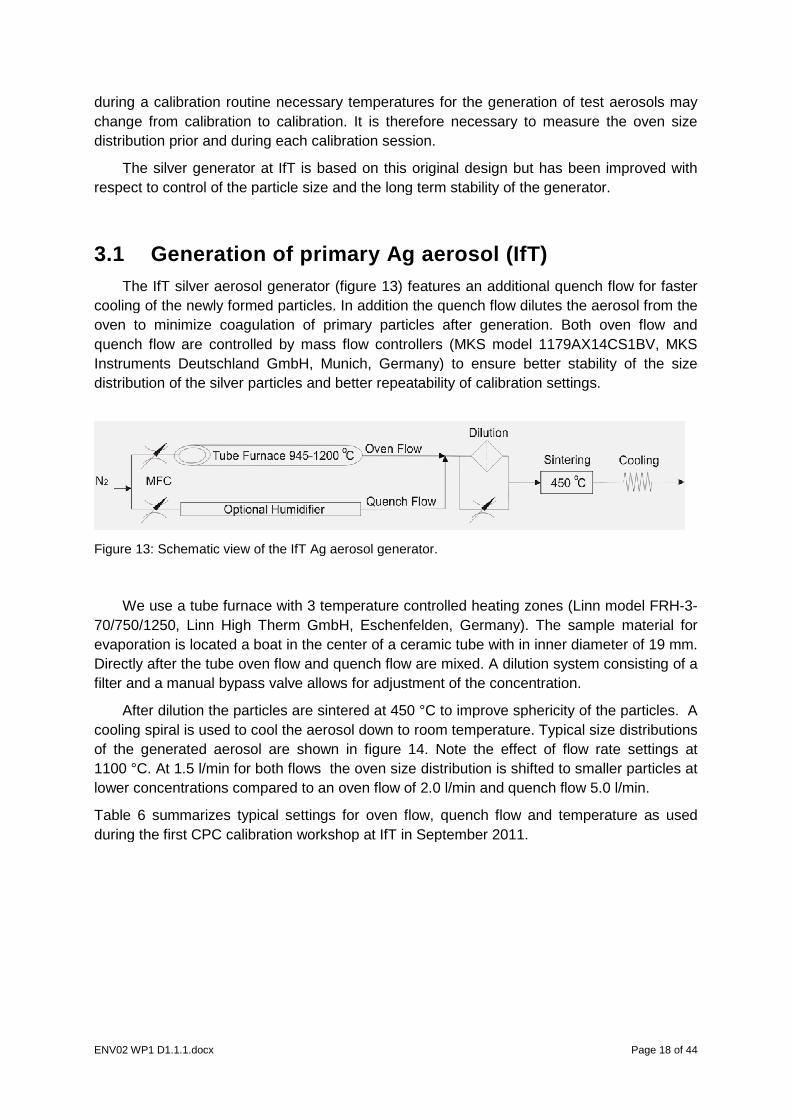
After dilution the particles are scooling spiral is used to cool the aerosol down to room temperature. Typical size distributions of the generated aerosol are shown in figure 141100 °C. At 1.5 l/min for both flows the oven size distribution is shifted to smaller particles at lower concentrations compared to an oven flow of 2.0 l/min and quench flow 5.0 l/min.
Table 6 summarizes typical settings for oven flow, quench flow and temperature during the first CPC calibration workshop at IfT in September 2011.
during a calibration routine necessary temperatures for the generation of test aerosols may change from calibration to calibration. It is therefore necessary to measure the oven size distribution prior and during each calibration session.
The silver generator at IfT is based on this original design but has been improved with respect to control of the particle size and the long term stability of the generator.
Generation of primary Ag a erosol (IfT) The IfT silver aerosol generator (figure 13) features an additional quench flow for faster
cooling of the newly formed particles. In addition the quench flow dilutes the aerosol from the oven to minimize coagulation of primary particles after generation. Both oven flow and
trolled by mass flow controllers (MKS model 1179AX14CS1BV, MKS Instruments Deutschland GmbH, Munich, Germany) to ensure better stability of the size distribution of the silver particles and better repeatability of calibration settings.
tic view of the IfT Ag aerosol generator.
We use a tube furnace with 3 temperature controlled heating zones (Linn model FRH70/750/1250, Linn High Therm GmbH, Eschenfelden, Germany). The sample material for evaporation is located a boat in the center of a ceramic tube with in inner diameter of 19 mm. Directly after the tube oven flow and quench flow are mixed. A dilution system consisting of a filter and a manual bypass valve allows for adjustment of the concentration.
rticles are sintered at 450 °C to improve sphericity of the particles. cooling spiral is used to cool the aerosol down to room temperature. Typical size distributions
ed aerosol are shown in figure 14. Note the effect of flow rate settings at At 1.5 l/min for both flows the oven size distribution is shifted to smaller particles at
lower concentrations compared to an oven flow of 2.0 l/min and quench flow 5.0 l/min.
summarizes typical settings for oven flow, quench flow and temperature during the first CPC calibration workshop at IfT in September 2011.
Page 18 of 44
during a calibration routine necessary temperatures for the generation of test aerosols may change from calibration to calibration. It is therefore necessary to measure the oven size
The silver generator at IfT is based on this original design but has been improved with respect to control of the particle size and the long term stability of the generator.
) features an additional quench flow for faster cooling of the newly formed particles. In addition the quench flow dilutes the aerosol from the oven to minimize coagulation of primary particles after generation. Both oven flow and
trolled by mass flow controllers (MKS model 1179AX14CS1BV, MKS Instruments Deutschland GmbH, Munich, Germany) to ensure better stability of the size distribution of the silver particles and better repeatability of calibration settings.
We use a tube furnace with 3 temperature controlled heating zones (Linn model FRH-3-70/750/1250, Linn High Therm GmbH, Eschenfelden, Germany). The sample material for
a ceramic tube with in inner diameter of 19 mm. Directly after the tube oven flow and quench flow are mixed. A dilution system consisting of a filter and a manual bypass valve allows for adjustment of the concentration.
C to improve sphericity of the particles. A cooling spiral is used to cool the aerosol down to room temperature. Typical size distributions
. Note the effect of flow rate settings at At 1.5 l/min for both flows the oven size distribution is shifted to smaller particles at
lower concentrations compared to an oven flow of 2.0 l/min and quench flow 5.0 l/min.
summarizes typical settings for oven flow, quench flow and temperature as used
ENV02 WP1 D1.1.1.docx Page 19 of 44
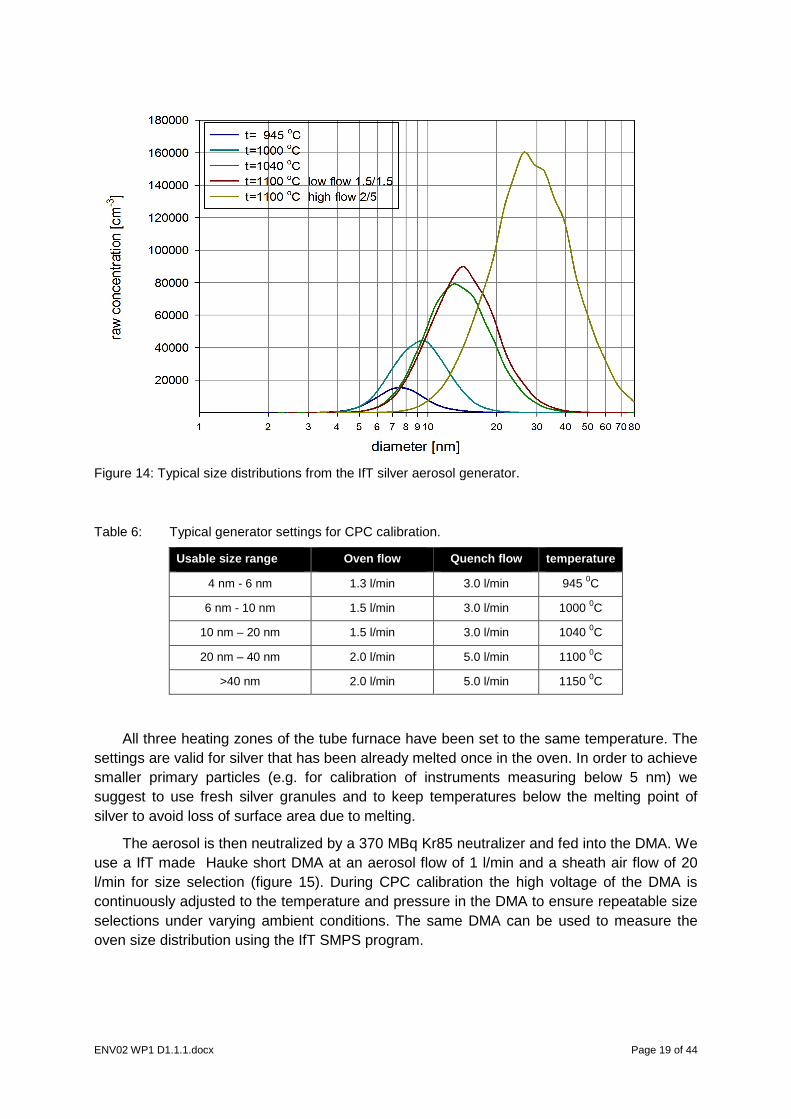
Figure 14: Typical size distributions from the IfT silver aerosol generator.
Table 6: Typical generator settings for CPC calibration.
Usable size range Oven flow Quench flow temperature
4 nm - 6 nm 1.3 l/min 3.0 l/min 945 0C
6 nm - 10 nm 1.5 l/min 3.0 l/min 1000 0C
10 nm – 20 nm 1.5 l/min 3.0 l/min 1040 0C
20 nm – 40 nm 2.0 l/min 5.0 l/min 1100 0C
>40 nm 2.0 l/min 5.0 l/min 1150 0C
All three heating zones of the tube furnace have been set to the same temperature. The settings are valid for silver that has been already melted once in the oven. In order to achieve smaller primary particles (e.g. for calibration of instruments measuring below 5 nm) we suggest to use fresh silver granules and to keep temperatures below the melting point of silver to avoid loss of surface area due to melting.
The aerosol is then neutralized by a 370 MBq Kr85 neutralizer and fed into the DMA. We use a IfT made Hauke short DMA at an aerosol flow of 1 l/min and a sheath air flow of 20 l/min for size selection (figure 15). During CPC calibration the high voltage of the DMA is continuously adjusted to the temperature and pressure in the DMA to ensure repeatable size selections under varying ambient conditions. The same DMA can be used to measure the oven size distribution using the IfT SMPS program.
ENV02 WP1 D1.1.1.docx
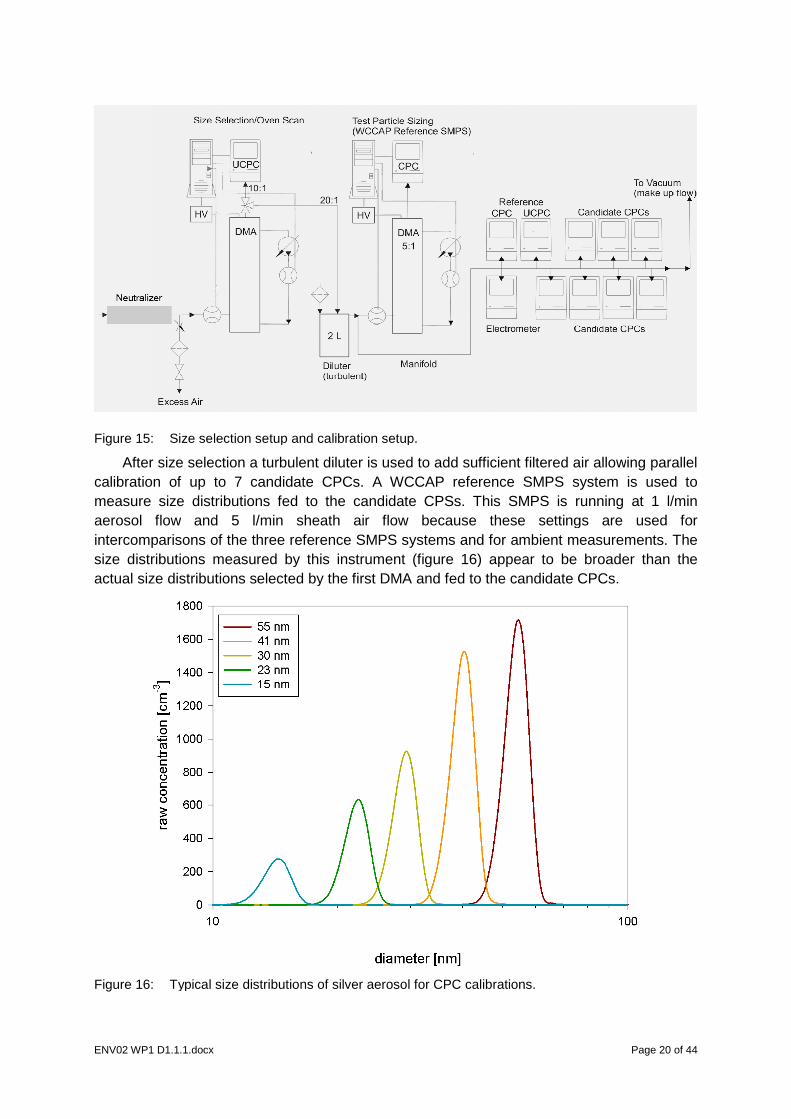
Figure 15: Size selection setup and calibration setup.
After size selection a turbulent diluter is used to add sufficient filtered air allowcalibration of up to 7 candidmeasure size distributions fed to the candidate CPSs. This SMPS is running at 1 l/min aerosol flow and 5 l/min sheath air flow because these settings are used for intercomparisons of the three reference SMPS systems and for ambient measurements. The size distributions measured by this instrument (figure actual size distributions selected by the first DMA and fed to the candidate CPCs.
Figure 16: Typical size distributions of silver aerosol for CPC calibrations.
Size selection setup and calibration setup.
After size selection a turbulent diluter is used to add sufficient filtered air allowcalibration of up to 7 candidate CPCs. A WCCAP reference SMPS system is used to measure size distributions fed to the candidate CPSs. This SMPS is running at 1 l/min aerosol flow and 5 l/min sheath air flow because these settings are used for
ercomparisons of the three reference SMPS systems and for ambient measurements. The size distributions measured by this instrument (figure 16) appear to be broader than the actual size distributions selected by the first DMA and fed to the candidate CPCs.
Typical size distributions of silver aerosol for CPC calibrations.
Page 20 of 44
After size selection a turbulent diluter is used to add sufficient filtered air allowing parallel A WCCAP reference SMPS system is used to
measure size distributions fed to the candidate CPSs. This SMPS is running at 1 l/min aerosol flow and 5 l/min sheath air flow because these settings are used for
ercomparisons of the three reference SMPS systems and for ambient measurements. The ) appear to be broader than the
actual size distributions selected by the first DMA and fed to the candidate CPCs.
ENV02 WP1 D1.1.1.docx Page 21 of 44
We use three reference instruments in a typical calibration setup. For traceable concentration measurements a TSI 3068B is used. This instrument has been calibrated by PTB using its fA source. Because electrometers tend to be noisy at low concentrations two CPCs (3772 and 3025A) are added to the setup. At the beginning and the end of each calibration run concentrations of 40 nm particles measured by the CPCs are compared to those measured by the electrometer and CPC concentrations are adjusted to electrometer concentrations.
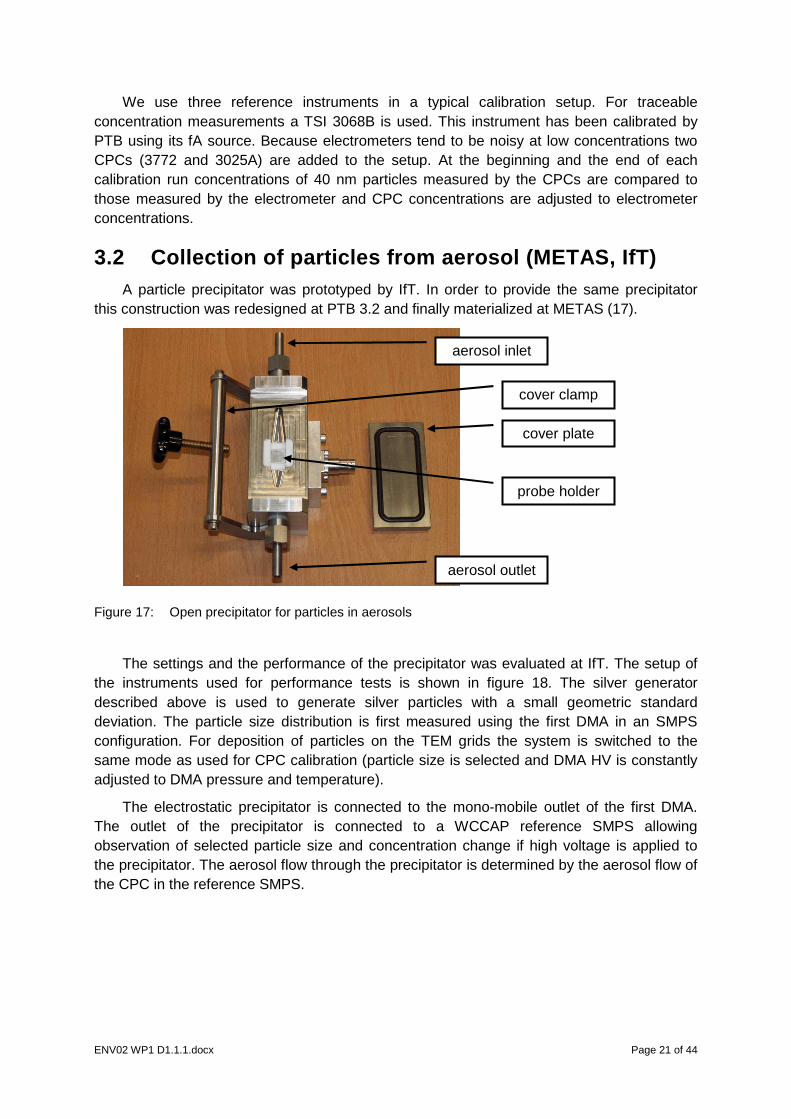
3.2 Collection of particles from aerosol (METAS, If T) A particle precipitator was prototyped by IfT. In order to provide the same precipitator
this construction was redesigned at PTB 3.2 and finally materialized at METAS (17).
Figure 17: Open precipitator for particles in aerosols
The settings and the performance of the precipitator was evaluated at IfT. The setup of the instruments used for performance tests is shown in figure 18. The silver generator described above is used to generate silver particles with a small geometric standard deviation. The particle size distribution is first measured using the first DMA in an SMPS configuration. For deposition of particles on the TEM grids the system is switched to the same mode as used for CPC calibration (particle size is selected and DMA HV is constantly adjusted to DMA pressure and temperature).
The electrostatic precipitator is connected to the mono-mobile outlet of the first DMA. The outlet of the precipitator is connected to a WCCAP reference SMPS allowing observation of selected particle size and concentration change if high voltage is applied to the precipitator. The aerosol flow through the precipitator is determined by the aerosol flow of the CPC in the reference SMPS.
aerosol inlet
aerosol outlet
cover plate
probe holder
cover clamp
ENV02 WP1 D1.1.1.docx
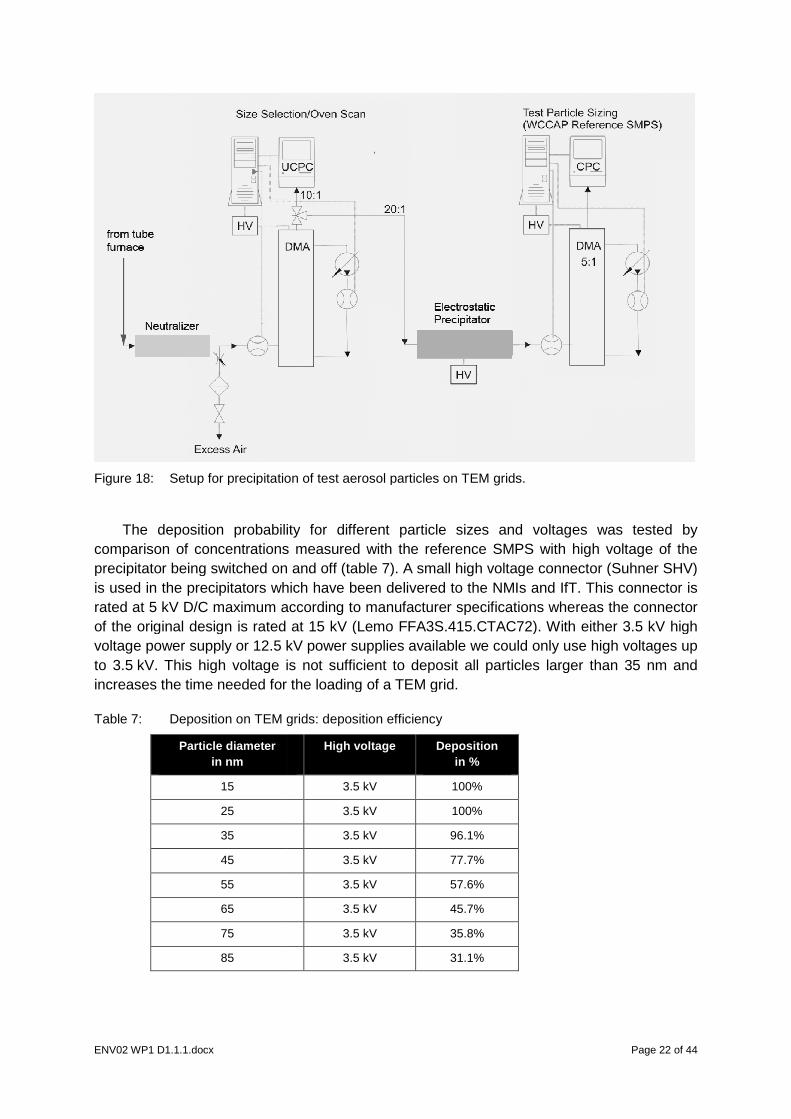
Figure 18: Setup for precipitation of test aerosol partic
The deposition probability for different particle sizes and voltages was tested by comparison of concentrations measured with the reference SMPS with high voltage of the precipitator being switched on and offis used in the precipitators which have been delivered to the NMIs and IfT. This connector is rated at 5 kV D/C maximum according to manufacturer specifications whereas the connector of the original design is rated at 15 kV (Lemovoltage power supply or 12.5 kV power supplies available we could only use high voltages up to 3.5 kV. This high voltage is not sufficient to deposit all particles larger than 35 nm and increases the time needed for the loading of a TEM grid.
Table 7: Deposition on TEM grids:
Particle diameter in nm
15
25
35
45
55
65
75
85
Setup for precipitation of test aerosol particles on TEM grids.
The deposition probability for different particle sizes and voltages was tested by comparison of concentrations measured with the reference SMPS with high voltage of the precipitator being switched on and off (table 7). A small high voltage connector (Suhner SHV) is used in the precipitators which have been delivered to the NMIs and IfT. This connector is rated at 5 kV D/C maximum according to manufacturer specifications whereas the connector of the original design is rated at 15 kV (Lemo FFA3S.415.CTAC72). With either 3.5 kV high voltage power supply or 12.5 kV power supplies available we could only use high voltages up
kV. This high voltage is not sufficient to deposit all particles larger than 35 nm and for the loading of a TEM grid.
on TEM grids: deposition efficiency
High voltage Deposition in %
3.5 kV 100%
3.5 kV 100%
3.5 kV 96.1%
3.5 kV 77.7%
3.5 kV 57.6%
3.5 kV 45.7%
3.5 kV 35.8%
3.5 kV 31.1%
Page 22 of 44
The deposition probability for different particle sizes and voltages was tested by comparison of concentrations measured with the reference SMPS with high voltage of the
age connector (Suhner SHV) is used in the precipitators which have been delivered to the NMIs and IfT. This connector is rated at 5 kV D/C maximum according to manufacturer specifications whereas the connector
FFA3S.415.CTAC72). With either 3.5 kV high voltage power supply or 12.5 kV power supplies available we could only use high voltages up
kV. This high voltage is not sufficient to deposit all particles larger than 35 nm and
ENV02 WP1 D1.1.1.docx Page 23 of 44
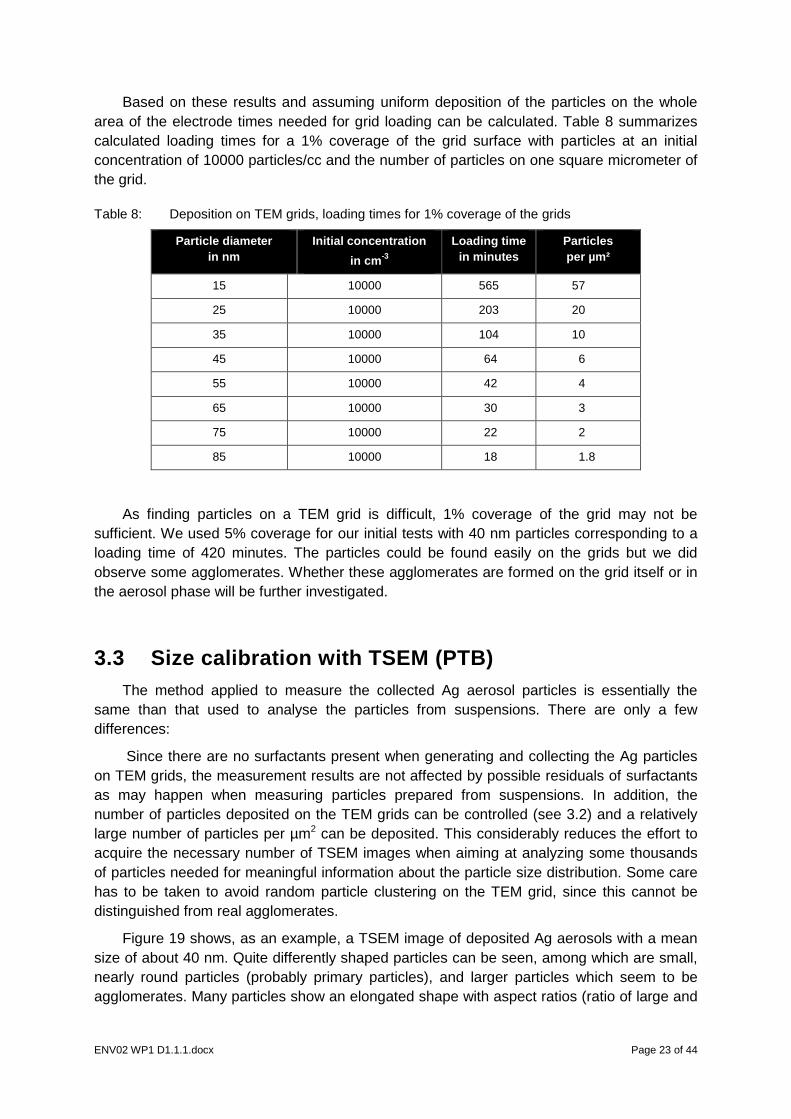
Based on these results and assuming uniform deposition of the particles on the whole area of the electrode times needed for grid loading can be calculated. Table 8 summarizes calculated loading times for a 1% coverage of the grid surface with particles at an initial concentration of 10000 particles/cc and the number of particles on one square micrometer of the grid.
Table 8: Deposition on TEM grids, loading times for 1% coverage of the grids
Particle diameter in nm
Initial concentration
in cm -3
Loading time in minutes
Particles per µm²
15 10000 565 57
25 10000 203 20
35 10000 104 10
45 10000 64 6
55 10000 42 4
65 10000 30 3
75 10000 22 2
85 10000 18 1.8
As finding particles on a TEM grid is difficult, 1% coverage of the grid may not be sufficient. We used 5% coverage for our initial tests with 40 nm particles corresponding to a loading time of 420 minutes. The particles could be found easily on the grids but we did observe some agglomerates. Whether these agglomerates are formed on the grid itself or in the aerosol phase will be further investigated.
3.3 Size calibration with TSEM (PTB) The method applied to measure the collected Ag aerosol particles is essentially the
same than that used to analyse the particles from suspensions. There are only a few differences:
Since there are no surfactants present when generating and collecting the Ag particles on TEM grids, the measurement results are not affected by possible residuals of surfactants as may happen when measuring particles prepared from suspensions. In addition, the number of particles deposited on the TEM grids can be controlled (see 3.2) and a relatively large number of particles per µm2 can be deposited. This considerably reduces the effort to acquire the necessary number of TSEM images when aiming at analyzing some thousands of particles needed for meaningful information about the particle size distribution. Some care has to be taken to avoid random particle clustering on the TEM grid, since this cannot be distinguished from real agglomerates.
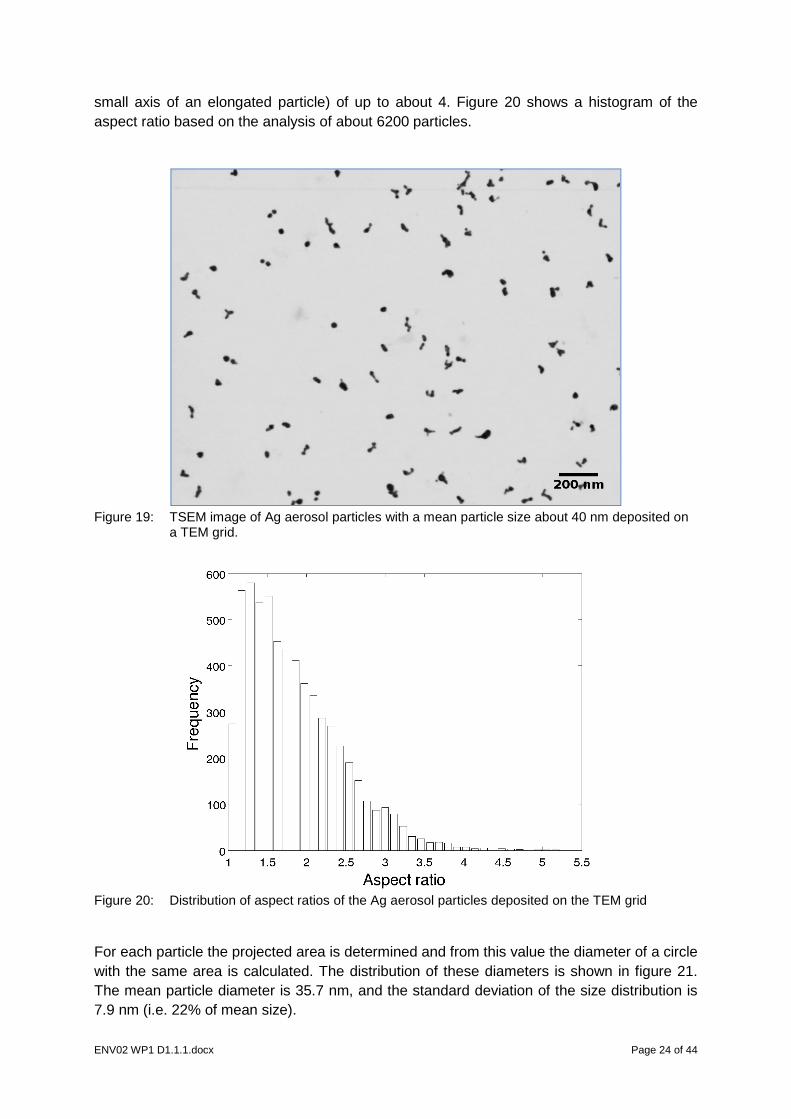
Figure 19 shows, as an example, a TSEM image of deposited Ag aerosols with a mean size of about 40 nm. Quite differently shaped particles can be seen, among which are small, nearly round particles (probably primary particles), and larger particles which seem to be agglomerates. Many particles show an elongated shape with aspect ratios (ratio of large and
ENV02 WP1 D1.1.1.docx Page 24 of 44
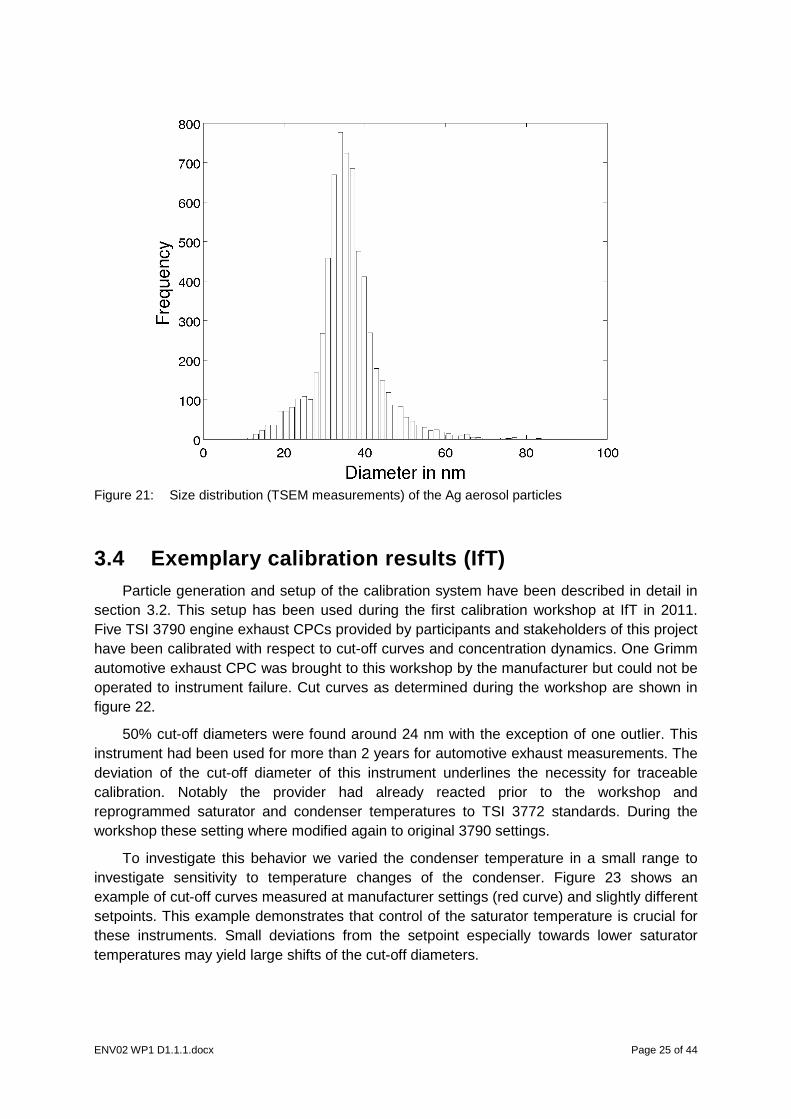
small axis of an elongated particle) of up to about 4. Figure 20 shows a histogram of the aspect ratio based on the analysis of about 6200 particles.
Figure 19: TSEM image of Ag aerosol particles with a mean particle size about 40 nm deposited on
a TEM grid.
Figure 20: Distribution of aspect ratios of the Ag aerosol particles deposited on the TEM grid
For each particle the projected area is determined and from this value the diameter of a circle with the same area is calculated. The distribution of these diameters is shown in figure 21. The mean particle diameter is 35.7 nm, and the standard deviation of the size distribution is 7.9 nm (i.e. 22% of mean size).
ENV02 WP1 D1.1.1.docx Page 25 of 44
Figure 21: Size distribution (TSEM measurements) of the Ag aerosol particles
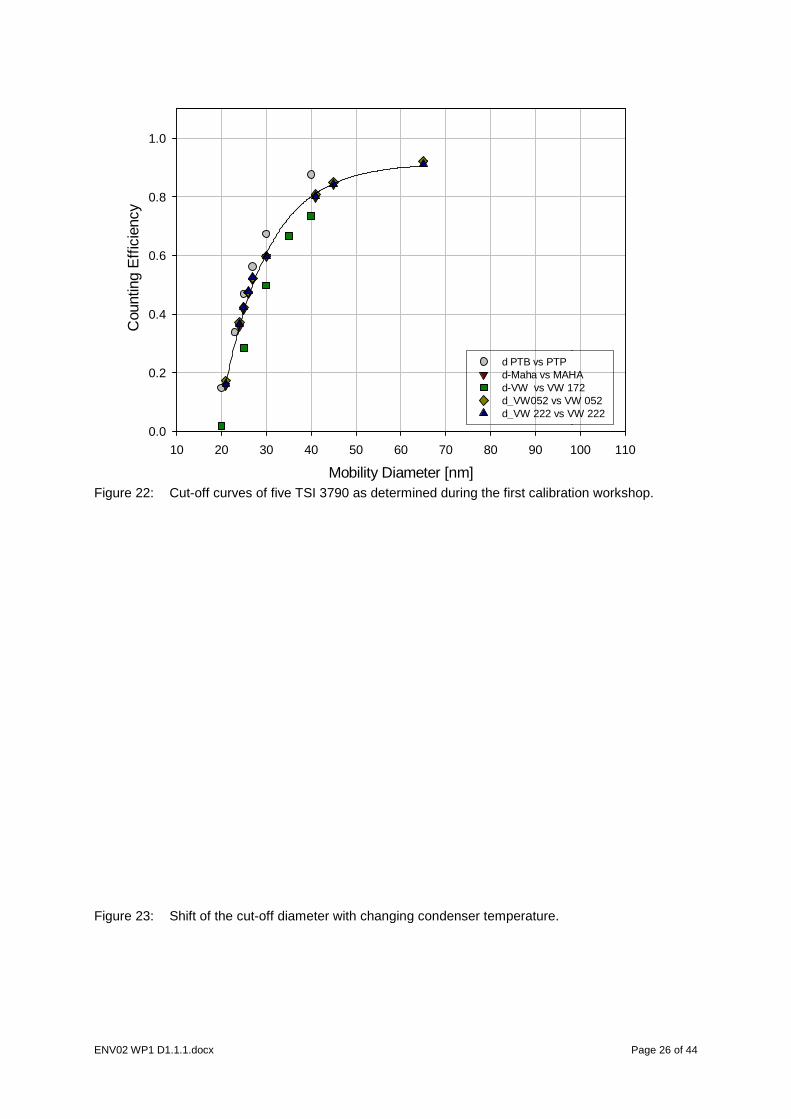
3.4 Exemplary calibration results (IfT) Particle generation and setup of the calibration system have been described in detail in
section 3.2. This setup has been used during the first calibration workshop at IfT in 2011. Five TSI 3790 engine exhaust CPCs provided by participants and stakeholders of this project have been calibrated with respect to cut-off curves and concentration dynamics. One Grimm automotive exhaust CPC was brought to this workshop by the manufacturer but could not be operated to instrument failure. Cut curves as determined during the workshop are shown in figure 22.
50% cut-off diameters were found around 24 nm with the exception of one outlier. This instrument had been used for more than 2 years for automotive exhaust measurements. The deviation of the cut-off diameter of this instrument underlines the necessity for traceable calibration. Notably the provider had already reacted prior to the workshop and reprogrammed saturator and condenser temperatures to TSI 3772 standards. During the workshop these setting where modified again to original 3790 settings.
To investigate this behavior we varied the condenser temperature in a small range to investigate sensitivity to temperature changes of the condenser. Figure 23 shows an example of cut-off curves measured at manufacturer settings (red curve) and slightly different setpoints. This example demonstrates that control of the saturator temperature is crucial for these instruments. Small deviations from the setpoint especially towards lower saturator temperatures may yield large shifts of the cut-off diameters.
ENV02 WP1 D1.1.1.docx
10 20 30
Cou
ntin
g E
ffic
ienc
y
0.0
0.2
0.4
0.6
0.8
1.0
Figure 22: Cut-off curves of five TSI 3790 as determined during the first calibration workshop.
Figure 23: Shift of the cut-off diameter with changing condenser temperature.
Mobility Diameter [nm]
40 50 60 70 80 90 100
d PTB vs PTP d-Maha vs MAHA d-VW vs VW 172 d_VW052 vs VW 052 d_VW 222 vs VW 222
off curves of five TSI 3790 as determined during the first calibration workshop.
off diameter with changing condenser temperature.
Page 26 of 44
100 110
d-Maha vs MAHA d-VW vs VW 172 d_VW052 vs VW 052 d_VW 222 vs VW 222
off curves of five TSI 3790 as determined during the first calibration workshop.
ENV02 WP1 D1.1.1.docx Page 27 of 44
4 CALIBRATION SERVICES
4.1 DFM (particle size, AFM) DFM is accredited for the measurement of the average diameter of spherical Polystyrene
Latex (PSL) particles with an Atomic Force Microscope. The CMC encompasses particle sizes ranging from 100 nm to 5 µm, with expanded uncertainties ranging from 5 nm to 50 nm. Analogous to the procedure described in 2.3, the sampling and preparation procedure for PSL particles includes the adsorption of the suspended particles to a cleaved mica substrate. The mica substrate serves as an atomically flat reference surface for the subsequent height measurement with the AFM.
Using this calibration technique, DFM is participating in several comparisons, such as organized by the VAMAS TW 34. In project 3, “Techniques for Characterizing Morphology of Airborne Nanoparticles”, silica nanoparticles serve as reference standards for test aerosols. In another ogoing comparison “Supplementary Comparison on Nanoparticle Size” organized by the RMO APMP, nanoparticles of different materials are used as references, namely PSL, gold and silver.
4.2 PTB (particle size, TSEM) PTB offers TSEM measurements of spherical nanoparticles as described in detail in
Section 2.2. Here, we briefly describe requirements and assumptions that must be met when quantitative and traceable size results are aimed at.
The nanoparticles need to be present on thin (about 12 nm thick) carbon films fixed on usual TEM grids. Samples originally existing as suspensions need to be prepared on these carbon films using appropriate techniques. If necessary, PTB may carry out this preparation.
The result of an individual measurement is the area of one particle. From this area a diameter is derived by calculating the diameter of a circle with the same area as the particle under test. A number of particles (typically some hundred to some thousand particles) may be measured to obtain the particle size distribution and to calculate statistical parameters derived from it, like mean or mode size values or higher order moments. The measurement effort grows linearly with the number of particles measured.
The assessable particle size ranges from a minimum of 5 nm (gold particles only) to about 200 nm. Larger sizes may be possible on request, but may require additional calibration and simulation efforts. Particles consisting of gold, silver, silica and polystyrene (latex) have been successfully measured so far. Other materials may be possible on request, but will need additional TSEM simulations. Inhomogeneous particles like core-shell particles cannot be measured yet.
The expanded uncertainty of the mean particle size depends, amongst others, on the particle material, the particle size distribution, the quality of the sample preparation and the number of particles analysed. Typical values of the expanded uncertainty are in the range of 2 nm to 7 nm for particles with sizes from about 10 to 200 nm.
ENV02 WP1 D1.1.1.docx Page 28 of 44
4.3 JRC-IET (aerosol particle size, DMA) The Institute for Energy and Transport (IET) of the Joint Research Center (JRC) of the
European Commission has been actively involved over the last four years in the assessment of the calibration requirements specified in the European regulation following the introduction of the particle number standard. In that respect, IET has already organized a CPC calibration workshop with the active participation of all major CPC and aerosol generator manufacturers [15]. IET is also currently leading an inter-laboratory correlation exercise aiming at the assessment of the comparability of the VPR calibration methodologies employed by the major VPR manufacturers in Europe. The research work however, is mainly focusing on the relative performance of different calibration materials and approaches employed by different instrumentation manufacturers, and not the establishment of absolute standards. IET does not provide this type of service (traceable calibration of instrumentation).
The particle size classification necessary in all this calibration work was achieved through the use of one or two (in tandem) Differential Mobility Analyzers (DMAs). The accuracy of size classification in the two DMAs is regularly checked against nebulized PolyStyrene Latex (PSL) spheres having a certified mobility diameter of 500 nm. The checks are performed at a convenient flow setting (measured with a bubble flowmeter) and mainly serve to verify that the peak of the classified particles lies within the reported uncertainty in the certified mobility size of the PSL particles (typically 493-503 nm).
In the frame of the ENV02 project, dedicated experiments were conducted using PSL particles (Thermoscientific) of 4 different sizes (Table 9). Some additional investigations (only with 200 nm PSL) were conducted to check the equivalency of the results at different operating sheath flows. Furthermore, the distinct peaks corresponding to PSL doublets were analyzed to investigate whether they become aligned inside the DMA.
Table 9: PSL particles employed at JRC.
Nominal diameter in nm
Uncertainty by manufacturer in nm
Uncertainty by manufacturer in %
Part number by Thermoscientific
102 ±3 2.9 % 3100A
203 ±5 2.5 % 3200A
350 ±6 1.7 % 3350A
498 ±5 1 % 3500A
4.3.1 EXPERIMENTAL SETUP
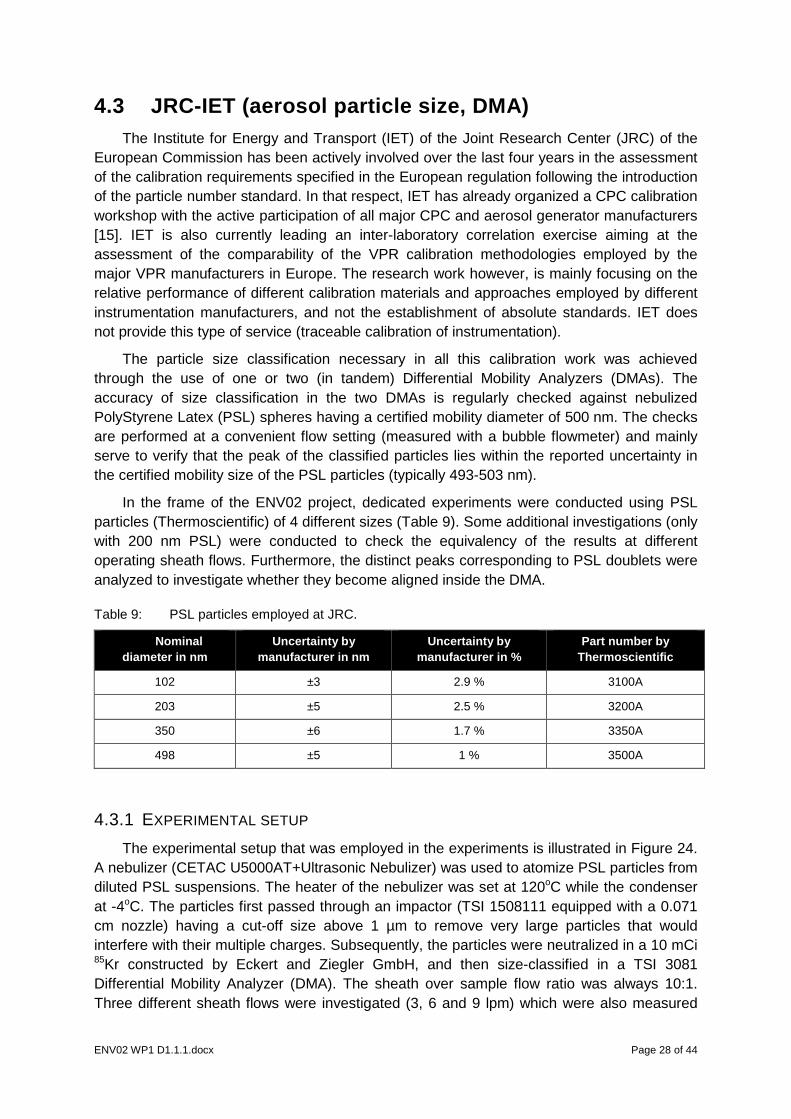
The experimental setup that was employed in the experiments is illustrated in Figure 24. A nebulizer (CETAC U5000AT+Ultrasonic Nebulizer) was used to atomize PSL particles from diluted PSL suspensions. The heater of the nebulizer was set at 120oC while the condenser at -4oC. The particles first passed through an impactor (TSI 1508111 equipped with a 0.071 cm nozzle) having a cut-off size above 1 µm to remove very large particles that would interfere with their multiple charges. Subsequently, the particles were neutralized in a 10 mCi 85Kr constructed by Eckert and Ziegler GmbH, and then size-classified in a TSI 3081 Differential Mobility Analyzer (DMA). The sheath over sample flow ratio was always 10:1. Three different sheath flows were investigated (3, 6 and 9 lpm) which were also measured
ENV02 WP1 D1.1.1.docx Page 29 of 44
with a bubble flowmeter (Gillian Gilibrator-2). The concentration of the size classified particles was measured with a TSI 3025A Condensation Particle Counter (CPC) operating at high flowrate (1.5 lpm). The necessary make-up air was supplied by a Mass Flow Controller (MFC). The two flows were mixed in a second neutralizer (1 mCi85Kr, TSI 3077). The suspensions that were used for the experiments were made with 10 drops into 100 ml of purified deionized water (Milli-Q).
Figure 24: Experimental setup used in the experiments conducted at JRC.
The nebulizer was allowed for at least 15 min to stabilize. During this period, the DMA operated in scanning mode (Scanning Mobility Particle Sizer - SMPS) to measure the size distribution and identify the peaks corresponding to singlets and doublets.
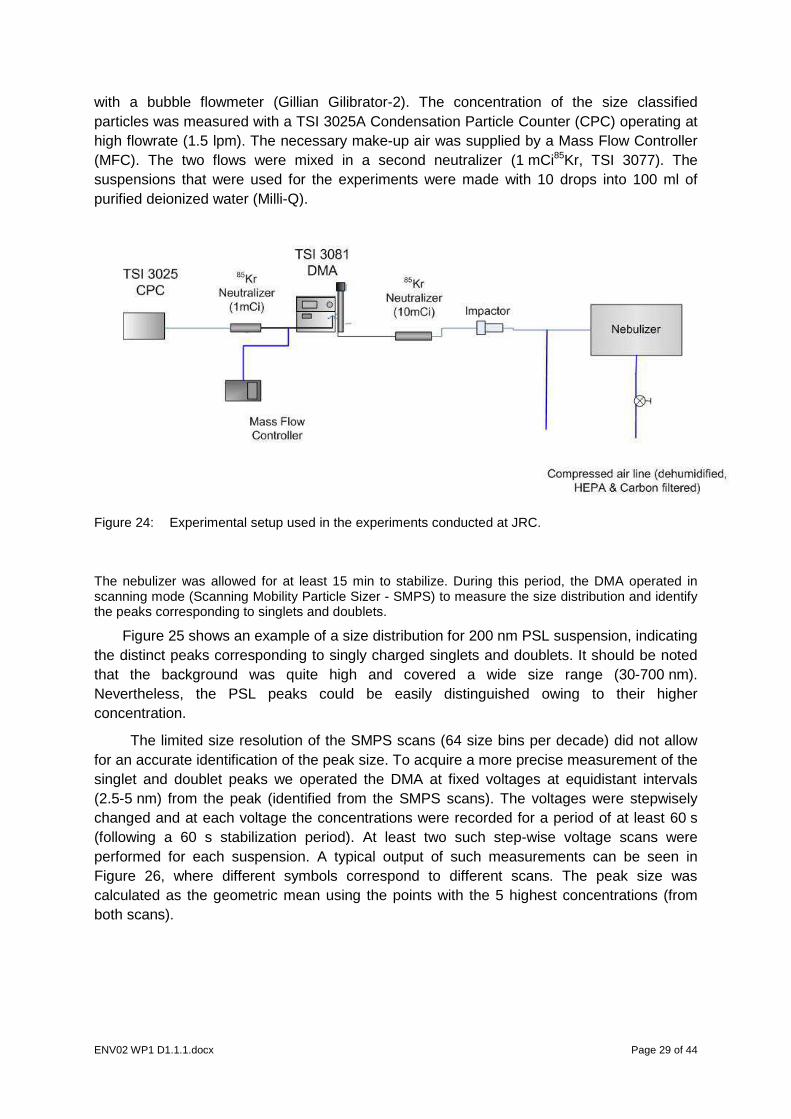
Figure 25 shows an example of a size distribution for 200 nm PSL suspension, indicating the distinct peaks corresponding to singly charged singlets and doublets. It should be noted that the background was quite high and covered a wide size range (30-700 nm). Nevertheless, the PSL peaks could be easily distinguished owing to their higher concentration.
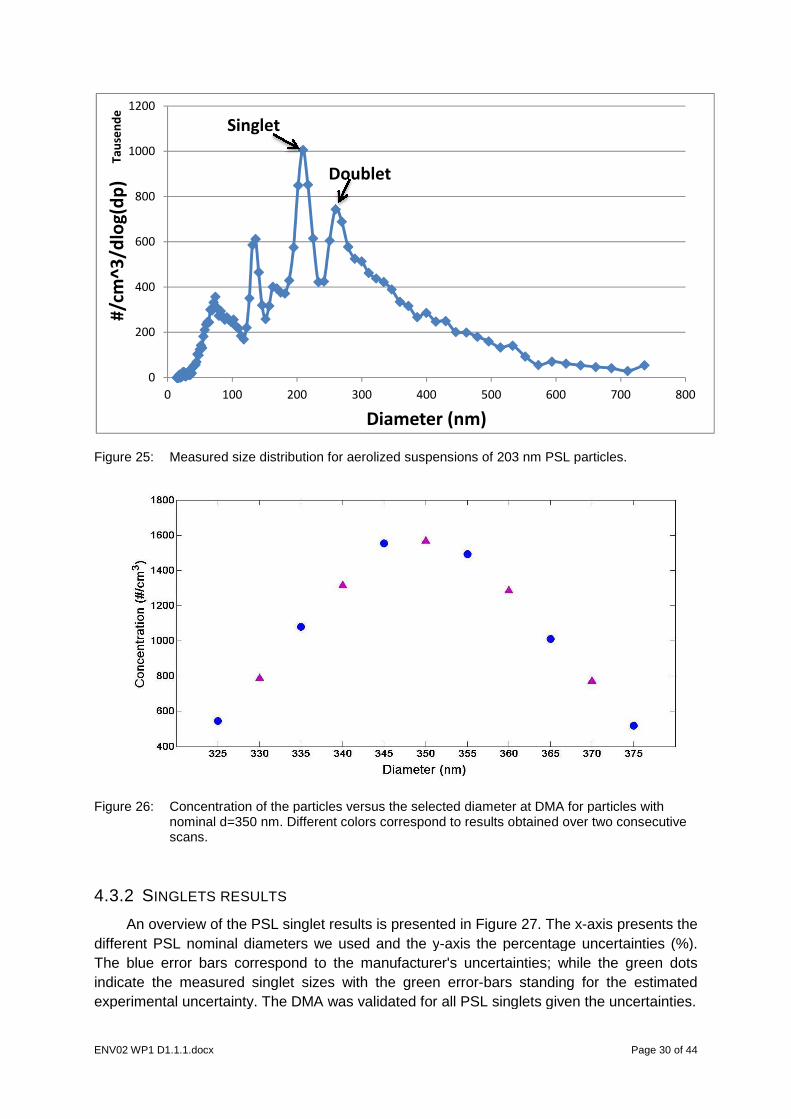
The limited size resolution of the SMPS scans (64 size bins per decade) did not allow for an accurate identification of the peak size. To acquire a more precise measurement of the singlet and doublet peaks we operated the DMA at fixed voltages at equidistant intervals (2.5-5 nm) from the peak (identified from the SMPS scans). The voltages were stepwisely changed and at each voltage the concentrations were recorded for a period of at least 60 s (following a 60 s stabilization period). At least two such step-wise voltage scans were performed for each suspension. A typical output of such measurements can be seen in Figure 26, where different symbols correspond to different scans. The peak size was calculated as the geometric mean using the points with the 5 highest concentrations (from both scans).
ENV02 WP1 D1.1.1.docx
Figure 25: Measured size distribution
Figure 26: Concentration of the particles versus the selected diameter at DMA for particles with nominal d=350 nm. Different scans.
4.3.2 SINGLETS RESULTS
An overview of the PSL singlet results is presented in different PSL nominal diameters we used and the yThe blue error bars correspond to the manufacturer's uncertainties; while the green dots indicate the measured singlet sizes with the green errorexperimental uncertainty. The DMA was validated for all PSL singlets given the uncertainties.
0
200
400
600
800
1000
1200
0 100
#/c
m^
3/d
log
(dp
)T
au
sen
de
Singlet
Measured size distribution for aerolized suspensions of 203 nm PSL particles.
oncentration of the particles versus the selected diameter at DMA for particles with . Different colors correspond to results obtained over two consecutive
INGLETS RESULTS
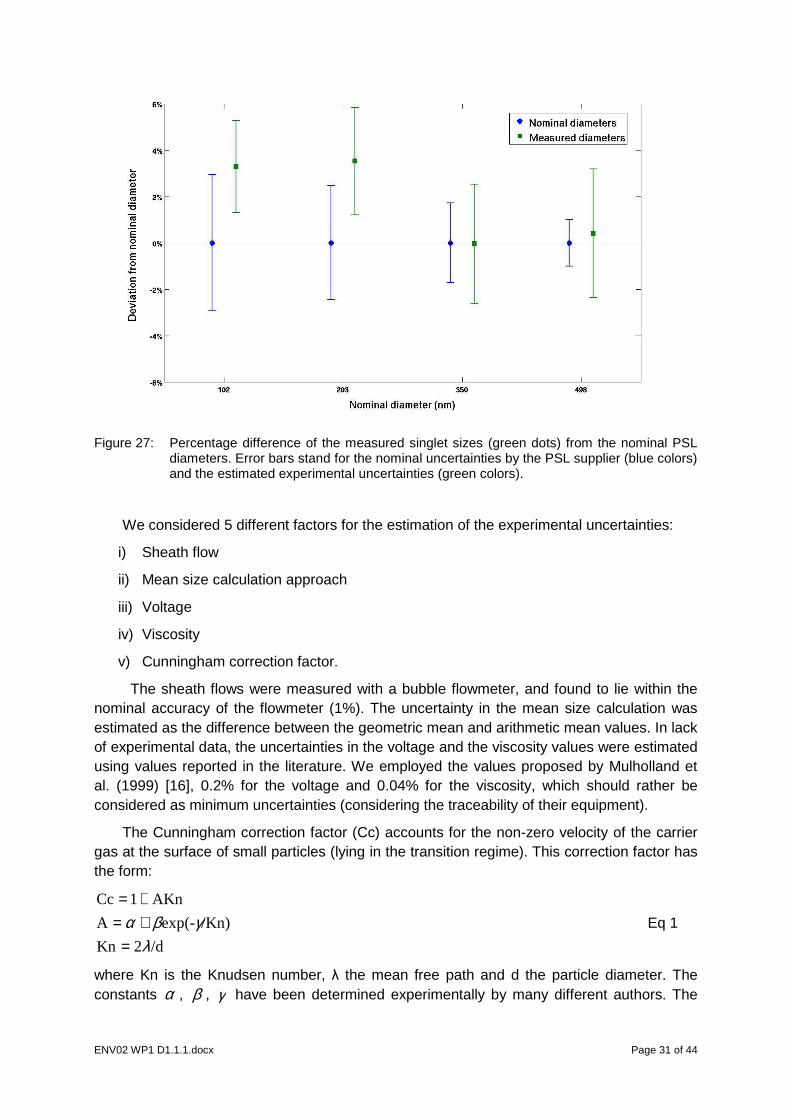
An overview of the PSL singlet results is presented in Figure 27. The xdifferent PSL nominal diameters we used and the y-axis the percentage uncertainties (%). The blue error bars correspond to the manufacturer's uncertainties; while the green dots indicate the measured singlet sizes with the green error-bars standing for the estimated experimental uncertainty. The DMA was validated for all PSL singlets given the uncertainties.
200 300 400 500 600
Diameter (nm)
Doublet
Page 30 of 44
PSL particles.
oncentration of the particles versus the selected diameter at DMA for particles with colors correspond to results obtained over two consecutive
. The x-axis presents the axis the percentage uncertainties (%).
The blue error bars correspond to the manufacturer's uncertainties; while the green dots g for the estimated
experimental uncertainty. The DMA was validated for all PSL singlets given the uncertainties.
700 800
ENV02 WP1 D1.1.1.docx Page 31 of 44
Figure 27: Percentage difference of the measured singlet sizes (green dots) from the nominal PSL diameters. Error bars stand for the nominal uncertainties by the PSL supplier (blue colors) and the estimated experimental uncertainties (green colors).
We considered 5 different factors for the estimation of the experimental uncertainties:
i) Sheath flow
ii) Mean size calculation approach
iii) Voltage
iv) Viscosity
v) Cunningham correction factor.
The sheath flows were measured with a bubble flowmeter, and found to lie within the nominal accuracy of the flowmeter (1%). The uncertainty in the mean size calculation was estimated as the difference between the geometric mean and arithmetic mean values. In lack of experimental data, the uncertainties in the voltage and the viscosity values were estimated using values reported in the literature. We employed the values proposed by Mulholland et al. (1999) [16], 0.2% for the voltage and 0.04% for the viscosity, which should rather be considered as minimum uncertainties (considering the traceability of their equipment).
The Cunningham correction factor (Cc) accounts for the non-zero velocity of the carrier gas at the surface of small particles (lying in the transition regime). This correction factor has the form:
/d2Kn
/Kn)exp(-A
AKn1Cc
λγβα
=+=+=
Eq 1
where Kn is the Knudsen number, λ the mean free path and d the particle diameter. The constants α , β , γ have been determined experimentally by many different authors. The
ENV02 WP1 D1.1.1.docx Page 32 of 44
Cunningham factor that we used for our calculations is the one proposed by Allen & Raabe (1985) [17].
( )[ ]0.999/Kn-exp0.5581.142Kn1Cc ++= Eq 2
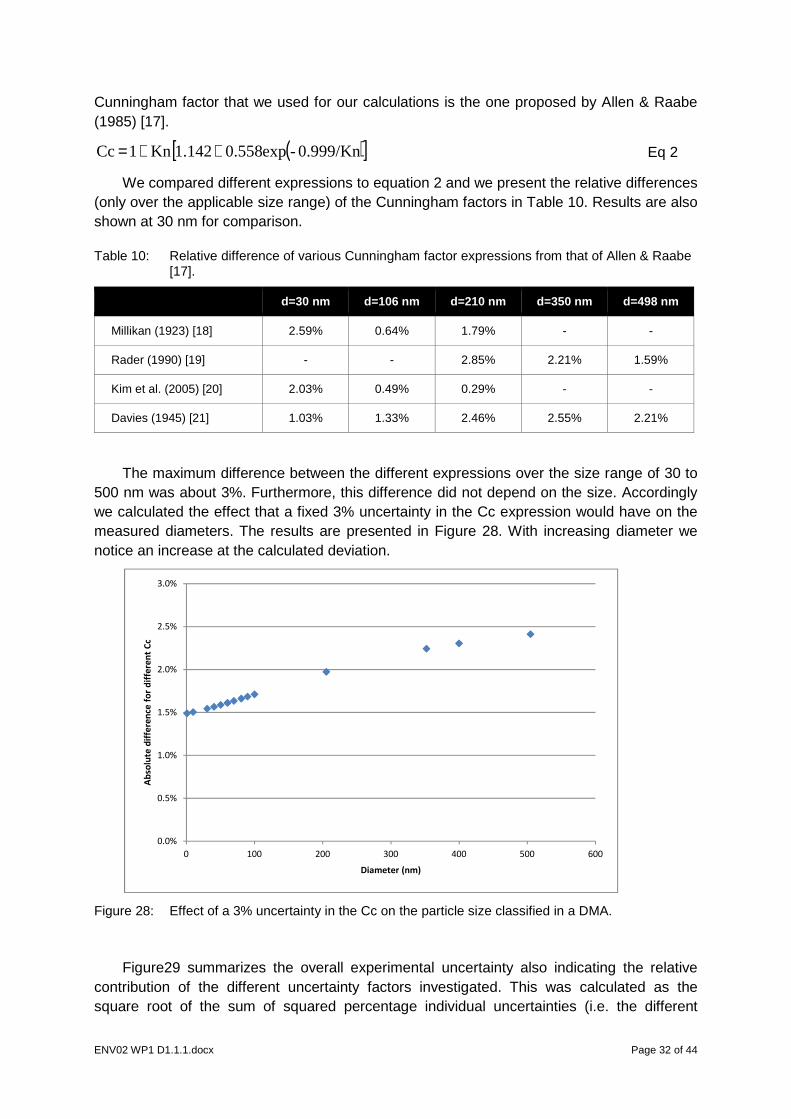
We compared different expressions to equation 2 and we present the relative differences (only over the applicable size range) of the Cunningham factors in Table 10. Results are also shown at 30 nm for comparison.
Table 10: Relative difference of various Cunningham factor expressions from that of Allen & Raabe [17].
d=30 nm d=106 nm d=210 nm d=350 nm d=498 nm
Millikan (1923) [18] 2.59% 0.64% 1.79% - -
Rader (1990) [19] - - 2.85% 2.21% 1.59%
Kim et al. (2005) [20] 2.03% 0.49% 0.29% - -
Davies (1945) [21] 1.03% 1.33% 2.46% 2.55% 2.21%
The maximum difference between the different expressions over the size range of 30 to 500 nm was about 3%. Furthermore, this difference did not depend on the size. Accordingly we calculated the effect that a fixed 3% uncertainty in the Cc expression would have on the measured diameters. The results are presented in Figure 28. With increasing diameter we notice an increase at the calculated deviation.
Figure 28: Effect of a 3% uncertainty in the Cc on the particle size classified in a DMA.
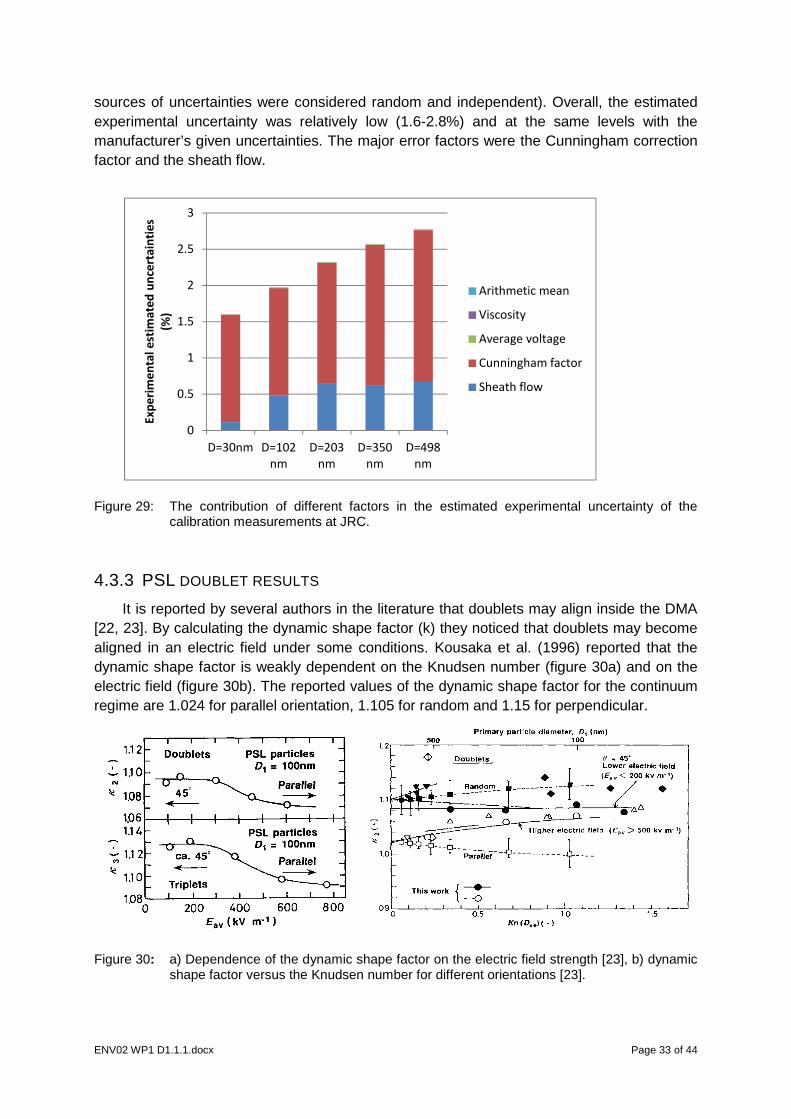
Figure29 summarizes the overall experimental uncertainty also indicating the relative contribution of the different uncertainty factors investigated. This was calculated as the square root of the sum of squared percentage individual uncertainties (i.e. the different
0.0%
0.5%
1.0%
1.5%
2.0%
2.5%
3.0%
0 100 200 300 400 500 600
Ab
solu
te d
iffe
ren
ce f
or
dif
fere
nt
Cc
Diameter (nm)
ENV02 WP1 D1.1.1.docx Page 33 of 44
sources of uncertainties were considered random and independent). Overall, the estimated experimental uncertainty was relatively low (1.6-2.8%) and at the same levels with the manufacturer’s given uncertainties. The major error factors were the Cunningham correction factor and the sheath flow.
Figure 29: The contribution of different factors in the estimated experimental uncertainty of the calibration measurements at JRC.
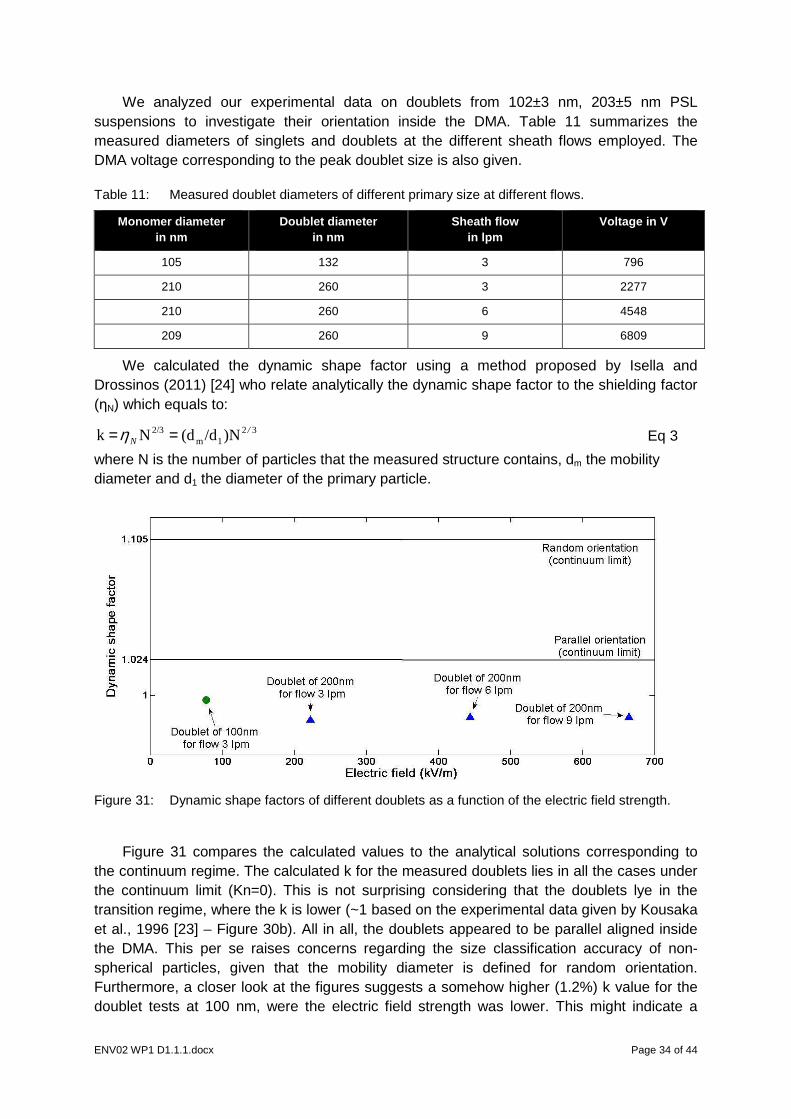
4.3.3 PSL DOUBLET RESULTS
It is reported by several authors in the literature that doublets may align inside the DMA [22, 23]. By calculating the dynamic shape factor (k) they noticed that doublets may become aligned in an electric field under some conditions. Kousaka et al. (1996) reported that the dynamic shape factor is weakly dependent on the Knudsen number (figure 30a) and on the electric field (figure 30b). The reported values of the dynamic shape factor for the continuum regime are 1.024 for parallel orientation, 1.105 for random and 1.15 for perpendicular.
Figure 30: a) Dependence of the dynamic shape factor on the electric field strength [23], b) dynamic shape factor versus the Knudsen number for different orientations [23].
0
0.5
1
1.5
2
2.5
3
D=30nm D=102
nm
D=203
nm
D=350
nm
D=498
nm
Ex
pe
rim
en
tal
est
ima
ted
un
cert
ain
tie
s
(%)
Arithmetic mean
Viscosity
Average voltage
Cunningham factor
Sheath flow
ENV02 WP1 D1.1.1.docx Page 34 of 44
We analyzed our experimental data on doublets from 102±3 nm, 203±5 nm PSL suspensions to investigate their orientation inside the DMA. Table 11 summarizes the measured diameters of singlets and doublets at the different sheath flows employed. The DMA voltage corresponding to the peak doublet size is also given.
Table 11: Measured doublet diameters of different primary size at different flows.
Monomer diameter in nm
Doublet diameter in nm
Sheath flow in lpm
Voltage in V
105 132 3 796
210 260 3 2277
210 260 6 4548
209 260 9 6809
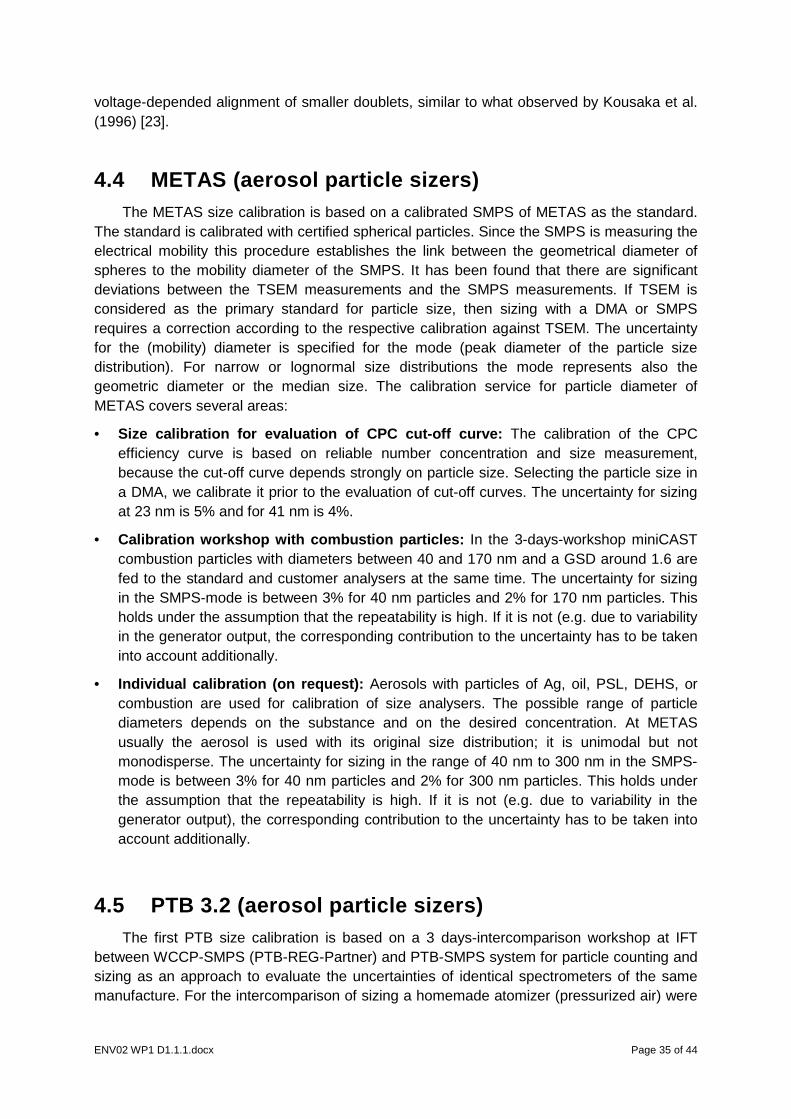
We calculated the dynamic shape factor using a method proposed by Isella and Drossinos (2011) [24] who relate analytically the dynamic shape factor to the shielding factor (ηN) which equals to:
321m
2/3 )N/d(dNk /N ==η Eq 3
where N is the number of particles that the measured structure contains, dm the mobility diameter and d1 the diameter of the primary particle.
Figure 31: Dynamic shape factors of different doublets as a function of the electric field strength.
Figure 31 compares the calculated values to the analytical solutions corresponding to the continuum regime. The calculated k for the measured doublets lies in all the cases under the continuum limit (Kn=0). This is not surprising considering that the doublets lye in the transition regime, where the k is lower (~1 based on the experimental data given by Kousaka et al., 1996 [23] – Figure 30b). All in all, the doublets appeared to be parallel aligned inside the DMA. This per se raises concerns regarding the size classification accuracy of non-spherical particles, given that the mobility diameter is defined for random orientation. Furthermore, a closer look at the figures suggests a somehow higher (1.2%) k value for the doublet tests at 100 nm, were the electric field strength was lower. This might indicate a
ENV02 WP1 D1.1.1.docx Page 35 of 44
voltage-depended alignment of smaller doublets, similar to what observed by Kousaka et al. (1996) [23].
4.4 METAS (aerosol particle sizers) The METAS size calibration is based on a calibrated SMPS of METAS as the standard.
The standard is calibrated with certified spherical particles. Since the SMPS is measuring the electrical mobility this procedure establishes the link between the geometrical diameter of spheres to the mobility diameter of the SMPS. It has been found that there are significant deviations between the TSEM measurements and the SMPS measurements. If TSEM is considered as the primary standard for particle size, then sizing with a DMA or SMPS requires a correction according to the respective calibration against TSEM. The uncertainty for the (mobility) diameter is specified for the mode (peak diameter of the particle size distribution). For narrow or lognormal size distributions the mode represents also the geometric diameter or the median size. The calibration service for particle diameter of METAS covers several areas:
• Size calibration for evaluation of CPC cut-off curv e: The calibration of the CPC efficiency curve is based on reliable number concentration and size measurement, because the cut-off curve depends strongly on particle size. Selecting the particle size in a DMA, we calibrate it prior to the evaluation of cut-off curves. The uncertainty for sizing at 23 nm is 5% and for 41 nm is 4%.
• Calibration workshop with combustion particles: In the 3-days-workshop miniCAST combustion particles with diameters between 40 and 170 nm and a GSD around 1.6 are fed to the standard and customer analysers at the same time. The uncertainty for sizing in the SMPS-mode is between 3% for 40 nm particles and 2% for 170 nm particles. This holds under the assumption that the repeatability is high. If it is not (e.g. due to variability in the generator output, the corresponding contribution to the uncertainty has to be taken into account additionally.
• Individual calibration (on request): Aerosols with particles of Ag, oil, PSL, DEHS, or combustion are used for calibration of size analysers. The possible range of particle diameters depends on the substance and on the desired concentration. At METAS usually the aerosol is used with its original size distribution; it is unimodal but not monodisperse. The uncertainty for sizing in the range of 40 nm to 300 nm in the SMPS-mode is between 3% for 40 nm particles and 2% for 300 nm particles. This holds under the assumption that the repeatability is high. If it is not (e.g. due to variability in the generator output), the corresponding contribution to the uncertainty has to be taken into account additionally.
4.5 PTB 3.2 (aerosol particle sizers) The first PTB size calibration is based on a 3 days-intercomparison workshop at IFT
between WCCP-SMPS (PTB-REG-Partner) and PTB-SMPS system for particle counting and sizing as an approach to evaluate the uncertainties of identical spectrometers of the same manufacture. For the intercomparison of sizing a homemade atomizer (pressurized air) were
ENV02 WP1 D1.1.1.docx Page 36 of 44
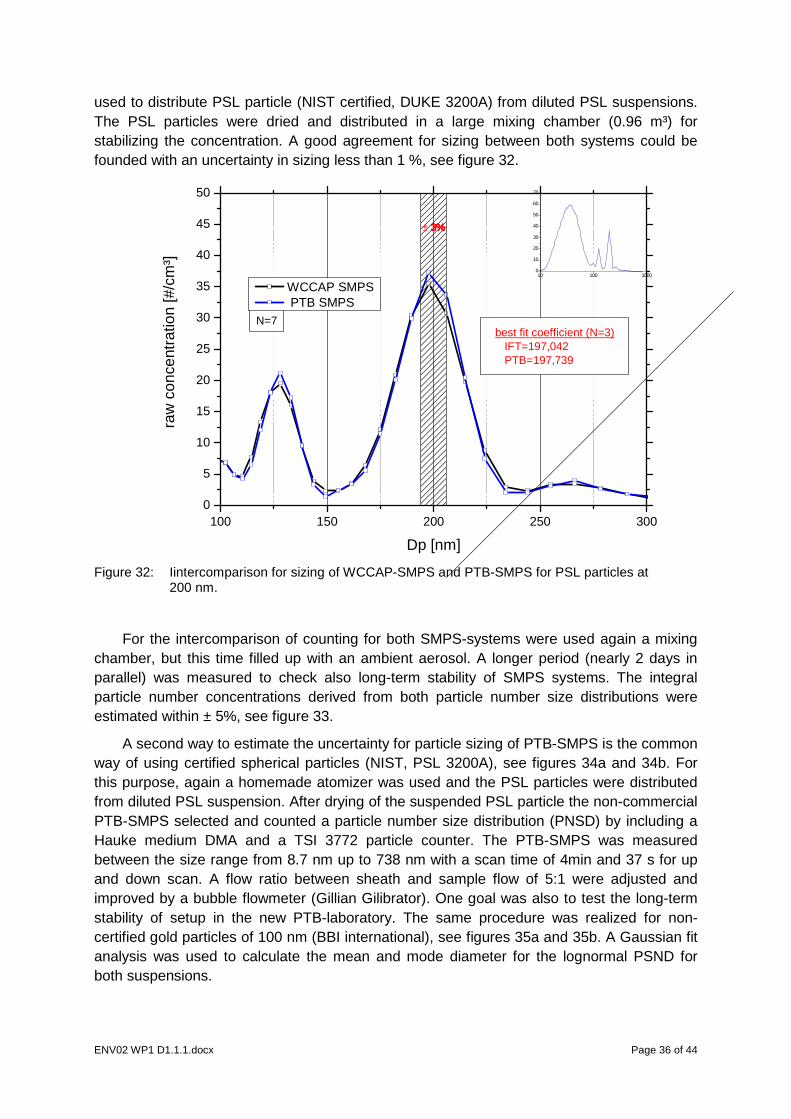
used to distribute PSL particle (NIST certified, DUKE 3200A) from diluted PSL suspensions. The PSL particles were dried and distributed in a large mixing chamber (0.96 m³) for stabilizing the concentration. A good agreement for sizing between both systems could be founded with an uncertainty in sizing less than 1 %, see figure 32.
Figure 32: Iintercomparison for sizing of WCCAP-SMPS and PTB-SMPS for PSL particles at 200 nm.
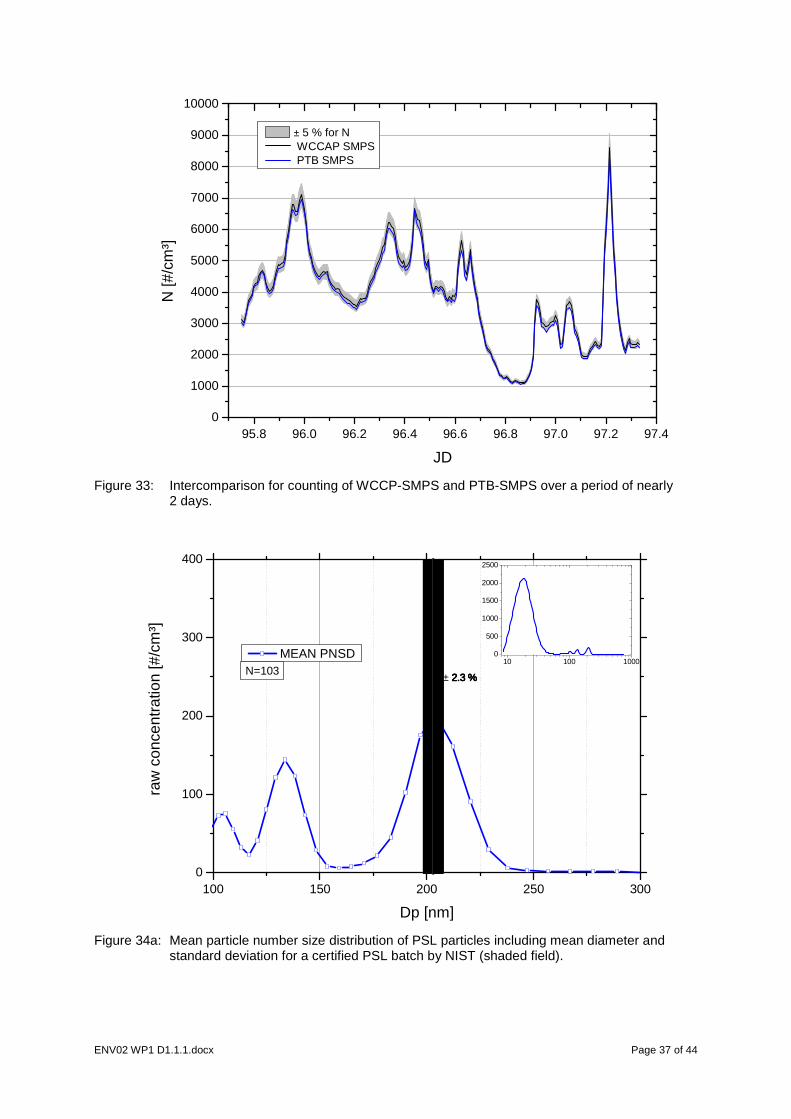
For the intercomparison of counting for both SMPS-systems were used again a mixing chamber, but this time filled up with an ambient aerosol. A longer period (nearly 2 days in parallel) was measured to check also long-term stability of SMPS systems. The integral particle number concentrations derived from both particle number size distributions were estimated within ± 5%, see figure 33.
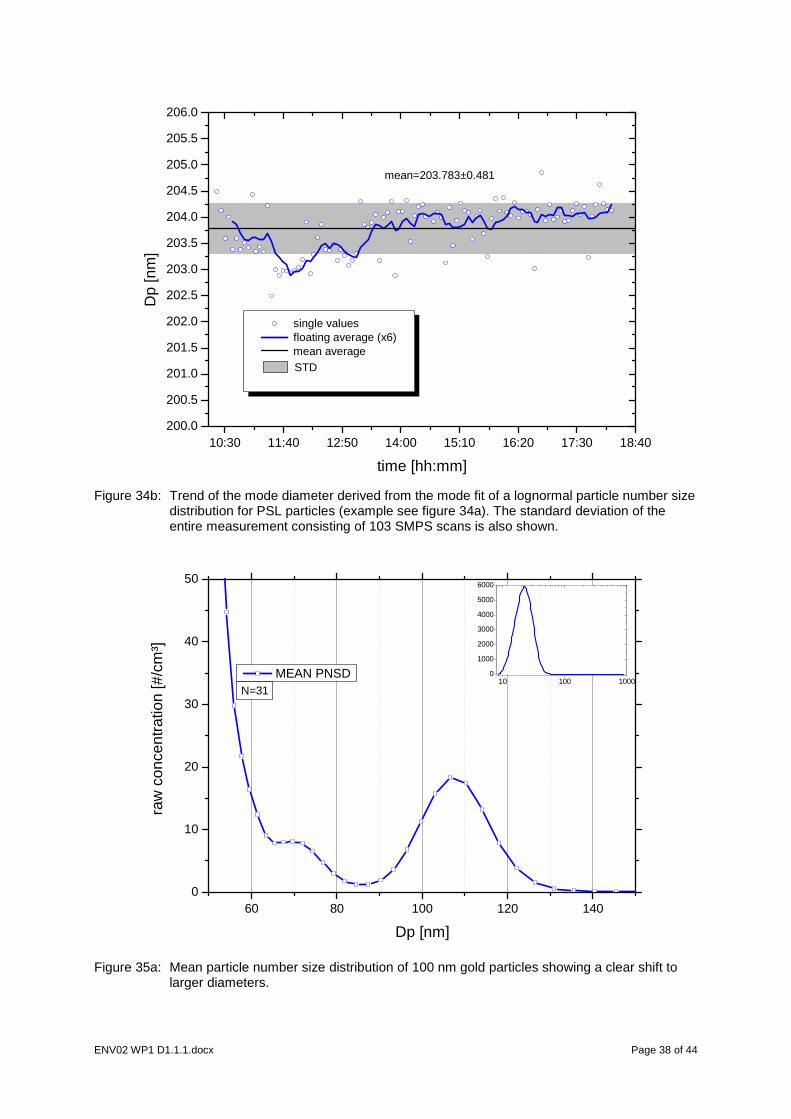
A second way to estimate the uncertainty for particle sizing of PTB-SMPS is the common way of using certified spherical particles (NIST, PSL 3200A), see figures 34a and 34b. For this purpose, again a homemade atomizer was used and the PSL particles were distributed from diluted PSL suspension. After drying of the suspended PSL particle the non-commercial PTB-SMPS selected and counted a particle number size distribution (PNSD) by including a Hauke medium DMA and a TSI 3772 particle counter. The PTB-SMPS was measured between the size range from 8.7 nm up to 738 nm with a scan time of 4min and 37 s for up and down scan. A flow ratio between sheath and sample flow of 5:1 were adjusted and improved by a bubble flowmeter (Gillian Gilibrator). One goal was also to test the long-term stability of setup in the new PTB-laboratory. The same procedure was realized for non-certified gold particles of 100 nm (BBI international), see figures 35a and 35b. A Gaussian fit analysis was used to calculate the mean and mode diameter for the lognormal PSND for both suspensions.
100 150 200 250 3000
5
10
15
20
25
30
35
40
45
50
± 3% 3% 3% 3%
N=7
raw
con
cent
ratio
n [#
/cm
³]
Dp [nm]
WCCAP SMPS PTB SMPS
best fit coefficient (N=3) IFT=197,042 PTB=197,739
10 100 10000
10
20
30
40
50
60
70
ENV02 WP1 D1.1.1.docx Page 37 of 44
Figure 33: Intercomparison for counting of WCCP-SMPS and PTB-SMPS over a period of nearly 2 days.
Figure 34a: Mean particle number size distribution of PSL particles including mean diameter and standard deviation for a certified PSL batch by NIST (shaded field).
95.8 96.0 96.2 96.4 96.6 96.8 97.0 97.2 97.40
1000
2000
3000
4000
5000
6000
7000
8000
9000
10000
± 5 % for N WCCAP SMPS PTB SMPS
N [#
/cm
³]
JD
100 150 200 250 3000
100
200
300
400
± 2.3 % 2.3 % 2.3 % 2.3 %N=103
raw
con
cent
ratio
n [#
/cm
³]
Dp [nm]
MEAN PNSD10 100 1000
0
500
1000
1500
2000
2500
ENV02 WP1 D1.1.1.docx Page 38 of 44
Figure 34b: Trend of the mode diameter derived from the mode fit of a lognormal particle number size distribution for PSL particles (example see figure 34a). The standard deviation of the entire measurement consisting of 103 SMPS scans is also shown.
Figure 35a: Mean particle number size distribution of 100 nm gold particles showing a clear shift to larger diameters.
10:30 11:40 12:50 14:00 15:10 16:20 17:30 18:40200.0
200.5
201.0
201.5
202.0
202.5
203.0
203.5
204.0
204.5
205.0
205.5
206.0
mean=203.783±0.481
single values floating average (x6) mean average
STD
Dp
[nm
]
time [hh:mm]
60 80 100 120 1400
10
20
30
40
50
N=31
raw
con
cent
ratio
n [#
/cm
³]
Dp [nm]
MEAN PNSD10 100 1000
0
1000
2000
3000
4000
5000
6000
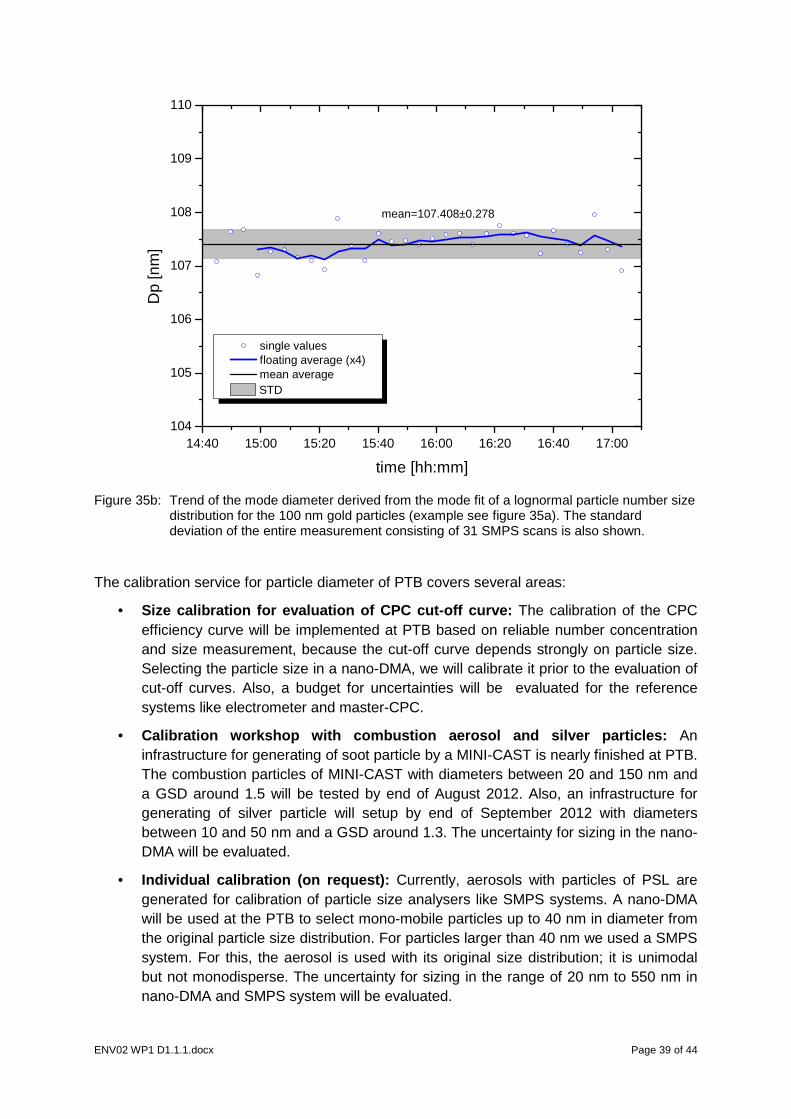
ENV02 WP1 D1.1.1.docx Page 39 of 44
Figure 35b: Trend of the mode diameter derived from the mode fit of a lognormal particle number size distribution for the 100 nm gold particles (example see figure 35a). The standard deviation of the entire measurement consisting of 31 SMPS scans is also shown.
The calibration service for particle diameter of PTB covers several areas:
• Size calibration for evaluation of CPC cut-off curv e: The calibration of the CPC efficiency curve will be implemented at PTB based on reliable number concentration and size measurement, because the cut-off curve depends strongly on particle size. Selecting the particle size in a nano-DMA, we will calibrate it prior to the evaluation of cut-off curves. Also, a budget for uncertainties will be evaluated for the reference systems like electrometer and master-CPC.
• Calibration workshop with combustion aerosol and si lver particles: An infrastructure for generating of soot particle by a MINI-CAST is nearly finished at PTB. The combustion particles of MINI-CAST with diameters between 20 and 150 nm and a GSD around 1.5 will be tested by end of August 2012. Also, an infrastructure for generating of silver particle will setup by end of September 2012 with diameters between 10 and 50 nm and a GSD around 1.3. The uncertainty for sizing in the nano-DMA will be evaluated.
• Individual calibration (on request): Currently, aerosols with particles of PSL are generated for calibration of particle size analysers like SMPS systems. A nano-DMA will be used at the PTB to select mono-mobile particles up to 40 nm in diameter from the original particle size distribution. For particles larger than 40 nm we used a SMPS system. For this, the aerosol is used with its original size distribution; it is unimodal but not monodisperse. The uncertainty for sizing in the range of 20 nm to 550 nm in nano-DMA and SMPS system will be evaluated.
14:40 15:00 15:20 15:40 16:00 16:20 16:40 17:00104
105
106
107
108
109
110
single values floating average (x4) mean average
Dp
[nm
]
time [hh:mm]
STD
mean=107.408±0.278
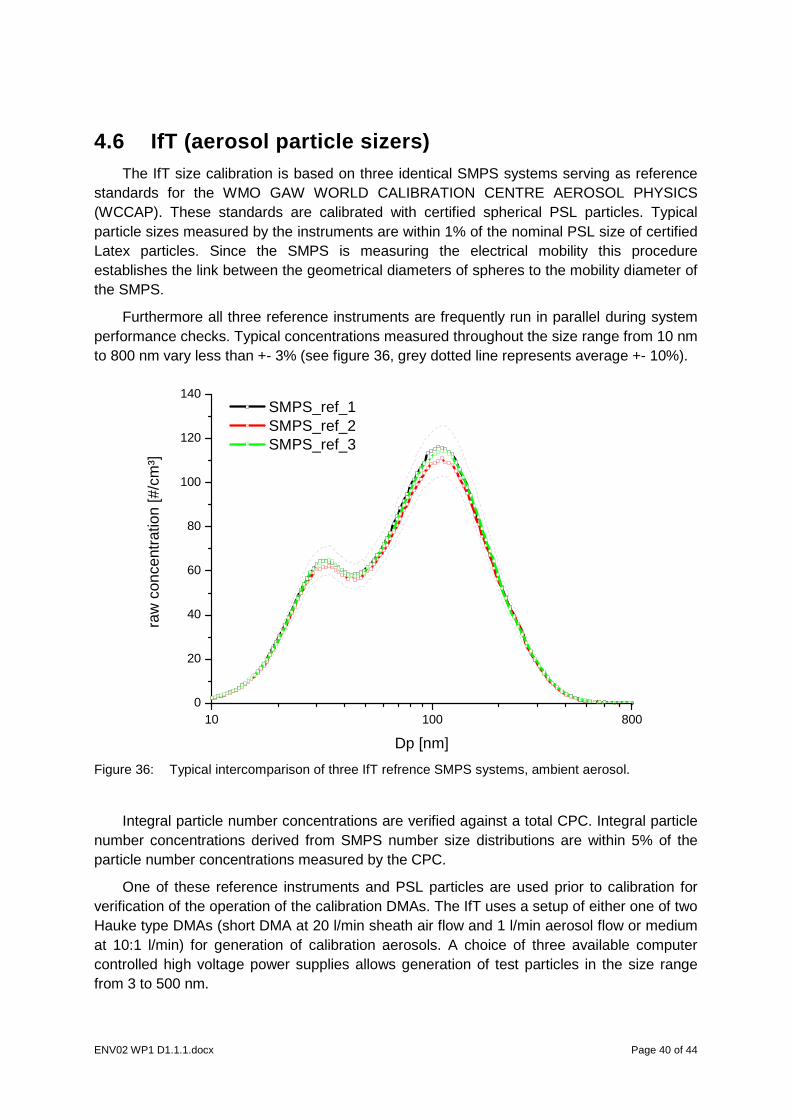
ENV02 WP1 D1.1.1.docx Page 40 of 44
4.6 IfT (aerosol particle sizers) The IfT size calibration is based on three identical SMPS systems serving as reference
standards for the WMO GAW WORLD CALIBRATION CENTRE AEROSOL PHYSICS (WCCAP). These standards are calibrated with certified spherical PSL particles. Typical particle sizes measured by the instruments are within 1% of the nominal PSL size of certified Latex particles. Since the SMPS is measuring the electrical mobility this procedure establishes the link between the geometrical diameters of spheres to the mobility diameter of the SMPS.
Furthermore all three reference instruments are frequently run in parallel during system performance checks. Typical concentrations measured throughout the size range from 10 nm to 800 nm vary less than +- 3% (see figure 36, grey dotted line represents average +- 10%).
Figure 36: Typical intercomparison of three IfT refrence SMPS systems, ambient aerosol.
Integral particle number concentrations are verified against a total CPC. Integral particle number concentrations derived from SMPS number size distributions are within 5% of the particle number concentrations measured by the CPC.
One of these reference instruments and PSL particles are used prior to calibration for verification of the operation of the calibration DMAs. The IfT uses a setup of either one of two Hauke type DMAs (short DMA at 20 l/min sheath air flow and 1 l/min aerosol flow or medium at 10:1 l/min) for generation of calibration aerosols. A choice of three available computer controlled high voltage power supplies allows generation of test particles in the size range from 3 to 500 nm.
10 100 8000
20
40
60
80
100
120
140
raw
con
cent
ratio
n [#
/cm
³]
Dp [nm]
SMPS_ref_1 SMPS_ref_2 SMPS_ref_3
ENV02 WP1 D1.1.1.docx Page 41 of 44
The calibration service for particle diameter of IfT covers several areas:
• Size calibration for evaluation of CPC cut-off curv e: The calibration of the CPC efficiency curve is based on reliable number concentration and size measurement, because the cut-off curve depends strongly on particle size.
• Calibration workshop with silver or sodiumchloride particles: During workshops of one to two weeks required aerosols are generated and fed to the customers CPCs. Depending on the intention on their intention these workshops may include hands on training with the instruments, data evaluation or courses on basic aerosol measurement techniques.
• Individual calibration (on request): Aerosols with particles of Ag, PSL, DEHS, NaCl or test dusts are used for calibration of size analysers. The possible range of particle diameters depends on the substance and on the desired concentration. A DMA is usually used at the IfT to select mono-mobile particles up to 40 nm in diameter from the original particle size distribution. For particles larger than 40 nm in diameter the original size distribution from the generator is used.
ENV02 WP1 D1.1.1.docx Page 42 of 44
5 CONCLUSIONS The coordinated actions of the partners involved in this part of the JRP ENV02 project
have lead to the following achievements which accomplish the tasks for deliverable D1.1.1:
• Successful evaluation and certification of geometrical particle diameter and size distribution of solid spherical monodisperse particle standards suitable for aerosol generation in the size range between about 20 nm and 200 nm. Gold, silver and polystyrene latex particles have been studied. The source material was either present as suspension or was directly generated from silver granulate using vaporization and sintering. These reference materials were analyzed and certified using TSEM and AFM.
• Successful generation of aerosols from above reference material. Different techniques have been applied and developed further. The problem of undesired residual particles encountered when nebulizing particle suspensions has been substantially reduced by exchanging the original solvent by a suited buffer solution. Consequently, the aerosol generated contained only a negligible fraction of particles with other diameters which might falsify the size calibration. Moreover, this technique also significantly lowered the accretion of suspension additives at the surface of the nanoparticles which reduced the measured differences between geometrical and mobility particle sizes.
• Provision of calibration services for particle mobility analysers applied for evaluation of CPC cut-off curves. These calibrations are based on the generated aerosols, individual calibrations are possible on request.
• The suspended gold particles between 20 and 100 nm, in combination with the size calibration with TSEM or AFM and the evaluated procedure to aerosolize the particles, best satisfy the requirement as reference particles for DMA calibration in the automotive application. This is based on the assessment of the associated uncertainty in sizing (< 5%), the roundness of the particles, and the width of the size distribution.
In total, the aims of this task have been fulfilled: Aerosols suitable for the calibration of aerosol particle sizers have been produced and corresponding calibration services have been established which meet the needs of the automotive industry and certification bodies. In addition, this study has raised scientific issues which should be explored in future research to foster the development of further improved aerosol generation and calibration services, e.g. to thoroughly understand the small but significant differences between geometrical and mobility particle sizes.
Parts of this work have been presented to an international expert audience at the 16th ETH-Conference on “Combustion Generated Nanoparticles” [25,26,27].
ENV02 WP1 D1.1.1.docx Page 43 of 44
6 REFERENCES
[1] Regulation No. 83: Uniform provisions concerning the approval of vehicles with regard to the emission of pollutants according to engine fuel requirements http://www.unece.org/fileadmin/DAM/trans/main/wp29/wp29regs/r083r4e.pdf
[2] Commission Regulation (EC) No 692/2008 of 18 July 2008 implementing and amending Regulation (EC) No 715/2007 of the European Parliament and of the Council on type-approval of motor vehicles with respect to emissions from light passenger and commercial vehicles (Euro 5 and Euro 6) and on access to vehicle repair and maintenance information. http://eur-lex.europa.eu/LexUriServ/LexUriServ.do?uri=OJ:L:2008:199:0001:0136:EN:PDF
[3] AEA Energy & Environment; Volatile Particle Remover - Calibration and Validation Procedures , ED47382004/VPR, Issue Number 5, December 2007 http://www.unece.org/fileadmin/DAM/trans/doc/2008/wp29grpe/PMP-VPR-CalibrationProcedure.pdf
[4] Publishable JRP Summary for Project T3 1.1; Traceable Characterisation of Nanoparticles http://www.euramet.org/fileadmin/docs/EMRP/JRP/iMERA-plus_JRPs_2010-06-22/T3.J1.1.pdf
[5] ISO Guide 30: Terms and definitions used in connection with reference materials (1992)
[6] Buhr E, Senftleben N, Klein T, Bergmann D, Gnieser D, Frase C G, Characterisation of nanoparticles by scanning electron microscope in transmission mode, Meas. Sci. Technol. 20, 084025 (2009)
[7] Klein T, Buhr E, Johnsen K-P, Frase C G, Traceable measurement of nanoparticle size using a scanning electron microscope in transmission mode (TSEM), Meas. Sci. Technol. 22, 094002 (2011)
[8] Buhr E, Michaelis W, Diener A and Mirandé W, Multi-wavelength VIS/UV optical diffractometer for high-accuracy calibration of nano-scale pitch standards, Meas. Sci. Technol. 18 667-74 (2007)
[9] Guide to the expression of uncertainty in measurement (GUM). Joint Committee for Guides in Metrology. JCGM 100 (2008).
[10] Garnæs J, Dirscherl K, “NANO5 – 2D Grating – Final report”, Metrologia 45 (2008), Tech. Suppl. 04003
[11] Garnæs J, Kofod N, Kühle A, Nielsen C, Dirscherl K, Blunt L, Calibration of step heights and roughness measurements with atomic force microscopes, Precision Engineering 27 (1) (2003), pp. 91-98
[12] Scanning Probe Image Processor V6.0.2 by Image Metrology A/S, www.imagemet.com
[13] TSI; Model 3480 –Electrospray Aerosol Generator – Instruction Manual; P/N 1933793, Revision D; October 2003
[14] ISO 15900:2009 Determination of particle size distribution -- Differential electrical mobility analysis for aerosol particles
[15] Scheibel H G, Porstendörfer J, Generation of monodisperse Ag- and NaCl aerosols with particle diameters between 2 and 300 nm, J. Aerosol Sci. 2 113-126 (1983)
[16] Mulholland G W, Bryner N P, Croarkin C, Measurement of the 100 nm NIST SRM 1963 by Differential Mobility Analysis, Aerosol Sci. and Technol. 31 (1999) 39.
ENV02 WP1 D1.1.1.docx Page 44 of 44
[17] Allen M D, Raabe O G, Slip correction measurements of spherical solid aerosol particles in an
improved Millikan apparatus, Aerosol Sci. and Technol. 4 (1985) 269.
[18] Millikan R A, The general law of fall of a small spherical body through a gas, and its bearing upon the nature of molecular reflection from surfaces, Phys. Rev. 22 (1923) 1.
[19] Rader D J, Momentum slip correction factor for small particles in nine common gases, J. Aerosol Sci. 21 (1990) 161.
[20] Kim J H, Mulholland G W, Kukuck S R, Pui D Y H, Slip correction measurements of certified PSL nanoparticles using a nanometer differential mobility analyzer (Nano-DMA) for Knudsen number from 0.5 to 83, J. Res. Natl. Inst. Stand. Technol. 110 (2005) 31
[21] Davies C N, Definitive equations for the fluid resistance of spheres, Proc. Phys. Soc. 57 (1945) 259
[22] Cheng Y S, Allen M D, Gallegos D P, Yeh H C, Peterson K, Drag force and slip correction of aggregate aerosols, Aerosol Sci. and Technol. 8 (1988) 199.
[23] Kousaka Y, Endo Y, Ichitsubo H, Alonso M, Orientation-specific dynamic shape factors for doublets and triplets of spheres in the transition regime, Aerosol Sci. and Technol. 24 (1996) 36.
[24] Isella L, Drossinos Y, On the friction coefficient of straight-chain aggregates, J. Colloid Interface Sci. 356 (2011) 505.
[25] Lüönd F, Aerosolization of Monodisperse Spherical Gold Particles as Reference for Calibration of Mobility Analyzers, 16th ETH-Conference on Combustion Generated Nanoparticles, Zurich, Switzerland, 24 – 27 June 2012
[26] Klein T, Generation and Traceable Electron-Microscopic Characterization of Monodisperse Aerosols, 16th ETH-Conference on Combustion Generated Nanoparticles, Zurich, Switzerland, 24 – 27 June 2012
[27] Nicolet A, Nanoparticle Trajectories in an Electrostatic Precipitator: Simulation and Experimental Validation, 16th ETH-Conference on Combustion Generated Nanoparticles, Zurich, Switzerland, 24 – 27 June 2012