Embed Size (px)
Citation preview
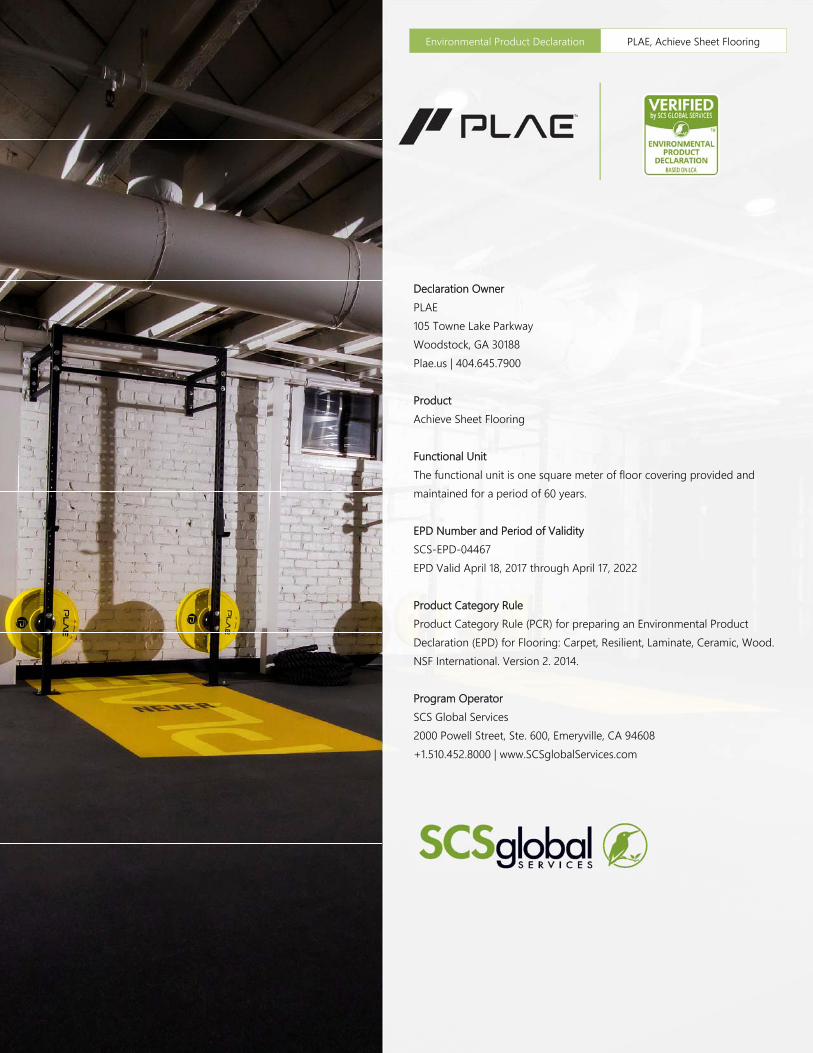
Environmental Product Declaration PLAE, Achieve Sheet Flooring
………………………………………………………………………………………………..……………………………………………………………………………………………………………………………
1
© 2017 SCSglobalServices.com
Environmental Product Declaration PLAE, Achieve Sheet Flooring
Declaration Owner PLAE 105 Towne Lake Parkway Woodstock, GA 30188 Plae.us | 404.645.7900 Product Achieve Sheet Flooring Functional Unit The functional unit is one square meter of floor covering provided and maintained for a period of 60 years. EPD Number and Period of Validity SCS-EPD-04467 EPD Valid April 18, 2017 through April 17, 2022 Product Category Rule Product Category Rule (PCR) for preparing an Environmental Product Declaration (EPD) for Flooring: Carpet, Resilient, Laminate, Ceramic, Wood. NSF International. Version 2. 2014. Program Operator SCS Global Services 2000 Powell Street, Ste. 600, Emeryville, CA 94608 +1.510.452.8000 | www.SCSglobalServices.com
………………………………………………………………………………………………..……………………………………………………………………………………………………………………………
1
© 2017 SCSglobalServices.com
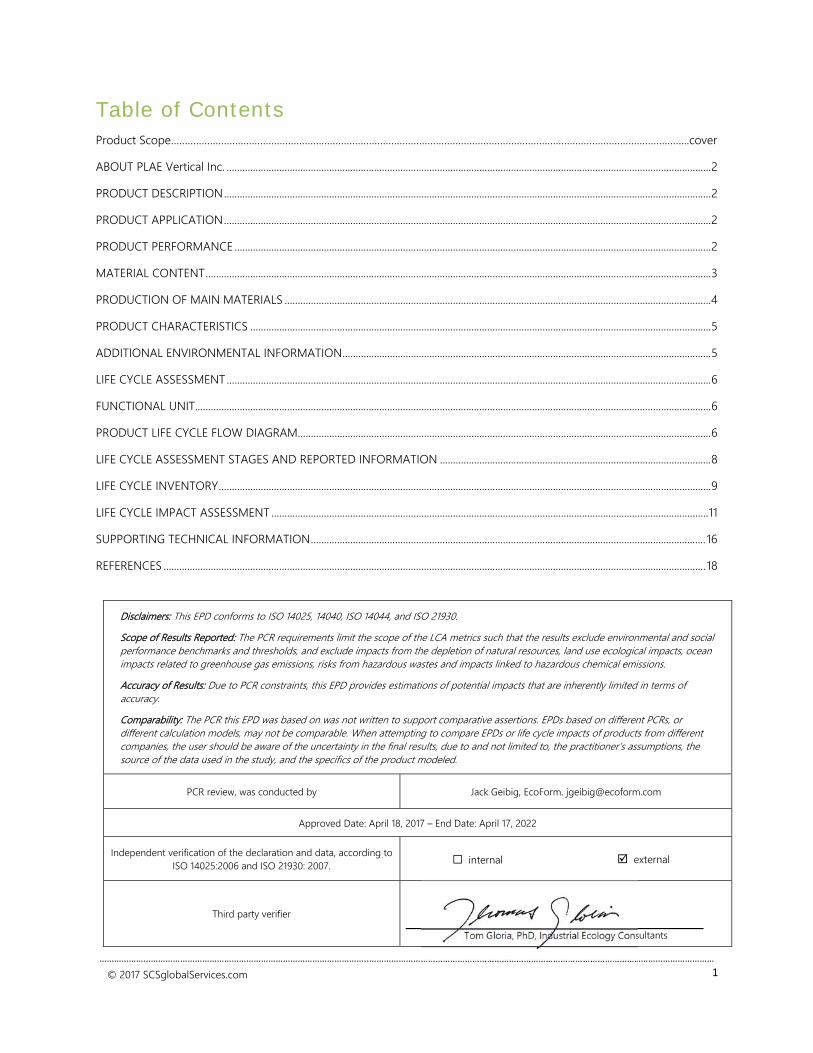
Table of Contents Product Scope…………………………………………………………………………………………………………………………………………………………………...cover
ABOUT PLAE Vertical Inc. ........................................................................................................................................................................................ 2
PRODUCT DESCRIPTION ......................................................................................................................................................................................... 2
PRODUCT APPLICATION ......................................................................................................................................................................................... 2
PRODUCT PERFORMANCE ..................................................................................................................................................................................... 2
MATERIAL CONTENT ................................................................................................................................................................................................ 3
PRODUCTION OF MAIN MATERIALS ..................................................................................................................................................................4
PRODUCT CHARACTERISTICS ............................................................................................................................................................................... 5
ADDITIONAL ENVIRONMENTAL INFORMATION ............................................................................................................................................ 5
LIFE CYCLE ASSESSMENT ........................................................................................................................................................................................ 6
FUNCTIONAL UNIT.................................................................................................................................................................................................... 6
PRODUCT LIFE CYCLE FLOW DIAGRAM............................................................................................................................................................. 6
LIFE CYCLE ASSESSMENT STAGES AND REPORTED INFORMATION ....................................................................................................... 8
LIFE CYCLE INVENTORY ........................................................................................................................................................................................... 9
LIFE CYCLE IMPACT ASSESSMENT ...................................................................................................................................................................... 11
SUPPORTING TECHNICAL INFORMATION ...................................................................................................................................................... 16
REFERENCES .............................................................................................................................................................................................................. 18
Disclaimers: This EPD conforms to ISO 14025, 14040, ISO 14044, and ISO 21930.
Scope of Results Reported: The PCR requirements limit the scope of the LCA metrics such that the results exclude environmental and social performance benchmarks and thresholds, and exclude impacts from the depletion of natural resources, land use ecological impacts, ocean impacts related to greenhouse gas emissions, risks from hazardous wastes and impacts linked to hazardous chemical emissions.
Accuracy of Results: Due to PCR constraints, this EPD provides estimations of potential impacts that are inherently limited in terms of accuracy.
Comparability: The PCR this EPD was based on was not written to support comparative assertions. EPDs based on different PCRs, or different calculation models, may not be comparable. When attempting to compare EPDs or life cycle impacts of products from different companies, the user should be aware of the uncertainty in the final results, due to and not limited to, the practitioner’s assumptions, the source of the data used in the study, and the specifics of the product modeled.
PCR review, was conducted by Jack Geibig, EcoForm. [email protected]
Approved Date: April 18, 2017 – End Date: April 17, 2022
Independent verification of the declaration and data, according to ISO 14025:2006 and ISO 21930: 2007. ☐ internal external
Third party verifier
Tom Gloria, PhD, Industrial Ecology Consultants
………………………………………………………………………………………………..……………………………………………………………………………………………………………………………
2
© 2017 SCSglobalServices.com
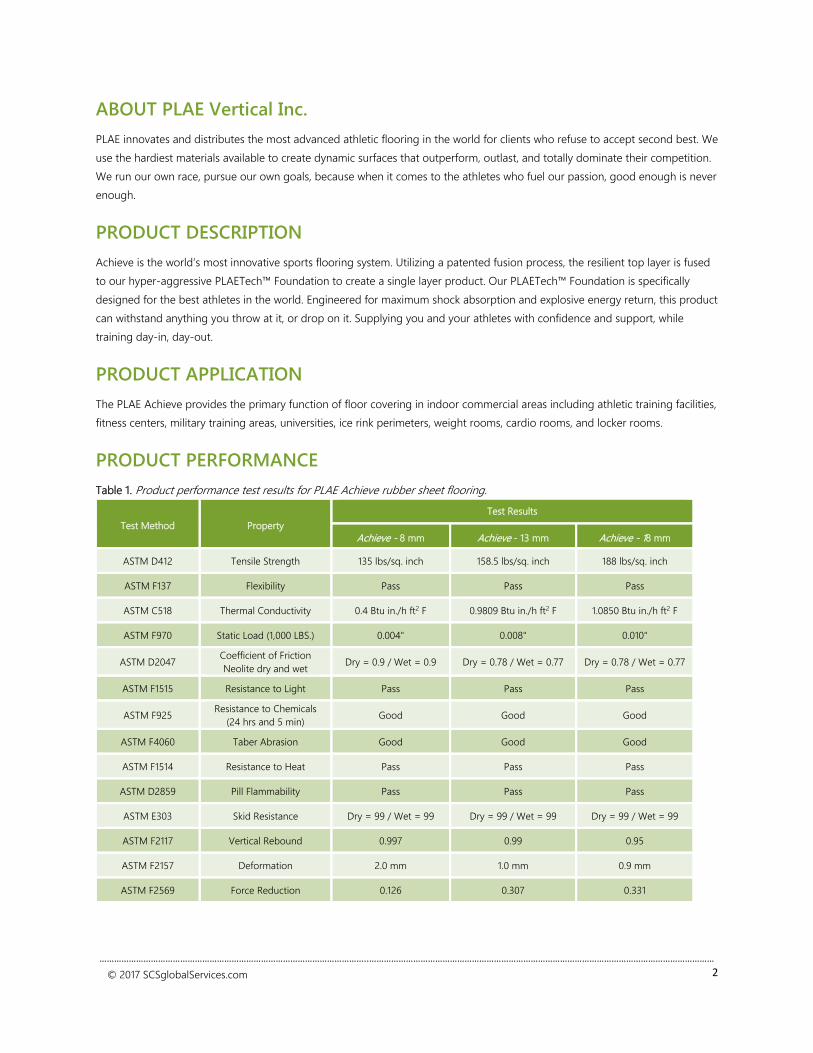
ABOUT PLAE Vertical Inc. PLAE innovates and distributes the most advanced athletic flooring in the world for clients who refuse to accept second best. We use the hardiest materials available to create dynamic surfaces that outperform, outlast, and totally dominate their competition. We run our own race, pursue our own goals, because when it comes to the athletes who fuel our passion, good enough is never enough.
PRODUCT DESCRIPTION Achieve is the world’s most innovative sports flooring system. Utilizing a patented fusion process, the resilient top layer is fused to our hyper-aggressive PLAETech™ Foundation to create a single layer product. Our PLAETech™ Foundation is specifically designed for the best athletes in the world. Engineered for maximum shock absorption and explosive energy return, this product can withstand anything you throw at it, or drop on it. Supplying you and your athletes with confidence and support, while training day-in, day-out.
PRODUCT APPLICATION The PLAE Achieve provides the primary function of floor covering in indoor commercial areas including athletic training facilities, fitness centers, military training areas, universities, ice rink perimeters, weight rooms, cardio rooms, and locker rooms.
PRODUCT PERFORMANCE Table 1. Product performance test results for PLAE Achieve rubber sheet flooring.
Test Method Property Test Results
Achieve - 8 mm Achieve - 13 mm Achieve - 18 mm
ASTM D412 Tensile Strength 135 lbs/sq. inch 158.5 lbs/sq. inch 188 lbs/sq. inch
ASTM F137 Flexibility Pass Pass Pass
ASTM C518 Thermal Conductivity 0.4 Btu in./h ft2 F 0.9809 Btu in./h ft2 F 1.0850 Btu in./h ft2 F
ASTM F970 Static Load (1,000 LBS.) 0.004" 0.008" 0.010"
ASTM D2047 Coefficient of Friction Neolite dry and wet Dry = 0.9 / Wet = 0.9 Dry = 0.78 / Wet = 0.77 Dry = 0.78 / Wet = 0.77
ASTM F1515 Resistance to Light Pass Pass Pass
ASTM F925 Resistance to Chemicals (24 hrs and 5 min) Good Good Good
ASTM F4060 Taber Abrasion Good Good Good
ASTM F1514 Resistance to Heat Pass Pass Pass
ASTM D2859 Pill Flammability Pass Pass Pass
ASTM E303 Skid Resistance Dry = 99 / Wet = 99 Dry = 99 / Wet = 99 Dry = 99 / Wet = 99
ASTM F2117 Vertical Rebound 0.997 0.99 0.95
ASTM F2157 Deformation 2.0 mm 1.0 mm 0.9 mm
ASTM F2569 Force Reduction 0.126 0.307 0.331
………………………………………………………………………………………………..……………………………………………………………………………………………………………………………
3
© 2017 SCSglobalServices.com
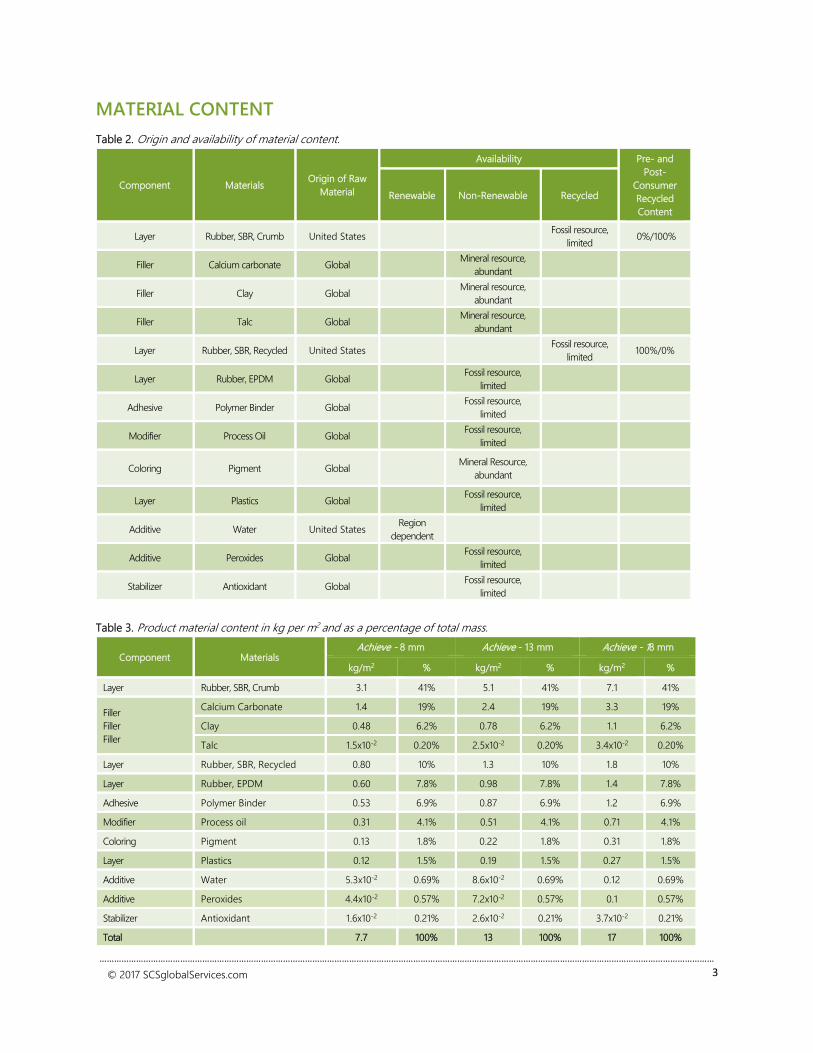
MATERIAL CONTENT Table 2. Origin and availability of material content.
Component Materials Origin of Raw Material
Availability Pre- and Post-
Consumer Recycled Content
Renewable Non-Renewable Recycled
Layer Rubber, SBR, Crumb United States Fossil resource, limited 0%/100%
Filler Calcium carbonate Global Mineral resource, abundant
Filler Clay Global Mineral resource, abundant
Filler Talc Global Mineral resource, abundant
Layer Rubber, SBR, Recycled United States Fossil resource, limited 100%/0%
Layer Rubber, EPDM Global Fossil resource, limited
Adhesive Polymer Binder Global Fossil resource, limited
Modifier Process Oil Global Fossil resource, limited
Coloring Pigment Global Mineral Resource, abundant
Layer Plastics Global Fossil resource, limited
Additive Water United States Region dependent
Additive Peroxides Global Fossil resource, limited
Stabilizer Antioxidant Global Fossil resource, limited
Table 3. Product material content in kg per m2 and as a percentage of total mass.
Component Materials Achieve - 8 mm Achieve - 13 mm Achieve - 18 mm
kg/m2 % kg/m2 % kg/m2 %
Layer Rubber, SBR, Crumb 3.1 41% 5.1 41% 7.1 41%
Filler Filler Filler
Calcium Carbonate 1.4 19% 2.4 19% 3.3 19%
Clay 0.48 6.2% 0.78 6.2% 1.1 6.2%
Talc 1.5x10⁻² 0.20% 2.5x10⁻² 0.20% 3.4x10⁻² 0.20%
Layer Rubber, SBR, Recycled 0.80 10% 1.3 10% 1.8 10%
Layer Rubber, EPDM 0.60 7.8% 0.98 7.8% 1.4 7.8%
Adhesive Polymer Binder 0.53 6.9% 0.87 6.9% 1.2 6.9%
Modifier Process oil 0.31 4.1% 0.51 4.1% 0.71 4.1%
Coloring Pigment 0.13 1.8% 0.22 1.8% 0.31 1.8%
Layer Plastics 0.12 1.5% 0.19 1.5% 0.27 1.5%
Additive Water 5.3x10⁻² 0.69% 8.6x10⁻² 0.69% 0.12 0.69%
Additive Peroxides 4.4x10⁻² 0.57% 7.2x10⁻² 0.57% 0.1 0.57%
Stabilizer Antioxidant 1.6x10⁻² 0.21% 2.6x10⁻² 0.21% 3.7x10⁻² 0.21%
Total 7.7 100% 13 100% 17 100%
………………………………………………………………………………………………..……………………………………………………………………………………………………………………………
4
© 2017 SCSglobalServices.com
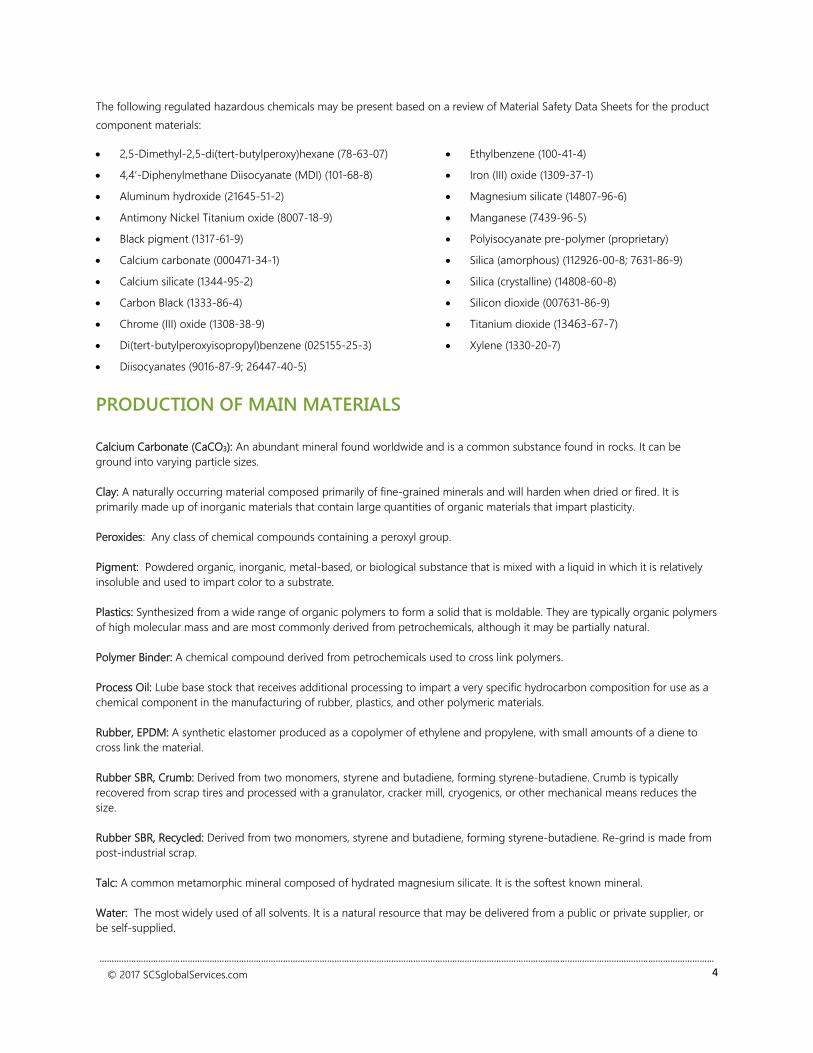
The following regulated hazardous chemicals may be present based on a review of Material Safety Data Sheets for the product component materials:
2,5-Dimethyl-2,5-di(tert-butylperoxy)hexane (78-63-07)
4,4’-Diphenylmethane Diisocyanate (MDI) (101-68-8)
Aluminum hydroxide (21645-51-2)
Antimony Nickel Titanium oxide (8007-18-9)
Black pigment (1317-61-9)
Calcium carbonate (000471-34-1)
Calcium silicate (1344-95-2)
Carbon Black (1333-86-4)
Chrome (III) oxide (1308-38-9)
Di(tert-butylperoxyisopropyl)benzene (025155-25-3)
Diisocyanates (9016-87-9; 26447-40-5)
Ethylbenzene (100-41-4)
Iron (III) oxide (1309-37-1)
Magnesium silicate (14807-96-6)
Manganese (7439-96-5)
Polyisocyanate pre-polymer (proprietary)
Silica (amorphous) (112926-00-8; 7631-86-9)
Silica (crystalline) (14808-60-8)
Silicon dioxide (007631-86-9)
Titanium dioxide (13463-67-7)
Xylene (1330-20-7)
PRODUCTION OF MAIN MATERIALS Calcium Carbonate (CaCO3): An abundant mineral found worldwide and is a common substance found in rocks. It can be ground into varying particle sizes. Clay: A naturally occurring material composed primarily of fine-grained minerals and will harden when dried or fired. It is primarily made up of inorganic materials that contain large quantities of organic materials that impart plasticity. Peroxides: Any class of chemical compounds containing a peroxyl group. Pigment: Powdered organic, inorganic, metal-based, or biological substance that is mixed with a liquid in which it is relatively insoluble and used to impart color to a substrate. Plastics: Synthesized from a wide range of organic polymers to form a solid that is moldable. They are typically organic polymers of high molecular mass and are most commonly derived from petrochemicals, although it may be partially natural. Polymer Binder: A chemical compound derived from petrochemicals used to cross link polymers. Process Oil: Lube base stock that receives additional processing to impart a very specific hydrocarbon composition for use as a chemical component in the manufacturing of rubber, plastics, and other polymeric materials. Rubber, EPDM: A synthetic elastomer produced as a copolymer of ethylene and propylene, with small amounts of a diene to cross link the material. Rubber SBR, Crumb: Derived from two monomers, styrene and butadiene, forming styrene-butadiene. Crumb is typically recovered from scrap tires and processed with a granulator, cracker mill, cryogenics, or other mechanical means reduces the size. Rubber SBR, Recycled: Derived from two monomers, styrene and butadiene, forming styrene-butadiene. Re-grind is made from post-industrial scrap. Talc: A common metamorphic mineral composed of hydrated magnesium silicate. It is the softest known mineral. Water: The most widely used of all solvents. It is a natural resource that may be delivered from a public or private supplier, or be self-supplied.

Environmental Product Declaration PLAE, Achieve Rubber Flooring
………………………………………………………………………………………………..……………………………………………………………………………………………………………………………
5
© 2017 SCSglobalServices.com
PRODUCT CHARACTERISTICS Table 4. Product characteristics for PLAE Achieve rubber sheet flooring.
Characteristics Average Value Unit Minimum Value Maximum Value
Product Thickness 13.0 (0.512) mm (inch) 8.0 (0.315) 18.0 (0.709)
Wear Layer Thickness 3.0 (0.118) mm (inch) 3.0 (0.118) 3.0 (0.118)
Product Weight 12,401 (41) g/m2 (oz/ft2) 7,324 (24) 17,626 (58)
Product Form Rolls Width: 1,219 (48) mm (inch) 1,219 (48) 1,219 (48)
Length: 7,620 (300) mm (inch) 7,620 (300) 7,620 (300)
VOC Emissions Test Method: FloorScore® (CA Specification 01350)
ADDITIONAL ENVIRONMENTAL INFORMATION All PLAE™ salvages, overages, and old material can be packaged and shipped back at the owner’s expense to PLAE’s PLAE-UP™ Reclamation Program in Lancaster, Pennsylvania. Materials accepted into the PLAE-UP program will be sorted, shredded, cleaned and ground for the next generation of recycled rubber flooring, underlayment, and industrial products. Similarly, all of PLAE’s rubber manufacturing scrap is collected and reground to be used in future flooring. For more information regarding the PLAE-UP program, visit http://plae.us/our-story/.
Environmental Product Declaration PLAE, Achieve Rubber Flooring
………………………………………………………………………………………………..……………………………………………………………………………………………………………………………
6
© 2017 SCSglobalServices.com
LIFE CYCLE ASSESSMENT A cradle to grave life cycle assessment (LCA) was completed for this product group in accordance with ISO 14040, ISO 14044, ISO 21930, and Product Category Rule for Environmental Product Declarations for Flooring: Carpet, Resilient, Laminate, Ceramic, Wood (Version 2).
FUNCTIONAL UNIT The functional unit is, according to the PCR, the total impact for the expected life of the building (60 years). But the service life is dependent on the product lifetime, which is 15 years in this case. The PCR consequently requires separate reporting of LCA results A) for 1 m2 of floor covering - extraction/processing, manufacturing, delivery and installation and end of life, B) the average 1- year use stage, and C) for the 60 year life of the building as combined using A) and B), calculated from the reference service life (RSL) of the product.
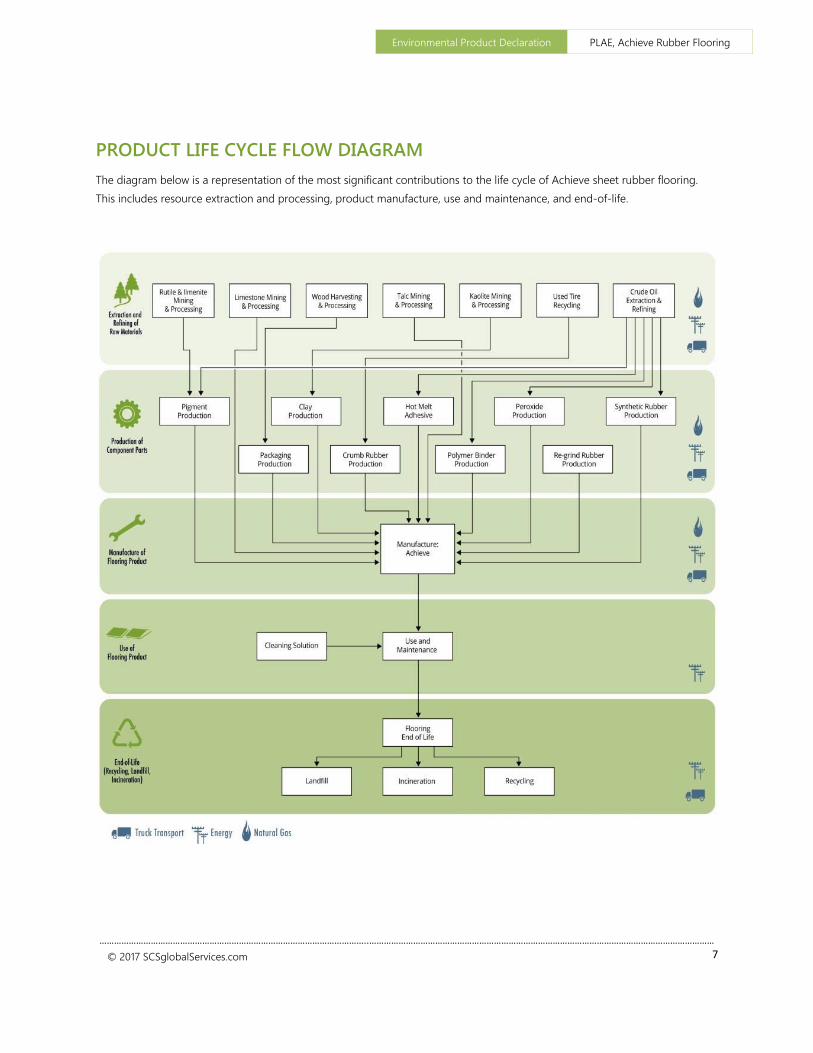
PRODUCT LIFE CYCLE FLOW DIAGRAM The diagram below is a representation of the most significant contributions to the life cycle of Achieve sheet rubber flooring. This includes resource extraction and processing, product manufacture, use and maintenance, and end-of-life.
Environmental Product Declaration PLAE, Achieve Rubber Flooring
………………………………………………………………………………………………..……………………………………………………………………………………………………………………………
7
© 2017 SCSglobalServices.com
PRODUCT LIFE CYCLE FLOW DIAGRAM The diagram below is a representation of the most significant contributions to the life cycle of Achieve sheet rubber flooring. This includes resource extraction and processing, product manufacture, use and maintenance, and end-of-life.
Environmental Product Declaration PLAE, Achieve Rubber Flooring
………………………………………………………………………………………………..……………………………………………………………………………………………………………………………
8
© 2017 SCSglobalServices.com
LIFE CYCLE ASSESSMENT STAGES AND REPORTED INFORMATION Sourcing/Extraction Stage (raw material acquisition)
This stage includes extraction of virgin materials and reclamation of non-virgin feedstock. Resource use and emissions associated with both extraction of the raw materials and manufacture of flooring components are included.
Manufacturing Stage
Achieve flooring is manufactured at an ISO 9001 facility in the United States.
This stage includes all the relevant manufacturing processes and flows, including packaging. Production of capital goods, infrastructure, production of manufacturing equipment, and personnel-related activities are not included.
Delivery and Installation Stage
Delivery
This stage includes the delivery of the flooring product to the point of installation. Modeling used in the life cycle assessment assumed an estimated distribution distance to point of sale of 2,700 miles (4,370 km) by diesel truck and 153 miles (246 km) by ocean freighter.
Installation
Achieve flooring is installed with an adhesive. The manufacturer recommends use of a zero-VOC, low odor, one-component urethane adhesive. The recommended application rate is 0.119 gallons per square meter (0.452 kg/m2). Waste
Waste generated during product installation can be disposed of in a landfill or incinerated.
Packaging
Table 5. Packaging material for the PLAE Achieve rubber sheet flooring. Results are shown per 1 m2 of flooring.
Material Amount (kg) Percent of Total
Corrugated board 0.11 27%
Packaging film (LDPE) 0.29 73%
Use Stage
Cleaning and maintenance
Achieve flooring can be cleaned with a mild detergent and water. The manufacturer recommends Diversey Profi diluted with water. The recommended product cleaning and maintenance are summarized in Table 5.
Table 6. Cleaning and maintenance for PLAE Achieve rubber sheet flooring.
Cleaning Process Cleaning and Maintenance Frequency
Frequency over 15 year Reference Service Life (RSL) Energy & Resource Use
Initial Cleaning Once per product lifetime Once per 15 year RSL Detergent; water
Daily Cleaning Daily 5,475 times over 15 year RSL Detergent; water
Heavy Soil and Restorative Cleaning As needed depending on use Dependent on use Detergent; water
Environmental Product Declaration PLAE, Achieve Rubber Flooring
………………………………………………………………………………………………..……………………………………………………………………………………………………………………………
9
© 2017 SCSglobalServices.com
End‐of‐Life Stage
Recycling, reuse, or repurpose
Data for estimation of recycling rates for the product and packaging are taken from the US Environmental Protection Agency’s Municipal Solid Waste Report, respectively. For product materials, it is assumed that 4% are recycled, while recycling rates for packaging materials vary, depending on waste material type. Disposal
For disposal of product materials which are not recycled, it is assumed that 20% are incinerated and 80% go to a landfill. Transportation of waste materials at end of life assumes a 20 mile average distance to disposal, consistent with assumptions used in the US EPA WARM model.
LIFE CYCLE INVENTORY In accordance with ISO 21930, the following aggregated inventory flows are included in the LCA, in addition to the LCIA and
inventory flow requirements specified by the PCR:
Use of renewable material resources
Consumption of freshwater
Hazardous Waste
Non-hazardous Waste
All results are calculated using the SimaPro 8.0 model using primary and secondary inventory data. Classification for
Use of Renewable Material Resources is based on review of elementary flows and resources considered renewable on a human
time scale. Elementary flows related to use of wood, minerals, and land occupation were not included. Water consumption is
also not included as this is reported separately. Based on this classification process, no renewable material resources are
estimated for the product system under consideration. Energy resource use results for the flooring product system are also
presented below.
Table 7. Results for aggregated inventory flows for the Achieve rubber flooring products. Results shown per 1 m2 of flooring.
Impact Category Units Achieve - 8 mm Achieve - 13 mm Achieve - 18 mm
1-yr 60-yr 1-yr 60-yr 1-yr 60-yr
Freshwater consumption m3 3,000 12,000 3,300 13,000 3,600 14,000
Hazardous wastes kg 1.8x10⁻⁴ 7.1x10⁻⁴ 2.8x10⁻⁴ 1.1x10⁻³ 3.9x10⁻⁴ 1.6x10⁻³
Non-Hazardous wastes kg 11 45 18 72 25 100

Environmental Product Declaration PLAE, Achieve Rubber Flooring
………………………………………………………………………………………………..……………………………………………………………………………………………………………………………
10
© 2017 SCSglobalServices.com
Table 8. Range in life cycle energy use results for 1 m2 of Achieve rubber floor covering maintained for 1 year.
Energy Use Achieve - 8 mm Achieve - 13 mm Achieve - 18 mm
Non-Renewable Energy Use (MJ) 370 92% 530 92% 710 92%
Coal 47 12% 61 11% 78 10%
Natural Gas 110 27% 150 25% 190 24%
Crude Oil 210 53% 320 56% 440 58%
Biomass 5.1x10⁻³ 0.001% 6.6x10⁻³ 0.001% 8.1x10⁻³ 0.001%
Nuclear Energy Use (MJ eq.) 26 6.4% 36 6.2% 47 6.1%
Renewable Energy Use (MJ) 7.9 1.9% 11 1.9% 14 1.9%
Hydropower 3.2 0.79% 4.6 0.80% 6.2 0.80%
Wind 0.36 0.09% 0.55 0.10% 0.77 0.10%
Solar 7.7x10⁻³ 0.002% 1.2x10⁻² 0.002% 1.7x10⁻² 0.002%
Geothermal 1.0x10⁻³ 0.00% 1.6x10⁻³ 0.00% 2.3x10⁻³ 0.00%
Biomass 4.3 1.1% 5.8 1.0% 7.3 1.0%
Total Primary Energy (MJ) 400 100% 580 100% 770 100%
Table 9. Range in life cycle energy use results for 1 m2 of Achieve rubber floor covering maintained for 60 years.
Energy Use Achieve - 8 mm Achieve - 13 mm Achieve - 18 mm
Non-Renewable Energy Use (MJ) 1,500 92% 2,100 92% 2,800 92%
Coal 190 12% 250 11% 310 10%
Natural Gas 450 27% 590 25% 740 24%
Crude Oil 850 53% 1,300 56% 1,800 58%
Biomass 9.1x10⁻² 0.006% 9.7x10⁻² 0.004% 0.10 0.003%
Nuclear Energy Use (MJ) 100 6.4% 140 6.2% 190 6.1%
Renewable Energy Use (MJ) 32 2.0% 44 1.9% 58 1.9%
Hydropower 13 0.79% 18 0.80% 25 0.80%
Wind 1.4 0.09% 2.2 0.10% 3.1 0.10%
Solar 3.1x10⁻² 0.002% 4.9x10⁻² 0.002% 6.8x10⁻² 0.002%
Geothermal 4.0x10⁻³ 0.00% 6.5x10⁻³ 0.00% 9.3x10⁻³ 0.00%
Biomass 18 1.1% 23 1.0% 30 1.0%
Total Primary Energy (MJ) 1,600 100% 2,300 100% 3,100 100%
Environmental Product Declaration PLAE, Achieve Rubber Flooring
………………………………………………………………………………………………..……………………………………………………………………………………………………………………………
11
© 2017 SCSglobalServices.com
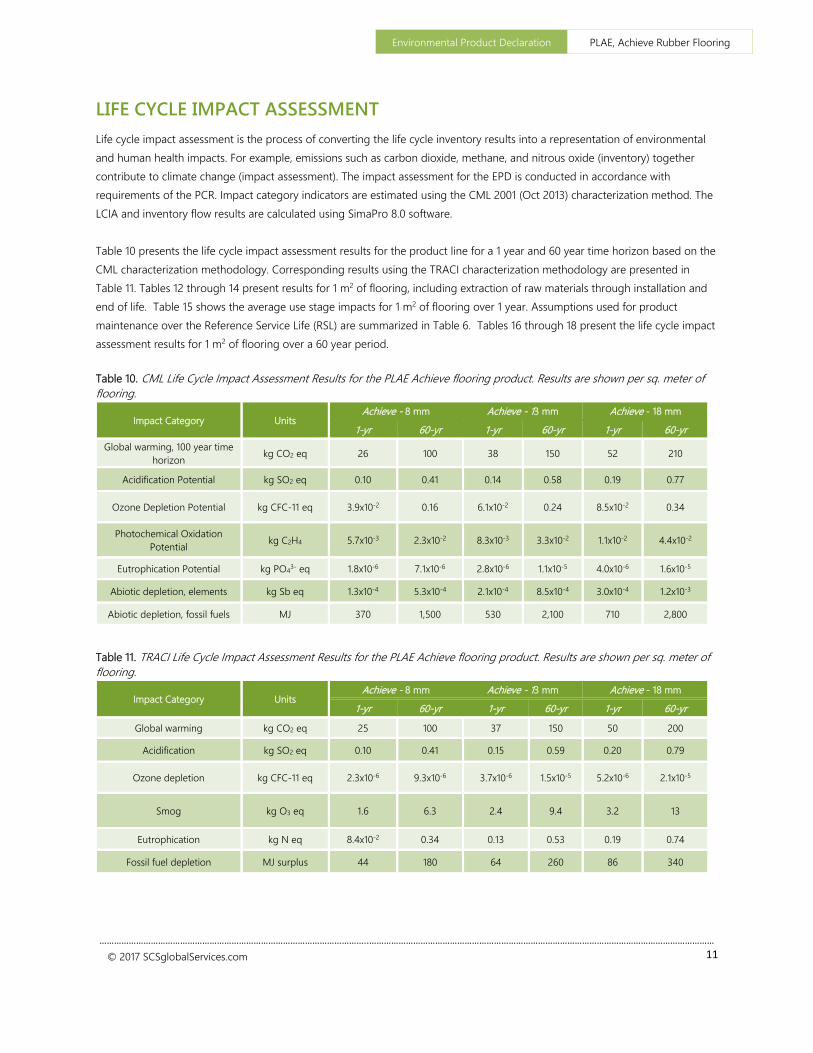
LIFE CYCLE IMPACT ASSESSMENT Life cycle impact assessment is the process of converting the life cycle inventory results into a representation of environmental and human health impacts. For example, emissions such as carbon dioxide, methane, and nitrous oxide (inventory) together contribute to climate change (impact assessment). The impact assessment for the EPD is conducted in accordance with requirements of the PCR. Impact category indicators are estimated using the CML 2001 (Oct 2013) characterization method. The LCIA and inventory flow results are calculated using SimaPro 8.0 software. Table 10 presents the life cycle impact assessment results for the product line for a 1 year and 60 year time horizon based on the CML characterization methodology. Corresponding results using the TRACI characterization methodology are presented in Table 11. Tables 12 through 14 present results for 1 m2 of flooring, including extraction of raw materials through installation and end of life. Table 15 shows the average use stage impacts for 1 m2 of flooring over 1 year. Assumptions used for product maintenance over the Reference Service Life (RSL) are summarized in Table 6. Tables 16 through 18 present the life cycle impact assessment results for 1 m2 of flooring over a 60 year period. Table 10. CML Life Cycle Impact Assessment Results for the PLAE Achieve flooring product. Results are shown per sq. meter of flooring.
Impact Category Units Achieve - 8 mm Achieve - 13 mm Achieve - 18 mm
1-yr 60-yr 1-yr 60-yr 1-yr 60-yr Global warming, 100 year time
horizon kg CO2 eq 26 100 38 150 52 210
Acidification Potential kg SO2 eq 0.10 0.41 0.14 0.58 0.19 0.77
Ozone Depletion Potential kg CFC-11 eq 3.9x10⁻² 0.16 6.1x10⁻² 0.24 8.5x10⁻² 0.34
Photochemical Oxidation Potential kg C2H4 5.7x10⁻³ 2.3x10⁻² 8.3x10⁻³ 3.3x10⁻² 1.1x10⁻² 4.4x10⁻²
Eutrophication Potential kg PO43- eq 1.8x10⁻⁶ 7.1x10⁻⁶ 2.8x10⁻⁶ 1.1x10⁻⁵ 4.0x10⁻⁶ 1.6x10⁻⁵
Abiotic depletion, elements kg Sb eq 1.3x10⁻⁴ 5.3x10⁻⁴ 2.1x10⁻⁴ 8.5x10⁻⁴ 3.0x10⁻⁴ 1.2x10⁻³
Abiotic depletion, fossil fuels MJ 370 1,500 530 2,100 710 2,800
Table 11. TRACI Life Cycle Impact Assessment Results for the PLAE Achieve flooring product. Results are shown per sq. meter of flooring.
Impact Category Units Achieve - 8 mm Achieve - 13 mm Achieve - 18 mm
1-yr 60-yr 1-yr 60-yr 1-yr 60-yr
Global warming kg CO2 eq 25 100 37 150 50 200
Acidification kg SO2 eq 0.10 0.41 0.15 0.59 0.20 0.79
Ozone depletion kg CFC-11 eq 2.3x10⁻⁶ 9.3x10⁻⁶ 3.7x10⁻⁶ 1.5x10⁻⁵ 5.2x10⁻⁶ 2.1x10⁻⁵
Smog kg O3 eq 1.6 6.3 2.4 9.4 3.2 13
Eutrophication kg N eq 8.4x10⁻² 0.34 0.13 0.53 0.19 0.74
Fossil fuel depletion MJ surplus 44 180 64 260 86 340
Environmental Product Declaration PLAE, Achieve Rubber Flooring
………………………………………………………………………………………………..……………………………………………………………………………………………………………………………
12
© 2017 SCSglobalServices.com
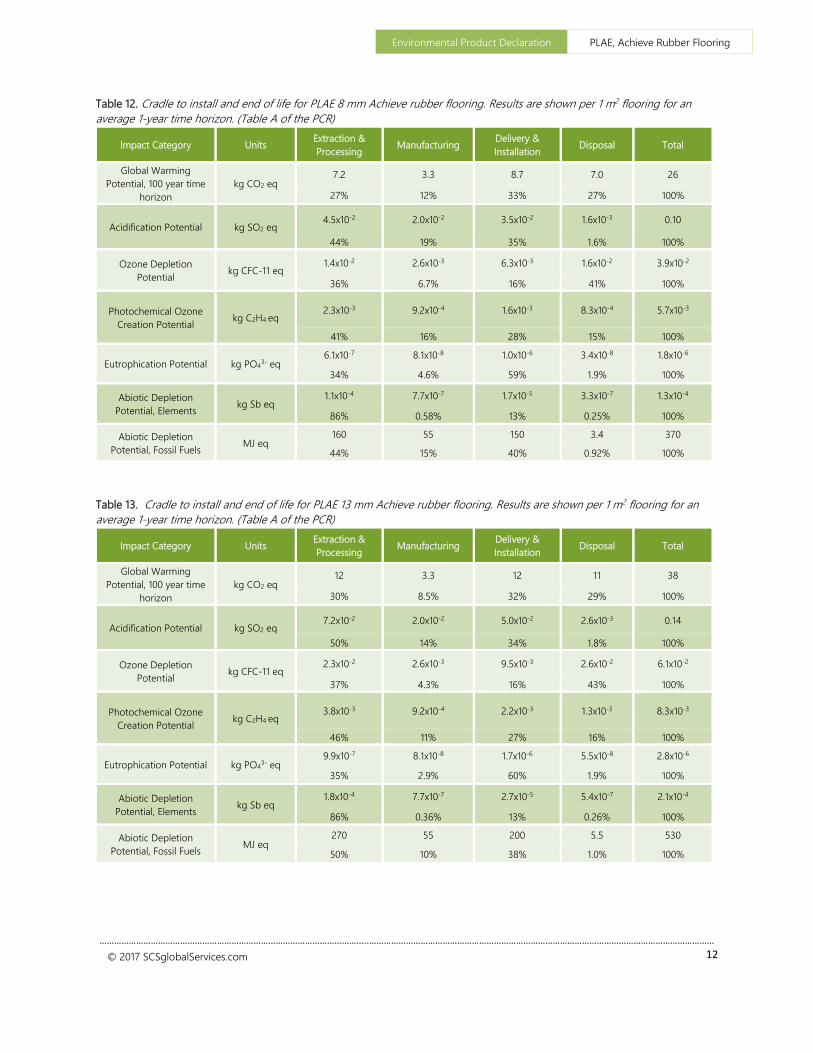
Table 12. Cradle to install and end of life for PLAE 8 mm Achieve rubber flooring. Results are shown per 1 m2 flooring for an average 1-year time horizon. (Table A of the PCR)
Impact Category Units Extraction & Processing Manufacturing Delivery &
Installation Disposal Total
Global Warming Potential, 100 year time
horizon kg CO2 eq
7.2 3.3 8.7 7.0 26
27% 12% 33% 27% 100%
Acidification Potential kg SO2 eq 4.5x10⁻² 2.0x10⁻² 3.5x10⁻² 1.6x10⁻³ 0.10
44% 19% 35% 1.6% 100%
Ozone Depletion Potential kg CFC-11 eq
1.4x10⁻² 2.6x10⁻³ 6.3x10⁻³ 1.6x10⁻² 3.9x10⁻²
36% 6.7% 16% 41% 100%
Photochemical Ozone Creation Potential kg C2H4 eq
2.3x10⁻³ 9.2x10⁻⁴ 1.6x10⁻³ 8.3x10⁻⁴ 5.7x10⁻³
41% 16% 28% 15% 100%
Eutrophication Potential kg PO43- eq 6.1x10⁻⁷ 8.1x10⁻⁸ 1.0x10⁻⁶ 3.4x10⁻⁸ 1.8x10⁻⁶
34% 4.6% 59% 1.9% 100%
Abiotic Depletion Potential, Elements kg Sb eq
1.1x10⁻⁴ 7.7x10⁻⁷ 1.7x10⁻⁵ 3.3x10⁻⁷ 1.3x10⁻⁴
86% 0.58% 13% 0.25% 100%
Abiotic Depletion Potential, Fossil Fuels MJ eq
160 55 150 3.4 370
44% 15% 40% 0.92% 100%
Table 13. Cradle to install and end of life for PLAE 13 mm Achieve rubber flooring. Results are shown per 1 m2 flooring for an average 1-year time horizon. (Table A of the PCR)
Impact Category Units Extraction & Processing Manufacturing Delivery &
Installation Disposal Total
Global Warming Potential, 100 year time
horizon kg CO2 eq
12 3.3 12 11 38
30% 8.5% 32% 29% 100%
Acidification Potential kg SO2 eq 7.2x10⁻² 2.0x10⁻² 5.0x10⁻² 2.6x10⁻³ 0.14
50% 14% 34% 1.8% 100%
Ozone Depletion Potential kg CFC-11 eq
2.3x10⁻² 2.6x10⁻³ 9.5x10⁻³ 2.6x10⁻² 6.1x10⁻²
37% 4.3% 16% 43% 100%
Photochemical Ozone Creation Potential kg C2H4 eq
3.8x10⁻³ 9.2x10⁻⁴ 2.2x10⁻³ 1.3x10⁻³ 8.3x10⁻³
46% 11% 27% 16% 100%
Eutrophication Potential kg PO43- eq 9.9x10⁻⁷ 8.1x10⁻⁸ 1.7x10⁻⁶ 5.5x10⁻⁸ 2.8x10⁻⁶
35% 2.9% 60% 1.9% 100%
Abiotic Depletion Potential, Elements kg Sb eq
1.8x10⁻⁴ 7.7x10⁻⁷ 2.7x10⁻⁵ 5.4x10⁻⁷ 2.1x10⁻⁴
86% 0.36% 13% 0.26% 100%
Abiotic Depletion Potential, Fossil Fuels MJ eq
270 55 200 5.5 530
50% 10% 38% 1.0% 100%
Environmental Product Declaration PLAE, Achieve Rubber Flooring
………………………………………………………………………………………………..……………………………………………………………………………………………………………………………
13
© 2017 SCSglobalServices.com
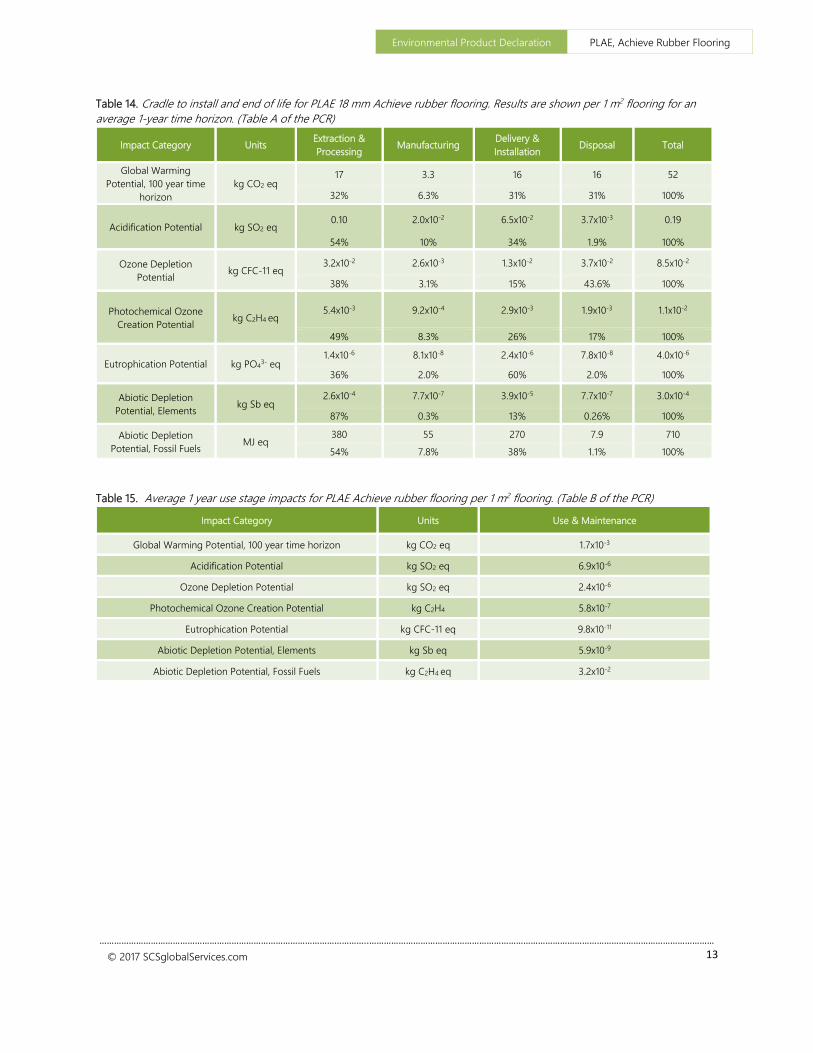
Table 14. Cradle to install and end of life for PLAE 18 mm Achieve rubber flooring. Results are shown per 1 m2 flooring for an average 1-year time horizon. (Table A of the PCR)
Impact Category Units Extraction & Processing Manufacturing Delivery &
Installation Disposal Total
Global Warming Potential, 100 year time
horizon kg CO2 eq
17 3.3 16 16 52
32% 6.3% 31% 31% 100%
Acidification Potential kg SO2 eq 0.10 2.0x10⁻² 6.5x10⁻² 3.7x10⁻³ 0.19
54% 10% 34% 1.9% 100%
Ozone Depletion Potential kg CFC-11 eq
3.2x10⁻² 2.6x10⁻³ 1.3x10⁻² 3.7x10⁻² 8.5x10⁻²
38% 3.1% 15% 43.6% 100%
Photochemical Ozone Creation Potential kg C2H4 eq
5.4x10⁻³ 9.2x10⁻⁴ 2.9x10⁻³ 1.9x10⁻³ 1.1x10⁻²
49% 8.3% 26% 17% 100%
Eutrophication Potential kg PO43- eq 1.4x10⁻⁶ 8.1x10⁻⁸ 2.4x10⁻⁶ 7.8x10⁻⁸ 4.0x10⁻⁶
36% 2.0% 60% 2.0% 100%
Abiotic Depletion Potential, Elements kg Sb eq
2.6x10⁻⁴ 7.7x10⁻⁷ 3.9x10⁻⁵ 7.7x10⁻⁷ 3.0x10⁻⁴
87% 0.3% 13% 0.26% 100%
Abiotic Depletion Potential, Fossil Fuels MJ eq
380 55 270 7.9 710 54% 7.8% 38% 1.1% 100%
Table 15. Average 1 year use stage impacts for PLAE Achieve rubber flooring per 1 m2 flooring. (Table B of the PCR)
Impact Category Units Use & Maintenance
Global Warming Potential, 100 year time horizon kg CO2 eq 1.7x10⁻³
Acidification Potential kg SO2 eq 6.9x10⁻⁶
Ozone Depletion Potential kg SO2 eq 2.4x10⁻⁶
Photochemical Ozone Creation Potential kg C2H4 5.8x10⁻⁷
Eutrophication Potential kg CFC-11 eq 9.8x10⁻¹¹
Abiotic Depletion Potential, Elements kg Sb eq 5.9x10⁻⁹
Abiotic Depletion Potential, Fossil Fuels kg C2H4 eq 3.2x10⁻²
Environmental Product Declaration PLAE, Achieve Rubber Flooring
………………………………………………………………………………………………..……………………………………………………………………………………………………………………………
14
© 2017 SCSglobalServices.com
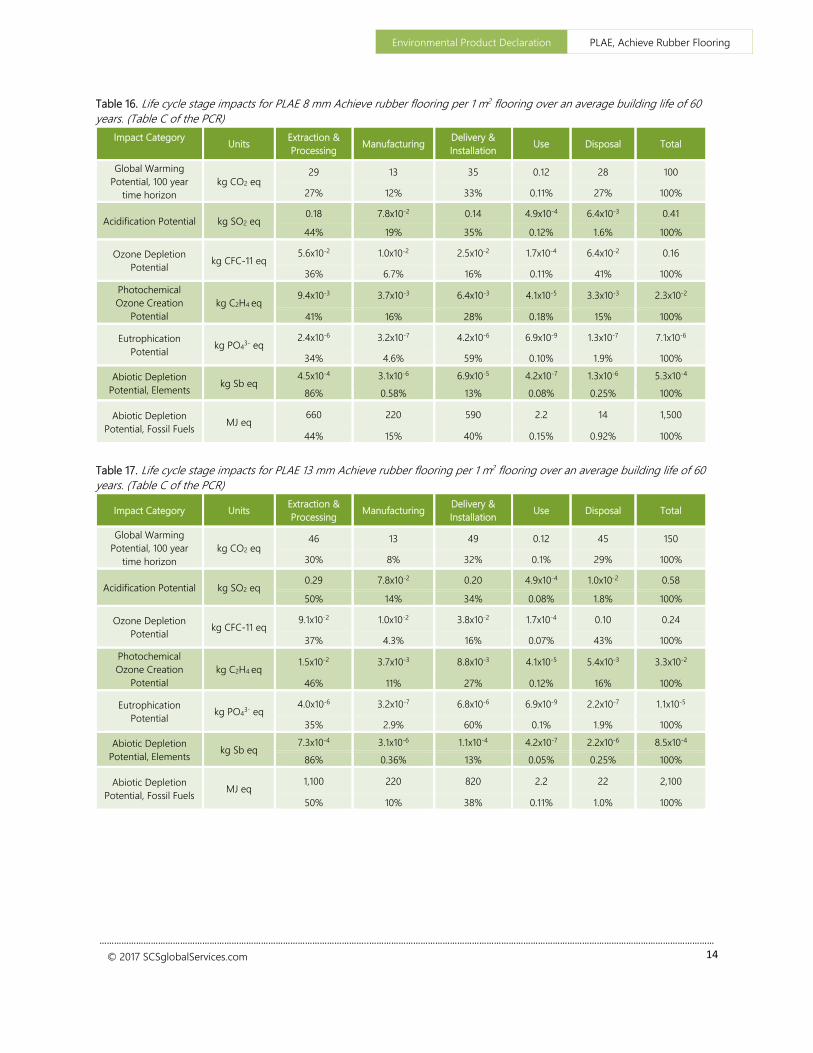
Table 16. Life cycle stage impacts for PLAE 8 mm Achieve rubber flooring per 1 m2 flooring over an average building life of 60 years. (Table C of the PCR)
Impact Category Units Extraction &
Processing Manufacturing Delivery & Installation Use Disposal Total
Global Warming Potential, 100 year
time horizon kg CO2 eq
29 13 35 0.12 28 100
27% 12% 33% 0.11% 27% 100%
Acidification Potential kg SO2 eq 0.18 7.8x10⁻² 0.14 4.9x10⁻⁴ 6.4x10⁻³ 0.41
44% 19% 35% 0.12% 1.6% 100%
Ozone Depletion Potential kg CFC-11 eq
5.6x10⁻² 1.0x10⁻² 2.5x10⁻² 1.7x10⁻⁴ 6.4x10⁻² 0.16
36% 6.7% 16% 0.11% 41% 100% Photochemical Ozone Creation
Potential kg C2H4 eq
9.4x10⁻³ 3.7x10⁻³ 6.4x10⁻³ 4.1x10⁻⁵ 3.3x10⁻³ 2.3x10⁻²
41% 16% 28% 0.18% 15% 100%
Eutrophication Potential kg PO43- eq
2.4x10⁻⁶ 3.2x10⁻⁷ 4.2x10⁻⁶ 6.9x10⁻⁹ 1.3x10⁻⁷ 7.1x10⁻⁶
34% 4.6% 59% 0.10% 1.9% 100%
Abiotic Depletion Potential, Elements kg Sb eq
4.5x10⁻⁴ 3.1x10⁻⁶ 6.9x10⁻⁵ 4.2x10⁻⁷ 1.3x10⁻⁶ 5.3x10⁻⁴ 86% 0.58% 13% 0.08% 0.25% 100%
Abiotic Depletion Potential, Fossil Fuels MJ eq
660 220 590 2.2 14 1,500
44% 15% 40% 0.15% 0.92% 100%
Table 17. Life cycle stage impacts for PLAE 13 mm Achieve rubber flooring per 1 m2 flooring over an average building life of 60 years. (Table C of the PCR)
Impact Category Units Extraction & Processing Manufacturing Delivery &
Installation Use Disposal Total
Global Warming Potential, 100 year
time horizon kg CO2 eq
46 13 49 0.12 45 150
30% 8% 32% 0.1% 29% 100%
Acidification Potential kg SO2 eq 0.29 7.8x10⁻² 0.20 4.9x10⁻⁴ 1.0x10⁻² 0.58
50% 14% 34% 0.08% 1.8% 100%
Ozone Depletion Potential kg CFC-11 eq
9.1x10⁻² 1.0x10⁻² 3.8x10⁻² 1.7x10⁻⁴ 0.10 0.24
37% 4.3% 16% 0.07% 43% 100% Photochemical Ozone Creation
Potential kg C2H4 eq
1.5x10⁻² 3.7x10⁻³ 8.8x10⁻³ 4.1x10⁻⁵ 5.4x10⁻³ 3.3x10⁻²
46% 11% 27% 0.12% 16% 100%
Eutrophication Potential kg PO43- eq
4.0x10⁻⁶ 3.2x10⁻⁷ 6.8x10⁻⁶ 6.9x10⁻⁹ 2.2x10⁻⁷ 1.1x10⁻⁵
35% 2.9% 60% 0.1% 1.9% 100%
Abiotic Depletion Potential, Elements kg Sb eq
7.3x10⁻⁴ 3.1x10⁻⁶ 1.1x10⁻⁴ 4.2x10⁻⁷ 2.2x10⁻⁶ 8.5x10⁻⁴ 86% 0.36% 13% 0.05% 0.25% 100%
Abiotic Depletion Potential, Fossil Fuels MJ eq
1,100 220 820 2.2 22 2,100
50% 10% 38% 0.11% 1.0% 100%
Environmental Product Declaration PLAE, Achieve Rubber Flooring
………………………………………………………………………………………………..……………………………………………………………………………………………………………………………
15
© 2017 SCSglobalServices.com
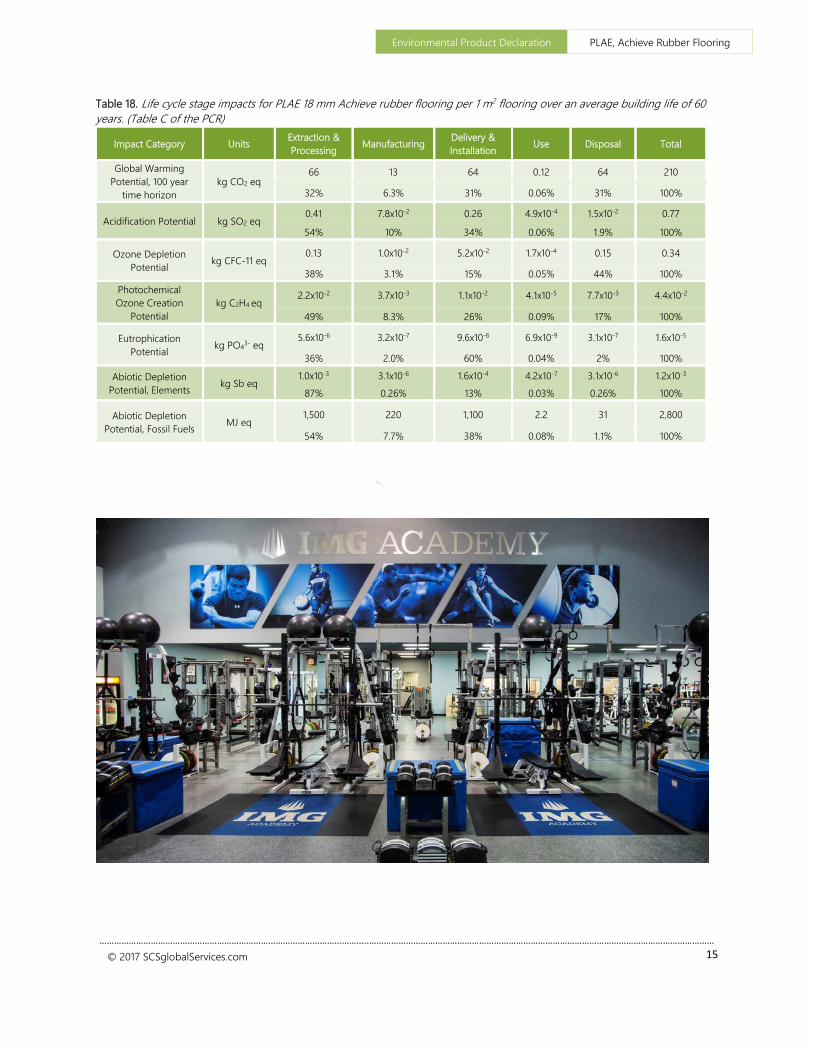
Table 18. Life cycle stage impacts for PLAE 18 mm Achieve rubber flooring per 1 m2 flooring over an average building life of 60 years. (Table C of the PCR)
Impact Category Units Extraction & Processing Manufacturing Delivery &
Installation Use Disposal Total
Global Warming Potential, 100 year
time horizon kg CO2 eq
66 13 64 0.12 64 210
32% 6.3% 31% 0.06% 31% 100%
Acidification Potential kg SO2 eq 0.41 7.8x10⁻² 0.26 4.9x10⁻⁴ 1.5x10⁻² 0.77
54% 10% 34% 0.06% 1.9% 100%
Ozone Depletion Potential kg CFC-11 eq
0.13 1.0x10⁻² 5.2x10⁻² 1.7x10⁻⁴ 0.15 0.34
38% 3.1% 15% 0.05% 44% 100% Photochemical Ozone Creation
Potential kg C2H4 eq
2.2x10⁻² 3.7x10⁻³ 1.1x10⁻² 4.1x10⁻⁵ 7.7x10⁻³ 4.4x10⁻²
49% 8.3% 26% 0.09% 17% 100%
Eutrophication Potential kg PO43- eq
5.6x10⁻⁶ 3.2x10⁻⁷ 9.6x10⁻⁶ 6.9x10⁻⁹ 3.1x10⁻⁷ 1.6x10⁻⁵
36% 2.0% 60% 0.04% 2% 100%
Abiotic Depletion Potential, Elements kg Sb eq
1.0x10⁻³ 3.1x10⁻⁶ 1.6x10⁻⁴ 4.2x10⁻⁷ 3.1x10⁻⁶ 1.2x10⁻³ 87% 0.26% 13% 0.03% 0.26% 100%
Abiotic Depletion Potential, Fossil Fuels MJ eq
1,500 220 1,100 2.2 31 2,800
54% 7.7% 38% 0.08% 1.1% 100%
Environmental Product Declaration PLAE, Achieve Rubber Flooring
………………………………………………………………………………………………..……………………………………………………………………………………………………………………………
16
© 2017 SCSglobalServices.com
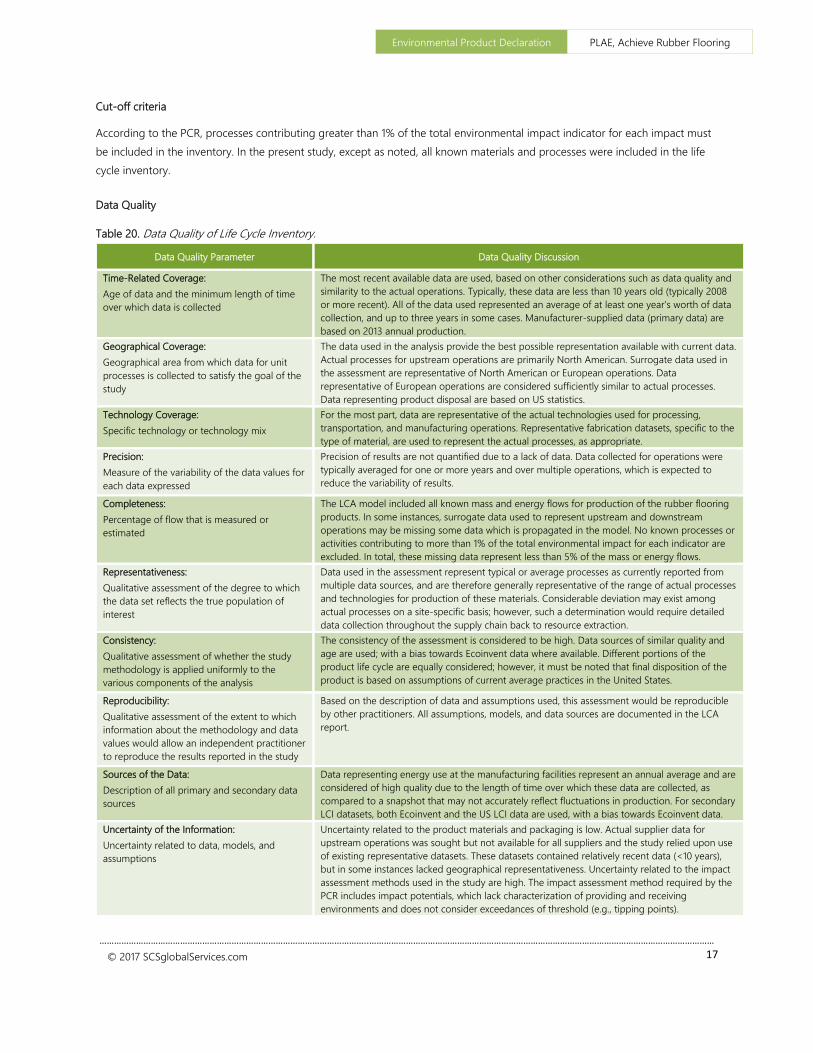
SUPPORTING TECHNICAL INFORMATION Unit processes are developed with SimaPro 8.0 software, drawing upon data from multiple sources. Primary data were provided by the manufacturer and some of its suppliers for their manufacturing processes. The primary sources of secondary LCI data are from the Ecoinvent and US LCI databases.
Data sources
Table 19. Data sources used for the LCA.
Component Material Description Material Dataset Data Source Publication Date
Product
Stabilizer Antioxidant Chemicals organic, at plant/kg/GLO Ecoinvent 2010
Filler Calcium Carbonate Limestone, milled, packed, at plant/kg/CH Ecoinvent 2010
Filler Clay Clay, at mine/kg/CH Ecoinvent 2010
Filler Talc Talc, in ground Primary data 2010
Coloring Pigment Titanium dioxide, production mix, at plant/kg/RER Ecoinvent 2010
Modifier Process Oil White mineral oil, at plant/kg/RNA US LCI 2012
Additive Peroxides Chemicals organic, at plant/kg/GLO Ecoinvent 2010
Layer Plastics Packaging film, LDPE, at plant/kg/RER Ecoinvent 2010
Adhesive Polymer Binder Methylene diphenyl diisocyanate, at plant/kg/RER Ecoinvent 2010
Layer Rubber, EPDM Synthetic rubber, at plant/kg/RER Ecoinvent 2010
Layer Rubber, SBR, Crumb SBR – Crumb, recycled Primary data 2014
Layer Rubber, SBR, Re-grind SBR – Regrind/Scrap, recycled Primary data 2014
Packaging
Packaging Corrugated board Corrugated board, recycling fibre, single wall, at plant/RER Ecoinvent 2007
Packaging Packaging film Packaging film, LDPE, at plant/RER Ecoinvent 2010
Transportation
Transport Truck Transport, combination truck, diesel powered/US US LCI 2008
Transport Ocean freighter Transport, transoceanic freight ship/OCE US LCI 2008
Allocation
Resource use at the Lancaster, PA manufacturing facility (e.g., water and energy) was allocated to the product based on the unit price as a fraction of the total facility sales. The PLAE Achieve rubber sheet flooring system includes recycled materials, which are allocated using the recycled content allocation method (also known as the 100-0 cut off method). Using the recycled content allocation approach, system inputs with recycled content do not receive any burden from the previous life cycle other than reprocessing of the waste material. At end of life, materials which are recycled leave the system boundaries with no additional burden. Impacts from transportation were allocated based on the mass of material and distance transported.
Environmental Product Declaration PLAE, Achieve Rubber Flooring
………………………………………………………………………………………………..……………………………………………………………………………………………………………………………
17
© 2017 SCSglobalServices.com
Cut-off criteria
According to the PCR, processes contributing greater than 1% of the total environmental impact indicator for each impact must be included in the inventory. In the present study, except as noted, all known materials and processes were included in the life cycle inventory.
Data Quality
Table 20. Data Quality of Life Cycle Inventory.
Data Quality Parameter Data Quality Discussion
Time-Related Coverage: Age of data and the minimum length of time over which data is collected
The most recent available data are used, based on other considerations such as data quality and similarity to the actual operations. Typically, these data are less than 10 years old (typically 2008 or more recent). All of the data used represented an average of at least one year’s worth of data collection, and up to three years in some cases. Manufacturer-supplied data (primary data) are based on 2013 annual production.
Geographical Coverage: Geographical area from which data for unit processes is collected to satisfy the goal of the study
The data used in the analysis provide the best possible representation available with current data. Actual processes for upstream operations are primarily North American. Surrogate data used in the assessment are representative of North American or European operations. Data representative of European operations are considered sufficiently similar to actual processes. Data representing product disposal are based on US statistics.
Technology Coverage: Specific technology or technology mix
For the most part, data are representative of the actual technologies used for processing, transportation, and manufacturing operations. Representative fabrication datasets, specific to the type of material, are used to represent the actual processes, as appropriate.
Precision: Measure of the variability of the data values for each data expressed
Precision of results are not quantified due to a lack of data. Data collected for operations were typically averaged for one or more years and over multiple operations, which is expected to reduce the variability of results.
Completeness: Percentage of flow that is measured or estimated
The LCA model included all known mass and energy flows for production of the rubber flooring products. In some instances, surrogate data used to represent upstream and downstream operations may be missing some data which is propagated in the model. No known processes or activities contributing to more than 1% of the total environmental impact for each indicator are excluded. In total, these missing data represent less than 5% of the mass or energy flows.
Representativeness: Qualitative assessment of the degree to which the data set reflects the true population of interest
Data used in the assessment represent typical or average processes as currently reported from multiple data sources, and are therefore generally representative of the range of actual processes and technologies for production of these materials. Considerable deviation may exist among actual processes on a site-specific basis; however, such a determination would require detailed data collection throughout the supply chain back to resource extraction.
Consistency: Qualitative assessment of whether the study methodology is applied uniformly to the various components of the analysis
The consistency of the assessment is considered to be high. Data sources of similar quality and age are used; with a bias towards Ecoinvent data where available. Different portions of the product life cycle are equally considered; however, it must be noted that final disposition of the product is based on assumptions of current average practices in the United States.
Reproducibility: Qualitative assessment of the extent to which information about the methodology and data values would allow an independent practitioner to reproduce the results reported in the study
Based on the description of data and assumptions used, this assessment would be reproducible by other practitioners. All assumptions, models, and data sources are documented in the LCA report.
Sources of the Data: Description of all primary and secondary data sources
Data representing energy use at the manufacturing facilities represent an annual average and are considered of high quality due to the length of time over which these data are collected, as compared to a snapshot that may not accurately reflect fluctuations in production. For secondary LCI datasets, both Ecoinvent and the US LCI data are used, with a bias towards Ecoinvent data.
Uncertainty of the Information: Uncertainty related to data, models, and assumptions
Uncertainty related to the product materials and packaging is low. Actual supplier data for upstream operations was sought but not available for all suppliers and the study relied upon use of existing representative datasets. These datasets contained relatively recent data (<10 years), but in some instances lacked geographical representativeness. Uncertainty related to the impact assessment methods used in the study are high. The impact assessment method required by the PCR includes impact potentials, which lack characterization of providing and receiving environments and does not consider exceedances of threshold (e.g., tipping points).
Environmental Product Declaration PLAE, Achieve Rubber Flooring
………………………………………………………………………………………………..……………………………………………………………………………………………………………………………
18
© 2017 SCSglobalServices.com
REFERENCES 1. ASTM International, 100 Barr Harbor Drive, West Conshohocken, PA, 19428-2959 USA.
http://www.astm.org/Standard/index.shtml 2. Ecoinvent Centre (2010) Ecoinvent data from v2.2. Swiss Center for Life Cycle Inventories, Dubendorf, 2010,
http://www.ecoinvent.org 3. ISO 14025: 2006 Environmental labels and declarations – Type III environmental declarations – Principles and
Procedures 4. ISO 14040: 2006 Environmental Management – Life cycle assessment – Principles and framework 5. ISO 14044: 2006 Environmental Management – Life cycle assessment – Requirements and guidelines 6. ISO 21930: 2007 Sustainability in Building Construction – Environmental declaration of building products. 7. Product Category Rule (PCR) for preparing an Environmental Product Declaration (EPD) for Flooring: Carpet, Resilient,
Laminate, Ceramic, Wood. NSF International. Version 2. 2014. 8. SCS Global Services. Life Cycle Assessment of Rubber Tile and Rolled Flooring. Updated April 2017. Final Report.
Prepared for Confidential client. 9. SCS Type III Environmental Declaration Program: Program Operator Manual v7.0. October 2015. SCS Global Services 10. US EPA. Advancing Sustainable Materials Management: 2013 Fact Sheet. Assessing Trends in Material Generation,
Recycling and Disposal in the United States. June 2015 11. US EPA. WARM Model Transportation Research - Draft. Memorandum from ICF Consulting to United States
Environmental Protection Agency. September 7, 2004. http://epa.gov/epawaste/conserve/tools/warm/SWMGHGreport.html#background.
………………………………………………………………………………………………..……………………………………………………………………………………………………………………………
© 2017 SCSglobalServices.com
SCS Global Services 2000 Powell Street, Ste. 600, Emeryville, CA 94608 USA
Main +1.50.452.8000 | fax +1.510.452.8001
For more information, contact:
PLAE Vertical Inc. 105 Towne Lake Parkway
Woodstock, GA 30188 Plae.us | 404.645.7900