Embed Size (px)
Citation preview

全身振動の許容基準
常習的な曝露に対する全身振動の許容基準を,
腰痛予防の立場から次のように定める.
1
2
3
4
5
6
7
8
9
10
11
12
13
14
15
16
17
18
19
20
21
22
23
24
25
26
27
28
29
30
31
32 33 34
1.許容基準
8 時間等価周波数補正加速度実効値(A (8))
0.5 m/s2を許容値とする.この基準未満であれば,
1 日 8 時間,週 40 時間の全身振動への曝露が常習
的に 1 年間続いた場合に,0.5~1.0 m/s2の全身振
動に曝露される場合に比べて,腰痛未経験者が腰
痛を経験する相対危険度を 0.5 未満にとどめるこ
とが期待できる.また,同様の曝露が 3 年以降
40 年目まで続いた場合に,原職復帰不可腰痛
(52 週を超える病休を伴う腰痛)発症の相対危険
度を 0.5 未満で推移させることも期待できる.
2.適用範囲
通常の健康状態にある椅座位の作業者が,座席
面からでん部を通して人体全体に伝達する振動
(全身振動)に,1 日 10 分以上常習的に曝露され
る場合に適用し,その際,評価する周波数範囲は
0.5~80 Hz とする.また,乗物の衝突時に発生す
るような激しい単発衝撃に対しては除外する.
3.適用方法
(1) この基準では,1 日の曝露時間が 10 分以上
の場合,表 1 に示すように,8 時間曝露を想定し
た等価変換値,すなわち 8 時間等価周波数補正加
速度実効値 A (8)をもって評価するものとする.
(2) A (8)は,振動源あるいは振動曝露条件(以下,
振動源)iの 3 軸の振動における周波数補正加速度
実効値(awxi, awyi, awzi)中の優勢軸の値avi,およ
び 1 日の曝露時間Ti(hour)より,式 (a) および
式 (b) を用いて計算する.周波数補正において,
水平振動についてはWd周波数補正特性1,2)を,鉛直
振動についてはWk周波数補正特性1,2)を用いる.
avi = Max.(1.4×awxi, 1.4×awyi, awzi) (a)
A (8) = 82 ⎟⎠
⎞⎜⎝
⎛×∑
n
iivi Ta (b) 35
36
38
39
40
47
2 軸以上で周波数補正加速度が同程度の場合は,
式 (c) により求めた合成振動値をa37
viとすること
を推奨する.
avi = (1.42×awxi 2+1.42×awyi
2+awzi 2)1/2 (c)
なお,全身振動への曝露時間が 1 日 4 時間未満
の場合や,波高率(crest factor)が 9 以上の繰り返
し衝撃型の全身振動への適用について,曝露を過
小評価するおそれがある
41
42
43
44
45 46
3)とされているので,A
(8)による判定は慎重でなければならない.
表 1.全身振動の曝露時間別許容値
周波数補正加速度実効値
(m/s2)
24 時間 0.2916 時間 0.3512 時間 0.4110 時間 0.458 時間 0.507 時間 0.536 時間 0.585 時間 0.634 時間 0.713 時間 0.822 時間 1.001 時間 1.41
50 分 1.5540 分 1.7330 分 2.0020 分 2.4510 分 3.46
曝露時間/日
48
54
55
57
58
49 50
51
52
53
4.測定方法
(1) 測定装置は「JIS B 7760-1:2004 全身振動-
第1部:測定装置4)」(ISO 80415))を満足するも
のとする.
(2) 測定は,振動源ごとに「JIS B 7760-2:2004
全身振動-第2部:測定方法及び評価に関する基
本的要求2)」(ISO 2631-11))の規定にそって,座
席面を通じて人体に伝達する振動が入力すると考
えられる位置を原点とした座標系にしたがって 3
56
軸について行う. 59
60
61
62
63
64
,65
66
67
68
69
70
71
72
73
74
75
76
77
78
79
80
81
82
83
84
85
86
87
88
89
. 90
91
92
93
94
95
96
97
98
99
104
108
109
110
120
138
(3) 振動測定が代表値を得る目的の場合,振動
源ごとの計測時間は,十分な精度の統計値を得る
ために,また,対象振動源の振動が典型的な曝露
状態である事を確かめるために,十分に長くなけ
ればならない.
100
101
102
103
(4) 振動源の代表値を用いて A (8)を求める場合
振動源ごと 1 日の曝露時間は,当該振動源から作
業者が振動に曝露されている時間の 1 日の累積値
とする.
105
106
107
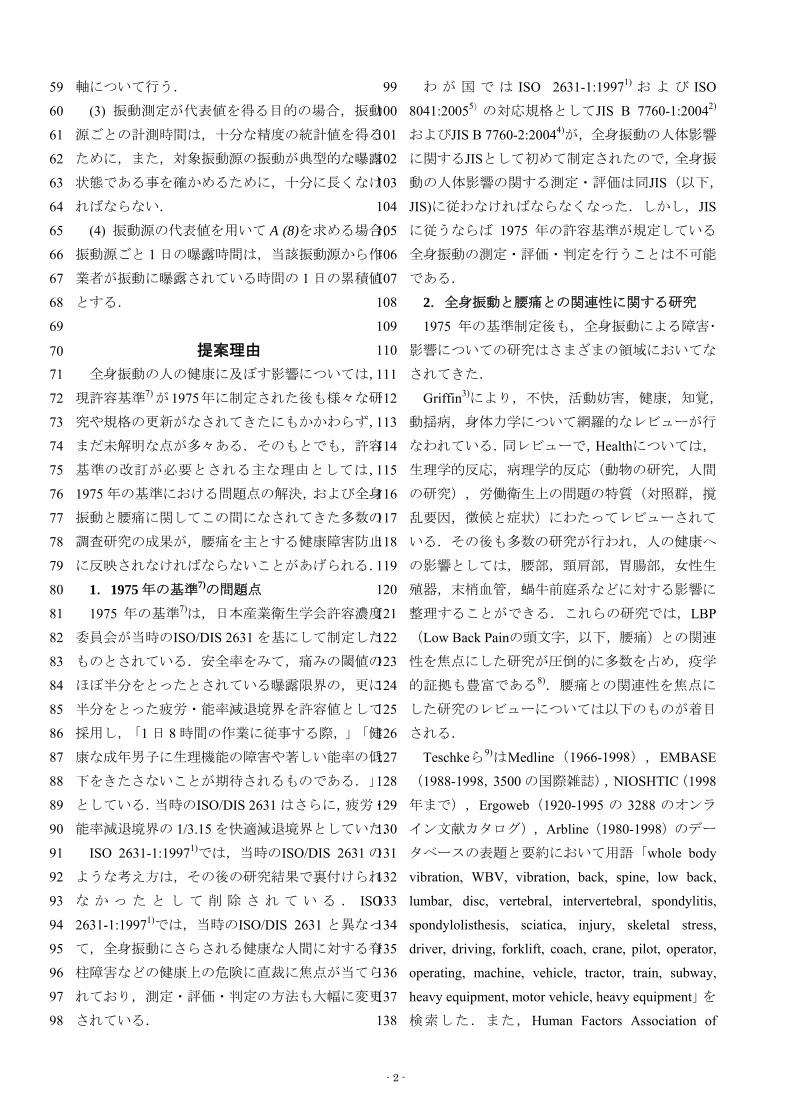
提案理由 全身振動の人の健康に及ぼす影響については,
現許容基準7) が1975年に制定された後も様々な研
究や規格の更新がなされてきたにもかかわらず,
まだ未解明な点が多々ある.そのもとでも,許容
基準の改訂が必要とされる主な理由としては,
1975 年の基準における問題点の解決,および全身
振動と腰痛に関してこの間になされてきた多数の
調査研究の成果が,腰痛を主とする健康障害防止
に反映されなければならないことがあげられる.
111
112
113
114
115
116
117
118
119
1.1975 年の基準7)の問題点
1975 年の基準7)は,日本産業衛生学会許容濃度
委員会が当時のISO/DIS 2631 を基にして制定した
ものとされている.安全率をみて,痛みの閾値の
ほぼ半分をとったとされている曝露限界の,更に
半分をとった疲労・能率減退境界を許容値として
採用し,「1 日 8 時間の作業に従事する際,」「健
康な成年男子に生理機能の障害や著しい能率の低
下をきたさないことが期待されるものである.」
としている.当時のISO/DIS 2631 はさらに,疲労・
能率減退境界の 1/3.15 を快適減退境界としていた
121
122
123
124
125
126
127
128
129
130
ISO 2631-1:19971)では,当時のISO/DIS 2631 の
ような考え方は,その後の研究結果で裏付けられ
な か っ た と し て 削 除 さ れ て い る . ISO
2631-1:19971)では,当時のISO/DIS 2631 と異なっ
て,全身振動にさらされる健康な人間に対する脊
柱障害などの健康上の危険に直裁に焦点が当てら
れており,測定・評価・判定の方法も大幅に変更
されている.
131
132
133
134
135
136
137
わ が 国 で は ISO 2631-1:19971) お よ び ISO
8041:20055)の対応規格としてJIS B 7760-1:20042)
およびJIS B 7760-2:20044)が,全身振動の人体影響
に関するJISとして初めて制定されたので,全身振
動の人体影響の関する測定・評価は同JIS(以下,
JIS)に従わなければならなくなった.しかし,JIS
に従うならば 1975 年の許容基準が規定している
全身振動の測定・評価・判定を行うことは不可能
である.
2.全身振動と腰痛との関連性に関する研究
1975 年の基準制定後も,全身振動による障害・
影響についての研究はさまざまの領域においてな
されてきた.
Griffin3)により,不快,活動妨害,健康,知覚,
動揺病,身体力学について網羅的なレビューが行
なわれている.同レビューで,Healthについては,
生理学的反応,病理学的反応(動物の研究,人間
の研究),労働衛生上の問題の特質(対照群,撹
乱要因,徴候と症状)にわたってレビューされて
いる.その後も多数の研究が行われ,人の健康へ
の影響としては,腰部,頸肩部,胃腸部,女性生
殖器,末梢血管,蝸牛前庭系などに対する影響に
整理することができる.これらの研究では,LBP
(Low Back Painの頭文字,以下,腰痛)との関連
性を焦点にした研究が圧倒的に多数を占め,疫学
的証拠も豊富である8).腰痛との関連性を焦点に
した研究のレビューについては以下のものが着目
される.
Teschkeら9)はMedline(1966-1998),EMBASE
(1988-1998,3500 の国際雑誌),NIOSHTIC(1998
年まで),Ergoweb(1920-1995 の 3288 のオンラ
イン文献カタログ),Arbline(1980-1998)のデー
タベースの表題と要約において用語「whole body
vibration, WBV, vibration, back, spine, low back,
lumbar, disc, vertebral, intervertebral, spondylitis,
spondylolisthesis, sciatica, injury, skeletal stress,
driver, driving, forklift, coach, crane, pilot, operator,
operating, machine, vehicle, tractor, train, subway,
heavy equipment, motor vehicle, heavy equipment」を
検索した.また,Human Factors Association of
- 2 -
Canada,Ergonomics Association of the UK,Human
Factors and Ergonomics,International Ergonomic
Association等のwebサイトのセミナー情報・会議録
や“Musculoskeletal Disorders (MSDs) and Workplac
Factors. A Critical Review of Epidemiologic Evidenc
for Work-Related Musculoskeletal Disorders of th
Neck, Upper Extremity, and Low Back”
139
s 140
141
e 142
e 143
e 144
145
t 146
147
148
149
150
151
152
153
. 154
155
156
157
1158
159
160
180
2
10)や“Back
Disorders and Whole-Body Vibration in Equipmen
Operators and Truck Drivers Epidemiology, Pathology,
and Exposure Limits”および同付録の参考文献を検
索している.最終的に人に関する文献 400 を抽出
してレビューし,疫学的因果関係(関連の一致,
関連の強さ,量反応関係,時間性,整合性)を確
認し,曝露 5 年以上の場合にリスクの上昇を認め
ている.また,実験的研究では座位姿勢やねじり
姿勢が振動伝達を増強するという示唆を得ている
161
162
163
164
165
166
167
168
169
170
171
172
173
174
175
176
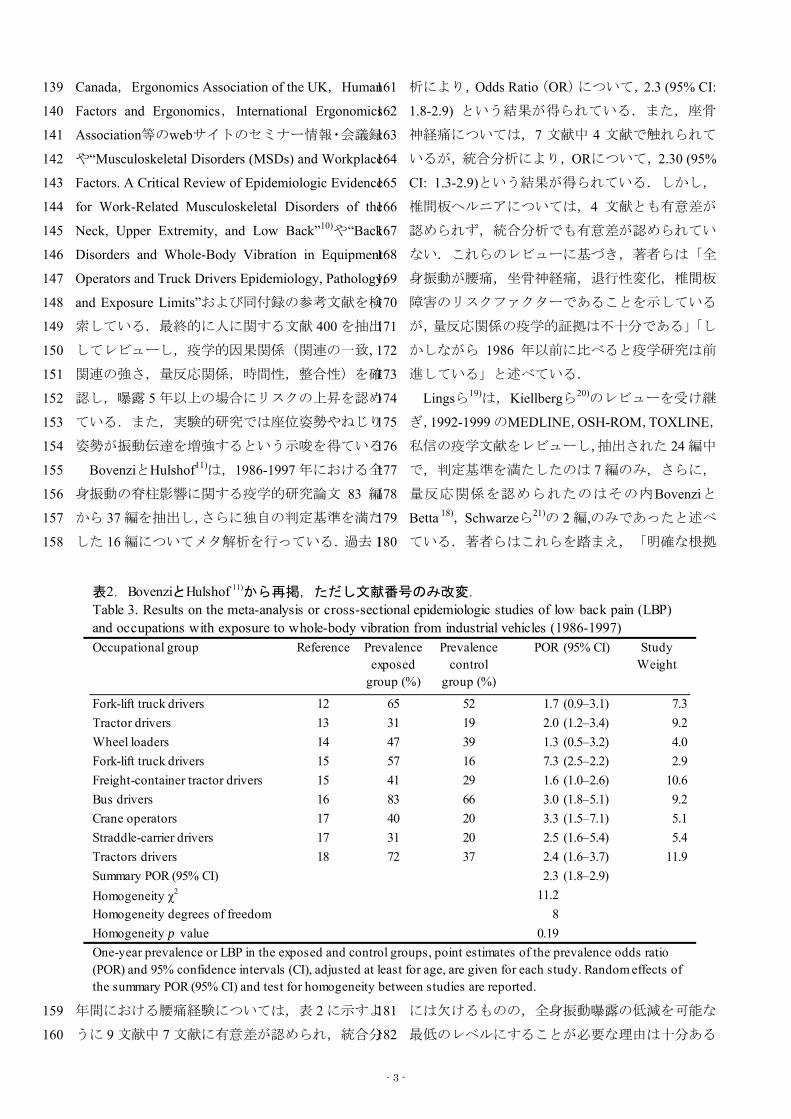
BovenziとHulshof11)は,1986-1997 年における全
身振動の脊柱影響に関する疫学的研究論文 83 編
から 37 編を抽出し,さらに独自の判定基準を満た
した 16 編についてメタ解析を行っている.過去
年間における腰痛経験については,表 2 に示すよ
うに 9 文献中 7 文献に有意差が認められ,統合分
析により,Odds Ratio(OR)について,2.3 (95% CI:
1.8-2.9) という結果が得られている.また,座骨
神経痛については,7 文献中 4 文献で触れられて
いるが,統合分析により,ORについて,2.30 (95%
CI: 1.3-2.9)という結果が得られている.しかし,
椎間板ヘルニアについては,4 文献とも有意差が
認められず,統合分析でも有意差が認められてい
ない.これらのレビューに基づき,著者らは「全
身振動が腰痛,坐骨神経痛,退行性変化,椎間板
障害のリスクファクターであることを示している
が,量反応関係の疫学的証拠は不十分である」「し
かしながら 1986 年以前に比べると疫学研究は前
進している」と述べている.
177
178
179
181
18
Lingsら19)は,Kiellbergら20)のレビューを受け継
ぎ,1992-1999 のMEDLINE,OSH-ROM,TOXLINE,
私信の疫学文献をレビューし,抽出された 24 編中
で,判定基準を満たしたのは 7 編のみ,さらに,
量反応関係を認められたのはその内Bovenziと
Betta 18),Schwarzeら21)の 2 編,のみであったと述べ
ている.著者らはこれらを踏まえ,「明確な根拠
には欠けるものの,全身振動曝露の低減を可能な
最低のレベルにすることが必要な理由は十分ある
Occupational group Reference Prevalenceexposed
group (%)
Prevalencecontrol
group (%)
POR (95% CI) StudyWeight
Fork-lift truck drivers 12 65 52 1.7 (0.9–3.1) 7.3Tractor drivers 13 31 19 2.0 (1.2–3.4) 9.2Wheel loaders 14 47 39 1.3 (0.5–3.2) 4.0Fork-lift truck drivers 15 57 16 7.3 (2.5–2.2) 2.9Freight-container tractor drivers 15 41 29 1.6 (1.0–2.6) 10.6Bus drivers 16 83 66 3.0 (1.8–5.1) 9.2Crane operators 17 40 20 3.3 (1.5–7.1) 5.1Straddle-carrier drivers 17 31 20 2.5 (1.6–5.4) 5.4Tractors drivers 18 72 37 2.4 (1.6–3.7) 11.9Summary POR (95% CI) 2.3 (1.8–2.9)Homogeneity χ2 11.2Homogeneity degrees of freedom 8Homogeneity p value 0.19
表2.BovenziとHulshof 11)から再掲,ただし文献番号のみ改変.
Table 3. Results on the meta-analysis or cross-sectional epidemiologic studies of low back pain (LBP)and occupations with exposure to whole-body vibration from industrial vehicles (1986-1997)
One-year prevalence or LBP in the exposed and control groups, point estimates of the prevalence odds ratio(POR) and 95% confidence intervals (CI), adjusted at least for age, are given for each study. Random effects ofthe summary POR (95% CI) and test for homogeneity between studies are reported.
- 3 -

こと」「従来以上の新知見を得ようとすれば,明
確な定義と細分類を伴う前向き研究が必要であ
る」と述べている.しかし,「進行中の技術的予
防の開発により,全身振動問題の大きさは既に減
少傾向にあると思われるので,この領域のその他
の研究は断念し,資源をもっと重要な問題に利用
したほうがよい」という論調も見受けられるよう
になった.
195
196
197
198
199
200
201
183
184
185
186
187
188
189
190
f 191
192
193
194
202
6
BurdorfとHulshof 22)は,前掲のBovenziとHulsho11),Lingsら19)とともにBurdorfとSorock 23)のレビュ
ーに基づき,全身振動が腰痛発症のリスクファク
ターであることは文献的に明らかであると述べて
いる.
203
204
205
20
3.8 時間等価周波数補正加速度実効値 0.5 m/s2
を許容値とする根拠について
Löttersら24)は,文献選択基準として,(i) 非特異
的腰痛の発症を 1 年以下の期間における有病率あ
るいは 1 年以下の発症率により記述している文献
であり,かつ,(ii) 非特異的腰痛と作業に関連す
る物理的(重量物取り扱い,躯幹の前屈・捻転の
反復,全身振動)あるいは心理社会的リスク要因
(仕事上の不満,単調作業)への曝露との関連を
示している文献とし,2000 年 1 月から 2002 年 9
月にMEDLINEおよびEMBASEのデータベースを
OR (95% CI)Alcouffe et al, 1999 29 Cross-sectional 7010 workers (male & female) 1.3 (1.7–2.2)
Boshuizen et al, 1990 13 Cross-sectional450 tractor drivers & 110agriculture workers (male) 1.5 (1.0–2.1)
242 drivers (male) 1.3 (0.6–2.6)210 operators (male) 1.7 (1.1–2.8)
Bovenzi & Zadini, 1992 16 Cross-sectional234 bus drivers & 125 main-tenance workers (male) 3.6 (1.6–8.2)
Bovenzi & Betta, 1994 18 Cross-sectional1155 tractor drivers & 220 officeworkers (male) 1.6 (1.0–2.4)
Burdorf et al, 1991 30 Cross-sectional114 concrete workers & 52maintenance workers (male) 3.1 (1.3–7.5)
Kumar et al, 1999 31 Cross-sectional50 tractor driving farmers & 50non tractor driving farmers 2.6 (1.1–6.2)
Liira et al, 1996 32 Cross-sectional―population
8020 Canadian blue-collar workers(male & female) 1.8 (1.4–2.7)
Linton, 1990 33 Cross-sectional22180 Swedish workers (male &female) 1.8 (1.5–2.2)
Magnusson et al, 1996 34 Cross-sectional228 drivers & 137 sedentaryworkers (male) 1.8 (1.2–2.8)
Pietri et al, 1992 35 Cross-sectional1709 commercial travelers (male &female) 2.0 (1.3–3.1)
Saraste & Hultman, 1987 36 Cross-sectional―population
2872 Swedish population (male &female) 2.1 (1.3–3.5)
5940 workers (male & female) 1.3 (1.0–1.6) [with Manual handling] 1.8 (1.2–2.7)
Cross-sectional―population
Boshuizen et al, 1992 15 Cross-sectional
Xu et al, 1997 37
Design Study population
表3.Löttersら24)のTable 1. Characteristics of the included studies (N=40). When odds ratios (OR),or relative risks, are presented in both boldface and italics, they have been adjusted for each other; oddsratios or relative risks presented only in italics are adjusted for one of the other risk factors, but novalue for those risk factor(s) is given. When both the adjusted and unadjusted OR are given, theadjusted was used in the meta-analysis. (95% CI=95% confidence interval, NA=not applicable)より、
1年以内に腰痛を経験した率と全身振動に関するメタ解析結果のみを抽出した結果、ただし文献番号のみ改変
Whole-bodyvibration
Authors Reference
- 4 -

用いて,戦略をlow-back pain AND risk factors AND
(lifting OR posture OR vibration OR workload OR job
satisfaction OR monotonous work) として検索した
さらに,曝露群が,国際的に認められているガイ
ドライン
207
208
.209
210
211
212
213
214
215
216
217
218
219
220
221
222
223
224
225
226
227
228
229
230
231
232
233
234
235
236
237
238
239
240
241
242
243
244
245
246
258
259
25-28)に従って分割点を決め,分割点(全
身振動の場合 0.5 m/s2)を下まわるレベルでリス
ク要因に曝露されている研究を除外した結果,40
文献を抽出している.その中でリスク要因として
全身振動を含む文献数は 13 であった.それらのオ
ッズ比あるいは相対危険度の推定結果(表 3)に
よれば,Boshuizenら13)の調整済みORを除いて 13
研究ともORは 1 以上(p < 0.05)である.
247
248
249
250
251
252
253
254
255
256
257
さらに,Löttersら24)は抽出した文献について,
調整の有無別に統合分析を行った.その中の全身
振動に関する結果(表 4)によれば,非調整研究
を統合したOverall pooled risk estimateは調整研究
を統合したrisk estimateとは大差がなく,およそOR
は 1.4 である.
以上を踏まえてLöttersら24)は,特に調整の有無
の区別をせずに,全身振動曝露群について低度曝
露群(0.5 m/s2~1.0 m/s2)と高度曝露群(1.0 m/s2以
上)の全身振動への 5 年曝露あるいはそれと等価
な全身振動曝露量として抽出できた文献,
Boshuizenら13),BovenziとZadini 16),BovenziとBetta
18)の統合分析をした.その結果によれば,表 5 に
示されるように,僅かながらであるが量反応関係
が認められる.
表 4.Löttersら24) のTable 2. Results of the meta-analysis for six occupational risk
factors for low-back pain and the effect of age on low-back pain より,1年以内に
腰痛を経験した率と全身振動に関するメタ解析結果のみを抽出した結果 Risk factor
OR 95% CI OR 95% CI OR 95% CIWhole-body vibration
Eight studiesb 1.83 1.63-2.06 1.38 1.15-1.66 1.39 1.24-1.55Five studiesa 1.43 1.19-1.71 1.43 1.19-1.71 - -
a Adjusted b Unadjusted
Overall pooledrisk estimate
Pooled riskestimate
Pooled riskestimate after
correction
表 5.Löttersら24) のTable 3. Analysis of studies presenting risk estimates for both
low and high exposure. より,1年以内に腰痛を経験した率と全身振動曝露量
に関するメタ解析結果のみを抽出した結果
Risk factor
OR 95% CI OR 95% CIWhole-body vibration 2.3 2.01-2.52 2.6 1.69-4.10 1.17 1.63
Ratio Risk(high or lowrisk estimate)
Risk estimate(high exposurein the model)
Overall pooled risk estimate Low exposure High exposure
注:Low exposure は 0.5 m/s2–1.0 m/s2,High exposureは 1.0 m/s2以上
- 5 -

BurdorfとHulshof 22)は,前掲のBovenziとHulsho11)
f 260
261
262
263
264
265
266
267
268
269
270
271
272
273
274
275
276
277
278
279
280
281
282
283
284
285
286
287
288
289
290
291
292
293
294
295
296
297
298
299
308
,Schwarzeら21),Löttersら24)の他に,Pietriら35),
Bongersら38),Bovenziら39)を総括して,男性につい
て,全身振動の 8 時間等価周波数補正加速度実効
値の大きさ別(0.5 m/s2未満:無/低度曝露,0.5-1.0
m/s2:中度,1.0 m/s2以上:高度)に曝露期間 1 年
の中での腰痛の発症および有症の推定率を表 6 の
ようにまとめた.この総括によれば,Annual
incidence LBP(年間腰痛発症率),
300
301
302
303
304
305
306
307
Annual incidence sick leave LBP(年間病休腰痛発症
率),Annual incidence disability pension(> 52 weeks
sick leave)(原職復帰不可腰痛,すなわち 52 週を
超える病休腰痛を経験し翌年に原職復帰すること
が不可と判定された腰痛),1-year prevalence(年
間腰痛有症率)のいずれにおいても,有意な(p <
0.05)全身振動の影響が認められ,年間腰痛有症
率については,有意な(p < 0.05)量反応関係が認
められる.
表 6.BurdorfとHulshof 22) のTable 2 overview of estimated incidence and prevalence of low-back pain
(LBP) and associated sick leave in occupational populations with exposure to whole -body vibration
(WBV), based on a pooled analysis of selected studies in Table 1 の再掲,ただし文献番号のみ改変
Measure Exposure level a Weighted level (%) (95% CI) Included studiesInformation from selected studiesAnnual incidence LBP No/low WBV exposure 6.7 (6.4-6.9) 19, 14
Moderate WBV exposure 13.0 (13.4-14.5) 19, 14
Annual incidence sick leave LBP No/low WBV exposure 14.8 (13.0-16.6) 21Moderate WBV exposure 36.4 (30.3-42.4) 21
Annual incidence disability pension No/low WBV exposure 0.47 (0.45-0.49) 20 (> 52 weeks sick leave) Moderate WBV exposure 0.85 (0.81-0.89) 20
1-year prevalence LBP No/low WBV exposure 30.4 (30.1-30.6) 10, 17Moderate WBV exposure 45.6 (45.3-45.9) 10, 17High WBV exposure 61.0 (60.6-61.4) 10
a No/low WBV exposure < 0.5 m s -2, moderate WBV exposure 0.5-1.0 m s -2, high WBV exposure > 1.0 m s -2
表 7.BurdorfとHulshof 22) のTable 3. Matrix of transition probabilities for three levels of
exposure to whole-body vibration (WBV) among the distinguished health states for low-back pain
(LBP) during a 1year follow-up among workersの再掲
Baseline Follow-upNo LBP LBP LBP with sick
No LBP 0.933 0.048 0.019LBP 0.160 0.605 0.235LBP with sick leave 0.160 0.605 0.235No LBP 0.861 0.075 0.064LBP 0.160 0.454 0.386LBP with sick leave 0.160 0.454 0.386No LBP 0.833 0.075 0.092LBP 0.120 0.396 0.484LBP with sick leave 0.120 0.396 0.484
No or low exposure <0.5 m s-2
Intermidiate exposure 0.5-1.0 m s-2
High exposure >1.0 m s-2
- 6 -
さらにBurdorfとHulshof 22) は,表 6 の概括に基
づき長期間にわたる全身振動曝露の影響を検討す
るためにマルコフモデルの適用を試みている.
「No LBP(年間腰痛経験無し)」「LBP(年間に
病休を伴わない腰痛の経験有り)」「LBP with sick
leave(病休LBP,年間に病休を伴う腰痛の経験有
り)」別に,No LBP,LBP,病休LBP,LBP disability
(原職復帰不可LBP,すなわち 52 週を超える病休
LBPを経験し,翌年に原職復帰することが不可と
判定された腰痛)を経験する者の割合(経験者率)
の遷移確率を推測している.推測に当たっては,
「LBP中に病休LBPの占める割合を無/低度曝露で
は 28%,中度以上曝露では 48%とする」,「文献
報告がない場合,高度曝露のリスクは中度曝露に
比べて 1.2 倍とする」,「原職復帰不可LBPは病
休LBPの経験を経てのみ発症する」と仮定し,原
職復帰不可LBPについてはBongersら
309
310
311
312
313
314
315
316
317
318
319
320
321
322
323
324
325
326
327
328
329
330
331
332
333
334
335
336
337
338
339
340
341
342
343
344
345
346
347
348
369
2
38)に基づき,
表 7 のような結果を得ている.この結果によれば,
1 年間の観察期間中にLBPを経験する率について
は,過去1年間腰痛経験の無い群が中度以上の全
身振動曝露を受けた場合,無/低度曝露に比
349
350
351
352
353
354
355
356
357
358
359
360
361
362
363
364
365
366
367
368
べると 1.56 倍,また,病休 LBP を経験する率に
ついては中度曝露の場合では 3.37,高度曝露の場
合では 4.84 倍であり,量反応関係のあることを示
370
371
37
している.また,過去 1 年間に腰痛経験あるいは
病休LBPの有る群が翌年 1 年間に病休LBPを経験
する率は,中度曝露の場合は無/低度曝露に比べる
と 1.64 倍,高度曝露の場合では 2.06 倍であり,量
反応関係のあることを示している.したがって,
中度(0.5 m/s2)以上の曝露を受けた群の過去1年
間の病休LBP経験の主要な要因は全身振動である
といえる24,40).
BurdorfとHulshof 22) は,腰痛への罹患がしばし
ば再発し,症状の起伏も大きいことが知られてい
るが,全身振動の寄与度は未解明であるとして,
得られた遷移確率を用いて,さらに,過去 1 年間
腰痛経験のない群について,全身振動の大きさ別
にマルコフモデルの適用を試みた.マルコフ連鎖
解析では,40 年間の曝露による病欠を伴わない
「腰痛」,病欠を伴う「腰痛」および原職復帰不
可LBPの有症率についての年次推移を求め,全身
振動曝露レベル別に,LBP+病休LBPの有症率を図
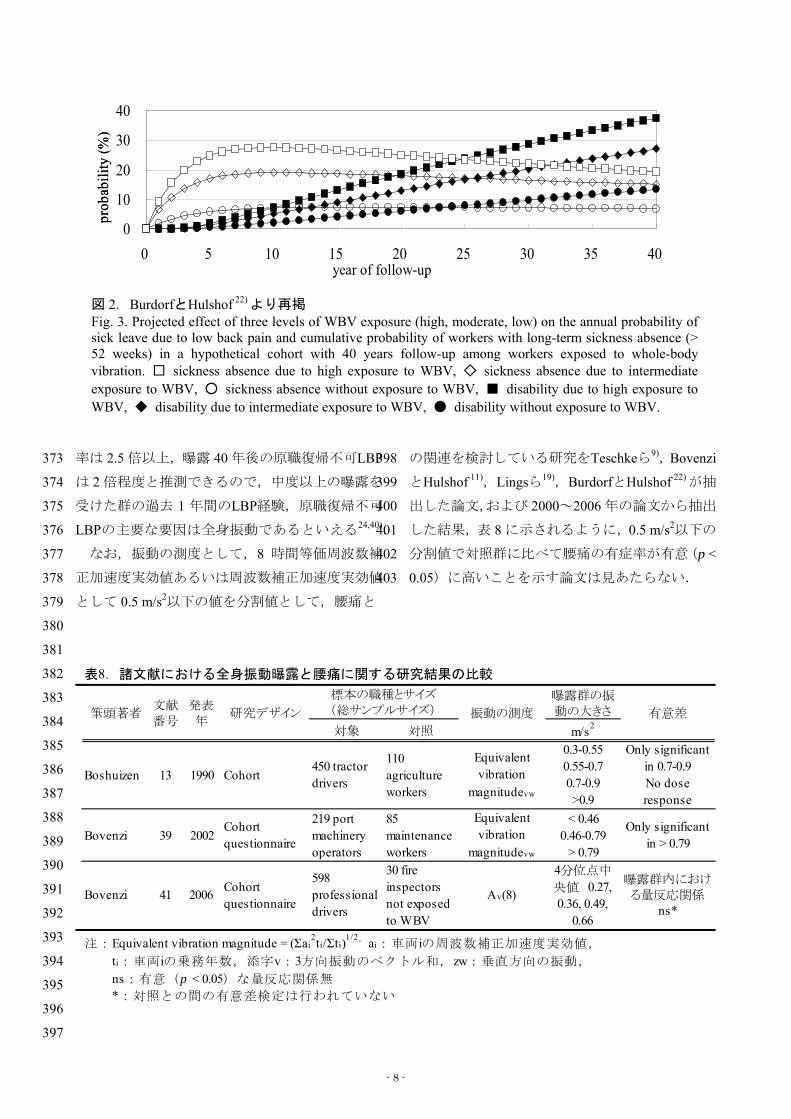
1,病休LBPの有症率および原職復帰不可LBPの累
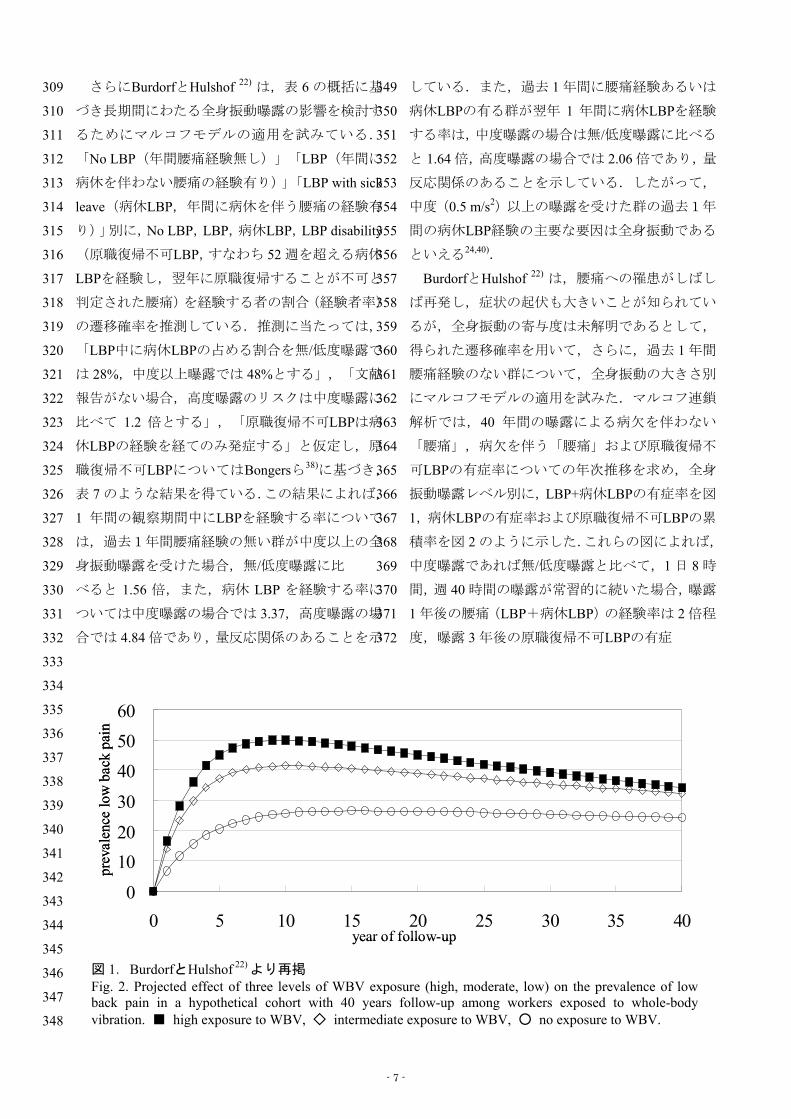
積率を図 2 のように示した.これらの図によれば,
中度曝露であれば無/低度曝露と比べて,1 日 8 時
間,週 40 時間の曝露が常習的に続いた場合,曝露
1 年後の腰痛(LBP+病休LBP)の経験率は 2 倍程
度,曝露 3 年後の原職復帰不可LBPの有症
0
1020
30
405060
0 5 10 15 20 25 30 35 40year of follow-up
prev
alen
ce lo
w b
ack
pain
0
1020
30
405060
0 5 10 15 20 25 30 35 40year of follow-up
prev
alen
ce lo
w b
ack
pain
図 1.BurdorfとHulshof 22) より再掲 Fig. 2. Projected effect of three levels of WBV exposure (high, moderate, low) on the prevalence of low back pain in a hypothetical cohort with 40 years follow-up among workers exposed to whole-body vibration. ■ high exposure to WBV, ◇ intermediate exposure to WBV, ○ no exposure to WBV.
- 7 -
0
10
20
30
40
0 5 10 15 20 25 30 35 40year of follow-up
prob
abili
ty (%
)
0
10
20
30
40
0 5 10 15 20 25 30 35 40year of follow-up
prob
abili
ty (%
)
図 2.BurdorfとHulshof 22) より再掲 Fig. 3. Projected effect of three levels of WBV exposure (high, moderate, low) on the annual probability of sick leave due to low back pain and cumulative probability of workers with long-term sickness absence (> 52 weeks) in a hypothetical cohort with 40 years follow-up among workers exposed to whole-body vibration. □ sickness absence due to high exposure to WBV, ◇ sickness absence due to intermediate exposure to WBV, ○ sickness absence without exposure to WBV, ■ disability due to high exposure to WBV, ◆ disability due to intermediate exposure to WBV, ● disability without exposure to WBV.
率は 2.5 倍以上,曝露 40 年後の原職復帰不可LBP
は 2 倍程度と推測できるので,中度以上の曝露を
受けた群の過去 1 年間のLBP経験,原職復帰不可
LBPの主要な要因は全身振動であるといえる
373
374
375 ). 376
377
378
379
380
381
382
383
384
385
386
387
388
389
390
391
392
393
394
395
396
397
3
24,40
398
399
400
401
なお,振動の測度として,8 時間等価周波数補
正加速度実効値あるいは周波数補正加速度実効値
として 0.5 m/s2以下の値を分割値として,腰痛と
402
40
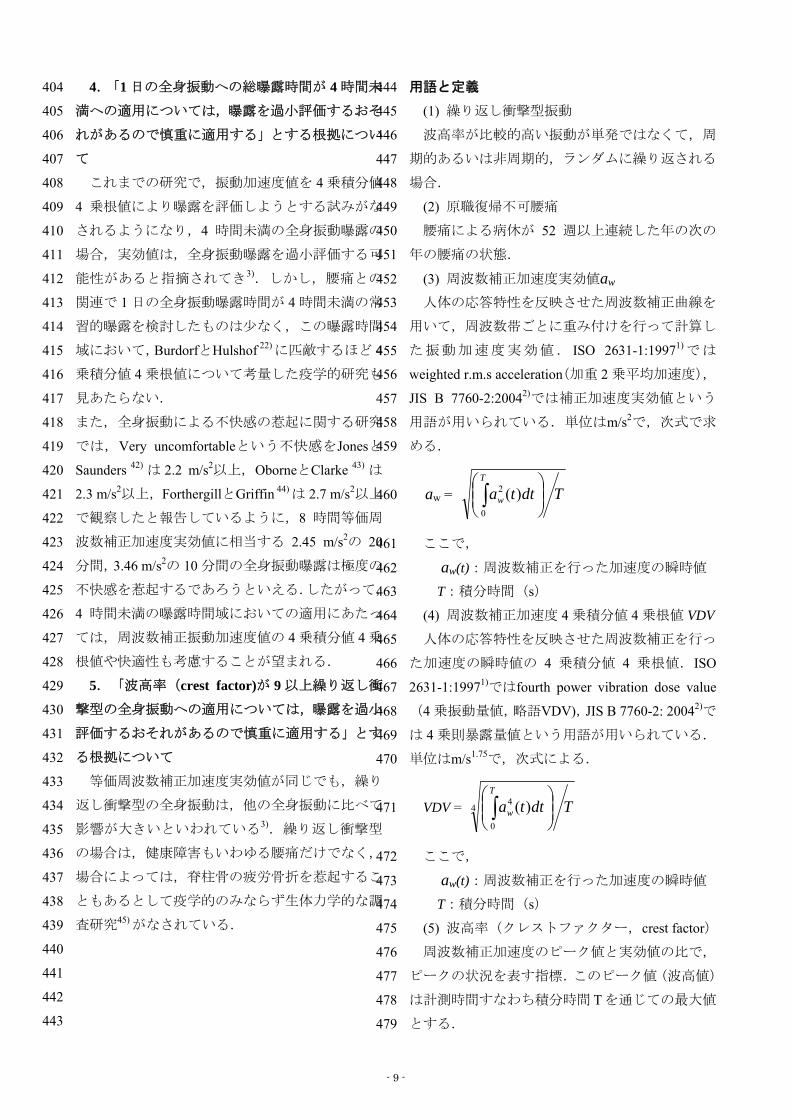
の関連を検討している研究をTeschkeら9),Bovenzi
とHulshof 11),Lingsら19),BurdorfとHulshof 22) が抽
出した論文,および 2000~2006 年の論文から抽出
した結果,表 8 に示されるように,0.5 m/s2以下の
分割値で対照群に比べて腰痛の有症率が有意(p <
0.05)に高いことを示す論文は見あたらない.
表8.諸文献における全身振動曝露と腰痛に関する研究結果の比較
曝露群の振動の大きさ
対象 対照 m/s2
Boshuizen 13 1990 Cohort450 tractordrivers
110agricultureworkers
Equivalentvibration
magnitudevw
0.3-0.550.55-0.70.7-0.9>0.9
Only significantin 0.7-0.9No doseresponse
Bovenzi 39 2002Cohortquestionnaire
219 portmachineryoperators
85maintenanceworkers
Equivalentvibration
magnitudevw
< 0.460.46-0.79
> 0.79
Only significantin > 0.79
Bovenzi 41 2006 Cohortquestionnaire
598professionaldrivers
30 fireinspectorsnot exposedto WBV
Av(8)
4分位点中
央値 0.27,0.36, 0.49,
0.66
曝露群内における量反応関係
ns*
注:Equivalent vibration magnitude = (Σai2ti/Σti)1/2,ai:車両iの周波数補正加速度実効値,
ti:車両iの乗務年数,添字v:3方向振動のベクトル和,zw:垂直方向の振動,
ns:有意(p < 0.05)な量反応関係無
*:対照との間の有意差検定は行われていない
標本の職種とサイズ(総サンプルサイズ) 振動の測度 有意差筆頭著者
文献番号
発表年
研究デザイン
- 8 -
4.「1 日の全身振動への総曝露時間が 4 時間未
満への適用については,曝露を過小評価するおそ
れがあるので慎重に適用する」とする根拠につい
て
444
445
446
404
405
406
407
408
409
410
411
412
413
414
4415
416
417
418
419
420
421
422
423
424
425
426
427
428
429
430
431
432
433
434
435
436
437
438
439
440
441
442
443
447
455
457
これまでの研究で,振動加速度値を 4 乗積分値
4 乗根値により曝露を評価しようとする試みがな
されるようになり,4 時間未満の全身振動曝露の
場合,実効値は,全身振動曝露を過小評価する可
能性があると指摘されてき3).しかし,腰痛との
関連で 1 日の全身振動曝露時間が 4 時間未満の常
習的曝露を検討したものは少なく,この曝露時間
域において,BurdorfとHulshof 22) に匹敵するほど
乗積分値 4 乗根値について考量した疫学的研究も
見あたらない.
448
449
450
451
452
453
454
456
また,全身振動による不快感の惹起に関する研究
では,Very uncomfortableという不快感をJonesと
Saunders 42) は 2.2 m/s2以上,OborneとClarke 43) は
2.3 m/s2以上,ForthergillとGriffin 44) は 2.7 m/s2以上
で観察したと報告しているように,8 時間等価周
波数補正加速度実効値に相当する 2.45 m/s2の 20
分間,3.46 m/s2の 10 分間の全身振動曝露は極度の
不快感を惹起するであろうといえる.したがって,
4 時間未満の曝露時間域においての適用にあたっ
ては,周波数補正振動加速度値の 4 乗積分値 4 乗
根値や快適性も考慮することが望まれる.
458
459
5.「波高率(crest factor)が 9 以上繰り返し衝
撃型の全身振動への適用については,曝露を過小
評価するおそれがあるので慎重に適用する」とす
る根拠について
等価周波数補正加速度実効値が同じでも,繰り
返し衝撃型の全身振動は,他の全身振動に比べて
影響が大きいといわれている3).繰り返し衝撃型
の場合は,健康障害もいわゆる腰痛だけでなく,
場合によっては,脊柱骨の疲労骨折を惹起するこ
ともあるとして疫学的のみならず生体力学的な調
査研究45) がなされている.
用語と定義
(1) 繰り返し衝撃型振動
波高率が比較的高い振動が単発ではなくて,周
期的あるいは非周期的,ランダムに繰り返される
場合.
(2) 原職復帰不可腰痛
腰痛による病休が 52 週以上連続した年の次の
年の腰痛の状態.
(3) 周波数補正加速度実効値aw
人体の応答特性を反映させた周波数補正曲線を
用いて,周波数帯ごとに重み付けを行って計算し
た振動加速度実効値. ISO 2631-1:19971)では
weighted r.m.s acceleration(加重 2 乗平均加速度),
JIS B 7760-2:20042)では補正加速度実効値という
用語が用いられている.単位はm/s2で,次式で求
める.
aw = TdttaT
w ⎟⎟⎠
⎞⎜⎜⎝
⎛∫0
2 )( 460
461
462
463
464
465
ここで,
aw(t):周波数補正を行った加速度の瞬時値
T:積分時間(s)
(4) 周波数補正加速度 4 乗積分値 4 乗根値 VDV
人体の応答特性を反映させた周波数補正を行っ
た加速度の瞬時値の 4 乗積分値 4 乗根値.ISO
2631-1:1997
466
470
1)ではfourth power vibration dose value
(4 乗振動量値,略語VDV),JIS B 7760-2: 2004
467
468
469
2)で
は 4 乗則暴露量値という用語が用いられている.
単位はm/s1.75で,次式による.
VDV = 4
0
4 )( TdttaT
w ⎟⎟⎠
⎞⎜⎜⎝
⎛∫ 471
472
473
474
ここで,
aw(t):周波数補正を行った加速度の瞬時値
T:積分時間(s)
475
476
477
478
479
(5) 波高率(クレストファクター,crest factor)
周波数補正加速度のピーク値と実効値の比で,
ピークの状況を表す指標.このピーク値(波高値)
は計測時間すなわち積分時間 Tを通じての最大値
とする.
- 9 -
(6) 病休腰痛(病休 LBP) 480
481
482
483
484
485
486
487
488
489
490
491
. 492
f 493
: 494
495
496
497
498
. 499
500
501
502
. 503
504
505
506
507
508
509
510
t 511
, 512
513
514
515
e 516
r 517
518
519
520
521
522
526
527
529
530
531
535
538
540
542
545
548
550
555
559
腰痛(LBP)が原因で仕事を休む状態.
(7) 優勢軸
周波数補正加速度実効値が最大となる軸方向の
値の 66%の範囲内に,残りの軸の周波数補正加速
度実効値が入らない場合,周波数補正加速度実効
値が最大の軸を優勢軸とする6).
523
524
525
(8) 腰痛(LBP)
腰部の痛みの自覚症状.症状の程度,期間,頻
度,医師の診断,他覚所見の有無を問わない.
528
引用文献
1) International Organization for Standardization
Mechanical vibration and shock – Evaluation o
human exposure to whole-body vibration – Part 1
General requirements, ISO 2631-1, 1997.
532
533
534
2) 日本工業規格.JIS B 7760-2:2004.全身振動-
第2部:測定方法及び評価に関する基本的要
求.2004.
536
537
3) Griffin MJ. Handbook of human vibration
London, San Diego: Academic Press, 1990.
539
4) 日本工業規格.JIS B 7760-1.全身振動-第1
部:測定装置.2004.
541
5) International Organization for Standardization
Human response to vibration – Measuring
instrumentation, ISO 8041, 2005.
543
544
6) European Standard. Testing of mobile machinery
in order to determine the vibration emission value,
EN 1032, 2003.
546
547
7) 日本産業衛生学会.許容濃度等の勧告,全身
振動の許容基準.1975.
549
8) VIBRISKS. Final Technical Report. FP5 Projec
No. QLK4-2002-02650, European Commission
Quality of Life and Management of Living
Resources Programme Key Action 4 –
Environment and health. 1-158. 2007.
551
552
553
554
9) Teschke K, Nicol A-M, Davies H, Ju S. Whol
body vibration and back disorders among moto
vehicle drivers and heavy equipment operators –
A review of the scientific evidence. 1-21. 1999.
556
557
558
10) Bernard B. Epidemiologic Evidence for
Work-Related Musculoskeletal Disorders of the
Neck, Upper Extremity, and Low Back. National
Institute for Occupational Safety and Health,
Cincinnati, OH. 1997.
11) Bovenzi M, Hulshof CTJ. An updated review of
epidemiologic studies on the relationship between
exposure to whole-body vibration and low back
pain (1986-1997). International Archives of
Occupational and Environmental Health 1998; 72:
351-365.
12) Brendstrup T, Biering-Sorensen F. Effect of
fork-lift truck driving on low-back trouble. Scand
J Work Environ Health 1987; 13: 445-452.
13) Boshuizen HC, Bonges PM, Hulshof TJ.
Self-reported back pain in tractor drivers exposed
to whole bbody vibration. Int Arch Occup Environ
Health. 1990; 62: 109-115.
14) Bongers PM, Boshuizen HC, Hulshof CTJ.
Self-reported back pain in drivers of
wheel-loaders. Academisch Proefschrift.
Universiteit van Amsterdam, Amsterdam, 1990.
15) Boshuizen HC, Bongers PM, Hulshof CTJ.
Self-reported back-pain in fork-lift truck and
freight-container tractor drivers exposed to
whole-body vibration. Spine 1992; 17: 59-65.
16) Bovenzi M, Zadini A. Self-reported low back
symptoms in urban bus drivers exposed to whole
body vibration. Spine 1992; 17(9): 1048-1059.
17) Burdorf A, Naaktgeboren B, de Groot HC.
Occupational risk factors for low back pain
among sedentary workers. J Occup Med 1993;
35(12): 1213-20.
18) Bovenzi M, Betta A. Low-back disorders in
agricultural tractor drivers exposed to whole-body
vibration and postural stress. Applied Ergonomics
1994; 25: 231-40.
19) Lings S, Leboeuf-Yde C. Whole-body vibration
and low back pain: a systematic, critical review of
the epidemiological literature 1992-1999. Int Arch
- 10 -

Occup Environ Health 2000; 73: 290-97. 560
s 561
e 562
a 563
564
. 565
566
567
r 568
569
f 570
571
s 572
573
574
e 575
576
: 577
578
. 579
. 580
: 581
582
583
: 584
585
586
l 587
588
589
. 590
591
t 592
f 593
594
, 595
596
c 597
598
599
600
604
609
614
618
622
626
634
639
20) Kjellberg A, Wikström BO, Landström U. Injurie
and other adverse effects of occupational exposur
to whole-body vibration. A review for criteri
documentation. Arb Hälsa, 41, 1994.
601
602
603
21) Schwarze S, Notbohm G, Dupuis H, Hartung E
Dose-response relationships between whole-body
vibration and lumbar disk disease—A field study
on 388 drivers of different vehicles. J Sound Vib
1998; 215(4): 613-28.
605
606
607
608
22) Burdorf A, Hulshof CTJ. Modelling the effects o
exposure to whole-body vibration on low-back
pain and its long-term consequences for sicknes
absence and associated work disability. J Sound
Vibr 2006; 298(3): 480-91.
610
611
612
613
23) Burdorf A, Sorock G. Positive and negativ
evidence for risk factors of work-related back
disorders. Scand J Work Environ Health 2003; 23
243-56.
615
616
617
24) Lötters F, Burdorf A, Kuiper J, Miedema H
Model for the work-relatedness of low-back pain
Scand J Work Environ Health 2003; 29(6)
431–40.
619
620
621
25) Washington State Department of Labor and
Industries. Ergonomics. Olympia (WA)
Washington State Department of Labor and
Industries. 1994.
623
624
625
26) Carter JT, Birrell LN (editors). Occupationa
health guidelines for the management of low back
pain at work—principal recommendations.
London: Faculty of Occupational Medicine. 2000
627
628
629
630
27) Waddell G, Burton AK. Occupational health
guidelines for the management of low back pain a
work—evidence review. London: Faculty o
Occupational Medicine. 2000.
631
632
633
28) Fallentin N, Viikari-Juntura E, Wærsted M
Kilbom Å. Evaluation of physical workload
standards and guidelines from a Nordi
perspective. Scand J Work Environ Health; 27
Suppl 2: 1–52. 2001.
635
636
637
638
29) Alcouffe J, Manillier P, Brehier M, Fabin C,
Faupin F. Analysis by sex of low back pain
among workers from small companies in the Paris
area: severity and occupational consequences.
Occup Environ Med 1999; 56: 696–701.
30) Burdorf A, Govaert G, Elders L. Postural load and
back pain of workers in the manufacturing of
prefabricated concrete elements. Ergonomics
1991; 34: 909–18.
31) Kumar A, Varghese M, Mohan D, Mahajan P,
Gulati P, Kale S. Effect of whole-body vibration
on the low back: a study of tractor-driving farmers
in north India. Spine 1999; 24: 2506–15.
32) Liira JP, Shannon HS, Chambers LW, Haines TA.
Long-term back problems and physical work
ex-posures in the 1990 Ontario Health Survey.
Am J Public Health 1996; 86: 382–7.
33) Linton S. Risk factors for neck and back pain in a
working population in Sweden. Work Stress 1990;
4: 41–9.
34) Magnusson ML, Pope MH, Wilder DG, Areskoug
B. Are occupational drivers at an increased risk
for developing musculoskeletal disorders? Spine
1996; 21: 710–7.
35) Pietri F, Lecerc A, Boitel L, Chastang JF, Mocret
JF, Blondet M. Low-back pain in commercial
travelers. Scand J Work Environ Health 1992; 18:
52–8.
36) Saraste H, Hultman G. Life conditions of persons
with and without low-back pain. Scand J Rehabil
Med 1987; 19: 109–13.
37) Xu Y, Bach E, Orhede E. Work environment and
low back pain: the influence of occupational
activities. Occup Environ Med 1997; 54: 741–5.
38) Bongers PM, Boshunizen HC, Hulshof CTJ,
Koemeester AC. Back disorders in crane
operators exposed to whole-body vibration. Int
Arch Occup Environ Health 1988; 60: 129-137.
39) Bovenzi M, Pinto I, Stacchini. Low back pain in
port machinery operators. J Sound Vibr 2002;
- 11 -
253(1): 9-20. 640
641
642
f 643
. 644
645
646
647
: 648
649
650
l 651
652
657
661
664
40) 西山勝夫,毛利一平訳. 作業関連疾患及び作業
関連災害の疫学. Joint ILO/WHO Committee on
Occupational Health. Epidemiology o
work-related disease and accident, WHO. 1987
労働基準調査会. 1991.
653
654
655
656
41) Bovenzi M, Ruia F, Negroa C, et al. An
epidemiological study of low back pain in
professional drivers. J Sound Vibr 2006; 298(3)
514-39.
658
659
660
42) Jones AL, Saunders DJ. Equal comfort contours
for whole body vertical, pulsed sinusoida
vibration. J Sound Vibr 1972; 23(1): 1-14.
662
663
43) Oborne DJ, Clarke MJ. The determination of
equal comfort zones for whole-body vibration.
Ergonomics 1974; 17: 769-782.
44) Forthergill LC, Griffin MJ. The subjective
magnitude of whole-body vibration. Ergonomics
1977; 20: 521-33.
45) International Organization for Standardization.
Mechanical vibration and shock – Evaluation of
human exposure to whole-body vibration – Part 5:
Method for evaluation containing multiple shocks,
ISO 2631-5, 1997.
- 12 -