Embed Size (px)
Citation preview
ERIA Study to Further Improve the AEC Scorecard: INVESTMENT
LIBERALIZATION AND FACILITATION
P O N C I A N O I N T A L , J R .
D I O N I S I U S N A R J O K O
M E R C Y S I M O R A N G K I R
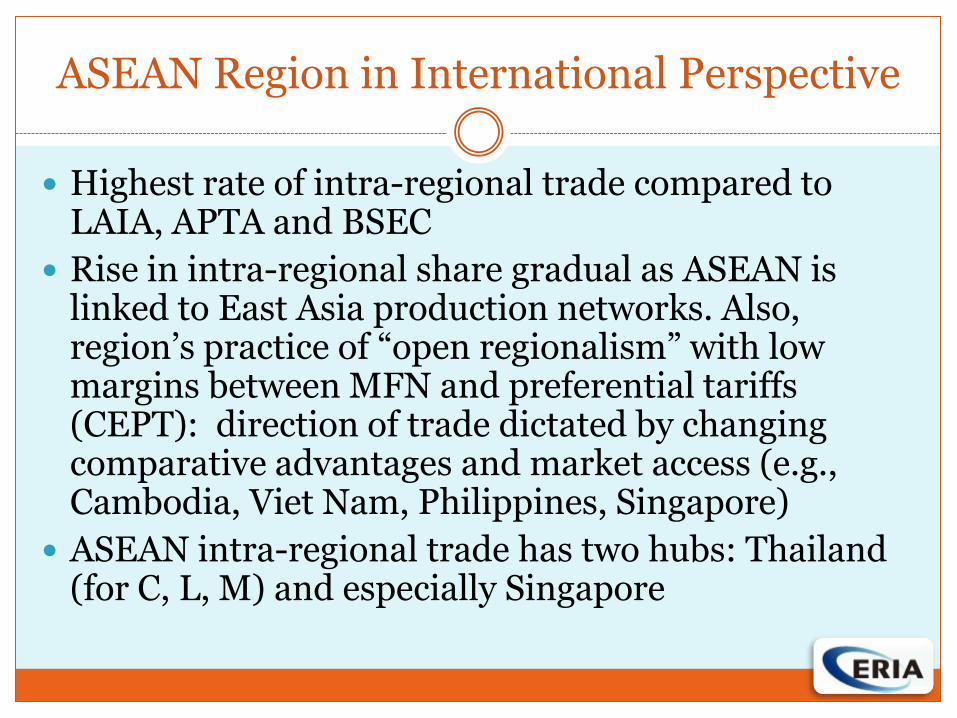
ASEAN Region in International Perspective
In 1990, ASEAN and APTA had comparable trade shares; by 2008, ASEAN’s share (around 16.5%) dwarfed by APTA’s share (around 33 %).
Model simulations suggest that China will crowd out ASEAN exports in third
markets by 2020 if China continues to liberalize while ASEAN does not. ASEAN leading investment destination in developing world in 1990-1991;
but global share declined to less than 10 percent by 2008. Moderate economic growth in 2000s, lower than APTA and BSEC. ASEAN more
trade dependent than APTA and BSEC Mixed individual country performance, with higher growth rates in CLMV
countries during the 2000s. Highly skewed foreign investment inflows, dominated by Singapore (46%), Thailand (17%) and Malaysia (14%)
Substantial progress in poverty reduction and improvements in public health.
Rise of middle class. But considerable number of poor remain (mainly in Indonesia, Myanmar, Philippines and Viet Nam)
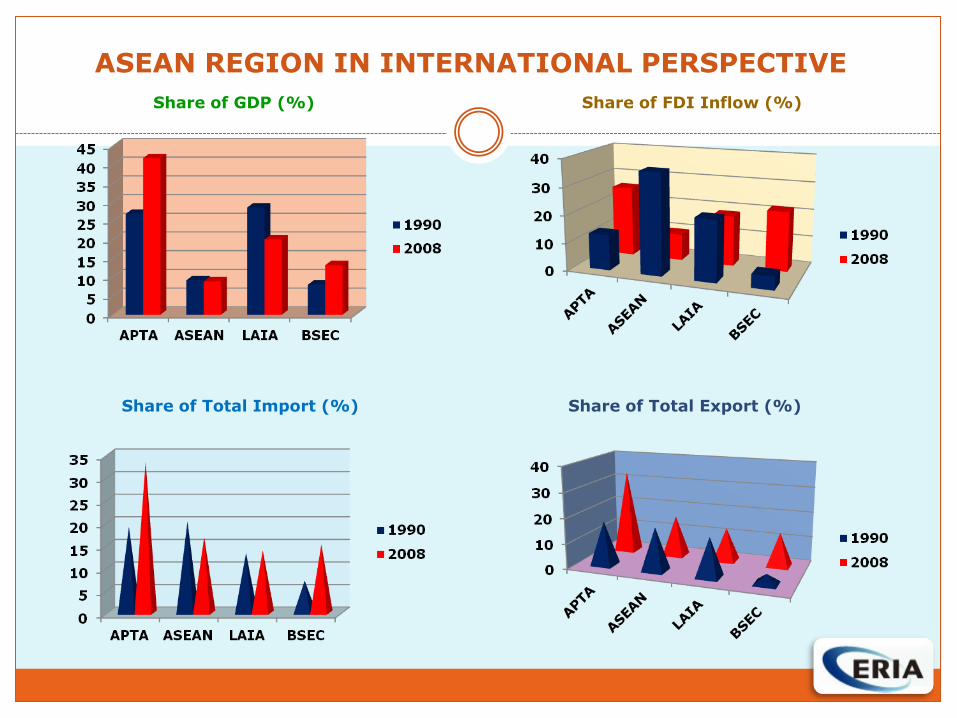
ASEAN REGION IN INTERNATIONAL PERSPECTIVE
Share of GDP (%) Share of FDI Inflow (%)
Share of Total Import (%) Share of Total Export (%)
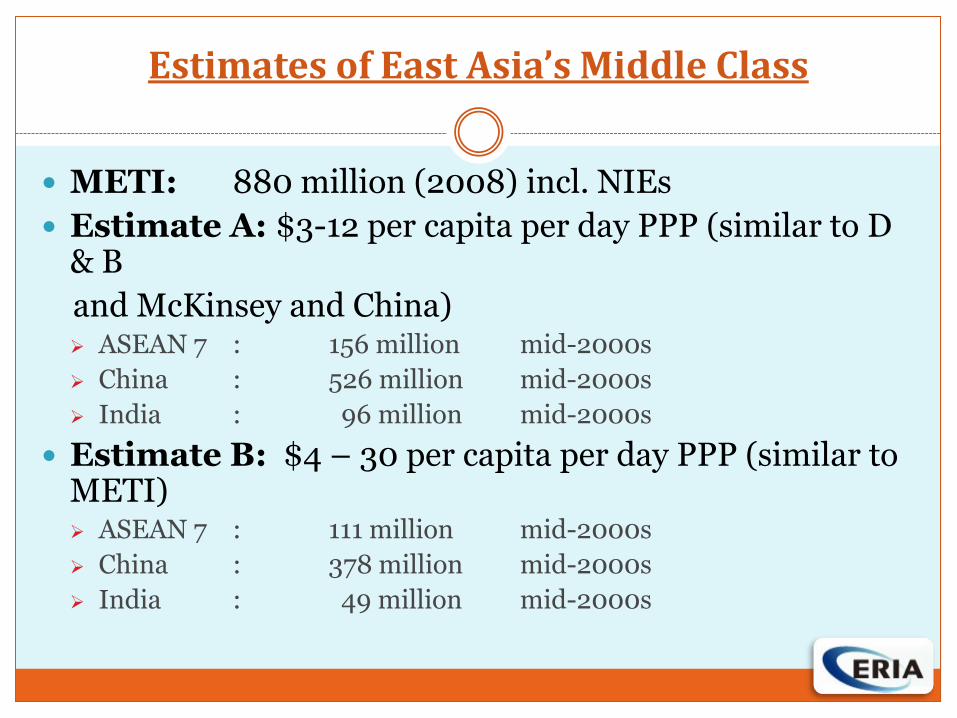
Estimates of East Asia’s Middle Class
METI: 880 million (2008) incl. NIEs
Estimate A: $3-12 per capita per day PPP (similar to D & B
and McKinsey and China) ASEAN 7 : 156 million mid-2000s
China : 526 million mid-2000s
India : 96 million mid-2000s
Estimate B: $4 – 30 per capita per day PPP (similar to METI) ASEAN 7 : 111 million mid-2000s
China : 378 million mid-2000s
India : 49 million mid-2000s
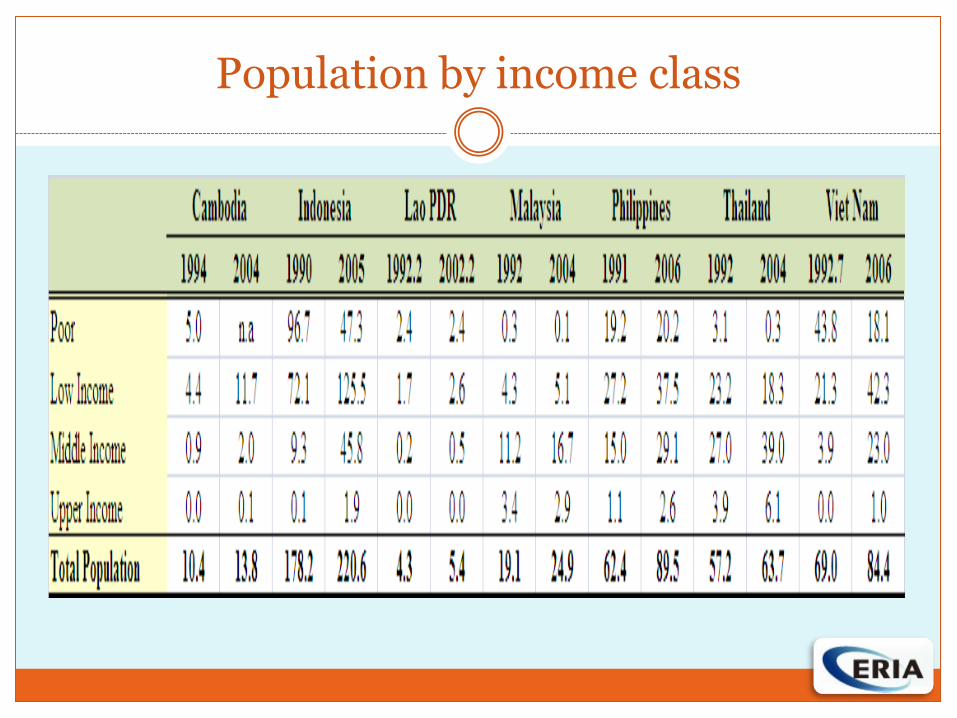
Population by income class
ASEAN Region in International Perspective
Highest rate of intra-regional trade compared to LAIA, APTA and BSEC
Rise in intra-regional share gradual as ASEAN is linked to East Asia production networks. Also, region’s practice of “open regionalism” with low margins between MFN and preferential tariffs (CEPT): direction of trade dictated by changing comparative advantages and market access (e.g., Cambodia, Viet Nam, Philippines, Singapore)
ASEAN intra-regional trade has two hubs: Thailand (for C, L, M) and especially Singapore
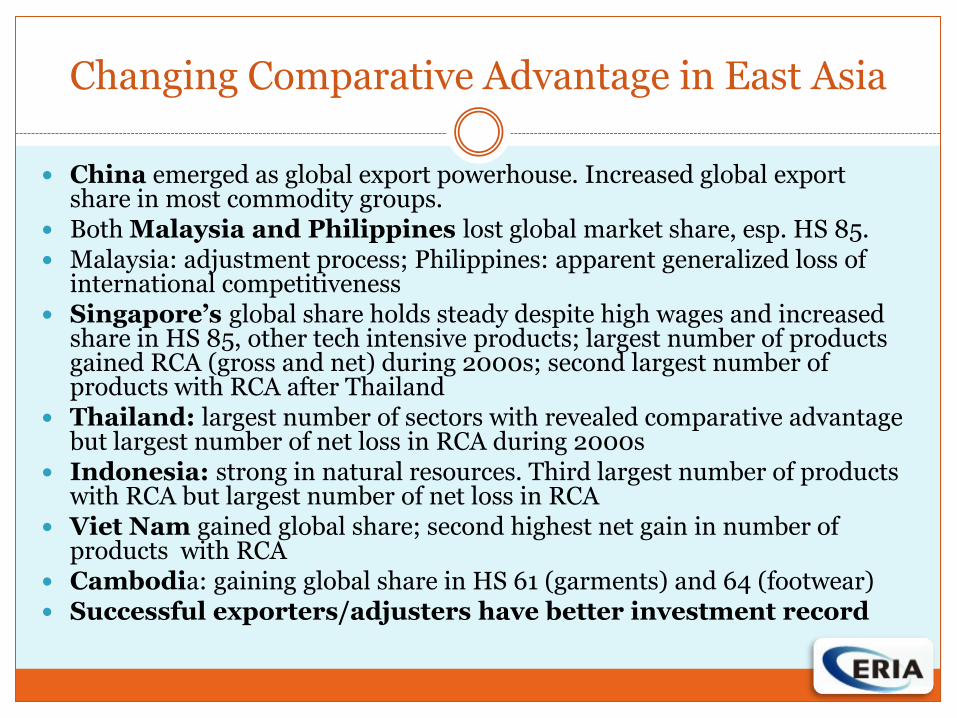
Changing Comparative Advantage in East Asia
China emerged as global export powerhouse. Increased global export share in most commodity groups.
Both Malaysia and Philippines lost global market share, esp. HS 85. Malaysia: adjustment process; Philippines: apparent generalized loss of
international competitiveness Singapore’s global share holds steady despite high wages and increased
share in HS 85, other tech intensive products; largest number of products gained RCA (gross and net) during 2000s; second largest number of products with RCA after Thailand
Thailand: largest number of sectors with revealed comparative advantage but largest number of net loss in RCA during 2000s
Indonesia: strong in natural resources. Third largest number of products with RCA but largest number of net loss in RCA
Viet Nam gained global share; second highest net gain in number of products with RCA
Cambodia: gaining global share in HS 61 (garments) and 64 (footwear) Successful exporters/adjusters have better investment record
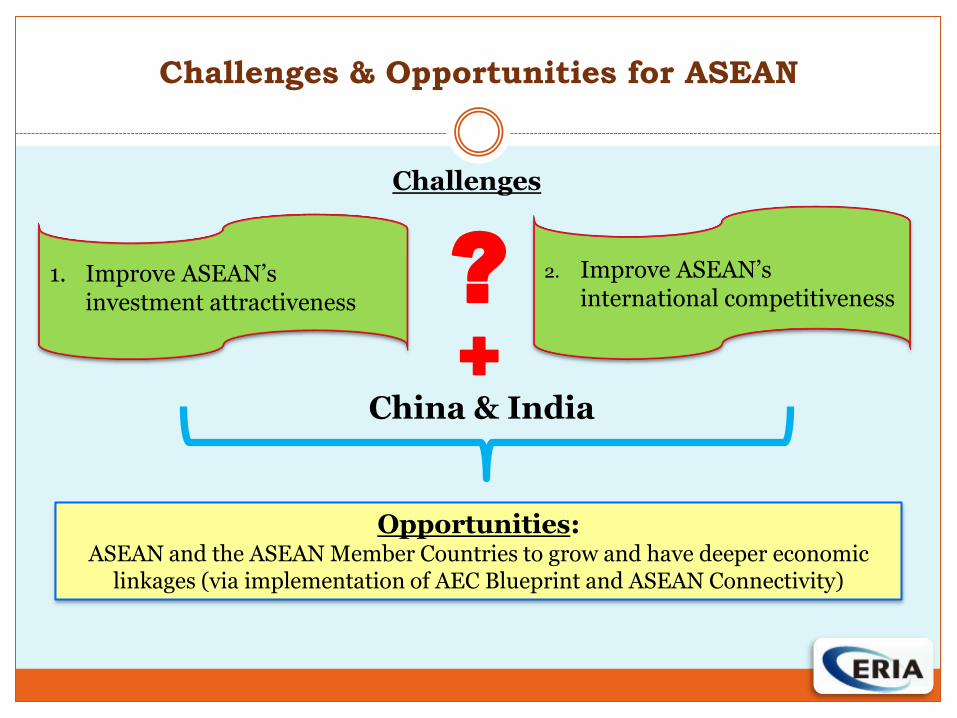
Challenges & Opportunities for ASEAN
? 1. Improve ASEAN’s
investment attractiveness
2. Improve ASEAN’s international competitiveness
+
China & India
Opportunities: ASEAN and the ASEAN Member Countries to grow and have deeper economic
linkages (via implementation of AEC Blueprint and ASEAN Connectivity)
Challenges
Critical Questions
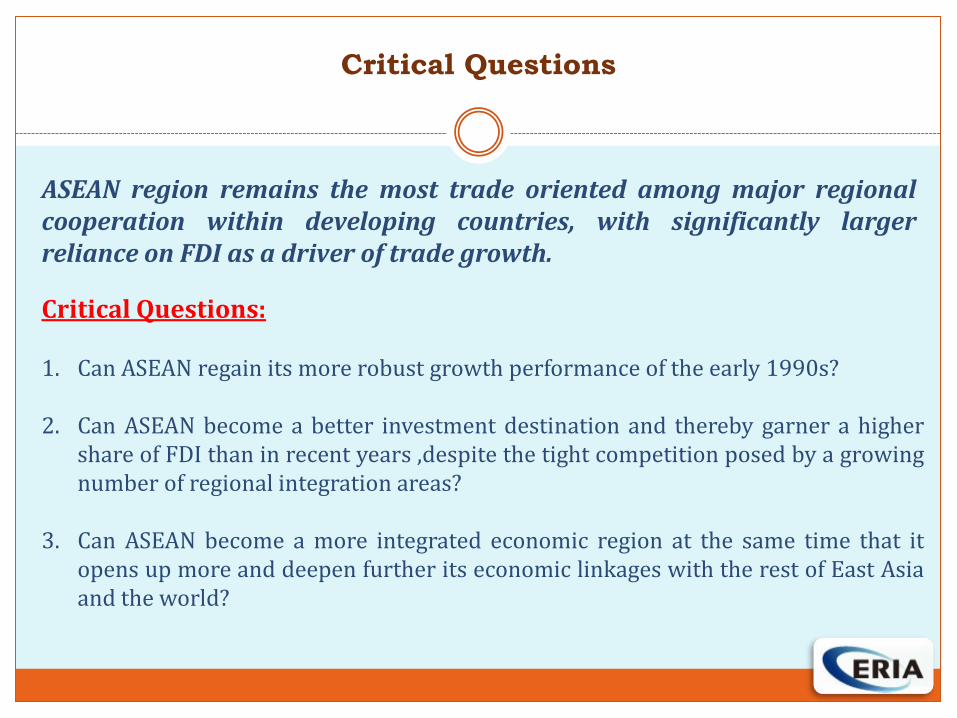
ASEAN region remains the most trade oriented among major regional cooperation within developing countries, with significantly larger reliance on FDI as a driver of trade growth.
Critical Questions: 1. Can ASEAN regain its more robust growth performance of the early 1990s? 2. Can ASEAN become a better investment destination and thereby garner a higher
share of FDI than in recent years ,despite the tight competition posed by a growing number of regional integration areas?
3. Can ASEAN become a more integrated economic region at the same time that it
opens up more and deepen further its economic linkages with the rest of East Asia and the world?
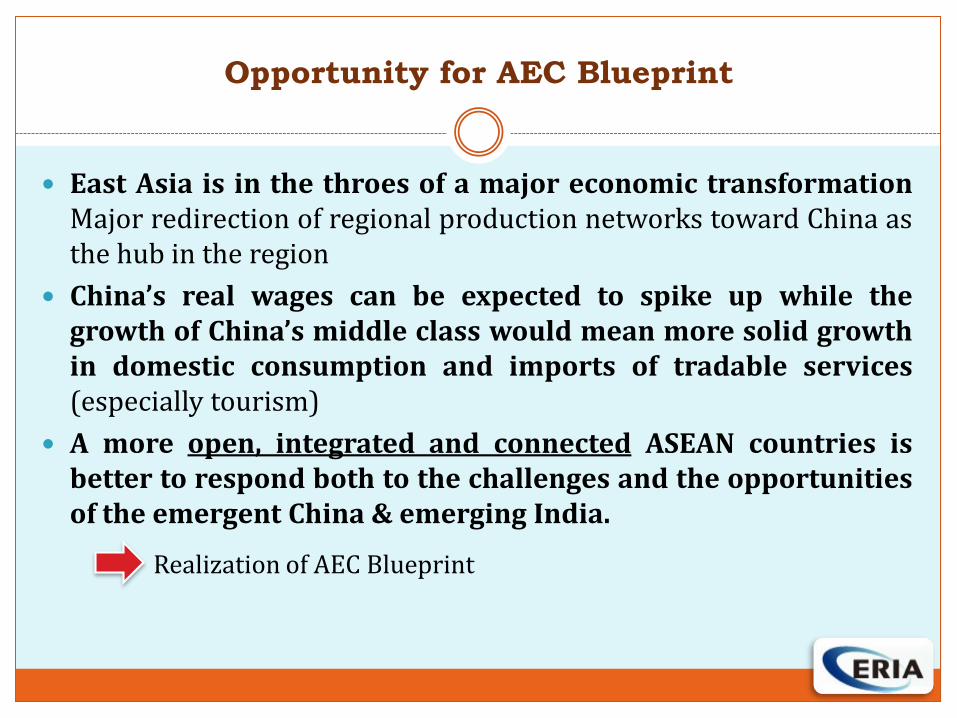
East Asia is in the throes of a major economic transformation Major redirection of regional production networks toward China as the hub in the region
China’s real wages can be expected to spike up while the growth of China’s middle class would mean more solid growth in domestic consumption and imports of tradable services (especially tourism)
A more open, integrated and connected ASEAN countries is better to respond both to the challenges and the opportunities of the emergent China & emerging India.
Opportunity for AEC Blueprint
Realization of AEC Blueprint
III. The AEC Blueprint & the Challenges of ASEAN Integration
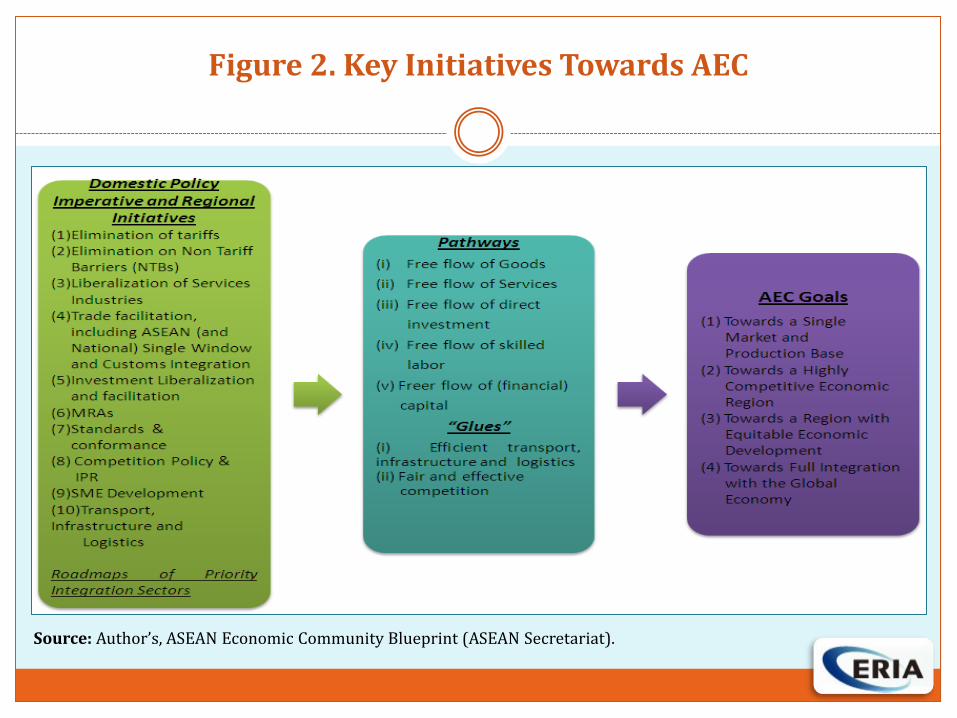
Figure 2. Key Initiatives Towards AEC
Source: Author’s, ASEAN Economic Community Blueprint (ASEAN Secretariat).
IV. Investment Liberalization and Facilitation
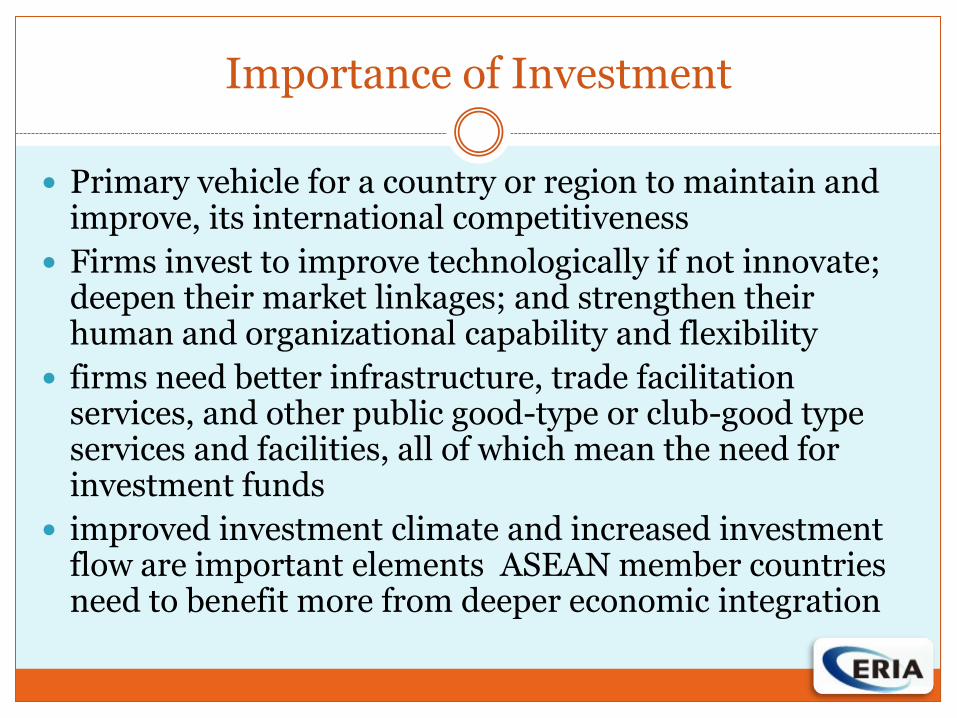
Importance of Investment
Primary vehicle for a country or region to maintain and improve, its international competitiveness
Firms invest to improve technologically if not innovate; deepen their market linkages; and strengthen their human and organizational capability and flexibility
firms need better infrastructure, trade facilitation services, and other public good-type or club-good type services and facilities, all of which mean the need for investment funds
improved investment climate and increased investment flow are important elements ASEAN member countries need to benefit more from deeper economic integration
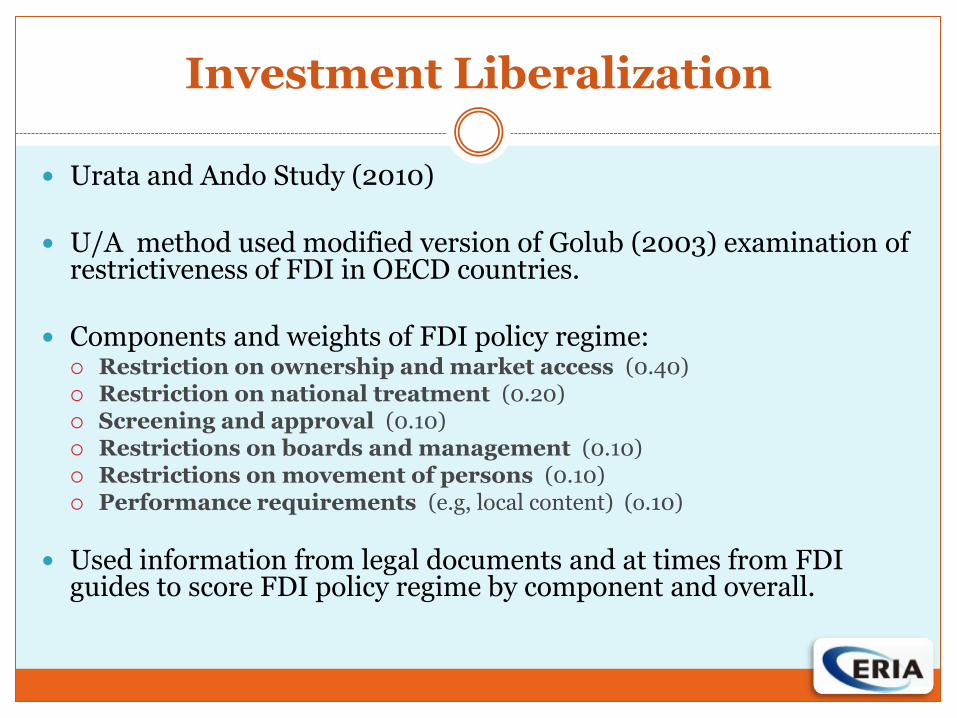
Investment Liberalization
Urata and Ando Study (2010) U/A method used modified version of Golub (2003) examination of
restrictiveness of FDI in OECD countries. Components and weights of FDI policy regime:
Restriction on ownership and market access (0.40) Restriction on national treatment (0.20) Screening and approval (0.10) Restrictions on boards and management (0.10) Restrictions on movement of persons (0.10) Performance requirements (e.g, local content) (o.10)
Used information from legal documents and at times from FDI guides to score FDI policy regime by component and overall.
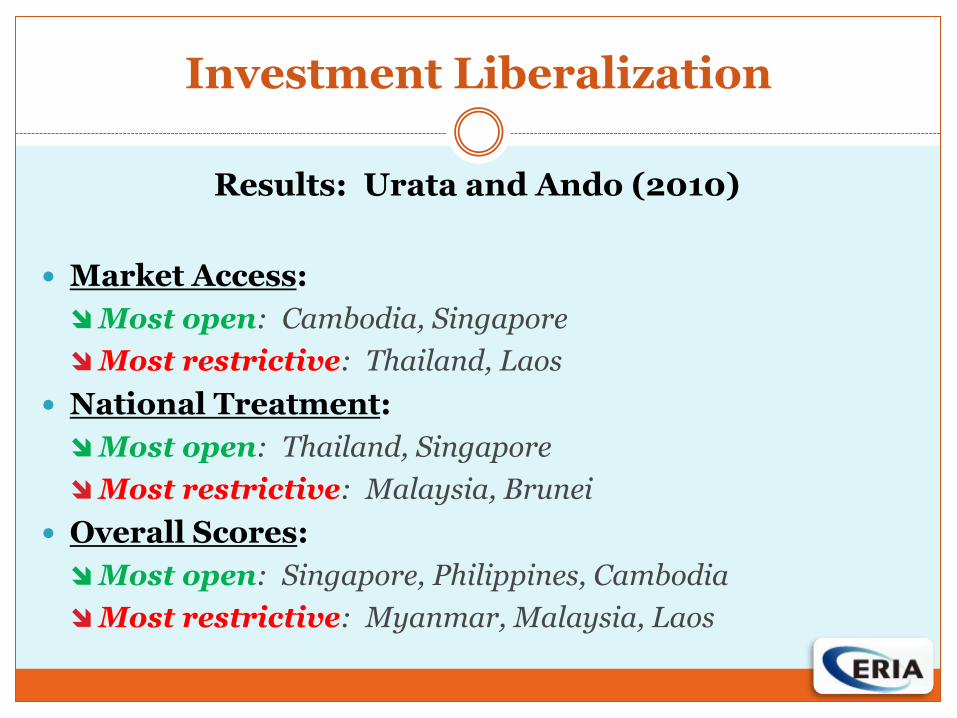
Investment Liberalization
Results: Urata and Ando (2010)
Market Access:
Most open: Cambodia, Singapore
Most restrictive: Thailand, Laos
National Treatment:
Most open: Thailand, Singapore
Most restrictive: Malaysia, Brunei
Overall Scores:
Most open: Singapore, Philippines, Cambodia
Most restrictive: Myanmar, Malaysia, Laos
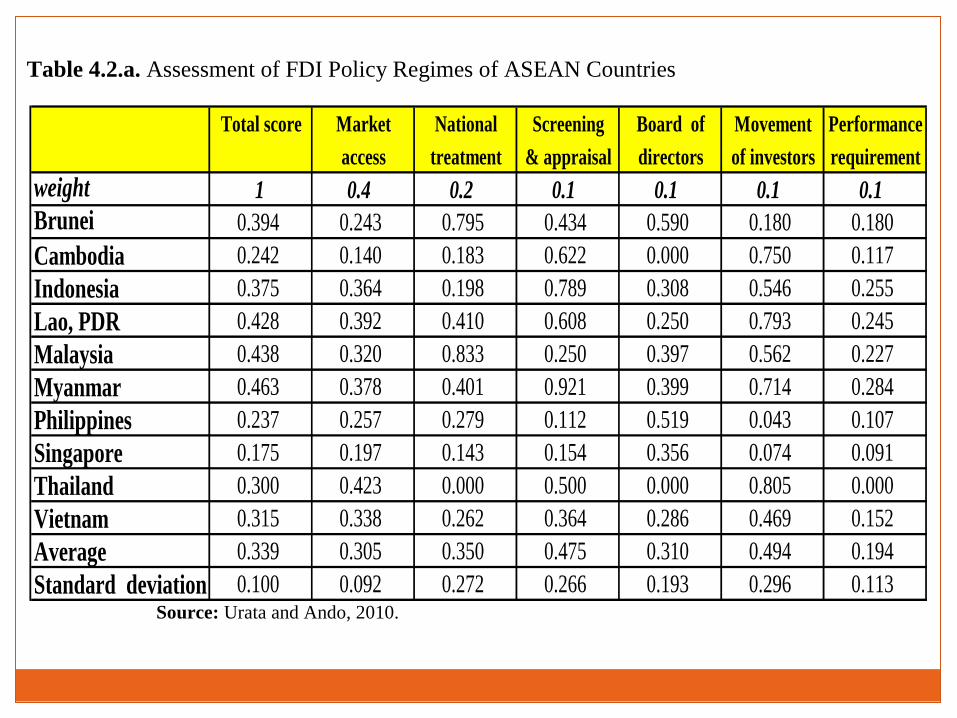
Table 4.2.a. Assessment of FDI Policy Regimes of ASEAN Countries
Source: Urata and Ando, 2010.
Total score Market National Screening Board of Movement Performance
access treatment & appraisal directors of investors requirement
weight 1 0.4 0.2 0.1 0.1 0.1 0.1
Brunei 0.394 0.243 0.795 0.434 0.590 0.180 0.180
Cambodia 0.242 0.140 0.183 0.622 0.000 0.750 0.117
Indonesia 0.375 0.364 0.198 0.789 0.308 0.546 0.255
Lao, PDR 0.428 0.392 0.410 0.608 0.250 0.793 0.245
Malaysia 0.438 0.320 0.833 0.250 0.397 0.562 0.227
Myanmar 0.463 0.378 0.401 0.921 0.399 0.714 0.284
Philippines 0.237 0.257 0.279 0.112 0.519 0.043 0.107
Singapore 0.175 0.197 0.143 0.154 0.356 0.074 0.091
Thailand 0.300 0.423 0.000 0.500 0.000 0.805 0.000
Vietnam 0.315 0.338 0.262 0.364 0.286 0.469 0.152
Average 0.339 0.305 0.350 0.475 0.310 0.494 0.194
Standard deviation 0.100 0.092 0.272 0.266 0.193 0.296 0.113
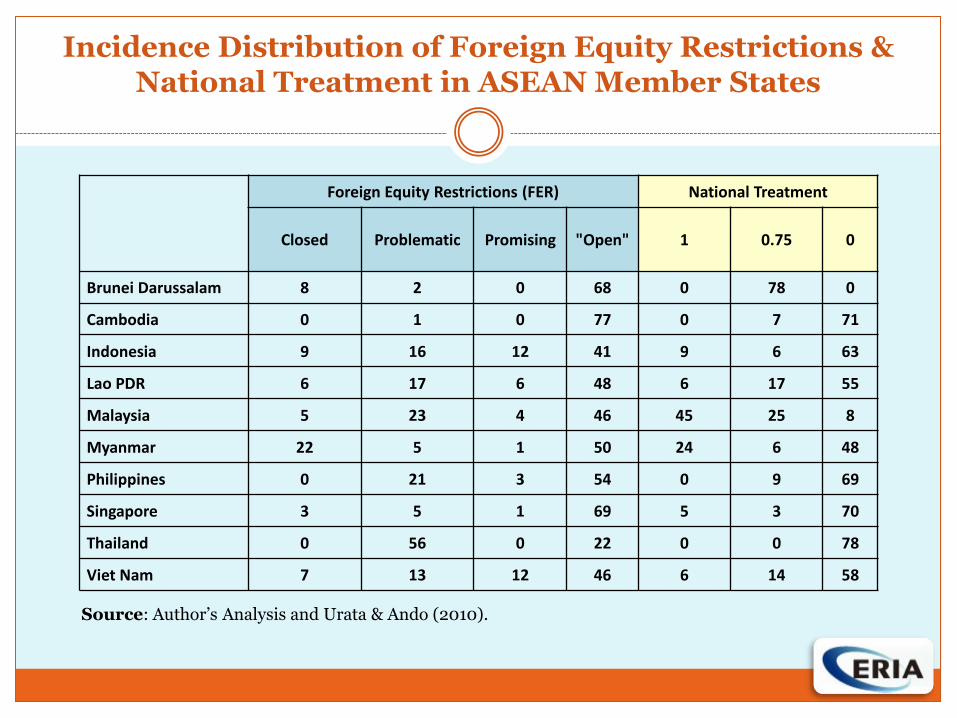
Incidence Distribution of Foreign Equity Restrictions & National Treatment in ASEAN Member States
Foreign Equity Restrictions (FER) National Treatment
Closed Problematic Promising "Open" 1 0.75 0
Brunei Darussalam 8 2 0 68 0 78 0
Cambodia 0 1 0 77 0 7 71
Indonesia 9 16 12 41 9 6 63
Lao PDR 6 17 6 48 6 17 55
Malaysia 5 23 4 46 45 25 8
Myanmar 22 5 1 50 24 6 48
Philippines 0 21 3 54 0 9 69
Singapore 3 5 1 69 5 3 70
Thailand 0 56 0 22 0 0 78
Viet Nam 7 13 12 46 6 14 58
Source: Author’s Analysis and Urata & Ando (2010).
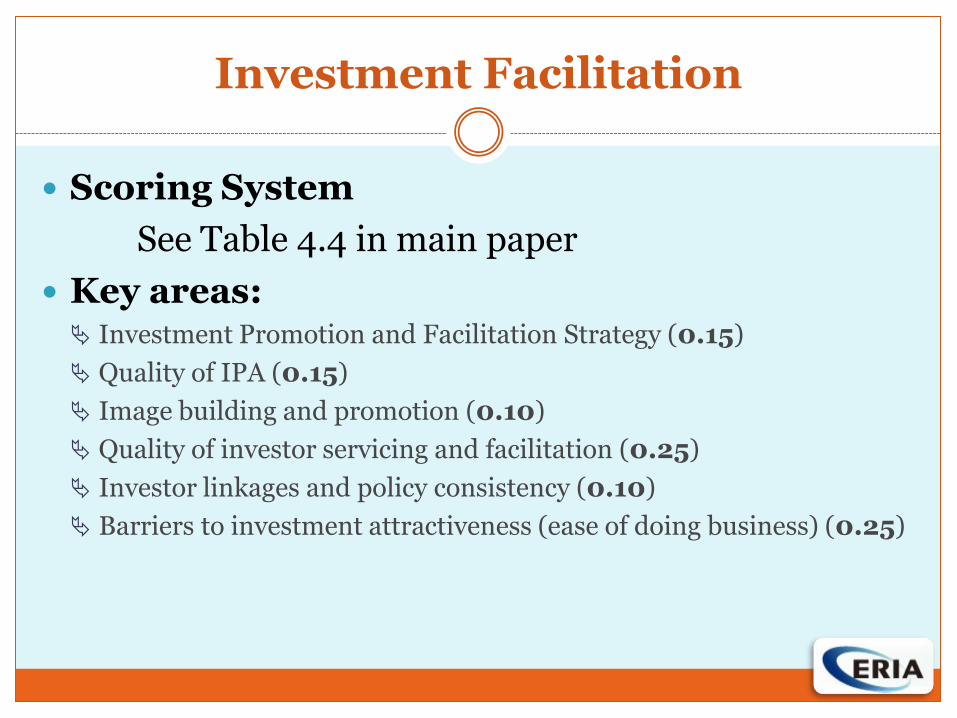
Investment Facilitation
Scoring System
See Table 4.4 in main paper
Key areas: Investment Promotion and Facilitation Strategy (0.15)
Quality of IPA (0.15)
Image building and promotion (0.10)
Quality of investor servicing and facilitation (0.25)
Investor linkages and policy consistency (0.10)
Barriers to investment attractiveness (ease of doing business) (0.25)
Approach
Study undertaken by country research team in each ASEAN member country, led and coordinated by ERIA with advice from Steering Committee members (HLTF, ASEC, ERIA RIN) and Senior Research Advisers (from Waseda and ANU)
2 questionnaires on investment facilitation and promotion: IPF Questionnaire for IPAs and Government Officials IPF Questionnaire for Private Firms
Questions in the questionnaires based on OECD Investment Reform Index, World Bank Investment Climate Advisory Services, APEC, academic literature, and internal discussions. Questions crafted to elicit scorable responses and specific answers.
Characteristics of Best Performing IPAs
Autonomous or joint govt private or wholly private
Salary close to or comparable to private sector
Corporate culture: continuous development of staff; “account officer” approach to client relations
IPA has in house research capability or can tap outside research institution
Adequate funding and staffing with some flexibility in use of resources
Information is clear, up to date, complete, readily available or accessible
Quality of handling investor initial inquiries
Characteristics of Effective Investment Facilitation
Minimize time and cost for investors to start up business
Processes are expeditious, clear, coordinated, and transparent.
One stop shops’ effectiveness lies on good interagency coordination and efficient systems.
Ease of doing business and reduced barriers to starting and operating business
Quality of investor –govt interactions/consultations and policy transparency
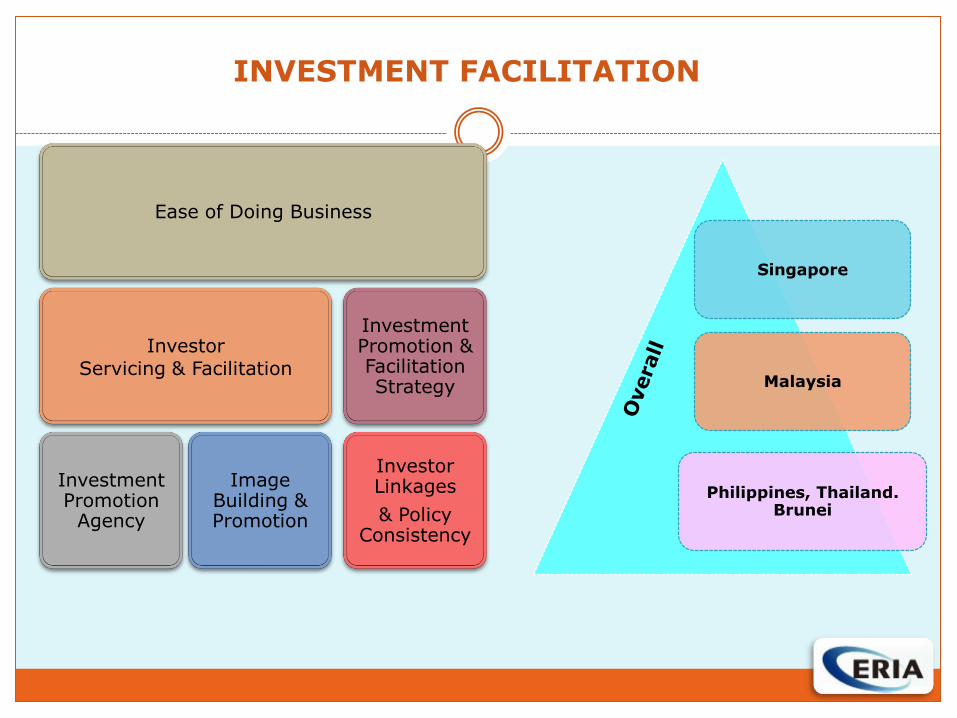
INVESTMENT FACILITATION
Ease of Doing Business
Investor Servicing & Facilitation
Investment Promotion
Agency
Image Building & Promotion
Investment Promotion & Facilitation Strategy
Investor Linkages
& Policy Consistency
Singapore
Malaysia
Philippines, Thailand. Brunei
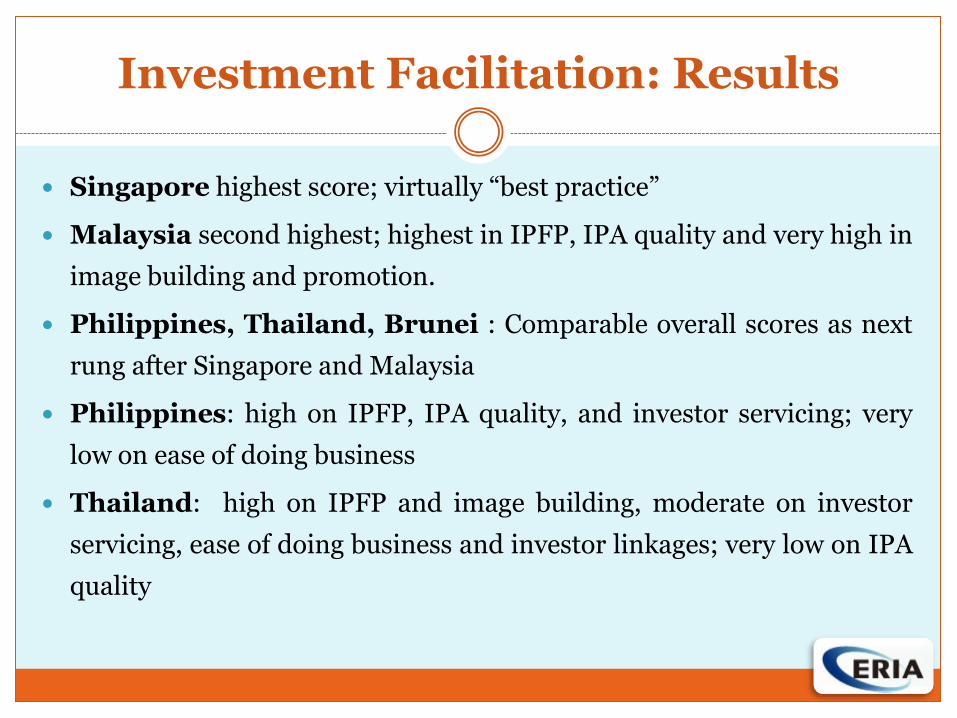
Investment Facilitation: Results
Singapore highest score; virtually “best practice”
Malaysia second highest; highest in IPFP, IPA quality and very high in
image building and promotion.
Philippines, Thailand, Brunei : Comparable overall scores as next
rung after Singapore and Malaysia
Philippines: high on IPFP, IPA quality, and investor servicing; very
low on ease of doing business
Thailand: high on IPFP and image building, moderate on investor
servicing, ease of doing business and investor linkages; very low on IPA
quality
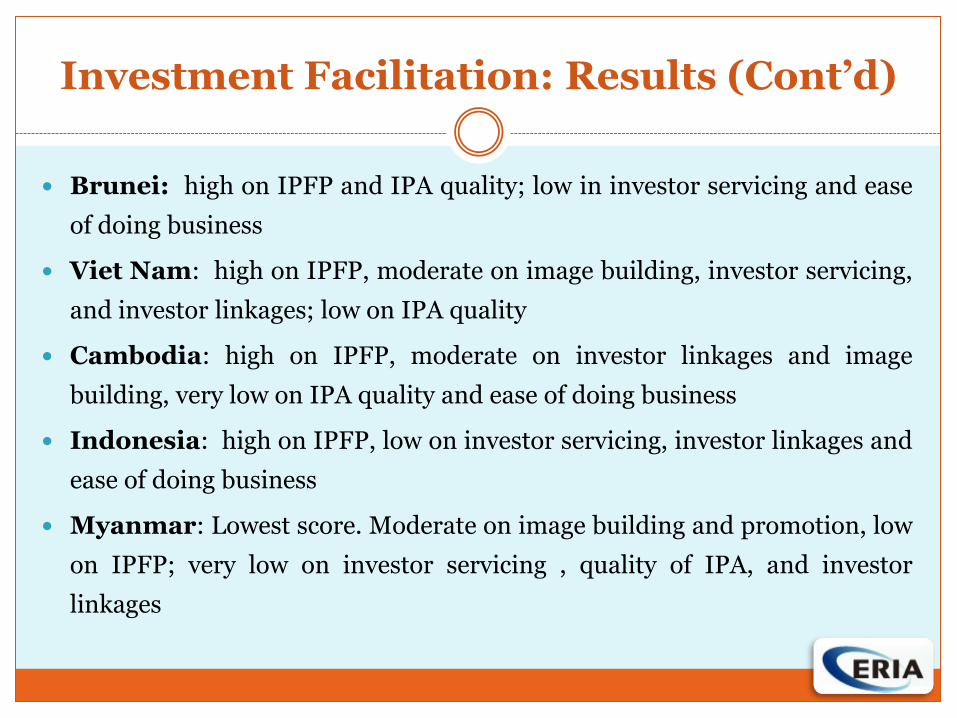
Investment Facilitation: Results (Cont’d)
Brunei: high on IPFP and IPA quality; low in investor servicing and ease
of doing business
Viet Nam: high on IPFP, moderate on image building, investor servicing,
and investor linkages; low on IPA quality
Cambodia: high on IPFP, moderate on investor linkages and image
building, very low on IPA quality and ease of doing business
Indonesia: high on IPFP, low on investor servicing, investor linkages and
ease of doing business
Myanmar: Lowest score. Moderate on image building and promotion, low
on IPFP; very low on investor servicing , quality of IPA, and investor
linkages
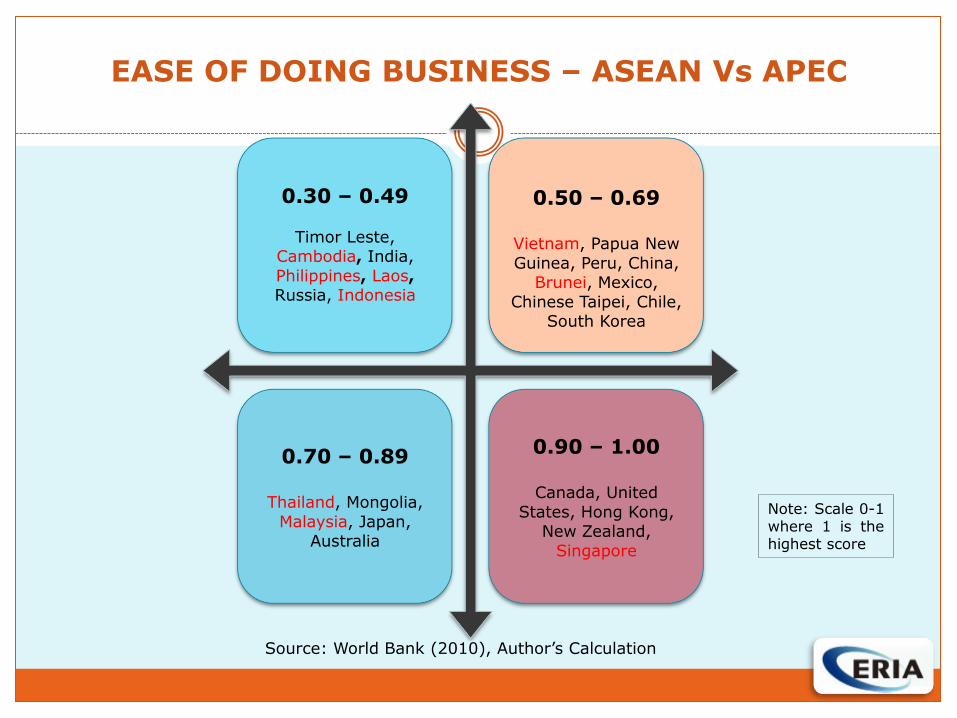
EASE OF DOING BUSINESS – ASEAN Vs APEC
0.30 – 0.49
Timor Leste, Cambodia, India,
Philippines, Laos, Russia, Indonesia
0.50 – 0.69
Vietnam, Papua New
Guinea, Peru, China, Brunei, Mexico,
Chinese Taipei, Chile, South Korea
0.70 – 0.89
Thailand, Mongolia,
Malaysia, Japan, Australia
0.90 – 1.00
Canada, United
States, Hong Kong, New Zealand,
Singapore
Source: World Bank (2010), Author’s Calculation
Note: Scale 0-1 where 1 is the highest score
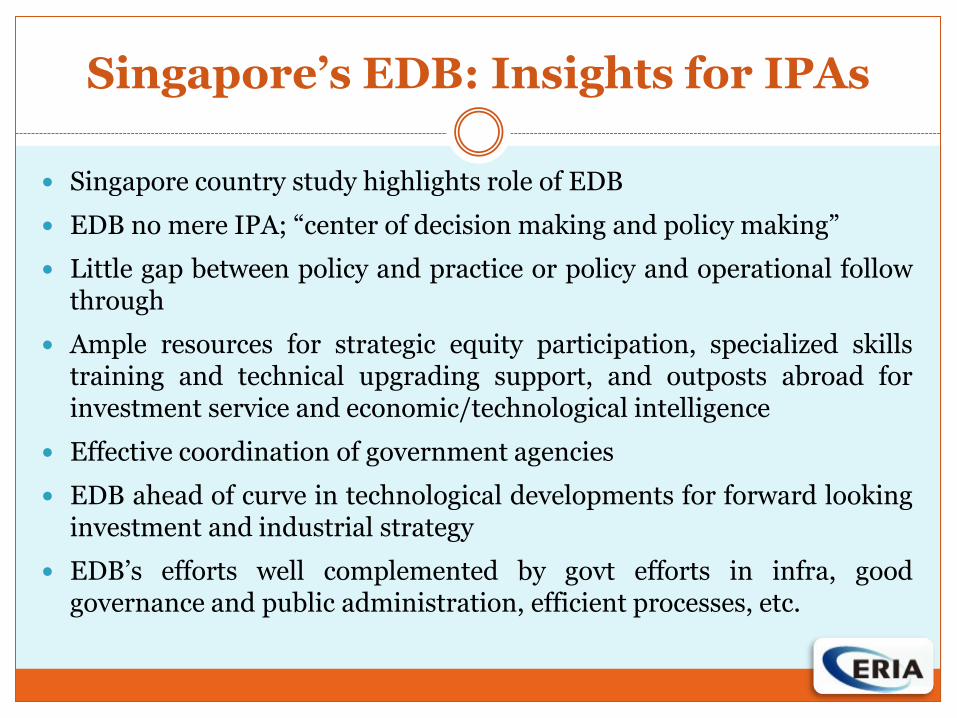
Singapore’s EDB: Insights for IPAs
Singapore country study highlights role of EDB
EDB no mere IPA; “center of decision making and policy making”
Little gap between policy and practice or policy and operational follow through
Ample resources for strategic equity participation, specialized skills training and technical upgrading support, and outposts abroad for investment service and economic/technological intelligence
Effective coordination of government agencies
EDB ahead of curve in technological developments for forward looking investment and industrial strategy
EDB’s efforts well complemented by govt efforts in infra, good governance and public administration, efficient processes, etc.
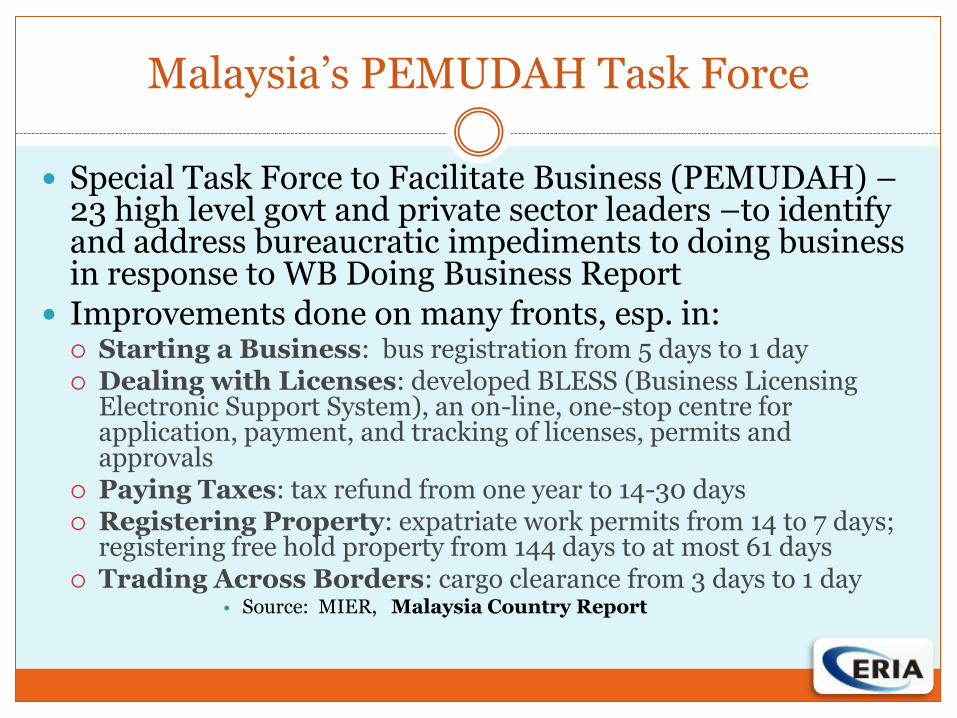
Malaysia’s PEMUDAH Task Force
Special Task Force to Facilitate Business (PEMUDAH) –23 high level govt and private sector leaders –to identify and address bureaucratic impediments to doing business in response to WB Doing Business Report
Improvements done on many fronts, esp. in: Starting a Business: bus registration from 5 days to 1 day Dealing with Licenses: developed BLESS (Business Licensing
Electronic Support System), an on-line, one-stop centre for application, payment, and tracking of licenses, permits and approvals
Paying Taxes: tax refund from one year to 14-30 days Registering Property: expatriate work permits from 14 to 7 days;
registering free hold property from 144 days to at most 61 days Trading Across Borders: cargo clearance from 3 days to 1 day
• Source: MIER, Malaysia Country Report
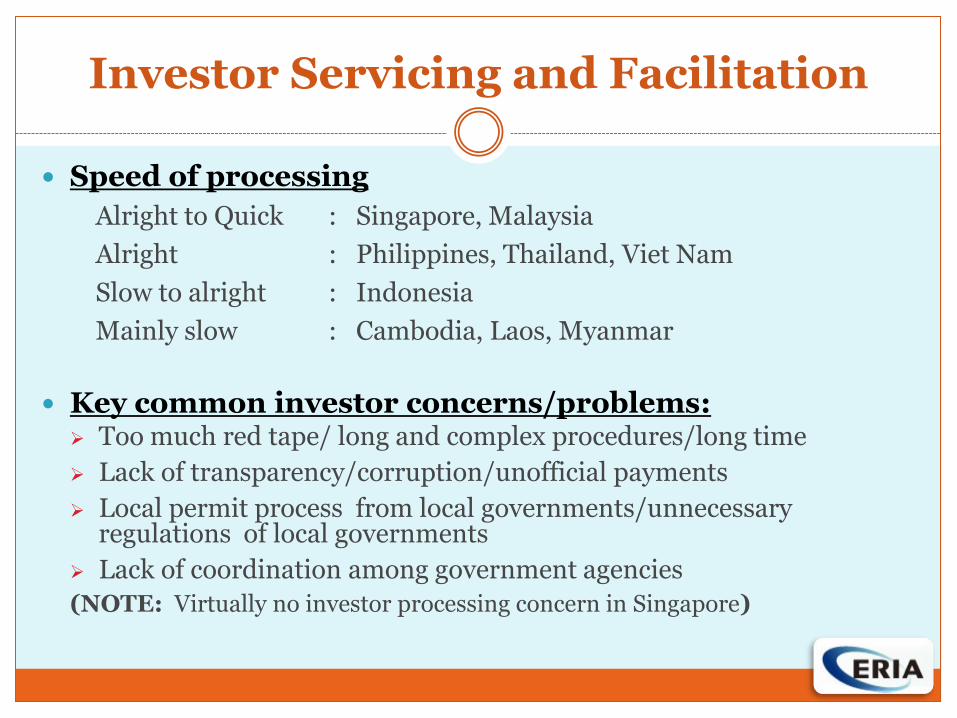
Investor Servicing and Facilitation
Speed of processing
Alright to Quick : Singapore, Malaysia
Alright : Philippines, Thailand, Viet Nam
Slow to alright : Indonesia
Mainly slow : Cambodia, Laos, Myanmar
Key common investor concerns/problems: Too much red tape/ long and complex procedures/long time
Lack of transparency/corruption/unofficial payments
Local permit process from local governments/unnecessary regulations of local governments
Lack of coordination among government agencies
(NOTE: Virtually no investor processing concern in Singapore)
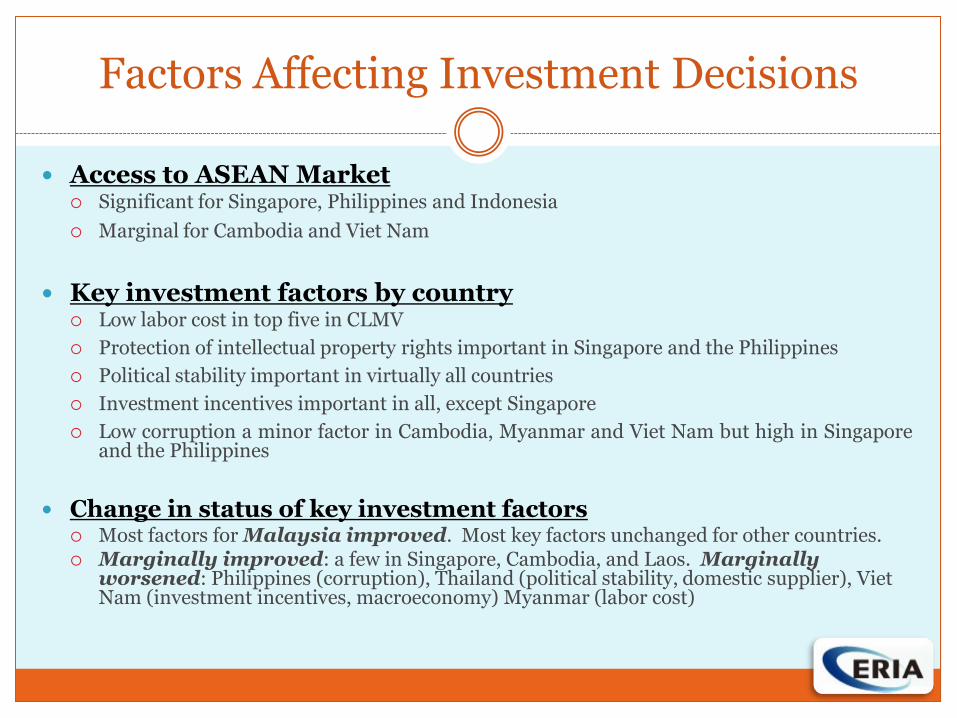
Factors Affecting Investment Decisions
Access to ASEAN Market Significant for Singapore, Philippines and Indonesia
Marginal for Cambodia and Viet Nam
Key investment factors by country Low labor cost in top five in CLMV
Protection of intellectual property rights important in Singapore and the Philippines
Political stability important in virtually all countries
Investment incentives important in all, except Singapore
Low corruption a minor factor in Cambodia, Myanmar and Viet Nam but high in Singapore and the Philippines
Change in status of key investment factors Most factors for Malaysia improved. Most key factors unchanged for other countries. Marginally improved: a few in Singapore, Cambodia, and Laos. Marginally
worsened: Philippines (corruption), Thailand (political stability, domestic supplier), Viet Nam (investment incentives, macroeconomy) Myanmar (labor cost)
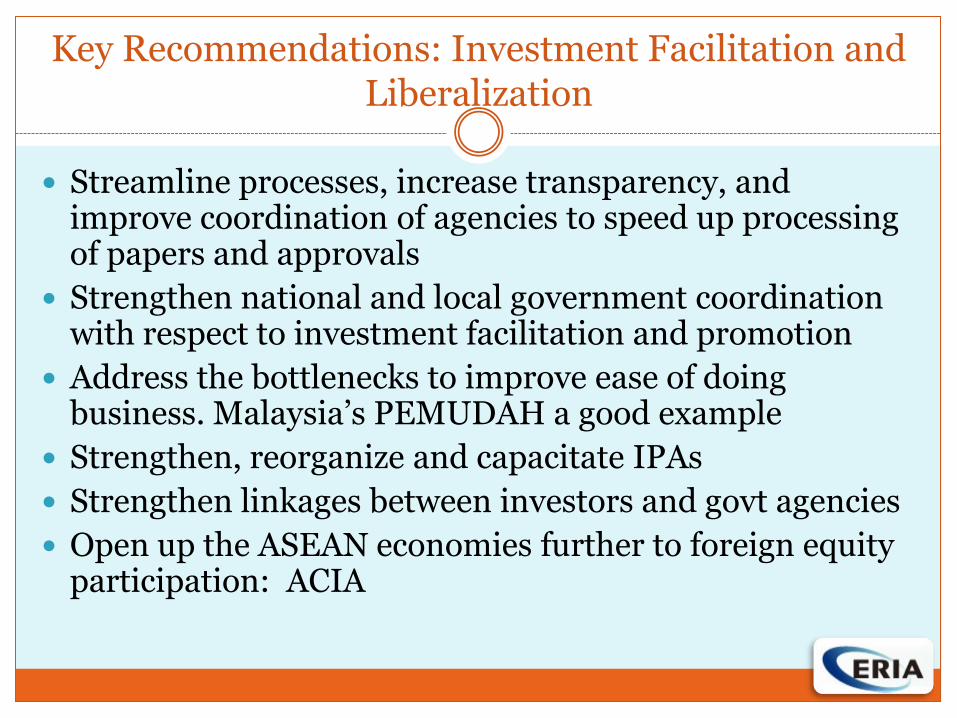
Key Recommendations: Investment Facilitation and Liberalization
Streamline processes, increase transparency, and improve coordination of agencies to speed up processing of papers and approvals
Strengthen national and local government coordination with respect to investment facilitation and promotion
Address the bottlenecks to improve ease of doing business. Malaysia’s PEMUDAH a good example
Strengthen, reorganize and capacitate IPAs
Strengthen linkages between investors and govt agencies
Open up the ASEAN economies further to foreign equity participation: ACIA