Embed Size (px)
Citation preview
Estructura del cuestionario de la encuesta
2017 ICP LAC: Primera Reunión Técnica del Programa de Comparación Internacional (PCI)
Junio 27-29 2017
Santiago, Chile
Estructura del cuestionario de la encuesta PCI 2017
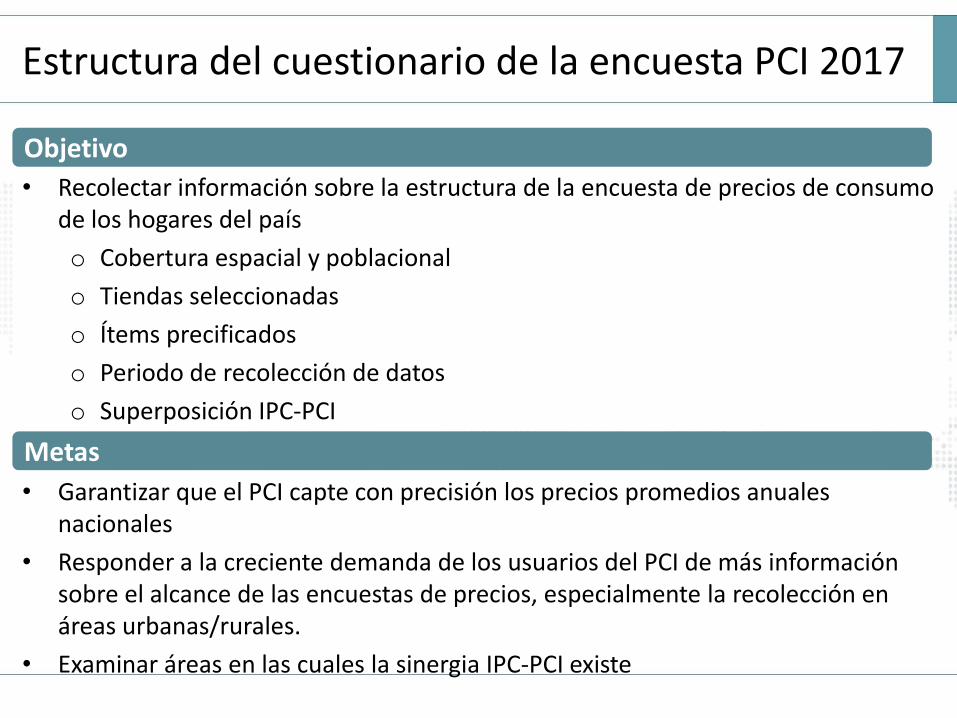
• Recolectar información sobre la estructura de la encuesta de precios de consumo de los hogares del país
o Cobertura espacial y poblacional
o Tiendas seleccionadas
o Ítems precificados
o Periodo de recolección de datos
o Superposición IPC-PCI
Objetivo
Metas
• Garantizar que el PCI capte con precisión los precios promedios anuales nacionales
• Responder a la creciente demanda de los usuarios del PCI de más información sobre el alcance de las encuestas de precios, especialmente la recolección en áreas urbanas/rurales.
• Examinar áreas en las cuales la sinergia IPC-PCI existe
Estructura del cuestionario: lecciones aprendidas
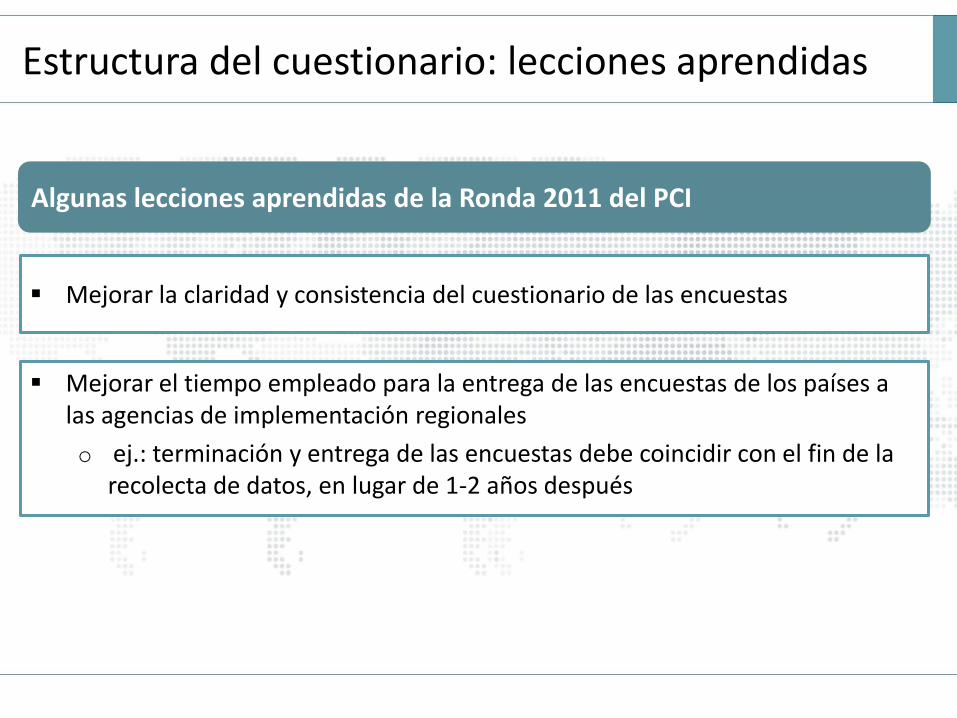
Algunas lecciones aprendidas de la Ronda 2011 del PCI
Mejorar la claridad y consistencia del cuestionario de las encuestas
Mejorar el tiempo empleado para la entrega de las encuestas de los países a las agencias de implementación regionales
o ej.: terminación y entrega de las encuestas debe coincidir con el fin de la recolecta de datos, en lugar de 1-2 años después
Estructura del cuestionario: cambios en 2017
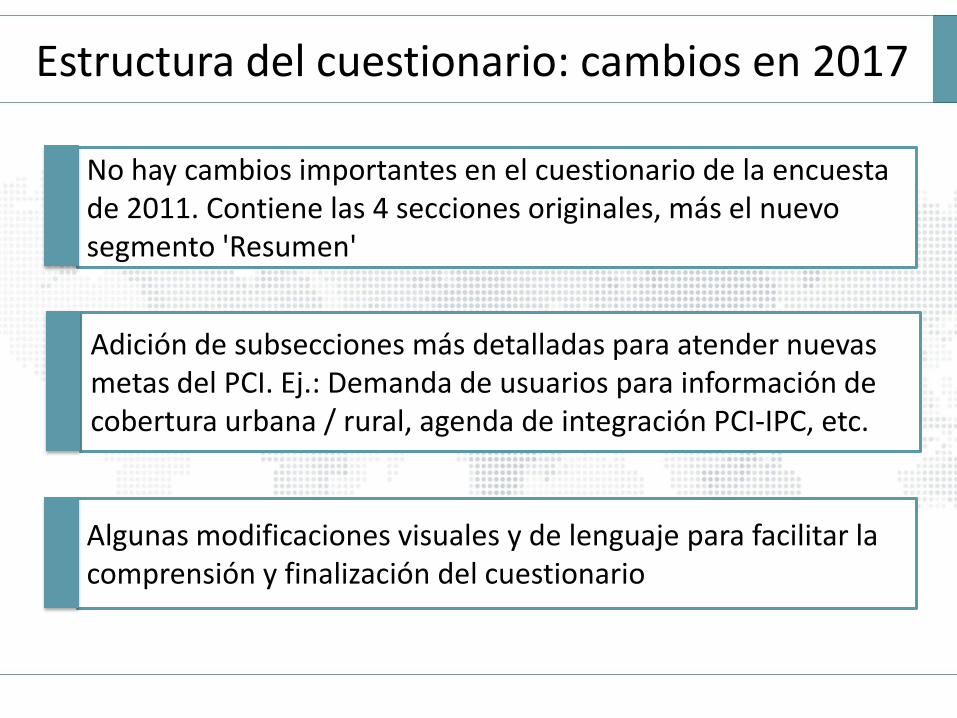
No hay cambios importantes en el cuestionario de la encuesta de 2011. Contiene las 4 secciones originales, más el nuevo segmento 'Resumen'
Adición de subsecciones más detalladas para atender nuevas metas del PCI. Ej.: Demanda de usuarios para información de cobertura urbana / rural, agenda de integración PCI-IPC, etc.
Algunas modificaciones visuales y de lenguaje para facilitar la comprensión y finalización del cuestionario
Estructura del cuestionario: cambios en 2017
Atención!!
La estructura del cuestionario PCI 2017 está disponible apenas en inglés por ahora. Las próximas pantallas contienen comentarios en español sobre las imágenes originales del cuestionario en inglés.
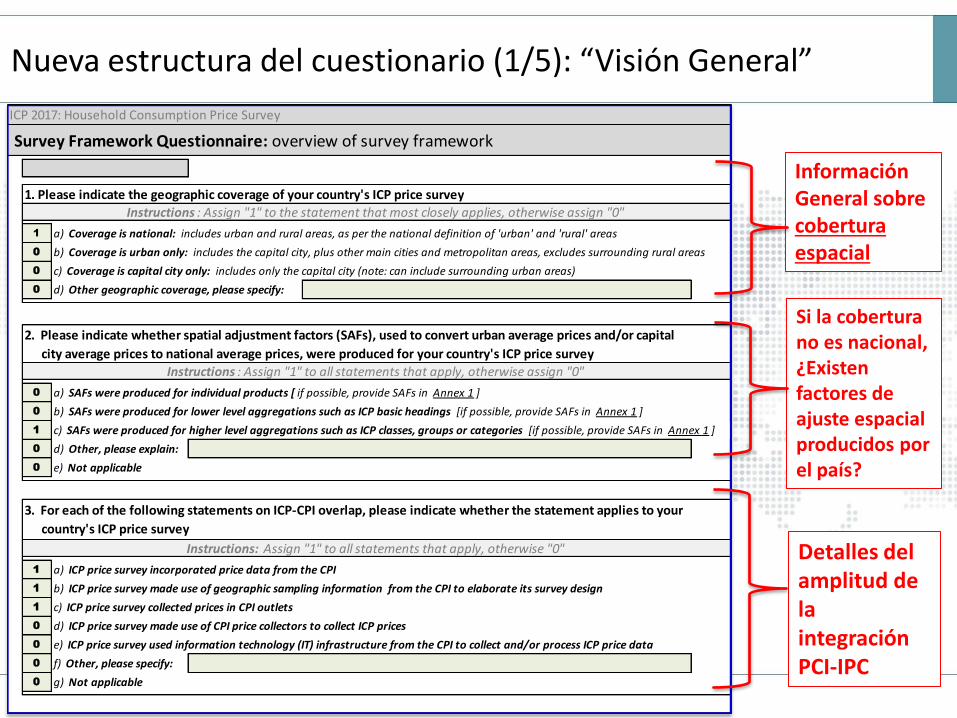
Nueva estructura del cuestionario (1/5): “Visión General”
Información General sobre cobertura espacial
Si la cobertura no es nacional, ¿Existen factores de ajuste espacial producidos por el país?
Detalles del amplitud de la integración PCI-IPC
Survey Framework Questionnaire: overview of survey framework
1. Please indicate the geographic coverage of your country's ICP price survey
1 a) Coverage is national: includes urban and rural areas, as per the national definition of 'urban' and 'rural' areas
0 b) Coverage is urban only: includes the capital city, plus other main cities and metropolitan areas, excludes surrounding rural areas
0 c) Coverage is capital city only: includes only the capital city (note: can include surrounding urban areas)
0 d) Other geographic coverage, please specify:
2. Please indicate whether spatial adjustment factors (SAFs), used to convert urban average prices and/or capital
city average prices to national average prices, were produced for your country's ICP price survey
0 a) SAFs were produced for individual products [ if possible, provide SAFs in Annex 1 ]
0 b) SAFs were produced for lower level aggregations such as ICP basic headings [if possible, provide SAFs in Annex 1 ]
1 c) SAFs were produced for higher level aggregations such as ICP classes, groups or categories [if possible, provide SAFs in Annex 1 ]
0 d) Other, please explain:
0 e) Not applicable
1 a) ICP price survey incorporated price data from the CPI
1 b) ICP price survey made use of geographic sampling information from the CPI to elaborate its survey design
1 c) ICP price survey collected prices in CPI outlets
0 d) ICP price survey made use of CPI price collectors to collect ICP prices
0 e) ICP price survey used information technology (IT) infrastructure from the CPI to collect and/or process ICP price data
0 f) Other, please specify:
0 g) Not applicable
ICP 2017: Household Consumption Price Survey
Instructions : Assign "1" to the statement that most closely applies, otherwise assign "0"
Instructions : Assign "1" to all statements that apply, otherwise assign "0"
Instructions: Assign "1" to all statements that apply, otherwise "0"
3. For each of the following statements on ICP-CPI overlap, please indicate whether the statement applies to your
country's ICP price survey
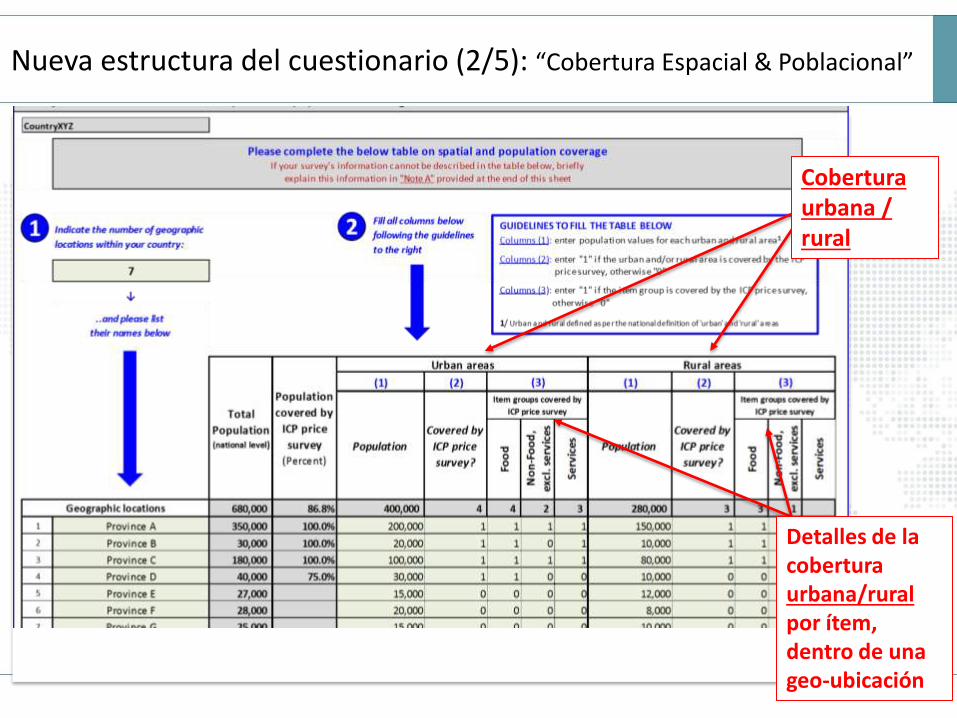
Cobertura urbana / rural
Detalles de la cobertura urbana/rural por ítem, dentro de una geo-ubicación
Nueva estructura del cuestionario (2/5): “Cobertura Espacial & Poblacional”
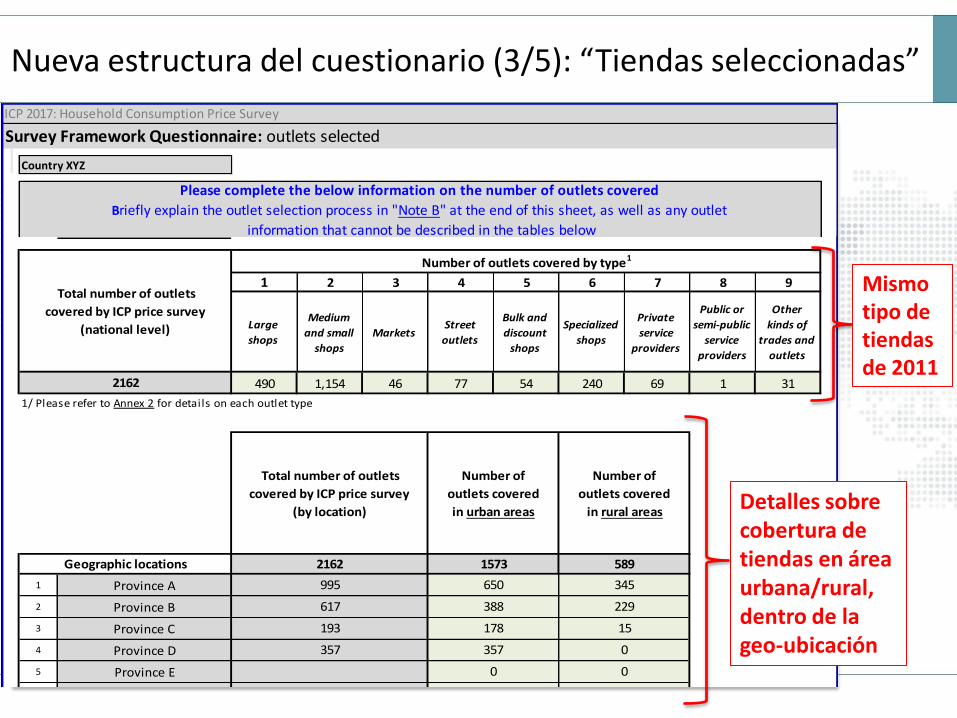
Please complete the below information on the number of outlets covered
Briefly explain the outlet selection process in "Note B" at the end of this sheet, as well as any outlet
information that cannot be described in the tables below
ICP 2017: Household Consumption Price Survey
Survey Framework Questionnaire: outlets selected
Country XYZ
1 2 3 4 5 6 7 8 9
Large
shops
Medium
and small
shops
MarketsStreet
outlets
Bulk and
discount
shops
Specialized
shops
Private
service
providers
Public or
semi-public
service
providers
Other
kinds of
trades and
outlets
490 1,154 46 77 54 240 69 1 31
1 Province A
2 Province B
3 Province C
4 Province D
5 Province E
6 Province F
7 Province G
8
9
10
11
12
13
14
15
Total number of outlets
covered by ICP price survey
(by location)
2162
995
617
193
357 0
0
0
0
Number of
outlets covered
in rural areas
589
345
229
15
0
Number of outlets covered by type1
Total number of outlets
covered by ICP price survey
(national level)
388
178
357
Number of
outlets covered
in urban areas
1573
650
2162
Geographic locations
1/ Please refer to Annex 2 for details on each outlet type
0
0
Mismo tipo de tiendas de 2011
Detalles sobre cobertura de tiendas en área urbana/rural, dentro de la geo-ubicación
Nueva estructura del cuestionario (3/5): “Tiendas seleccionadas”
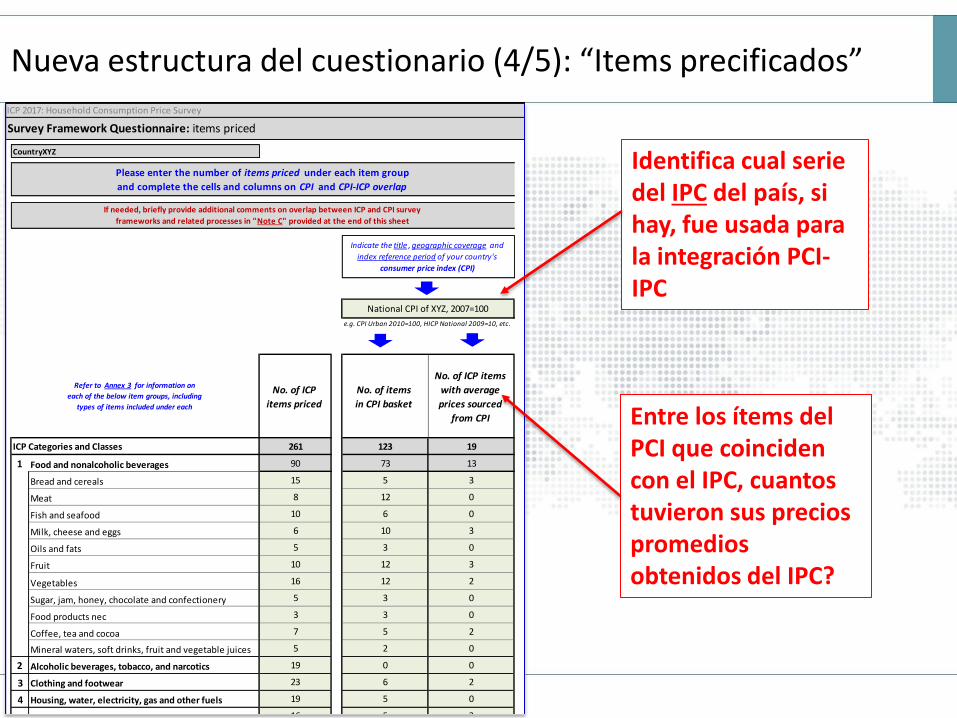
Identifica cual serie del IPC del país, si hay, fue usada para la integración PCI-IPC
Entre los ítems del PCI que coinciden con el IPC, cuantos tuvieron sus precios promedios obtenidos del IPC?
No. of ICP
items priced
No. of items
in CPI basket
No. of ICP items
with average
prices sourced
from CPI
261 123 19
1 Food and nonalcoholic beverages 90 73 13
Bread and cereals 15 5 3
Meat 8 12 0
Fish and seafood 10 6 0
Milk, cheese and eggs 6 10 3
Oils and fats 5 3 0
Fruit 10 12 3
Vegetables 16 12 2
Sugar, jam, honey, chocolate and confectionery 5 3 0
Food products nec 3 3 0
Coffee, tea and cocoa 7 5 2
Mineral waters, soft drinks, fruit and vegetable juices 5 2 0
2 Alcoholic beverages, tobacco, and narcotics 19 0 0
3 Clothing and footwear 23 6 2
4 Housing, water, electricity, gas and other fuels 19 5 0
5 Furnishings, household equipment and maintenance 16 5 3
6 Health 19 12 0
7 Transport 21 6 0
8 Communication 16 4 0
9 Recreation and culture 12 4 0
10 Education 4 3 0
11 Restaurants and hotels 13 3 1
12 Miscellaneous goods and services 9 2 0
* Note C: Overlap between ICP and CPI survey frameworks
ICP Categories and Classes
Refer to Annex 3 for information on
each of the below item groups, including
types of items included under each
e.g. CPI Urban 2010=100, HICP National 2009=10, etc.
National CPI of XYZ, 2007=100
ICP 2017: Household Consumption Price Survey
Indicate the title , geographic coverage and
index reference period of your country's
consumer price index (CPI)
If needed, briefly provide additional comments on overlap between ICP and CPI survey
frameworks and related processes in "Note C" provided at the end of this sheet
Survey Framework Questionnaire: items priced
CountryXYZ
Please enter the number of items priced under each item group
and complete the cells and columns on CPI and CPI-ICP overlap
Nueva estructura del cuestionario (4/5): “Items precificados”
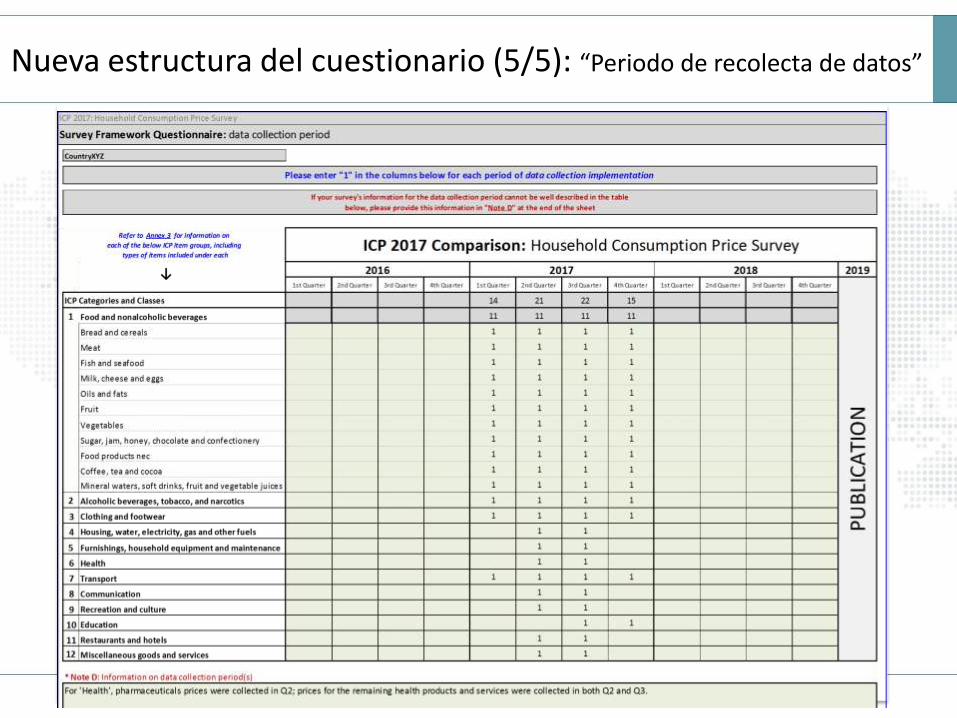
Nueva estructura del cuestionario (5/5): “Periodo de recolecta de datos”
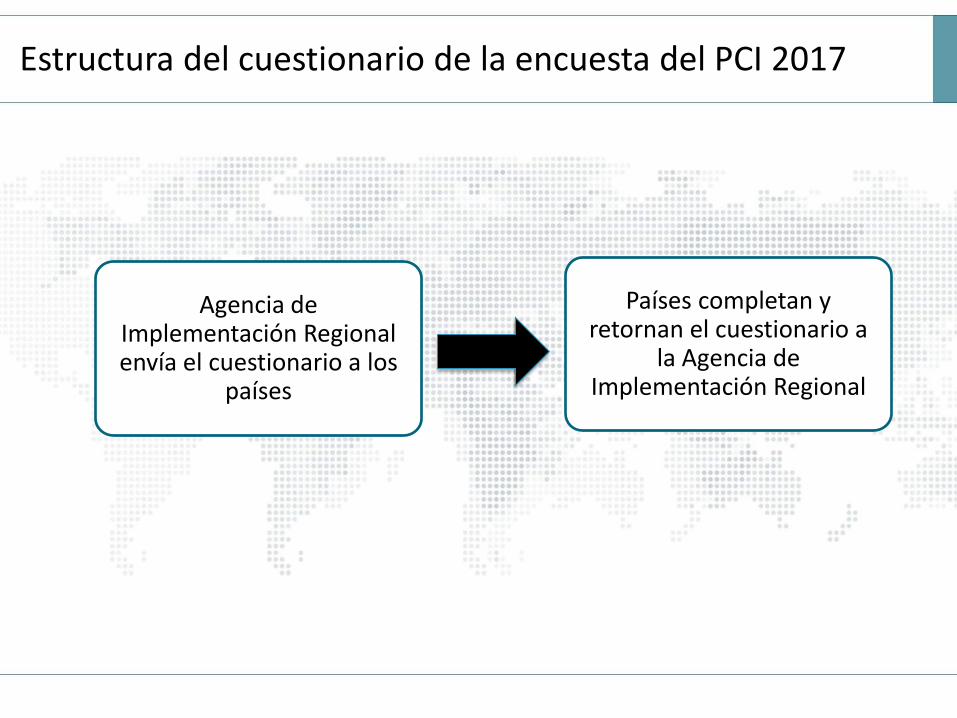
Estructura del cuestionario de la encuesta del PCI 2017
Agencia de Implementación Regional envía el cuestionario a los
países
Países completan y retornan el cuestionario a
la Agencia de Implementación Regional

GRACIAS!
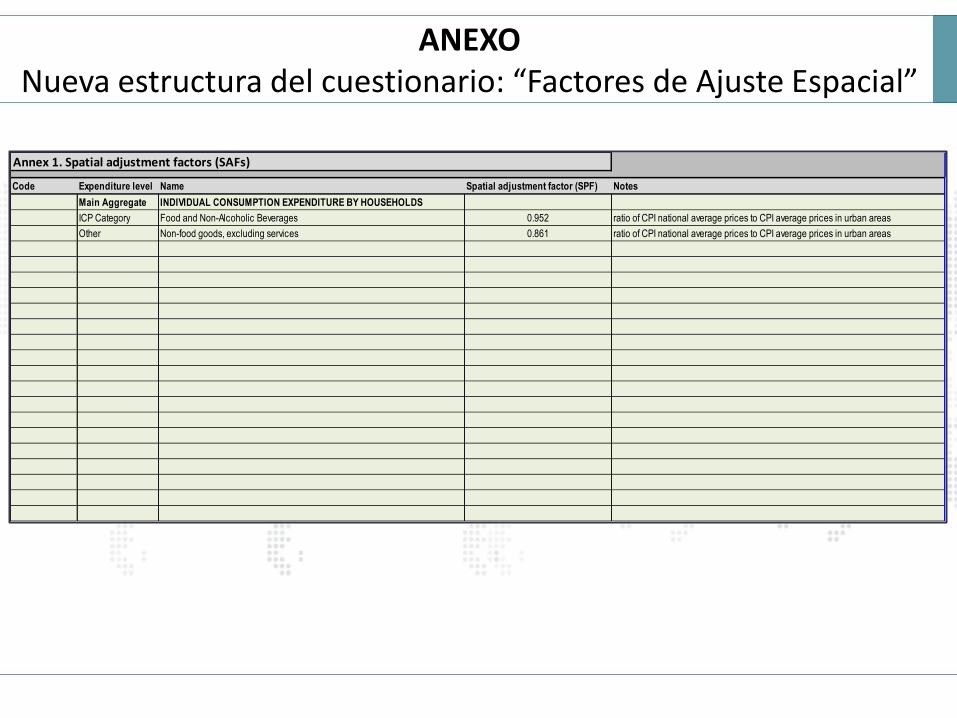
Annex 1. Spatial adjustment factors (SAFs)
Code Expenditure level Name Spatial adjustment factor (SPF) Notes
Main Aggregate INDIVIDUAL CONSUMPTION EXPENDITURE BY HOUSEHOLDS
ICP Category Food and Non-Alcoholic Beverages 0.952 ratio of CPI national average prices to CPI average prices in urban areas
Other Non-food goods, excluding services 0.861 ratio of CPI national average prices to CPI average prices in urban areas
ANEXO Nueva estructura del cuestionario: “Factores de Ajuste Espacial”