Embed Size (px)
Citation preview
ETHNIC DIVERSITY, POLITICAL STABILITY,
AND PRODUCTIVE EFFICIENCY:
EMPIRICAL EVIDENCE
FROM THE AFRICAN COUNTRIES
March 20, 2013
Alexandre Repkine
ETHNIC DIVERSITY AND ECONOMIC PERFORMANCE
The negative consequences of ethnic dive
rsity:
Poor economic policies (Easterly and Levine, 19
97)
Suboptimal social capital formation (Easterly, 20
01)
Poor infrastructure and underprovision of
public goods (Collier and Gunning, 1999)
Low economic growth, also due to inadequate
provision of public goods (Alesina and La Ferrar
a, 2005)
ETHNIC DIVERSITY AND ECONOMIC PERFORMANCE
The positive side of ethnic diversity:
Human capital created due to implicit contract enforcement (Bates, 2000)
Ethnic diversity fosters competition and survival by analogy with biodiversity (Nettle and Romaine, 2000)
Ethnically diverse countries grow faster (Cinyabuguma and Putterman, 2011)
Ethnic diversity leads to higher productivity in terms of a private (as opposed to public) good: Alesina and Ferrara, 2005

ETHNIC DIVERSITY, PUBLIC AND PRIVATE GOODS
Ethnically diverse societies should find
themselves closer to the best-practice frontie
r
The best-practice frontier may itself be
depressed or stagnating
Hence no contradiction between Africa being
ethnically diverse and economically depresse
d
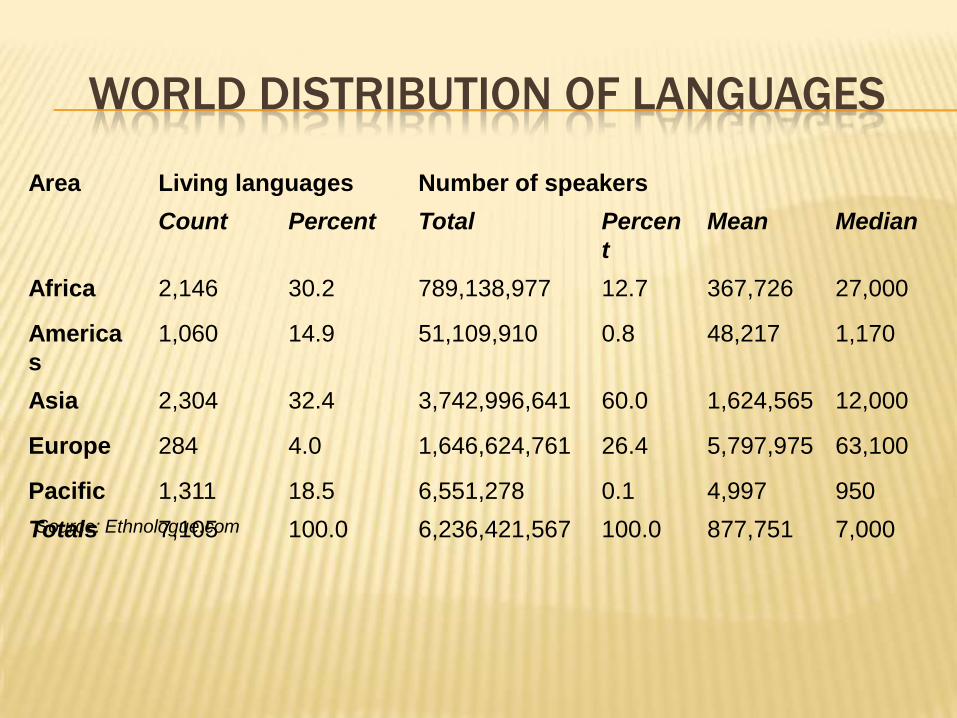
WORLD DISTRIBUTION OF LANGUAGES
Area Living languages Number of speakers
Count Percent Total Percen
t
Mean Median
Africa 2,146 30.2 789,138,977 12.7 367,726 27,000
America
s
1,060 14.9 51,109,910 0.8 48,217 1,170
Asia 2,304 32.4 3,742,996,641 60.0 1,624,565 12,000
Europe 284 4.0 1,646,624,761 26.4 5,797,975 63,100
Pacific 1,311 18.5 6,551,278 0.1 4,997 950
Totals 7,105 100.0 6,236,421,567 100.0 877,751 7,000Source: Ethnologue.com
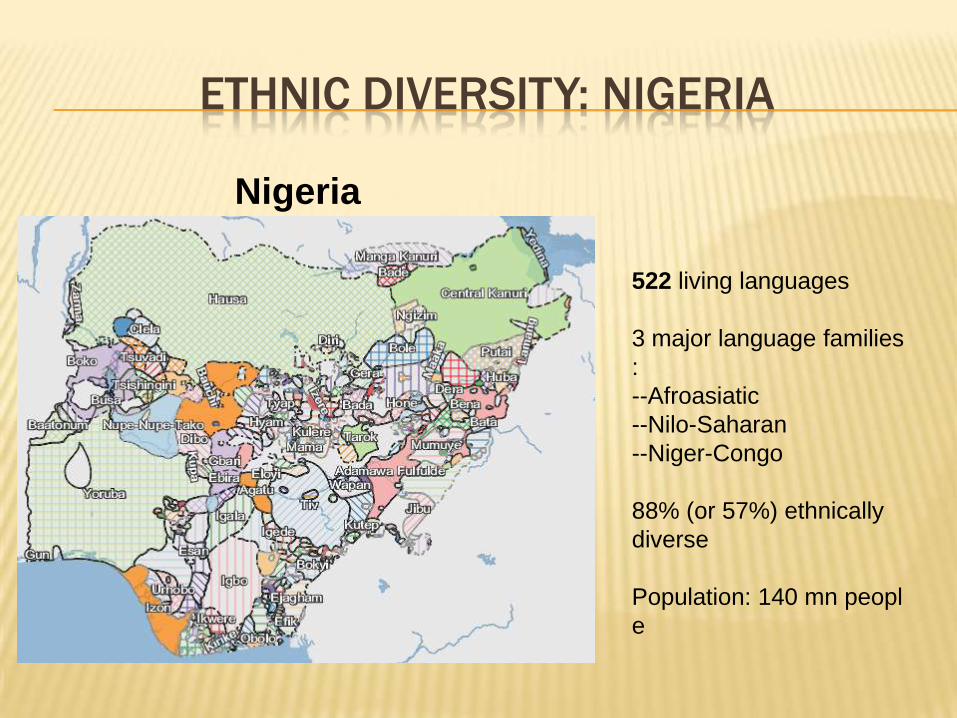
ETHNIC DIVERSITY: NIGERIA
Nigeria
522 living languages
3 major language families
:
--Afroasiatic
--Nilo-Saharan
--Niger-Congo
88% (or 57%) ethnically
diverse
Population: 140 mn peopl
e
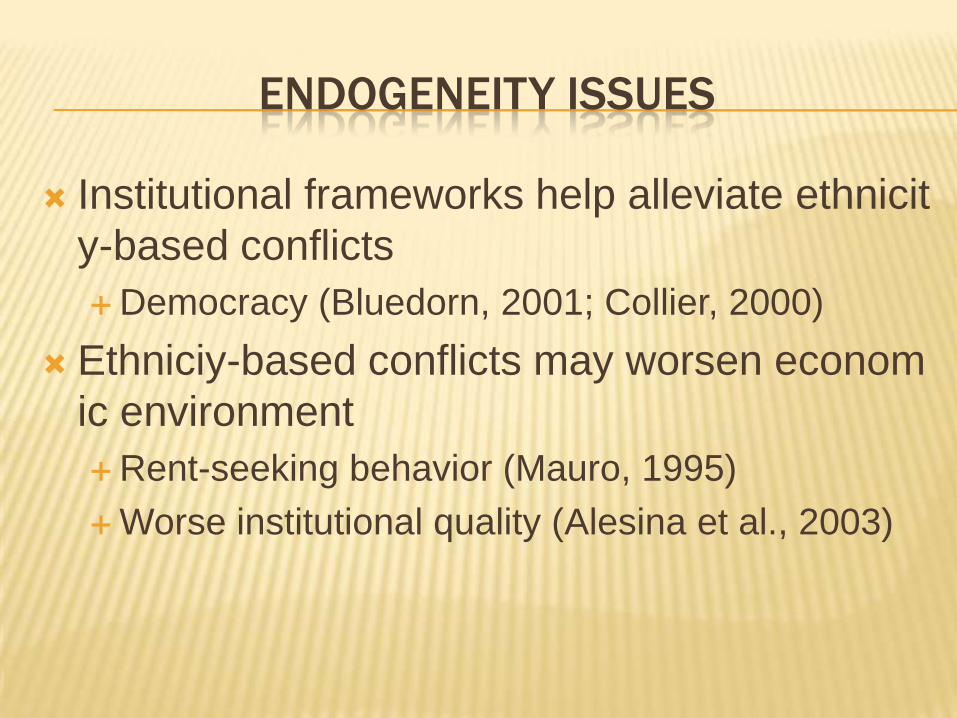
ENDOGENEITY ISSUES
Institutional frameworks help alleviate ethnicit
y-based conflicts
Democracy (Bluedorn, 2001; Collier, 2000)
Ethniciy-based conflicts may worsen econom
ic environment
Rent-seeking behavior (Mauro, 1995)
Worse institutional quality (Alesina et al., 2003)
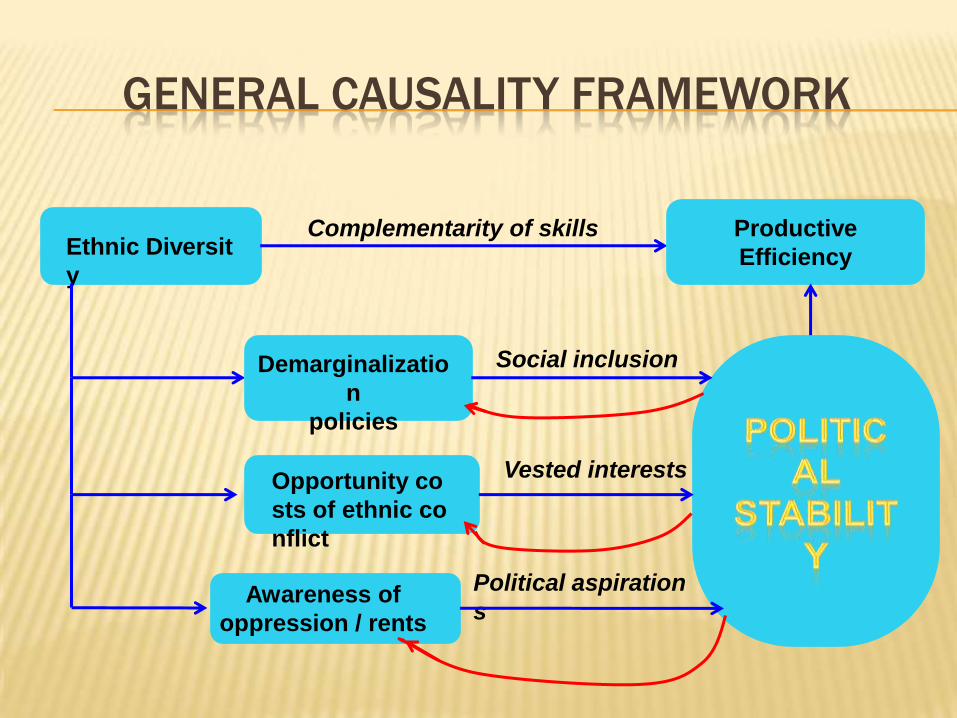
GENERAL CAUSALITY FRAMEWORK
Ethnic Diversit
y
Productive
Efficiency
Complementarity of skills
Demarginalizatio
n
policies
Social inclusion
Opportunity co
sts of ethnic co
nflict
Vested interests
Awareness of
oppression / rents
Political aspiration
s
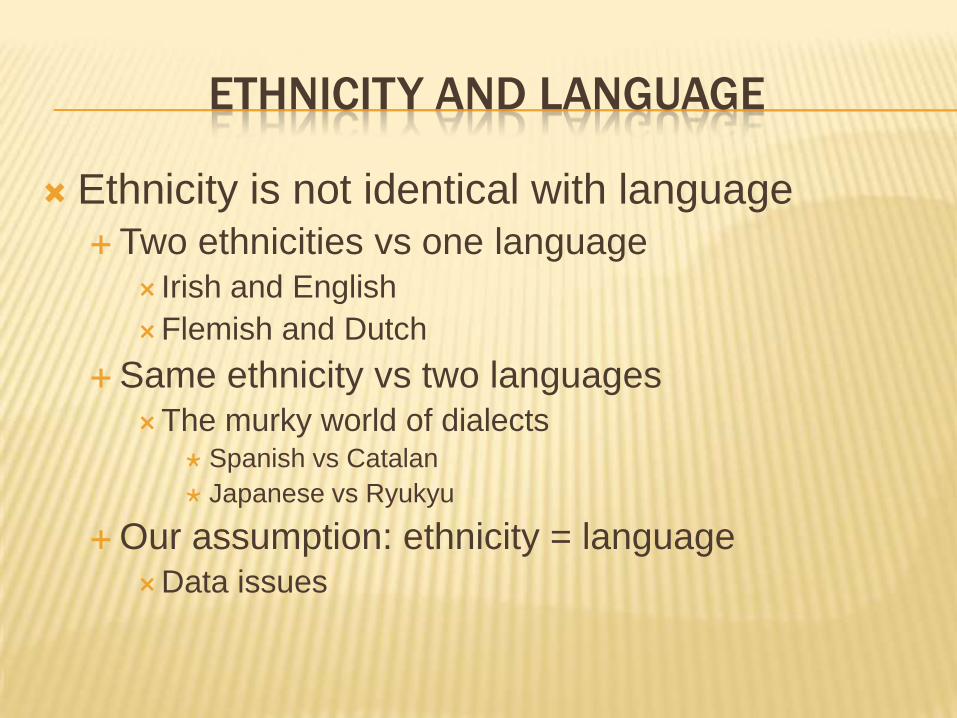
ETHNICITY AND LANGUAGE
Ethnicity is not identical with language
Two ethnicities vs one language Irish and English
Flemish and Dutch
Same ethnicity vs two languagesThe murky world of dialects
Spanish vs Catalan
Japanese vs Ryukyu
Our assumption: ethnicity = languageData issues
MEASURING ETHNIC DIVERSITY
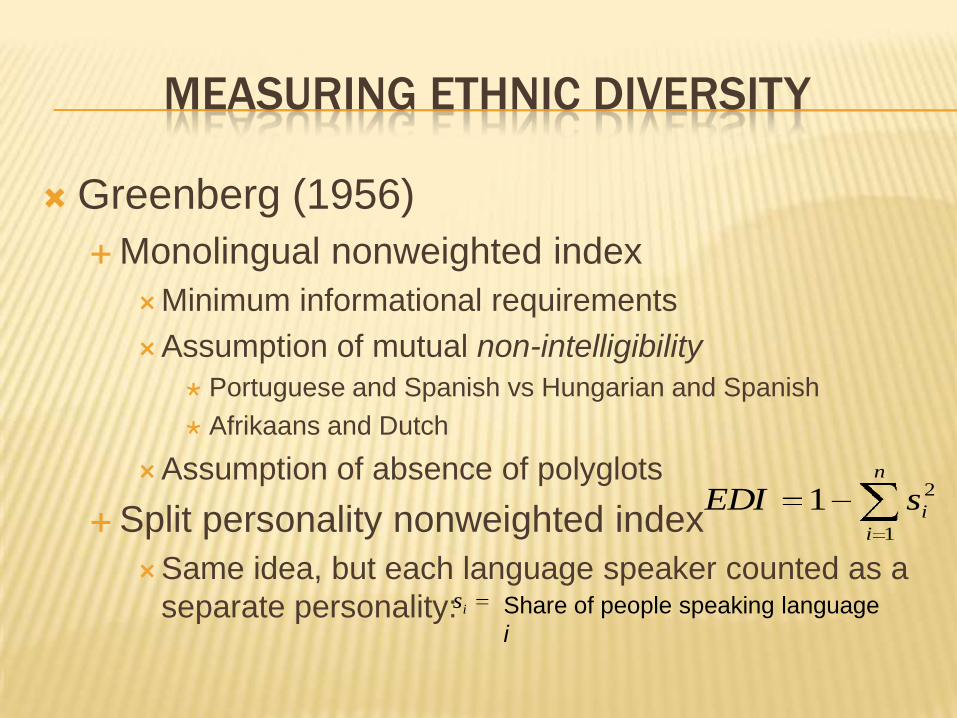
Greenberg (1956)
Monolingual nonweighted index
Minimum informational requirements
Assumption of mutual non-intelligibility
Portuguese and Spanish vs Hungarian and Spanish
Afrikaans and Dutch
Assumption of absence of polyglots
Split personality nonweighted index
Same idea, but each language speaker counted as a
separate personality:
n
i
isEDI1
21
is Share of people speaking language
i
MEASURING ETHNIC DIVERSITY
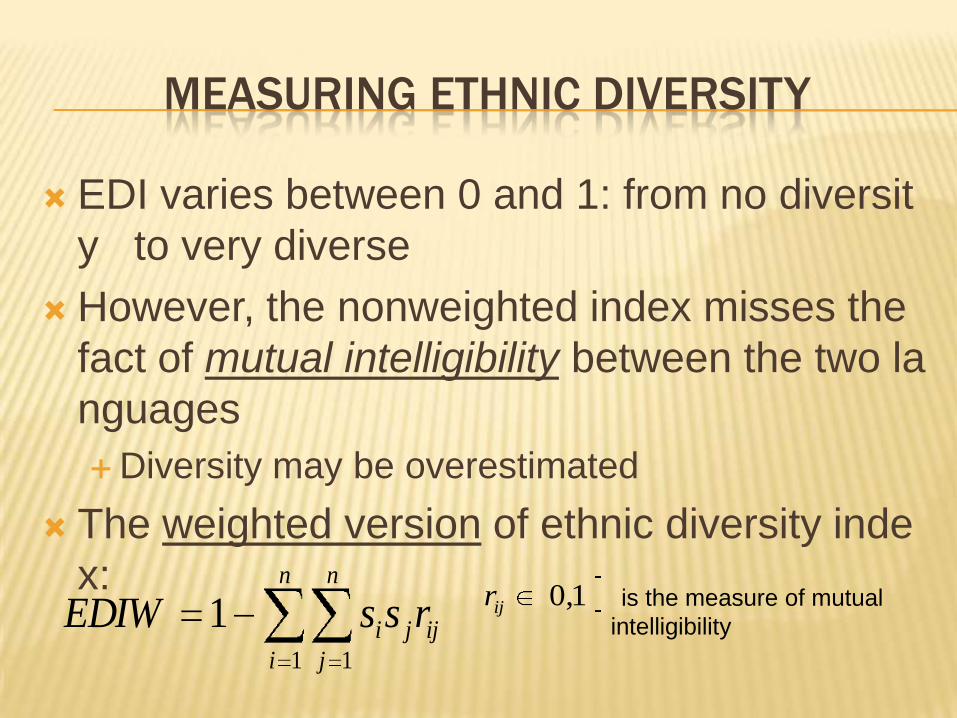
EDI varies between 0 and 1: from no diversit
y to very diverse
However, the nonweighted index misses the
fact of mutual intelligibility between the two la
nguages
Diversity may be overestimated
The weighted version of ethnic diversity inde
x: n
i
n
j
ijji rssEDIW1 1
1is the measure of mutual
intelligibility
1,0ijr
COMPUTING ETHNIC DIVERSITY INDICES
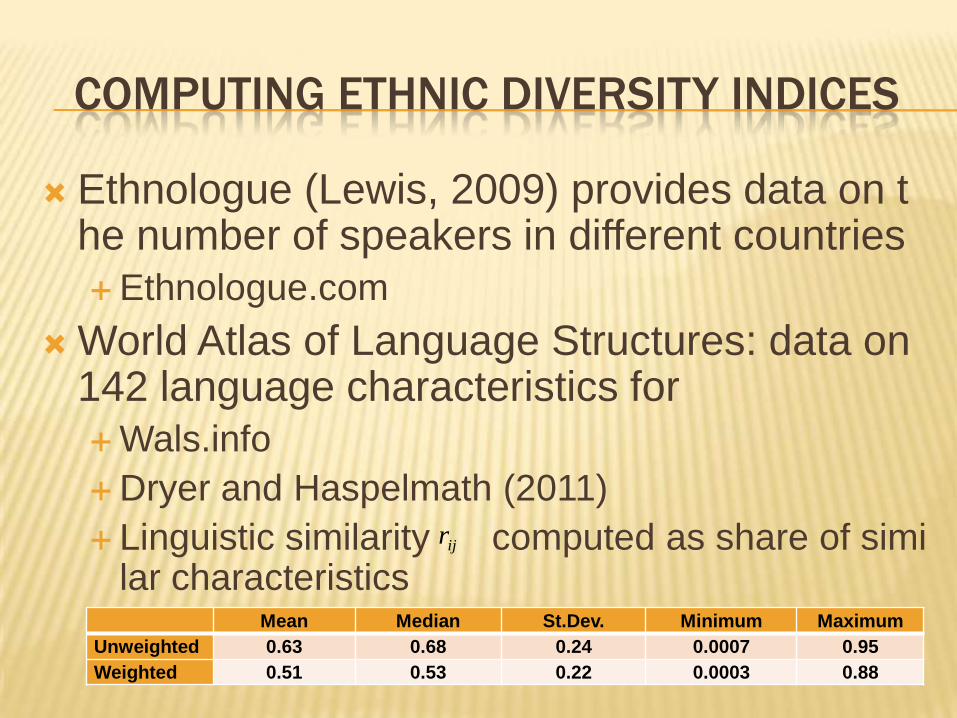
Ethnologue (Lewis, 2009) provides data on the number of speakers in different countries
Ethnologue.com
World Atlas of Language Structures: data on 142 language characteristics for
Wals.info
Dryer and Haspelmath (2011)
Linguistic similarity computed as share of similar characteristics
ijr
Mean Median St.Dev. Minimum Maximum
Unweighted 0.63 0.68 0.24 0.0007 0.95
Weighted 0.51 0.53 0.22 0.0003 0.88
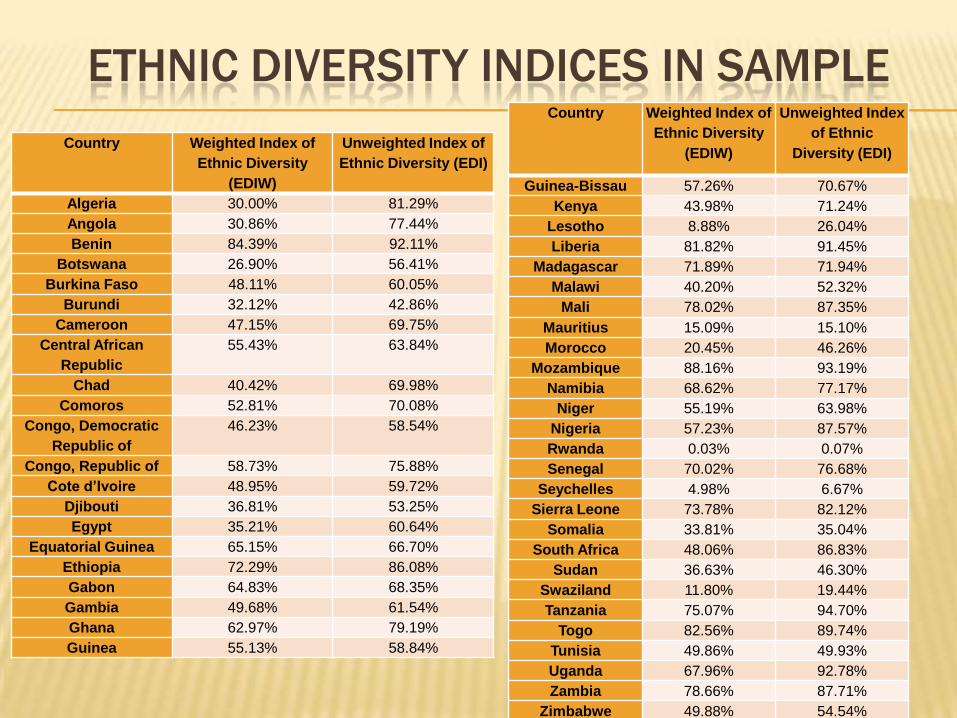
ETHNIC DIVERSITY INDICES IN SAMPLE
Country Weighted Index of
Ethnic Diversity
(EDIW)
Unweighted Index of
Ethnic Diversity (EDI)
Algeria 30.00% 81.29%
Angola 30.86% 77.44%
Benin 84.39% 92.11%
Botswana 26.90% 56.41%
Burkina Faso 48.11% 60.05%
Burundi 32.12% 42.86%
Cameroon 47.15% 69.75%
Central African
Republic
55.43% 63.84%
Chad 40.42% 69.98%
Comoros 52.81% 70.08%
Congo, Democratic
Republic of
46.23% 58.54%
Congo, Republic of 58.73% 75.88%
Cote d’Ivoire 48.95% 59.72%
Djibouti 36.81% 53.25%
Egypt 35.21% 60.64%
Equatorial Guinea 65.15% 66.70%
Ethiopia 72.29% 86.08%
Gabon 64.83% 68.35%
Gambia 49.68% 61.54%
Ghana 62.97% 79.19%
Guinea 55.13% 58.84%
Country Weighted Index of
Ethnic Diversity
(EDIW)
Unweighted Index
of Ethnic
Diversity (EDI)
Guinea-Bissau 57.26% 70.67%
Kenya 43.98% 71.24%
Lesotho 8.88% 26.04%
Liberia 81.82% 91.45%
Madagascar 71.89% 71.94%
Malawi 40.20% 52.32%
Mali 78.02% 87.35%
Mauritius 15.09% 15.10%
Morocco 20.45% 46.26%
Mozambique 88.16% 93.19%
Namibia 68.62% 77.17%
Niger 55.19% 63.98%
Nigeria 57.23% 87.57%
Rwanda 0.03% 0.07%
Senegal 70.02% 76.68%
Seychelles 4.98% 6.67%
Sierra Leone 73.78% 82.12%
Somalia 33.81% 35.04%
South Africa 48.06% 86.83%
Sudan 36.63% 46.30%
Swaziland 11.80% 19.44%
Tanzania 75.07% 94.70%
Togo 82.56% 89.74%
Tunisia 49.86% 49.93%
Uganda 67.96% 92.78%
Zambia 78.66% 87.71%
Zimbabwe 49.88% 54.54%

EMPIRICAL FRAMEWORK
LAWPROPINCLHEDIWSTABLESTABLE ,,,,
Political stability affects productive efficiency
Ethnic diversity affects political stability in both direct and indirect ways:
STABLE = Political Stability
EDIW = weighted index of ethnic diversity
H = human capital
INCL = quality of policies for social inclusion
PROP = property rights protection
LAW = extent of the rule of law
STABLEEDIEffEff ,
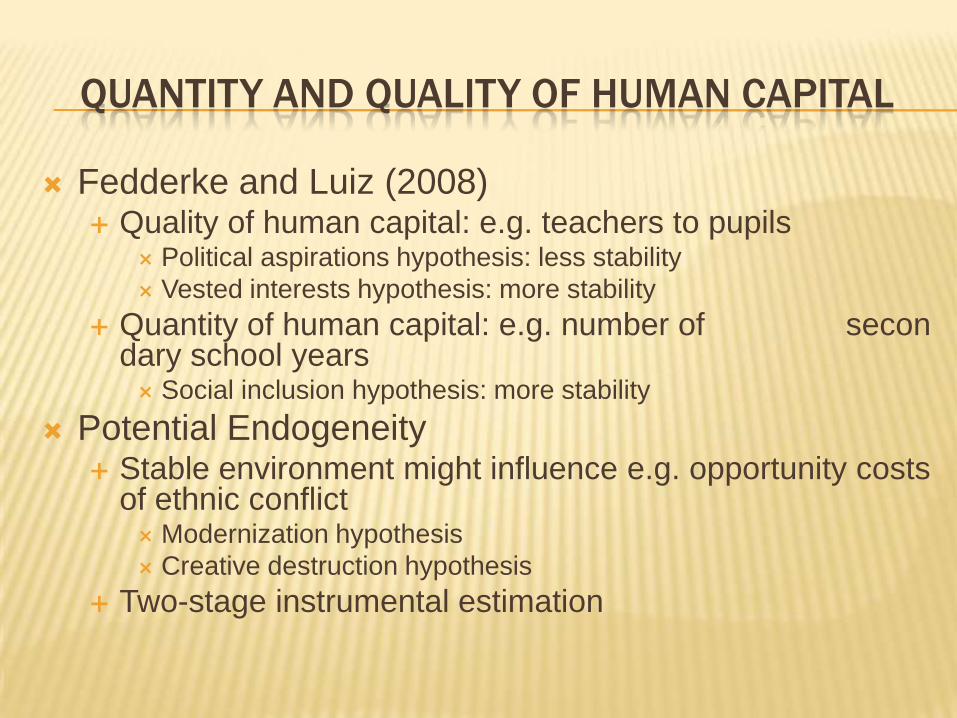
QUANTITY AND QUALITY OF HUMAN CAPITAL
Fedderke and Luiz (2008) Quality of human capital: e.g. teachers to pupils
Political aspirations hypothesis: less stability
Vested interests hypothesis: more stability
Quantity of human capital: e.g. number of secondary school years Social inclusion hypothesis: more stability
Potential Endogeneity Stable environment might influence e.g. opportunity costs
of ethnic conflict Modernization hypothesis
Creative destruction hypothesis
Two-stage instrumental estimation
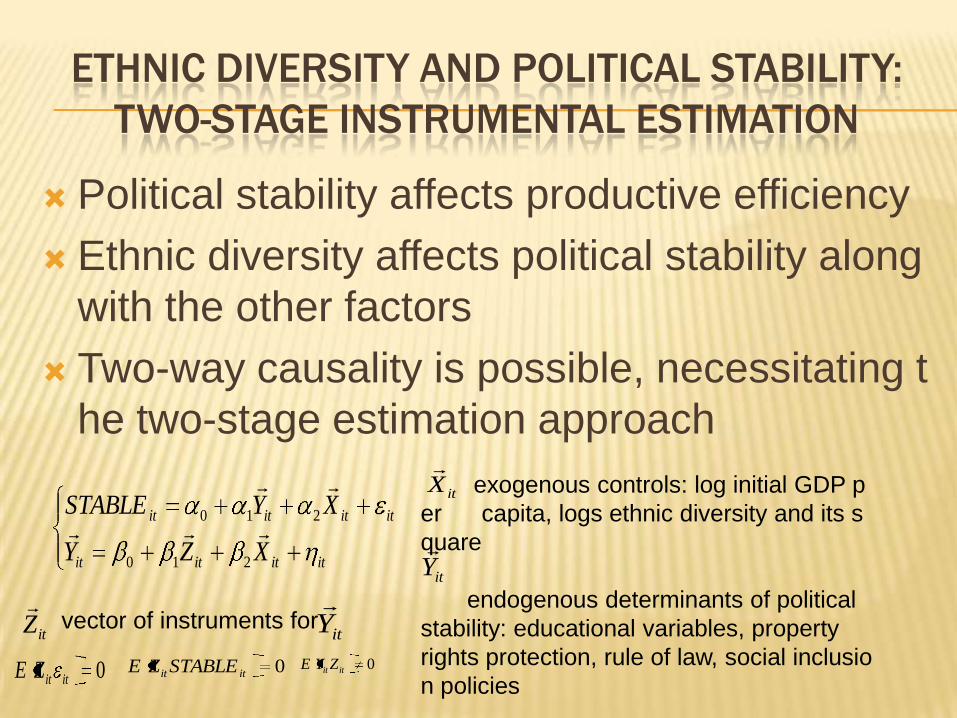
ETHNIC DIVERSITY AND POLITICAL STABILITY:
TWO-STAGE INSTRUMENTAL ESTIMATION
Political stability affects productive efficiency
Ethnic diversity affects political stability along
with the other factors
Two-way causality is possible, necessitating t
he two-stage estimation approach
itititit
itititit
XZY
XYSTABLE
210
210
exogenous controls: log initial GDP p
er capita, logs ethnic diversity and its s
quare
endogenous determinants of political
stability: educational variables, property
rights protection, rule of law, social inclusio
n policies
itX
itY
vector of instruments for itZ
itY
0ititZE 0itit STABLEZE 0itit ZYE
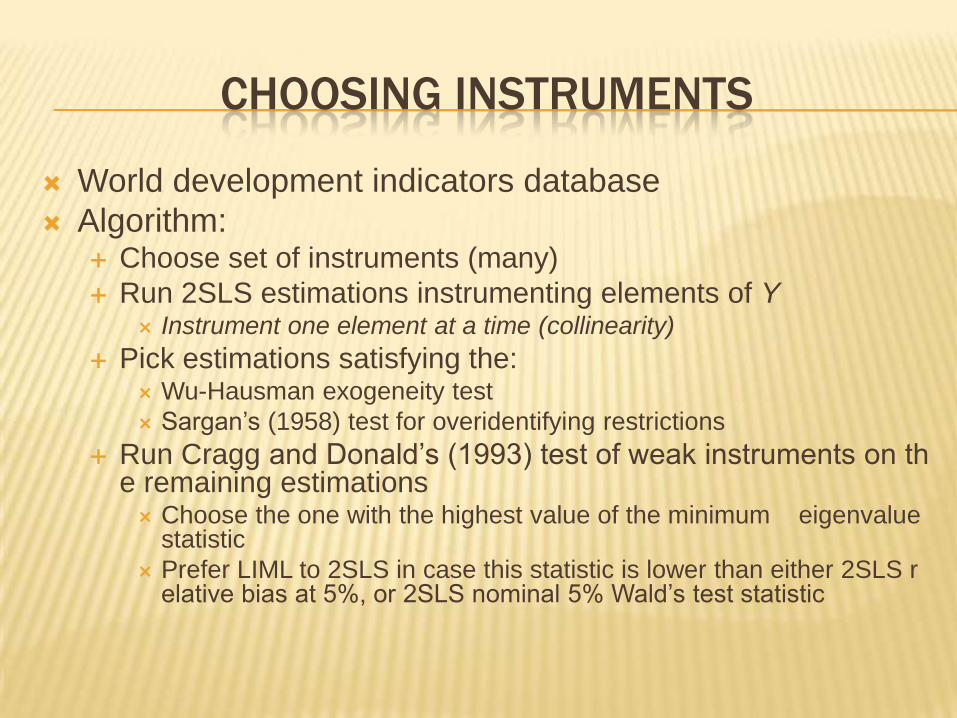
CHOOSING INSTRUMENTS
World development indicators database
Algorithm: Choose set of instruments (many)
Run 2SLS estimations instrumenting elements of Y Instrument one element at a time (collinearity)
Pick estimations satisfying the: Wu-Hausman exogeneity test
Sargan’s (1958) test for overidentifying restrictions
Run Cragg and Donald’s (1993) test of weak instruments on the remaining estimations Choose the one with the highest value of the minimum eigenvalue
statistic
Prefer LIML to 2SLS in case this statistic is lower than either 2SLS relative bias at 5%, or 2SLS nominal 5% Wald’s test statistic
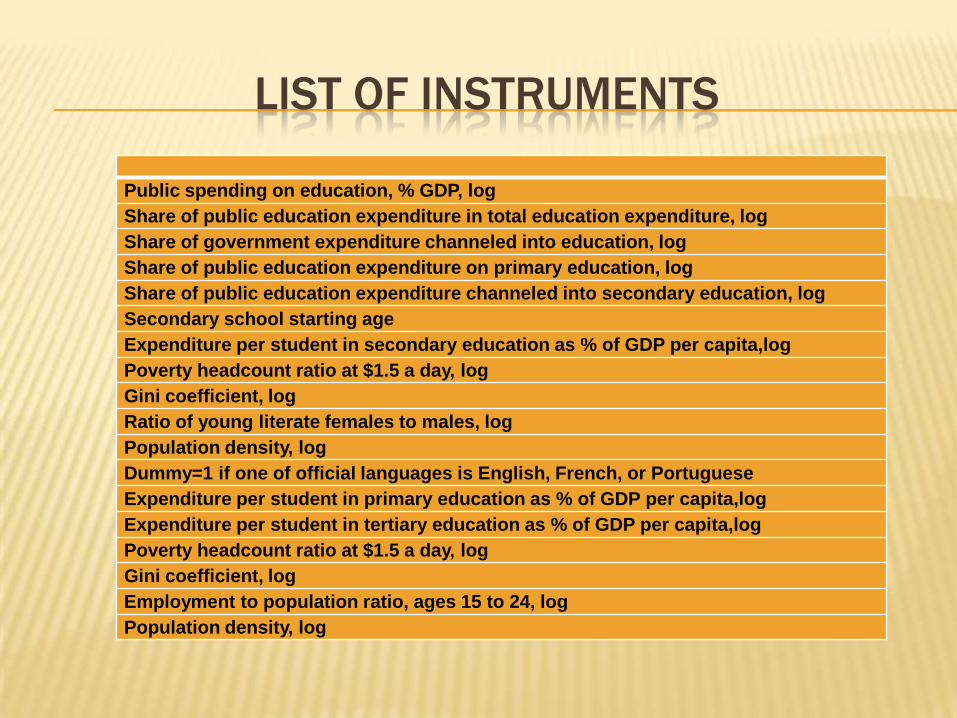
LIST OF INSTRUMENTS
Public spending on education, % GDP, log
Share of public education expenditure in total education expenditure, log
Share of government expenditure channeled into education, log
Share of public education expenditure on primary education, log
Share of public education expenditure channeled into secondary education, log
Secondary school starting age
Expenditure per student in secondary education as % of GDP per capita,log
Poverty headcount ratio at $1.5 a day, log
Gini coefficient, log
Ratio of young literate females to males, log
Population density, log
Dummy=1 if one of official languages is English, French, or Portuguese
Expenditure per student in primary education as % of GDP per capita,log
Expenditure per student in tertiary education as % of GDP per capita,log
Poverty headcount ratio at $1.5 a day, log
Gini coefficient, log
Employment to population ratio, ages 15 to 24, log
Population density, log
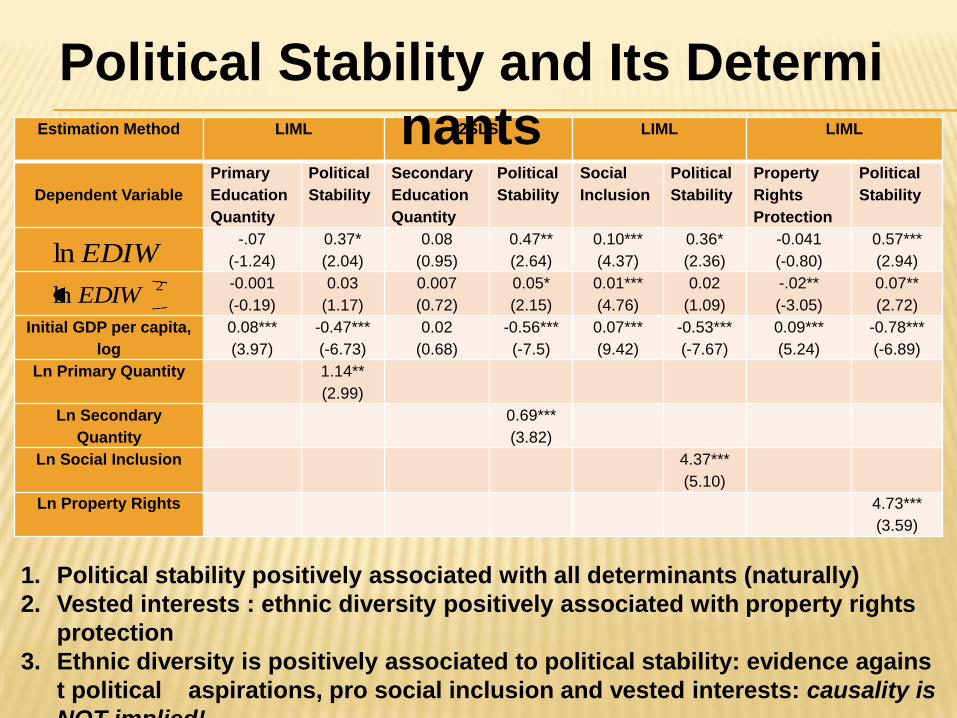
Estimation Method LIML 2SLS LIML LIML
Dependent Variable
Primary
Education
Quantity
Political
Stability
Secondary
Education
Quantity
Political
Stability
Social
Inclusion
Political
Stability
Property
Rights
Protection
Political
Stability
-.07
(-1.24)
0.37*
(2.04)
0.08
(0.95)
0.47**
(2.64)
0.10***
(4.37)
0.36*
(2.36)
-0.041
(-0.80)
0.57***
(2.94)
-0.001
(-0.19)
0.03
(1.17)
0.007
(0.72)
0.05*
(2.15)
0.01***
(4.76)
0.02
(1.09)
-.02**
(-3.05)
0.07**
(2.72)
Initial GDP per capita,
log
0.08***
(3.97)
-0.47***
(-6.73)
0.02
(0.68)
-0.56***
(-7.5)
0.07***
(9.42)
-0.53***
(-7.67)
0.09***
(5.24)
-0.78***
(-6.89)
Ln Primary Quantity 1.14**
(2.99)
Ln Secondary
Quantity
0.69***
(3.82)
Ln Social Inclusion 4.37***
(5.10)
Ln Property Rights 4.73***
(3.59)
EDIWln2
ln EDIW
Political Stability and Its Determi
nants
1. Political stability positively associated with all determinants (naturally)
2. Vested interests : ethnic diversity positively associated with property rights
protection
3. Ethnic diversity is positively associated to political stability: evidence agains
t political aspirations, pro social inclusion and vested interests: causality is
NOT implied!
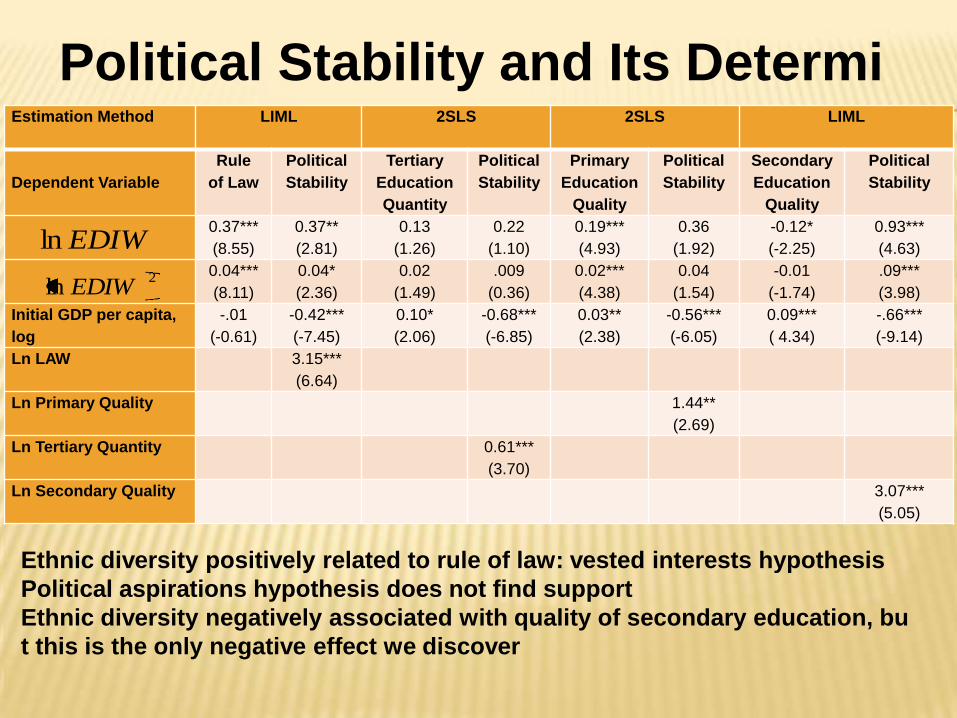
Political Stability and Its Determi
nantsEstimation Method LIML 2SLS 2SLS LIML
Dependent Variable
Rule
of Law
Political
Stability
Tertiary
Education
Quantity
Political
Stability
Primary
Education
Quality
Political
Stability
Secondary
Education
Quality
Political
Stability
0.37***
(8.55)
0.37**
(2.81)
0.13
(1.26)
0.22
(1.10)
0.19***
(4.93)
0.36
(1.92)
-0.12*
(-2.25)
0.93***
(4.63)
0.04***
(8.11)
0.04*
(2.36)
0.02
(1.49)
.009
(0.36)
0.02***
(4.38)
0.04
(1.54)
-0.01
(-1.74)
.09***
(3.98)
Initial GDP per capita,
log
-.01
(-0.61)
-0.42***
(-7.45)
0.10*
(2.06)
-0.68***
(-6.85)
0.03**
(2.38)
-0.56***
(-6.05)
0.09***
( 4.34)
-.66***
(-9.14)
Ln LAW 3.15***
(6.64)
Ln Primary Quality 1.44**
(2.69)
Ln Tertiary Quantity 0.61***
(3.70)
Ln Secondary Quality 3.07***
(5.05)
EDIWln
2ln EDIW
Ethnic diversity positively related to rule of law: vested interests hypothesis
Political aspirations hypothesis does not find support
Ethnic diversity negatively associated with quality of secondary education, bu
t this is the only negative effect we discover
STOCHASTIC FRONTIER FRAMEWORK
Ethnic diversity found positively associated w
ith political stability even after controlling for
potential endogeneity
Stability positively affects productive efficienc
y since it makes more certain investment
outcomes
Aigner et al. (1997) and Battese and Coelli
(1995)
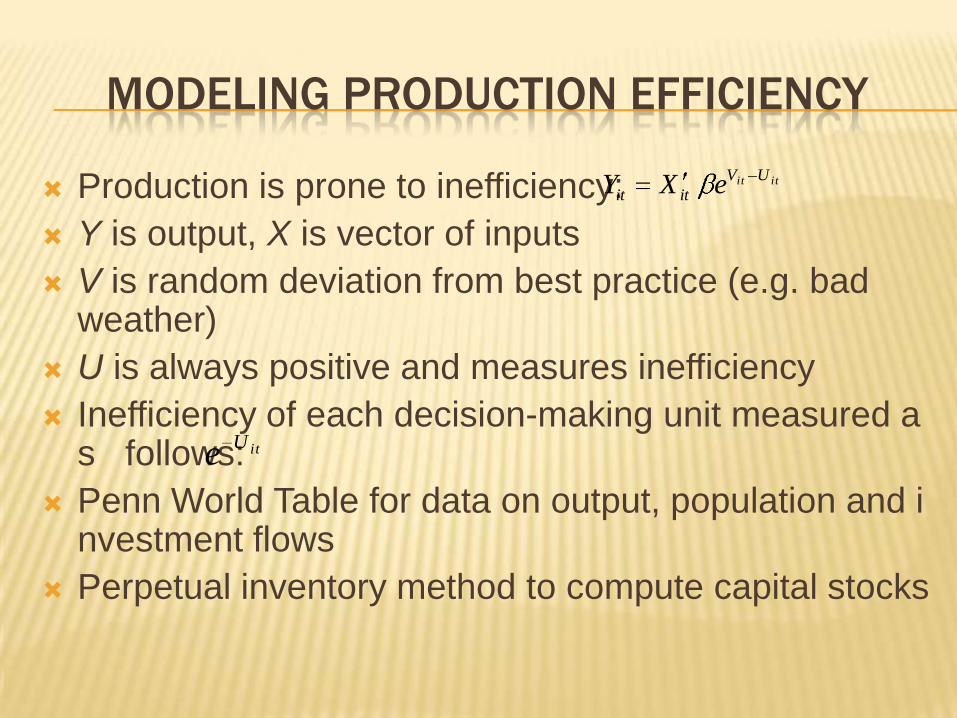
MODELING PRODUCTION EFFICIENCY
Production is prone to inefficiency:
Y is output, X is vector of inputs
V is random deviation from best practice (e.g. bad weather)
U is always positive and measures inefficiency
Inefficiency of each decision-making unit measured as follows:
Penn World Table for data on output, population and investment flows
Perpetual inventory method to compute capital stocks
itit UV
itit eXY
itUe
EMPIRICAL ESTIMATION FRAMEWORK
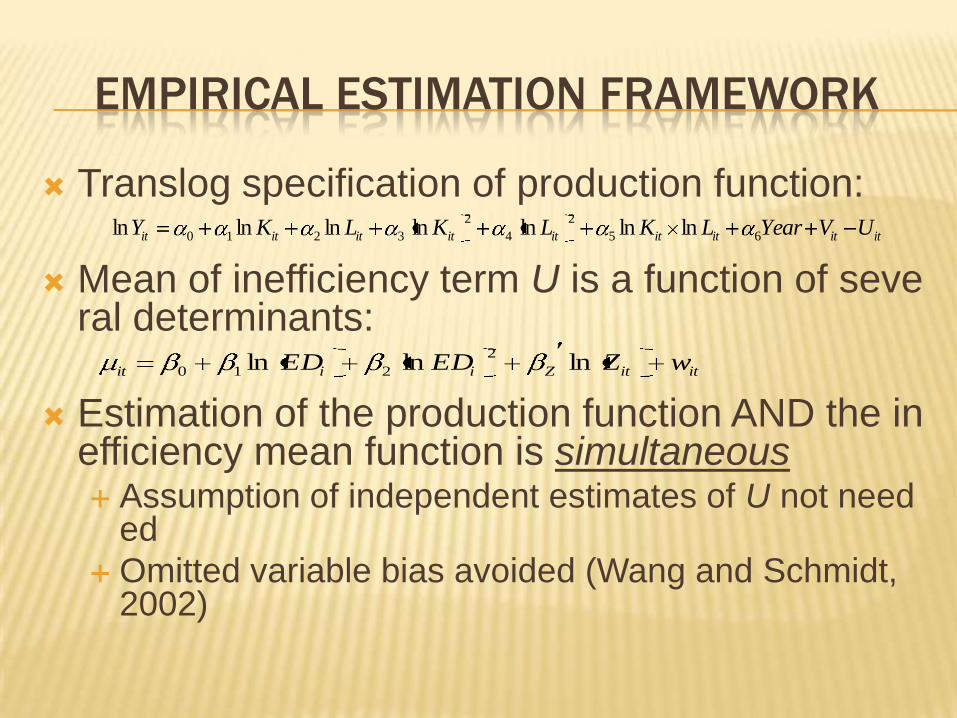
Translog specification of production function:
Mean of inefficiency term U is a function of several determinants:
Estimation of the production function AND the inefficiency mean function is simultaneous Assumption of independent estimates of U not need
ed
Omitted variable bias avoided (Wang and Schmidt, 2002)
ititititititititit UVYearLKLKLKY 65
2
4
2
3210 lnlnlnlnlnlnln
ititZiiit wZEDED lnlnln2
210
MONOTONICITY OF PRODUCTION FUNCTION
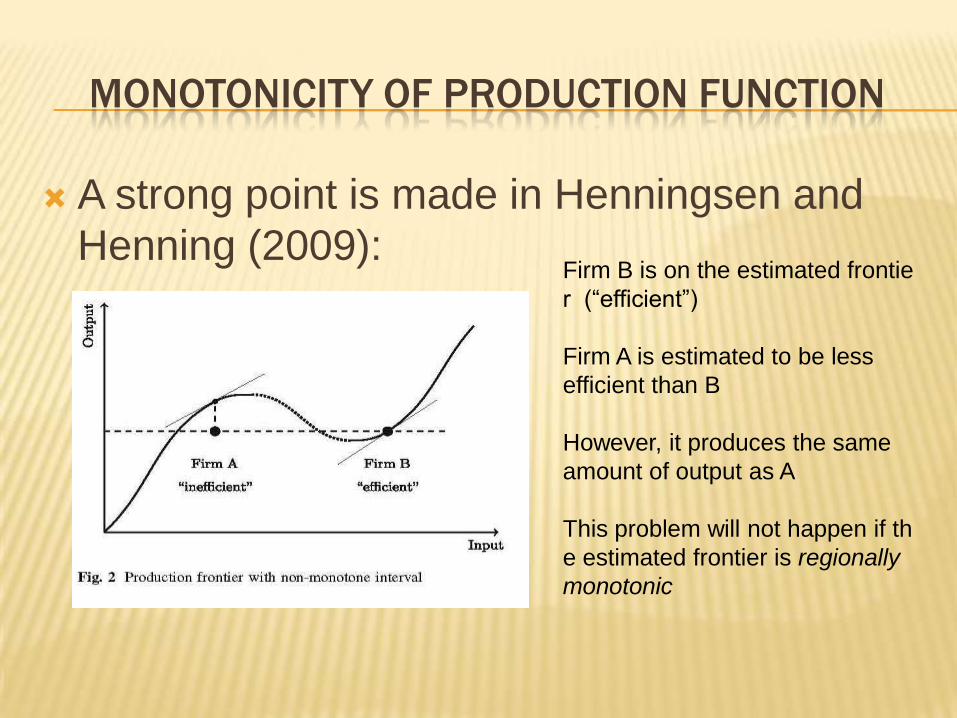
A strong point is made in Henningsen and
Henning (2009):Firm B is on the estimated frontie
r (“efficient”)
Firm A is estimated to be less
efficient than B
However, it produces the same
amount of output as A
This problem will not happen if th
e estimated frontier is regionally
monotonic
PROCEDURE FOR MONOTONIC ESTIMATION
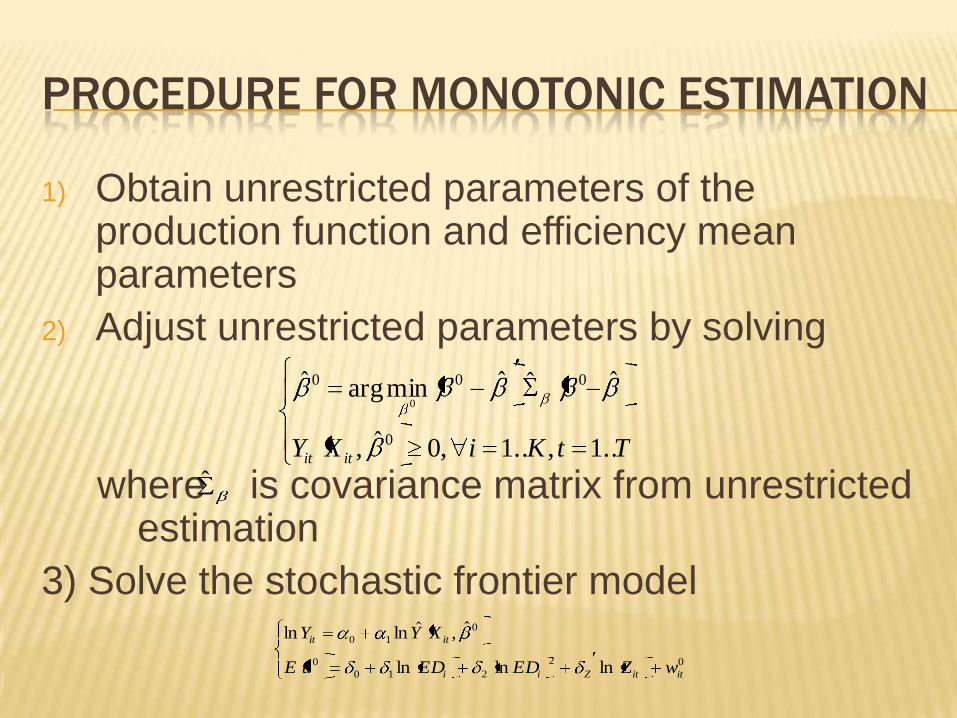
1) Obtain unrestricted parameters of the production function and efficiency mean parameters
2) Adjust unrestricted parameters by solving
where is covariance matrix from unrestricted estimation
3) Solve the stochastic frontier model
TtKiXY itit ..1,..1,0ˆ,
ˆˆˆminargˆ
0
000
0
ˆ
02
210
0
0
10
lnlnln
ˆ,ˆlnln
ititZii
itit
wZEDEDuE
XYY
ETHNIC DIVERSITY AND PRIMARY EDUCATION
Inefficiency Mean Unrestr. Adjusted Unrestr. Adjusted Unrestr. Adjusted Unrestr. Adjusted
-0.18
(-0.82)
-0.22
(-0.93)
-0.60
(-1.34)
-0.55
(-1.48)
-0.71
(-1.56)
-0.62
(-1.72)
-0.99*
(-2.06)
-0.89*
(-2.01)
-0.56**
(-3.02)
-0.57*
(-2.54)
-0.72**
(-2.80)
-0.67**
(-2.87)
-0.83**
(-2.88)
-0.78**
(-3.19)
-1.29***
(-3.38)
-1.23**
(-3.25)
-0.10
( -1.92)
-0.10
(-1.56)
-0.11*
(-2.21)
-0.10**
(-2.21)
-0.13*
(-2.27)
-0.12*
(-2.44)
-0.30**
(-2.81)
-0.29**
(-2.79)
-0.46*
(-2.31)
-0.46**
(-2.96)
-0.50**
(-2.62)
-0.48**
(-3.22)
-1.05*
(-2.09)
-0.98*
(-2.50)
-0.35
(-1.92)
-0.37*
(-2.36)
1.05
(1.87)
1.02
(1.93)
-0.57
(-1.27)
-0.53
(-1.54)
1.55*
(2.32)
1.52*
(2.38)
Mean efficiency 0.76 0.78 0.78 0.79 0.78 0.79 0.80
Log-likelihood -253.04 -257.57 -245.38 -247.96 -242.99 -234.22 -235.05
0.46**
( 3.04)
0.45***
(3.51)
0.66***
(5.32)
0.60***
(5.83)
0.68***
(5.46)
0.60***
(5.41)
0.71***
(8.41)
0.67***
(7.63)
0.16***
( 5.82)
0.16***
( 6.29)
0.22***
(3.29)
0.20***
(4.67)
0.23***
(3.36)
0.20***
(4.45)
0.25***
(4.15)
0.23***
(4.17)
Monotonicity, % obs 100% 100% 99.9% 100%
Quasi-concavity,
% obs
89.2% 88.8% 88.2% 87.8%
Observations 704 704 704 704 704 704 704 704
0
ln EDIW2
ln EDIW
PRIMQNln
PRIMQLlnEDIWPRIMQN lnln
EDIWPRIMQL lnln
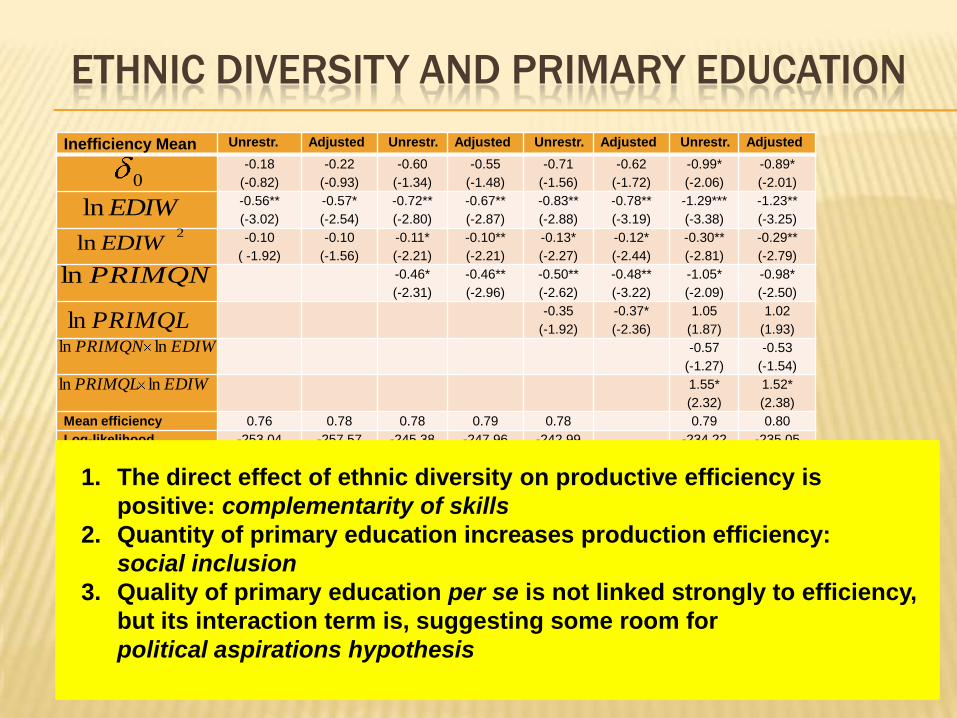
1. The direct effect of ethnic diversity on productive efficiency is
positive: complementarity of skills
2. Quantity of primary education increases production efficiency:
social inclusion
3. Quality of primary education per se is not linked strongly to efficiency,
but its interaction term is, suggesting some room for
political aspirations hypothesis
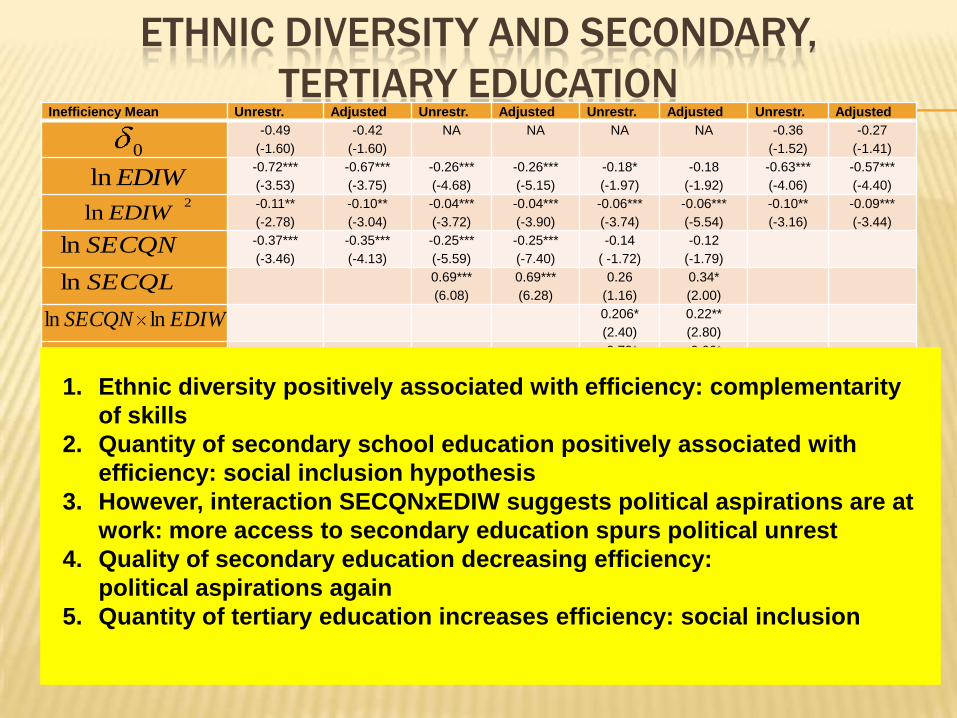
ETHNIC DIVERSITY AND SECONDARY,
TERTIARY EDUCATIONInefficiency Mean Unrestr. Adjusted Unrestr. Adjusted Unrestr. Adjusted Unrestr. Adjusted
-0.49
(-1.60)
-0.42
(-1.60)
NA NA NA NA -0.36
(-1.52)
-0.27
(-1.41)
-0.72***
(-3.53)
-0.67***
(-3.75)
-0.26***
(-4.68)
-0.26***
(-5.15)
-0.18*
(-1.97)
-0.18
(-1.92)
-0.63***
(-4.06)
-0.57***
(-4.40)
-0.11**
(-2.78)
-0.10**
(-3.04)
-0.04***
(-3.72)
-0.04***
(-3.90)
-0.06***
(-3.74)
-0.06***
(-5.54)
-0.10**
(-3.16)
-0.09***
(-3.44)
-0.37***
(-3.46)
-0.35***
(-4.13)
-0.25***
(-5.59)
-0.25***
(-7.40)
-0.14
( -1.72)
-0.12
(-1.79)
0.69***
(6.08)
0.69***
(6.28)
0.26
(1.16)
0.34*
(2.00)
0.206*
(2.40)
0.22**
(2.80)
-0.79*
(-2.52)
-0.66*
(-2.39)
-0.23*
(-2.37)
-0.20*
(-2.41)
0.04
(0.50)
0.05
(0.68)
Mean efficiency 0.76 0.77 0.78 0.78 0.79 0.81 0.75 0.75
Log-likelihood -238.67 -239.46 -218.60 -218.752 -213.00 -216.93 -230.79 -232.68
0.67***
(6.21)
0.61***
(6.65)
0.33*
(2.46)
0.33**
(2.84)
0.37
(1.84)
0.26
(1.89)
0.69***
(6.88)
0.60***
(6.78)
0.21***
(4.38)
0.19***
(5.57)
0.13***
(10.41)
0.13***
(10.98)
0.13***
(6.79)
0.12***
(10.27)
0.20***
(4.71)
0.17***
(6.25)
Monotonicity, % obs 100% 100% 100% 100%
Quasi-concavity,
% obs
88.4% 88.8% 99.9% 86.8%
Observations 704 704 704 704 704 704 704 704
0
ln EDIW2
ln EDIW
SECQNln
SECQLln
EDIWSECQN lnln
EDIWSECQL lnln
TERTQNln
EDIWTERTQN lnln
1. Ethnic diversity positively associated with efficiency: complementarity
of skills
2. Quantity of secondary school education positively associated with
efficiency: social inclusion hypothesis
3. However, interaction SECQNxEDIW suggests political aspirations are at
work: more access to secondary education spurs political unrest
4. Quality of secondary education decreasing efficiency:
political aspirations again
5. Quantity of tertiary education increases efficiency: social inclusion
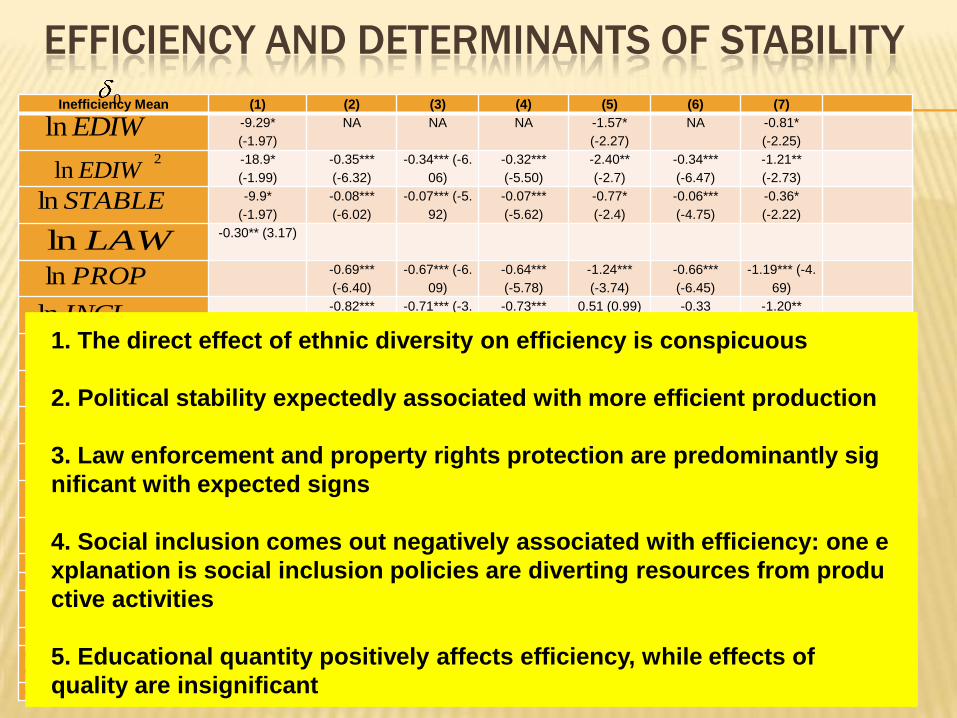
EFFICIENCY AND DETERMINANTS OF STABILITY
Inefficiency Mean (1) (2) (3) (4) (5) (6) (7)
-9.29*
(-1.97)
NA NA NA -1.57*
(-2.27)
NA -0.81*
(-2.25)
-18.9*
(-1.99)
-0.35***
(-6.32)
-0.34*** (-6.
06)
-0.32***
(-5.50)
-2.40**
(-2.7)
-0.34***
(-6.47)
-1.21**
(-2.73)
-9.9*
(-1.97)
-0.08***
(-6.02)
-0.07*** (-5.
92)
-0.07***
(-5.62)
-0.77*
(-2.4)
-0.06***
(-4.75)
-0.36*
(-2.22)
-0.30** (3.17)
-0.69***
(-6.40)
-0.67*** (-6.
09)
-0.64***
(-5.78)
-1.24***
(-3.74)
-0.66***
(-6.45)
-1.19*** (-4.
69)
-0.82***
(-3.96)
-0.71*** (-3.
41)
-0.73***
(-3.74)
0.51 (0.99) -0.33
(-1.07)
-1.20**
(-2.92)
0.60*** (2.98
)
0.61** (6.10
)
0.50* (2.35) 2.13***
(3.03)
0.65**
(3.28)
1.55** (3.17
)
-0.11*
(-2.43)
-0.13**
(-2.63)
-0.11
(-1.26)
-0.74*** (-3.
43)
-0.32***
(-3.87)
0.04
(0.44)
-0.36***
(-4.66)
Mean efficiency 0.89 0.75 0.76 0.76 0.84 0.76 0.83
Log-likelihood 39.55 29.60 31.70 32.58 49.43 37.09 64.17
0.84*** (11.69) 0.87*** (19.7
2)
0.87*** (19.
78)
0.86*** (18.9
7)
0.84***
(18.17)
0.85*** (15.3
3)
0.80***
(16.14)
Monotonicity, % obs 99.8% 100% 99.8% 99.8% 99.8% 99.8% 99.8%
Quasi-concavity,
% obs
94.8% 94.8% 94.8% 94.8% 94.8% 94.8% 94.8%
Observations 406 406 406 406 406 406 406
0
ln EDIW2
ln EDIW
STABLEln
LAWln
PROPln
INCLln
SECQNln
SECQLln
PRIMQNln
PRIMQLln
TERTQNln
1. The direct effect of ethnic diversity on efficiency is conspicuous
2. Political stability expectedly associated with more efficient production
3. Law enforcement and property rights protection are predominantly sig
nificant with expected signs
4. Social inclusion comes out negatively associated with efficiency: one e
xplanation is social inclusion policies are diverting resources from produ
ctive activities
5. Educational quantity positively affects efficiency, while effects of
quality are insignificant
CONCLUSIONS
Ethnic diversity affects productive performance in both direct and indirect ways
The indirect effects of ethnic diversity originate in its association with determinants of political stability and human capital formation
3 hypothesis on indirect effects
Social inclusion
Political aspirations
Vested interests
CONCLUSIONS
Robust positive direct association between ethni
c diversity and productive efficiency: complemen
tarity of skills
Robust positive association between ethnic dive
rsity and political stability
Social inclusion and vested interests corroborated
Political aspirations: some evidence, but mostly refut
ed
Quantity of education associated with increased
efficiency, but not quality
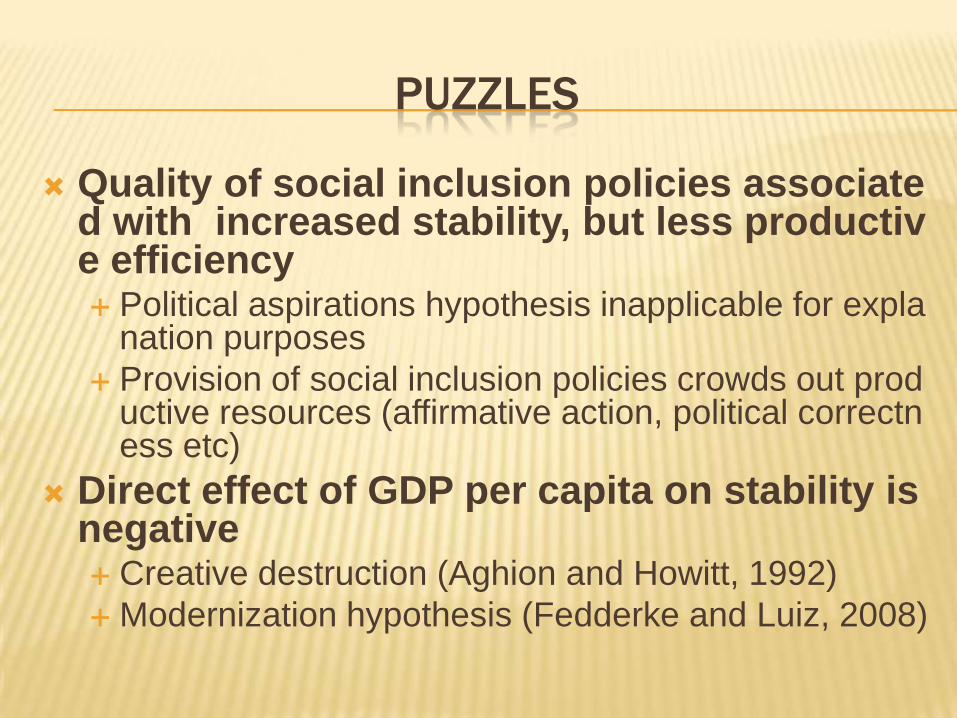
PUZZLES
Quality of social inclusion policies associated with increased stability, but less productive efficiency Political aspirations hypothesis inapplicable for expla
nation purposes
Provision of social inclusion policies crowds out productive resources (affirmative action, political correctness etc)
Direct effect of GDP per capita on stability is negative Creative destruction (Aghion and Howitt, 1992)
Modernization hypothesis (Fedderke and Luiz, 2008)
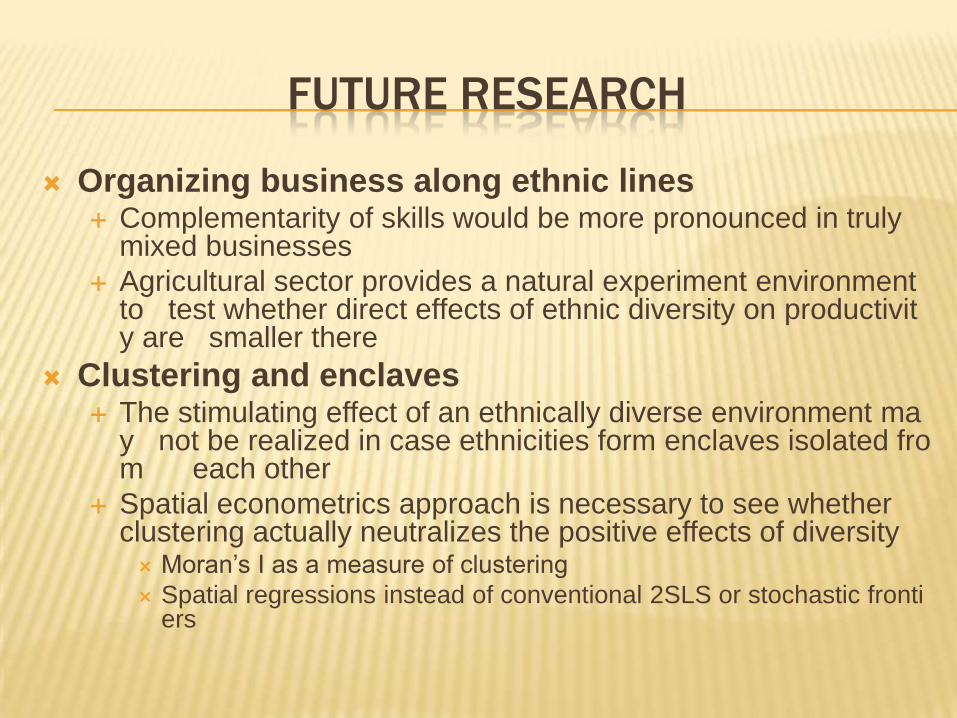
FUTURE RESEARCH
Organizing business along ethnic lines Complementarity of skills would be more pronounced in truly
mixed businesses
Agricultural sector provides a natural experiment environment to test whether direct effects of ethnic diversity on productivity are smaller there
Clustering and enclaves The stimulating effect of an ethnically diverse environment ma
y not be realized in case ethnicities form enclaves isolated from each other
Spatial econometrics approach is necessary to see whether clustering actually neutralizes the positive effects of diversity Moran’s I as a measure of clustering
Spatial regressions instead of conventional 2SLS or stochastic frontiers