Embed Size (px)
Citation preview
Environmental RTDI Programme 2000–2006
EUTROPHICATION FROM AGRICULTURAL
SOURCES – Phosphorus Chemistry of Mineral
and Peat Soils in Ireland
(2000-LS-2.1.1b-M2)
Final Report
Prepared for the Environmental Protection Agency
by
Teagasc, Johnstown Castle, Wexford
Authors:
Karen Daly and David Styles
ENVIRONMENTAL PROTECTION AGENCY
An Ghníomhaireacht um Chaomhnú ComhshaoilPO Box 3000, Johnstown Castle, Co. Wexford, Ireland
Telephone: +353 53 60600 Fax: +353 53 60699E-mail: [email protected] Website: www.epa.ie
6. The6. It isby theoting
lication,uthor(s)ioned, in mattersion,
© Environmental Protection Agency 2005
ACKNOWLEDGEMENTS
This report has been prepared as part of the Environmental Research Technological Development andInnovation Programme (ERTDI) under the productive Sector Operational Programme 2000–200programme is financed by the Irish Government under the National Development Plan 2000–200administered on behalf of the Department of the Environment, Heritage and Local Government Environmental Protection Agency which has the statutory function of co-ordinating and promenvironmental research.
DISCLAIMER
Although every effort has been made to ensure the accuracy of the material contained in this pubcomplete accuracy cannot be guaranteed. Neither the Environmental Protection Agency nor the aaccept any responsibility whatsoever for loss or damage occasioned or claimed to have been occaspart or in full, as a consequence of any person acting, or refraining from acting, as a result of acontained in this publication. All or part of this publication may be reproduced without further permisprovided the source is acknowledged.
ENVIRONMENTAL RTDI PROGRAMME 2000–2006
Published by the Environmental Protection Agency, Ireland
PRINTED ON RECYCLED PAPER
ISBN: 1-84095-174-5
Price: €10 11/05/500
ii

Details of Project Partners
Karen DalyTeagascJohnstown Castle Research CentreCo. WexfordIreland
Tel: +353 53 42888E-mail: [email protected]
David StylesDepartment of BotanyTrinity College DublinCollege GreenDublin 2Ireland
E-mail: [email protected]
iii

10
11
11
13
13
Table of Contents
Acknowledgements ii
Disclaimer ii
Details of Project Partners iii
1 Introduction 1
2 Materials and Methods 3
2.1 Soil Sampling 3
2.2 Laboratory Analysis 3
3 Results and Discussion 5
3.1 General Soil Characteristics 5
3.2 Moist and Dried Sample Analyses 5
3.3 Phosphorus Sorption and Desorption in Mineral and Peat Soils 7
3.4 Phosphorus Sorption in Calcareous and Non-Calcareous Mineral Soils 8
3.5 Phosphorus Desorption in Mineral Soils 8
3.6 Effect of pH on P Sorption–Desorption Dynamics in Non-Calcareous Soils
3.7 Phosphorus Desorption in Non-Calcareous and Calcareous Soils
3.8 The Effect of Soil Type on Morgan’s P–P Desorption/Solubility Relationships
3.9 Phosphorus Sorption/Desorption in Calcareous Soils
3.10 Olsen P and Mehlich-3 P Extraction in Calcareous Soils
4 Conclusions and Recommendations 15
4.1 Conclusions 15
v

4.1.1 Phosphorus chemistry of soils from the Clarianna, Dripsey and Oona catchments 15
4.1.2 Effects of soil type on P chemistry in Irish soils 15
4.2 Recommendations 15
References 17
vi
1 Introduction
Phosphorus (P) loss to Irish rivers is of great concern and
agriculturally derived P is estimated to account for almost
half of Irish river pollution (McGarrigle and Clenaghan,
2004). Soil P that accumulates beyond crop requirements
is a major diffuse source of agricultural P and high soil test
P (STP) levels have been linked to losses in overland flow
from grasslands in Ireland (Kurz et al., 2005) and
elsewhere (Heckrath et al., 1995; Pote et al., 1996). Soil
P analysis is therefore used as an indicator of potential P
losses from grassland soils (Lemunyon and Gilbert, 1993)
and this has led to advancements in soil P analysis that
focus on environmentally orientated tests designed to
simulate losses to water, as opposed to P availability to
plants. The objective of this study was to examine the
impact of soil chemical properties on P sorption and
desorption, so that a risk assessment of P loss from soil
types could be developed using identifiable soil chemical
characteristics.
The importance of relating soil P chemistry to general soil
characteristics and STP in order to predict the risk of P
loss to freshwater systems has been demonstrated in
recent Irish studies (Daly et al., 2002; Kurz et al., 2005;
Styles et al., 2005). These studies used Morgan’s P – the
standard agronomic P test in the Republic of Ireland – as
an indicator of soil P solubility and potential losses to
water.
Olsen P is another STP method widely used in Europe,
Australia and New Zealand, and differs from most other,
acidic, P tests in that it uses an alkaline extractant
(NaHCO3 at pH 8.5). It is thought to be a better indicator
of P availability in calcareous soils (e.g. Curtin and Syers,
2001) than acidic extractants, which, according to test
characteristics, have been found to either overestimate
available P through rigorous Ca-P dissolution, or
underestimate available P through neutralisation in
calcareous soils (e.g. Rhue and Hensel, 1983; Zbiral,
2000). Olsen P was therefore used as an additional
indicator of P availability in this study, alongside Morgan’s
P, in order to determine whether it was a better indicator
of P loss risk for calcareous soils.
Desorption methods, such as the iron-oxide impregnated
paper strip test, simulate long-term desorption using a
sink for P (Menon et al., 1988; Chardon et al., 1996) and
have been used to measure bioavailable P in overland
flow water (Sharpley, 1993). The iron-oxide strip test for P
(FeO-P) provides a rigorous quantification of short-term
desorbable P (Van der Zee et al., 1987), and, in contrast
to other soil P extractions, it has been found to be equally
effective for calcareous and non-calcareous soils (Guo et
al., 1996; Menon et al., 1997). It was initially thought to
primarily represent bioavailable, dissolved inorganic P
(Van der Zee et al., 1987; Menon et al., 1988). However,
Robinson and Sharpley (1994) found that, whilst it was
effective at extracting almost all dissolved inorganic P
from (soil) solutions, much of the dissolved organic P
fraction was extracted too. Some of the most abundant
soil organic species, such as inositol hexakisphosphate,
are strongly sorbed onto Fe oxides. Thus the FeO-P test,
provides a good indication of desorbable, though not
necessarily inorganic, P. Sibbesen and Sharpley (1997)
recorded strong linear relationships between FeO-P and
bioavailable P in surface runoff. The water-soluble P test
(WSP) was first reported as a simple, effective agronomic
P test by Van der Paauw (1971), but has since been
adopted as a convenient indicator of immediately soluble
P content in soils. A number of studies have proved it to
be a useful indicator of soluble P concentrations in soil
runoff water (Yli-Halla et al., 1995; Sharpley et al., 1981;
McDowell and Sharpley, 2001; Torrent and Delgado,
2001). Both the FeO-P and the WSP tests were used as
indicators of P solubility in this study.
The degree of P saturation (DPS) has been used
extensively as a saturation index that combines
desorbable P and sorption capacity, and is used to define
thresholds of soil P as an environmental indicator
(Beauchemin and Simard, 1999). Aspects of P sorption
often included in the saturation index vary from the sum of
extractable aluminium (Al) and iron (Fe), to a measure of
P sorption capacity from isotherm experiments, thereby
incorporating some feature of soil type combined with a
measurement of soil P. The process of soil P sorption is
commonly described by the sorption isotherm,0 initially to
provide a better understanding of the behaviour of labile P
and its uptake by plants (Barrow, 1967; Bache and
Williams 1971) but more recently, in the context of
describing the capacity of a soil to retain P against losses
1
K. Daly and D. Styles, 2000-LS-2.1.1b-M2
to water (Lookman et al., 1996; Borling et al., 2001). The
advantage of describing P sorption in soils, either for
agronomic or environmental purposes, is that it includes
some aspect of soil type. Phosphorus sorption capacity
has been related to amounts of extractable Al and Fe in
soils and this has been used to model P sorption in soils
with regard to different soil type characteristics (Freese et
al., 1992; Simard et al., 1994; Maguire et al., 2001).
In this present study, the principal soil types (mineral and
peat) from six mini-catchments were collected and
measured for their sorption and desorption properties. An
objective of this study was to describe the phosphorus
chemistry of soil types, and link soil chemical properties
associated with sorption and desorption processes to
potential risk of P loss.
Soil sampling in this study was carried out over two
different time periods. The first soil sampling (over six
mini-catchments) took place in 2001. Phosphorus
sorption in soil types was measured using the Langmuir
sorption isotherm parameters of sorption capacity,
binding energy and buffer capacity. Desorption was
described using the iron-oxide paper strip test (FeO-P)
and P saturation was described using an index of Mehlich-
3 P and maximum sorption capacity from the Langmuir
isotherms. Soil P level was described using the standard
agronomic Morgan’s P test.
When the analytical results from these samples were
examined some of the results relating to P desorption in
calcareous soils were inconclusive. This prompted a
second sampling programme in 2004, to clarify some of
the original findings relating to calcareous and non-
calcareous mineral soils. Four of the original six mini-
catchments were revisited and a range of mineral soils
was collected. The same analytical procedures were
applied to these samples with the inclusion of additional
tests including Olsen-P, single point sorption index (PSI),
total neutralising value (TNV), and water-soluble P
(WSP). Soil P sorption and desorption was also carried
out on field moist and dried samples to compare P
solubility under natural and artificially dried conditions.
These data were used to identify soil factors controlling
sorption and desorption in Irish grassland soils and assign
some level of environmental risk to soils relative to each
other. These results were applied to GIS data sets on soil
classifications for use in a risk assessment model for P
loss in Irish catchments (Daly and Mills, 2005).
2
Eutrophication from agricultural sources – Phosphorus chemistry of mineral and peat soils in Ireland
2 Materials and Methods
2.1 Soil Sampling
The principal soil types (as described by great soil group
or soil association) in six mini-catchments at various
locations around Ireland were identified from detailed soil
maps of catchments. For catchments where no detailed
soil information was available, The General Soil Map of
Ireland (Gardiner and Radford, 1980) was used. Soil
samples were collected so that a range of STP levels,
using Morgan’s P, were represented in each soil group or
association. Samples were taken on a field-by-field basis
to 100 mm using a standard bucket sampler with
approximately 30–40 cores bulked to provide a composite
sample from each field.
Soil sampling was carried out from November 2000 to
January 2001, prior to the spreading of fertilisers and
manures. Seventy samples were collected across six
mini-catchments and returned to Johnstown Castle
Laboratories, oven-dried (40°C), ground and sieved (2-
mm mesh) and stored in boxes at room temperature prior
to analysis. A list of the catchments and their general
characteristics is provided in Table 2.1.
Soil samples taken from the Dripsey, Oona, Clarianna and
Grange–Rahara catchments in November 2004 and early
January 2005 were divided into two subsample sets. One
set was placed in plastic bags and stored at 4°C prior to
analysis within 1 week. The other set of subsamples was
dried in an oven at 40°C for 3 days and stored in plastic
bags at room temperature prior to analysis.
2.2 Laboratory Analysis
Soil samples were analysed for Morgan’s P at Johnstown
Castle Laboratories, Wexford. Agronomic P, as
determined by Morgan’s P, was measured on 6.5 ml of
soil using a buffered acetate-acetic acid reagent in a 1:5
(v/v) soil to solution ratio extracting for 30 min (Peech and
English, 1944; Byrne, 1979). Mehlich-3 extraction was
carried out at the Department of Plant and Soil Science at
the University of Delaware using the modified Mehlich test
(Mehlich, 1984) to extract P, Al, Fe, calcium (Ca), copper
(Cu), magnesium (Mg), manganese (Mn), potassium (K)
and zinc (Zn) at a 1:10 soil solution ratio using Mehlich-3
reagent (0.2 M CH3COOH + 0.25 M NH4NO3 + 0.015 M
NH4F + 0.13 M HNO3 + 0.001 M EDTA). Soil pH was
determined on a 2:1 soil–water ratio paste and
percentage organic matter (%OM) estimated as the loss-
on-ignition of 5-g samples.
Olsen P was measured on a 2.0-g soil sample which was
shaken with 40 ml 0.5 M NaHCO3, buffered at pH 8.5, for
30 min, and MRP measured in the filtrate (Olsen et al.,
1954).
The iron-oxide paper strip P test was used as a ‘P sink’
method for estimates of labile inorganic P in soils
according to the method of Menon et al. (1988). One iron-
oxide impregnated paper strip (100 × 20 mm) was added
to each sample of soil (1 g) suspended in 40 ml of 0.01 M
CaCl2 solution and shaken for 16 h on an end-over-end
shaker. The paper strips were then eluted with 0.1 M
H2SO4 for 1 h and the P concentration in the acidic
solution determined colorimetrically.
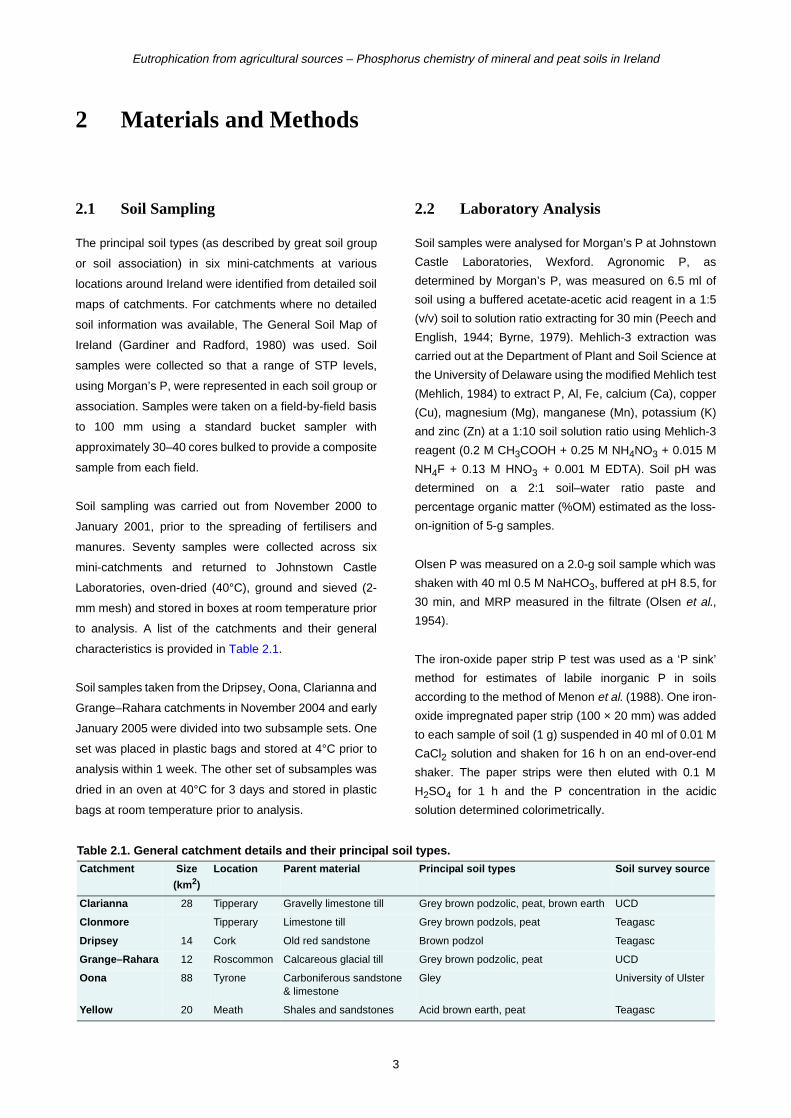
Table 2.1. General catchment details and their principal soil types.Catchment Size
(km2)
Location Parent material Principal soil types Soil survey source
Clarianna 28 Tipperary Gravelly limestone till Grey brown podzolic, peat, brown earth UCD
Clonmore Tipperary Limestone till Grey brown podzols, peat Teagasc
Dripsey 14 Cork Old red sandstone Brown podzol Teagasc
Grange–Rahara 12 Roscommon Calcareous glacial till Grey brown podzolic, peat UCD
Oona 88 Tyrone Carboniferous sandstone& limestone
Gley University of Ulster
Yellow 20 Meath Shales and sandstones Acid brown earth, peat Teagasc
3
K. Daly and D. Styles, 2000-LS-2.1.1b-M2
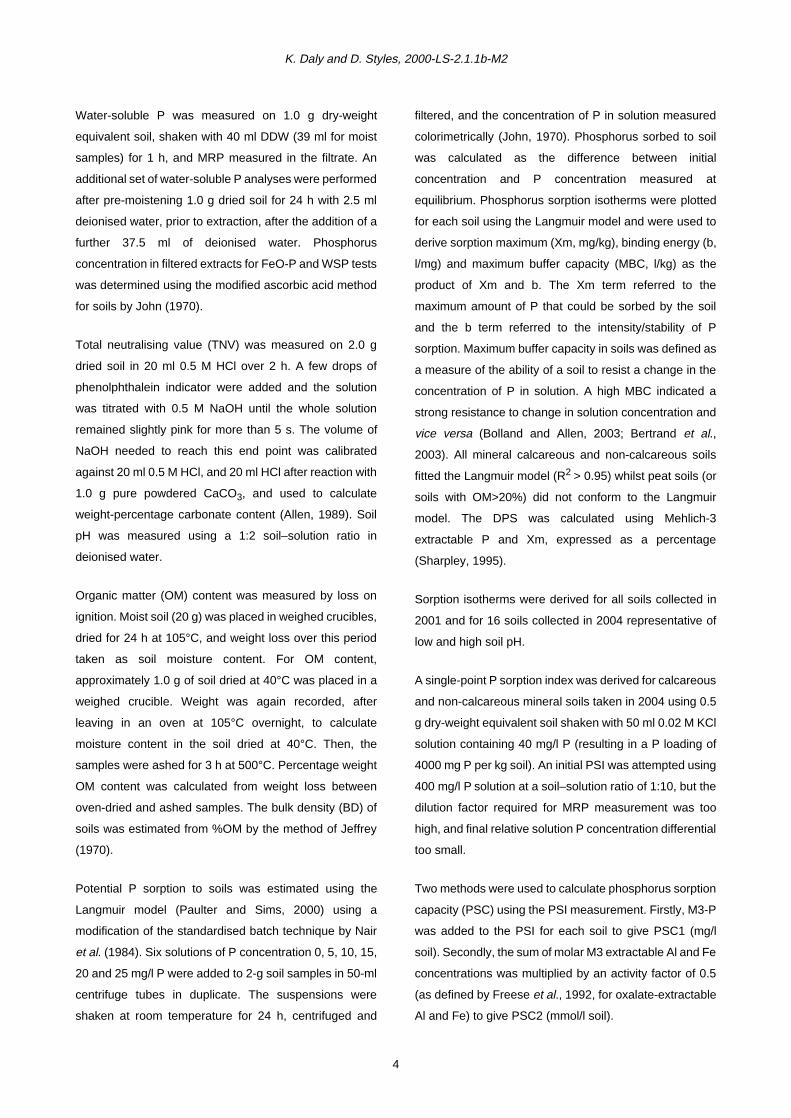
Water-soluble P was measured on 1.0 g dry-weight
equivalent soil, shaken with 40 ml DDW (39 ml for moist
samples) for 1 h, and MRP measured in the filtrate. An
additional set of water-soluble P analyses were performed
after pre-moistening 1.0 g dried soil for 24 h with 2.5 ml
deionised water, prior to extraction, after the addition of a
further 37.5 ml of deionised water. Phosphorus
concentration in filtered extracts for FeO-P and WSP tests
was determined using the modified ascorbic acid method
for soils by John (1970).
Total neutralising value (TNV) was measured on 2.0 g
dried soil in 20 ml 0.5 M HCl over 2 h. A few drops of
phenolphthalein indicator were added and the solution
was titrated with 0.5 M NaOH until the whole solution
remained slightly pink for more than 5 s. The volume of
NaOH needed to reach this end point was calibrated
against 20 ml 0.5 M HCl, and 20 ml HCl after reaction with
1.0 g pure powdered CaCO3, and used to calculate
weight-percentage carbonate content (Allen, 1989). Soil
pH was measured using a 1:2 soil–solution ratio in
deionised water.
Organic matter (OM) content was measured by loss on
ignition. Moist soil (20 g) was placed in weighed crucibles,
dried for 24 h at 105°C, and weight loss over this period
taken as soil moisture content. For OM content,
approximately 1.0 g of soil dried at 40°C was placed in a
weighed crucible. Weight was again recorded, after
leaving in an oven at 105°C overnight, to calculate
moisture content in the soil dried at 40°C. Then, the
samples were ashed for 3 h at 500°C. Percentage weight
OM content was calculated from weight loss between
oven-dried and ashed samples. The bulk density (BD) of
soils was estimated from %OM by the method of Jeffrey
(1970).
Potential P sorption to soils was estimated using the
Langmuir model (Paulter and Sims, 2000) using a
modification of the standardised batch technique by Nair
et al. (1984). Six solutions of P concentration 0, 5, 10, 15,
20 and 25 mg/l P were added to 2-g soil samples in 50-ml
centrifuge tubes in duplicate. The suspensions were
shaken at room temperature for 24 h, centrifuged and
filtered, and the concentration of P in solution measured
colorimetrically (John, 1970). Phosphorus sorbed to soil
was calculated as the difference between initial
concentration and P concentration measured at
equilibrium. Phosphorus sorption isotherms were plotted
for each soil using the Langmuir model and were used to
derive sorption maximum (Xm, mg/kg), binding energy (b,
l/mg) and maximum buffer capacity (MBC, l/kg) as the
product of Xm and b. The Xm term referred to the
maximum amount of P that could be sorbed by the soil
and the b term referred to the intensity/stability of P
sorption. Maximum buffer capacity in soils was defined as
a measure of the ability of a soil to resist a change in the
concentration of P in solution. A high MBC indicated a
strong resistance to change in solution concentration and
vice versa (Bolland and Allen, 2003; Bertrand et al.,
2003). All mineral calcareous and non-calcareous soils
fitted the Langmuir model (R2 > 0.95) whilst peat soils (or
soils with OM>20%) did not conform to the Langmuir
model. The DPS was calculated using Mehlich-3
extractable P and Xm, expressed as a percentage
(Sharpley, 1995).
Sorption isotherms were derived for all soils collected in
2001 and for 16 soils collected in 2004 representative of
low and high soil pH.
A single-point P sorption index was derived for calcareous
and non-calcareous mineral soils taken in 2004 using 0.5
g dry-weight equivalent soil shaken with 50 ml 0.02 M KCl
solution containing 40 mg/l P (resulting in a P loading of
4000 mg P per kg soil). An initial PSI was attempted using
400 mg/l P solution at a soil–solution ratio of 1:10, but the
dilution factor required for MRP measurement was too
high, and final relative solution P concentration differential
too small.
Two methods were used to calculate phosphorus sorption
capacity (PSC) using the PSI measurement. Firstly, M3-P
was added to the PSI for each soil to give PSC1 (mg/l
soil). Secondly, the sum of molar M3 extractable Al and Fe
concentrations was multiplied by an activity factor of 0.5
(as defined by Freese et al., 1992, for oxalate-extractable
Al and Fe) to give PSC2 (mmol/l soil).
4
Eutrophication from agricultural sources – Phosphorus chemistry of mineral and peat soils in Ireland
3 Results and Discussion
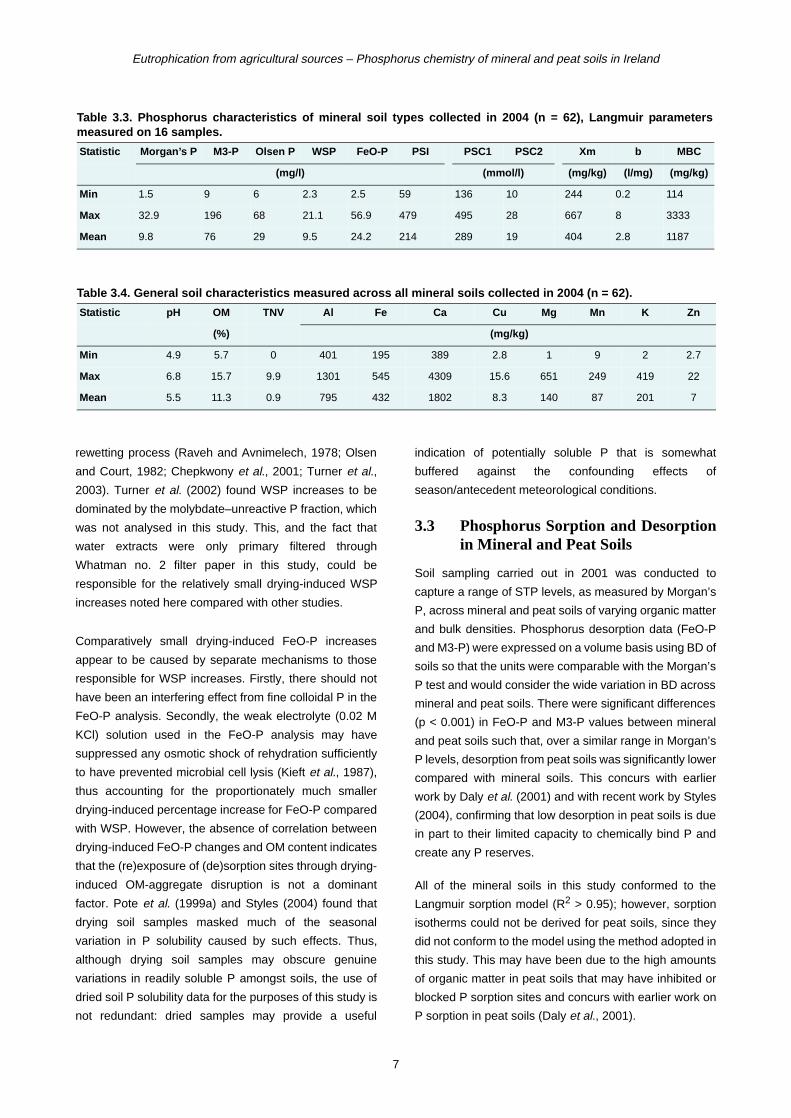
3.1 General Soil Characteristics
Soil samples taken across the six catchments in 2001,
comprising of mineral and peat soils, displayed a range of
general soil properties. Soil pH ranged from 4.7 to 7.3
(mean 5.8) and %OM ranged from 5.3 to 43 (mean
11.5%). Summary statistics of P and non-P data are
presented in Tables 3.1 and 3.2. The peat soils from the
Clonmore, Clarianna and Grange–Rahara catchments,
had OM levels above 20%. The pH of non-calcareous
mineral soils, in general, ranged from 4.7 to 6.0. The
average Morgan’s P value across all soils was 7.2 mg/l
and ranged from 1.5 to 17.5 mg/l.
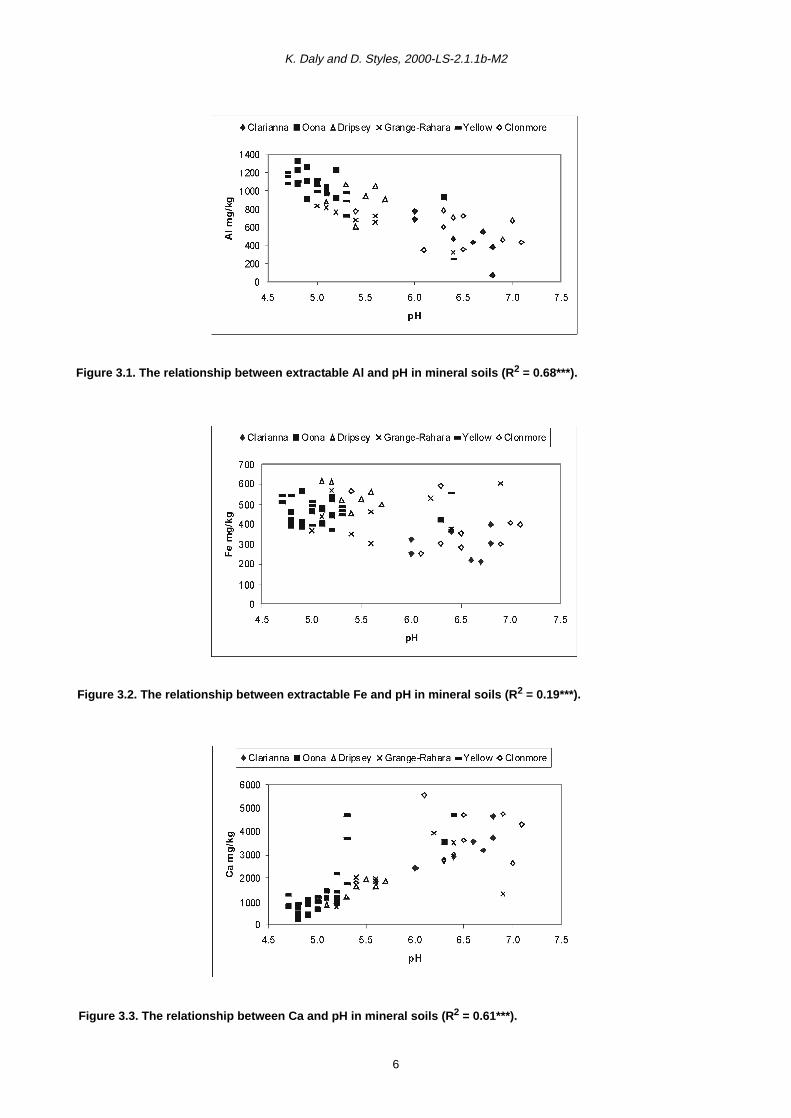
Soil chemical parameters, such as extractable Al, Fe, Ca,
Mg and Mn, were all strongly correlated with soil pH and
these elements were measured in both non-calcareous
and calcareous mineral soils sampled in this study. Within
the mineral soils, extractable Al (R2 = 0.68***) and Fe (R2
= 0.19***) were negatively correlated with soil pH with
values of both metals significantly higher in non-
calcareous soils compared to calcareous soils (p < 0.001).
Conversely, extractable Ca (R2 = 0.61***), Mg (R2 =
0.14**) and Mn (R2 = 0.14**) were positively correlated
with pH and values of these metals were significantly
higher in calcareous soils compared to non-calcareous
soils. The relationships between Al, Fe, Ca and pH across
mineral soils are presented in Figs 3.1–3.3. Extractable
Ca ranged from 284.3 to 32,104 mg/kg (mean 3598.8
mg/kg) with the highest measured in calcareous soils of
the Clarianna and Clonmore catchments. Conversely, the
highest Al levels were measured in the non-calcareous
soils of the Oona catchment and values ranged from 69 to
1330 mg/kg. Extractable Fe was highest in the non-
calcareous soils of the Dripsey catchment and values
ranged from 75 to 618.8 mg/kg. Analytical data of soil
samples taken in 2004 from four of the six mini-
catchments are summarised in Tables 3.3 and 3.4.
3.2 Moist and Dried Sample Analyses
In line with other studies, overall, drying the soils was
found to significantly increase soluble P (measured here
in the form of WSP and FeO-P). However, the mean
increases in WSP and FeO-P after drying were similar
and small (3.32 mg/l, or 50%, and 3.36 mg/l, or 16%,
respectively) compared with soluble P increases found by
Turner and Haygarth (2001) and Styles et al. (2005).
Drying-induced changes in WSP were significantly
positively correlated with OM content (r = 0.59, p <
0.0001), but not with pH or Ca, and drying-induced
changes in FeO-P were not significantly correlated with
any of these soil characteristics. The positive correlation
between drying-induced WSP increases and OM is
consistent with drying-induced P release associated with
OM oxidation and disruption during the drying and
Table 3.1. Phosphorus sorption and desorption in all soil types collected (n = 70); peat soils are not included inLangmuir sorption terms.
Statistic Morgan ’s P(mg/l)
Feo-P(mg/l)
M3-P(mg/l)
Xm(mg/kg)
b(l/mg)
MBC(mg/kg)
DPS(%)
Min 1.5 14.3 2.2 263 0.35 119 4.4
Max 17.5 60.7 174.5 625 7.67 3333 48.4
Mean 7.2 30.2 55.6 421 1.85 816 17.6
Table 3.2. General soil characteristics measured across all mineral and peat soils collected in 2001 (n = 70).Statistic pH OM BD* Al Fe Ca Cu Mg Mn K Zn
(%) (g/ml) (mg/kg)
Min 4.7 5.3 0.4 69 75 284 0.9 58 20 59 2.5
Max 7.3 43 1.0 1330 619 32,104 10.8 544 217 420 21.5
Mean 5.8 11.5 0.8 809 430 3,599 3.8 154 87 171 6.0
*Estimated from %OM (Jeffrey, 1970).
5
K. Daly and D. Styles, 2000-LS-2.1.1b-M2
Figure 3.3. The relationship between Ca and pH in mineral soils (R2 = 0.61***).
Figure 3.1. The relationship between extractable Al and pH in mineral soils (R2 = 0.68***).
Figure 3.2. The relationship between extractable Fe and pH in mineral soils (R2 = 0.19***).
6
Eutrophication from agricultural sources – Phosphorus chemistry of mineral and peat soils in Ireland
rewetting process (Raveh and Avnimelech, 1978; Olsen
and Court, 1982; Chepkwony et al., 2001; Turner et al.,
2003). Turner et al. (2002) found WSP increases to be
dominated by the molybdate–unreactive P fraction, which
was not analysed in this study. This, and the fact that
water extracts were only primary filtered through
Whatman no. 2 filter paper in this study, could be
responsible for the relatively small drying-induced WSP
increases noted here compared with other studies.
Comparatively small drying-induced FeO-P increases
appear to be caused by separate mechanisms to those
responsible for WSP increases. Firstly, there should not
have been an interfering effect from fine colloidal P in the
FeO-P analysis. Secondly, the weak electrolyte (0.02 M
KCl) solution used in the FeO-P analysis may have
suppressed any osmotic shock of rehydration sufficiently
to have prevented microbial cell lysis (Kieft et al., 1987),
thus accounting for the proportionately much smaller
drying-induced percentage increase for FeO-P compared
with WSP. However, the absence of correlation between
drying-induced FeO-P changes and OM content indicates
that the (re)exposure of (de)sorption sites through drying-
induced OM-aggregate disruption is not a dominant
factor. Pote et al. (1999a) and Styles (2004) found that
drying soil samples masked much of the seasonal
variation in P solubility caused by such effects. Thus,
although drying soil samples may obscure genuine
variations in readily soluble P amongst soils, the use of
dried soil P solubility data for the purposes of this study is
not redundant: dried samples may provide a useful
indication of potentially soluble P that is somewhat
buffered against the confounding effects of
season/antecedent meteorological conditions.
3.3 Phosphorus Sorption and Desorptionin Mineral and Peat Soils
Soil sampling carried out in 2001 was conducted to
capture a range of STP levels, as measured by Morgan’s
P, across mineral and peat soils of varying organic matter
and bulk densities. Phosphorus desorption data (FeO-P
and M3-P) were expressed on a volume basis using BD of
soils so that the units were comparable with the Morgan’s
P test and would consider the wide variation in BD across
mineral and peat soils. There were significant differences
(p < 0.001) in FeO-P and M3-P values between mineral
and peat soils such that, over a similar range in Morgan’s
P levels, desorption from peat soils was significantly lower
compared with mineral soils. This concurs with earlier
work by Daly et al. (2001) and with recent work by Styles
(2004), confirming that low desorption in peat soils is due
in part to their limited capacity to chemically bind P and
create any P reserves.
All of the mineral soils in this study conformed to the
Langmuir sorption model (R2 > 0.95); however, sorption
isotherms could not be derived for peat soils, since they
did not conform to the model using the method adopted in
this study. This may have been due to the high amounts
of organic matter in peat soils that may have inhibited or
blocked P sorption sites and concurs with earlier work on
P sorption in peat soils (Daly et al., 2001).
Table 3.3. Phosphorus characteristics of mineral soil types collected in 2004 (n = 62), Langmuir parametersmeasured on 16 samples.
Statistic Morgan’s P M3-P Olsen P WSP FeO-P PSI PSC1 PSC2 Xm b MBC
(mg/l) (mmol/l) (mg/kg) (l/mg) (mg/kg)
Min 1.5 9 6 2.3 2.5 59 136 10 244 0.2 114
Max 32.9 196 68 21.1 56.9 479 495 28 667 8 3333
Mean 9.8 76 29 9.5 24.2 214 289 19 404 2.8 1187
Table 3.4. General soil characteristics measured across all mineral soils collected in 2004 (n = 62).
Statistic pH OM TNV Al Fe Ca Cu Mg Mn K Zn
(%) (mg/kg)
Min 4.9 5.7 0 401 195 389 2.8 1 9 2 2.7
Max 6.8 15.7 9.9 1301 545 4309 15.6 651 249 419 22
Mean 5.5 11.3 0.9 795 432 1802 8.3 140 87 201 7
7
K. Daly and D. Styles, 2000-LS-2.1.1b-M2
3.4 Phosphorus Sorption in Calcareousand Non-Calcareous Mineral Soils
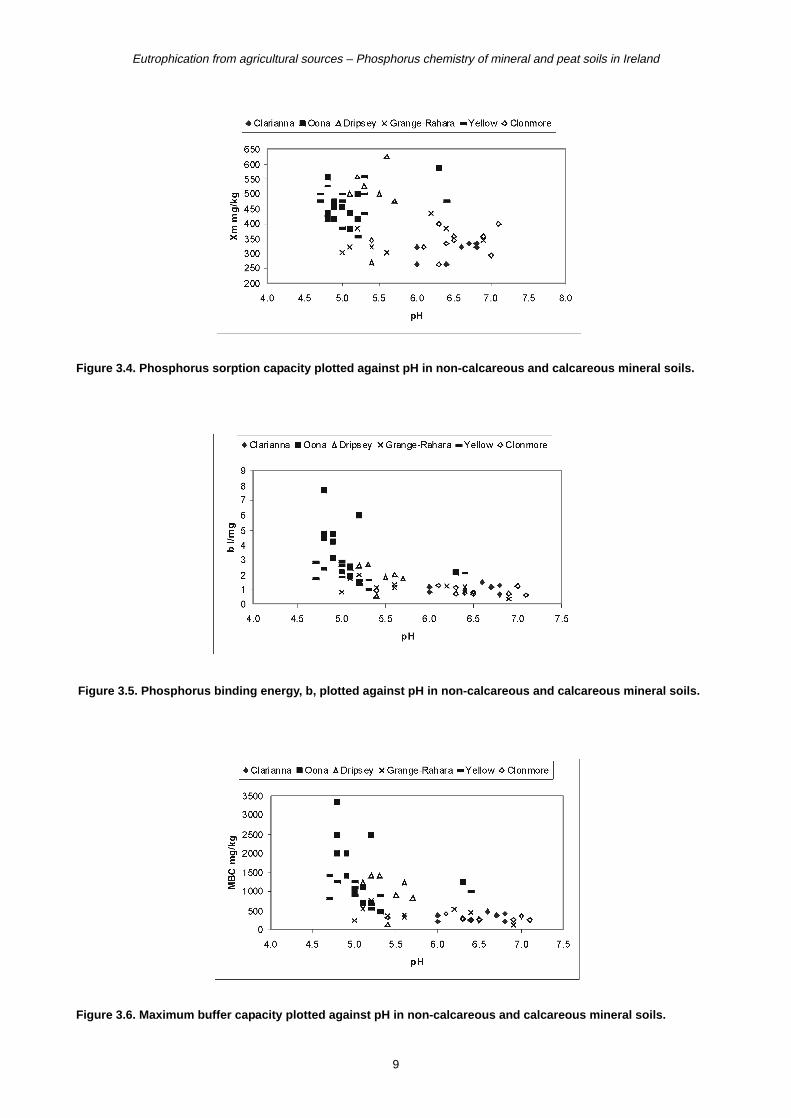
The Langmuir sorption isotherm parameters Xm, b and
MBC were negatively correlated with soil pH in mineral
soils (collected in 2001) and all of the sorption parameters
decreased as soil pH increased (Figs 3.4 to 3.6).
Maximum sorption capacity, Xm, was negatively
correlated with pH (R2 = 0.23***), and decreased as pH
increased. Hypothesis testing between non-calcareous
and calcareous soils returned significant differences
about the mean (p < 0.001) and median (p < 0.001) with
higher sorption capacities measured in non-calcareous
soils. The binding energy, b, decreased non-linearly with
pH and values were significantly higher in non-calcareous
soils (p < 0.001). Similarly, MBC decreased with
increasing soil pH (R2 = 0.37***) and values in non-
calcareous soils were significantly higher than calcareous
soils (p < 0.001). Soil samples collected in 2004 showed
similar trends and sorption measurements PSI, PSC1 and
PSC2 were all significantly, inversely correlated with pH
and Ca. In addition, measures of PSI and Langmuir terms
Xm, b and MBC were all significantly (p < 0.0001) lower in
calcareous soils than non-calcareous soils, with highest
values measured in non-calcareous mineral soils. The
PSI was found to be significantly lower in calcareous than
non-calcareous soils, in both moist and dried sample
analyses.
All of the Langmuir sorption parameters Xm, b and MBC
were positively correlated with extractable Al across the
range of mineral soils; however, these correlations were
only significant in the non-calcareous soils. Maximum
sorption capacity was positively correlated with
extractable Fe across calcareous (R2 = 0.36**) and non-
calcareous soils (R2 = 0.25**). In a multiple regression
model (R2 = 0.72), Xm was described by Al, Fe and %OM
as positive predictors. Phosphorus binding energy (b) was
described in a multiple regression model (R2 = 0.63) using
Al as a positive predictor and %OM as a negative
predictor. These equations are shown in Table 3.5.
Extractable Al correlated with both Xm and b, providing
strongly bound sites for sorption. Both Al and Fe are
recognised soil factors that influence sorption capacity in
soils (Freese et al., 1992; Beauchemin and Simard, 1999;
Borling et al., 2001); however, the inclusion of %OM as a
variable is not as common as using Al and Fe. The
equations in Table 3.5, describing Xm and b using %OM,
suggest that whilst sorption surfaces can be provided by
OM, the P binding energies were negatively affected by
OM, suggesting weaker P binding energies associated
with OM surfaces.
Amongst non-calcareous soils collected in 2004,
regression analyses between PSC1 and the major soil
characteristics indicated that extractable Al was the
dominant predictor of sorption capacity (R2 = 0.64, p <
0.0001) and the inclusion of OM content was significant as
a positive predictor (p = 0.023) and marginally increased
R2 to 0.66. This concurred with the earlier finding reported
in soils taken in 2001.
For calcareous soils, only the regression equation
predicting Xm using extractable Fe was improved with the
inclusion of Ca (R2 = 0.65) in a multiple regression model.
However, amongst calcareous soils collected in 2004, no
significant association was found between PSC1 and
extractable Al, Fe, Ca, pH or OM content.
3.5 Phosphorus Desorption in MineralSoils
The standard agronomic P test, Morgan’s P, was strongly
correlated with desorption tests FeO-P (R2 = 0.63***), M3-
P (R2 = 0.66***) and DPS (R2 = 0.69***), across the range
of mineral calcareous and non-calcareous soils collected
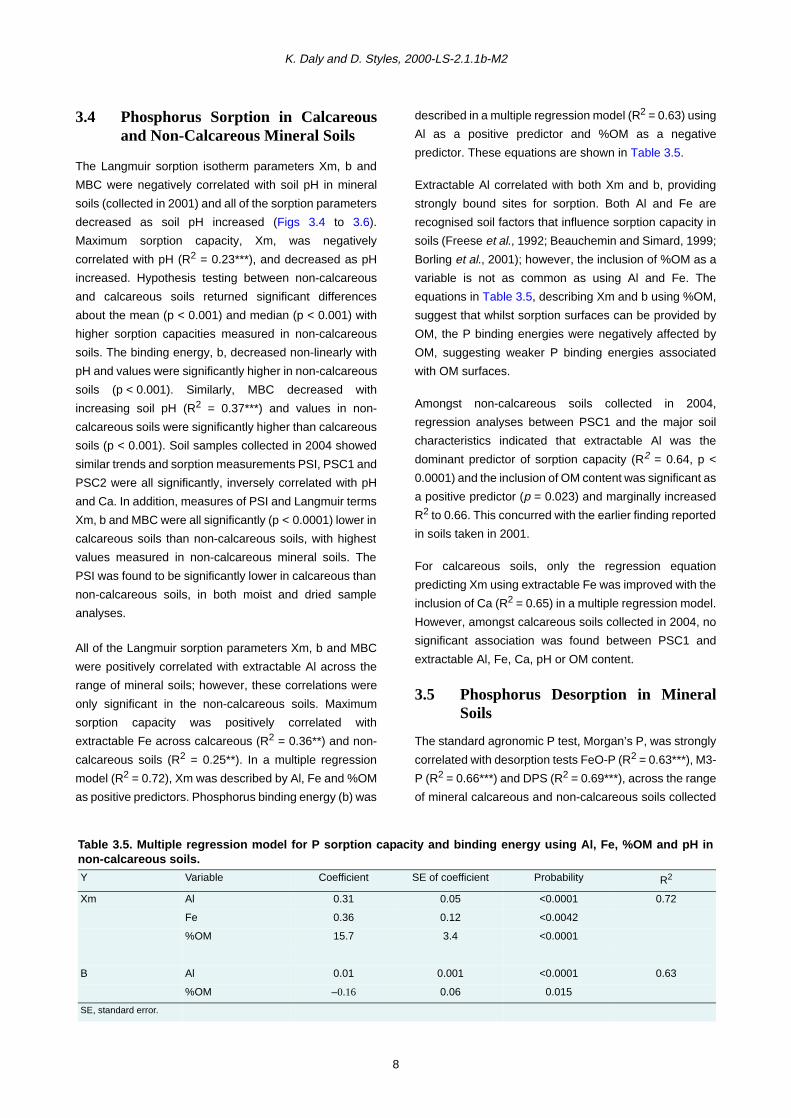
Table 3.5. Multiple regression model for P sorption capacity and binding energy using Al, Fe, %OM and pH innon-calcareous soils.Y Variable Coefficient SE of coefficient Probability R2
Xm Al 0.31 0.05 <0.0001 0.72
Fe 0.36 0.12 <0.0042
%OM 15.7 3.4 <0.0001
B Al 0.01 0.001 <0.0001 0.63
%OM –0.16 0.06 0.015
SE, standard error.
8
Eutrophication from agricultural sources – Phosphorus chemistry of mineral and peat soils in Ireland
Figure 3.6. Maximum buffer capacity plotted against pH in non-calcareous and calcareous mineral soils.
Figure 3.5. Phosphorus binding energy, b, plotted against pH in non-calcareous and calcareous mineral soils.
Figure 3.4. Phosphorus sorption capacity plotted against pH in non-calcareous and calcareous mineral soils.
9
K. Daly and D. Styles, 2000-LS-2.1.1b-M2
in 2001, thus Morgan’s P alone was a reasonably good
predictor of P desorption and saturation. This finding
concurs with work carried out evaluating Morgan’s P as an
indicator of agronomic P and potential losses in laboratory
studies (Jokela et al., 1998; Daly et al., 2001; Humphreys
et al., 2001; Styles, 2004) and plot-scale studies
(Kleinman et al., 2000).
3.6 Effect of pH on P Sorption–Desorption Dynamics in Non-Calcareous Soils
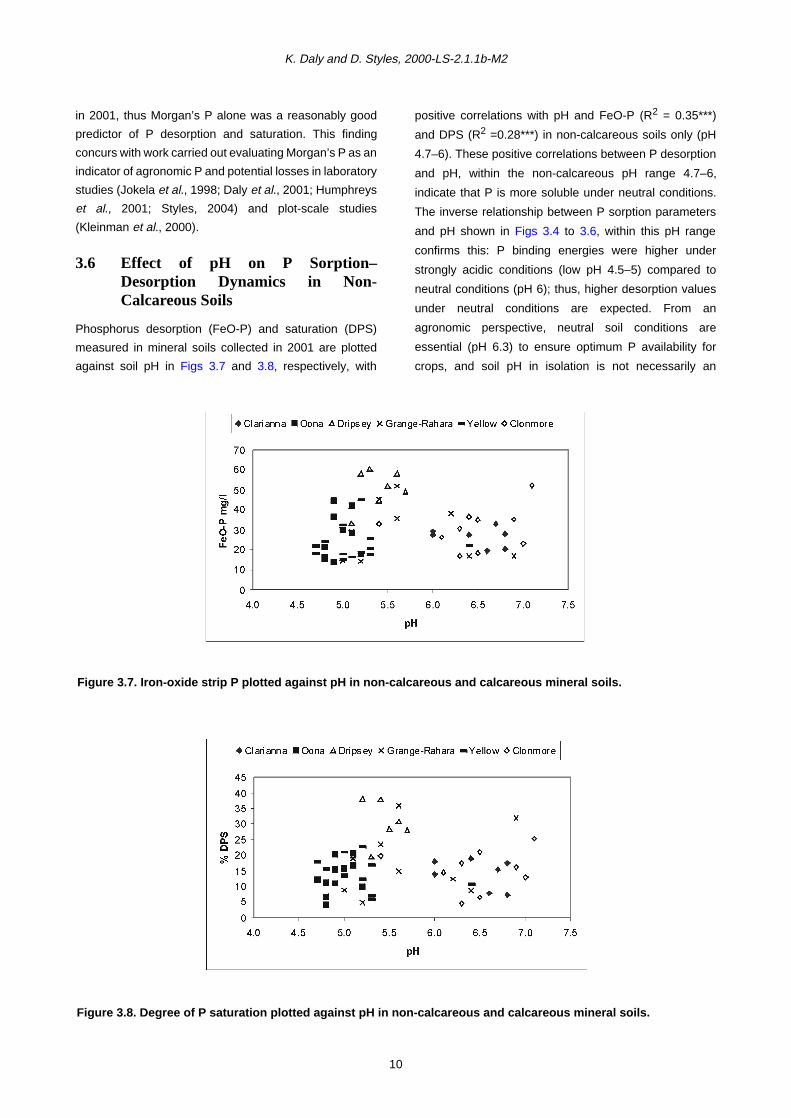
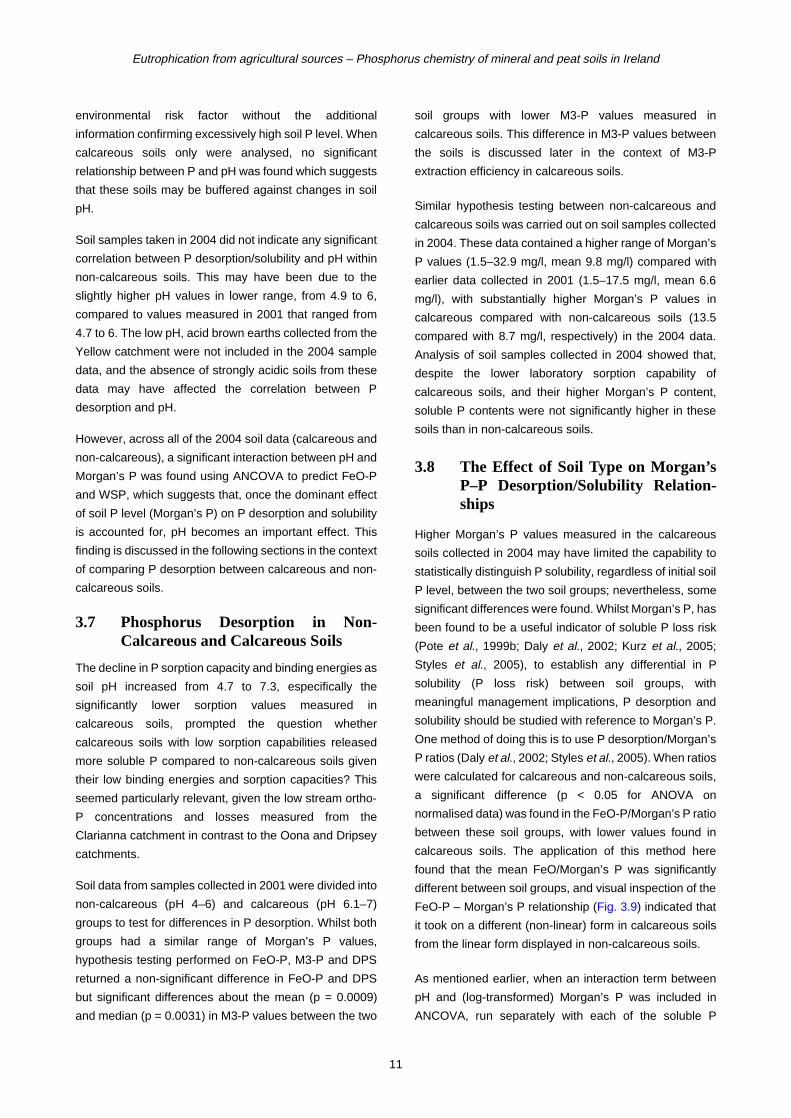
Phosphorus desorption (FeO-P) and saturation (DPS)
measured in mineral soils collected in 2001 are plotted
against soil pH in Figs 3.7 and 3.8, respectively, with
positive correlations with pH and FeO-P (R2 = 0.35***)
and DPS (R2 =0.28***) in non-calcareous soils only (pH
4.7–6). These positive correlations between P desorption
and pH, within the non-calcareous pH range 4.7–6,
indicate that P is more soluble under neutral conditions.
The inverse relationship between P sorption parameters
and pH shown in Figs 3.4 to 3.6, within this pH range
confirms this: P binding energies were higher under
strongly acidic conditions (low pH 4.5–5) compared to
neutral conditions (pH 6); thus, higher desorption values
under neutral conditions are expected. From an
agronomic perspective, neutral soil conditions are
essential (pH 6.3) to ensure optimum P availability for
crops, and soil pH in isolation is not necessarily an
Figure 3.7. Iron-oxide strip P plotted against pH in non-calcareous and calcareous mineral soils.
Figure 3.8. Degree of P saturation plotted against pH in non-calcareous and calcareous mineral soils.
10
Eutrophication from agricultural sources – Phosphorus chemistry of mineral and peat soils in Ireland
environmental risk factor without the additional
information confirming excessively high soil P level. When
calcareous soils only were analysed, no significant
relationship between P and pH was found which suggests
that these soils may be buffered against changes in soil
pH.
Soil samples taken in 2004 did not indicate any significant
correlation between P desorption/solubility and pH within
non-calcareous soils. This may have been due to the
slightly higher pH values in lower range, from 4.9 to 6,
compared to values measured in 2001 that ranged from
4.7 to 6. The low pH, acid brown earths collected from the
Yellow catchment were not included in the 2004 sample
data, and the absence of strongly acidic soils from these
data may have affected the correlation between P
desorption and pH.
However, across all of the 2004 soil data (calcareous and
non-calcareous), a significant interaction between pH and
Morgan’s P was found using ANCOVA to predict FeO-P
and WSP, which suggests that, once the dominant effect
of soil P level (Morgan’s P) on P desorption and solubility
is accounted for, pH becomes an important effect. This
finding is discussed in the following sections in the context
of comparing P desorption between calcareous and non-
calcareous soils.
3.7 Phosphorus Desorption in Non-Calcareous and Calcareous Soils
The decline in P sorption capacity and binding energies as
soil pH increased from 4.7 to 7.3, especifically the
significantly lower sorption values measured in
calcareous soils, prompted the question whether
calcareous soils with low sorption capabilities released
more soluble P compared to non-calcareous soils given
their low binding energies and sorption capacities? This
seemed particularly relevant, given the low stream ortho-
P concentrations and losses measured from the
Clarianna catchment in contrast to the Oona and Dripsey
catchments.
Soil data from samples collected in 2001 were divided into
non-calcareous (pH 4–6) and calcareous (pH 6.1–7)
groups to test for differences in P desorption. Whilst both
groups had a similar range of Morgan’s P values,
hypothesis testing performed on FeO-P, M3-P and DPS
returned a non-significant difference in FeO-P and DPS
but significant differences about the mean (p = 0.0009)
and median (p = 0.0031) in M3-P values between the two
soil groups with lower M3-P values measured in
calcareous soils. This difference in M3-P values between
the soils is discussed later in the context of M3-P
extraction efficiency in calcareous soils.
Similar hypothesis testing between non-calcareous and
calcareous soils was carried out on soil samples collected
in 2004. These data contained a higher range of Morgan’s
P values (1.5–32.9 mg/l, mean 9.8 mg/l) compared with
earlier data collected in 2001 (1.5–17.5 mg/l, mean 6.6
mg/l), with substantially higher Morgan’s P values in
calcareous compared with non-calcareous soils (13.5
compared with 8.7 mg/l, respectively) in the 2004 data.
Analysis of soil samples collected in 2004 showed that,
despite the lower laboratory sorption capability of
calcareous soils, and their higher Morgan’s P content,
soluble P contents were not significantly higher in these
soils than in non-calcareous soils.
3.8 The Effect of Soil Type on Morgan’sP–P Desorption/Solubility Relation-ships
Higher Morgan’s P values measured in the calcareous
soils collected in 2004 may have limited the capability to
statistically distinguish P solubility, regardless of initial soil
P level, between the two soil groups; nevertheless, some
significant differences were found. Whilst Morgan’s P, has
been found to be a useful indicator of soluble P loss risk
(Pote et al., 1999b; Daly et al., 2002; Kurz et al., 2005;
Styles et al., 2005), to establish any differential in P
solubility (P loss risk) between soil groups, with
meaningful management implications, P desorption and
solubility should be studied with reference to Morgan’s P.
One method of doing this is to use P desorption/Morgan’s
P ratios (Daly et al., 2002; Styles et al., 2005). When ratios
were calculated for calcareous and non-calcareous soils,
a significant difference (p < 0.05 for ANOVA on
normalised data) was found in the FeO-P/Morgan’s P ratio
between these soil groups, with lower values found in
calcareous soils. The application of this method here
found that the mean FeO/Morgan’s P was significantly
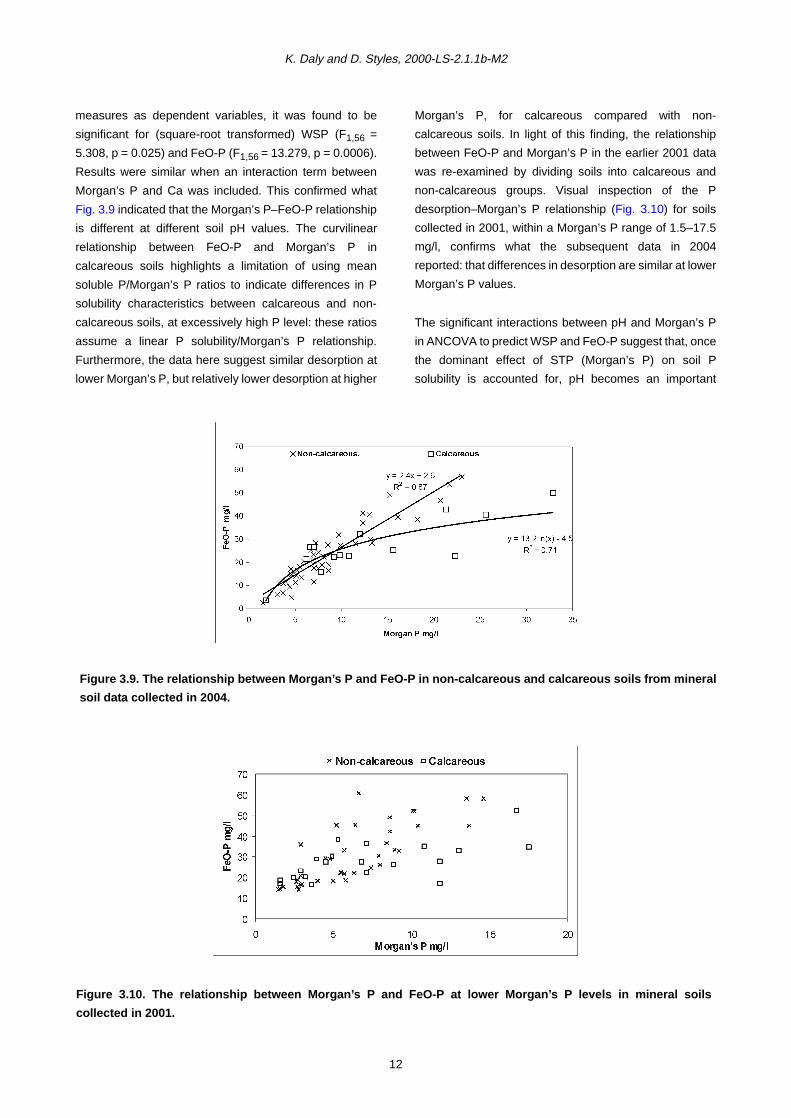
different between soil groups, and visual inspection of the
FeO-P – Morgan’s P relationship (Fig. 3.9) indicated that
it took on a different (non-linear) form in calcareous soils
from the linear form displayed in non-calcareous soils.
As mentioned earlier, when an interaction term between
pH and (log-transformed) Morgan’s P was included in
ANCOVA, run separately with each of the soluble P
11
K. Daly and D. Styles, 2000-LS-2.1.1b-M2
measures as dependent variables, it was found to be
significant for (square-root transformed) WSP (F1,56 =
5.308, p = 0.025) and FeO-P (F1,56 = 13.279, p = 0.0006).
Results were similar when an interaction term between
Morgan’s P and Ca was included. This confirmed what
Fig. 3.9 indicated that the Morgan’s P–FeO-P relationship
is different at different soil pH values. The curvilinear
relationship between FeO-P and Morgan’s P in
calcareous soils highlights a limitation of using mean
soluble P/Morgan’s P ratios to indicate differences in P
solubility characteristics between calcareous and non-
calcareous soils, at excessively high P level: these ratios
assume a linear P solubility/Morgan’s P relationship.
Furthermore, the data here suggest similar desorption at
lower Morgan’s P, but relatively lower desorption at higher
Morgan’s P, for calcareous compared with non-
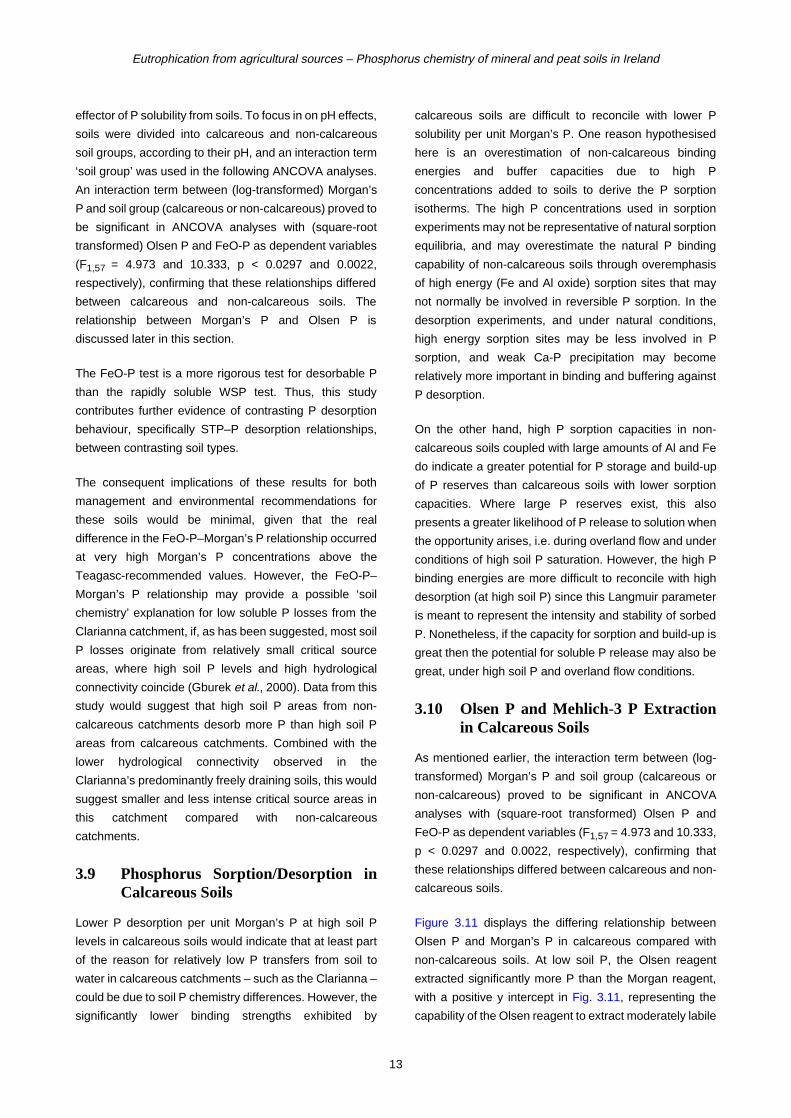
calcareous soils. In light of this finding, the relationship
between FeO-P and Morgan’s P in the earlier 2001 data
was re-examined by dividing soils into calcareous and
non-calcareous groups. Visual inspection of the P
desorption–Morgan’s P relationship (Fig. 3.10) for soils
collected in 2001, within a Morgan’s P range of 1.5–17.5
mg/l, confirms what the subsequent data in 2004
reported: that differences in desorption are similar at lower
Morgan’s P values.
The significant interactions between pH and Morgan’s P
in ANCOVA to predict WSP and FeO-P suggest that, once
the dominant effect of STP (Morgan’s P) on soil P
solubility is accounted for, pH becomes an important
Figure 3.10. The relationship between Morgan ’s P and FeO-P at lower Morgan ’s P levels in mineral soils
collected in 2001.
Figure 3.9. The relationship between Morgan ’s P and FeO-P in non-calcareous and calcareous soils from mineral
soil da ta collected in 2004.
12
Eutrophication from agricultural sources – Phosphorus chemistry of mineral and peat soils in Ireland
effector of P solubility from soils. To focus in on pH effects,
soils were divided into calcareous and non-calcareous
soil groups, according to their pH, and an interaction term
‘soil group’ was used in the following ANCOVA analyses.
An interaction term between (log-transformed) Morgan’s
P and soil group (calcareous or non-calcareous) proved to
be significant in ANCOVA analyses with (square-root
transformed) Olsen P and FeO-P as dependent variables
(F1,57 = 4.973 and 10.333, p < 0.0297 and 0.0022,
respectively), confirming that these relationships differed
between calcareous and non-calcareous soils. The
relationship between Morgan’s P and Olsen P is
discussed later in this section.
The FeO-P test is a more rigorous test for desorbable P
than the rapidly soluble WSP test. Thus, this study
contributes further evidence of contrasting P desorption
behaviour, specifically STP–P desorption relationships,
between contrasting soil types.
The consequent implications of these results for both
management and environmental recommendations for
these soils would be minimal, given that the real
difference in the FeO-P–Morgan’s P relationship occurred
at very high Morgan’s P concentrations above the
Teagasc-recommended values. However, the FeO-P–
Morgan’s P relationship may provide a possible ‘soil
chemistry’ explanation for low soluble P losses from the
Clarianna catchment, if, as has been suggested, most soil
P losses originate from relatively small critical source
areas, where high soil P levels and high hydrological
connectivity coincide (Gburek et al., 2000). Data from this
study would suggest that high soil P areas from non-
calcareous catchments desorb more P than high soil P
areas from calcareous catchments. Combined with the
lower hydrological connectivity observed in the
Clarianna’s predominantly freely draining soils, this would
suggest smaller and less intense critical source areas in
this catchment compared with non-calcareous
catchments.
3.9 Phosphorus Sorption/Desorption inCalcareous Soils
Lower P desorption per unit Morgan’s P at high soil P
levels in calcareous soils would indicate that at least part
of the reason for relatively low P transfers from soil to
water in calcareous catchments – such as the Clarianna –
could be due to soil P chemistry differences. However, the
significantly lower binding strengths exhibited by
calcareous soils are difficult to reconcile with lower P
solubility per unit Morgan’s P. One reason hypothesised
here is an overestimation of non-calcareous binding
energies and buffer capacities due to high P
concentrations added to soils to derive the P sorption
isotherms. The high P concentrations used in sorption
experiments may not be representative of natural sorption
equilibria, and may overestimate the natural P binding
capability of non-calcareous soils through overemphasis
of high energy (Fe and Al oxide) sorption sites that may
not normally be involved in reversible P sorption. In the
desorption experiments, and under natural conditions,
high energy sorption sites may be less involved in P
sorption, and weak Ca-P precipitation may become
relatively more important in binding and buffering against
P desorption.
On the other hand, high P sorption capacities in non-
calcareous soils coupled with large amounts of Al and Fe
do indicate a greater potential for P storage and build-up
of P reserves than calcareous soils with lower sorption
capacities. Where large P reserves exist, this also
presents a greater likelihood of P release to solution when
the opportunity arises, i.e. during overland flow and under
conditions of high soil P saturation. However, the high P
binding energies are more difficult to reconcile with high
desorption (at high soil P) since this Langmuir parameter
is meant to represent the intensity and stability of sorbed
P. Nonetheless, if the capacity for sorption and build-up is
great then the potential for soluble P release may also be
great, under high soil P and overland flow conditions.
3.10 Olsen P and Mehlich-3 P Extractionin Calcareous Soils
As mentioned earlier, the interaction term between (log-
transformed) Morgan’s P and soil group (calcareous or
non-calcareous) proved to be significant in ANCOVA
analyses with (square-root transformed) Olsen P and
FeO-P as dependent variables (F1,57 = 4.973 and 10.333,
p < 0.0297 and 0.0022, respectively), confirming that
these relationships differed between calcareous and non-
calcareous soils.
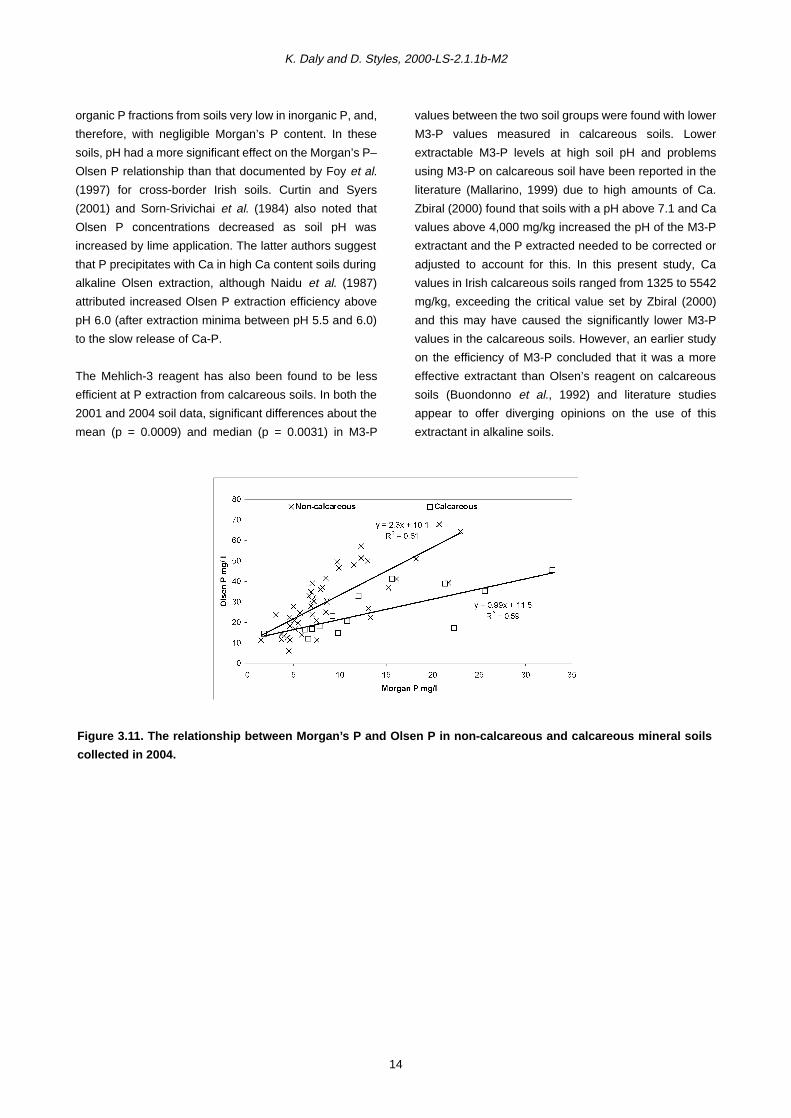
Figure 3.11 displays the differing relationship between
Olsen P and Morgan’s P in calcareous compared with
non-calcareous soils. At low soil P, the Olsen reagent
extracted significantly more P than the Morgan reagent,
with a positive y intercept in Fig. 3.11, representing the
capability of the Olsen reagent to extract moderately labile
13
K. Daly and D. Styles, 2000-LS-2.1.1b-M2
organic P fractions from soils very low in inorganic P, and,
therefore, with negligible Morgan’s P content. In these
soils, pH had a more significant effect on the Morgan’s P–
Olsen P relationship than that documented by Foy et al.
(1997) for cross-border Irish soils. Curtin and Syers
(2001) and Sorn-Srivichai et al. (1984) also noted that
Olsen P concentrations decreased as soil pH was
increased by lime application. The latter authors suggest
that P precipitates with Ca in high Ca content soils during
alkaline Olsen extraction, although Naidu et al. (1987)
attributed increased Olsen P extraction efficiency above
pH 6.0 (after extraction minima between pH 5.5 and 6.0)
to the slow release of Ca-P.
The Mehlich-3 reagent has also been found to be less
efficient at P extraction from calcareous soils. In both the
2001 and 2004 soil data, significant differences about the
mean (p = 0.0009) and median (p = 0.0031) in M3-P
values between the two soil groups were found with lower
M3-P values measured in calcareous soils. Lower
extractable M3-P levels at high soil pH and problems
using M3-P on calcareous soil have been reported in the
literature (Mallarino, 1999) due to high amounts of Ca.
Zbiral (2000) found that soils with a pH above 7.1 and Ca
values above 4,000 mg/kg increased the pH of the M3-P
extractant and the P extracted needed to be corrected or
adjusted to account for this. In this present study, Ca
values in Irish calcareous soils ranged from 1325 to 5542
mg/kg, exceeding the critical value set by Zbiral (2000)
and this may have caused the significantly lower M3-P
values in the calcareous soils. However, an earlier study
on the efficiency of M3-P concluded that it was a more
effective extractant than Olsen’s reagent on calcareous
soils (Buondonno et al., 1992) and literature studies
appear to offer diverging opinions on the use of this
extractant in alkaline soils.
Figure 3.11. The relationship between Morgan’s P and Olsen P in non-calcareous and calcareous mineral soils
collected in 2004.
14
Eutrophication from agricultural sources – Phosphorus chemistry of mineral and peat soils in Ireland
4 Conclusions and Recommendations
4.1 Conclusions
4.1.1 Phosphorus chemistry of soils from the
Clarianna, Dripsey and Oona catchmentsOne of the objectives of this project was to provide some
information on the soil P chemistries of the Oona,
Clarianna and Dripsey catchments. These catchments
were the focus of a recent catchment monitoring study
(Kiely et al., 2005). The chemistry of the Oona and
Dripsey soils are characterised here as non-calcareous
soils that followed a pattern of sorption and desorption
controlled by soil factors such as pH, Al, Fe and %OM. In
terms of desorption to solution, high STP tended towards
higher P desorption and desorption was also influenced
by pH. In the Oona samples, the high levels of Al, perhaps
insoluble under acidic conditions, ensured high P binding
energies and less P desorption relative to the neutral soils
of the Dripsey catchment. The Dripsey catchment soils
were characterised as neutral soils with high DPS and
desorption values that responded to an increase in soil
pH. Amounts of Al in Dripsey soils were relatively small
compared to the Oona catchment, with Fe being the
dominant element in these soils. The soils of the
Clarianna catchment fell into the calcareous category of
soils, determined in this study by soil pH > 6, and, despite
their significantly lower sorption capabilities, they
displayed relatively lower desorption per unit Morgan’s P
at high P levels compared to soils from the other
catchments. The lack of overland and interflow in the
Clarianna, coupled with the relatively lower soil P
desorption at high STP values, could explain the low in-
stream P concentrations in this catchment.
4.1.2 Effects of soil type on P chemistry in Irish
soilsIn mineral soils, high STP values led to greater amounts
of P desorption and saturation.
Peat soils and high organic matter soils (%OM > 20) did
not chemically adsorb P in the same way that mineral soils
do. Surface applications of manure and fertiliser P on peat
soils may be lost to water if P is not sorbed into the soil. In
grassland peat soils, a risk of P loss will occur if fertiliser
and manure P are applied and not utilised immediately by
the crop. Unlike mineral soils, peat soils do not have a
capacity to fix or store applied P as unavailable occluded
fractions that can be made available when a demand for
P occurs during the growing season. The concept of P
‘build-up’ cannot be applied to peat soils in the agronomic
sense and advice needs to be tailored to account for this.
These soils are vulnerable to P loss through a lack of
sorption capacity and binding energy rather than high
rates of desorption to solution.
Phosphorus desorption was affected by soil pH in non-
calcareous mineral soils, such that soils that were neutral
in status desorbed more P to solution than soils that were
strongly acidic. Phosphorus binding energy was affected
by Al and %OM in non-calcareous soils, such that soils
with high amounts of Al (and low pH) had high P binding
energies, whilst mineral soils with high %OM held P less
strongly. The sorption-desorption dynamics in non-
calcareous mineral soils were affected by pH and/or the
presence and solubility of Al under strongly acidic and
neutral conditions.
Across non-calcareous and calcareous soils, pH affected
the relationship between Morgan’s P and P desorption.
Phosphorus desorption in calcareous and non-calcareous
soils, per unit Morgan’s P, was similar at low Morgan’s P
levels (within agronomic limits) but desorption from
calcareous soils was lower when Morgan’s P levels
increased beyond the recommended agronomic values.
4.2 Recommendations
Soil P levels should not exceed crop requirements.
Phosphorus applications on peat soils should not be
managed in the same way as mineral soils; there is a
need for more tailored guidelines for intensively managed
grassland peat soil.
Differences in soil types should be considered in all
catchment and river basin district studies when P losses
to surface waters are under investigation. Excessively
high soil P levels on all soils should be avoided due to
their high P desorption potential, especially those soils
that displayed higher desorption per unit Morgan’s P at
high P levels, i.e. non-calcareous soils. Excessively high
soil P levels on mineral soils with high OM should be
15
K. Daly and D. Styles, 2000-LS-2.1.1b-M2
avoided, particularly those soils approaching peat soil
types such as peat gleys and peaty podzols.
This project recommends that a detailed soil survey is
completed on a national level, so that soil parameters
such as pH and %OM, included in the survey bulletins,
can be used, alongside STP level, as a guide towards
high desorption soils and peat soils where heavy
applications of P should be avoided. Identifying soils at
risk of P desorption might be used towards developing P
management strategies that are more soil type specific.
A national soil P testing survey is also recommended so
that excessively high soil P areas on high desorbing soils
can be identified. For the identification of critical source
areas within catchments for P risk assessment, STP
levels are essential, not only as an indicator of risk, per se,
but coupled with information on soil type, these data could
pinpoint high desorbing soils at high STP levels and
highlight the most intense P desorbing areas within a
catchment. A national soil P testing survey should
consider testing on a field-by-field basis so that the
information could be compatible with field-by-field risk
assessment schemes (Magette et al., 2005) that may be
required under the Water Framework Directive (Council of
the European Communities, 2000) and provide some
detailed agronomic information to farmers.
16
Eutrophication from agricultural sources – Phosphorus chemistry of mineral and peat soils in Ireland
References
Allen, S.E. (ed.), 1989. Chemical Analysis of EcologicalMaterials (2nd edition). Blackwell Scientific Publications,Oxford.
Bache, B.W. and Williams, E.G., 1971. A phosphate sorptionindex for soils. Journal of Soil Science 22: 289–301.
Barrow, N.J., 1967. The relationship between uptake ofphosphorus by plants and the phosphorus potential andbuffering capacity of the soil. Soil Science 104: 99–106.
Beauchemin S. and Simard, R.R., 1999. Soil phosphorussaturation degree: Review of some indices and theirsuitability for P management in Quebec, Canada. CanadianJournal of Soil Science 79: 615–625.
Bertrand I., Holloway R.E., Armstrong R.D., McLaughlin M.J.,2003. Chemical characteristics of phosphorus in alkalinesoils from southern Australia. Australian Journal of SoilResearch 41(1): 61–76.
Bolland M.D.A. and Allen D.G., 2003. Increased P application tolateritic soil in 1976 increased Colwell soil test P for Papplied in 2000. Australian Journal of Soil Research 41(4):645–651.
Borling, K., Otabbong, E. and Barberis, E., 2001. Phosphorussorption in relation to soil properties in some cultivatedSwedish soils. Nutrient Cycling in Agroecosystems 59: 39–46.
Buondonno, A. Coppola, E., Felleca, D. and Violante, P., 1992.Comparing tests for soil fertility: 1. Conversion equationsbetween Olsen and Mehlich3 as phosphorus extractants for120 soils of South Italy. Communications in Soil Scienceand Plant Analysis 23: 699–716.
Byrne, E., 1979. Chemical Analysis of Agricultural Materials. AnForas Taluntais, Dublin, p.194.
Chardon, W.J., Menon R.G and Chien. S.H., 1996. Iron-oxideimpregnated filter paper (Pi test): a review of itsdevelopment and methodological research. Nutrient Cyclingin Agroecosystems 46: 41–51.
Chepkwony, C.K., Haynes, R.J., and Harrison, R., 2001.Mineralization of soil organic P induced by drying andrewetting as a source of plant-available P in limed andunlimed samples of an acid soil. Plant and Soil 234: 89–90.
Council of the European Communities, 2000. Directive2000/60/EC of October 2000, establishing a framework forcommunity action in the field of water policy. Official Journalof the European Communities L327/1 2000.
Curtin, D. and Syers, J.K., 2001. Lime-induced changes inindices of soil phosphate availability. Soil Science Society ofAmerica Journal 65: 147–152.
Daly, K. and Mills, P., 2005. Eutrophication from AgriculturalSources – Relating Catchment Characteristics toPhosphorus Concentrations in Irish Rivers. Final Report.EPA, Johnstown Castle Estate, Wexford, Ireland.
Daly, K., Jeffrey, D. and Tunney, H., 2001. The effect of soil typeon phosphorus sorption capacity and desorption dynamicsin Irish grassland soils. Soil Use and Management 17: 12–
20.
Daly, K., Mills, P., Coulter, B., and McGarrigle, M., 2002.Modelling phosphorus concentrations in Irish rivers usingland use, soil type, and soil phosphorus data. Journal ofEnvironmental Quality 31: 590–599.
Foy, R.H., Tunney, H., Carroll, M.J., Byrne, E., Gately, T.,Bailey, J.S. and Lennox, S.D., 1997. A comparison of Olsenand Morgan soil phosphorus test results from the cross-border region of Ireland. Irish Journal of Agricultural andFood Research 36: 185–193.
Freese, D., Van der Zee, S.E.A.T.M., and Riemsdijk, W.H.,1992. Comparison of different models for phosphatesorption as a function of the iron and aluminium oxides ofsoils. Journal of Soil Science 43: 729–738.
Gardiner, M.J. and Radford, T., 1980. Soil Associations ofIreland and Their Land Use Potential: Explanatory Bulletin toSoil Map of Ireland, 1980. National Soil Survey of Ireland,An Foras Talúntas.
Gburek, W.J., Sharpley, A.N., Heathwaite, L., and Folmar, G.J.,2000. Phosphorus management at the watershed scale: amodification of the phosphorus index. Journal ofEnvironmental Quality 29(1): 130–144.
Guo, F., Yost, R.S., and Jones, R.C., 1996. Evaluation iron-impregnated paper strips for assessing available soilphosphorus. Communications in Soil Science and PlantAnalysis 27(11&12): 2561–2590.
Heckrath, G., Brookes, P.C., Poulton, P.R. and Goulding,K.W.T., 1995. Phosphorus Leaching from Soils ContainingDifferent Phosphorus Concentrations in the BroadbalkExperiment. Journal of Environmental Quality 24(5): 904-910.
Humphreys, J., Tunney, H. and Duggan, P., 2001. Comparisonof extractable soil phosphorus with dry matter productionand phosphorus uptake by perennial ryegrass in a potexperiment. Irish Journal of Agriculture and Food Research,40: 45–54.
Jeffrey, D.W., 1970. A note on the use of ignition loss as ameans for the approximate estimation of soil bulk density.Journal of Ecology 58: 297–299.
John, M.K. 1970. Colorimetric determination of phosphorus insoil and plant materials with ascorbic acid. Soil Science109(4): 214–220.
Jokela W.E, Magdoff, F.R. and Durieux, R.P., 1998. Improvedphosphorus recommendations using modified Morganphosphorus and Aluminium soil tests. Communications inSoil Science and Plant Analysis 29: 1739–1749.
Kieft, T.L., Soroker, E., and Firestone, M.K., 1987. Microbialbiomass response to a rapid increase in water potentialwhen dry soil is wetted. Soil Biology and Biochemistry 19(2):119–126.
Kiely, G., Morgan, G., Quishi, X., Moles, R., Byrne, P., O'Regan,B., Manary, W., Douglas, R., Jordan, P and Daly, K., 2005.Soil and Phosphorus: Catchment Studies. Synthesis report.
17
K. Daly and D. Styles, 2000-LS-2.1.1b-M2
EPA, Johnstown Castle Estate, Wexford, Ireland.
Kleinman, P.J.A., Bryant, R.B., Reid, W.S., Sharpley, A.N. andPimental, D., 2000. Using soil phosphorus behavior toidentify environmental thresholds. Soil Science 165: 943–950.
Kurz, I., Coxon, C., Tunney, H., and Ryan, D., 2005. Effects ofgrassland management practices and environmentalconditions on nutrient concentrations in overland flow.Journal of Hydrology 304: 35–50.
Lemunyon, J. and Gilbert, R.G., 1993. The concept and need fora phosphorus assessment tool. Journal of ProductionAgriculture 6(4): 483–486.
Lookman, R., Jansen, K., Merckx, R., Vlassak, K., 1996.Relationship between soil properties and phosphatesaturation parameters – a transect study in northernBelgium. Geoderma 69: 265–274.
Magette, W.R., Hallissey, R. and Hughes, K., 2005.Eutrophication from Agricultural Sources. Field-by-field riskassessment. Final report. Teagasc, Johnstown CastleResearch Centre, Wexford, Ireland.
Maguire, R.O., Foy, R.H., Bailey, J.S., and Sims, J.T., 2001.Estimation of the phosphorus sorption capacity of acidicsoils in Ireland. European Journal of Soil Science 52: 479–487.
Mallarino, A.P., 1999. Extracting phosphorus in calcareous soilsusing Mehlich3. Soil Plant Analysis 2: 7.
McDowell, R.W. and Sharpley, A.N., 2001. Approximatingphosphorus release from soils to surface runoff andsubsurface drainage. Journal of Environmental Quality 30:508–520.
McGarrigle, M. and Clenaghan, C., 2004. Agriculture andForestry. In: Ireland’s Environment 2004. ISBN 1-84095-134-6. Environmental Protection Agency, Johnstown CastleEstate, Wexford, Ireland.
Mehlich, A., 1984. Mehlich-3 soil test extractant: a modificationof Mehlich-2 extractant. Communications in Soil Scienceand Plant Analysis 15: 1409–1416.
Menon, R.G., Hammond, L.L., and Sissingh, H.A., 1988.Determination of plant-available phosphorus by the ironhydroxide-impregnated filter paper (Pi) soil test. Soil Science
Society of America Journal 52: 110–115.
Menon, R.G., Chien, S.H., and Chardon, W.J., 1997. Iron oxide-impregnated filter paper (Pi) test: II. A review of its
application. Nutrient cycling in Agroecosystems 47: 7–18.
Naidu, R., Tillman, R.W., Syers, J.K., and Kirkman, J.H., 1987.Effect of liming on phosphate extracted by two soil-testingprocedures. Fertilizer Research 14(2): 143–152.
Nair, P.S., Logan, T.J., Sharpley, A.N., Sommers, L.E.,Tabatabai, M.A. and Yuan, T.L., 1984. Interlaboratorycomparison of a standardized phosphorus adsorptionprocedure. Journal of Environmental Quality 13: 591–595.
Olsen, R.G. and Court, M.N., 1982. Effect of wetting and dryingof soils on phosphate adsorption and resin extraction of soilphosphate. Journal of Soil Science 33: 709–717.
Olsen, S.R., Cole, C.V., Watanabe, F.S., and Dean, L.A., 1954.Estimation of Available Phosphorus in Soils by Extractionwith Sodium Bicarbonate. USDA Circ. 939. US Gov. Print.Office, Washington, DC.
Paulter, M.C., and Sims, J.T., 2000. Relationship between soiltest P, soluble P and P saturation in Delaware soils. SoilScience Society of America Journal 64: 765–773.
Peech, M. and English, L., 1944. Rapid microbiological soiltests. Soil Science 57: 167–195.
Pote, D.H., Daniel, T.C., Sharpley, A.N., Moore, P.A., Edwards,D.R. and Nichols, D.J., 1996. Relating extractable soilphosphorus to phosphorus losses in runoff. Soil ScienceSociety of America Journal 60: 855–859.
Pote, D.H., Daniel, T.C, Nichols, D.J., Moore, P.A., Miller, D.M.,and Edwards, D.R., 1999a. Seasonal and soil-drying effectson runoff phosphorus relationships to soil phosphorus. SoilScience Society of America Journal 63: 1006–1012.
Pote, D.H., Daniel, T.C, Nichols, D.J., Sharpley, A.N., Moore,P.A., Miller, D.M., and Edwards, D.R., 1999b. Relationshipbetween phosphorus levels in three Ultisols and phosphorusconcentrations in runoff. Journal of Environmental Quality28: 170–175.
Raveh, A., and Avnimelech, Y., 1978. The effect of drying on thecolloidal properties and stability of humic compounds. Plantand Soil 50: 545–552.
Rhue, R.D. and Hensel, D.R., 1983. The effect of lime on theavailability of residual phosphorus and its extractability bydilute acid. Soil Science Society of America Journal 47:266–270.
Robinson, J.S., and Sharpley, A.N., 1994. Organic phosphoruseffects on sink characteristics of iron-oxide-impregnatedfilter paper. Soil Science Society of America Journal 58:758–761.
Sharpley, A.N., 1993. An innovative approach to estimatebioavailable phosphorus in agricultural runoff using ironoxide-impregnated paper. Journal of Environmental Quality22: 597–601.
Sharpley, A.N., 1995. Dependence of runoff phosphorus onextractable soil phosphorus. Journal of EnvironmentalQuality 24: 920–926.
Sharpley, A.N., Ahuja, L.R., and Menzel, R.G., 1981. Therelease of soil phosphorus to runoff in relation to the kineticsof desorption. Journal of Environmental Quality 10(3): 386–391.
Sibbeson, E. and Sharpley, A.N., 1997. Setting and justifyingupper critical limits for phosphorus in soils. p 151. In:Tunney, H., Carton, O.T., Brookes, P.C., and Johnson, A.E.(eds) Phosphorus Loss from Soil to Water. CABinternational, Guildford, UK.
Simard, R.R., Cluis, D. Gangbazo, G. and Pesant, A.R., 1994.Phosphorus sorption and desorption indices in soil.Communications in Soil Science and Plant Analysis 25:1483–1494.
Sorn-Srivichai, P., Tillman, R.W., Syers, J.K., and Cornforth,I.S., 1984. The effect of soil pH on Olsen bicarbonatephosphate values. Journal of the Science of Food andAgriculture 35: 257–264.
Styles, D., 2004. Phosphorus dynamics in some Irish soils: theinfluence of laboratory drying, soil characteristics andseason. Ph.D. thesis, Dublin University.
Styles, D., Donohue, I., Coxon, C., Irvine, K., (2005) Linking soilphosphorus to water quality in the Mask catchment of
18
Eutrophication from agricultural sources – Phosphorus chemistry of mineral and peat soils in Ireland
western Ireland through the analysis of moist soil samples.Agriculture, Ecosystems and the Environment, in press.
Torrent, J. and Delgado, A., 2001. Using phosphorusconcentration in the soil solution to predict phosphorusdesorption to water. Journal of Environmental Quality 30:1829–1835.
Turner, B.L. and Haygarth, P.M., 2001. Phosphorussolubilization in rewetted soils. Nature 411: 258.
Turner, B.L., McKelvie, I.D., and Haygarth, P.M., 2002.Characterisation of water-extractable soil organicphosphorus by phosphatase hydrolysis. Soil Biology andBiochemistry 34: 27–35.
Turner, B.L., Driessen, J.P., Haygarth, P.M., and McKelvie, I.D.,2003. Potential contribution of lysed bacterial cells tophosphorus solubilisation in two rewetted Australian pasturesoils. Soil Biology and Biochemistry 35: 187–189.
Van der Paauw, F., 1971. An effective water extraction methodfor the determination of plant-available soil phosphorus.Plant and Soil 34: 467–481.
Van der Zee, S.E.A.T.M., Fokkink, L.G.J., and Van Riemsdijk,W.H., 1987. A new technique for assessment of reversiblyadsorbed phosphate. Soil Science Society of AmericaJournal 51: 599–604.
Yli-Halla, Ekholm, H.P, Turtola, E., Puustinen, K., and Kallio, K.,1995. Assessment of soluble phosphorous load in surfacerunoff by soil analyses. Agriculture, Ecosystems andEnvironment 56: 53–62.
Zbiral, J., 2000. Determination of phosphorus in calcareous soilsby Mehlich3, Mehlich2, CAL and Egner extractants.Communications in Soil Science and Plant Analysis 31:3037–3048.
19