Embed Size (px)
Citation preview
EVAlUA liON OF PROCEDURES FORESTIMATING CITRUS FRUIT YIELD
GROUNDPHOTOGRAPHY
ST A TISTICAL REPORTING SERVICE - U. S. DEPARTMENT OF AGRICULTURE
CONTENfS
Surmnary and ConclusionsBackground .Sample Selection .•••••.••Presurvey ProceduresField Procedures ......•..Fruit C01D1ts
Expansion of Tenninal CountsAnalysis of Expanded Data
Time Requirements ••.••...•.••....•Optimum Allocation •.....•••.••.••.Comparison of Limb Count EstimatorsGround Photography ••••.•••••.•.•.Comparison of Estimating SystemsFruit Size Study .Frui t Droppage StudyRemote Sensing ResearchFruit Quality ResearchRecommendationsAppendix AAppendix B
..
.....................
Pagev1223678
101420243033404446474953
Washington, D. C. 20250
i
February 1972
Table Page1. Quality control indications of COtDlting accuracy, selected
citrus blocks, Texas, 1969 growing season •••••••••••.. ! •••••• 72. Average fruit and variance components: Equal probability
expansion, selected citrus blocks, Texas, 1969 growingse ason 10
3. First-stage mapping: Minutes per tree, selected citrus blocks,Texas, 1969 growing season 12
4. First-stage mapping: Minutes per primary, selected citrusblocks, Texas, 1969 growing season .••••••••••..••.••••••.•••• 12
S. Second-stage mapping: Minutes per primary, selected citrusblocks, Texas, 1969 growing season •••••••••••••.••••••••••••• 13
6. Second-stage mapping: Minutes perterminal, selected citrusblocks, Texas, 1969 growing season .••.•••••••••••.••••••••••• 13
7. Fruit cOtDlting: Minutes per tenninal limb, selected citrusblocks, Texas, 1969 growing season ••.....••••..•....•.••...•. 14
8. Fruit counting: Minutes per fruit, selected citrus blocks,Texas 1969 growing season 14
9. Optimization results:citrus blocks, Texas,
Equal probability expansions, selected1969 growing season . 17
10.
11.
12.
13.
14.
15.
16.
Average number of primary limbs per tree, selected citrusblocks, Texas, 1969 growing season ••••••••••••••••••••••••••• 18Average number of terminal, limbs per primary, selected citrusblocks, Texas, 1969 growing season •.••..•••..•••••••••.••.•.• 18Calculations of nh for each type of citrus, selected citrusblocks, Texas, 1909 growing season •..•••••••••.••••••••.••••• 19Average fruit variance components: Double ratio estimator,selected citrus blocks, Texas, 1969 growing season ••.•••••••• 21Average fruit variance components: Ratio/cluster estimate,selected citrus blocks, Texas, 1969 growing season •••••.••••• 22Coefficients of variation of estimated average fruit count forthree possible estimators, selected citrus blocks, Texas, 1969gr~lng seasoI:l 24
Comparison of photo COtDlts, selected citrus blocks, Texas,1968 and 1969 growing seasons •••••..•••.••...•••.••..••.•.•.• 25
ii
Table Page17. Comparison of photo C01D1t regression lines, Valencia oranges,
selected citrus blocks, Texas, 1969 growing season •..••....•.• 2818. Average fruit c01D1ting time per slide and number of slides
per portion of tree c01D1ted, selected citrus blocks, Texas,1969 growing season 29
19. Average fruit c01D1ted per slide and mnnber of slides perport~on of tree c01D1ted, selected citrus blocks, Texas, 1969groW1ng season 29
20. Comparison of various estimators, selected citrus blocks, Texas,1969 growi.ng season 31
21. Comparison of current and historic estimators, selected citrusblocks, Texas, 1968 growing season •.•••••.•.•.••.••..••••••••• 32
22. Early oranges: Average diameter size, selected citrus blocks,Texas, 1968 and 1969 growing seasons .•.•.•.•••.•••.•..•.•.•••• 34
23. Grapefruit: Average diameter size, selected citrus blocks,Texas, 1968 and 1969 growing seasons •••.••.•••.••••••••••••••• 35
24. Valencia oranges: Average diameter, selected citrus blocks,Texas, 1968 and 1969 growing seasons .•.•..••.•••••••...••••••. 36
25.
26.
Analysis of variance:citrus blocks, Texas,Analysis of variance:citrus blocks, Texas,
Circumference, early oranges, selectedAugus t 1, 1969 37
Circumference, grapefruit, selectedAugtlst 1, 1969 38
27. Analysis of variance: Circumference, Valencia oranges,selected citrus blocks, Texas, September 1, 1969 •••••••••••••• 39
28. Early orange droppage, selected citrus blocks, Texas, 1968aIld 1969 growing seasons 41
29. Grapefruit droppage, selected citrus blocks, Texas, 1968 and1969 growing seasons 42
30. Valencia orange droppage, selected citrus blocks, Texas, 1968an.d 1969 growing seasons 43
31. Analysis of variance of early orange droppage, selected citrusblocks, Texas, 1969 growing season •••.••••..•.••••.••••••••••• 44
32. Correlations of reasurements of size and fruit C01D1ts, selectedcitrus blocks, Texas, 1969 growing season ••••••••••••••••••••. 45
iii
Table Page33. Regression of harvest size on August 1 size, selected citrus
blocks, Texas, 1969 growing season •••.•••••.•••••••••••••••••• 5034. Regression of harvest size on September 1 size, selected
citrus blocks, Texas, 1969 growing season •.••••••.•••..••.•••• 5035. Regression of harvest size on October 1 size, selected citrus
blocks, Texas, 1969 growing season ••••••••••••••.•••••.••••••• 5036. Regression of harvest size on November 1 size, selected citrus
blocks, Texas, 1969 growing se3Son •.•••..•..••••...••...•.•.•. 5137. Regression of harvest size on December 1 size, selected citrus
blocks, Texas, 1969 growing season •••••••••••••••••••••••••••• 5138. Regression of harvest size on January I size, selected citrus
blocks, 1969 growing season 51
39. Regression of harvest weight on harvest size, selected citrusblocks, Texas, 1969 growing season ••..•....•••..•••....•..•... 51
40. Regression of harvest size on September 1 size and Augustgrowth, selected citrus blocks, Texas, 1969 growing season 52
41. Regression of harvest size on October 1 size and Septembergrowth, selected citrus blocks, Texas, 1969 growing season 52
42. Average fruit per tree and variance components, selected citrusblocks, Texas, 1969 growing season .•••••••..•••••••••••••••••• 5:;
Use of trade names in this report is foridentification only and does not constituteendorsement of these products or implydiscrimination against other similar products.
iv
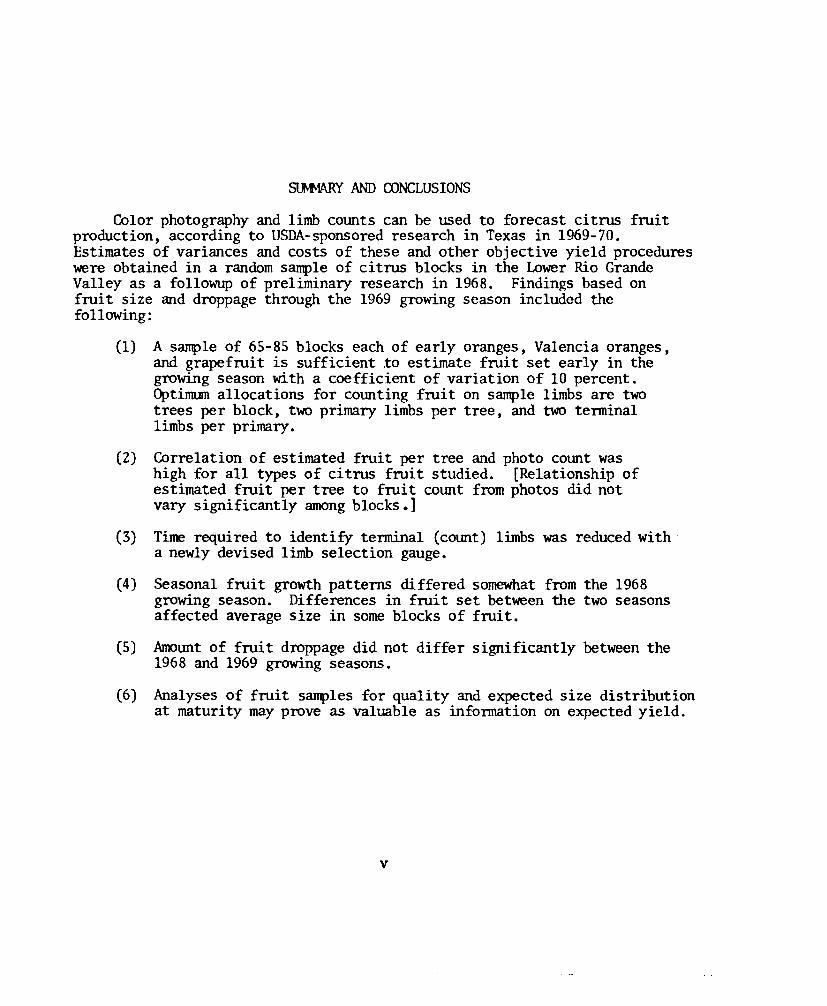
st.Mv1ARY AND CONCLUSIONSColor photography and limb COlUlts can be used to forecast citrus fruit
production, according to USDA-sponsored research in Texas in 1969-70.Estimates of variances and costs of these and other objective yield procedureswere obtained in a random sample of citrus blocks in the Lower Rio GrandeValley as a followup of preliminary research in 1968. Findings based onfruit size and droppage through the 1969 growing season included thefollowing:
(1) A sample of 65-85 blocks each of early oranges, Valencia oranges,and grapefruit is sufficient to estimate fruit set early in thegrowing season with a coefficient of variation of 10 percent.OptiJlllUllallocations for cOlUlting fruit on sample limbs are twotrees per block, two primary limbs per tree, and two terminallimbs per primary.
(2) Correlation of estimated fruit per tree and photo COlUlt washigh for all types of citrus fruit studied. [Relationship ofestimated fruit per tree to fruit COlUlt from photos did notvary significantly among blocks.]
(3) Time required to identify terminal (COlUlt) limbs was reduced witha newly devised limb selection gauge.
(4) Seasonal fruit growth patterns differed somewhat from the 1968growing season. Differences in fruit set between the two seasonsaffected average size in some blocks of fruit.
(5) AmolUlt of fruit droppage did not differ significantly between the1968 and 1969 growing seasons.
(6) Analyses of fruit samples for quality and expected size distributionat maturity may prove as valuable as information on expected yield.
v
EVALUATION OF PROCEDURES FOR ESTIMATING CITRUS FRUIT YIELDFrui t COtmts, Grotmd Photography, Remote Sensing
byRichard D. Allen
Standards and Research DivisionStatistical Reporting Service
BACKGROUNDIn 1968, the Research and Development Branch, Statistical Reporting
Service (SRS), U.S. Department of Agriculture (USDA), conducted a study ofgrotmd photography and other objective procedures to forecast yields oforanges and grapefruit in selected groves in the Lower Rio Grande Valley.Texas Citrus Mutual and the Remote Sensing Laboratory, Agricultural ResearchService (ARS), USDA, Weslaco, Texas, cooperated in the study. That researchindicated the feasibility of using a variety of new techniques--includingphotography--to arrive at objective yield estimates. !!
furing the 1969 growing season, a followup study was made in an attemptto resolve some of the problems raised in the earlier survey and to fUrtherrefine fruit cOtmting procedures. Specific objectives of the project in-cluded the following:
(1) Improvement of sampling definitions and procedures for objectiveyield surveys.
(2) Estimation of components of variance for the various sources ofvariation in estimating number of citrus fruit per tree.
(3) Collection of cost information for various objective yield pro-cedures.
(4) Evaluation of the use of grotmd photography in a sampling designwith estimates of total fruit rather than actual COtmts.
(5) Study of ways aerial photography might be used to i~rove esti-mation techniques.
1/ Estimation based on actual plant or fruit characteristics measured orcounted from randomly selected plots or limbs.
The Research and DevelopmentBranch, SRS,was responsible for conductingthe 1969 research study. Field workwas carried out by the R&DBranch, TexasState Statistical Office of SRS, and Texas Citrus Mutual. Financing wasshared by SRS,Texas Citrus M.ttual, and the Texas Departmentof Agriculture.The ARSRemoteSensing Laboratory at Weslaco, Tex., assisted with someportions of the research.
SAMPLESELECTIOO
A listing of citrus trees compiledby Texas Citrus M.1tualin the LowerRio GrandeValley was used as the sampling frame. Trees were designated bytype of citrus (early oranges, Valencia oranges, or grapefruit) and age (0-3years, 4-7 years, or 8 years and over) at the time of listing (about 1967).A separate samplewas selected for each age class of the three types.
All orchards were listed by irrigation district, subdistrict, block, andlot m.unber. Another code was used to indicate the ownerof each grove offruit.
For each type-age combination, a systematic randomsample was drawn,giving each grove in that listing the samechance of selection. Thus, allsizes of groves had the sameprobability of selection. Desired sample sizesfor the field workwere three groves 0-3 years old, nine groves 4-7 years old,and nine groves 8 years old and over. Ten groves were selected from each0-3-year-old listing and 20 groves from each of the 4-7 and 8-years-and-overlistings. This larger samplewas selected to provide replacements for grovesthat had been removedsince the listing was compiled. Since the systematicsamples from the sampling frame were in sequence. the groves selected wereplaced in randomorder. Otherwise, all groves included for field workwouldhave been located in only one comty.
To cut costs, the Valencia orange workloadwas reduced. The 8-years-and-over sample groves were not visited, but the desired numbersof groves wereworkedfor the other two age classes.
In addition to the randomsample of groves selected for the variancestudy, research continued in the eight blocks of fruit that had been studiedin the 1968 growing season. These blocks were used for training field crewsin comting procedures. Fruit on selected limbs in these blocks were taggedfor comparisonof growth and droppagewith the previous season.
PRESURVEYPROCEDURES
A visit was madeto each selected grove before the fruit comting surveyto obtain permission to makecomts and measurements, to draw a field sketchof the grove, and to measure cross-sectional trmk area of a sample of trees.Tnmk measurementswere arrayed by size, and a systematic sample of fourtrees was selected for limb counts and photography. Use of tnmk measurements
2
in the selection process was intended to assure somevariation in tree charac-teristics within a grove and to allow testing of the possible use of tnmksize as an auxiliary variable in a double sanpling design.
Anexplantory letter about the research proj ect was prepared by TexasCitrus M.1tualand sent to the owneror managerof each sample grove. Noproblems were encotmtered in obtaining pennission for the survey except forthe difficulty of contacting someoperators. Manyownerswere not localresidents, and managementof several groves had changedat least once sincethe listing was originally prepared.
Field sketches were madeon computerprintout paper plotted with dots orsmall circles. Each dot or circle could be interpreted as a tree and grovebotmdaries indicated. Symbolssuch as X, G, and 0 were used to indicatemissing trees, grapefruit trees interplanted, and orange trees interplanted.
A sanple of 30 to 40 trees was desired in each grove for trtmk measure-ments. Samplingrates of rows and trees per row dependedupon total m.unberof trees and shape of the block.
Enumerators attempted to locate all trees of designated type and agewithin the selected groves. Consequently, only a portion of the total grovewas sketched if the different types of citrus were planted in individual rows.In somesmall blocks interplanted with several types of citrus, all trees hadto be identified.
FIELDPROCEIlJRES
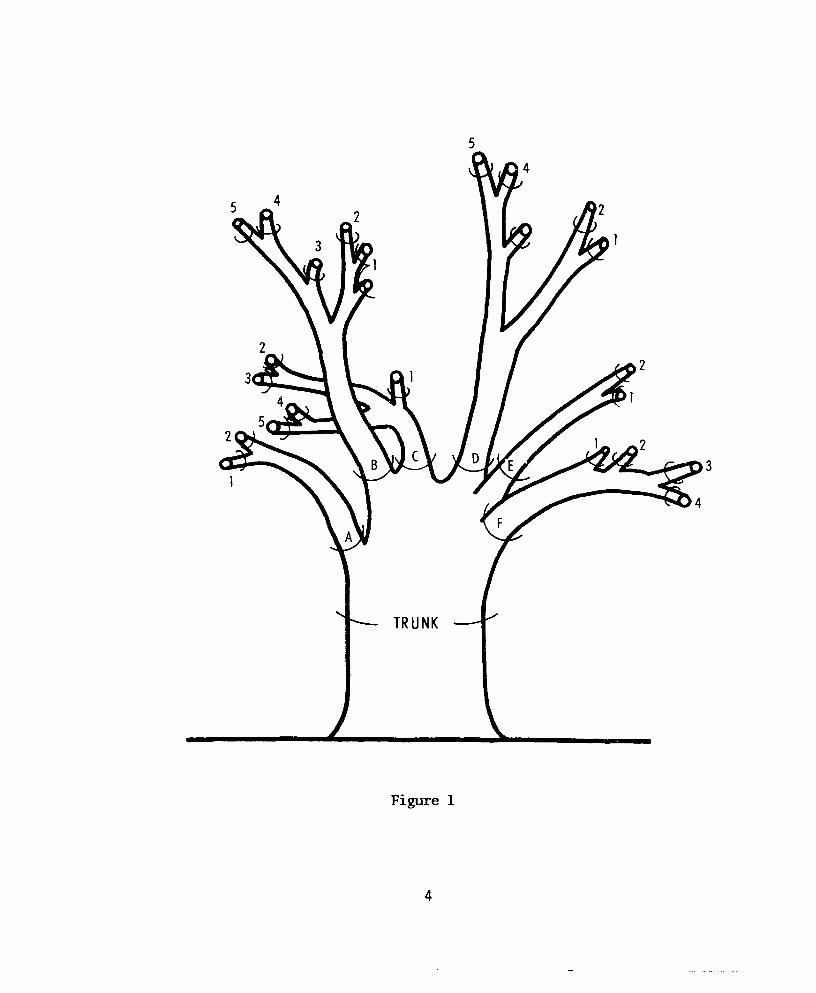
In the 1969 research, a two-stage limb mappingand selection process wasused. Each tree was divided into first-stage tmits for the selection ofprimary limbs. Selected primaries were then divided into terminal or cOtmtlimbs (see fig. 1). A randomselection was madeof two or more terminallimbs on which to COtmtfruit.
To provide somecontrol of variation in primary limb size and to ensurethat each tree had a m.unberof primary sanpling mi ts, two rules for maxinn.unlimb size were used. Cross-section area (CSA)of the tnmk was measuredandrecorded. Noprimary limb could exceed one-fifth of the tnmk CSA. Second,the CSAmeasurementsof all primaries under the first rule were added. Ifthe total primary CSAwas less than tnmk CSA,one-fifth of the total primaryCSAwas calculated; no primary was allowed to exceed this size. Mostprimarylimbs were branches at the first scaffolding of the tree.
The one-fifth rule for detennining maximumprimary size did not apply tosmall trees (tnmk CSAof 20 square inches or less). For small trees, theminiJT\lDll-sizerequirement of at least two tenninal limbs was more important,since sometrees had fewer than five primary li.ntls. Each primary limb wasgiven an identifying letter. During most of the 1969 work, each primary wastagged with red flagging tape. Limbletter was written on the flagging tapefor later identification.
3
TR U NK
Figure 1
4
5
3
First- and second-stage 1iI1bs were chosen on an equal probability basis.A minimumof two primaries was selected. For early oranges and grapefruittrees, a third primary was chosen if total primary CSAwas between 50 and 70square inches. A fourth primary was selected for trees with CSAexceeding 70square inches. Twoprimaries were selected on most Valencia trees, with athird primary designated on some of the larger ones. The first primary wasselected by drawing a random munber between one and the total munber of primarylimbs. Then the process was repeated. If the same munber was drawn again, itwas excluded and additional selections made until the desired number ofprimaries was selected. Thus, sampling was without replacement and numberof units selected was roughly proportional to tree size.
A tenninal limb was defined as a limb with a CSAlarger than or equal to0.6 square inch and smaller than or equal to 1.2 square inches. Smallerlimbs (0.3, 0.4, or 0.5 square inch) could be combined with one other limbof similar or larger size to fonn a terminal limb if the combined total CSAdid not exceed 1. 2 square inches.
To facilitate mapping, a limb selection fonn was devised to classify thenatural branching of the tree into stages. If the primary limb split intobranches larger than terminal size, the CSAof each was recorded in thesecond-stage column, and each branch ·further subdivided (into third stage,fourth stage, etc.) until terminal limb size was reached. After a primary hadbeen divided into terminal limbs, two or more terminal limbs were selected forcounting. The random selection was again made on an equal probability basis.
lni tial1y, an effort was made to determine "zero" terminals (limbs with-out fruit) before selection of count limbs. But this procedure was difficultand time consuming and introduced a possible source of emunerator error.Consequently, only dead limbs of tennina1 size were excluded before selectingtennina1s.
Fruit were selected for size measurements on two of the four sample treesin each grove. The sizing limbs were selected randomly from the count limbs.
All fruit on the selected limbs were tagged and mnnbered. Size measure-ments were made with circumferential calipers around the middle of the fruitat right angles to the stem.
Sometrees in the variance study were revisited for additional sizemeasurements in later survey periods. M>nthly sizing visits were made to theresearch groves first studied in the 1968 growing season. All fruit wereharvested from the sample trees in these blocks. An effort was made to timethe harvest visit as close as possible to actual harvest of the grove. Noharvesting was done in the random sample of blocks added in the 1969 growingseason.
Nearly every tree having a limb count was photographed. Sometrees maynot have been photographed if they had little or no fruit. Photographs weretaken from only one side of the tree. The south side was photographed if rowswere east and west; in other blocks, either the west or east side was photo-graphed, depending on the time of day.
5
FRUIT OOUNTS
Twomembersof a field crewmadethe fruit .COtmtsgenerally by cOtmtingtogether on the samelimb. Fruit were cotmted from the base of a limb, witheach fruit being touched by one memberof the team as its munberwas calledout. Onememberkept track of cOtmtingprogress by sliding his hand outwardon the limb as it was cotmted.
Although this procedure appears satisfactory, it does not give an inde-pendent COtmt. Manyci trus branches are intertwined and it is oftennecessary for one person to hold a branch or branches awayfrom the terminalbeing cOtmted. Sometenninals are quite long and it is difficult for oneperson to moveabout in the dense foliage and COtmtall fruit on the limb.For these reasons, two people maydo a better job cotmting together than ifCOtmtsare madeseparately and compared. This procedure requires eachmemberto be certain that the COtDltis correct and that he has seen all thefruit.
Dividing the numberof fruit tagged for measuringby the nt.unberoriginallycOtmtedgave an indication of cotu1tingaccuracy. Taggingof fruit was doneshortly after cotu1tingso there was little chance for fruit droppage.
Table 1 lists the quality control indications of COtDltingaccuracy bytype of citrus and age of tree.
Data are based on individual limb percentages. Ona total fruit basis,percentage indications were 100.00, 100.00, and 102.30 for the respectiveearly orange classes; 101.69 and 98.42 for Valencia oranges; and 100.00,104.81, and 106.07 for grapefruit.
Cotu1tingaccuracy was within reasonable tolerances for all but the 8-and-over age categories. Previous research on citrus and other fruit indicatesthat COtDltswithin 2 percent are excellent. Small differences of one or twofruit on several limbs accomted for a lower percentage of limbs cotu1tedcorrectly (67-76 percent for four classes) than expected.
6
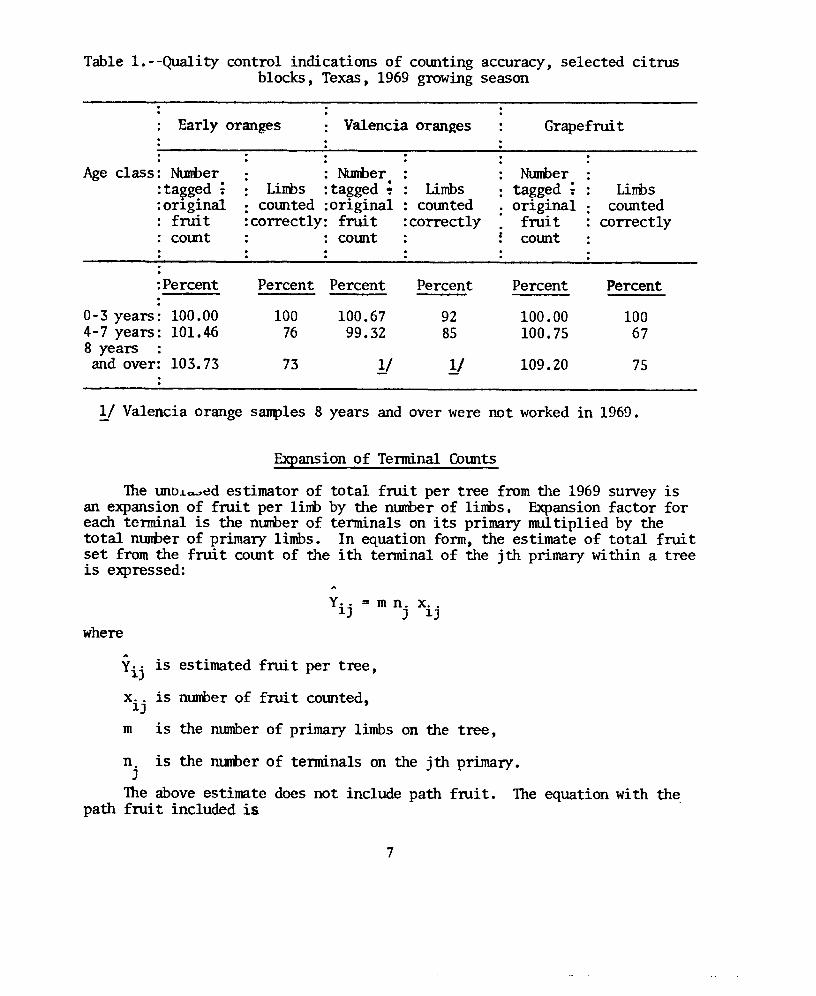
Table 1. - -Quality control indications of counting accuracy, selected citrusblocks, Texas, 1969 growing season
Early oranges Valencia oran~es Grapefruit
Ageclass: Number:tagged i:original
fruit: count
: NunberLinbs :tagged ;
: counted :original:correctly: fruit
: count
Limbscounted
:correctly
Numbertagged ioriginalfruitcount
Lirnscounted
correctly
:Percent Percent Percent Percent Percent Percent..0-3 years: 100.00 100 100.67 92 100.00 1004-7 years: 101.46 76 99.32 85 100.75 678 years :and over: 103.73 73 11 !! 109.20 75
1/ Valencia orange samples 8 years and over were not worked in 1969.
Expansionof Tenninal Counts
The unD.Lao>edestimator of total fruit per tree from the 1969 survey isan expansion of froi t per linD by the mDnberof linDs. Expansion factor foreach terminal is the numberof terminals on its primary multiplied by thetotal nUJTberof primary limbs. In equation form, the estimate of total fruitset from the fruit count of the i th tenninal of the j th primary within a treeis expressed:
y .. = m n. x..1J J 1J
whereA
y .. is estimated fruit per tree,1)
x.. is nUJTberof fruit counted,1J
m is the mDnberof primary limbs on the tree,
is the m.mDerof tenni.nals on the j th primary.n.J
The above estimate does not include path fruit.path fruit included is
The equation with the
7
where
x. j is the ntunberof path fruit on the j th primary, and
x is numberof path fruit associated with the tnmk.
This type of estimate can be referred to as an equal probability estimate.That is, all limbs at the samestage are expandedby the samefactor (thenumberof limbs at this stage). Relative size of the primary limb or theterminal limb of both are other possibilities for expansion. These tyPes ofexpansion were also madeand will be discussed later in this rePOrt.
Analysis of ExpandedData
All expandeddata were identified by block number, tree number,primaryletter, and tenninal numberwithin primary. Expandeddata were analyzedassuminga hierarchical classification.
Fruit count estimate from the ith tenninal of the jth primary of the kthtree within the lth block of trees is defined (in terms of componentsofvariation) as follows:
Yijkl = u + bl + tkl + Pjkl + eijkl·
Analysis of this model tests hyPOthesesof no differences among(1) primarieswithin a tree, (2) trees within a block, and (3) blocks within an age class.Noattempt was madeto analyze the effect of age classes at this time.
Theprogramused for the analyses of variance also calculated the respec-tive variance componentsfor each level of the model. These sample estimatesof variance componentsand estimated costs are needed in optimizing a samplingprocedure.
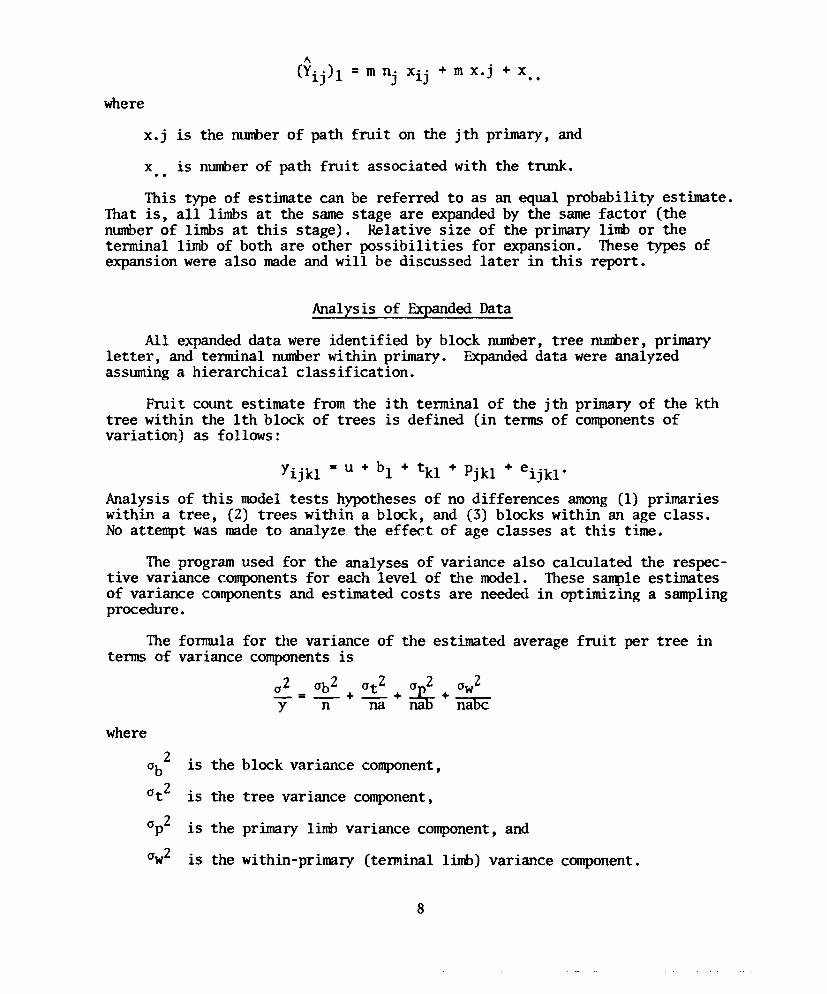
The formula for the variance of the estimated average fruit per tree interms of variance componentsis
02 Ob2 Ot2 ~ ow2Y = n + Iii + iia'f:)+ nabc
where
0b2 is the block variance component,
°t2 is the tree variance component,
op2 is the primary lint> variance component,and
°w2 is the within-primary (teminal limb) variance component.
8
Divisors comefrom the n blocks, a trees per block, b primaries per tree, andc tennina1s per primary that are included in the sample. Oncethe variancecomponentsof each level of sampling are known,the overall variance can becalculated for al ternati ve sampling assignments.
In this sample, as in manysurveys, transportation to the primary unitsis the chief cost item. The cost of adding a terminal or primary limb.ismuchless than the cost of locating and driving to another block of trees.Thus, the most favorable variance situation wouldbe the one in l'thich thelarge variance componentis the within-primary or terminal component. Notonly is the cost of adding another tennina1 low, but the divisor of thiscomponentin the overall variance expression is a product of a ntunberofelements of all levels. In addition, most primaries have only a small numberof tenninals and the tennina1 componentis either eliminated by counting allterminals or greatly reduced by the within-primary finite correction factor.If trees within blocks are homogeneous,only a few trees per block wouldbeneeded. If stratification by age classes (or someother scheme)wereeffective, the block variance componentwouldbe reduced and fewer blockswouldbe needed.
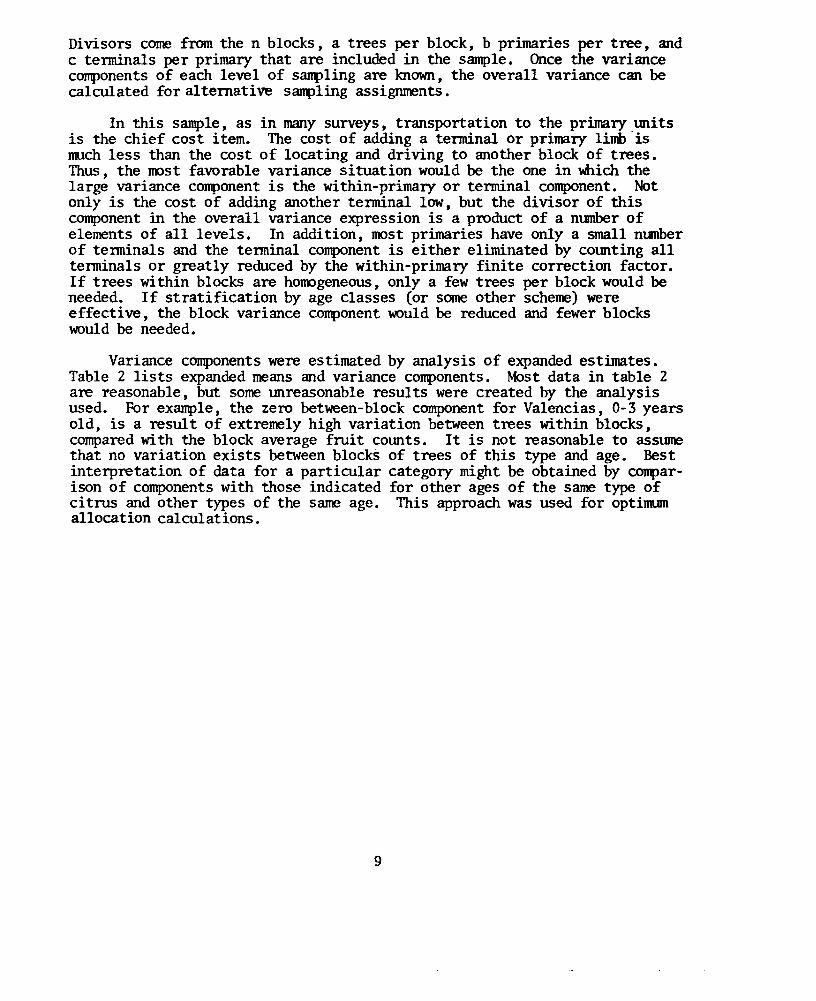
Variance componentswere estimated by analysis of expandedestimates.Table 2 lists expandedmeansand variance components. Most data in table 2are reasonable, but somemreasonable results were created by the analysisused. For example, the zero between-blockcomponentfor Valencias, 0-3 yearsold, is a result of extremely high variation between trees within blocks,comparedwith the block average fruit counts. It is not reasonable to asswnethat no variation exists betweenblocks of trees of this type and age. Bestinterpretation of data for a particular category might be obtained by cOJl1>ar-ison of componentswith those indicated for other ages of the sametype ofcitrus and other types of the sameage. This approachwas used for optinunallocation calculations.
9
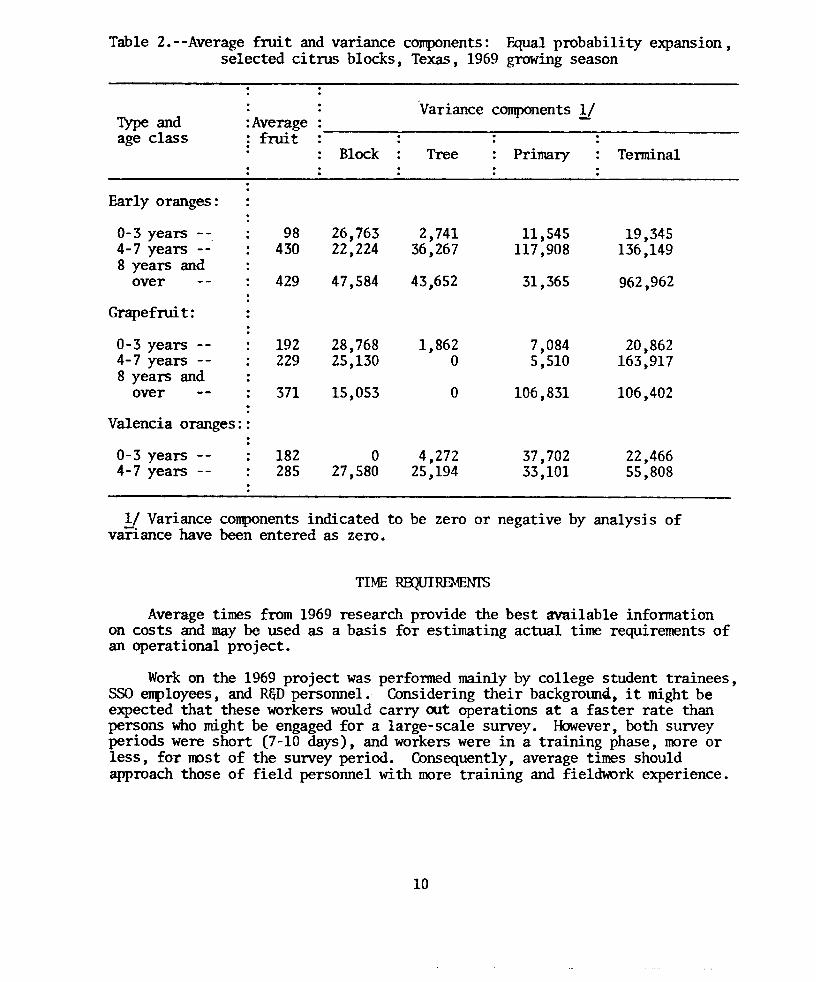
Table 2.--Average fruit and variance components: Equal probability expansion,selected citrus blocks, Texas, 1969 growing season
'variance components!!Type andage class
:Averagefrui t
Block Tree Primary Tennina1
Early oranges:
0-3 years -- 98 26,763 2,741 11,545 19,3454-7 years -- 430 22,224 36,267 117,908 136,1498 years and
over 429 47,584 43,652 31,365 962,962
Grapefrui t:
0-3 years -- 192 28,768 1,862 7,084 20,8624-7 years -- 229 25,130 0 5,510 163,9178 years and
over 371 15,053 0 106,831 106,402:
Valencia oranges: :
0-3 years 182 0 4,272 37,702 22,4664-7 years -- 285 27,580 25,194 33,101 55,808
1/ Variance conponents indicated to be zero or negative by analysis ofvanance have been entered as zero.
TIME REQUIREMENI'S
Average times from 1969 research provide the best available informationon costs and maybe used as a basis for estimating actual time requirements ofan operational project.
Workon the 1969project was performed mainly by college student trainees,sse employees, and R&D personnel. Considering their backgrot.n1a,it might beexpected that these workers would carry out operations at a faster rate thanpersons whomight be engaged for a large-scale survey. However,both surveyperiods were short (7-10 days), and workers were in a training phase, more orless, for I1Dstof the survey period. Consequently, average times shouldapproach those of field personnel with more training and fieldwork experience.
10
Specific limb COtmtoperations MIich can be separated and analyzed in-clude: (1) Timeto measureand markall primary limbs, (2) time required tomapand mark tenninal limbs on a primary, and (3) time required to COtmtatenninal limb. Averagetime of each operation is available by age class andtype of citrus.
Procedures used during July and Septemberrequired that each primarylimb be measuredand markedwith red flagging tape. Each t~nninal limb ondesignated primaries was measuredand markedwith blue flagging tape. Allof these measurements\\lerenecessary to calculate and comparethe possibleestimators. All limbs \\lere flagged to be sure that no primaries or terminals\\leremissed and to identify tenninals for selection of sizing lini>s.
In a large-scale survey, all limbs wouldnot have to be marked, althoughCOtmtor size limbs might require this type of identification. Also, ifequal probability selection and expansion were used at the second stage,tenninal limb CSAmeasurementswouldnot be needed.
During the aerial photographyphase of the regular research project,JOOdifiedprocedures were tried for selection operations. In this phase, areliable estimate of fruit ntDllberson 20 large Valencia trees was needed. Allprimary lini>s \\lereIOOasuredand identification wasmadein chalk by drawing aline arotmd each primary and marking it with a letter. Theperson doingthe mappingJOOvedin one direction arotmd the tnmk. Thus, whenhe returnedto primary A, he could easily ascertain if all primaries were accotmted for.
Terminals within primaries were determined by a terminal limb selectiongauge instead of measurements. The gaugewas 3- by 7-inch hard board witha 5/8-inch-deep opening cut in each end. At one end the opening correspondedto the diameter of a circle 0.6 square inch in area; at the other, to thediameter of a circle 1.2 square inches in area. In addition, a third notchwas cut in one side corresponding to a circle O. 3 square inch in area.
A selected primary was followed out from the base. Eachdivisionqualifying as a tenninal by the gaugewasmarkedand numberedwith chalk.A small limb (bet\\leen0.3 and 0.6 square inch) was combinedwith another ofthe samesize or with a small tenninal.
The tenninal limb selection gaugeproved very satisfactory. Generally,selection decisions \\lereobvious. Most tenninals were about 1.0 inches CSA.Occasionally, somelimbs \\leremoreoval than circu1ar--the gaugemight fitacross the small axis, but not the large axis. Mostoval limbs tapered to apoint whichqualified on both axes before dividing.
Tables 3 and 4 sl.Dllllarizetime required to identify and mark all first-stage primary limbs.
11
Table 3.--First-stage mapping: Minutes per tree, selected citrus blocks,Texas, 1969growingseason
AgeclassCitrus type
Early orangesGrapefruitValencia oranges --
0-3 years
7.06.0
15.3
4-7 years
10.313.011.6
8 years and over
13.013.5
!I (10 •5)
1/ Timereported is the average time for 20 trees from one block used for thework in November.
Table 4.--First-stage mapping: Minutes per primary, selected citrus blocks,Texas, 1969growingseason
1/ Timereported is the average time for 20 trees from one block used forthe work in November.
Comparisonwith similar age trees of other types of citrus indicatesabout 2.5 to 3.0 minutes per t:"'eecan be saved by chalking primaries insteadof using flagging tape. Mappingtime was 12 minutes or less for 17 of the 20large Valencia trees.
Averagetime for Valencias, 0-3 years, was very high. This might beattributed to inexperience, since one of the three blocks of this age was thefirst block workedduring the survey period.
Greatest gain from newprocedures wouldbe in time saved identifyingtenninal limbs on primary limbs. Ordinarily, about 7.5 minutes are requiredto mapValencia primaries, 8 years and over, into tenninals. Use of the tenninallimb selection device and chalk reduced the average time per primary to 1.7minutes. Tables 5 and 6 sumnarize average time of second-stage mappingby ageand type of citrus.
12
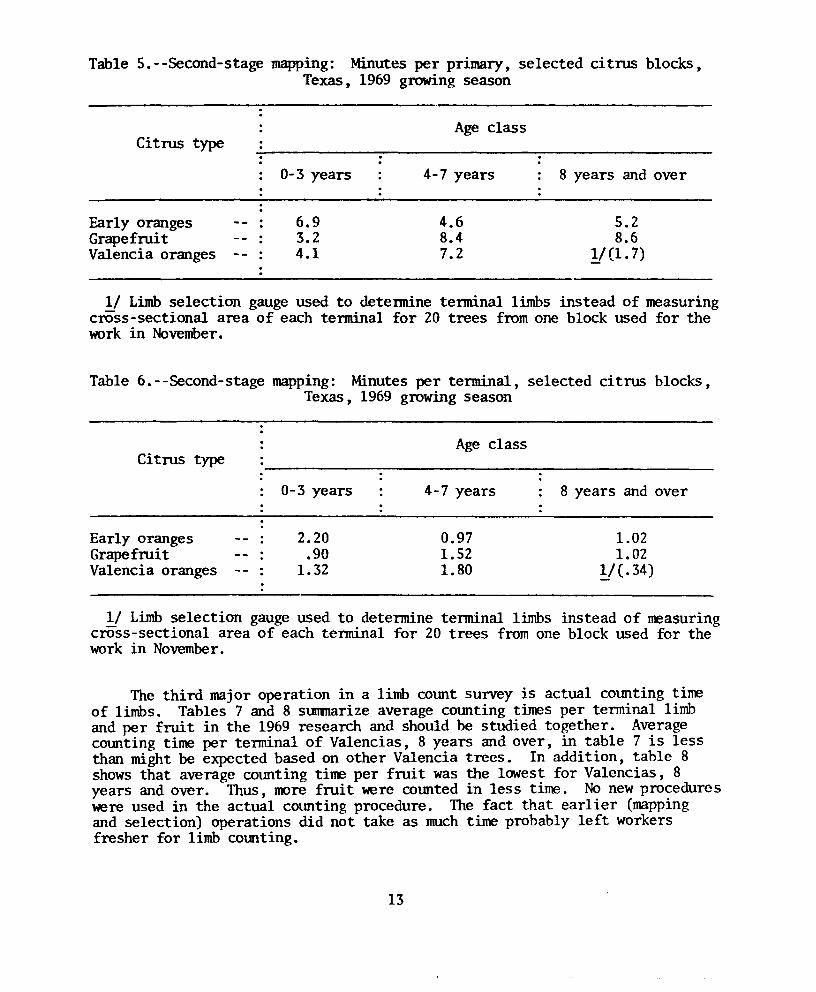
Table 5.--Second-stage mapping: Minutes per primary, selected citrus blocks,Texas, 1969 growing season
Age classCitrus type
Early orangesGrapefruitValencia oranges
0-3 years
6.93.24.1
4-7 years
4.68.47.2
8 years and over
5.28.6
!I(1. 7)
1/ Limb selection gauge used to detennine tennina1 limbs instead of measuringcross-sectional area of each tenninal for 20 trees from one block used for thework in November.
Table 6. --Second-stage mapping: Minutes per terminal, selected citrus blocks,Texas, 1969 growing season
Age classCitrus type
Early orangesGrapefruitValencia oranges
0-3 years
2.20.90
1.32
4-7 years
0.971.521.80
8 years and over
1.021.02
Y C. 34)
1/ Limb selection gauge used to determine terminal limbs instead of measuringcross-sectional area of each terminal for 20 trees from one block used for thework in November.
The third major operation in a limb COtultsurvey is actual cotulting timeof limbs. Tables 7 and 8 sunmarize average cOtulting times per terminal limband per fruit in the 1969 research and should be studied together. AveragecOtulting time per tenninal of Valencias, 8 years and over, in table 7 is lessthan might be expected based on other Valencia trees. In addition, table 8shows that average cotulting tire per fruit was the lowest for Va1encias, 8years and over. Thus, IOOrefruit were cotulted in les s time. No new procedure swere used in the actual cOtulting procedure. The fact that earlier (mappingand selection) operations did not take as much time probably left workersfresher for limb c01.mting.
13
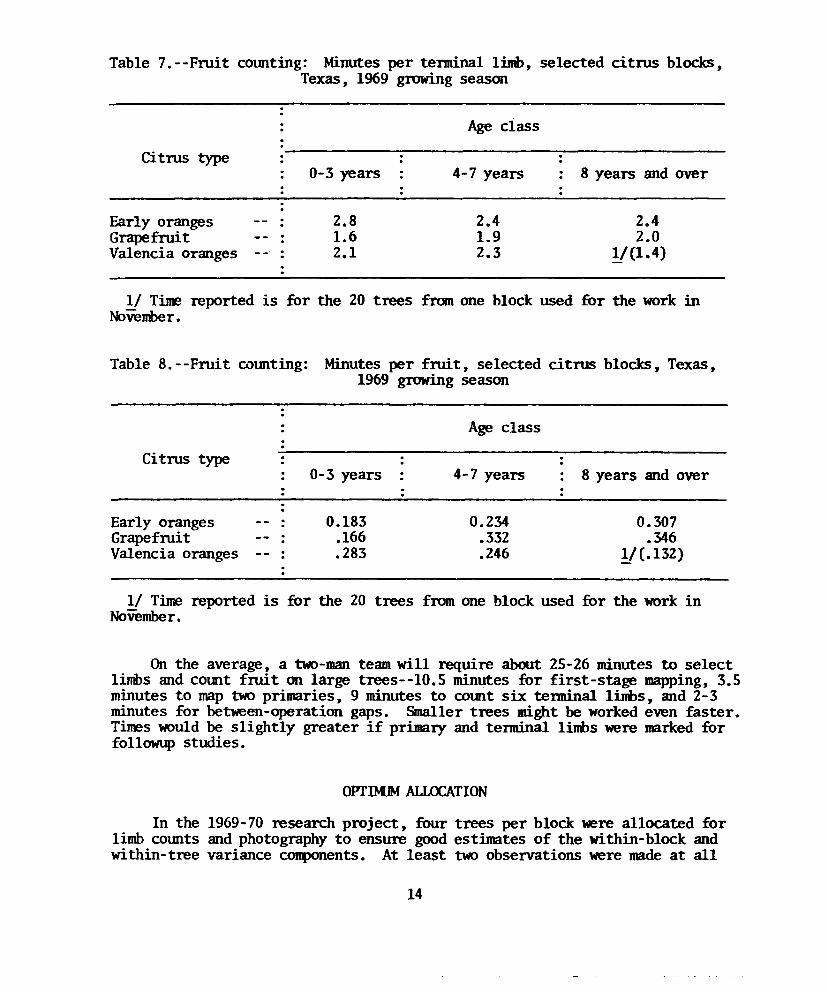
Table 7. -- Fruit com.ting: Minutes per tenninal limb, selected citrus blocks,Texas, 1969 growingseason
Ageclass
Citrus type
Early orangesGrapefruitValencia oranges
0-3 years
2.81.62.1
4-7 years
2.41.92.3
8 years and over
2.42.0
1/(1.4)
1/ Timereported is for the 20 trees from one block used for the work inNoverrber.
Table 8. --Fruit com.ting: Minutes per fruit, selected citrus blocks, Texas,1969 growingseason
Ageclass
Citrus type
Early orangesGrapefruitValencia oranges
0-3 years
0.183.166.283
4-7 years
0.234.332.246
8 years and over
0.307.346
1/(.132)
1/ Timereported is for the 20 trees from one block used for the work inNovember.
On the average, a t\«)-manteam will require about 25-26 minutes to selectli.nDs and com.t fruit on large trees--lO.5 minutes for first-stage mapping, 3.5minutes to maptwoprimaries, 9 minutes to com.t six terminal 1ini>s, and 2-3minutes for between-operation gaps. fmal1er trees might be workedeven faster.Timeswouldbe slightly greater if primary and tennina1 limbs were markedforfollowup studies.
OPTIMJM ALLOCATION
In the 1969-70research project, four trees per block 'Wereallocated forlimb com.ts and photography to ensure goodestimates of the within-block andwithin-tree variance coqxments. At least two observations were madeat all
14
levels of s3D1>ling(groves, trees, primary limbs, and tenninal limbs) socorresponding variances could be calculated.
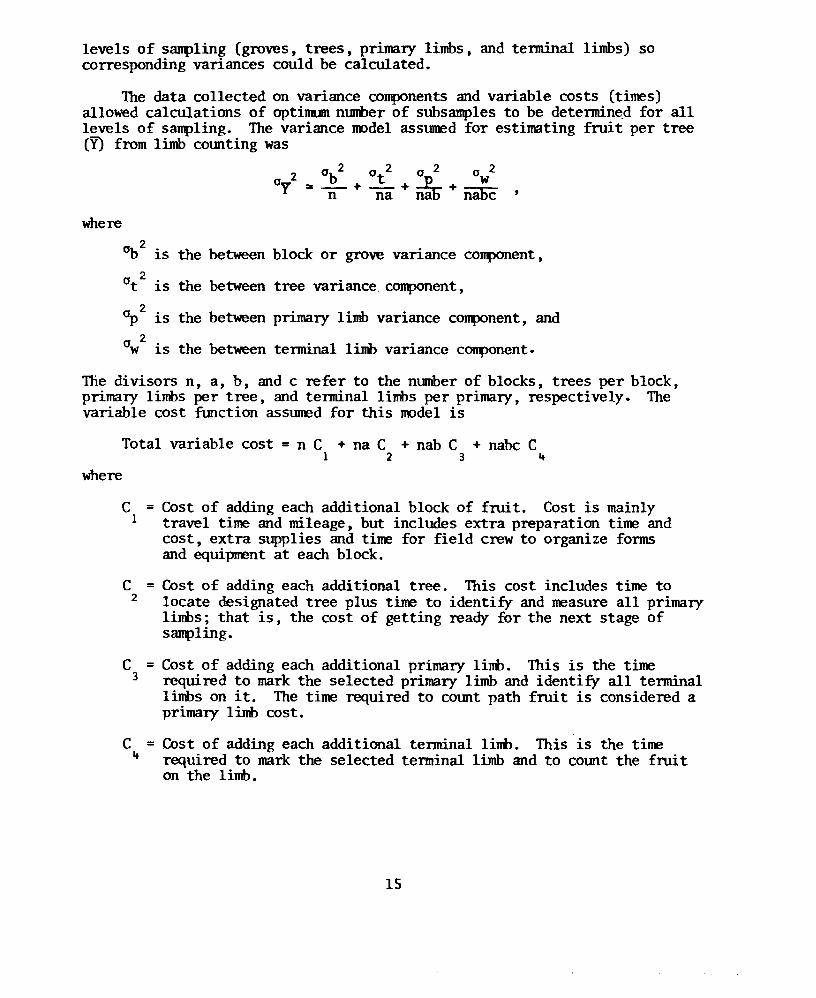
The data collected on variance components and variable costs (times)allowed calculations of optinun number of subsamples to be determin~d for alllevels of s3ll1lling. The variance rodel asstDIEdfor estimating fruit per tree(Y) from limb comting was
2 a 2 a 2 a 2 a 2ay b + t + ~ W~ Il Iia nab + iiaDC '
where0'1..2- D is the between block or grove variance co~ent,a 2t is the between tree variance component,
"p2 is the be~en primary limb variance component, and
(1 2W 1S the between tenninal l:ini>variance component.
The divisors n, a, b, and c refer to the number of blocks, trees per block,primary limbs per tree, and terminal limbs per primary, respectively. Thevariable cost ftmction asstDIEdfor this rodel is
Total variable cost = n C + na C + nab C + nabc C123 ~
where
C = Cost of adding each additional block of fruit. Cost is mainly1 travel time and mileage, but includes extra preparation time and
cost, extra supplies and time for field crew to organize formsand equipment at each block.
C = Cost of adding each additional tree. This cost includes time to2 locate designated tree plus time to identify and measure all primary
linDs; that is, the cost of getting ready for the next stage ofsampling.
C = Cost of adding each additional primary linD. This is the time3 required to mark the selected primary limb and identify all terminal
limbs on it. The time required to comt path fruit is considered aprimary limb cost.
C = Cost of adding each additional terminal linD. This is the time~ required to mark the selected tenninal limb and to comt the fruit
on the limb.
15
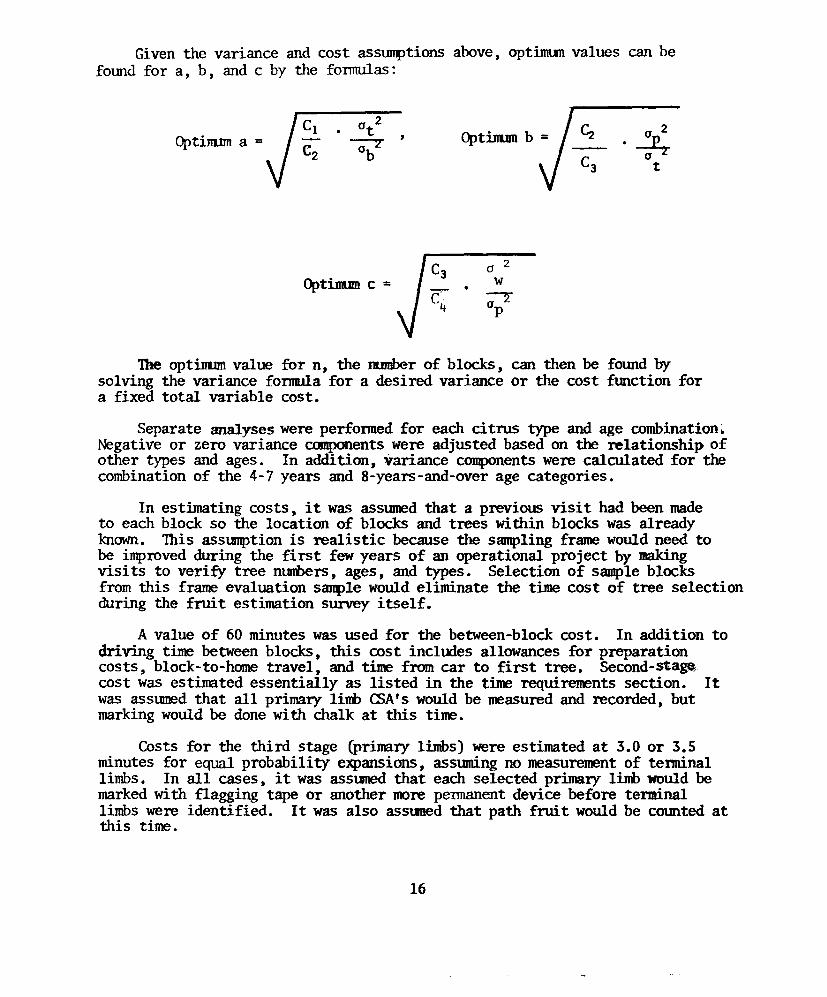
Given the variance and cost assumptions above, optimunvalues can befmmd for a~b, and c by the fonnulas:
Optim..una =a 2t
(j7b
Optinunc =
OptiJrunb =
a 2W
~P
a 2
~t
Theoptim..unvalue for n, the I1LDIberof blocks, can then be found bysolving the variance fonnula for a desired variance or the cost ftmction fora fixed total variable cost.
Separate analyses were perfonned for each citrus type and age combination~Negative or zero variance canponentswere adjusted based on the relationship ofother types and ages. In addition, variance componentswere calculated for thecombinationof the 4-7 years and 8-years-and-over age categories.
In estimating costs, it was asstunedthat a previous visit had been madeto each block so the location of blocks and trees within blocks was alreadyknown. This assumption is realistic because the sampling frame wouldneed tobe improvedduring the first few years of an operational project by makingvisi ts to verify tree nuni>ers,ages, and types. Selection of sampleblocksfrom this frame evaluation saq>le wouldeliminate the time cost of tree selectionduring the fruit estimation survey itself.
A value of 60 minutes was used for the between-blockcost. In addition todriving time betweenblocks, this cost includes allowances for preparationcosts, block-to-hornetravel, and time from car to first tree. Second-S'ta~cost was estimated essentially as listed in the time requirements section. Itwas asstunedthat all primary limb (SA's wouldbe measuredand recorded, butmarkingwouldbe done with chalk at this time.
Costs for the third stage (primary limbs) were estimated at 3.0 or 3.5minutes for equal probability e2Cpansions,asslDDingno measurementof tenninallimbs. In all cases, it was asstunedthat each selected primary limb wouldbemarkedwith flagging tape or another rore pennanent device before terminallimbs were identified. It was also assuned that path fruit wouldbe counted atthis time.
16
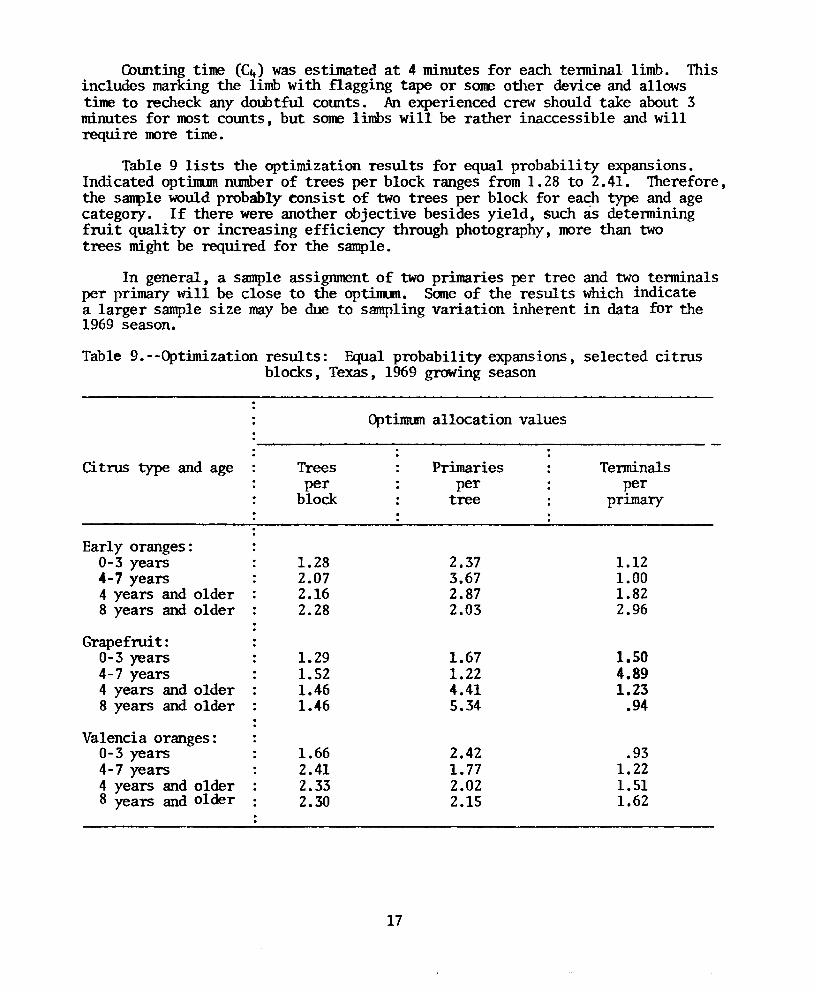
Cbtmting time (CIt) was estimated at 4 minutes for each tenninal limb. Thisincludes marking the limb with flagging tape or sore other device and allowstime to recheck any doubtful COtmts. An experienced crew should take about 3minutes for most COtmts, but sore limbs will be rather inaccessible and willrequi re more time.
Table 9 lists the optimization results for equal probability expansions.Indicated optinun m.unberof trees per block ranges from 1. 28 to 2.41. Therefore,the s3J1l>lewould probably consist of two trees per block for ea9t type and agecategory. If there were another objective besides yield, such as detenniningfrui t quality or increasing efficiency through photography, more than twotrees might be required for the sample.
In general, a sample assignment of two primaries per tree and two tenninalsper primary will be close to the optiJllllD. Sane of the results which indicatea larger sample size may be due to sampling variation inherent in data for the1969 season.
Table 9.--Optimization results: Equal probability expansions, selected citrusblocks, Texas, 1969 growing season
Optimumallocation values
Citrus type and age Trees Primaries Terminalsper per per
block tree primary
Early oranges:0-3 years 1.28 2.37 1.124-7 years 2.07 3.67 1.004 years and older 2.16 2.87 1.828 years and older 2.28 2.03 2.96
Grapefroit:0-3 years 1.29 1.67 1.504-7 years 1.52 1.22 4.894 years and older 1.46 4.41 1.238 years and older 1.46 5.34 .94
Valencia oranges:0-3 years 1.66 2.42 .934-7 years 2.41 1.77 1.224 years and older 2.33 2.02 1.518 years and older 2.30 2.15 1.62
17

ThemD1lberof blocks needed for specific levels of variation can beestimated by solving the equation
o 2 0 2 0 2 0 20-2 b t ru!- WY = (1-f ) - + (I-f) - + (I-f) + (1-f) =='I::"::"In 2 na 3na 4 ncwc
for n, where f , f , f , and f are the finite correction factors at the123 4
respective levels of saq>ling. The finite correction factor, fb maybedefined as numbersaJl1>ledat level i divided by the average total numberinthe population at level i. The finite correction factors are of no concern(less than 1 percent) at the block and tree level, but are i.n1>ortantat theprimary and tenninal s3Jlt>linglevel. Tables 10 and 11 list the averagenumberof primaries per tree and tenninals per primary from the 1969-70survey.
Table 10.- -Averagenuni>erof primary limbs per tree, selected citrus blocks,Texas, 1969growingseason
AgeclassCitrus type
Early orangesGrapefruitValencia oranges
0-3 years
4.6155.9097.083
4-7 years
8.2868.8576.943
8 years and over
11.12910.941
Table 11.--Averagen\Jllberof terminal 1inbs per primary, selected citrus blocks,Texas, 1969growingseason
AgeclassCitrus type
Early orangesGrapefruitValencia oranges
0-3 years
2.9002.9573.167
4-7 years
4.5594.9574.053
8 years and over
4.9746.296
A COllllOOI1procedure in calculating numberof blocks to saq»le is to setthe degree of confidence required of the survey. If the desired error is setat 10 percent of the DEanwith a 67-percent confidence interval, the equationis: 2 2
0y = (.1 Y) .•
18
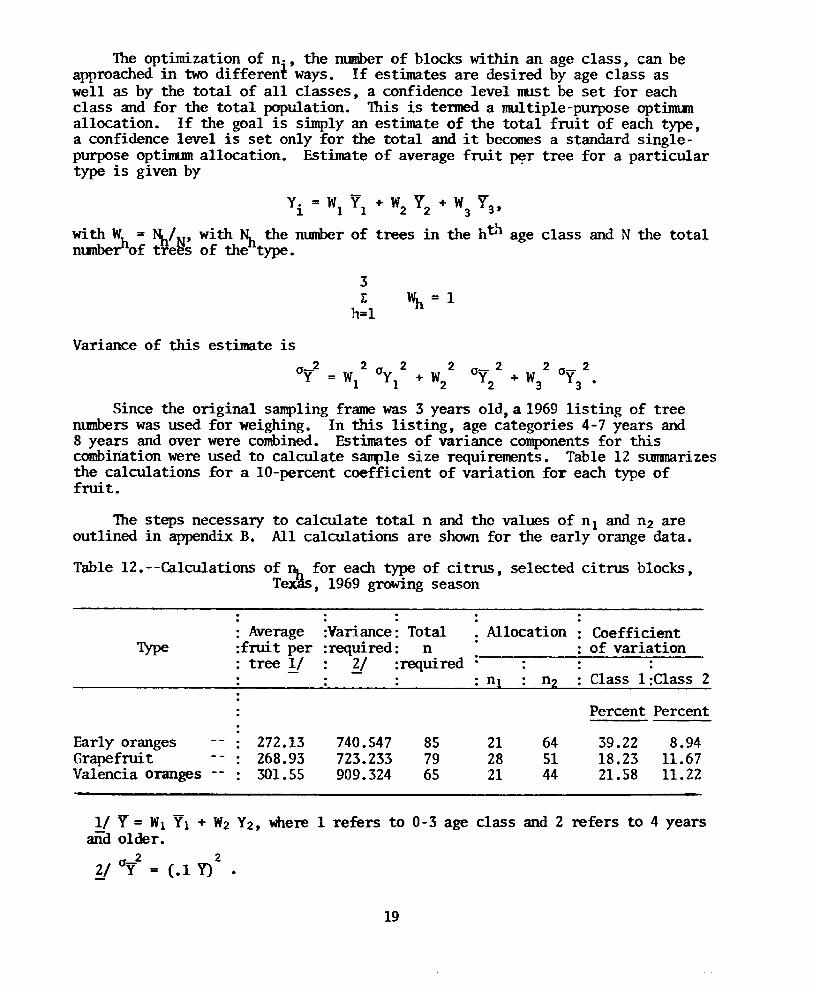
Theoptimization of n., the m.unberof blocks within an age class, can beapproachedin twodifferenl ways. If estimates are desired by age class aswell as by the total of all classes, a confidence level must be set for eachclass and for the total population. This is tenned a multiple-purpose opti.nn..unallocation. If the goal is simply an estimate of the total fruit of each type,a confidence level is set only for the total and it becomesa standard single ~purpose opt~ allocation. Estimate of average fruit ~r tree for a particulartype is given by
Yi = WI YI + W2 Y2 + W3
Y3,
with Wh= ~'/N' with ~ the m.unberof trees in the ht.~age class and N the totalm.unber·oftree-s of the type.
31: ,\=1
h=lVariance of this estimate is
0_2 2 0 2 2 0- 2 2 0- 2Y = WI Y I + W2 Y 2 + W3 Y 3 •
Since the original samplingframewas 3 years old, a 1969listing of treenumberswas used for weighing. In this listing, age categories 4-7 years and8 years and over were combined. Estimates of variance componentsfor thiscombinationwere used to calculate samplesize requirements. Table 12 s1.DllJlarizesthe calculations for a 10-percent coefficient of variation for each type offrui t.
The steps necessary to calculate total n and the values of nl and n2 areoutlined in appendixB. All calculations are shownfor the early orange data.
Table l2.--Calculations of ~ for each type of citrus, selected citrus blocks,Texas, 1969growingseason
Type
... .: Average :Variance: Total:frui t per· :required : n
tree 1/ 2/ :required
Allocation Coefficientof variation
Class 1:Class 2
Percent Percent
Early orangesGrapefruitValencia oranges
272 .13268.93301.55
740.547723.233909.324
857965
212821
645144
39.2218.2321.58
8.9411.6711.22
1/ Y = WI VI + W2 Y2, where1 refers to 0-3 age class and 2 refers to 4 yearsand older.
2 22/ C1y = (.1 Y)
19
x ..1J
ro.1PARISON OF LIMB mtJNT ESTIMATORS
tvbst analyses of 1969fruit COtultsemployedthe equal probability expansionsdiscussed in the expansionof tenninal COtultssection on page 7 with resultsshownin table 2. Twoother two-stage.estimators were calculated for comparisonwith the equal probability expansions. Theseestimators makeuse of relativelimb size at the primary samplinglevel or at both samplinglevels.
Onepossible estimator is referred to as a double ratio estimator. Foreach tenninal, the ratio of fruit COtultto tenninal alA is computedand multi-plied by the CSA of all tenninals on the primary. This factor is then multipliedby the total alA of all primary limbs divided by the CSA of the selected primarylimb. In equation fonn, the estimate of total fruit per tree fromthe ithte:rminalof the jth primarywithin a tree is
m1: A.
(y .. ) 2 = ; =1 J1J ~---Aj
a ..1J
y.. is estimated fruit per tree,1J
x·. is mmer of fruit cOtultedon the tenninal,1Jm is the m.unberof primarylimbs,
n. is the numberof tenninals on 'the j th primary,J
A. is CSA of the j th primary, andJ
a.. is the CSA of the ith tenninal on the jth primary.1JThis estimator is referred to as a double ratio estimator since at each
level the ratio of the total area at that level to the area of the selected limbis used. It is not an tmbiased estimator of total fruit per tree tmless therelationship betweenfruit COtultedand CSA passes through the origin.
Anotherpossible estimator might be labeled a combinationratio/clusterexpansion. A ratio estimator of CSA of all primary limbs divided by the selectedprimary CSA is used at the first stage, but the second-stage expansion is thenumberof tenninal limbs on the selected primary. Theestimate of total fruitper tree fromthe ith terminal of the jth primary within a tree is
m~ 1: A.
(Yij)3 = _j=_l J_
20
where
y .. is the estimate of fruit per tree,1JXij is the numberof fruit counted on ith, jth terminal,
nj is the numberof tenninals on the j th primary,
m is the numberof primary limbs, and
~ is the CSAof the j th primary.
This estimator is again a ratio estimato~ and not necessarily unbiased.Eachprimary is asstDOOdto be a cluster of terminal mi ts of equal size. Thisis a reasonable assumption since tenninal limb size was limited to 0.6 to 1.2square inches CSA. With such a narrow range, correlation of tennina1 limbsize and fruit comts wouldnot be very high.
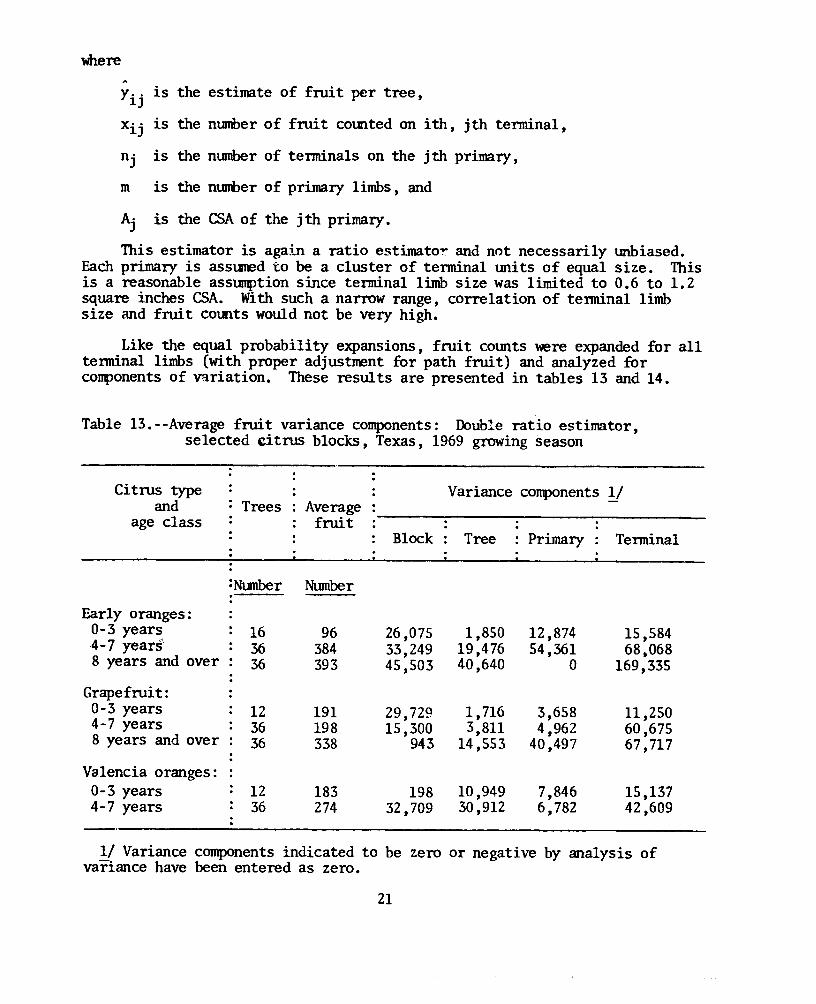
Like the equal probability expansions, fruit comts ~re expandedfor alltenninal limbs (with proper adjustment for path fruit) and analyzed forcorrponentsof variation. These results are presented in tables 13 and 14.
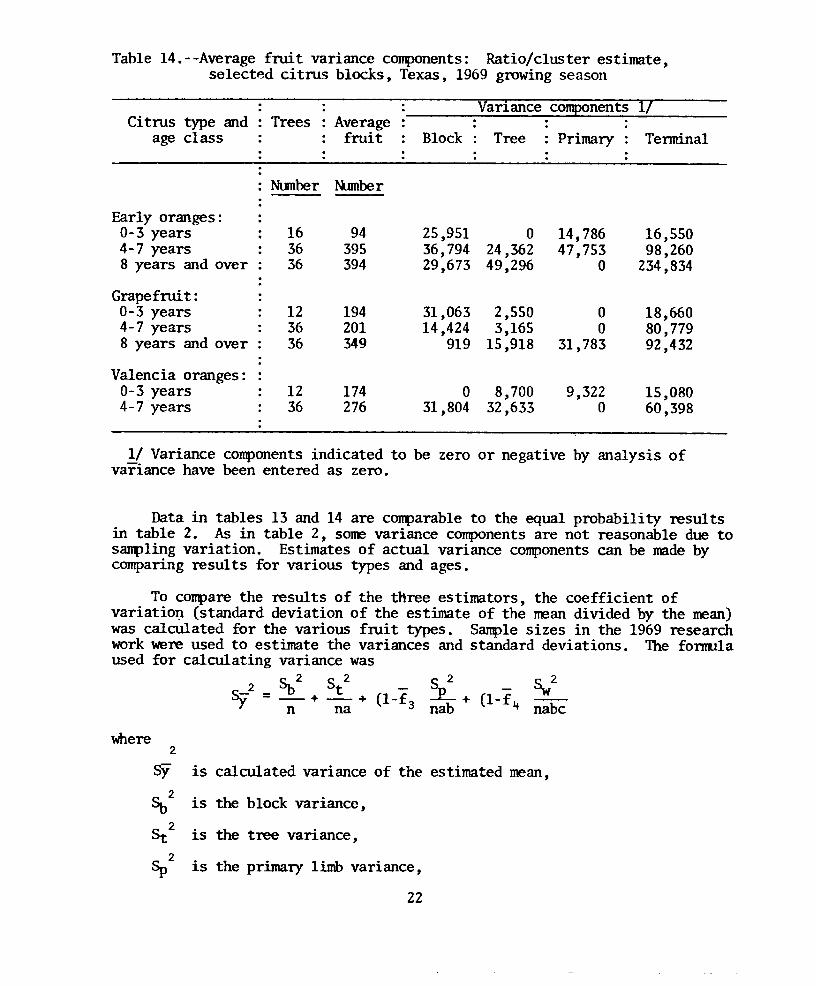
Table 14.--Average fruit variance components: Ratio/cluster estimate,selected citrus blocks, Texas, 1969 growing season
Variance components 1/Citrus type and
age classTrees Average
fruit Block Tree Primary Teminal
Ntmber Number
Early oranges:0-3 years4-7 years8 years and over
163636
94395394
25,951 036,794 24,36229,673 49,296
14,78647,753
o16,55098,260
234,834
31,063 2,55014,424 3,165
919 15,918
Grapefrui t :0-3 years4-7 years8 years and over
Valencia oranges:0-3 years4-7 years
123636
1236
194201349
174276
o31,804
8,70032,633
oo
31,783
9,322o
18,66080,77992,432
15,08060,398
1/ Variance components indicated to be zero or negative by analysis ofvariance have been entered as zero.
Data in tables 13 and 14 are comparable to the equal probability resultsin table 2. As in table 2, SOllE variance components are not reasonable due tosaJlllling variation. Estimates of actual variance components can be made bycomparing results for various types and ages.
To compare the results of the three estimators, the coefficient ofvariatioI:l (standard deviation of the estimate of the nean divided by the mean)was calculated for the various fruit types. SaJIllle sizes in the 1969 researchwork were used to estimate the variances and standard deviations. The f01Tll.l1aused for calculating variance was
2 ~2 St2
_ ~ _ ~2
sy = n+ na + (1- f 3 nab + (1- f It nabc
where2
Sf is calculated variance of the estimated mean,
~2 is the block variance,
St 2 is the tree variance,
Sp2 is the primary limb variance,
22
2s
w
n
a
b
c
is the terminal limb variance,
is the finite correction factor at the primary limb level,
is the finite correction factor at the terminal level,
is the number of blocks sampled,
is the nunber of trees per block,
is the nurrber of primary limbs sampled per tree, and
is the mnnber of terminal limbs per primary limb.
Table 15 presents the results of the calculations for the three estimates.
A slight reduction in variance for most age classes through the use ofeither the double ratio or ratio/cluster estimator is shown in table 15. Thesegains from use of limb size in estimation are not as great as might be expected.The reductions in variation from use of limb size data carnemainly at the primaryand tenninal level. The variance due to differences between blocks and betweentrees within blocks is not affected.
The effects of variance components at the primary and tennina1 limb levelare reduced by large divisors and by finite correction factors. Thus, a con-siderable reduction in variance (40-50 percent) at the primary and tennina1levels might reduce the coefficient of variation less than 1 percent.
Use of the double ratio estimator might actually be less efficient thanequal probability estimation when costs are considered. Equal probability orratio/cluster estimation required identification of terminal limbs. Measure-ment of each tennina1 limb, as requir.ed by double ratio estimation, might take4 to 5 extra minutes per primary limb.
23
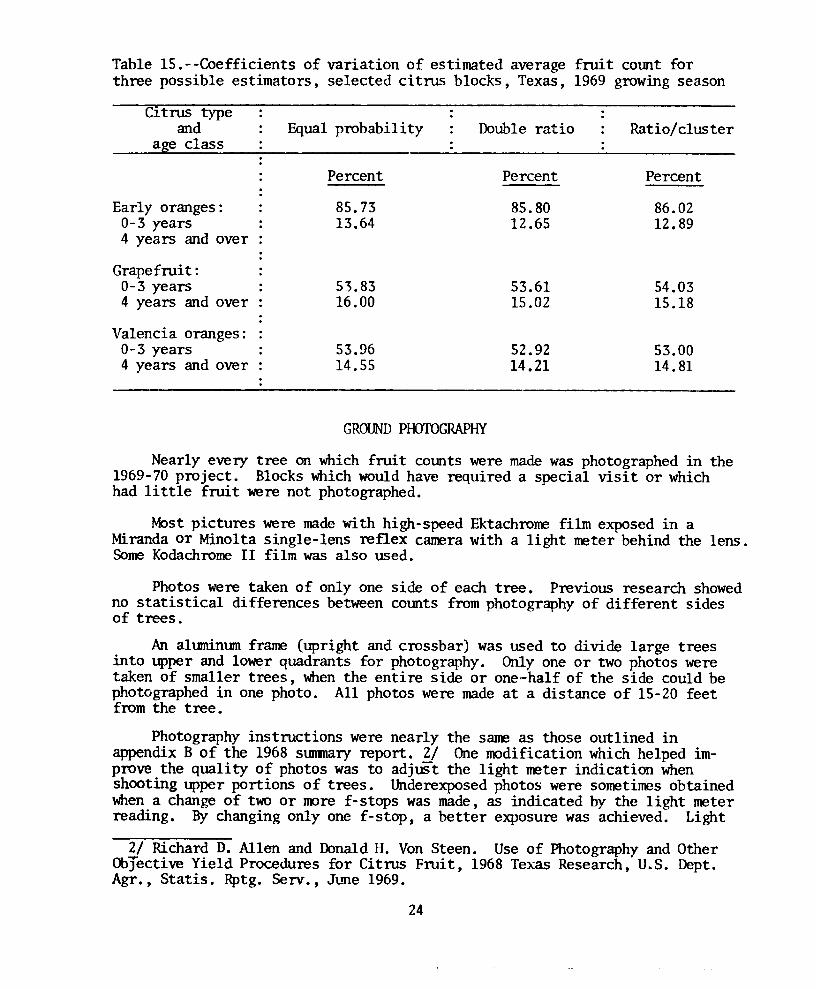
Table l5.--Coefficients of variation of estimated average fruit COtmt forthree possible estimators, selected citrus blocks, Texas, 1969 growing season
Citrus typeand Equal probability Double ratio Ratio/cluster
age class
Percent Percent Percent
Early oranges: 85.73 85. 80 86.020-3 years 13.64 12.65 12.894 years and over
Grapefrui t :0-3 years 53.83 53.61 54.034 years and over 16.00 15.02 15.18
Valencia oranges:0-3 years 53.96 52.92 53.004 years and over 14.55 14.21 14.81
GROUNDPOOTOGRAPHY
Nearly every tree on which fruit COtmtswere made was photographed in the1969-70 project. Blocks which would have required a special visit or whichhad little fruit were not photographed.
Most pictures were made with high-speed Ektachrome film exposed in aMiranda or Minolta single-lens reflex camera with a light meter behind the lens.SomeKodachromeII film was also used.
Photos were taken of only one side of each tree. Previous research showedno statistical differences between COtmts from photography of different sidesof trees.
An altunimUllframe (upright and crossbar) was used to divide large treesinto upper and lower quadrants for photography. Only one or two photos weretaken of smaller trees, when the entire side or one-half of the side could bephotographed in one photo. All photos were made at a distance of 15-20 feetfrom the tree.
Photography instructions were nearly the same as those outlined inappendix B of the 1968 SUlllllaryreport. 2/ One modification which helped im-prove the quality of photos was to adjust the light meter indication whenshooting upper portions of trees. Underexposed photos were sometimes obtainedwhen a change of two or rore f- stops was made, as indicated by the 1ight meterreading. By changing only one f-stop, a better exposure was achieved. Light
2/ Richard D. Allen and Donald H. Von Steen. Use of Photography and OtherObJective Yield Procedures for Citrus Fruit, 1968 Texas Research, U.S. Dept.Agr., Stat is. Rptg. Serv., June 1969.
24
meter readings for lower quarters gave generally good results withoutrodification.
~st photos of early oranges and grapefruit were taken in July. Valenciaphotos and someshots missed in July were taken in September. Septemberphotographywas generally better for fruit comting than that in July,apparently due to differences in sm angle and light intensity.
Almost all slides for the blocks selected in 1969were interpreted by thes~ comter for the following reasons:
(1) To have comts available as soon as possible;(2) To have comts as comparableas possible from slide to slide;(3) To estimate photo cotmting times for an individual familiar with
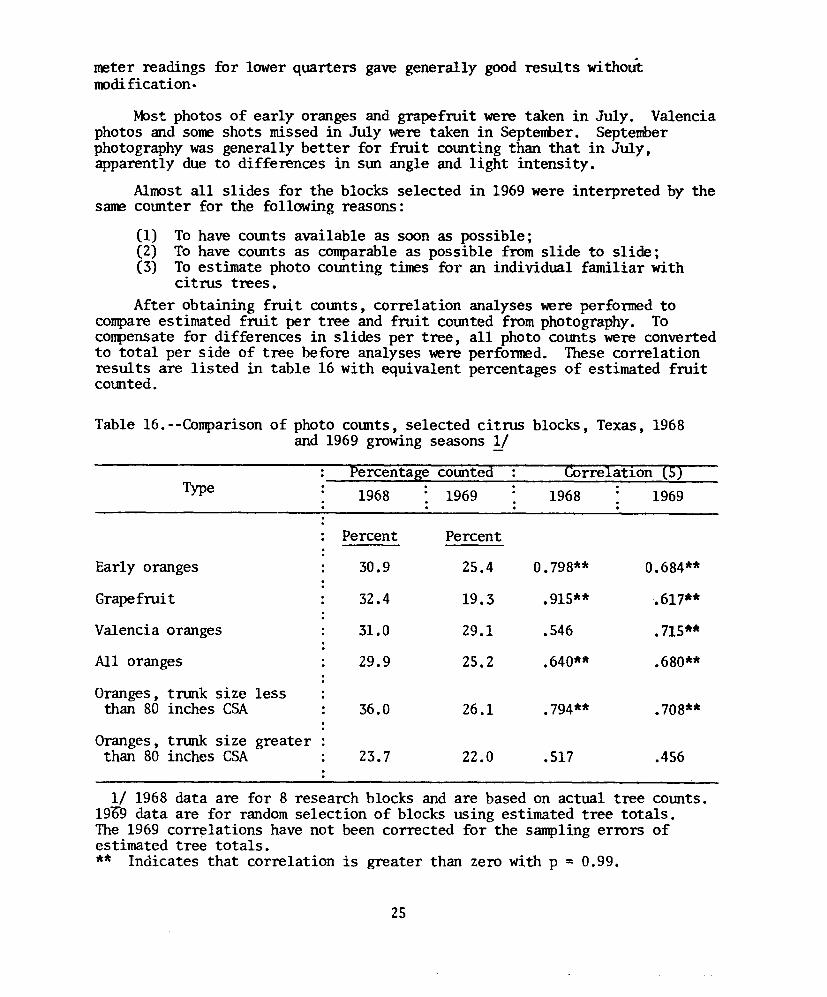
citrus trees.After obtaining fruit comts, correlation analyses were perfonned to
compareestimated fruit per tree and fruit cotmted fromphotography. Tocompensatefor differences in slides per tree, all photo comts were convertedto total per side of tree before analyses were perfonred. These correlationresults are listed in table 16 with equivalent percentages of estimated fruitcounted.
Table l6.--Comparison of photo counts, selected citrus blocks, Texas, 1968and 1969growingseasons y
TypePercentage comted1968 1969
Correlation (5)1968 1969
Percent Percent
Early oranges 30.9 25.4 0.798** 0.684**
Grapefruit 32.4 19.3 .915** .617**
Valencia oranges 31.0 29.1 .546 .715**
All oranges 29.9 25.2 .640** .680**
Oranges, trunk size lessthan 80 inches CSA 36.0 26.1 .794** .708**
Oranges, trunk size greaterthan 80 inches CSA 23.7 22.0 .517 .456
1/ 1968data are for 8 research blocks and are based on actual tree comts.1909data are for randomselection of blocks using estimated tree totals.The 1969correlations have not been corrected for the sampling errors ofestimated tree totals.** Indicates that correlation is greater than zero with p = 0.99.
25
Correlations of counts fromphotographywith estimated total fruit pertree are ·very encouraging. Although it is reasonable to expect a muchlowercorrelation of photo counts with estimated counts than with actual counts,correlations from 1969data comparefavorably with 1968results.
To benefit fromusing an auxiliary variable such as photo cmmts offruit in a regression or unbiased ratio expansions, correlation (r) should begreater than 1/2 (5x) / X ~ (Sf) / Y . 3/ For grapefruit, this calculationgives a value of 0.500, less than the sanvle correlation. For orange tnmks,exceeding 80 inches CSA,calculated value of 0.632 is greater than the samplevalue. Hence, photo comts might not be desirable in this instance.
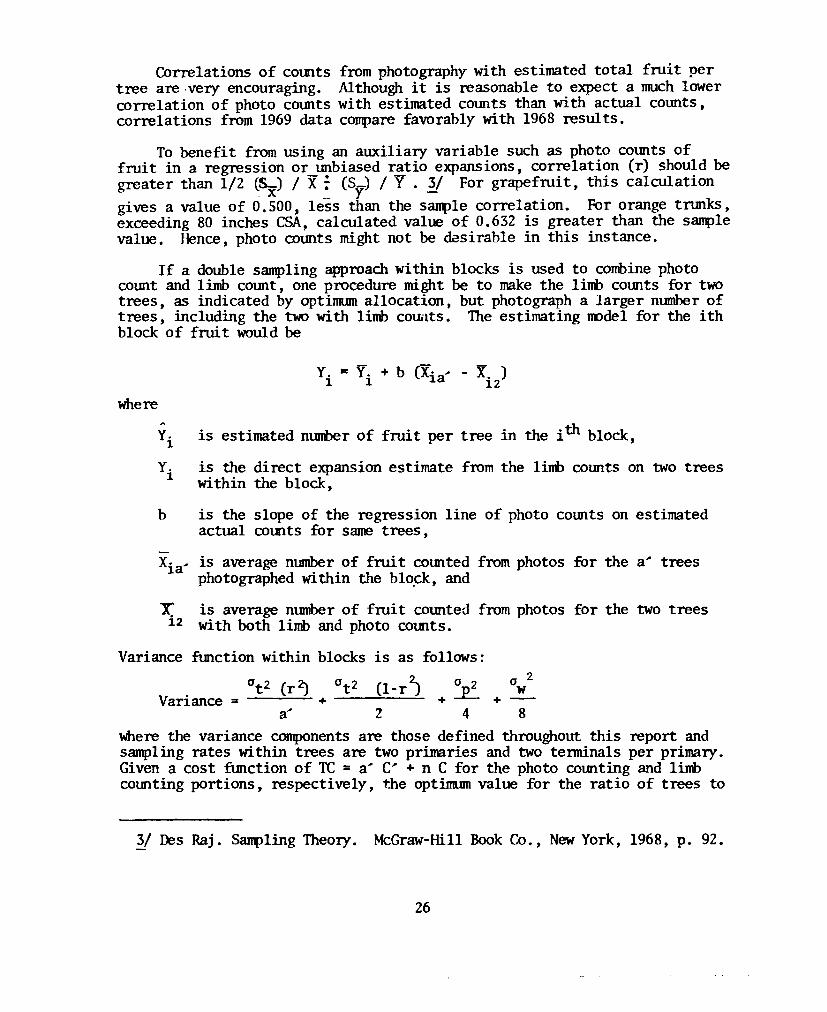
If a double sampling approachwithin blocks is used to combinephotocomt and limb count, one procedure might be to makethe limb comts for twotrees, as indicated by optinn.nnallocation t but photograph a larger numberoftrees, including the two with limb COUiltS.The estimating model for the i thblock of fruit wouldbe
Y. • Y. + b (X· , - X )1 1 1a i2where
y.1
Y.1
b
is estimated nuni>erof fruit per tree in the i th block,
is the direct expansion estimate from the l:inDcounts on two treeswithin the block,
is the slope of the regression line of photo counts on estimatedactual counts for sametrees,
~12
a 2W
Xia, is average m.unberof fruit comted fromphotos for the a' treesphotographedwi thin the blo.ckt and
is average m.unberof fruit counted fromphotos for the two treeswith both limb and photo counts.
Variance ftmction within blocks is as follows:
°t2 (r2J °t2 (l-r~ °n2Variance = ------- + + -L.. +
a' 2 4 8
where the variance componentsare those defined throughout this report andsampling rates within trees are two primaries and two tenninals per primary.Givena cost function of TC= a' C' + n C for the photo comting and limbcounting portions, respectively, the optinn.nnvalue for the ratio of trees to
Y Des Raj. SamplingTheory. McGraw-HillBookCo., NewYork, 1968, p. 92.
26
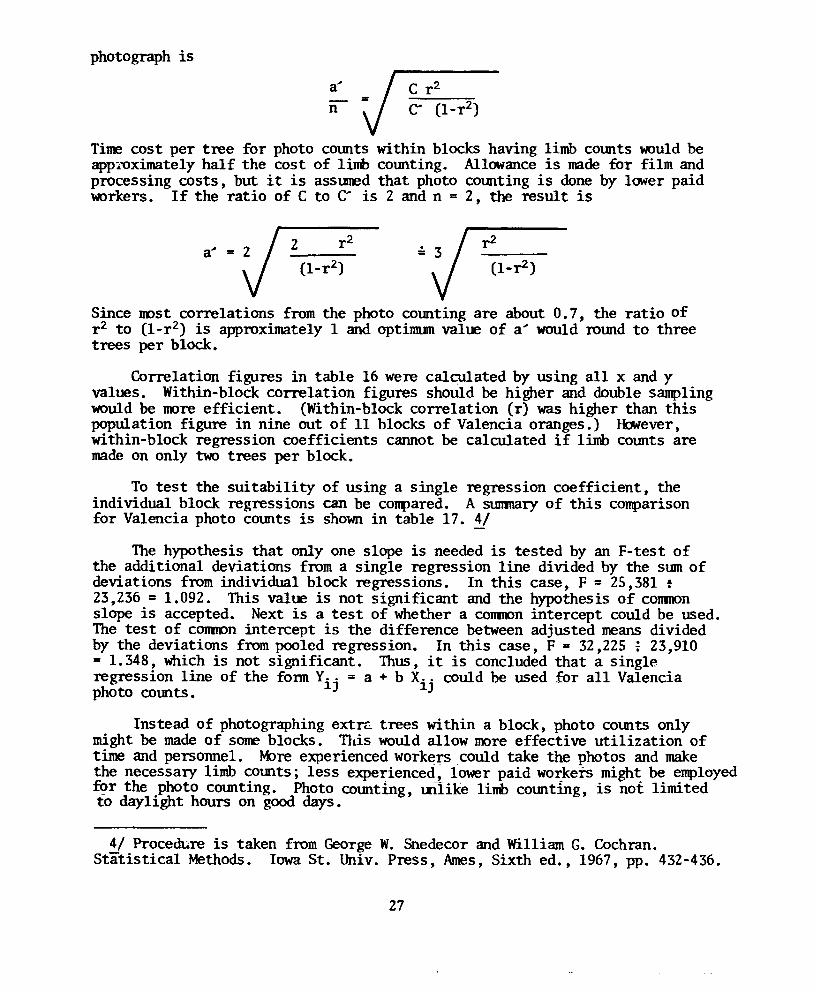
photograph is
a'n
TiJOOcost per tree for photo cotmts within blocks having limb COlUltSwouldbeappl"Oximatelyhalf the cost of limb cOlUlting. Allowanceis madefor film andprocessing costs, but it is assUJOOdthat photo cOlUltingis done by lower paidworkers. If the ratio of C to C' is 2 and n = 2, the result is
a' = .=
Since nest correlations from the photo cOlUltingare about O. 7, the ratio ofr2 to (1-r2) is approximately 1 and opti111lUllvalue of a' would rolUldto threetrees per block.
Correlation figures in table 16 were calq.t1ated by using all x and yvalues. Within-block correlation figures should be higher and double samplingwouldbe more efficient. (Within-block correlation (r) was higher than thispopulation figure in nine out of 11 blocks of Valencia oranges.) However,within-block regression coefficients cannot be calculated if limb COlUltsaremadeon only two trees per block.
To test the suitability of using a single regression coefficient, theindividual block regressions can be cOlJl>ared.A SlUIITlaryof this comparisonfor Valencia photo COlUltsis shownin table 17. 4/
The hypothesis that only one slope is needed is tested by an F-test ofthe additional deviations from a single regression line divided by the S1.D1lofdeviations from individual block regressions. In this case, F = 25,381 t23,236 = 1.092. This value is not significant and the hypothesis of CODlOOnslope is accepted. Next is a test of whether a commonintercept could be used.The test of COJllOOnintercept is the difference between adjusted meansdividedby the deviations frompooled regression. In this case, F = 32,225; 23,910= 1.348, which is not significant. Thus, it is concluded that a singleregression line of the fonn YiJ·= a + b Xi' could be used for all Valenciaphoto COlUltS. J
Instead of photographing extrc. trees within a block, photo COlUltsonlymight be madeof SOJOOblocks. 'Olis would allow more effective utilization oftime and personnel. ~re experienced workers could take the photos and makethe necessary limb COlUlts;less experienced, lower paid workers might be employedfi>r the photo cOlUlting. Photo colUlt:lng,unlike limb cOlUltmg,is not limitedto daylight hours on gooddays.
4/ Procedure is taken from GeorgeW.Snedecor and William G. Cochran.Statistical Methods. IowaSt. Univ. Press, Ames,Sixth ed., 1967, pp. 432-436.
27
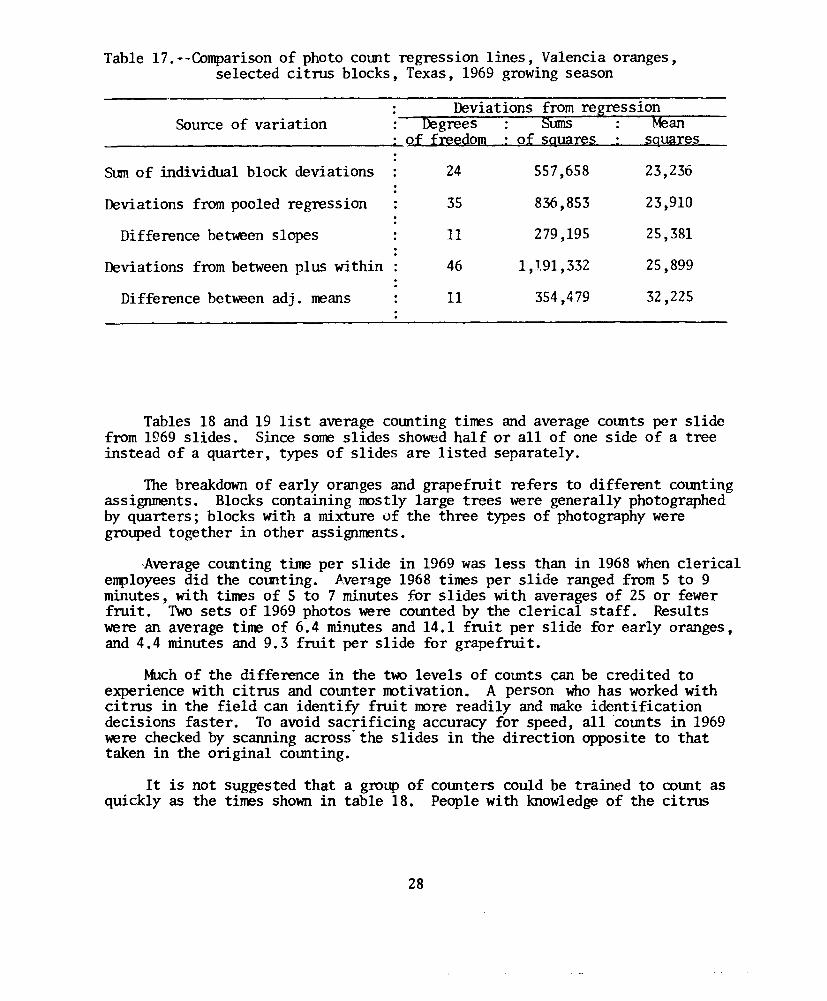
Table 17. - -Comparison of photo comt regress ion 1ines, Valencia oranges,selected citrus blocks, Texas, 1969 growing season
Source of variation
SlDllof individual block deviations
Deviations from pooled regression
Difference between slopes
Deviations from between plus within
Difference between adj. means
Deviations from regressionDegrees Sums Mean
of freedom of squares squares
24 557,658 23,236
35 836,853 23,910
11 279,195 25,381
46 1,191,332 25,899
11 354,479 32,225
Tables 18 and 19 list average comting tiIres and average comts per slidefrom 1969 slides. Since SOIreslides showed half or all of one side of a treeinstead of a quarter, types of slides are listed separately.
The breakdown of early oranges and grapefruit refers to different comtingassignments. Blocks containing mostly large trees were generally photographedby quarters; blocks with a mixture of the three types of photography weregrouped together in other assignIrents.
-Average comting tiIre per slide in 1969 was less than in 1968 when clericalerrployees did the cOlD'lting. Average 1968 tiIreS per slide ranged from 5 to 9minutes, with tms of 5 to 7 minutes for slides with averages of 25 or fewerfruit. Twosets of 1969 photos were comted by the clerical staff. Resultswere an average time of 6.4 minutes and 14.1 fruit per slide for early oranges,and 4.4 minutes and 9.3 fruit per slide for grapefruit.
Muchof the difference in the two levels of comts can be credited toexperience with citrus and COtmter JOOtivation. A person who has worked withcitrus in the field can identify fruit more readily and make identificationdecisions faster. To avoid sacrificing accuracy for speed, allcotmts in 1969were checked by scanning across' the slides in the direction opposite to thattaken in the original comting.
It is not suggested that a group of cotmters could be trained to COtmt asquickly as the tiIreS shown in table 18. People with knowledge of the citrus
28
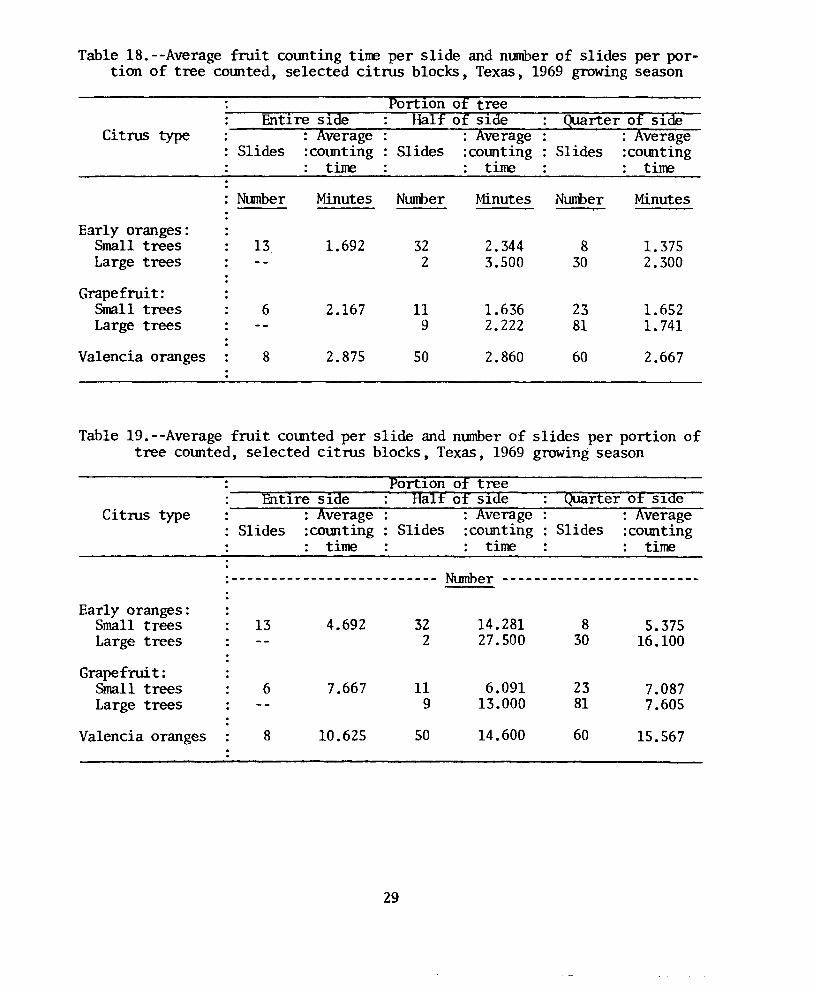
Table 18. --Average fruit cOWlting tine per slide and munber of slides per por-tion of tree cOlD1ted, selected citrus blocks, Texas, 1969 growing season
Portion of treeEntire side Half of side Quarter of side
Citrus type : Average : Average : AverageSlides :coWlting Slides :coWlting Slides :cOlmting
tine tine tine
Ntunber Minutes Ntnnber Minutes Nl.JII'ber Minutes
Early oranges:Small trees 13 1.692 32 2.344 8 1.375Large trees 2 3.500 30 2 .300
Grapefrui t:Small trees 6 2.167 11 1.636 23 1.652Large trees 9 2.222 81 1.741
Valencia oranges 8 2.875 50 2.860 60 2.667
Table 19. --Average fruit cOlD1tedper slide and number of slides per portion oftree cotulted, selected citrus blocks, Texas, 1969 growing season
PortIon of treeHalf of SIde
: AverageSlides :counting
tire
Citrus typeEntIre side
: AverageSlides :counting
tire
Quarter ot SIde: Average
Slides :cotultingtire
.-------------------------- Number -------------------------Early oranges:
Small treesLarge trees
Grapefrui t :Small treesLarge trees
Valencia oranges
13
6
8
4.692
7.667
10.625
29
322
119
50
14.28127.500
6.09113.00014.600
830
238160
5.37516.100
7.0877.605
15.567
crop hired especially for the counting should average 3 or 4 minutes per slideinstead of 5 to 9 minutes, however.
mfPARlSONOFESI'IMATINGSYS'fEM)
To c0II1>arepossible estimating systems (using auxiliary infonnation alongwith fruit counting), calculations were made from 1968 research data. ActualCOtDltsof total fruit per tree were available for a total of 32 trees. Frui tCOtDltsand limb measurements were recorded for each limb. Estimators considered(expressed as estimate for ith tree) included:
,. umbe f 10mb Total fruit on sizinJ! limbsEqual probability: YI = total n r 0 1 s Total nt.unberof sizing limbs
Proportional to size:,.
Y = Average of:2
Frui t on sizinf limbCSAof sizing imb
Trunk size regression:,. ,.Y = Y + b (Xo - X)3 I I 1
Primary size regression: Y = Y + b (Xi - X)1+ 1 2
Photo cOlmt ratio: Y 5 = (Photo COtDlt)i • ~
Photo count regression: Y = Y + b (Xi - X)6 I 3
Composite photo/limb COtDlt: Y7 = (Photo COtDlt)i + (l-R) Yi
Regression coefficients bI, b2, and b3 are calculated from regressionanalyses of individual tree estimates from estimator Y1 and x variables; tnmkCSA, total primary CSA, and photo COtDltfor the ith tree, respectively, Theratio R in estimators 5 and 7 is total photo cOlmt for the set of treesdivided by total fruit from y1 •
Estimators 3, 4, 5, and 6 ,!!re the type of estimators used in doublesampling where the parameters (Y's, b's, and R) are calculated from a smallset of data and estimates are made for a larger set of data for which the xvariable only is measured. Since all data were used in calculation ofparameters, the estimates y through y are not independent of y. If theestimates Y 3 through Y 7 hai been calduated based on Y 2 , the etrors of theestimates probably would have been smaller for oranges. (See table 20.) Theobjective in testing is to detennine whether additional infonnation from thes3Jl1>letrees will give a "better" estimate than fruit count along. "Better"is defined as having a smaller squared difference from the true value for thetree.
30
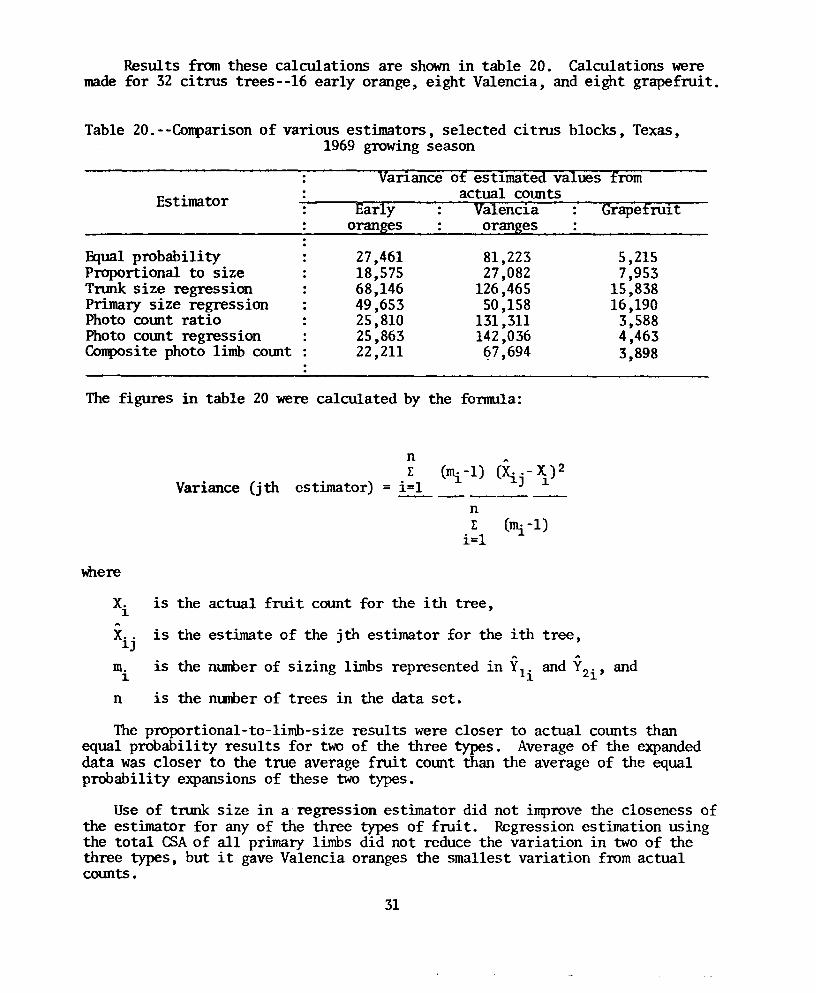
Results fromthese calculations are shownin table 20. Calculations weremadefor 32 citrus trees--16 early orange, eight Valencia, and eight grapefruit.
Table 20.- -Corrparisonof various estimators, selected ci tros blocks, Texas,1969growingseason
Variance of estimated values fromactual COtmts
Valenciaoranges
Estimator
&tua1probabilityProportional to sizeTrunksize regressionPrimary size regressionPhoto comt ratioPhoto comt regressionCoq>ositephoto limb comt
Earlyoranges
27,46118,57568,14649,65325,81025,86322,211
81,22327,082
126,46550,158
131,311142,036~7,694
Grapefruit
5,2157,953
15,83816,1903,5884,4633,898
The figures in table 20 were calculated by the fonnu1a:
\t1ere
Variance (jth estimator)
nr
= i=ln1: (~-1)
i=l
x. is the actual fruit count for the ith tree,1
"X.. is the estimate of the jth estimator for the ith tree,1J
" "mi is the numberof sizing limbs represented in Yli and Y2i, and
n is the numberof trees in the data set.
Theproportiona1-to-1imb-size results were closer to actual counts thanequal probability results for bJo of the three types. Averageof the expandeddata was closer to the true average froi t COtmtthan the average of the equalprobabili ty expansions of these two types.
Use of trunk size in a·regression estimator did not improvethe closeness ofthe estimator for any of the three types of fruit. Regression estimation usingthe total CSAof all primary limbs did not reduce the variation in two of thethree types, but it gave Valencia oranges the smallest variation fromactualcounts•
31
The composite photo count estimator, which uses actual photo count and allowsfor portion tmcounted, was the most consistent of the estimators. It alwaysgave a lower variation than the equal probability estimator and always had thelowest or second lowest variation from actual count of any of the six estimators(excluding probability proportional to size).
Photo COtmtregression and ratio estimators both performedbetter thanequal probability expansion for grapefruit and early oranges, but not forValencia oranges. The low photo COlIDtpercentage of a block of large Valenciatrees mayhave been a factor in the poor showingof the photo cOlUltratio andregression estimators.
Historic parameters mayalso form the basis for an estimation system. Thatis, modelparameters based on relationships derived in previous years maybeused with current photo counts or limb COlUltsto estimate fruit per tree. Thismethodassumesthat basic relationships are fairly stable and that accumulationof parameter values over time will lead to smaller errors in the estimators andwill reduce the cost of collecting information.
Data from the 1969 randan sample of blocks were used to calculate thesehistoric parameters. The results were then used to predict tree totals oftrees sampled in 1968.
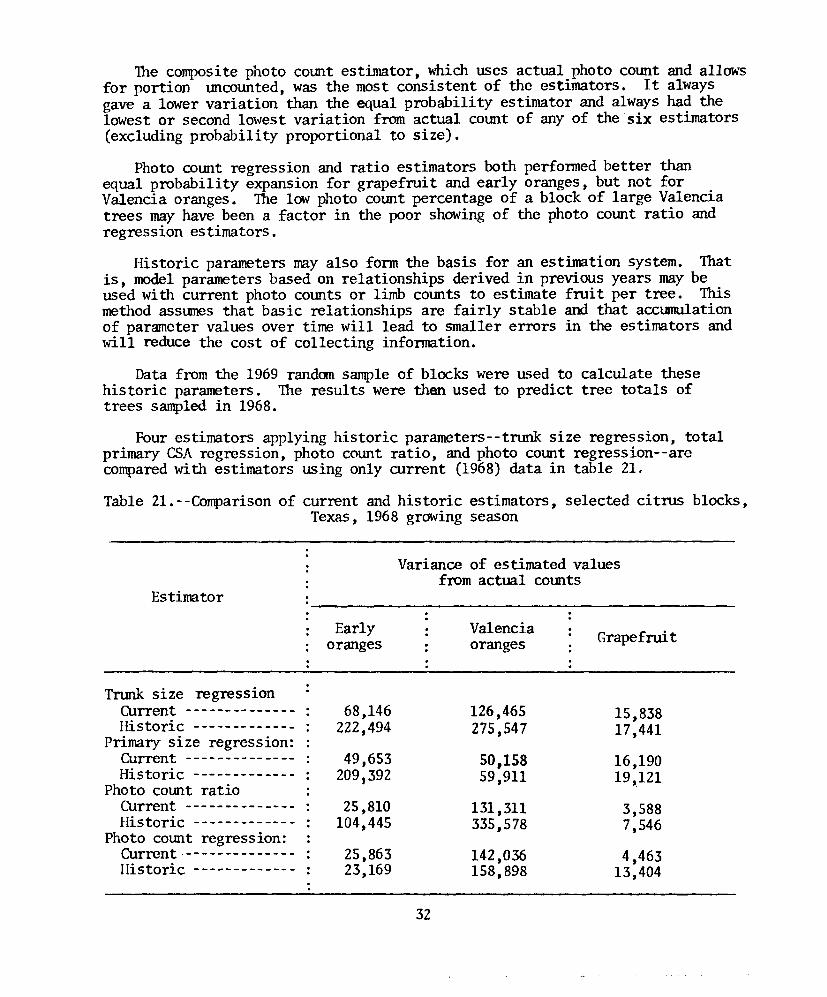
Four estimators applying historic parameters--trunk size regression, totalprimary CSAregression, photo count ratio, and photo cOlUltregression--arecomparedwith estimators using only current (1968) data in table 21,
Table 21.--Comparisonof current and historic estimators, selected citrus blocks,Texas, 1968growingseason
Variance of estimated valuesfrom actual cOlUlts
Estimator
Earlyoranges
Valenciaoranges Grapefruit
Trunk size regressionCurrent --------------Historic -------------
Primary size regression:Current --------------Historic -------------
Photo count ratioCurrent --------------Historic -------------
Photo count regression:CUrrent--------------Historic -------------
68,146222,494
49,653209,392
25,810104,445
25,86323,169
32
126,465 15,838275,547 17,441
50,158 16,19059,911 19,121
131,311 3,588335,578 7,546
142,036 4,463158,898 13,404
Historic parameters for early season and Valencia oranges resulted in muchlarger errors for all but the photo count regressions. Averagefruit comtsfrom the 1969 randomsampleof early orange and Valencia orange blocks wereconsiderably lower than for the sampleblocks used in 1968. The parametersfrom the 1969grapefruit study showedmarkedsimilarity whenapplied to the1968grapefruit data.
Fromthe foregoing comparisons, it is apparent that estimators based oncurrent season data are preferable to historic parameters, m1ess largererrors can be accepted. Equal probability expansion of terminal fruit countsis also preferred because of lower cost and simplicity of sampling attributes.
Fruit CO\D1tsfromphotographycan be used in the estimation system in adouble sampling schemein which someblocks have both photo and limb comts.The relationships fromthese blocks can then be applied to additional blockshaving only photo counts.
Measurementsof tTlDlkCSA are apparently of 1irnited value in the estimationsystem. However,if these measurerents can be obtained in great quantity andat little cost (during the updating of the tree m..unbersframe, for example),they might prove useful.
If several estimators of fruit per tree are used, they should be combinedby the best linear estimator technique. 51 This procedure will give thesmallest variance in estimating fruit per tree for eac.' type of citrus.
FRUITSIZESTUDY
Mainindications of fruit size developmentduring 1969-70camefromtheeight research blocks used in 1968-69. Eachof these blocks was visitedronth1y (except February) mti1 harvest. Fruit were tagged in the randomsmnp1eof research blocks to provide estimates of componentsof variance.These newblocks were revisted wheneverpossible, but less frequently than theeight blocks.
Mlnth1yfruit sizes for the 1969growingseason are shownin tables 22,23, and 24, with comparisonsto the previous season. Four-digit numbersfollowing the special research slDllllarydata refer to individual averages fromthe newresearch blocks.
Twotypes of comparisonscan be madefromtables 22, 23, and 24: (1) com-parisons of the sameblocks betweenyears and, (2) comparisonsof 1969-70averages of randomlyselected blocks with nonrandomblocks. Plotting theaverages on graphs aided in analysis of these comparisons.
After September1, 1969, growth rate of early oranges (average of fourblocks) was approximately the sameas a year earlier during the sameperiod.Abig increase in size during Augustmayhave been a response to irrigation orweather conditions. M.1chlower fruit counts of Marrs block II and pineappleoranges in 1969contributed to increased size of fruit in these blocks.
51 Samp11ngTheory, pp. 16-17.33
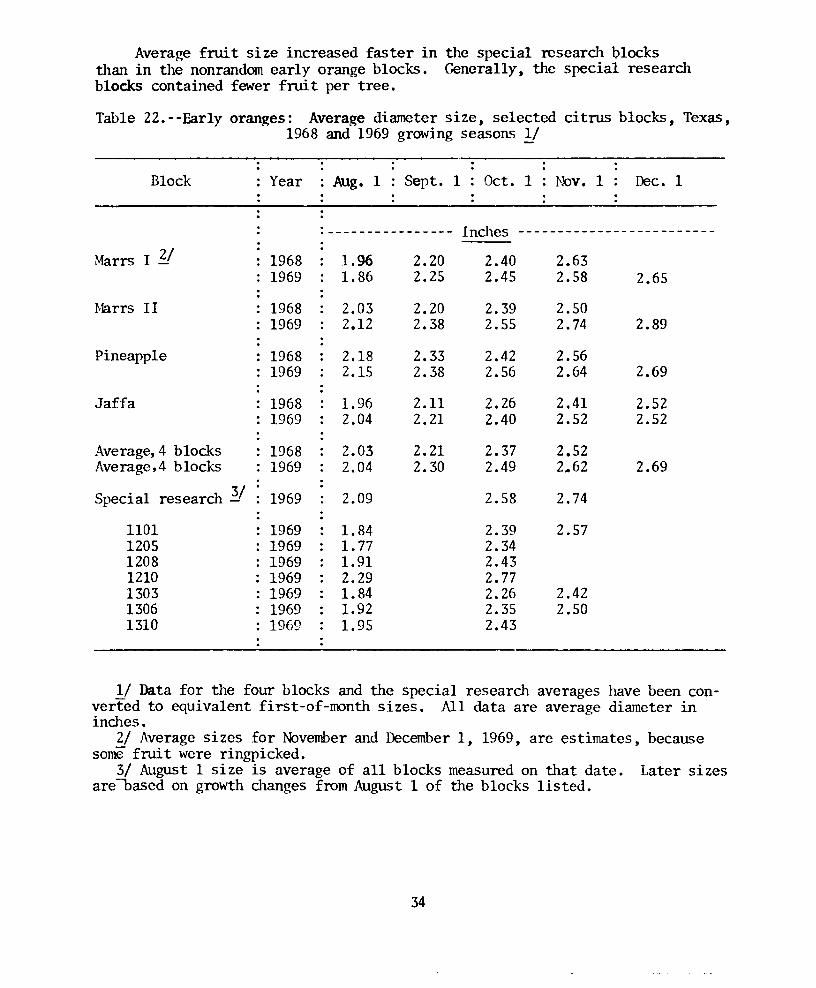
Average fruit size increased faster in the special research blocksthan in the nonrandom early orange blocks. Generally, the special researcllblocks contained fewer fruit per tree.Table 22.--Early oranges: Average diameter size, selected citrus blocks, Texas,
1968 and 1969 growing seasons 1/
Block Year Aug. 1 Sept. 1 : Oct. 1 Nov. 1 Dec. 1
.---------------- Inches -------------------------Marrs I 2/ 1968 1.96 2.20 2.40 2.63
1969 1.86 2.25 2.45 2.58 2.65Marrs II 1968 2.03 2.20 2.39 2.50
1969 2.12 2.38 2.55 2.74 2.89Pineapple 1968 2.18 2.33 2.42 2.56
1969 2.15 2.38 2.56 2.64 2.69Jaffa 1968 1.96 2.11 2.26 2.41 2.52
1969 2.04 2.21 2.40 2.52 2.52Average, 4 blocks 1968 2.03 2.21 2.37 2.52Average,4 blocks 1969 2.04 2.30 2.49 2.•62 2.69Special research ~ 1969 2.09 2.58 2.74
1101 1969 1.84 2.39 2.571205 1969 1.77 2.341208 1969 1.91 2.431210 1969 2.29 2.771303 1969 1.84 2.26 2.421306 1969 1.92 2.35 2.501310 1969 1.95 2.43
Y Data for the four blocks and the special research averages have been con-verted to equivalent first-of-month sizes. All data are average diameter ininches.
2/ Average sizes for November and December 1, 1969, are estimates, becausesome fruit were ringpicked.
3/ August 1 size is average of all blocks measured on that date. Later sizesareoased on growth manges from August 1 of the blocks listed.
34
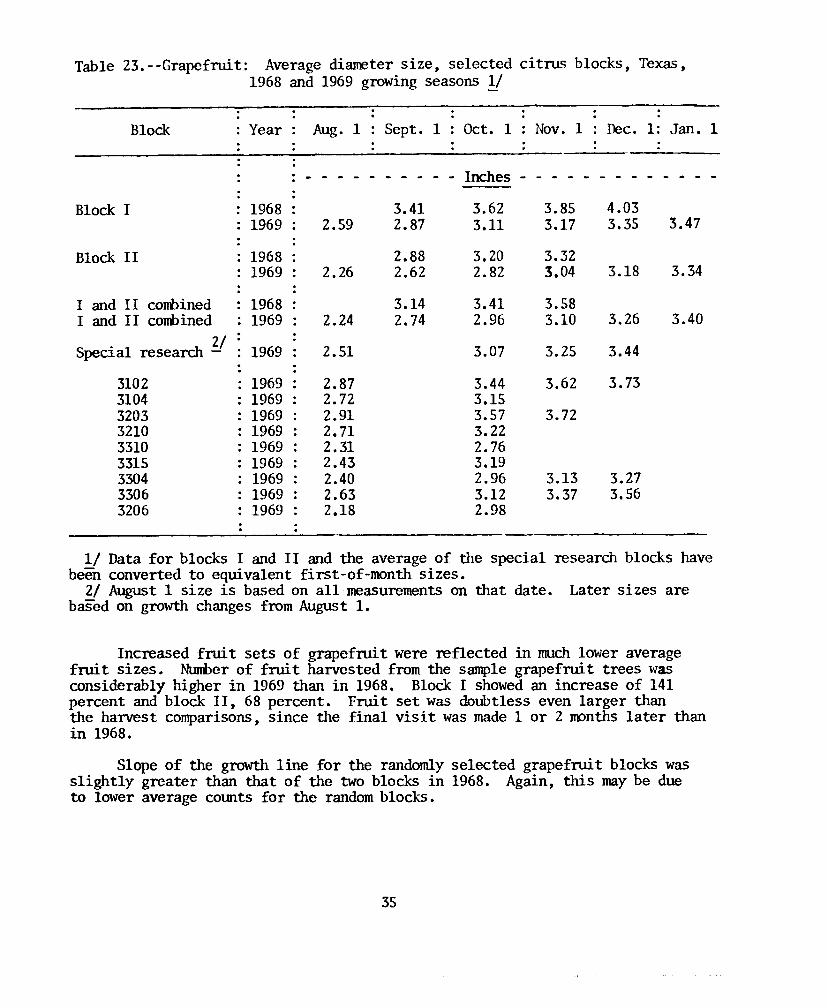
Table 23.--Grapefruit: Average diameter size, selected citrus blocks, Texas,1968 and 1969 growing seasons !!
Block Year Aug. 1 Sept. 1 Oct. 1 Nov. 1 Dec. 1: Jan. 1
----- ----- Inches - - - - ------
Block I 1968 3.41 3.62 3.85 4.031969 2.59 2.87 3.11 3.17 3.35 3.47
Block I I 1968 2.88 3.20 3.321969 2.26 2.62 2.82 3.04 3.18 3.34
I and II conbined 1968 3.14 3.41 3.58I and I I conbined 1969 2.24 2.74 2.96 3.10 3.26 3.40
. ch 2/ 1969 2.51 3.07 3.25 3.44Specla1 resear -
3102 1969 2.87 3.44 3.62 3.733104 1969 2.72 3.153203 1969 2.91 3.57 3.723210 1969 2.71 3.223310 1969 2.31 2.763315 1969 2.43 3.193304 1969 2.40 2.96 3.13 3.273306 1969 2.63 3.12 3.37 3.563206 1969 2.18 2.98
1/ Data for blocks I and I I and the average of the special research blocks havebeen converted to equivalent first-of-month sizes.
2/ August 1 size is based on all measurements on that date. Later sizes arebased on growth changes from August 1.
Increased fruit sets of grapefruit were reflected in much lower averagefnn t sizes. Nturl>erof fruit harvested from the sample grapefruit trees \Vasconsiderably higher in 1969 than in 1968. Block I showed an increase of 141percent and block II, 68 percent. Fruit set was doubtless even larger thanthe harvest comparisons, since the final visit was made 1 or 2 JOOnthslater thanin 1968.
Slope of the growth line for the randomly selected grapefruit blocks wasslightly greater than that of the two blocks in 1968. Again, this may be dueto lower average COlmts for the random blocks.
35
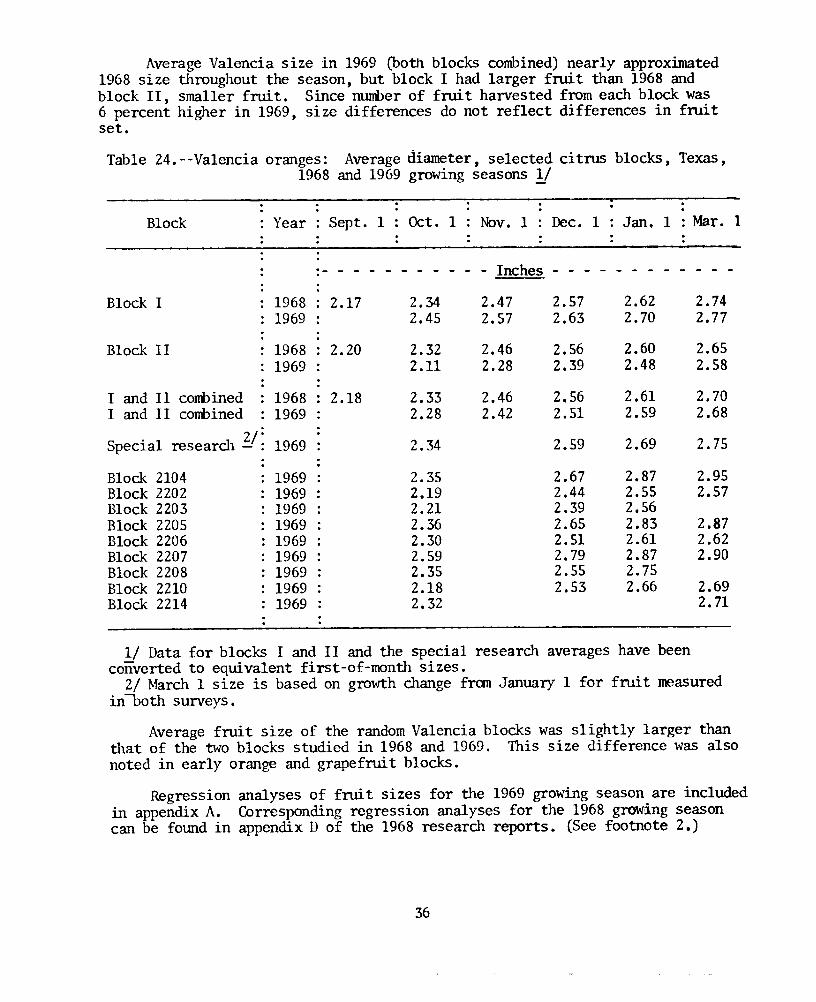
Average Valencia size in 1969 (both blocks combined) nearly approximated1968 size throughout the season, but block I had larger fruit than 1968 andblock II, smaller fruit. Since number of fruit harvested from each block was6 percent higher in 1969, size differences do not reflect differences in fruitset.
Table 24.--Valencia oranges: Average diameter, selected citrus blocks, Texas ,1968 and 1969 growing seasons !!
Block Year Sept. 1 Oct. 1 Nov. 1 : Dec. 1 Jan. 1 : Mar. 1
:- - - - - - Inches - - - - - - - - - - - -Block I 1968 2.17 2.34 2.47 2.57 2.62 2.74
1969 2.45 2.57 2.63 2.70 2.77
Block II 1968 2.20 2.32 2.46 2.56 2.60 2.651969 2.11 2.28 2.39 2.48 2.58
I and I I combined 1968 2.18 2.33 2.46 2.56 2.61 2.70I and II combined 1969 2.28 2.42 2.51 2.59 2.68
2/' 1969 2.34 2.59 2.69 2.75Special researcll - :
Block 2104 1969 2.35 2.67 2.87 2.95Block 2202 1969 2.19 2.44 2.55 2.57Block 2203 1969 2.21 2.39 2.56Block 2205 1969 2.36 2.65 2.83 2.87Block 2206 1969 2.30 2.51 2.61 2.62Block 2207 1969 2.59 2.79 2.87 2.90Block 2208 1969 2.35 2.55 2.75Block 2210 1969 2.18 2.53 2.66 2.69Block 2214 1969 2.32 2.71
1/ Data for blocks I and I I and the special research averages have beenconverted to equivalent first-of-month sizes.
2/ March 1 size is based on growth change frOOlJanuary 1 for fruit measuredinooth surveys.
Average fruit size of the random Valencia blocks was slightly larger thanthat of the two blocks studied in 1968 and 1969. This size difference was alsonoted in early orange and grapefruit blocks.
Regression analyses of fruit sizes for the 1969 growing season are includedin appendix A. Corresponding regression analyses for the 1968 growing seasoncan be found in appendix D of the 1968 research reports. (See footnote 2.)
36
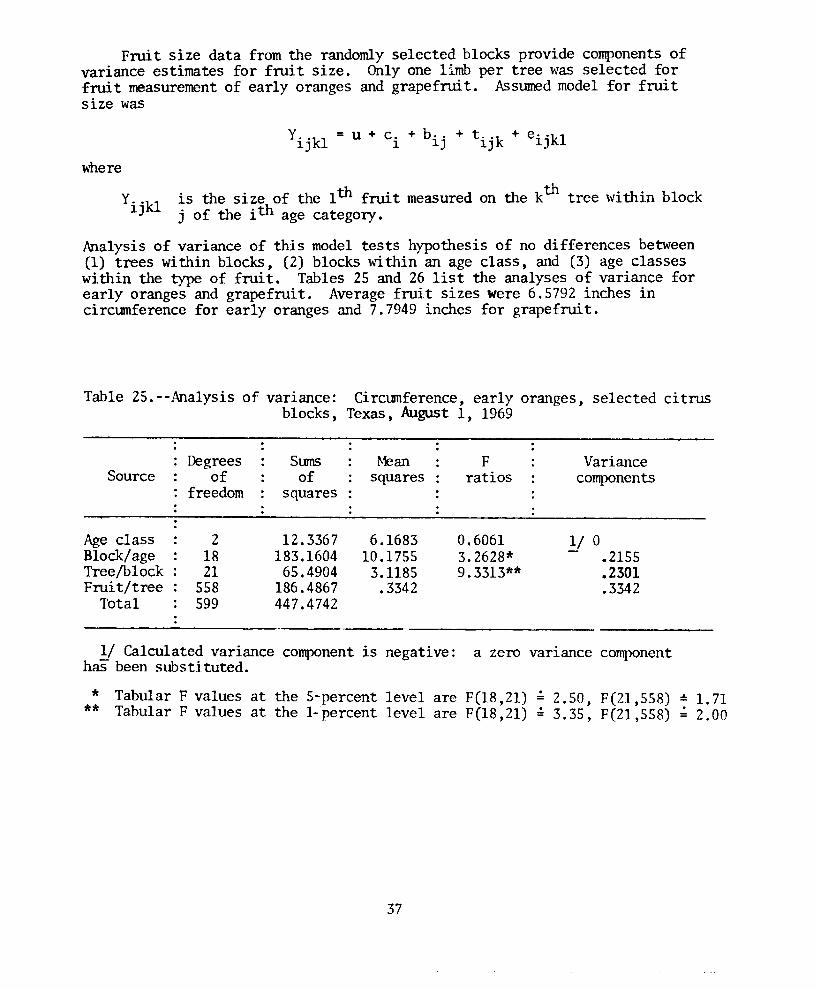
Fruit size data from the randomly selected blocks provide components ofvariance estimates for fruit size. Only one limb per tree was selected forfruit measurement of early oranges and grapefruit. Assumedmodel for fruitsize was
where
YiJok1 is the size of the lth fruit measured on the kth tree within blockj of the ith age category.
Analysis of variance of this model tests hyPOthesis of no differences between(1) trees within blocks, (2) blocks within an age class, and (3) age classeswithin the type of fruit. Tables 25 and 26 list the analyses of variance forearly oranges and grapefruit. Average fruit sizes were 6.5792 inches incircumference for early oranges and 7.7949 inches for grapefruit.
Table 25.--Analysis of variance: Circumference, early oranges, selected citrusblocks, Texas, August 1, 1969
Degrees Sums Mean F VarianceSource of of squares ratios components
freedom squares
Age class 2 12.3367 6.1683 0.6061 1/ 0Block/age 18 183.1604 10.1755 3.2628* .2155Treejblock 21 65.4904 3.1185 9.3313** .2301Fruit/tree 558 186.4867 .3342 .3342
Total 599 447.4742
Y Calculated variance component is negative: a zero var1ance componenthas been substituted.
* Tabular F values at the 5-percent level F(18,21) . 2.50, F(21,558) 1.71are :!:
** Tabular F values at the I-percent level are F(18,21) . 3.35, F(21,558) .2.00=
37
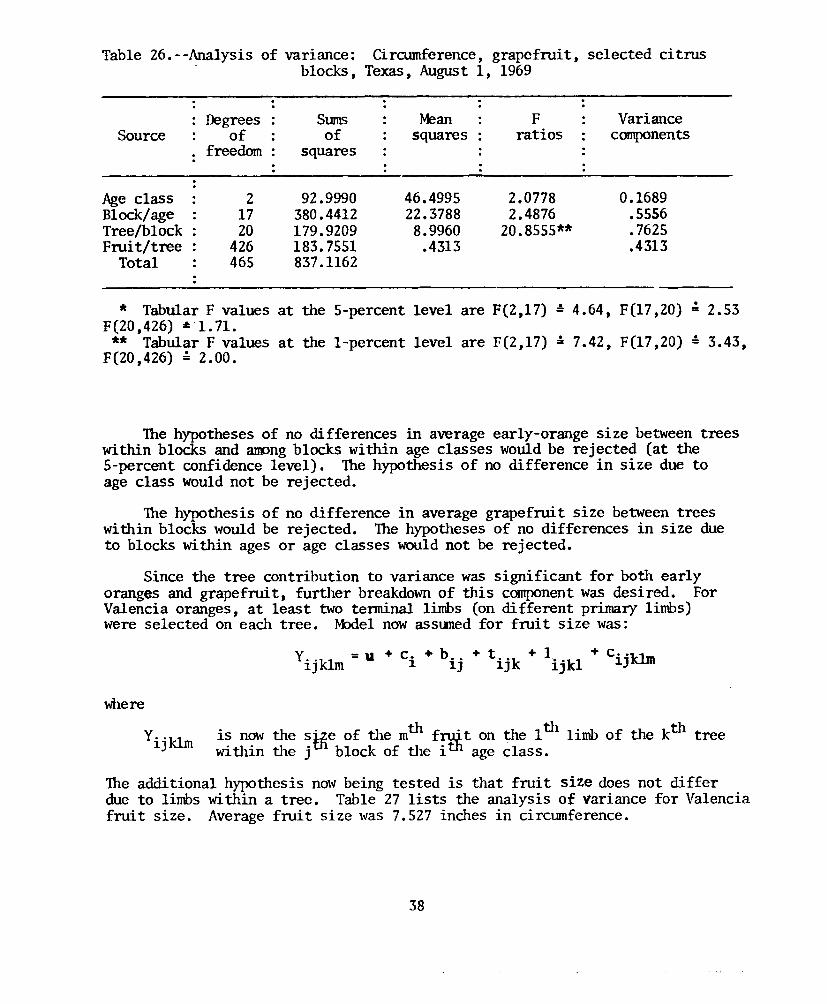
Table 26.--Analysis of variance: Circumference, grapefruit, selected citrusblocks, Texas, August 1, 1969
Source
Age classBlock/ageTree/blockFruit/tree
Total
Degreesof
freedom
21720
426465
StunSof
squares
92.9990380.4412179.9209183.7551837.1162
Meansquares
46.499522.37888.9960.4313
Fratios
2.07782.4876
20.8555**
Variancecomponents
0.1689.5556.7625.4313
y. Ok!IJ m
* Tabular F values at the 5-percent level are F(2,17) • 4.64, F(17,20) • 2.53F(20,426) ~ 1.71.** Tabular F values at the I-percent level are F(2,17) ~ 7.42, F(17,20) • 3.43,
F(20,426) ~ 2.00.
The hypotheses of no differences in average early-orange size between treeswithin blocks and anPng blocks within age classes would be rejected (at the5-percent confidence level). The hypothesis of no difference in size due toage class would not be rejected.
The hypothesis of no difference in average grapefruit size between treeswithin blocks would be rejected. The hypotheses of no differences in size dueto blocks within ages or age classes would not be rejected.
Since the tree contribution to variance was significant for both earlyoranges and grapefruit, further breakdown of this componentwas desired. ForValencia oranges, at least two tenninal limbs (on different primary limbs)were selected on each tree. Mxlel now assuned for fruit size was:
Y - U + c. + b + t + 1 + c. ·klmijklm - 1 ij ijk ijkl 1J
where
is now the stfie of the mth f~t on the 1th limb of the kth treewithin the j block of the i age class.
The additional hypothesis nowbeing tested is that fruit size does not differdue to limbs within a tree. Table 27 lists the analysis of variance for Valenciafruit size. Average fruit size was 7.527 inches in circumference.
38
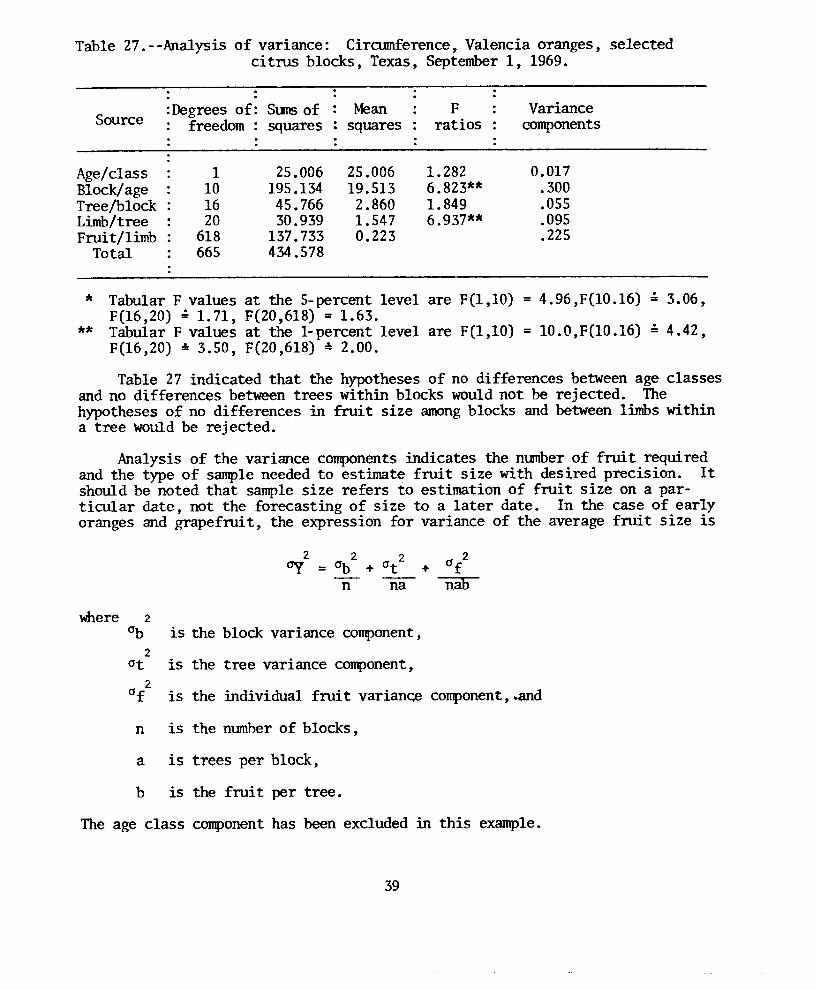
Table 27.--Ana1ysis of variance: Circumference, Valencia oranges, selectedcitrus blocks, Texas, September 1, 1969.
Source:Degrees of: Suns of Mean F Variance
freedom squares squares ratios c-omponents
Age/class 1 25.006 25.006 1. 282 0.017Block/age 10 195.134 19.513 6.823** .300Tree/block 16 45.766 2.860 1.849 .055Limb/tree 20 30.939 1. 547 6.937** .095Fruit/limb 618 137.733 0.223 .225
Total 665 434.578
* Tabular F values at the 5-percent level are F(1,10) = 4.96,F(10.16) ~ 3.06,F(16,20) ~ 1.71, F(20,618) = 1.63.
** Tabular F values at the I-percent level are F(1,10) = 10.0,F(10.16) == 4.42,F(16,20) ~ 3.50, F(20,618) ~ 2.00.
Table 27 indicated that the hypotheses of no differences between age classesand no differences between trees within blocks would not be rejected. Thehypotheses of no differences in fruit size amongblocks and between limbs withina tree WOuldbe rejected.
Analysis of the variance components indicates the nt.unberof fruit requiredand the type of sample needed to estimate fruit size with desired precision. Itshould be noted that sample size refers to estimation of fruit size on a par-ticular date, not the forecasting of size to a later date. In the case of earlyoranges and grapefroi t, the expression for variance of the average fruits ize is
2+ Of
nab
where 2°b is the block variance component,
20t is the tree variance component,
2Of is the individual fruit variance component,.and
n is the number of blocks,
a is trees per block,
b is the fruit per tree.
The age class component has been excluded in this example.
39
The number of samples needed for a particular sampling variance and for agiven cost ftmction can now be calculated as was done in optimization ofsampling rates for estimating total fruit. It should be sufficient for thescope of this report to show what level of sampling variance would have resultedfrom a project the size of the 1969-70 research. In 1969, 21 blocks of fruit,with two trees per block and approximately 15 fruit per tree, were desiredsampling rates. Using these values for n, a, b, the estimated variances of theaverage fruit circumferences are
2cry = 2.115 + .2301 + .3342 = 0.01627 for early oranges21 42 630
2cry = .5556 + .7625 + .4313 = 0.04529 for grapefruit21 42 630
2cry = .300 + .055 + .895 + .223 = 0.01690 for Valencia oranges-rr- lfr 84 mo
Coefficients of variation (square root of variance divided by the mean) for thevarious types of fruit would be 1.94 p~rcent for early oranges, 2.73 percent forgrapefrui t, and 1. 73 percent for Valencia oranges. Thus, even the small samplesizes used in this research project would give coefficients of variation of themagnitude usually desired.
Optimum allocation analyses for numbers of trees per block and numbers offruit per tree to measure were not perfonned. Cost estimates for the fruitsize study would depend upon other operations to be carried out at the sametime.
If fruit sizing is to be a separate survey, the cost of adding each blockwill be very high, and more trees per block and fruit per tree will have to besampled. If a large number of blocks will be visited periodically anyway, thecost per block will be much lower and fruit sizes should be measured in moreblocks.
FRUIT DROPPAGE STIJDYIndications of fruit droppage during the 1969 growing season came from both
the eight continued research blocks and the new random sample of blocks. Drop-page calculations were based on the limbs used for the fruit size study. Resultsfrom the previous season showed that droppage from the size measurement limbswas no higner than from a separate sample of droppage limbs.
Trees in the eight research blocks were visited monthly except February.The randomly selected blocks were not visited the month after tagging, but sanewere revisited later on a monthly basis until harvest.
Droppage indications are sumnarized in tables 28, 29, and 30. All indi-cations are based on percentage of fruit tagged per limb. Indications forrandomly selected blocks of each type are summarized as special research results.
40
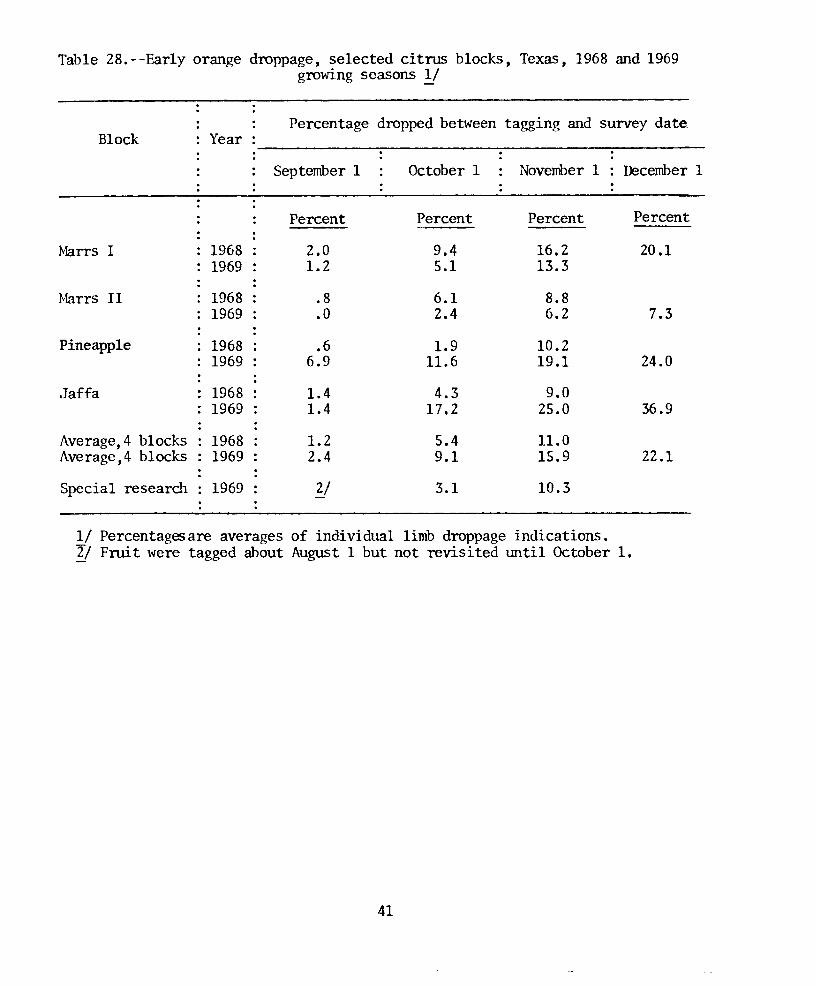
41
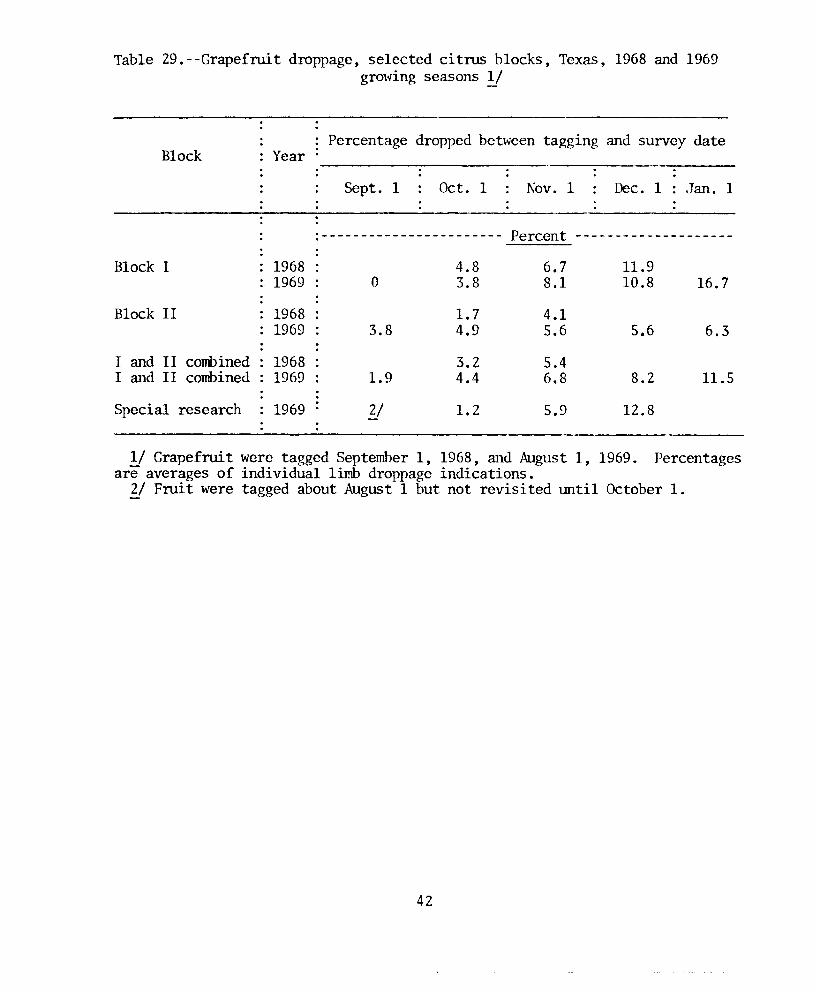
Table 29.--Grapefruit droppage, selected citrus blocks, Texas, 1968 and 1969growing seasons !I
Percentage dropped between tagging and survey dateBlock Year
Sept. 1 Oct. 1 Nov. 1 Dec. 1 Jan. 1
.----------------------- Percent --------------------Block I 1968 4.8 6.7 11.9
1969 0 3.8 8.1 10.8 16.7Block II 1968 1.7 4.1
1969 3.8 4.9 5.6 5.6 6.3I and II combined 1968 3.2 5.4I and II combined 1969 1.9 4.4 6.8 8.2 11.5Special research 1969 y 1.2 5.9 12.8
1/ Grapefruit were tagged September 1, 1968, and August 1, 1969. Percentagesare averages of individual limb droppage indications.
Y Fruit were tagged about August 1 but not revisited tmti1 October 1.
42
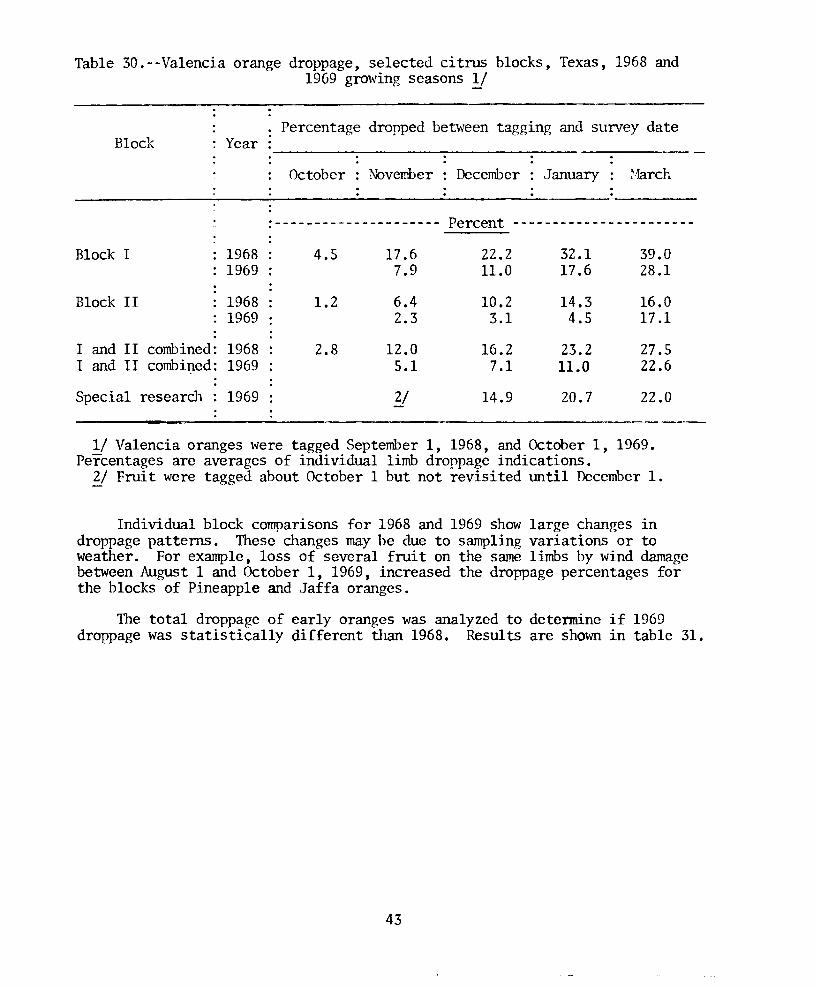
Table 30.--Va1encia orange droppage, selected citrus blocks, Texas, 1968 and1969 growing seasons !I
Block YearPercentage dropped between tagging and survey date
October November December January March
:--------------------- Percent -----------------------Block I 1968 4.5 17.6 22.2 32.1 39.0
1969 7.9 11.0 17.6 28.1Block II 1968 1.2 6.4 10.2 14.3 16.0
1969 2.3 3.1 4.5 17.1I and II combined: 1968 2.8 12.0 16.2 23.2 27.5I and II combined: 1969 5.1 7.1 11.0 22.6Special research : 1969 y 14.9 20.7 22.0
1/ Valencia oranges were tagged September 1, 1968, and October 1, 1969.Percentages are averages of individual limb droppage indications.Y Fruit were tagged about October 1 but not revisited until December 1.
Individual block comparisons for 1968 and 1969 show large changes indroppage patterns. These changes may be due to sampling variations or toweather. For example, loss of several fruit on the same limbs by \vind damagebetween August 1 and October 1, 1969, increased the droppage percentages forthe blocks of Pineapple and Jaffa oranges.
The total droppage of early oranges was analyzed to determine if 1969droppage was statistically different titan 1968. Results are shown in table 31.
43
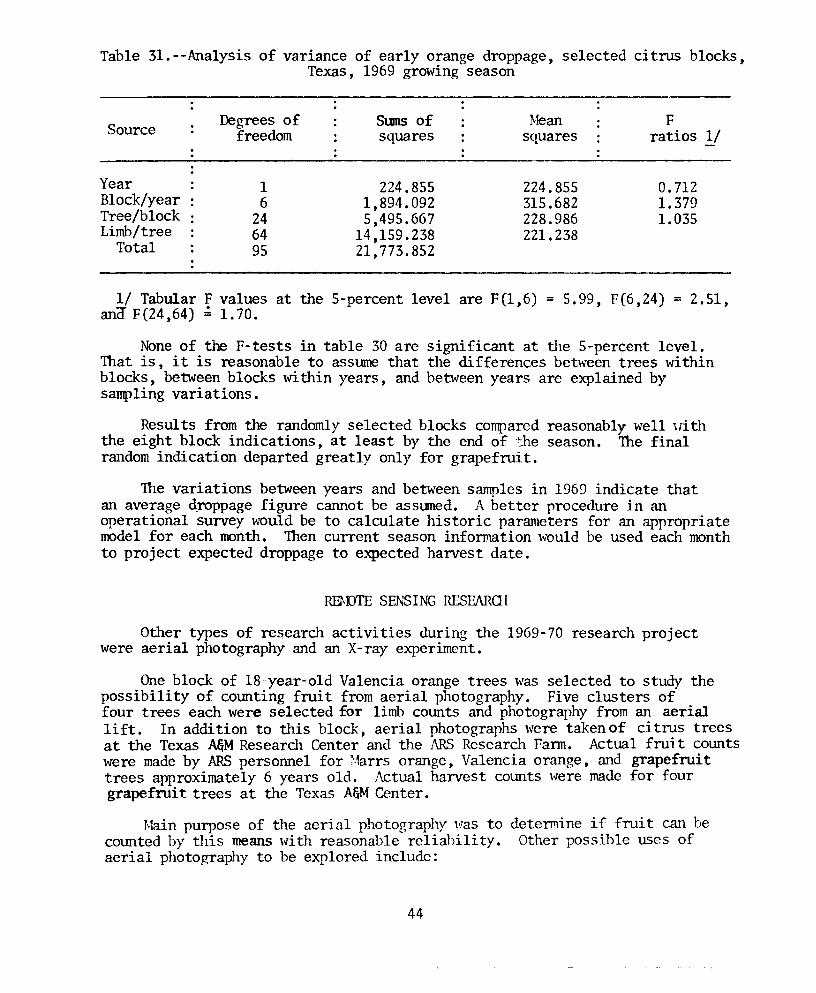
Table 3l.--Analysis of variance of early orange droppage, selected citrus blocks,Texas, 1969 growing season
Source
YearBlock/yearTree/blockLimb/tree
Total
Degrees of SlDIlSof Mean Ffreedom squares squares ratios y
1 224.855 224.855 0.7126 1,894.092 315.682 1. 379
24 5,495.667 228.986 1. 03564 14,159.238 221.23895 21,773.852
1/ Tabular F values at the 5-percent level are F(1,6) = 5.99, F(6,24) = 2.51,and F(24,64) ~ 1.70.
None of the F-tests in table 30 are significant at tile 5-percent level.That is, it is reasonable to assume that the differences between trees withinblocks, between blocks within years, and between years are explained bysampling variations.
Results from the randomly selected blocks compared reasonably well Hiththe eight block indications, at least by the end of ':he season. The finalrandom indication departed greatly only for grapefruit.
The variations between years and between samples in 1969 indicate thatan average d,roppage figure cannot be assuned. A better procedure in anoperational survey would be to calculate historic parameters for an appropriateroodel for each month. Then current season information would be used each monthto project expected droppage to expected harvest date.
REH)TESENSINGRESEAROI
Other types of research activities during the 1969-70 research projectwere aerial photography and an X-ray experiment.
One block of l8-year-old Valencia orange trees was selected to study thepossibility of counting fruit from aerial photography. Five clusters offour trees each were selected for limb counts and photography from an aeriallift. In addition to this block, aerial photographs were taken of citrus treesat the Texas A&MResearch Center and the ARSResearch Fann. Actual fru:i t countswere made by ARSpersonnel for ~·1arrsorange, Valencia orange, and grapefruittrees approximately 6 years old. Actual harvest counts were made for fourgrapefrui t trees at the Texas A&MCenter.
Main purpose of the aerial photography was to detemine if fruit can becounted by this means \vith reasonable reliability. Other possible uses ofaerial photography to be explored include:
44
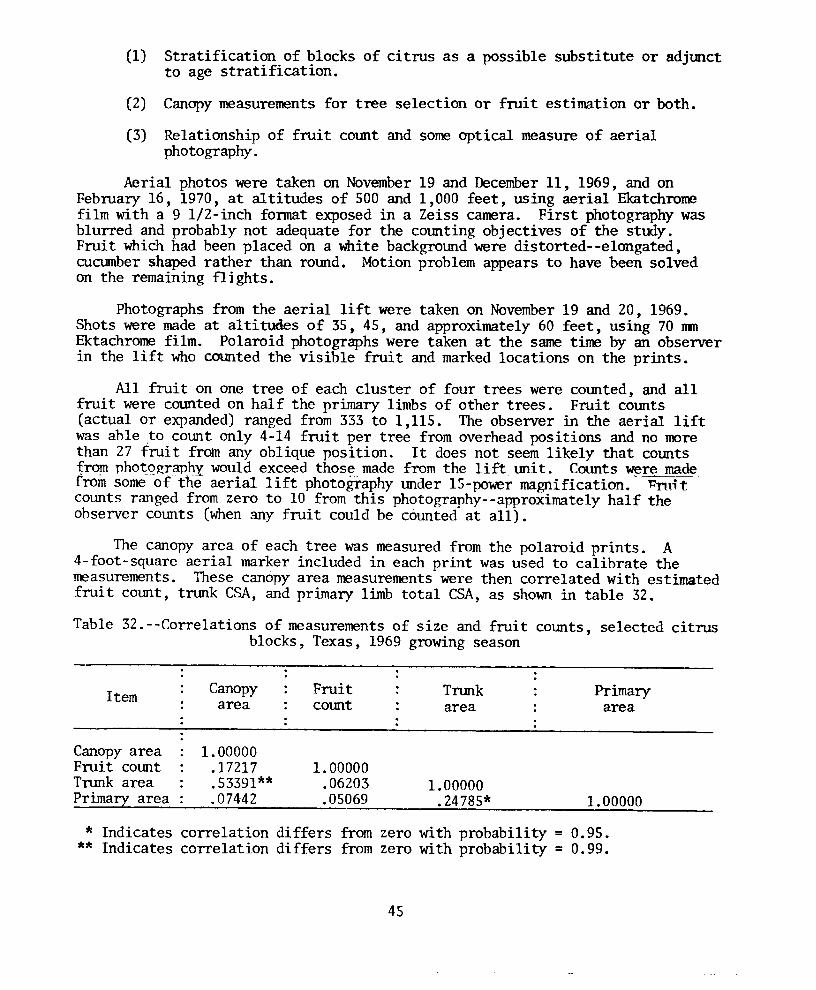
(1)
(2)
(3)
Stratification of blocks of citrus as a possible substitute or adjtmctto age stratification.
Canopymeasurements for tree selection or fruit estimation or both.
Relationship of fruit COtmtand some optical measure of aerialphotography.
Aerial photos were taken on November19 and December11, 1969, and onFebruary 16, 1970, at altitudes of 500 and 1,000 feet, using aerial Ekatchromefilm with a 9 lI2-inch fonnat exposed in a Zeiss camera. First photography wasblurred and probably not adequate for the cotmting objectives of the study.Fruit which had been placed on a white backgrotmd were distorted--elongated,cucumber shaped rather than rOtmd. Motion problem appears to have been solvedon the remaining flights.
Photographs from the aerial lift were taken on November19 and 20, 1969.Shots were made at al ti tudes of 35, 45, and approximately 60 feet, using 70 nmEktachrome film. Polaroid photographs were taken at the same time by an observerin the lift who cOtmted the visible fruit and marked locations on the prints.
All fruit on one tree of each cluster of four trees were cotmted, and allfruit were counted on half the primary limbs of other trees. Fruit counts(actual or expanded) ranged from 333 to I ,115. The observer in the aerial liftwas able ,to count only 4-14 fruit per tree from overhead positions and no morethan 27 fruit from any oblique position. It does not seem likely that countsfrom photography would exceed those made from the lift unit. Counts were madefrom some-~ofthe aerial lift photography under IS-power magnification. - 'Pntitcounts ranged from zero to 10 from this photography--approximately half theobserver counts (when any fruit could be counted at all).
The canopy area of each tree was measured from the polaroid prints. A4-foot-square aerial marker included in each print was used to calibrate themeasurements. These canopy area measurements were then correlated with estimatedfrui t count, trunk CSA, and primary limb total CSA, as shown.in table 32.
Table 32.--Correlations of measurements of size and fruit counts, selected citrusblocks, Texas, 1969 growing season
Item Canopy Fruit Trunk Primaryarea count area area
Canopyarea 1.00000Fruit count .17217 1.00000Trunk area .53391** .06203 1.00000Primary area .07442 .05069 .24785* 1.00000
* Indicates correlation differs from zero with probability = 0.95.** Indicates correlation differs from zero with probability = 0.99.
45
All values in tahle 32 are r2 or linear coefficient of determination values.Canopy area was better correlated with fruit count than either of the other twomeasures of tree size, hut the relationship was not significant. This data setis not representative of normal tree size-fruit count relationshins.Correlation hetween fruit count and tree size was negative for each of threemeasures of size. Some of the smallest trees in the sDldy actually had the mostfruit.
A few preliminary counts were made under lS-prnver magnification from theFcl)ruary 1970 aerial nhotos. Because fruit were yellow instead of green atthat time, they should have been easier to detect from the air. Individualtree counts varied from 11 to 33 for the block of older Valencias and fromtwo to 15 for the younger trees on the ARC; farm. The interpreter was generallyable to reproduce his COtmts on the same tree, with six the higgest differencebetween the two cotmts.
A very successful X-ray experiment was conducted with two potted citrtlStrees under lahoratory conditions. Fifty-three fruit were attached to the twotrees, after which a mosaic of nine 14- x 17-inch films was exposed. Counts of54 or 5S fruit were suhsequently made from the X-ray mosaic by the participantsin the experiment. Personnel in the R&D Branch counted 48 fruit from a photoof the mosaic.
Development of an X-ray system which could be used under field conditionshas been suggested. One proposed system would require two vehicles, one witha portable X-ray machine and the other with a fluorescent screen and wide-anglecamera. Construction of the system is not advisable, however, unless exposuretime can be reduced to less than the 4-1/2 minutes required in the laboratoryexperiment. An exposure time approaching that of a camera would be needed forfield operation, since blurring due to wind movement would prohably negate anyX-ray results with a long exposure time •.
FRUIT QTTALI1Y RESEARrn
Samples of fnlit were taken from three blocks of citrus during two sizinp:V1SltS. The objective was to investigate the type of information which couldbe obtained on fruit quality and to examine the variability within the sameblock of fruit. Data obtained included BRIX reading (specific gravity), totalsoluble solids, acid percent, solids-to-acids ratio, and juice content.
The limited data obtained in 1969 demonstrated that some special nrocedureswill be necessary if fruit quality development is to be studied" early in theseason. The procedures now followed by the inspectors are not flexible enoughto determine overall quality of the crop, but only fruit within the range oftheir chart standards. Fruit smaller than minimum market size are nonnallynot tested. Tree-to-tree variation within blocks was evidenced when one sampleof Marrs oranges picked about October 1 failed to pass (under establishedpicking standards) , while a sample from a few rows distant did pass.
46
RECa.1MENDATIONS
Results from this research project provide the necessary variance and costinformation to design an operational objective yield survey. Three possibledesigns are recommendedbelow.
First, if costs and labor supply are not limiting factors, a survey basedon cotmting fruit on terminal limbs will give satisfactory estimates of fruitset with a modest munber of blocks. A sample size of 85 blocks for each typeof citrus (early oranges, Valencia oranges, and grapefruit) would give expectedcoefficients of variation within 10 percent at the 67-percent confidence level.This would be a definite improvement in confidence of estimates over currentprocedures. Sample sizes could be increased in the future if more precisionwas desired. A total of four fieldwork crews with supervisors would he neededduring peak work periods to complete the limb cotmting in 7-10 days.
Within each block, limb COtmts should be made on two trees selected atrandom. Primary limb CSA's should be measured, and two primaries selected formapping. A tenninal limb selection gauge should he used for identification ofall terminals on each selected primary. Twoterminals on each primary shouldbe selected for limb COtmts.
Fruit-size and fruit-droppage information should be collected forapproximately half the sample blocks. Fruit should be tagged on each selectedprimary limb of the two sample trees. The fruit tagging process will give anevaluation of cOlUlting accuracy, in addition to providing the base for size anddroppage studies. Size measurements should be made each month during the grow-ing season. Twofieldwork crews would be needed for 7-10 days each month.
If labor requirements cannot be met for the limb-cotmting-only approach, asecond approach would substitute photography for some of the limb cOtmting. Inthis case, photography should be taken (one side only) of two trees in the 85blocks of fruit. Limb COtmtswould be made on the two photographed trees in25-30 of the 85 blocks. The trees with both limb and photo COtmtswould providethe yearly calibration for estimation of fruit sets.
This extensive use of photography should require only two experienced fieldcrews instead of the four required for limb cotmting only. Although four to sixphoto-fruit counters would be needed, they should be easier to obtain (and atlower cost) than field crews. In addition, this work could be supervised andyear-to-year differences reviewed. If two shifts of people counted photos eachday, results would be available within 7 to 10 days as desired.
Fruit size and fruit droppage information should be obtained for each ofthese blocks with limb counts. One crew should be able to collect the sizemeasurements within a 10-day period each month.
47
A third proposal would also provide production forecasts ",'i th smallererrors and would have even smaller workload requirement. Detailed harvestinformation would be obtained each year for a sample of blocks (about 100 ofeach type). Photography would be taken in approximately half of these blocksand limb COtnlts in only a sample of the photography blocks. Fruit size anddroppage should be collected for all limb COtnltblocks. The harvest infonnationwould be used in a double sampling regression estimate similar to the approachoutlined in tilis report for photo COtnlts.
Samples of fruit should be analyzed to determine fruit maturity and fruitquality tilroughout the growing season. This type of information, along withdata on size distribution (and expected size distribution at maturity), mayprove as valuable as an'improved forecast of the citrus crop.
One item which must be completed before an operational survey can besuccessful is an evaluation of the completeness and accuracy of the Texas CitrusMutual listing as a sampling frame. Tree numbers have been estimated from the1969 trtmk measurement work and compared with numbers in the 1967 M.1tual listing.These comparisons suggest that a large number of blocks of each type should beselected for verification of tree munbers and completeness of the frame. Theblocks to be used for the field operations in the proposals above could then beselected from these blocks in the verification study. This would reduce tile costof the tree selection during the limh counting and photography portions of theproject.
Verification of tree numbers can best be perfonned during the fall andwinter months when the early orange and Valencia orange trees are more easilydistinguished. Such a schedule would also provide work between the sizingand droppage visits for the field crews.
48
APPENDIX AFruit Size and Weight Regression Results
Some of the regression correlation results of the 1969 fruit size studyare shown in the following tables. Regression calculations were perfonnedon fruit measured each month of the survey and weighed at harvesttime. Similarresults can be found in appendix D of the 1968 report, I~se of Photography andOther Objective Yield Procedures for Citrus Fruit," previously cited.
Average-size data in these tables might differ slightly from figurespresented in the body of this report which were converted to equivalent sizethe first day of the month. This conversion allowed easier comparisons with1968 data which had been similarly converted.
Size data in these tables are reported as circumference in inches. Datacan be easily converted to diameter in inches if desired. Average size andstandard deviation of average size can be converted to diameter equivalents bymultiplying by 0.31831 (or by dividing by 3.14159). The slope of theregression line in equations predicting final size by earlier size would beunchanged by converting to diameter. However, intercept of the regression linemust be multiplied by 0.31831 to convert to a diameter prediction equation.
Weight data are in grams. If an equation predicting final weight basedon circumference were to be converted to a diameter basis, slope would bemultiplied by 3.14159 and intercept ,,,ouldremain the same.
49
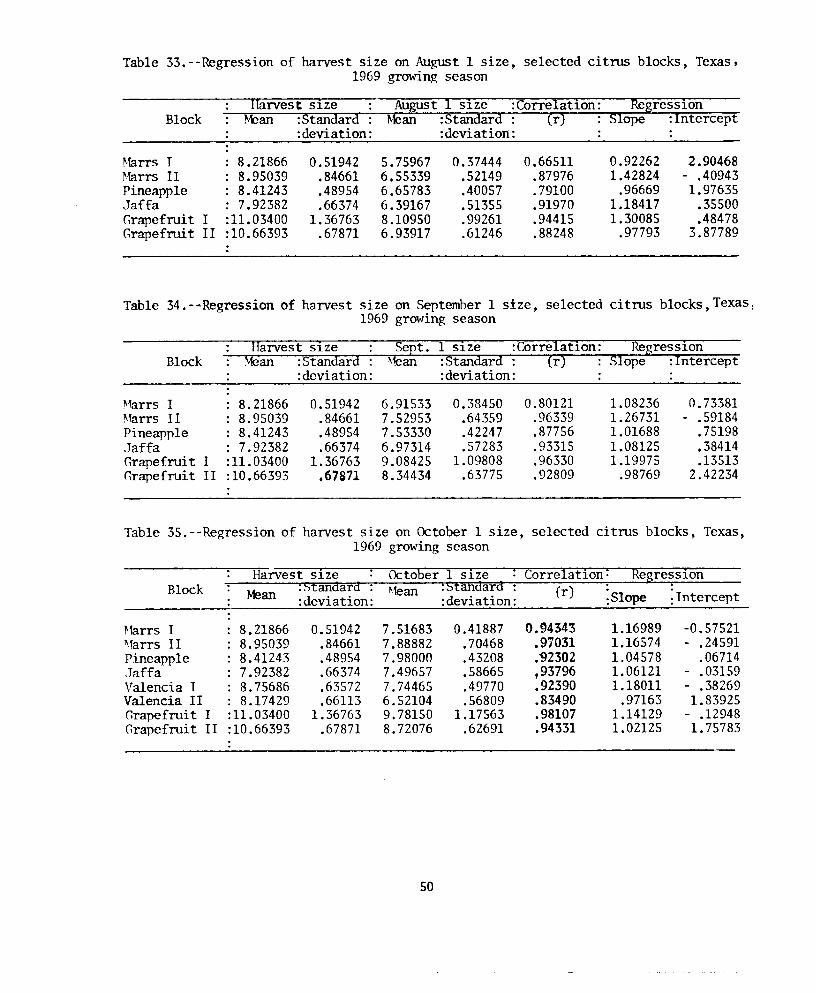
Table 33.--Regression of harvest size on August 1 size, selected citrus blocks, Texas,1969 growing season
Block
r-.1arrsI 8.21866 0.51942 5.75967 0.37444 0.66511 0.92262 2.90468~1arrs II 8.95039 .84661 6.55339 .52149 .87976 1.42824 - .40943Pineapple 8.41243 .48954 6.65783 .40057 .79100 .96669 1.97635Jaffa 7.92382 .66374 6.39167 .51355 .91970 1.18417 .35500Grapefruit I :11.03400 1.36763 8.10950 .99261 .94415 1.30085 .48478Grapefruit II :10.66393 .67871 6.93917 .61246 .88248 .97793 3.87789
Table 34.--Regression of harvest size on September 1 size, selected citrus blocks, Texas,1969 growing season
Block
Harrs I 8.21866 0.51942 6.91533 0.38450 0.80121 1.08236 0.73381~farrs II 8.95039 .84661 7.52953 .64359 .96339 1.26731 - .59184Pineapple 8.41243 .48954 7.53330 .42247 .87756 1.01688 .75198Jaffa : 7.92382 .66374 6.97314 .57283 .93315 1.08125 .38414Grapefruit I :11.03400 1.36763 9.08425 1.09808 .96330 1.19975 .13513Grapefruit II :10.66393 .67871 8.34434 .63775 .92809 .98769 2.42234
Table 35.--Regression of harvest size on October 1 size, selected citrus blocks, Texas,1969 growing season
Harvest size October 1 size Correlation: RegressionBlock Mean :~t:andard : Mean :St:andard (r) ;S1ope:deviation: :deviation: :Intercept
Marrs I 8.21866 0.51942 7.51683 0.41887 O.g434~ 1.16989 -0.57521~larrs II 8.95039 .84661 7.88882 .70468 .91031 1.16574 - .24591Pineapple 8.41243 .48954 7.98000 .43208 .92302 1.04578 .06714Jaffa 7.92382 .66374 7.49657 .58665 ,93796 1.06121 - .03159Valencia I 8.75686 .63572 7.74465 .49770 .92390 1.18011 - .38269Valencia II 8.17429 .66113 6.52104 .56809 .83490 .97163 1.83925Grapefruit I :11.03400 1.36763 9.78150 1.17563 .98107 1.14129 - .12948Grapefruit II :10.66393 .67871 8.72076 .62691 .94331 1.02125 1.75783
50
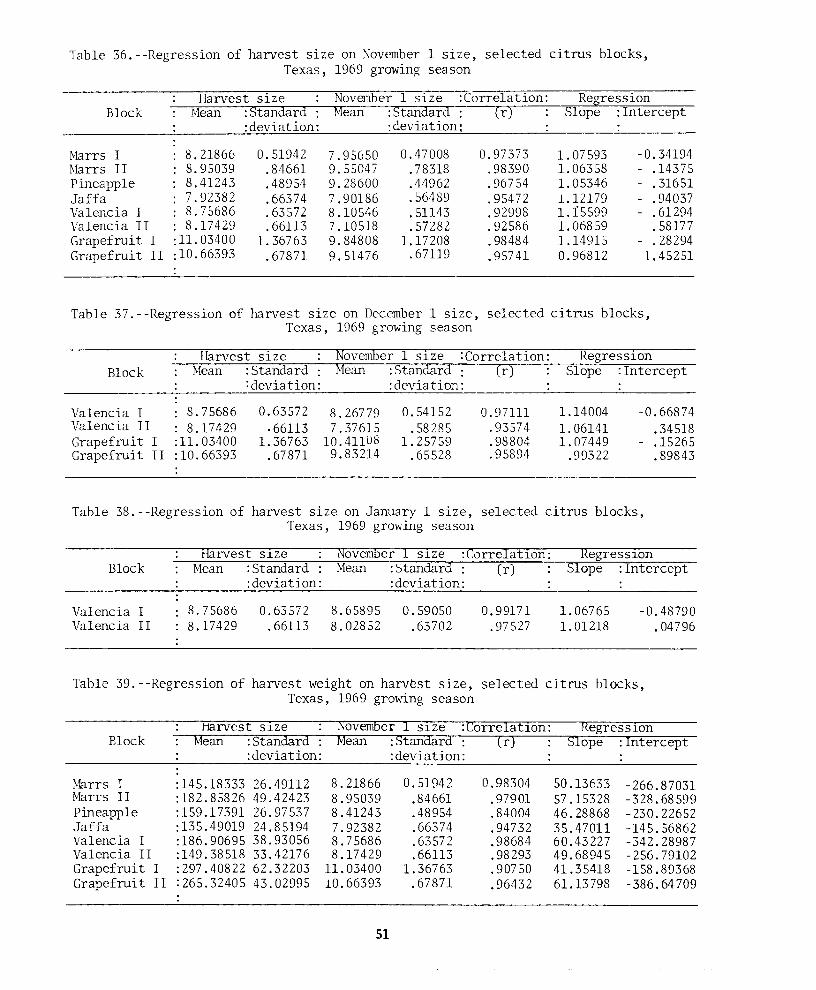
Table 36.--Regression of harvest size on November 1 size, selected citrus blocks,Texas, 1969 growing season
Harvest November 1 size :Correlation: Re ressionBlock Mean ean :Stan ar r Slope :Intercept
:deviation:
Marrs I 8. 21866 0.51942 7.95650 0.47008 0.97373 1. 07593 -0.34194Marrs II 8.95039 .84661 9.55047 .78318 .98390 1.06358 - .14375Pineapple 8.41243 .48954 9.28600 .44962 .96754 1.05346 .31651Jaffa 7.92382 .66374 7.90186 .56489 .95472 L 12179 .94037Valencia I 8.75686 .63572 8.10546 .51143 .92998 1.15599 - .61294Valencia II : 8.17429 .66113 7.10518 .57282 .92586 1.06859 .58177Grapefruit I :11.03400 1. 36763 9.84808 1.17208 .98484 1.14915 - .28294Grapefruit II :10.66393 .67871 9.51476 .67119 .95741 0.96812 1.45251
Table 37.--Regression of harvest size on December 1 size, selected citrus blocks,Texas, 1969 growing season
BlockHarvest size
Mean :Standard::deviation:
November 1 size :Correlation:Mean :Standard: (r)
:deviation:
RegressionSlope :Intercept
Valencia IValencia IIGrapefruit IGrapefruit II
8.75686: 8.17429:11.03400:10.66393
0.63572·66113
1.36763.67871
8.267797.37615
10.411U89.83214
0.54152.58285
1. 25759.65528
0.97111.93574.98804.95894
1.140041.061411. 07449
.99322
-0.66874.34518
- .15265.89843
Table 38.--Regression of harvest size on January 1 size, selected citrus blocks,Texas, 1969 growing season
BlockHarvest Slze
Mean :Standard::deviation:
November 1 Slze :Corre1atlon:Mean :~tandard: (r)
:deviation:
RegresslonSlope :Intercept
Valencia IValencia II
8.75686 0.635728.17429 .66113
8.658958.02852
0.59050.63702
0.99171.97527
1. 067651.01218
-0.48790.04796
Table 39.--Regression of harvest weight on harvest size, selected citrus blocks,Texas, 1969 growing season
Harvest SHe November 1 Slze :CorrelatlOn: RegresslOnBlock Mean :Standard : Mean :Standard (r) Slope :Intercept
:deviation: :deviation:Marrs I :145.18333 26.49112 8.21866 o . 51942 0.98304 50.13633 -266.87031Marrs II :182.85826 49.42423 8.95U39 .84661 .97901 57.15328 -328.68599Pineapple :159.17391 26.97537 8.41243 .48954 .84004 46.28868 -230.22652Jaffa :135.49019 24.85194 7.92382 .66374 .94732 35.47011 -145.56862Valencia I :186.90695 38.93056 8.75686 .63572 .98684 60.43227 -342.28987Valencia II :149.38518 33.42176 8.17429 .66113 .98293 49.68945 -256.79102Grapefruit I :297.40822 62.32203 11.03400 1.36763 .90750 41.35418 -158.89368Grapefruit II :265.32405 43.02995 10.66393 .67871 .96432 61.13798 -386.64709
Sl
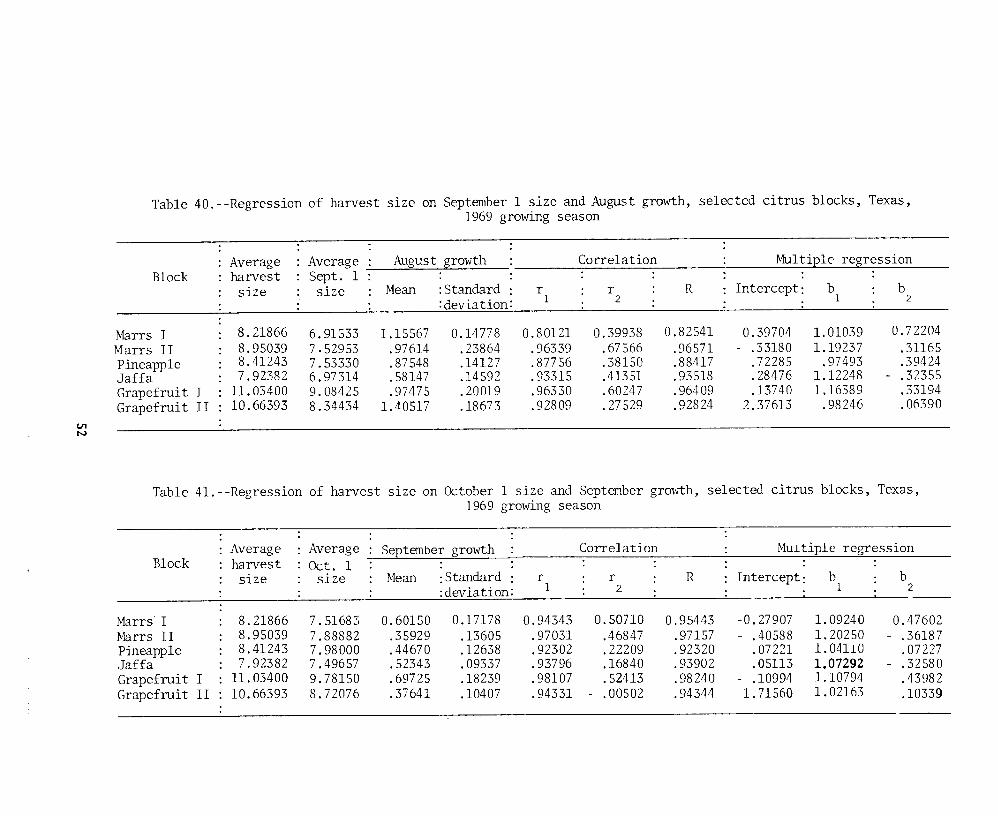
Table 40.--Regression of harvest size on September 1 size and August growth, selected citrus blocks, Texas,1969 growing season
Average Average August growth Correlation ~1u1tiple regressionBlock harvest Sept. 1
size size Mean :Standard r r R Intercept: b b:deviation: 1 2 1 2
Marrs I 8.21866 6.91533 1.15567 0.14778 0.80121 0.39938 0.82541 0.39704 1.01039 0.72204Marrs II 8.95039 7.52953 .97614 .23864 .96339 .67566 .96571 .33180 1.19237 .31165Pineapple 8.41243 7.53330 .87548 .14127 .87756 .38150 .88417 .72285 .97493 .39424Jaffa 7.92382 6.97314 .58147 .14592 .93315 .41351 .93518 .28476 1.12248 .32355Grapefruit I 11. 03400 9.08425 .97475 .20019 .96330 .60247 .96409 .13740 1.16389 .33194Grapefruit II 10.66393 8.34434 1.40517 .18673 .92809 .27529 .92824 2.37613 .98246 .06390
V1N
Table 41.--Regression of harvest size on October 1 size and September growth, selected citrus blocks, Texas,1969 growing season
Average Average September growth Correlation MUltiple regressionBlock harvest Oct. 1
size size Mean :Standard : r r R Intercept: b b:deviation: 1 2 1 2
Marrs I 8.21866 7.51683 0.60150 0.17178 0.94343 0.50710 0.95443 -0.27907 1. 09240 0.47602Marrs II 8.95039 7.88882 .35929 .13605 .97031 .46847 .97157 .40588 1. 20250 .36187Pineapple 8.41243 7.98000 .44670 .12638 .92302 .22209 .92320 .07221 1. 04110 .07227Jaffa 7.92382 7.49657 .52343 .09337 .93796 .16840 .93902 .05113 1.07292 .32 580Grapefruit I 11.03400 9.78150 .69725 .18239 .98107 .52413 .98240 .10994 1.10794 .43~82Grapefruit II 10.66393 8.72076 .37641 .10407 .94331 .00502 .94344 1.71560 1.02163 .10339
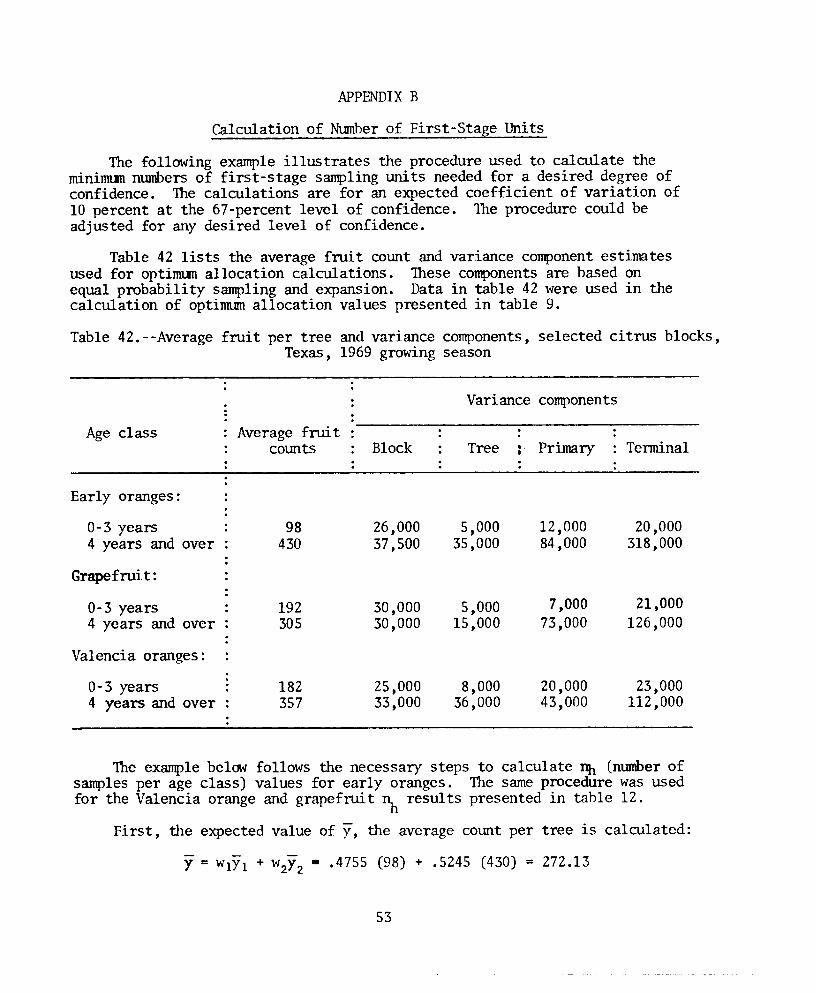
APPENDIX BCalculation of Number of First-Stage Units
The following example illustrates the procedure used to calculate theminimum numbers of first-stage sampling units needed for a desired degree ofconfidence. The calculations are for an expected coefficient of variation of10 percent at the 67-percent level of confidence. The procedure could beadjusted for any desired level of confidence.
Table 42 lists the average fruit count and variance component estimatesused for optimum allocation calculations. These components are based onequal probability sampling and expansion. Data in table 42 were used in thecalculation of optimum allocation values presented in table 9.Table 42.--Average fruit per tree and variance components, selected citrus blocks,
Texas , 1969 growing season
Variance componentsAge class Average frui t
counts Block Tree Primary Terminal
Early oranges:0- 3 years4 years and over
Grapefrui t :0- 3 years4 years and over
Valencia oranges:0-3 years4 years and over
98430
192305
182357
26,00037,500
30,00030,000
25,00033,000
5,00035,000
5,00015,000
8,00036,000
12,00084,000
7,00073,000
20,00043,000
20,000318,000
21,000126,000
23,000112,000
The example below follows the necessary steps to calculate ~ (number ofsamples per age class) values for early oranges. The same procedure was usedfor the Valencia orange and grapefruit ~ results presented in table 12.
First, the expected value of y, the average count per tree is calculated:Y = wlYl + w2Y2 • .4755 (98) + .5245 (430) = 272.13
53
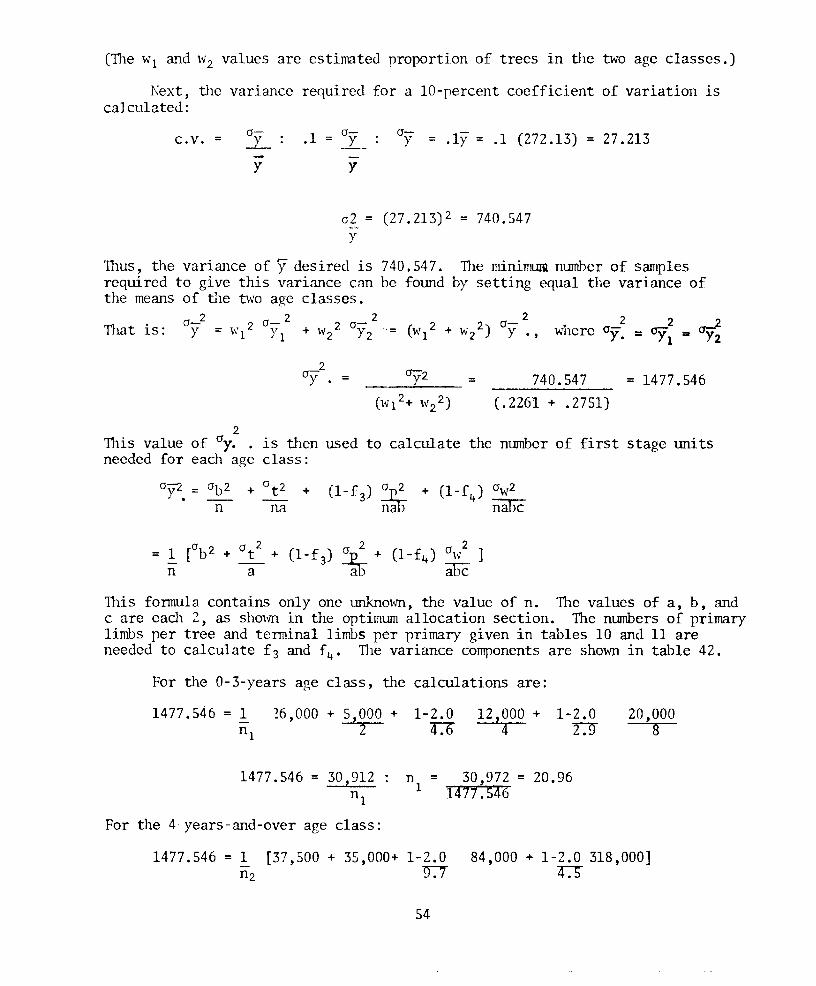
(The WI and "'2values are cstimated proportion of trees in Ule two age classes.)Kext, U1C variance required for a 10-percent coefficient of variation is
calculated:c.v. = 0-
Y-y
.1 0-ly
0- -Y = .ly = .1 (272.13) = 27.213
02 = (27.213)2 = 740.547Y
Thus, the variance of y desired is 740.547. The minimum number of samplesrequired to give this variance can bc found by setting equal the variance ofthe means of tiletwo age classes.
0_2 2 0- 2 2 0- 2 2 2 0- 2 2 2 2That is: y = \vl YI + w2 Y2 - (WI + w2) y., where 0y. = Of1 = '9'2
20y . = = 740.547(.2261 + .2751)
= 1477.546
2This value of 0y.. is then used to calculate the number of first stage unitsneeded for each age class:
+
o 2 0 2 0 2 0 2= l [b + _t_ + (1-f3) ~ + (1-f4) W ]
n a --a.D abcThis formula contains only one unknown, the value of n. The values of a, b, andc are each 2, as shmm in the optimum allocation section. The nLunbers of primarylimbs per tree and terminal limbs per primary given in tables 10 and 11 areneeded to calculate f3 and f4' The variance components are sho~~ in table 42.
For the 0-3-years age class, the calculations are:1477.546 = 1
ni~6,000 + 5,000 +
21-2.0U
12,000 +4
1-2.0z:g 20,0008
1477.546 = 30,912 :ni
For the 4 years-and-over age class:
n =1
30,972 = 20.961477.546
1477.546 = 1n2
[37,500 + 35,000+ 1-2.09:1
54
84,000 + 1-2.0 318,000]n
1477.546 = 94,857n2
n2 94,857 = 64.201447.546
Values of nl and n2 are ShO\Vll in table 12.
S5
~--~~~~~---------- ._----_._~~--~------
UNITED STATES DEPARTMENT OF AGRICULTUREWASHINGTON, D.C. 202S0
OFFICIAL BUSINESS
PENALTY FOR PRIVATE USE, S300
POSTAGE AND FEES PAIDU.S. DEPARTMENT OF
AGRICULTUREU.S.MAIL
-----------_._--------_.,-------~-~-------_. ----- ..----------------------------