Embed Size (px)
Citation preview
i
qwertyuiopasdfghjklzxcvbnmqwertyui

ii
Recommended citation: Dr. Suresh Tiwari, Hema Bhatt, Dr. Timothy Ensor, Dr. Bal Krishna Suvedi, Tomas Lievens, Dr. Chris James, and Dr. Sharad Kumar Sharma. Unit cost analysis of the health facility reimbursement made under the Aama Programme. Ministry of Health and Population/Family Health Division and Nepal Health Sector Support Programme.
Prepared by Family Health Division Department of Health Services Ministry of Health and Population Teku, Kathmandu, Nepal Tel +977-1- 4262155, Fax +977-1- 4256181 www.dohs.gov.np Supported by Nepal Health Sector Support Programme Ministry of Health and Population Ramshahpath, Kathmandu, Nepal Tel - +977-1-4264250, 4262110 www.nhssp.org.np [email protected]
Disclaimer: All reasonable precautions have been taken by the Ministry of Health and Population
(MoHP), Family Health Division (FHD), and Nepal Health Sector Support Programme (NHSSP) to verify
the information contained in this publication. However, this published material is being distributed
without warranty of any kind, either expressed or implied. The responsibility for the interpretation and
use of the material lies with the reader. In no event shall the MoHP, FHD, and NHSSP be liable for
damages arising from its use.

iii
ACKNOWLEDGEMENTS
The unit cost analysis of the health facility reimbursement made under the Aama Programme was
conducted by the FHD, Department of Health Services (DoHS), with technical support from the
NHSSP/Oxford Policy Management (OPM). First of all we would like to offer our sincere thanks to Dr.
Pushpa Chaudhary for her continuous support in implementing and finalising the study. We are very
thankful to Dr. Kiran Regmi, former director of the FHD, who requested that NHSSP conduct this study.
We appreciate the support from Dr. Shilu Aryal, Chief of Safe Motherhood, and Mr. Paban Ghimire,
Chief of Demography. We also appreciate the inputs from Mr. Baburam Humangain and Mr. Navin
Adhikari for their help in designing the questionnaire and training the field assistants. We are also
thankful to Ms. Dhana Basnet and Ms Banu Kandel for their inputs in training and field supervision. Our
special thanks go to the field assistants for their hard work in collecting the data.
Finally, we would like to acknowledge the valuable contributions of those who were involved in
preparing and reviewing this document. Useful inputs have been provided by representatives’ external
development partners and professional organisations.
Study Team
October 2015

iv
EXECUTIVE SUMMARY
The Aama Programme is one of Nepal’s national flagship programmes aimed at increasing institutional
delivery and thereby improving maternal health outcomes. Since its launch ten years ago, the Aama
Programme has made a significant contribution to increasing institutional delivery. The Aama
Programme is primarily a Demand Side Financing (DSF) mechanism which includes incentives to women,
free institutional delivery for all types of deliveries, incentives to health workers, and incentives for
women who complete four antenatal care (4ANC) visits.
In July 2005, the Government of Nepal (GoN) launched the Maternity Incentive Scheme (MIS), which
was renamed the “Safe Delivery Incentive Programme” (SDIP) in August 2006. In January 2009, the GoN
removed user fees from all types of delivery in public health facilities nationwide and renamed the
programme ‘Aama’. An incentive for increasing the number of women accessing 4ANC visits (under the
4ANC scheme) was merged with the Aama Programme in July 2012.
In 2008, the unit cost1 for free institutional delivery was determined based on a review of the existing
fees, drugs, supplies, and charges for the different types of deliveries at health facilities. The Aama
Programme unit cost has not been revised since the programme was first launched in January 2009.
Several studies have raised concerns about the current rate of reimbursement provided. The Rapid
Assessment VII, for example, reported that women visiting some Aama implementing private
institutions were not receiving delivery care for free, with a proportion paying higher fees for
complicated and caesarean section (C-section) deliveries. This kind of evidence led to the suggestion by
some that private providers asked women to pay because the reimbursement level was too low.
The purpose of this study is to assess the adequacy of the current rate of reimbursement under the
Aama Programme in both public and private facilities. It further intends to:
a) determine the actual unit cost of providing delivery care and complication management
(complicated and C-section delivery) in public and private health facilities;
b) assess the adequacy of Aama unit costs provided to health facilities for normal, complicated,
and C-section deliveries, and
c) make some policy and programme-related recommendations for the future implementation of
the Aama Programme.
This costing study is designed to calculate the actual cost required for normal, complicated, and C-
section deliveries. The study is carried out from a healthcare systems perspective rather than a wider
societal perspective. It aims to provide comprehensive coverage of the facility cost (direct and indirect)
associated with all types of institutional deliveries. This includes all necessary drug and diagnostic costs,
but excludes household costs related to travelling to the facility. A mixed approach was used which
1 In this context “unit costs” refer to the reimbursement health facilities receive for performing services under the
Aama Programme.

v
utilised both ‘bottom-up’ costing methods to estimate the direct costs of all type of deliveries, and top-
down costing to estimate the associated indirect costs. Ten districts were purposively sampled for data
collection. Proportionate allocation as per the geographical region i.e. mountain (two), hill (five), and
Tarai (three) ensured that at least two districts from each development region were selected in the
sample. A random sample of the strata was first done to determine the sequence of the selection of
health facilities among the stratum. A total of 52 facilities, including 40 public and 12 private facilities,
were included to estimate the actual cost of all types of deliveries.
The current rate of reimbursement under the Aama Programme is 1,000/1,500 Nepalese Rupees (NPR)
for a normal delivery, NPR 3,000 for a complicated delivery, and NPR 7,000 for a C-section delivery. The
guideline intends to cover the direct cost of care for all types of deliveries. This study finds that the
current unit cost (reimbursement rate) is sufficient to cover the direct costs incurred by health facilities
participating in the Aama Programme.
This study shows that the average actual cost (direct and indirect) of a normal delivery in both public
and private facilities is NPR 2,889, NPR 4,422 for a complicated delivery, and NPR 11,181 for a C-section
delivery. When we consider the actual direct cost (actual cost in 2014 prices), the study concludes that
the current rate of reimbursement under the Aama Programme is sufficient to cover the direct costs of
all types of deliveries in both public and private facilities. It should be noted that the direct cost also
includes the human resources time cost required for providing delivery care. Furthermore, direct cost is
also associated with the treatment regime, prescribing pattern, use of drugs, and level of human
resources involved in providing delivery care. The average indirect cost of a normal delivery in a primary
health care centre (PHCC) and health post is found to be higher than that of a complicated delivery. This
is because only a small number of relatively productive PHCCs and health posts carry out complicated
deliveries which have a low unit cost. In contrast, many PHCCs and health posts (with low utilisation and
so high indirect unit costs) provide normal delivery services. A similar issue occurs in district facilities
where low throughput means that indirect unit costs are higher than in zonal and central level facilities.
The average cost of a normal delivery in private facility Mission/NGO/Cooperative, private (for profit),
and teaching hospitals is NPR 3,913, NPR 9,722, and NPR 2,796, respectively. The average cost of a
complicated delivery in Mission/NGO/Cooperative, private, and teaching hospitals is NPR 10,864, NPR
4,746, and NPR 5,816, respectively. The average cost of a C-section delivery in
Mission/NGO/Cooperative, private, and teaching hospitals is NPR 8,340, NPR 10,887, and NPR 13,264.
This study indicates that the cost of normal and complicated deliveries is lower in teaching hospitals
than elsewhere. However, the direct costs for all types of delivery are higher in teaching hospitals. This is
likely to be because of the involvement of more highly qualified staff and a variety of complication
management procedures. The direct costs in private facilities are close to the current reimbursement
rate of the Aama Programme.
The total actual cost of a normal delivery in the mountain region is NPR 7,534, in the hill region NPR
2,488, and in the Tarai region NPR 2,011. Similarly, the total actual cost of a complicated delivery in the

vi
mountains is NPR 12,639, in the hills NPR 3,483, and in the Tarai NPR 3,138. The total actual cost of a C-
section delivery in the mountains is NPR 23,242, in the hills NPR 9,654, and in the Tarai NPR 11,722. The
cost of normal and complicated deliveries in the Tarai is lower than that of both mountain and hill
regions but the cost of a C-section is higher, which is inflated by the larger number of private providers
and higher cost of some inputs.
The Aama guidelines stipulate that the participation of all public facilities functioning under the MoHP
that provide delivery services is mandatory. The guideline is also open to private facilities on a voluntary
basis. This study suggests that the current rate of reimbursement under the Aama Programme is
sufficient to compensate for the direct costs required for public/private, different levels of facility,
different levels of care, and for all geographical regions.
The study also suggests that a comprehensive national reproductive health clinical protocol should be
developed to ensure that delivery practices, drugs, prescribing patterns, involvement of trained health
workers, use of diagnostic services, and use of supplies in both public and private health facilities are
more uniformly applied. Linking Aama with other interventions such as the free essential drugs
programme would further increase value for money. A clearer guideline that sets out how facilities can
use savings from the current rate of reimbursement would also help improve the delivery services in
health facilities. The study also indicates that implementation of the Aama Programme in higher level
private hospitals would ensure value for money because of the high cost of complicated and C-section
deliveries in lower level private facilities. The detailed costs of delivery care provided in this study should
also be useful for a national social health insurance programme which would need both direct and
indirect costs to be reimbursed to accredited health facilities. Finally, findings from this study would be
useful evidence when designing the next generation of the Aama Programme.

vii
LIST OF ABBREVIATIONS
ANC antenatal care 4ANC four antenatal care visits (programme) ANM auxiliary nurse midwives APH antepartum haemorrhages ART antiretroviral therapy AWPB annual workplan and budget BC birthing centre BEONC basic emergency obstetrics and newborn (neonatal) care CEONC comprehensive emergency obstetrics and newborn (neonatal) care C-section caesarean section DHO district health office DPHO district public health officer DoHS Department of Health Services DSF demand-side financing DUDBC Department of Urban Development and Building Construction EDPs external development partners FHD Family Health Division GoN Government of Nepal HDI human development index LMD Logistics Management Division MDG millennium development goal MIS Maternity Incentive Scheme MoHP Ministry of Health and Population NPHL National Public Health Laboratory NPR Nepalese Rupees NSMP National Safe Motherhood Plan OPM Oxford Policy Management OT operating theatre PHCC primary health care centre PNC postnatal care PPH postpartum haemorrhages SDIP Safe Delivery Incentive Programme SBA skilled birth attendant SHP sub health post SM safe motherhood WHO World Health Organization

viii
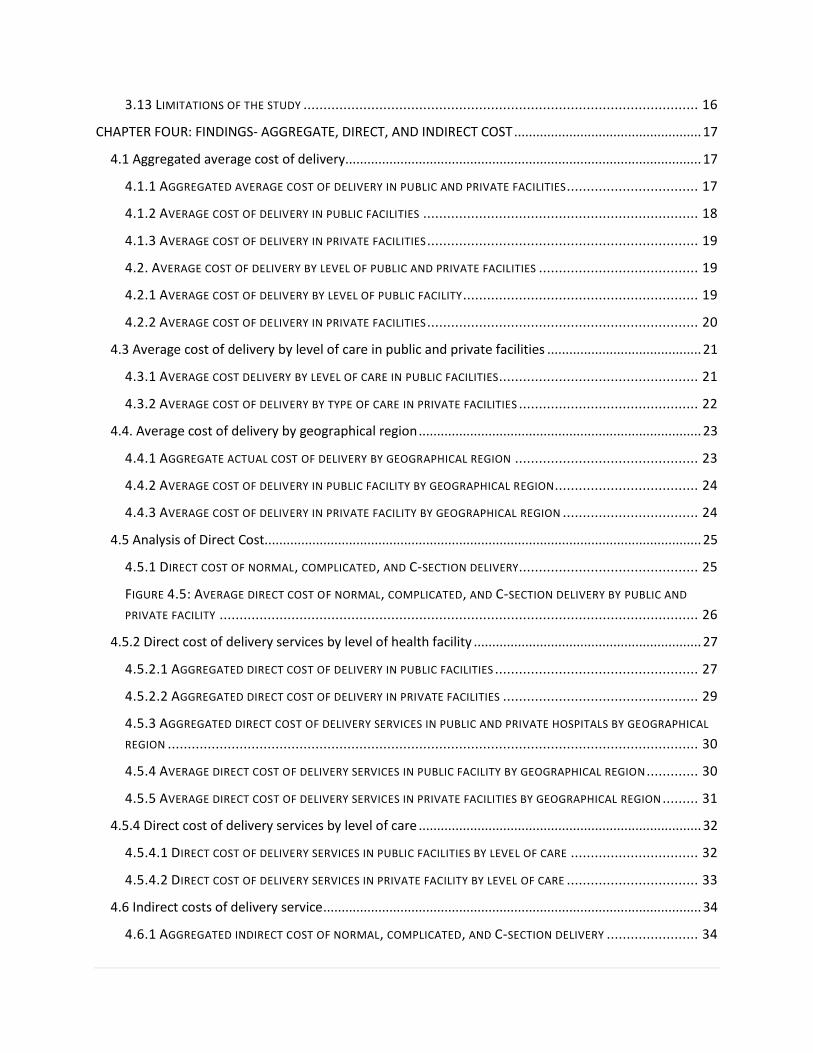
LIST OF FIGURES
Figure 1 Evolution of the Aama Programme Figure 2 Component of the Aama Programme Figure 3 Final list of complications for the study Figure 4 Standards used to define travel time and method of health facility selection Figure 4.1 Total cost of normal, complicated, and C-section delivery (n=52) Figure 4.2 Total cost of normal, complicated, and C-section delivery in public facilities (n=40) Figure 4.3 Average cost of delivery in private facilities (n=12) Figure 4.4 Aggregate actual cost of delivery by geographical region
LIST OF TABLES
Table 3.1: Recurrent and Capital cost for the costing study Table 3.2: Resource use identification, measurement, and valuation Table 3.3: Health facilities implementing the Aama Programme in the study districts Table 3.4: Total number of health facilities sampled for the study Table 4.1: Total cost of normal, complicated, and C-section deliveries by level of public facilities (n=40) Table 4.2: Total cost of normal, complicated and C-section deliveries in private facilities (n=12) Table 4.3: Average cost of delivery by level of care in public facilities (n=40) Table 4.4: Average cost of delivery by level of care in private facilities (n=12) Table 4.5: Average cost of delivery in public facilities by geographical region (n=40) Table 4.6: Average cost of delivery in private facilities by geographical region (n=12) Table 4.7: Direct cost of normal, complicated, and C-section delivery by public and private facility (n=52) Table 4.8: Direct cost of normal, complicated, and C-section delivery by public health facility (n=40) Table 4.9: Direct cost of normal, complicated, and C-section delivery in different private facilities (n=12) Table 4.10: Direct cost of normal, complicated, and C-section delivery by geographical region (n=52) Table 4.11: Direct cost of normal, complicated, and C-section delivery by geographical region in public facilities (n=40) Table 4.12: Direct cost of normal, complicated, and C-section delivery by geographical region in private facilities (n=12) Table 4.13: Direct cost of normal, complicated, and C-section delivery by level of care in public facilities (n=40) Table 4.14: Direct cost of normal, complicated, and C-section delivery in different private facilities (n=12) Table 4.15: Indirect cost of normal, complicated, and C-section delivery by items in public and private facilities (n=52) Table 4.16: Indirect cost of normal, complicated, and C-section delivery by type of public health facility (n=40) Table 4.17: Indirect cost of normal, complicated, and C-section delivery by private facility (n=12) Table 4.18: Indirect cost normal, complicated, and C-section delivery by geographical region (n=52) Table 4.19: Indirect cost of normal, complicated, and C-section delivery in public facilities by geographical region (n=40) Table 4.20: Indirect cost of normal, complicated, and C-section delivery in private facilities by geographical region (n=12) Table 4.21: Indirect cost of normal, complicated, and C-section delivery by level of care in public facilities Table 4.22: Indirect cost of normal, complicated, and C-section delivery by level of care in private facilities (n=12)

TABLE OF CONTENTS ACKNOWLEDGEMENTS ............................................................................................................................ iii
EXECUTIVE SUMMARY ............................................................................................................................. iv
LIST OF ABBREVIATIONS ......................................................................................................................... vii
LIST OF FIGURES ..................................................................................................................................... viii
LIST OF TABLES ....................................................................................................................................... viii
CHAPTER ONE: BACKGROUND AND INTRODUCTION ................................................................................... 1
1.2 Background ......................................................................................................................................... 1
1.1 MATERNAL HEALTH IN NEPAL .................................................................................................... 1
1.2 EVOLUTION OF THE AAMA PROGRAMME ...................................................................................... 1
CHAPTER TWO: RATIONALE OF THE STUDY .................................................................................................. 4
2.1 Introduction ........................................................................................................................................ 4
2.2 Rationale ............................................................................................................................................. 4
CHAPTER THREE: OBJECTIVE AND METHODOLOGY ..................................................................................... 6
3.1 Purpose and objectives of the costing study ...................................................................................... 6
3.2 Perspective of costing ......................................................................................................................... 6
3.3 Approach to the costing study ............................................................................................................ 6
3.4 Defining health services for costing .................................................................................................... 6
3.4.1 COSTED CONDITIONS ............................................................................................................. 6
3.4.2 COMPLICATIONS ................................................................................................................... 7
3.4.3 HEALTH FACILITY OWNERSHIP, TYPE, AND GEOGRAPHICAL REGION .................................................. 7
3.5 IDENTIFICATION AND CLASSIFICATION OF RESOURCE ITEMS ............................................................... 8
3.5.1 DIRECT COST ....................................................................................................................... 8
3.5.2 INDIRECT COST ..................................................................................................................... 9
3.6 MEASUREMENT OF RESOURCE USE .............................................................................................. 9
3.7 MAJOR ASSUMPTIONS IN THE STUDY ......................................................................................... 11
3.8 SAMPLING STRATEGY AND SAMPLE SIZE ...................................................................................... 11
3.9 DATA COLLECTION METHOD ..................................................................................................... 14
3.10 DATA COLLECTION INSTRUMENTS ........................................................................................... 14
3.11 DATA MANAGEMENT ............................................................................................................ 15
3.12 DATA ANALYSIS ................................................................................................................... 15
3.13 LIMITATIONS OF THE STUDY ................................................................................................... 16
CHAPTER FOUR: FINDINGS- AGGREGATE, DIRECT, AND INDIRECT COST ................................................... 17
4.1 Aggregated average cost of delivery................................................................................................. 17
4.1.1 AGGREGATED AVERAGE COST OF DELIVERY IN PUBLIC AND PRIVATE FACILITIES ................................. 17
4.1.2 AVERAGE COST OF DELIVERY IN PUBLIC FACILITIES ..................................................................... 18
4.1.3 AVERAGE COST OF DELIVERY IN PRIVATE FACILITIES .................................................................... 19
4.2. AVERAGE COST OF DELIVERY BY LEVEL OF PUBLIC AND PRIVATE FACILITIES ........................................ 19
4.2.1 AVERAGE COST OF DELIVERY BY LEVEL OF PUBLIC FACILITY ........................................................... 19
4.2.2 AVERAGE COST OF DELIVERY IN PRIVATE FACILITIES .................................................................... 20
4.3 Average cost of delivery by level of care in public and private facilities .......................................... 21
4.3.1 AVERAGE COST DELIVERY BY LEVEL OF CARE IN PUBLIC FACILITIES.................................................. 21
4.3.2 AVERAGE COST OF DELIVERY BY TYPE OF CARE IN PRIVATE FACILITIES ............................................. 22
4.4. Average cost of delivery by geographical region ............................................................................. 23
4.4.1 AGGREGATE ACTUAL COST OF DELIVERY BY GEOGRAPHICAL REGION .............................................. 23
4.4.2 AVERAGE COST OF DELIVERY IN PUBLIC FACILITY BY GEOGRAPHICAL REGION .................................... 24
4.4.3 AVERAGE COST OF DELIVERY IN PRIVATE FACILITY BY GEOGRAPHICAL REGION .................................. 24
4.5 Analysis of Direct Cost....................................................................................................................... 25
4.5.1 DIRECT COST OF NORMAL, COMPLICATED, AND C-SECTION DELIVERY............................................. 25
FIGURE 4.5: AVERAGE DIRECT COST OF NORMAL, COMPLICATED, AND C-SECTION DELIVERY BY PUBLIC AND
PRIVATE FACILITY ........................................................................................................................ 26
4.5.2 Direct cost of delivery services by level of health facility .............................................................. 27
4.5.2.1 AGGREGATED DIRECT COST OF DELIVERY IN PUBLIC FACILITIES ................................................... 27
4.5.2.2 AGGREGATED DIRECT COST OF DELIVERY IN PRIVATE FACILITIES ................................................. 29
4.5.3 AGGREGATED DIRECT COST OF DELIVERY SERVICES IN PUBLIC AND PRIVATE HOSPITALS BY GEOGRAPHICAL
REGION ..................................................................................................................................... 30
4.5.4 AVERAGE DIRECT COST OF DELIVERY SERVICES IN PUBLIC FACILITY BY GEOGRAPHICAL REGION ............. 30
4.5.5 AVERAGE DIRECT COST OF DELIVERY SERVICES IN PRIVATE FACILITIES BY GEOGRAPHICAL REGION ......... 31
4.5.4 Direct cost of delivery services by level of care ............................................................................. 32
4.5.4.1 DIRECT COST OF DELIVERY SERVICES IN PUBLIC FACILITIES BY LEVEL OF CARE ................................ 32
4.5.4.2 DIRECT COST OF DELIVERY SERVICES IN PRIVATE FACILITY BY LEVEL OF CARE ................................. 33
4.6 Indirect costs of delivery service ....................................................................................................... 34
4.6.1 AGGREGATED INDIRECT COST OF NORMAL, COMPLICATED, AND C-SECTION DELIVERY ....................... 34

4.6.2 Indirect cost of normal, complicated, and C-section delivery by level of health facility ............... 35
4.6.2.1 INDIRECT COST OF NORMAL, COMPLICATED, AND C-SECTION DELIVERY IN PUBLIC FACILITY BY LEVEL . 35
4.6.2.2 INDIRECT COST OF NORMAL, COMPLICATED, AND C-SECTION DELIVERY IN PRIVATE FACILITIES BY LEVEL
............................................................................................................................................... 36
4.6.2.3 AVERAGE INDIRECT COST OF NORMAL, COMPLICATED, AND C-SECTION DELIVERY BY GEOGRAPHICAL
REGION ..................................................................................................................................... 37
4.6.2.4 AVERAGE INDIRECT COST OF NORMAL, COMPLICATED, AND C-SECTION DELIVERY IN PUBLIC FACILITIES
BY GEOGRAPHICAL REGION ............................................................................................................ 38
4.6.2.5 AVERAGE INDIRECT COST OF NORMAL, COMPLICATED, AND C-SECTION DELIVERY IN PRIVATE FACILITIES
BY GEOGRAPHICAL REGION ............................................................................................................ 39
4.6.2.6 Average Indirect cost of normal, complicated, and C-section delivery by level of care in public
facility ...................................................................................................................................................... 39
CHAPTER FIVE: CONCLUSION AND RECOMMENDATIONS .......................................................................... 41
5.1 Conclusion ......................................................................................................................................... 41
5.1.1 ACTUAL COST OF NORMAL, COMPLICATED, AND C-SECTION DELIVERY IN PUBLIC AND PRIVATE FACILITIES
............................................................................................................................................... 41
5.1.2 SUFFICIENCY OF THE CURRENT RATE OF REIMBURSEMENT AGAINST AAMA PROGRAMME GUIDELINES ... 43
5.2 Way Forward ..................................................................................................................................... 44
REFERENCES ............................................................................................................................... 47
ANNEX I: STANDARD DEFINITION OF COMPLICATIONS ....................................................................... 49
ANNEX II: CONDITIONS LISTED FOR COMPLICATED AND C-SECTION IN THE AAMA PROGRAMME ............... 51
ANNEX III: 75 DISTRICTS STRATIFIED BY FUNCTIONALITY OF CEONC AND C-SECTION FACILITY IN PRIVATE 52
ANNEX IV: GOVERNMENT HEALTH FACILITIES STATUS OF THE STUDY DISTRICTS ...................................... 54
ANNEX V: DETAILS OF HEALTH FACILITIES IN THE STUDY DISTRICT ........................................................ 55
ANNEX VI: DIRECT COST OF COMPLICATION .................................................................................... 57

1 | P a g e
CHAPTER ONE: BACKGROUND AND INTRODUCTION
1. Background
1.1 Maternal health in Nepal
Over the last decade Nepal has made impressive progress in improving maternal and infant health. From
1996 to 2011, there has been a significant reduction in the maternal mortality ratio from 539 to 170
deaths per 100,000 live births and in the infant mortality ratio from 108 to 46 deaths per 1,000 live
births. Similarly, skilled attendant care at delivery has increased from 9% to 36% (MoHP, 2012). Several
factors may have contributed to these improvements, including declining poverty levels and fertility
ratios, the steady rise in female education, an increased use of modern contraceptives, skilled birth
attendance, C-section deliveries, and abortion services. However, investments in maternal health
services through both demand and supply side interventions are believed to be significant contributors
(Jackson et al., 2010).
1.2 Evolution of the Aama Programme
In July 2005, the GoN realised the importance of increasing the demand for and use of institutional
delivery services and introduced a policy guideline called the Maternity Incentive Scheme (MIS) (FHD,
2005). This programme aimed to reduce maternal and neonatal mortality and morbidity by improving
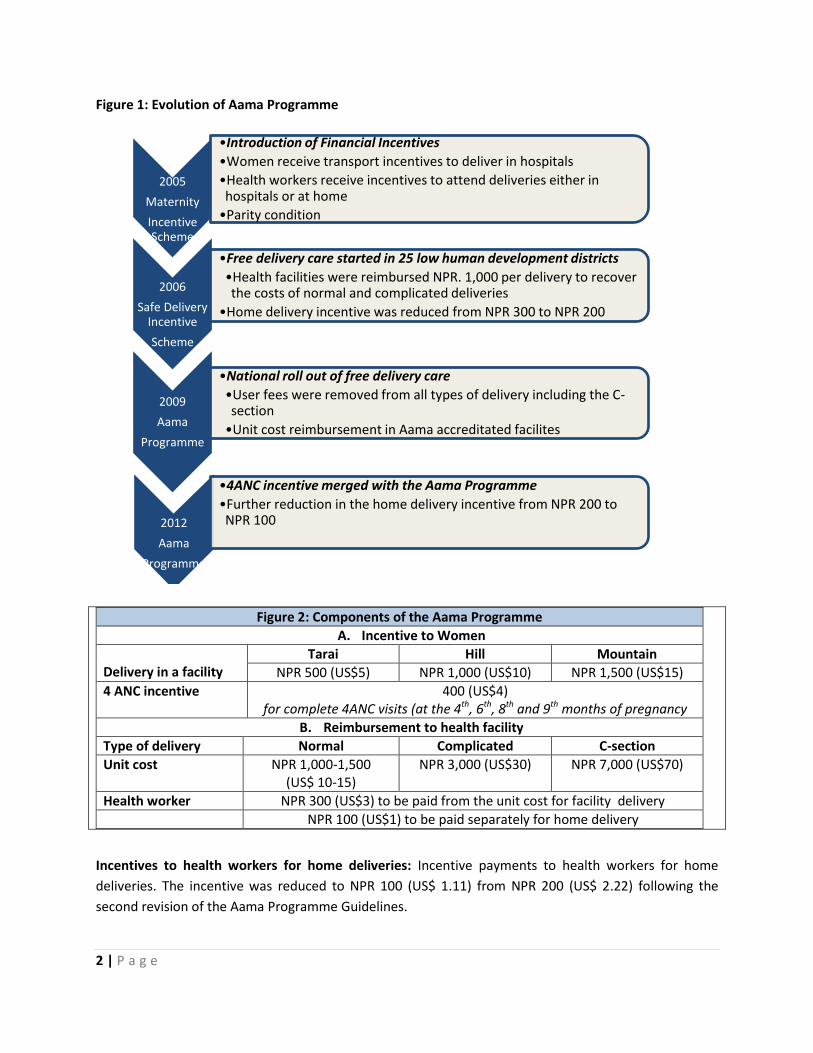
equity and access to essential maternal health services via reducing financial barriers. Figure 1
summarises the evolution of the Aama Programme (FHD, 2006; FHD, 2009; FHD, 2012).
The Aama Programme currently provides funds to participating institutions for the following:
Incentives to women: Cash payments to women immediately following their institutional deliveries-
NPR 1,500 (US$ 15)2 in mountain districts, NPR 1,000 (US$ 10) in hill districts, and NPR 500 (US$ 5) in
Tarai districts.
Free institutional delivery services: Payments to health facilities for the provision of free care. The
payment, referred to as ‘the Aama unit costs’, varies by type of delivery. For a normal delivery, health
facilities with fewer than 25 beds receive NPR 1,000 (US$ 11.11) while health facilities with 25 or more
beds receive NPR 1,500 (US$ 16.67). For complicated deliveries, health facilities receive NPR 3,000 (US$
33.33) and NPR 7,000 (US$ 77.78) for C-sections. The Aama unit cost should cover the cost of medical
commodities (such as essential drugs, tests, and supplies) personnel, and overhead costs e.g. electricity
and water.
2 US$1= NPR 100
2 | P a g e
Figure 1: Evolution of Aama Programme
Figure 2: Components of the Aama Programme
A. Incentive to Women
Delivery in a facility
Tarai Hill Mountain
NPR 500 (US$5) NPR 1,000 (US$10) NPR 1,500 (US$15)
4 ANC incentive 400 (US$4) for complete 4ANC visits (at the 4th, 6th, 8th and 9th months of pregnancy
B. Reimbursement to health facility
Type of delivery Normal Complicated C-section
Unit cost NPR 1,000-1,500 (US$ 10-15)
NPR 3,000 (US$30) NPR 7,000 (US$70)
Health worker NPR 300 (US$3) to be paid from the unit cost for facility delivery
NPR 100 (US$1) to be paid separately for home delivery
Incentives to health workers for home deliveries: Incentive payments to health workers for home
deliveries. The incentive was reduced to NPR 100 (US$ 1.11) from NPR 200 (US$ 2.22) following the
second revision of the Aama Programme Guidelines.
2005
Maternity
Incentive Scheme
•Introduction of Financial Incentives
•Women receive transport incentives to deliver in hospitals
•Health workers receive incentives to attend deliveries either in hospitals or at home
•Parity condition
2006
Safe Delivery Incentive
Scheme
•Free delivery care started in 25 low human development districts
•Health facilities were reimbursed NPR. 1,000 per delivery to recover the costs of normal and complicated deliveries
•Home delivery incentive was reduced from NPR 300 to NPR 200
2009
Aama
Programme
•National roll out of free delivery care
•User fees were removed from all types of delivery including the C-section
•Unit cost reimbursement in Aama accreditated facilites
2012
Aama
Programme
•4ANC incentive merged with the Aama Programme
•Further reduction in the home delivery incentive from NPR 200 to NPR 100

3 | P a g e
Incentives to pregnant women for 4ANC visits: Women receive NPR 400 (US$ 4.44) if they complete
four ANC visits (at the 4th, 6th, 8th and 9th months of pregnancy), have an institutional delivery, and make
one postnatal care (PNC) visit. The second revision of the Aama guidelines merged the 4ANC incentives
with the Aama Programme.

4 | P a g e
CHAPTER TWO: RATIONALE OF THE STUDY
2.1 Introduction
The unit costs for free delivery care under the Aama Programme were determined on the basis of a
review of the existing capital cost, fees, and charges for the different types of deliveries at health
facilities (unpublished work of FHD, 2009). Some of this information was derived from a study on coping
with the burden of cost of maternity care conducted in 2003 (Borghi et al., 2004). The costs were
divided into the following four components:
1. General health institution costs, reflecting the cost of personnel and running costs of each
institution
2. Supply costs (drugs , gloves, syringes, etc.) based on a review of the cost in health facilities
which was cross matched with existing studies
3. An allowance for minor quality improvements, including general incentives for staff
4. Capital costs of equipment which covered delivery-specific costs of equipment required to
provide the appropriate level of care - the costs were based on a compilation of the basic
equipment packages, apportioned to delivery care and divided by the expected number of
deliveries.
The following two principal sources of fund flow were considered:
1. Regular budgets allocated through district health offices (DHOs) and district public health
officers (DPHOs), primarily to finance personnel costs but also to provide resources to meet
running costs and medical supplies of health facilities
2. Additional funding based on the proposed unit costs
An analysis carried out by Ensor and Witter (2008) reported that the Aama Programme’s unit cost
payments, together with the budget from the public, were sufficient to offset the recurrent costs to
facilities. The authors suggested that the costs of complications would largely be covered by the
proposed payments and budget funding (Ensor T. and Witter S., 2008). However, they also noted that
the Aama unit cost payments were insufficient to offset the capital costs of deliveries and that without
additional funding it might not be possible for facilities to obtain or replace capital equipment.
2.2 Rationale
The Aama Programme’s unit costs have not been revised since the programme was first launched in
January 2009. Several studies have raised concerns about the current level of Aama unit costs. For
example, health workers surveyed in the Aama Rapid Assessment round VII (Upreti et al., 2013)

5 | P a g e
suggested that Aama unit costs for C-sections and RH negative blood type cases (a complication listed
under the Aama Programme, which is to be covered for free) were not sufficient to cover the actual cost
of care. Likewise, personnel at private hospitals who were visited to explore the reason behind
discontinuing the Aama Programme said that the unit cost provided was insufficient to deliver quality
care (Upreti et al., 2013).
The Rapid Assessment VII also found that women visiting Aama implementing private institutions were
not receiving delivery care for free and that many women reported paying for drugs and cleaning
services. The proportion paying was higher for complicated and C-section deliveries. This was also found
to be the case at some public facilities. This mounting evidence, in light of a possible further expansion
of the scheme to include more private facilities, constitutes the study rationale to re-examine the Aama
unit costs.

6 | P a g e
CHAPTER THREE: OBJECTIVE AND METHODOLOGY
This chapter describes the objectives and methodology of the study. A more detailed description of the
methodology as used in the study protocol can be obtained from www.nhssp.org.np.
3.1 Purpose and objectives of the costing study
The purpose of this costing study is to assess the adequacy of the Aama unit cost reimbursed to both
public and private facilities. The specific objectives of this study are to:
determine the actual unit cost of providing delivery care and complication management
(complicated and C-section delivery) in public and private health facilities
assess the adequacy of Aama unit costs provided to health facilities for normal, complicated,
and C-section deliveries
recommend options for future implementation of the Aama Programme.
3.2 Perspective of costing
This costing study is conducted from a healthcare system perspective rather than a wider societal
perspective. The study comprehensively covers the facility cost associated with all types of institutional
deliveries. This includes all necessary drug and diagnostic costs, but excludes household costs incurred
to access services, for example related to travelling to the facility. This study is only focused on an
assessment of the sufficiency of unit cost reimbursement for all types of deliveries made at the health
facility. It does not include an assessment of other components of the Aama Programme such as the
transport incentive for delivery care and 4ANC incentives.
3.3 Approach to the costing study
A mixed approach was used in this costing study. The study utilised both ‘bottom-up’ costing methods to
estimate the direct costs of all type of deliveries, and ‘top-down’ costing to estimate the associated
indirect costs (the details of the approach are included in the study protocol www.nhssp.org.np).
3.4 Defining health services for costing
3.4.1 Costed conditions
The study determines the cost of normal delivery as well as 14 conditions of complicated delivery (see
Box 2). Standard definitions are provided in the Annex I.

7 | P a g e
Figure 3: Final list of complications for the study
1. Antepartum haemorrhages (APH)
2. Postpartum haemorrhages (PPH)
3. Severe pre-eclampsia
4. Eclampsia
5. Retained placenta
6. Puerperal sepsis
7. Instrumental deliveries
8. Multiple pregnancies/breech deliveries
9. RH negative (anti-D)
10. Post-abortion care
11. Prolonged/obstructed labour
12. Ectopic pregnancies
13. Ruptured uterus
14. Molar pregnancy
Most of these conditions are already included in the Aama package although one condition, molar
pregnancy, was added as a result of expert panel discussions and at the request of the DoHS, FHD. This
study includes all three modes of delivery: normal vaginal delivery, assisted vaginal delivery including
vacuum and forceps (forceps deliveries though no longer recommended can still be found in practice),
and C-section as included in the Aama Programme.
3.4.2 Complications
This study is limited to costing only the direct causes leading to maternal complications. Any chronic or
acute condition aggravated during pregnancy and child birth is not included. For example, the costs of
treating conditions such as pregnancy with heart disease/jaundice/anaemia/fever are not included. In
total, 14 complications are included in this study. Each complication is further differentiated on the basis
of treatment modality requiring either minor medical treatment (evacuation, assisted vaginal delivery,
blood transfusion) or major medical treatment (surgical intervention including C-section, hysterectomy,
re-caesarean, and ICU support).
3.4.3 Health facility ownership, type, and geographical region
The study estimates the unit cost of care at both public and private facilities implementing the Aama
Programme. This includes health facilities such as birthing centres, basic emergency obstetric and
newborn care (BEONC) centres, and comprehensive emergency obstetrics and newborn care (CEONC)
centres implementing the Aama Programme. Health facilities were selected from all three geographical
regions viz: mountain, hill, and Tarai and also from five development regions: eastern, central, western,
mid-western, and far-western.

8 | P a g e
3.5 Identification and classification of resource items
Important for estimating accurate unit costs is the identification of all relevant costs, resource items, for
delivery service. The total cost of producing a delivery care service comprises “direct costs” and
“indirect costs”.
3.5.1 Direct cost
The costs of resources which can be directly related to the production of the different types of delivery
care services are the direct costs (Mogyorosy Z, Smith P, 2005). The following are the major direct costs
included in this study.
i) Human resources
Human resources refers to different cadres of workers directly involved in managing/treating delivery-
related conditions that have been identified. Staff involvement was divided into procedural and
hospitalisation time which includes the initial consultation; diagnoses, inpatients, ward time, and
discharge. A list of staff available at different levels of care was obtained and segregated by grade or
level.
ii) Drugs and supplies
Pharmaceuticals and supplies used while managing/treating each of the 14 conditions were identified.
Since drug prescribing patterns are different at public and private facilities (second line drugs are
generally preferred in private facilities), a separate list of pharmaceuticals were obtained.
iii) Diagnostics
Major laboratory tests and radiological examinations associated with managing/treating each of the 14
conditions including normal and C-section deliveries were identified. Diagnostics covers the cost of
laboratory and radiological equipment, chemicals, and supplies required to perform specific
tests/examinations. The price quoted for a particular test/examination was used to determine the cost
of diagnostics. A standard price list for diagnostics was obtained for both public and private facilities.
iv) Medical Equipment
Medical equipment that is used solely for managing/treating each of the 14 conditions was identified.
Equipment that is shared across different departments is covered under indirect costs. The standard
working life for each type of equipment was obtained from Arges, G. S. (2008) “Estimated Useful Lives of
Depreciable Hospital Assets”, AHA Press; Revised Edition. Only equipment in full working condition was
included in the study.

9 | P a g e
3.5.2 Indirect cost
Indirect costs are resource items that cannot be directly associated with the production of particular
services. These costs cannot be easily traced (Mogyorosy Z, Smith P, 2005). The following are the major
indirect costs identified for this study:
1. Maternity ward/building and land
2. Furniture, fixtures, and beds in maternity ward
3. Shared equipment, computer hardware and software
4. General administration/management:
recording and printing Aama reporting forms
accounting and payments
security and cleaning
utilities (electricity, water)
communication (telephone and fax)
repairs, renewals and rental
vehicles.
The resource use identified in the study can also be classified as either capital or recurrent costs.
Capital costs are the costs of acquiring fixed assets such as buildings, land, and equipment. These
resources usually have a life longer than one financial year and so their cost needs to be
apportioned across years. A resource item which is consumed within one financial year is a
recurrent cost. Some items can be both direct and indirect costs (Mogyorosy Z, Smith P, 2005).
Table 3.1: Recurrent and Capital costs for the costing study
Recurrent Costs Capital Costs (annualised)
1. Personnel
2.Medical commodities
Drugs
Medical supplies
3. Other recurrent expenditure
Utilities, routine maintenance, etc.
1. Buildings
2. Medical equipment
3. Non-medical equipment
Vehicles
Bed
Office furniture
3.6 Measurement of resource use
The type and characteristics of the resources used and the feasibility of the measurement determine
the selection of the unit of resource measurement. The selection of physical units for resource use
measurement should take into account the availability and quality of data and the aim of the costing
study. The following shows the steps used to determine cost:

10 | P a g e
i) Primary data source
A costing survey was conducted to estimate both the direct and indirect resource utilisation while
managing/treating 14 conditions including normal and C-section delivery at different levels of care
(birthing centre/BEONC/CEONC, public, and private).
ii) Secondary data source
Standard guidelines and norms, important data sources, studies, and working papers were reviewed to
cross validate existing best practice and also to feed in some important information for the costing
study. The following are the key data sources used for this study:
1. World Health Organization (WHO) norms and national guidelines on pregnancy and childbirth
2. Standard equipment working life
3. Public salary structure by level of health worker
4. Standard price list for drugs , supplies, equipment, and laboratory
5. Previous top down costing studies
6. Cost of building construction and rental charges
iii) Attaching monetary value to each resource item
The final step in determining cost is to place a monetary value on each resource item (see Table 3.2).
This study took into account both the public and private sector prices. A shadow price method was used
to estimate private sector prices as they are less uniform, often distorted (market price does not reflect
marginal social values of goods or services in the competitive market), and hard to obtain (Mogyorosy Z,
Smith P, 2005).
Table 3.2: Resource item identification, measurement, and valuation
S.N. Identification Measurement Valuation
1 Direct costs
1.1 Human resource Time taken in minutes taken to treat/manage each condition and time spent on hospitalisation
Salary structure of public health worker by level/grade.
1.2 Pharmaceuticals and supplies
drug×dose×duration actual unit of supplies used to treat each condition
Standardised price list obtained from Logistics Management Division (LMD) and Maternity hospital
1.3 Diagnostics Test or radiological examination Standardised price list obtained from the National Public Health Laboratory (NPHL)
1.4 Medical equipment
Equipment apportioned to the delivery caseloads
Undiscounted/discounted annual cost using standardised price list obtained from the LMD
11 | P a g e
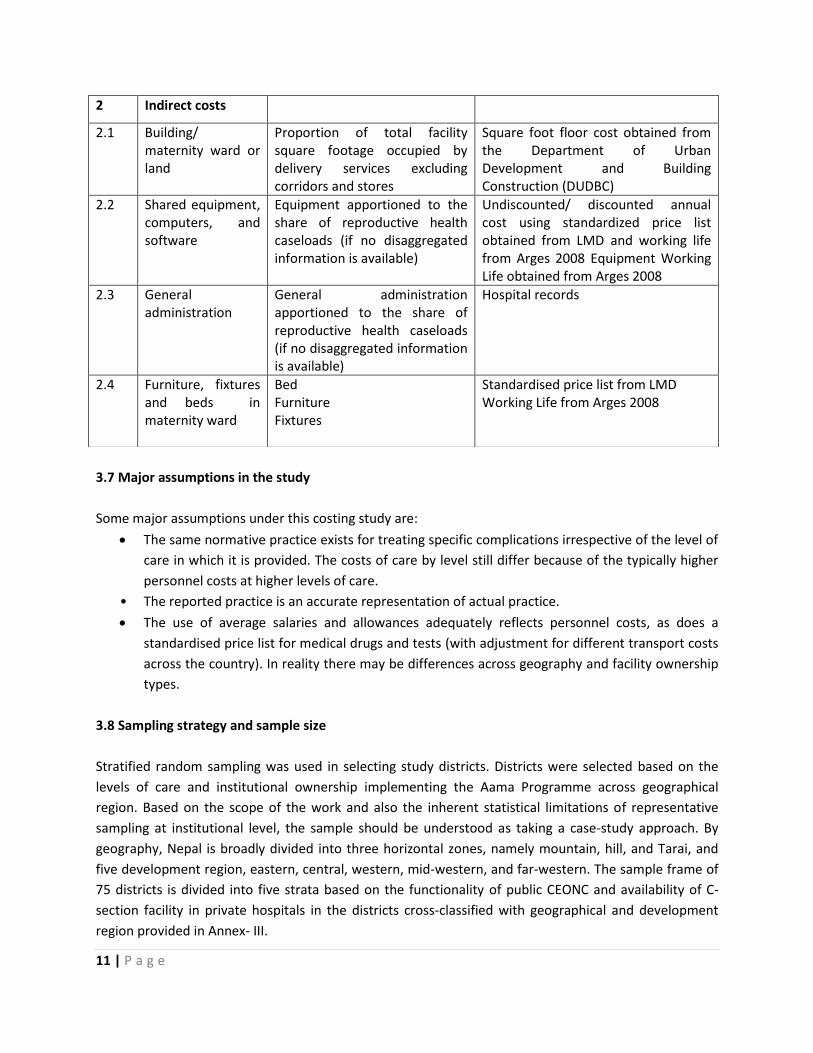
3.7 Major assumptions in the study
Some major assumptions under this costing study are:
The same normative practice exists for treating specific complications irrespective of the level of
care in which it is provided. The costs of care by level still differ because of the typically higher
personnel costs at higher levels of care.
• The reported practice is an accurate representation of actual practice.
The use of average salaries and allowances adequately reflects personnel costs, as does a
standardised price list for medical drugs and tests (with adjustment for different transport costs
across the country). In reality there may be differences across geography and facility ownership
types.
3.8 Sampling strategy and sample size
Stratified random sampling was used in selecting study districts. Districts were selected based on the
levels of care and institutional ownership implementing the Aama Programme across geographical
region. Based on the scope of the work and also the inherent statistical limitations of representative
sampling at institutional level, the sample should be understood as taking a case-study approach. By
geography, Nepal is broadly divided into three horizontal zones, namely mountain, hill, and Tarai, and
five development region, eastern, central, western, mid-western, and far-western. The sample frame of
75 districts is divided into five strata based on the functionality of public CEONC and availability of C-
section facility in private hospitals in the districts cross-classified with geographical and development
region provided in Annex- III.
2 Indirect costs
2.1 Building/ maternity ward or land
Proportion of total facility square footage occupied by delivery services excluding corridors and stores
Square foot floor cost obtained from the Department of Urban Development and Building Construction (DUDBC)
2.2 Shared equipment, computers, and software
Equipment apportioned to the share of reproductive health caseloads (if no disaggregated information is available)
Undiscounted/ discounted annual cost using standardized price list obtained from LMD and working life from Arges 2008 Equipment Working Life obtained from Arges 2008
2.3 General administration
General administration apportioned to the share of reproductive health caseloads (if no disaggregated information is available)
Hospital records
2.4 Furniture, fixtures and beds in maternity ward
Bed Furniture Fixtures
Standardised price list from LMD Working Life from Arges 2008
12 | P a g e
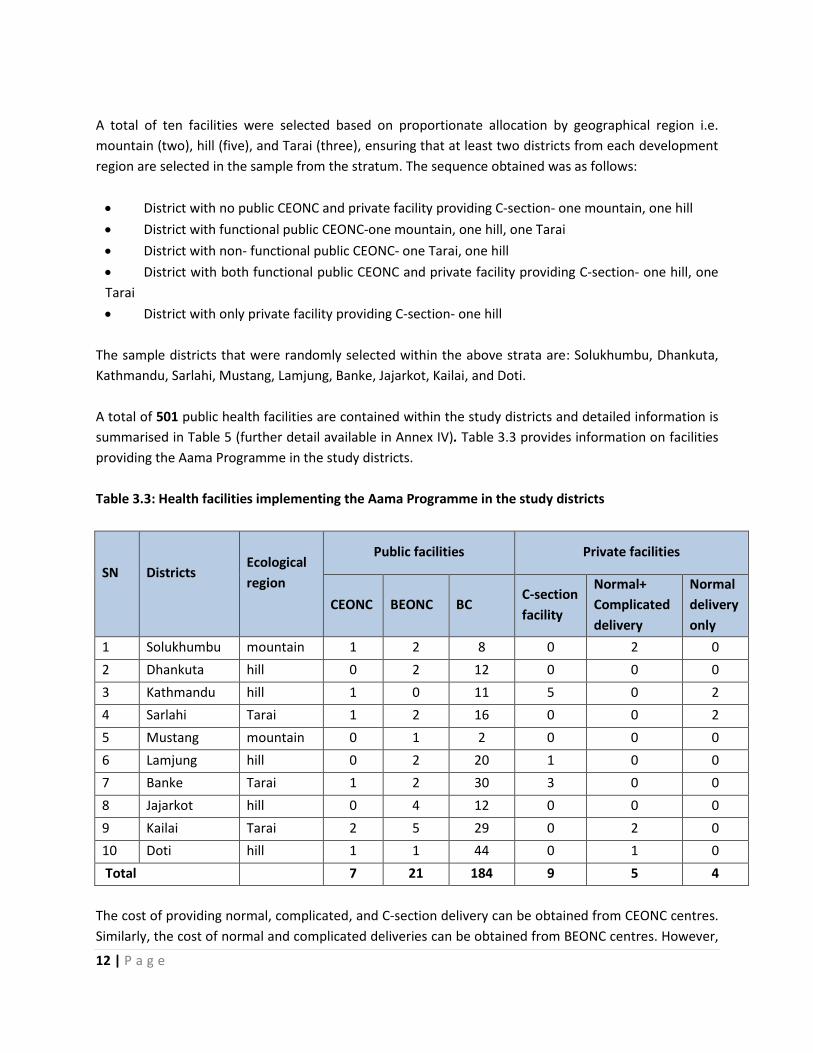
A total of ten facilities were selected based on proportionate allocation by geographical region i.e.
mountain (two), hill (five), and Tarai (three), ensuring that at least two districts from each development
region are selected in the sample from the stratum. The sequence obtained was as follows:
District with no public CEONC and private facility providing C-section- one mountain, one hill
District with functional public CEONC-one mountain, one hill, one Tarai
District with non- functional public CEONC- one Tarai, one hill
District with both functional public CEONC and private facility providing C-section- one hill, one
Tarai
District with only private facility providing C-section- one hill
The sample districts that were randomly selected within the above strata are: Solukhumbu, Dhankuta,
Kathmandu, Sarlahi, Mustang, Lamjung, Banke, Jajarkot, Kailai, and Doti.
A total of 501 public health facilities are contained within the study districts and detailed information is
summarised in Table 5 (further detail available in Annex IV). Table 3.3 provides information on facilities
providing the Aama Programme in the study districts.
Table 3.3: Health facilities implementing the Aama Programme in the study districts
SN
Districts
Ecological
region
Public facilities Private facilities
CEONC BEONC BC C-section
facility
Normal+
Complicated
delivery
Normal
delivery
only
1 Solukhumbu mountain 1 2 8 0 2 0
2 Dhankuta hill 0 2 12 0 0 0
3 Kathmandu hill 1 0 11 5 0 2
4 Sarlahi Tarai 1 2 16 0 0 2
5 Mustang mountain 0 1 2 0 0 0
6 Lamjung hill 0 2 20 1 0 0
7 Banke Tarai 1 2 30 3 0 0
8 Jajarkot hill 0 4 12 0 0 0
9 Kailai Tarai 2 5 29 0 2 0
10 Doti hill 1 1 44 0 1 0
Total 7 21 184 9 5 4
The cost of providing normal, complicated, and C-section delivery can be obtained from CEONC centres.
Similarly, the cost of normal and complicated deliveries can be obtained from BEONC centres. However,

13 | P a g e
there are certain factors such as distance, level of health worker, supply of drugs and supplies, and
Aama reimbursement costs which require this study to obtain a sample from all levels of care. In this
context, in order to capture the cost of care in BEONC and birthing centres, the following criteria were
used:
50% facilities with BEONC services were selected
10% of the birthing centres were selected from each district
Health posts and sub health posts (SHPs) functioning as birthing centres were selected as ideally PHCC
level should provide BEONC level of care. For private facilities (operating at different levels) the
following criteria was used:
In case of a district with only one private health facility implementing the Aama
Programme, that facility is selected by default in the study.
In case of a district with two or more private health facilities implementing the Aama
Programme, 50% were selected.
Health facilities were selected based on the travel time to the facility by public transport. Figure 4
provides detail on the procedure used to define travel time and health facility selection.
Figure 4: Standards used to define travel time and method of health facility selection
Method used to select health facilities in the district:
In case of one health facility selection, furthest located health facility was selected.
In case of two health facility selections, one furthest and one nearest located facility was
selected.
In case of three health facility selection, one furthest, another moderately far, and the other
nearest located facility was selected.
In case of four health facility selection, one furthest, other moderately far, another
moderately near, and the other nearest located facility was selected.
Note: In the case of Solukhumbu, travel time was calculated based on walking distance.
Standards Travel time by public transport
from district head quarter
Furthest > 5 hours
Moderately far 3-5 hours
Moderately near 1-3 hours
Nearest < 1 hours
A total of 52 health facilities were selected from ten districts as summarised in table 3.4. A detailed
name list of facilities is included in the Annex V.

14 | P a g e
Table 3.4: Total number of health facilities sampled for the study
Facility Public Private Total number of sampled health facility
Total Sample Total Sample
CEONC 6 6 9 6 12
BEONC 21 14 5 3 17
Birthing centre
186 20 4 3 23
Total 213 40 18 12 52
3.9 Data collection method
Both prospective and retrospective data collection methods were used to estimate resource use.
Prospective data collection was done to estimate resource utilisation (medical commodities: drugs,
supplies, diagnostic tests, and human resource time by cadre of worker) for each of the 14 conditions.
a) Health facility survey
A health facility survey was carried out in selected facilities to obtain both direct and indirect costs
involved in treating each of the 14 conditions including normal and C-section delivery. Records were
reviewed for the last year to identify different forms of complication treated in the institution. Based on
a fixed number of cases to be obtained from different levels of care, a proportion of these conditions
were included in the sample. Patient records (cardex) and medicine and supply registers maintained at
different wards such as delivery, operative, and post-op were reviewed to take account of drugs and
supplies used for treating individual patients, including the diagnostics performed. On top of this, service
providers who were involved in providing care were asked to provide information, using their best
judgement, about the time different health cadres spent treating those conditions. This was the basis for
determining the actual practice of care associated with treating the 14 conditions.
b) Expert panel discussion
An expert panel discussion was held to review the condition specific questionnaire. Experts were asked
about the intensity of all direct resource inputs by condition. This was used as the basis for estimating
the normative direct costs involved in treating each of the 14 conditions at the national level.
3.10 Data collection Instruments
The study team developed two data collection instruments building on existing tools used in the similar
costing studies conducted in Tanzania and Indonesia previously developed and used by OPM and
modified to suit the local context and objective of the study. These were used to collect data regarding
the ‘actual practice’ unit cost associated with treating/managing the 14 conditions, derived from
interviews with health workers and a review of medical records at sampled health institutions.

15 | P a g e
a) Expert panel workshop
Two expert panel workshops were held to identify the conditions to be studied in the costing
study and refine the condition specific questionnaire. Molar pregnancy was then included in
addition to 14 conditions included in the Aama guidelines.
b) Health facility survey questionnaire
The health facility survey has two questionnaires capturing general information about health facilities
and information on managing the 14 conditions including normal and C-section delivery at their
respective level.
i) General health facility questionnaire
This questionnaire contains general information on health facilities which helps to estimate the indirect
costs associated with treating/managing the 14 conditions. It includes information on infrastructure and
physical facilities (floor occupied by maternity ward, number of beds available), staff details (technical
and administrative staff), availability of medical equipment and fixed assets, annual expenditure, and
the number of in-patients treated (total in-patients and those related to delivery or complication
management/ reproductive health related).
ii) Condition specific questionnaire
This questionnaire contains information on the use of resources that help to estimate the direct costs
associated with treating/managing the 14 conditions including normal and C-section delivery in that
particular health facility. It includes information on the average time spent per medical personnel, actual
use of pharmaceuticals and supplies, and diagnostic tests. The condition specific questionnaire is divided
into normal and complicated delivery questionnaires.
3.11 Data management
All activities related to the health facility survey, including training of enumerators, data collection,
entry, data cleaning, descriptive analysis, and draft report writing were subject to quality assurance
procedures. The field assistant verified the quality of each questionnaire in the field. Field monitoring
visits carried out by the national consultant and the study team were made to ensure the quality
assurance process was rigorously applied. Every questionnaire was assessed on an individual basis by
the study team. Some data captured was cross-checked through telephone interviews with facility staff
and during subsequent field visits. Data entry was conducted in CS pro under the supervision of the
study team. Ten percent of the data was re-entered as part of the quality assurance process, and
additional analytical checks on data quality were carried out.
3.12 Data analysis
Study units (health facilities) within particular areas may share common characteristics and so are more
similar to each other than those in other areas leading to a design effect that increases the standard
16 | P a g e
error of estimates. Standard errors are adjusted in the Stata statistical software by implementing the
svyset command to take account of the clustered nature of sampling, stratification, and sampling
weights. The estimates for facilities with particular characteristics are weighted to reflect their relative
numbers in the health facilities. Weights have been assigned both at the health facility level and at
individual level.
For health facilities, the weights were computed in two stages, firstly a selection of ten study districts by
geographical belts and secondly a selection of health facilities within the ten study districts
disaggregated by public/private and type/level of facilities. The weight assigned in this case varies across
the type/level of health facilities. At the individual level, the weights were computed in three stages:
firstly a selection of ten study districts by geographical belts, secondly, a selection of health facilities
within the ten study districts disaggregated by public/private and type/level of facilities, and thirdly,
total number of normal, complicated, and C-section deliveries in the sampled health facilities over a one
year period. The weight assigned in this case varies across the individual health facilities and type/level
of deliveries. The analysis of this study takes into account 2014 as the price year. All cost data was
converted to present value, using the end of the year price value.
3.13 Limitations of the study
This study focuses on the supply side cost of services and does not take into account the transportation
costs and other associated costs incurred by delivering women to visit a health facility. The actual cost
was calculated using the prices in 2014. Therefore, caution has to be taken while interpreting the
findings in consecutive years. For example:
The price for drugs and supplies has been set at the rate available from the LMD and, for those
not available in the division, the Maternity Hospital. These prices may not always accurately
reflect the actual price incurred by facilities when purchasing drugs since smaller facilities may
not be able to purchase in bulk (which is cheaper).
Laboratory prices have been set at the rate of the NPHL. Many public facilities follow this rate,
however, for private facilities these may sometimes under-estimate the true cost of services to
facilities which will include private laboratory profit margins.
Building prices have been set at the present day value annualised over a standard life without
taking into account physical condition. This may overestimate the actual cost since facilities in
practice may be maintained beyond the life of their buildings.
The study only collected the related cost of care from the patients who received and completed
delivery care in the facility. The study may under-estimate the cost of patients that receive
partial care at one facility and then are referred for further care at a different facility.
17 | P a g e
CHAPTER FOUR: FINDINGS - AGGREGATE, DIRECT, AND INDIRECT COST
This chapter includes a detailed analysis of the aggregated actual cost of delivery, direct cost of delivery,
and indirect cost of delivery in the following sections. It further analyses both the direct and indirect cost
of delivery by level of facility, level of care, public and private, and geographical regions. Representative
country-wide and disaggregated averages were obtained by applying sampling weights.
4.1 Aggregated average cost of delivery
This section provides the national average cost of normal, complicated, and C-section delivery. It also
includes the disaggregated direct and indirect costs of delivery in public and private facilities.
4.1.1 Aggregated average cost of delivery in public and private facilities
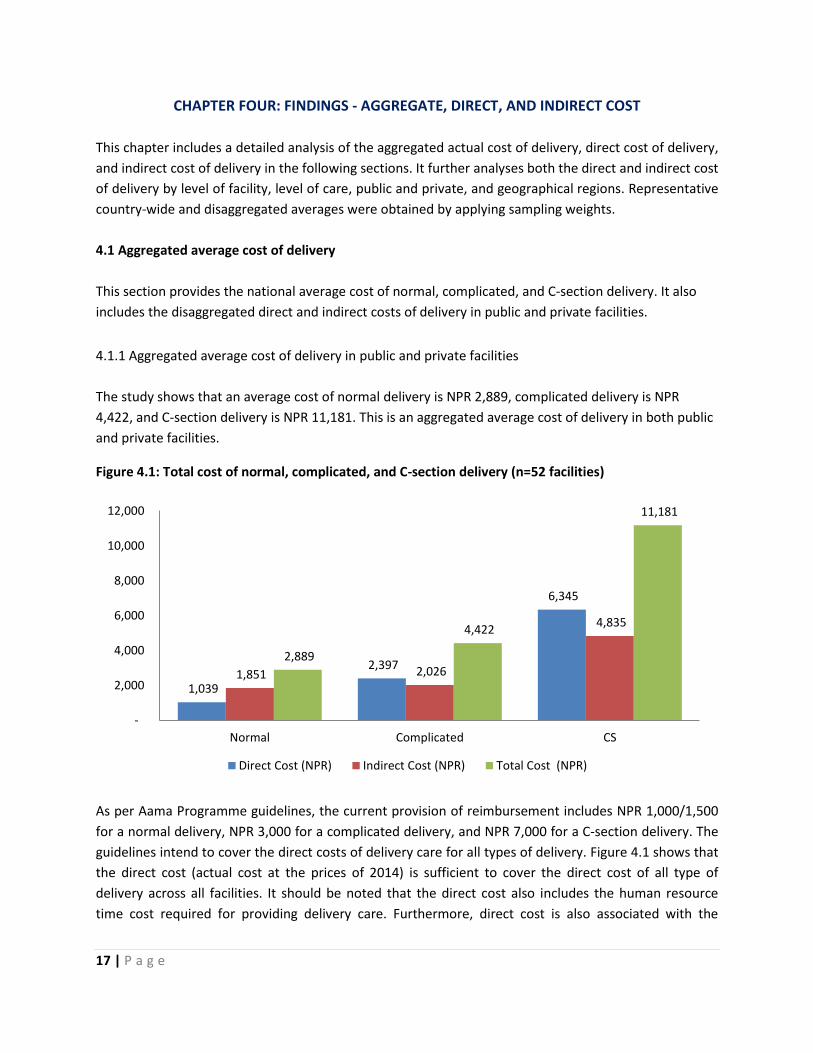
The study shows that an average cost of normal delivery is NPR 2,889, complicated delivery is NPR
4,422, and C-section delivery is NPR 11,181. This is an aggregated average cost of delivery in both public
and private facilities.
Figure 4.1: Total cost of normal, complicated, and C-section delivery (n=52 facilities)
As per Aama Programme guidelines, the current provision of reimbursement includes NPR 1,000/1,500
for a normal delivery, NPR 3,000 for a complicated delivery, and NPR 7,000 for a C-section delivery. The
guidelines intend to cover the direct costs of delivery care for all types of delivery. Figure 4.1 shows that
the direct cost (actual cost at the prices of 2014) is sufficient to cover the direct cost of all type of
delivery across all facilities. It should be noted that the direct cost also includes the human resource
time cost required for providing delivery care. Furthermore, direct cost is also associated with the
1,039
2,397
6,345
1,851 2,026
4,835
2,889
4,422
11,181
-
2,000
4,000
6,000
8,000
10,000
12,000
Normal Complicated CS
Direct Cost (NPR) Indirect Cost (NPR) Total Cost (NPR)

18 | P a g e
treatment regime, prescribing pattern, use of drugs, and level of human resources involved in providing
delivery care.
4.1.2 Average cost of delivery in public facilities
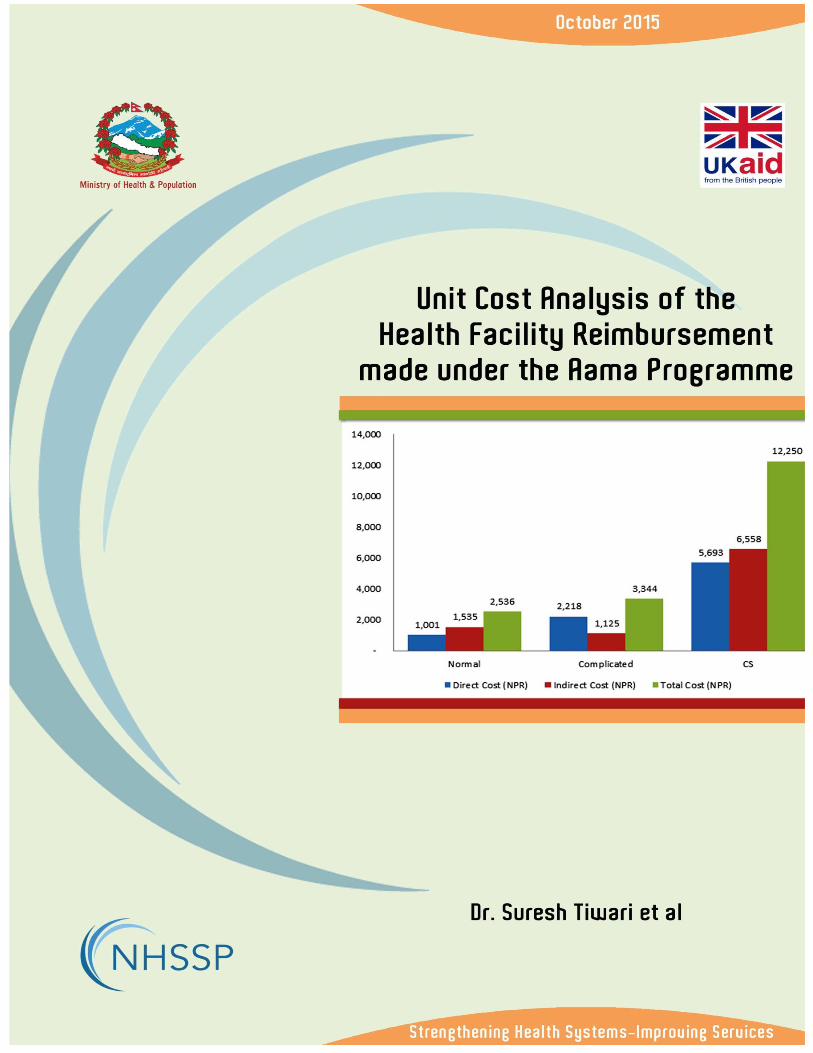
Figure 4.2 shows that the total average cost for normal, complicated, and C-section delivery is NPR
2,536, NPR 3,344, and NPR 12,250, respectively. The table indicates that the indirect cost of C-section is
relatively higher compared to other types of delivery care. This is due to the use of technological
equipment, operating theatre (OT) facility, and longer average length of stay.
Figure 4.2: Total cost of normal, complicated, and C-section delivery in Public facilities (n=40 facilities)
The indirect cost of a complicated delivery is found to be less than for a normal delivery. This is likely to
be due to the larger number of facilities providing small numbers of normal deliveries leading to high
average indirect costs. In contrast, a smaller number of facilities with high workloads and so low unit
indirect costs often provide care for complications.
The study shows that the current reimbursement provision in the Aama Programme is sufficient to cover
the direct cost of all types of delivery care in public facilities.
1,001
2,218
5,693
1,535 1,125
6,558
2,536 3,344
12,250
-
2,000
4,000
6,000
8,000
10,000
12,000
14,000
Normal Complicated CS
Direct Cost (NPR) Indirect Cost (NPR) Total Cost (NPR)

19 | P a g e
4.1.3 Average cost of delivery in private facilities
Figure 4.3 shows that the average cost of normal, complicated, and C-section delivery is NPR 6,880, NPR
7,621, and NPR 11,506, respectively. The cost of care for C-section delivery is found to be less compared
to in public facilities. This likely to be due to the unavailability of private facilities in mountain regions.
Public facilities in mountain areas have higher unit costs than other regions which inflates the average
public sector cost.
Figure 4.3: Average cost of delivery in private facility (n=12 facilities)
The direct costs for normal, complicated, and C-section delivery is found to be sufficient when compared
to the current reimbursement provided through Aama Programme. It should also be noted that the
direct cost includes the time cost of human resources which is relatively higher in private facilities.
4.2. Average cost of delivery by level of public and private facilities
This section analyses the average actual cost of normal, complicated, and C-section delivery by level of
public and private facilities.
4.2.1 Average cost of delivery by level of public facility
Table 4.1 shows that the average cost of a normal delivery ranges from NPR 1,349 to NPR 5,357. The
average cost of a complicated delivery in a PHCC is NPR 2,153 and is NPR 2,470 in a health post. The
average cost of a complicated delivery in central, zonal, and district level health facilities is NPR 3,434,
NPR 3,095, and NPR 4,595, respectively. The average cost of C-section delivery in central, zonal, and
district level is NPR 7,471, NPR 9,207, and NPR 18,379.
1,221
2,901
7,794
5,659 4,720
3,711
6,880 7,621
11,506
-
2,000
4,000
6,000
8,000
10,000
12,000
14,000
Normal Complicated CS
Direct Cost (NPR) Indirect Cost (NPR) Total Cost (NPR)

20 | P a g e
Table 4.1: Total cost of normal, complicated, and C-section delivery by level of public facility (n=40
facilities)
Type Direct Cost (NPR) Indirect Cost (NPR) Total Cost (NPR)
Central Hospital
Normal 1,199 534 1,733
Complicated 2,448 986 3,434
C-section 5,199 2,272 7,471
Zonal Hospital
Normal 1,349 335 1,684
Complicated 2,524 571 3,095
C-section 6,981 2,226 9,207
District Hospital
Normal 1,000 2,367 3,367
Complicated 1,452 3,143 4,595
C-section 7,762 10,617 18,379
PHCC
Normal 767 4,590 5,357
Complicated 1,332 821 2,153
Health post
Normal 763 1,312 2,075
Complicated 2,158 312 2,470
SHP
Normal 735 614 1,349
The average indirect cost of normal delivery in PHCC and health post is higher than for complicated
deliveries because complicated deliveries are only performed in facilities with higher levels of activity
and consequently lower indirect unit costs. For similar reasons, the cost of C-sections in district hospitals
exceed those in zonal and central level facilities.
The results suggest that the average direct cost for normal, complicated, and C-section delivery care are
in line with the current reimbursement provided through the Aama Programme. It should be noted that
the findings also support the different rates of reimbursement for normal delivery by level of facility.
4.2.2 Average cost of delivery in private facilities
The average cost of a normal delivery in a private facility Mission/NGO/Cooperatives, Private (for Profit),
and teaching hospitals is NPR 3,913, NPR 9,722, and NPR 2,795, respectively. The average cost of a
complicated delivery in Mission/NGO/Cooperatives, Private, and teaching hospitals is NPR 10,864, NPR
4,747, and NPR 5,817. The average cost of C-section delivery in Mission/NGO/Cooperatives, Private, and
teaching hospitals is NPR 8,340, NPR 10,887, and NPR 13,263.

21 | P a g e
Table 4.2: Total cost of normal, complicated, and C-section delivery in private facilities (n=12 facilities)
Facility type Direct Cost NPR Indirect Cost NPR Total cost NPR
NGO/Mission/Cooperative Hospital
Normal 664 3,249 3,913
Complicated 1,897 8,967 10,864
C-section 6,377 1,963 8,340
Private (for profit) Hospital
Normal 1,166 8,556 9,722
Complicated 2,320 2,427 4,747
C-section 6,758 4,129 10,887
Teaching Hospital
Normal 1,480 1,315 2,795
Complicated 3,412 2,405 5,817
C-section 8,084 5,179 13,263
The study indicates that the cost of normal and complicated delivery is lower in teaching hospitals than
elsewhere. However, the direct costs for all types of delivery are higher in teaching hospitals. This could
be due to the involvement of higher level human resources and a variety of complication management
procedures. The direct costs in private facilities are not far from the current reimbursement rate.
This section shows that the current reimbursement rate cost included in the Aama Programme
guidelines is sufficient to offset the direct cost for normal, complicated, and C-section delivery for both
public and private facilities at all levels.
4.3 Average cost of delivery by level of care in public and private facilities
This section analyses the cost of providing normal, complicated, and C-section delivery by level of care
disaggregated by public and private facilities.
4.3.1 Average cost delivery by level of care in public facilities
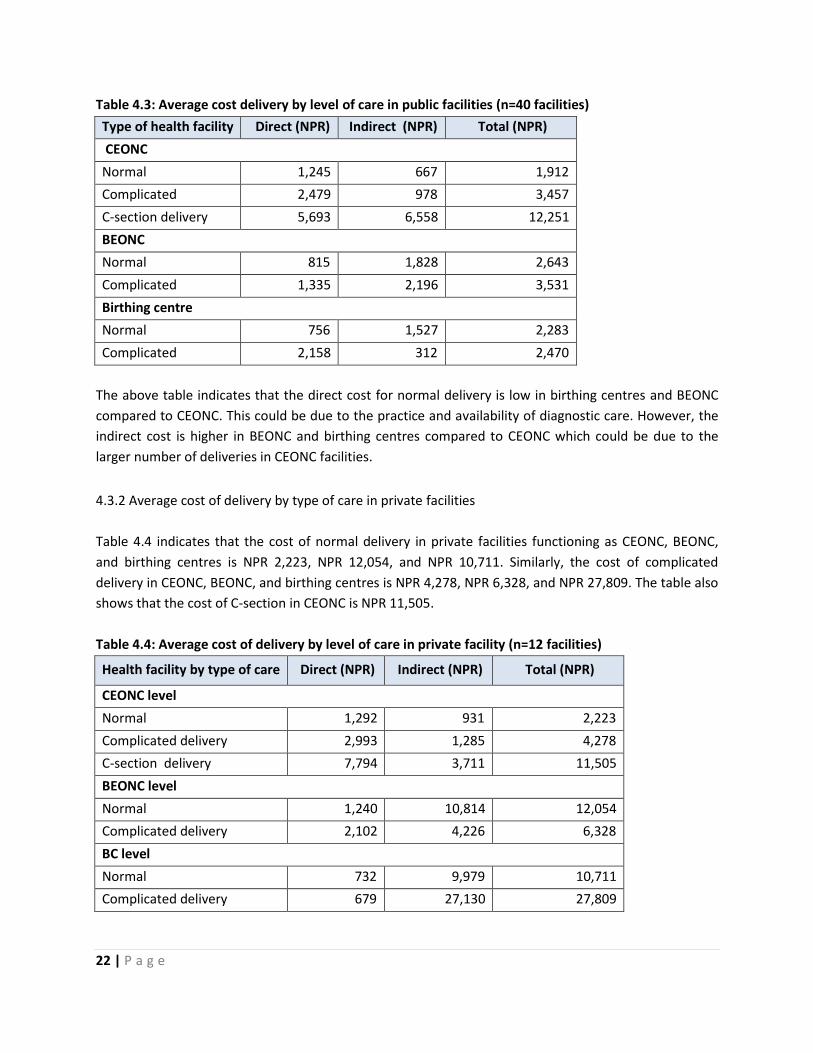
Table 4.3 indicates that the cost of normal delivery in CEONC, BEONC, and birthing centre facilities is
NPR 1,912, NPR 2,643, and NPR 2,283, respectively. Similarly, the cost of complicated delivery in CEONC,
BEONC and birthing centre facilities is NPR 3,457, NPR 3,531, and NPR 2,470. The table also shows that
the cost of C-section in CEONC facilities is NPR 12,251.
22 | P a g e
Table 4.3: Average cost delivery by level of care in public facilities (n=40 facilities)
Type of health facility Direct (NPR) Indirect (NPR) Total (NPR)
CEONC
Normal 1,245 667 1,912
Complicated 2,479 978 3,457
C-section delivery 5,693 6,558 12,251
BEONC
Normal 815 1,828 2,643
Complicated 1,335 2,196 3,531
Birthing centre
Normal 756 1,527 2,283
Complicated 2,158 312 2,470
The above table indicates that the direct cost for normal delivery is low in birthing centres and BEONC
compared to CEONC. This could be due to the practice and availability of diagnostic care. However, the
indirect cost is higher in BEONC and birthing centres compared to CEONC which could be due to the
larger number of deliveries in CEONC facilities.
4.3.2 Average cost of delivery by type of care in private facilities
Table 4.4 indicates that the cost of normal delivery in private facilities functioning as CEONC, BEONC,
and birthing centres is NPR 2,223, NPR 12,054, and NPR 10,711. Similarly, the cost of complicated
delivery in CEONC, BEONC, and birthing centres is NPR 4,278, NPR 6,328, and NPR 27,809. The table also
shows that the cost of C-section in CEONC is NPR 11,505.
Table 4.4: Average cost of delivery by level of care in private facility (n=12 facilities)
Health facility by type of care Direct (NPR) Indirect (NPR) Total (NPR)
CEONC level
Normal 1,292 931 2,223
Complicated delivery 2,993 1,285 4,278
C-section delivery 7,794 3,711 11,505
BEONC level
Normal 1,240 10,814 12,054
Complicated delivery 2,102 4,226 6,328
BC level
Normal 732 9,979 10,711
Complicated delivery 679 27,130 27,809

23 | P a g e
The above table indicates that the direct cost for normal delivery is low in birthing centres compared to
BEONC and CEONC level while the indirect cost is higher in BEONC and birthing centres compared to
CEONC. This likely to be due to differences in practice and availability of diagnostic care. The indirect
cost of normal and complicated delivery at BEONC and birthing centre level is high compared to at
CEONC level facilities due to the high indirect costs of running private health facilities in hill and
mountain regions.
4.4. Average cost of delivery by geographical region
This section analyses the cost of providing normal, complicated, and C-section delivery by geographical
region in both public and private facilities.
4.4.1 Aggregate actual cost of delivery by geographical region
Figure below shows that the aggregated actual cost of normal delivery in mountain regions is NPR 7,534,
in hill, NPR 2,488, and in Tarai, NPR 2,011. Similarly, the actual aggregated cost of complicated delivery
in mountain regions is NPR 12,639, in hill, NPR 3,483, and in Tarai, NPR 3,138. The actual aggregated
cost of C-section delivery in mountain regions is NPR 23,242, in hill, NPR 9,654, and Tarai, NPR 11, 722.
Figure 4. 4: Aggregate actual cost of delivery by geographical region
The figure indicates that the cost of normal and complicated delivery in the Tarai is lower than that of
both mountain and hill. However, C-section was found to be higher. This could be due to the number of
private providers and transportation index used in the Tarai.
7,534
12,639
23,242
2,488 3,483
9,654
2,011 3,138
11,722
-
5,000
10,000
15,000
20,000
25,000
Normal Complicated CS
Mountain Hill Tarai

24 | P a g e
4.4.2 Average cost of delivery in public facility by geographical region
Table 4.5 shows that the total cost of normal delivery in mountain, hill, and Tarai is NPR 7,246, NPR
2,250, and NPR 2,216, respectively. The cost of complicated delivery in mountain, hill, and Tarai is NPR
7,339, NPR 2,983, and NPR 2,664. The cost of C-section delivery in mountain, hill, and Tarai is NPR
23,242, NPR 12,619, and NPR 9,037.
Table 4.5: Average cost of delivery in public facility by geographical region (n=40)
Geographical Region Direct Cost (NPR) Indirect Cost (NPR) Total Cost (NPR)
Normal delivery
Mountain 883 6,363 7,246
Hill 1,022 1,228 2,250
Tarai 988 1,228 2,216
Complicated delivery
Mountain 1,950 5,389 7,339
Hill 2,133 850 2,983
Tarai 2,284 380 2,664
C-section delivery
Mountain 6,984 16,258 23,242
Hill 5,241 7,378 12,619
Tarai 6,999 2,038 9,037
The table shows that the direct cost of C-section delivery is almost the same for each geographical
region. The cost in hill districts is slightly less due to exclusion of the transport cost. However, the
indirect cost in mountain is higher compared to hill and Tarai which is likely to be due to fewer patients
and higher costs of operation.
4.4.3 Average cost of delivery in private facility by geographical region
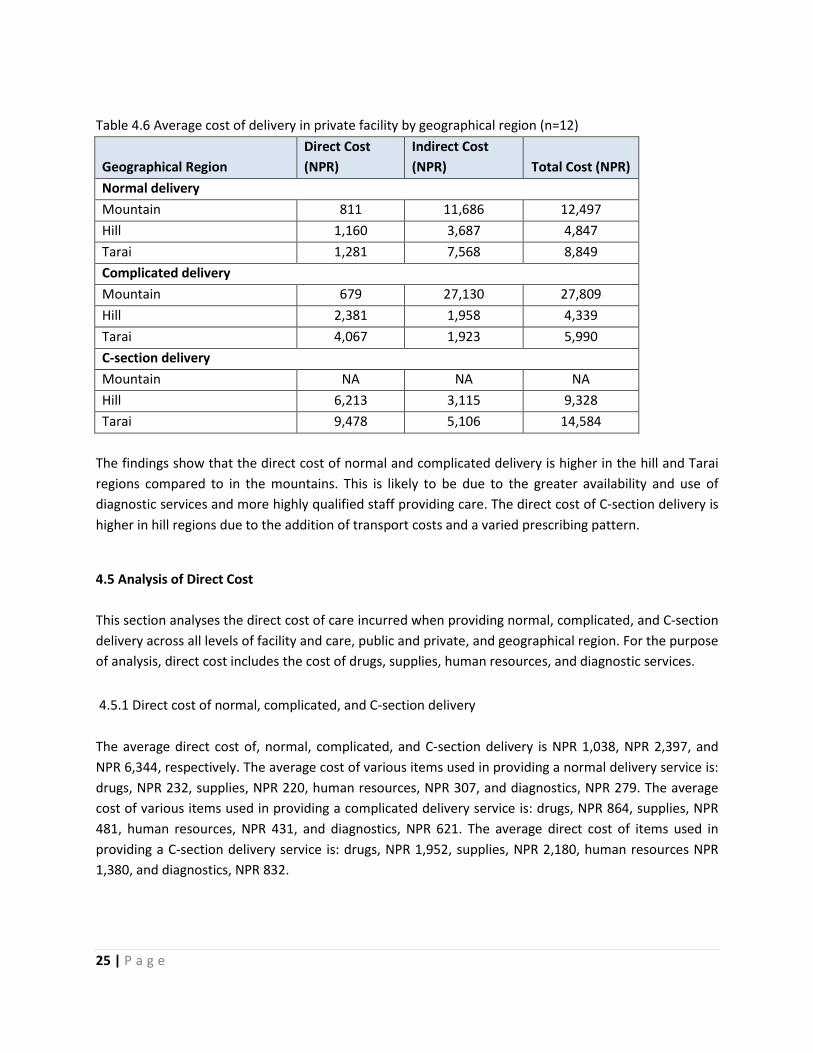
Table 4.6 shows that the total cost of a normal delivery in mountain, hill, and Tarai regions is NPR
12,497, NPR 4,847, and NPR 8,849, respectively. The cost of complicated delivery in mountain, hill, and
Tarai is NPR 27,809, NPR 4,339, and NPR 5,990. The cost of C-section delivery in hill and Tarai is NPR
9,328 and NPR 14,584.
25 | P a g e
Table 4.6 Average cost of delivery in private facility by geographical region (n=12)
Geographical Region
Direct Cost
(NPR)
Indirect Cost
(NPR) Total Cost (NPR)
Normal delivery
Mountain 811 11,686 12,497
Hill 1,160 3,687 4,847
Tarai 1,281 7,568 8,849
Complicated delivery
Mountain 679 27,130 27,809
Hill 2,381 1,958 4,339
Tarai 4,067 1,923 5,990
C-section delivery
Mountain NA NA NA
Hill 6,213 3,115 9,328
Tarai 9,478 5,106 14,584
The findings show that the direct cost of normal and complicated delivery is higher in the hill and Tarai
regions compared to in the mountains. This is likely to be due to the greater availability and use of
diagnostic services and more highly qualified staff providing care. The direct cost of C-section delivery is
higher in hill regions due to the addition of transport costs and a varied prescribing pattern.
4.5 Analysis of Direct Cost
This section analyses the direct cost of care incurred when providing normal, complicated, and C-section
delivery across all levels of facility and care, public and private, and geographical region. For the purpose
of analysis, direct cost includes the cost of drugs, supplies, human resources, and diagnostic services.
4.5.1 Direct cost of normal, complicated, and C-section delivery
The average direct cost of, normal, complicated, and C-section delivery is NPR 1,038, NPR 2,397, and
NPR 6,344, respectively. The average cost of various items used in providing a normal delivery service is:
drugs, NPR 232, supplies, NPR 220, human resources, NPR 307, and diagnostics, NPR 279. The average
cost of various items used in providing a complicated delivery service is: drugs, NPR 864, supplies, NPR
481, human resources, NPR 431, and diagnostics, NPR 621. The average direct cost of items used in
providing a C-section delivery service is: drugs, NPR 1,952, supplies, NPR 2,180, human resources NPR
1,380, and diagnostics, NPR 832.

26 | P a g e
Table 4.7: Direct cost of normal, complicated and C-section delivery by public and private facility (n=52
facilities)
Delivery Type Items Mean (NPR) 95% CI
Normal Drugs 232 132,332
Supplies 220 196,245
Human resources 307 217,398
Diagnostics 279 104,454
Total 1,038 843, 1234
Complicated Drugs 864 5201,207
Supplies 481 296,666
Human resources 431 267,595
Diagnostics 621 1691,074
Total 2,397 2035, 2758
C-section Drugs 1,952 14732,432
Supplies 2,180 14182,943
Human resources 1,380 8721,889
Diagnostics 832 714,950
Total 6,344 4605, 8085
The table indicates that the human resources cost is a major cost driver for normal delivery, followed by
drugs in complicated delivery and supplies in C-section delivery. This excludes the cost of Anti-D in the
analysis. The direct cost of normal and complicated delivery with Anti-D increased to NPR 1,134 and NPR
2,460, respectively.
Figure 4.5: Average direct cost of normal, complicated, and C-section delivery by public and private
facility
Figure 4.5 shows that the average direct cost of providing normal, complicated, and C-section delivery is
higher in private facilities compared to public facilities.
1,001
2,218
5,693
1,221
2,901
7,794
-
1,000
2,000
3,000
4,000
5,000
6,000
7,000
8,000
9,000
Normal Complicated CS
Public Private

27 | P a g e
4.5.2 Direct cost of delivery services by level of health facility
4.5.2.1 Aggregated direct cost of delivery in public facilities
The average cost of a normal delivery in lower level public facilities: SHP, health post, and PHCC, is NPR
735, NPR 762, and NPR 767. Similarly, the average cost of normal delivery at district level and above i.e.
district, zonal, and central, is NPR 999, NPR 1, 349, and NPR 1,199. The average cost of complicated
delivery in lower level public facilities, health post and PHCC, is NPR 2,158 and NPR 1,331. Similarly, the
average cost of complicated delivery at district and above level facilities, i.e. district, zonal, and central,
is NPR 1,451, NPR 2,525, and NPR 2,449. The average cost of C-section delivery in district, zonal, and
central level facilities is NPR 7,762, NPR 6,981, and NPR 5,199.
In lower level facilities drugs appear to be the major cost contributor. At central level hospitals,
diagnostic services form the greatest cost in managing complications while drugs seem to be the
greatest in zonal and district level hospitals. It is to be noted that the cost of complications increases
with the level of facility as a wide variety of complications get treated in higher level facilities. The
variations across facilities could be explained by the difference in practices in different facilities such as
drug prescribing and the use of diagnostics. For example, ferrous sulphate, vitamin A capsules, and
calcium tablets are not prescribed in central level hospitals but facilities at zonal level and below
prescribe it routinely according to the national protocol. Similarly, differences in supplies used such as
Foley’s catheter, variety in suture materials, and spinal needles used could explain some of the observed
variation.

28 | P a g e
Table 4.8: Direct cost of normal, complicated, and C-section delivery by public health facility (n=40
facilities)
Type of health
facility Items
Normal
Delivery (NPR)
Complicated Delivery
(NPR)
C-section Delivery
(NPR)
Central Hospital
Drugs 115 660 1,759
Supplies 195 311 1,622
Human resources 411 386 1,012
Diagnostics 478 1,092 806
Total 1,199 2,449 5,199
Zonal Hospital
Drugs 229 697 1,975
Supplies 289 830 3,096
Human resources 365 383 1,165
Diagnostics 466 615 745
Total 1,349 2,525 6,981
District Hospital
Drugs 228 581 2,237
Supplies 248 300 3,637
Human resources 301 418 1,058
Diagnostics 222 152 830
Total 999 1,451 7,762
PHCC
Drugs 251 434 NA
Supplies 197 400 NA
Human resources 237 327 NA
Diagnostics 82 170 NA
Total 767 1,331 NA
Health post
Drugs 247 1,434 NA
Supplies 200 394 NA
Human resources 211 216 NA
Diagnostics 104 114 NA
Total 762 2,158 NA
SHP
Drugs 337 NA NA
Supplies 149 NA NA
Human resources 249 NA NA
Diagnostics - NA NA
Total 735 NA NA
The findings show that the direct cost of normal, complicated, and C-section delivery in public facilities is
sufficient to cover the cost of delivery care under the Aama Programme’s current rate of

29 | P a g e
reimbursement. The findings also show that the use of human resources across facilities is one of the
key cost drivers. It is to be noted that the time cost of human resources is covered by the annual
workplan and budget (AWPB) for public facilities and some drugs are also covered under the free
essential drug list.
4.5.2.2 Aggregated direct cost of delivery in private facilities
The average cost of normal delivery in Mission/NGO/Cooperative, private (for profit), and teaching
hospitals is NPR 665, NPR 1,166, and NPR 1,481, respectively. The cost of diagnostic services and human
resources time are the major costs for private facilities. The cost of normal delivery in private facilities is
almost double that of in Mission/NGO/Cooperative hospitals. Similarly, the higher levels and numbers of
human resources involved in providing normal delivery care in teaching hospitals contributes to higher
direct costs. The average cost of a complicated delivery in Missionary/NGO/Cooperatives, private, and
teaching hospitals is NPR 1,897, NPR 2,320, and NPR 3,412. The cost of managing complications is
highest in teaching hospitals, most probably due to the wide variety of complications treated and use of
diagnostics services.
Table 4.9: Direct cost of normal, complicated and C-section delivery in different private facilities (n=12
facilities)
Type of health
facility Items
Normal delivery
(NPR)
Complicated
delivery (NPR)
C-section
delivery (NPR)
Missionary/N
GO/Cooperati
ves,
Drugs 242 555 1,429
Supplies 188 525 2,048
Human resources 177 449 1,977
Diagnostics 58 368 924
Total 665 1,897 6,378
Private (for
profit)
Drugs 197 759 1,608
Supplies 171 394 2,589
Human resources 171 449 1,670
Diagnostics 627 718 891
Total 1,166 2,320 6,758
Teaching
Hospitals
Drugs 332 957 2,408
Supplies 310 559 2,577
Human resources 404 858 2,177
Diagnostics 435 1,038 923
Total 1,481 3,412 8,085
The average cost of a C-section delivery in private facilities, Missionary/NGO/Cooperatives, private, and
teaching hospitals, is NPR 6,378, NPR 6,758, and NPR 8,085. As shown in the table, the cost of C-section
delivery appears to be high in teaching hospitals which could be due to types of complications managed
there. However, the difference in practice could also contribute to the higher cost of care. Differences in
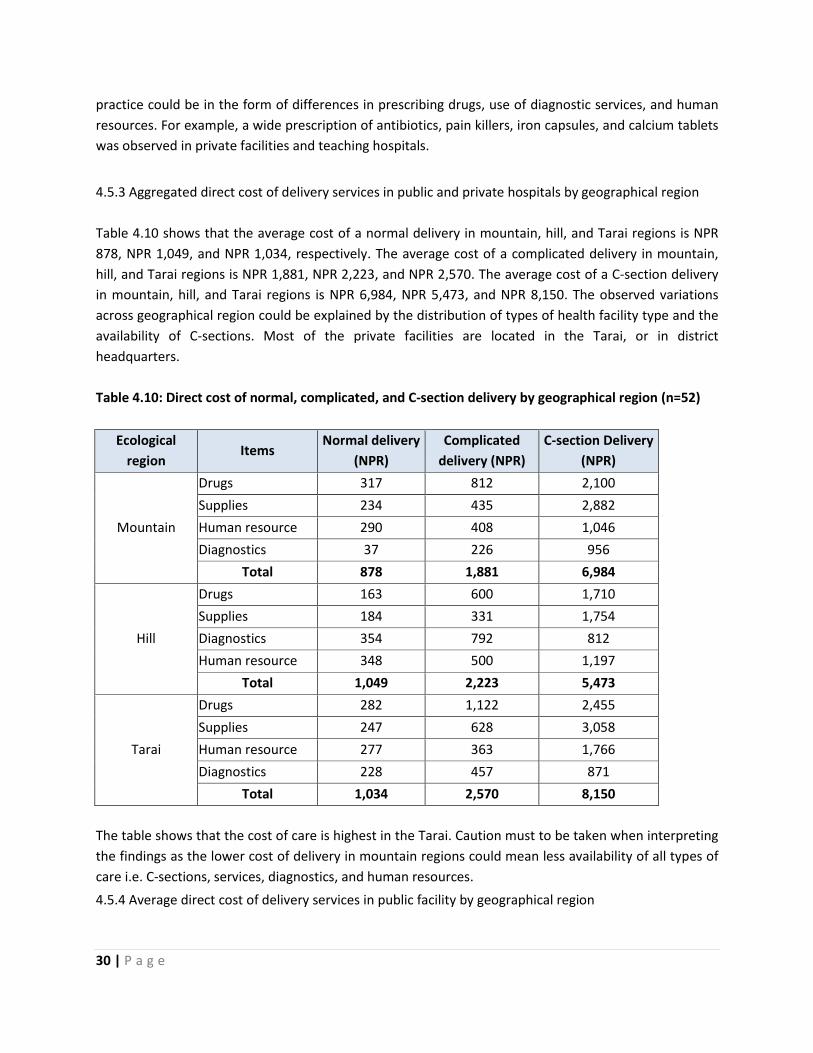
30 | P a g e
practice could be in the form of differences in prescribing drugs, use of diagnostic services, and human
resources. For example, a wide prescription of antibiotics, pain killers, iron capsules, and calcium tablets
was observed in private facilities and teaching hospitals.
4.5.3 Aggregated direct cost of delivery services in public and private hospitals by geographical region
Table 4.10 shows that the average cost of a normal delivery in mountain, hill, and Tarai regions is NPR
878, NPR 1,049, and NPR 1,034, respectively. The average cost of a complicated delivery in mountain,
hill, and Tarai regions is NPR 1,881, NPR 2,223, and NPR 2,570. The average cost of a C-section delivery
in mountain, hill, and Tarai regions is NPR 6,984, NPR 5,473, and NPR 8,150. The observed variations
across geographical region could be explained by the distribution of types of health facility type and the
availability of C-sections. Most of the private facilities are located in the Tarai, or in district
headquarters.
Table 4.10: Direct cost of normal, complicated, and C-section delivery by geographical region (n=52)
Ecological
region Items
Normal delivery
(NPR)
Complicated
delivery (NPR)
C-section Delivery
(NPR)
Mountain
Drugs 317 812 2,100
Supplies 234 435 2,882
Human resource 290 408 1,046
Diagnostics 37 226 956
Total 878 1,881 6,984
Hill
Drugs 163 600 1,710
Supplies 184 331 1,754
Diagnostics 354 792 812
Human resource 348 500 1,197
Total 1,049 2,223 5,473
Tarai
Drugs 282 1,122 2,455
Supplies 247 628 3,058
Human resource 277 363 1,766
Diagnostics 228 457 871
Total 1,034 2,570 8,150
The table shows that the cost of care is highest in the Tarai. Caution must to be taken when interpreting
the findings as the lower cost of delivery in mountain regions could mean less availability of all types of
care i.e. C-sections, services, diagnostics, and human resources.
4.5.4 Average direct cost of delivery services in public facility by geographical region
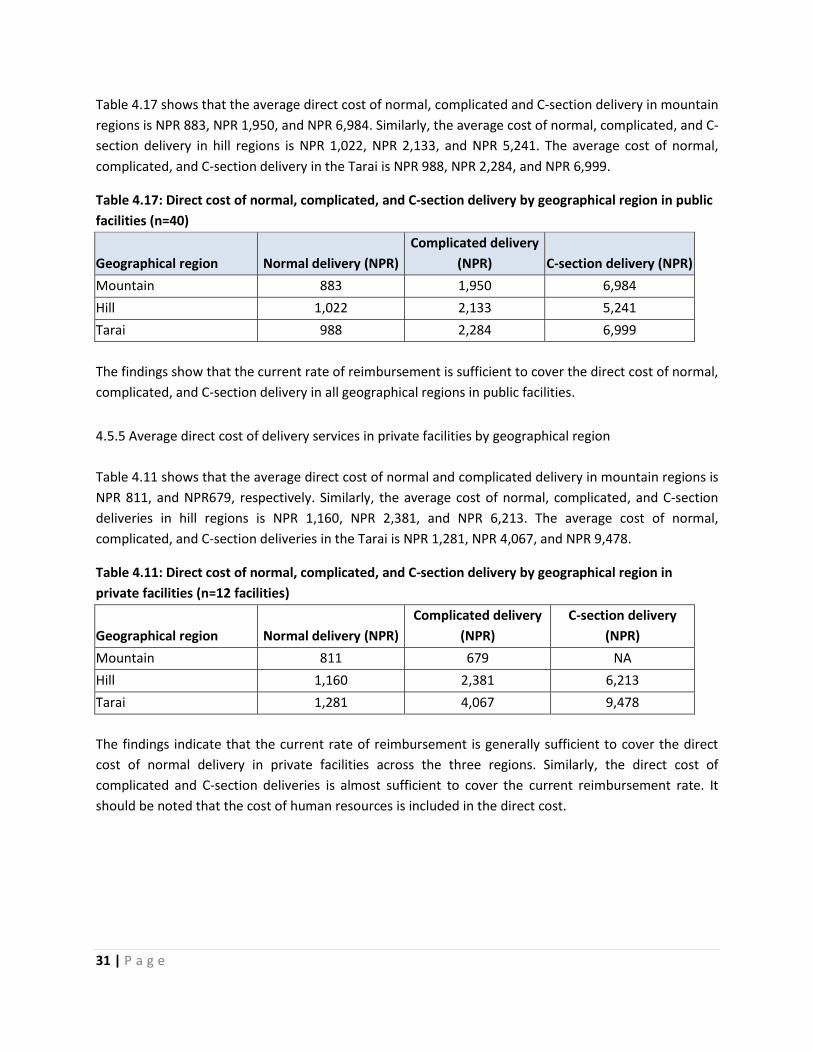
31 | P a g e
Table 4.17 shows that the average direct cost of normal, complicated and C-section delivery in mountain
regions is NPR 883, NPR 1,950, and NPR 6,984. Similarly, the average cost of normal, complicated, and C-
section delivery in hill regions is NPR 1,022, NPR 2,133, and NPR 5,241. The average cost of normal,
complicated, and C-section delivery in the Tarai is NPR 988, NPR 2,284, and NPR 6,999.
Table 4.17: Direct cost of normal, complicated, and C-section delivery by geographical region in public
facilities (n=40)
Geographical region Normal delivery (NPR)
Complicated delivery
(NPR) C-section delivery (NPR)
Mountain 883 1,950 6,984
Hill 1,022 2,133 5,241
Tarai 988 2,284 6,999
The findings show that the current rate of reimbursement is sufficient to cover the direct cost of normal,
complicated, and C-section delivery in all geographical regions in public facilities.
4.5.5 Average direct cost of delivery services in private facilities by geographical region
Table 4.11 shows that the average direct cost of normal and complicated delivery in mountain regions is
NPR 811, and NPR679, respectively. Similarly, the average cost of normal, complicated, and C-section
deliveries in hill regions is NPR 1,160, NPR 2,381, and NPR 6,213. The average cost of normal,
complicated, and C-section deliveries in the Tarai is NPR 1,281, NPR 4,067, and NPR 9,478.
Table 4.11: Direct cost of normal, complicated, and C-section delivery by geographical region in
private facilities (n=12 facilities)
Geographical region Normal delivery (NPR)
Complicated delivery
(NPR)
C-section delivery
(NPR)
Mountain 811 679 NA
Hill 1,160 2,381 6,213
Tarai 1,281 4,067 9,478
The findings indicate that the current rate of reimbursement is generally sufficient to cover the direct
cost of normal delivery in private facilities across the three regions. Similarly, the direct cost of
complicated and C-section deliveries is almost sufficient to cover the current reimbursement rate. It
should be noted that the cost of human resources is included in the direct cost.

32 | P a g e
4.5.4 Direct cost of delivery services by level of care
4.5.4.1 Direct cost of delivery services in public facilities by level of care
The average cost of a normal delivery at a public birthing centre, BEONC, and CEONC is NPR 756, NPR
814, and NPR 1,245. The cost of a normal delivery is highest at CEONC facilities which could be due to
the variety of diagnostic services and human resources involved. The average cost of a complicated
delivery at a public birthing centre, BEONC, and CEONC is NPR 2,158, NPR 1,335 and NPR 2,479. It is to
be noted that a wide variety of complications are treated at CEONC facilities. The average cost of a C-
section delivery at a public CEONC is NPR 5,693.
Table 4.12: Direct cost of normal, complicated, and C-section delivery by level of care in public
facilities (n=40)
Some forms of complicated delivery such as such as puerperal sepsis, manual removal of the placenta,
and PPH are performed in some birthing centres.
The study indicates that drugs are the one of the major cost contributors in both birthing centres and
BEONCs for normal and complicated deliveries. Supplies appear to be the major cost driver followed by
drugs for C-section delivery.
Type of
health
facility Items
Normal delivery
(NPR)
Complicated delivery
(NPR)
C-section Delivery
(NPR)
Birthing
centre
Drugs 277 1,434 NA
Supplies 185 394 NA
Human resources 224 216 NA
Diagnostics 70 114 NA
Total 756 2,158 NA
BEONC
Drugs 272 526 NA
Supplies 204 307 NA
Human resources 262 402 NA
Diagnostics 76 100 NA
Total 814 1,335 NA
CEONC
Drugs 161 677 1,823
Supplies 237 548 2,028
Human resources 383 382 1,050
Diagnostics 464 872 792
Total 1,245 2,479 5,693

33 | P a g e
4.5.4.2 Direct cost of delivery services in private facility by level of care
The average cost of a normal delivery at a private facility functioning as a birthing centre, BEONC and
CEONC is NPR 731, NPR 1,240, and NPR 1,292, respectively. The average cost of a complicated delivery
at a private facility providing birthing centre, BEONC, and CEONC level care is NPR 679, NPR 2,103, and
NPR 2,993. The average cost of a C-section delivery in a private CEONC is NPR 7,794.
Table 4.13: Direct cost of normal, complicated and C-section delivery in different private facility
(n=12)
Type of
health
facility
Items Normal delivery
(NPR)
Complicated
delivery (NPR)
C-section Delivery
(NPR)
Birthing
centre
level
Drugs 304 154 NA
Supplies 259 170 NA
Human resources 160 355 NA
Diagnostics 8 - NA
Total 731 679 NA
BEONC
level
Drugs 200 722 NA
Supplies 160 392 NA
Human resources 156 251 NA
Diagnostics 724 738 NA
Total 1,240 2,103 NA
CEONC
level
Drugs 297 856 2,239
Supplies 269 531 2,520
Human resources 351 745 2,115
Diagnostics 375 861 920
Total 1,292 2,993 7,794
The cost of normal delivery is highest at CEONC level which could be due to the variety of diagnostic
services used and human resources involved. Similarly, a wider variety of complications are treated at
CEONC level such as blood transfusions.
The study indicates that drugs are one of the major contributors at birthing centre level for normal
delivery. Diagnostic services are the major cost drivers for CEONCs. Moreover, diagnostic services are
also the major cost contributors for both normal and complicated deliveries at BEONC level. Supplies
appear to be the major cost driver followed by drugs for C-section deliveries.
The findings suggest that the current rate of reimbursement under the Aama Programme is sufficient to
cover normal and complicated deliveries at all levels of care. The direct cost of C-section deliveries is
sufficiently covered if the human resources cost is excluded from the analysis.

34 | P a g e
4.6 Indirect costs of delivery service
This section analyses the indirect costs incurred in providing normal, complicated, and C-section delivery
across all levels of facility, level of care, public and private, and geographical region. For the purpose of
this analysis, indirect cost is categorised as buildings, equipment, and recurrent costs. It should be noted
that the primary interest of the Aama Programme is to offset the direct cost of care. Indirect units are
substantially driven by the level of activity in a facility; facilities with high throughput of patients tend to
have lower indirect unit costs.
4.6.1 Aggregated indirect cost of normal, complicated, and C-section delivery
The average indirect cost of a normal delivery in both public and private facilities is NPR 1,851. The cost
of buildings, equipment, and recurrent the costs is found to be NPR 1,014, NPR 346, and NPR 491,
respectively. Similarly, the average indirect cost of a complicated delivery is NPR 2,026. The cost of
buildings, equipment, and recurrent costs is NPR 650, NPR 544, and NPR 832. The average indirect cost
of a C-section delivery is NPR 4,835. The cost of buildings, equipment, and recurrent costs is NPR 947,
NPR 2,380, and NPR 1,508.
Table 4.14: Indirect cost normal, complicated and C-section delivery by items in public and private
(n=52)
Items
Normal delivery
(NPR)*
Complicated
delivery (NPR)** C-section delivery (NPR)***
Buildings 1,014 650 947
Equipment 346 544 2,380
Recurrent 491 832 1,508
Total 1,851 2,026 4,835
*n=52 **-n=30 ***n=12
Table 4.14 shows that the cost of buildings is the major cost driver for normal delivery. This could be due
to the availability of service across all levels of facilities and geographical regions. In recent years, huge
investment has been put into buildings for lower level facilities to be able to function as birthing centres.
The findings show that the equipment and recurrent costs are similar for managing complicated
delivery. This could be due to the use of technological equipment, maintenance, and a lower number of
cases in lower level facilities. Equipment is the major cost driver for C-section delivery and this could be
due to the higher average length of stay and use of C-section equipment. The cost of building is
relatively lower for C-section deliveries as a result of relatively high caseloads in these facilities.
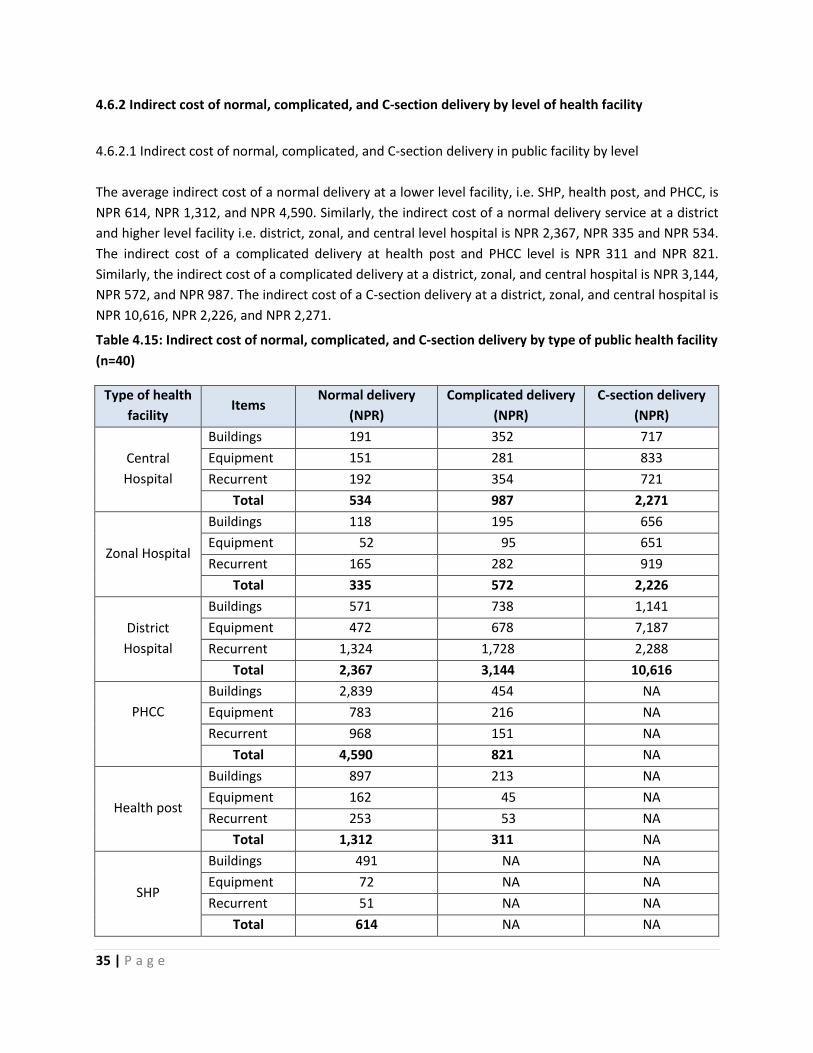
35 | P a g e
4.6.2 Indirect cost of normal, complicated, and C-section delivery by level of health facility
4.6.2.1 Indirect cost of normal, complicated, and C-section delivery in public facility by level
The average indirect cost of a normal delivery at a lower level facility, i.e. SHP, health post, and PHCC, is
NPR 614, NPR 1,312, and NPR 4,590. Similarly, the indirect cost of a normal delivery service at a district
and higher level facility i.e. district, zonal, and central level hospital is NPR 2,367, NPR 335 and NPR 534.
The indirect cost of a complicated delivery at health post and PHCC level is NPR 311 and NPR 821.
Similarly, the indirect cost of a complicated delivery at a district, zonal, and central hospital is NPR 3,144,
NPR 572, and NPR 987. The indirect cost of a C-section delivery at a district, zonal, and central hospital is
NPR 10,616, NPR 2,226, and NPR 2,271.
Table 4.15: Indirect cost of normal, complicated, and C-section delivery by type of public health facility
(n=40)
Type of health
facility Items
Normal delivery
(NPR)
Complicated delivery
(NPR)
C-section delivery
(NPR)
Central
Hospital
Buildings 191 352 717
Equipment 151 281 833
Recurrent 192 354 721
Total 534 987 2,271
Zonal Hospital
Buildings 118 195 656
Equipment 52 95 651
Recurrent 165 282 919
Total 335 572 2,226
District
Hospital
Buildings 571 738 1,141
Equipment 472 678 7,187
Recurrent 1,324 1,728 2,288
Total 2,367 3,144 10,616
PHCC
Buildings 2,839 454 NA
Equipment 783 216 NA
Recurrent 968 151 NA
Total 4,590 821 NA
Health post
Buildings 897 213 NA
Equipment 162 45 NA
Recurrent 253 53 NA
Total 1,312 311 NA
SHP
Buildings 491 NA NA
Equipment 72 NA NA
Recurrent 51 NA NA
Total 614 NA NA

36 | P a g e
Table 4.15 shows that buildings are a major cost driver for normal and complicated delivery in PHCCs,
health posts, and SHPs. This is because these facilities have a relatively lower caseload to offset the cost
of buildings. The average cost of normal, complicated, and C-section deliveries is higher in district
hospitals compared to zonal and central hospitals. This could be due to a relatively lower caseload to
offset all indirect costs. In addition, the average length of stay is also an important factor that increases
the share of indirect costs in district hospitals (a maximum of nine and a half days in mountain regions).
Longer stays are sometimes required in more remote areas to provide post-natal care that is less easy to
deliver once women are back at their homes.
4.6.2.2 Indirect cost of normal, complicated, and C-section delivery in private facilities by level
The average indirect cost of a normal delivery in Mission/NGO/Cooperatives, private, and teaching
hospitals is NPR 3,248, NPR 8,557, and NPR 1,315, respectively. Similarly, the indirect cost of a
complicated delivery in Mission/NGO/Cooperatives, private, and teaching hospitals is NPR 8,967, NPR
4,508, and NPR 2,405. The indirect cost of a C-section delivery in Mission/NGO/Cooperatives, private,
and teaching hospitals is NPR 1,963, NPR 4,129, and NPR 5,179.
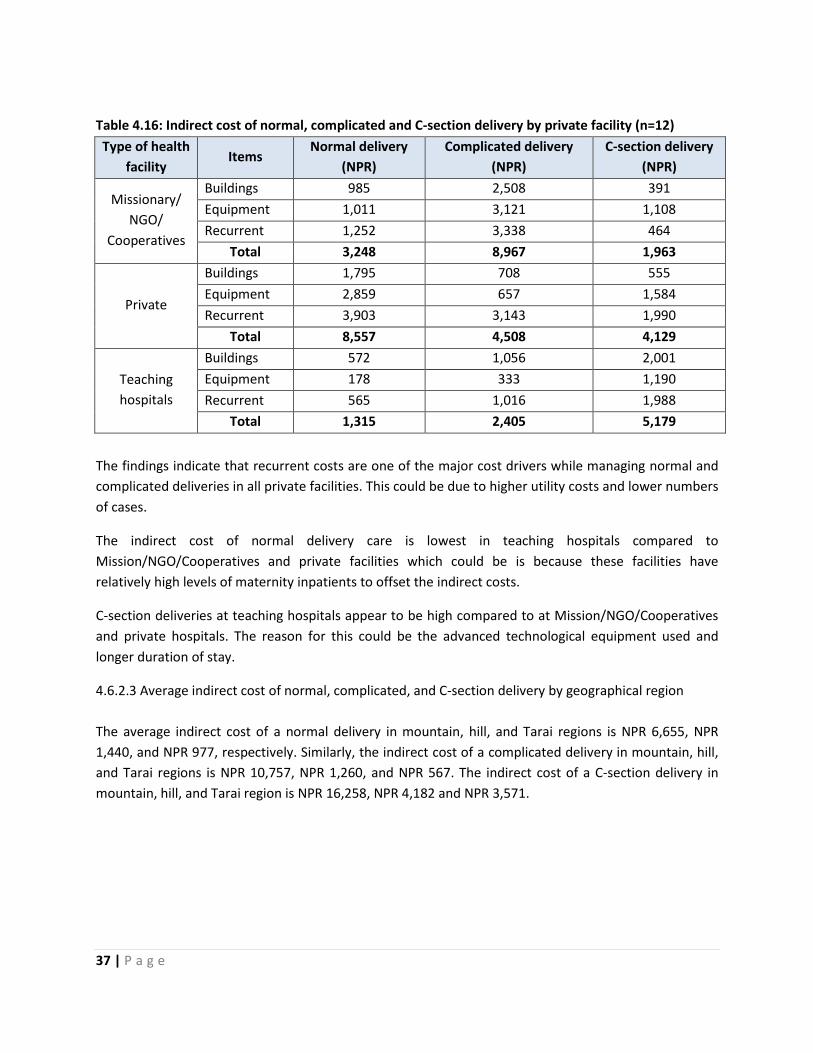
37 | P a g e
Table 4.16: Indirect cost of normal, complicated and C-section delivery by private facility (n=12)
Type of health
facility Items
Normal delivery
(NPR)
Complicated delivery
(NPR)
C-section delivery
(NPR)
Missionary/
NGO/
Cooperatives
Buildings 985 2,508 391
Equipment 1,011 3,121 1,108
Recurrent 1,252 3,338 464
Total 3,248 8,967 1,963
Private
Buildings 1,795 708 555
Equipment 2,859 657 1,584
Recurrent 3,903 3,143 1,990
Total 8,557 4,508 4,129
Teaching
hospitals
Buildings 572 1,056 2,001
Equipment 178 333 1,190
Recurrent 565 1,016 1,988
Total 1,315 2,405 5,179
The findings indicate that recurrent costs are one of the major cost drivers while managing normal and
complicated deliveries in all private facilities. This could be due to higher utility costs and lower numbers
of cases.
The indirect cost of normal delivery care is lowest in teaching hospitals compared to
Mission/NGO/Cooperatives and private facilities which could be is because these facilities have
relatively high levels of maternity inpatients to offset the indirect costs.
C-section deliveries at teaching hospitals appear to be high compared to at Mission/NGO/Cooperatives
and private hospitals. The reason for this could be the advanced technological equipment used and
longer duration of stay.
4.6.2.3 Average indirect cost of normal, complicated, and C-section delivery by geographical region
The average indirect cost of a normal delivery in mountain, hill, and Tarai regions is NPR 6,655, NPR
1,440, and NPR 977, respectively. Similarly, the indirect cost of a complicated delivery in mountain, hill,
and Tarai regions is NPR 10,757, NPR 1,260, and NPR 567. The indirect cost of a C-section delivery in
mountain, hill, and Tarai region is NPR 16,258, NPR 4,182 and NPR 3,571.
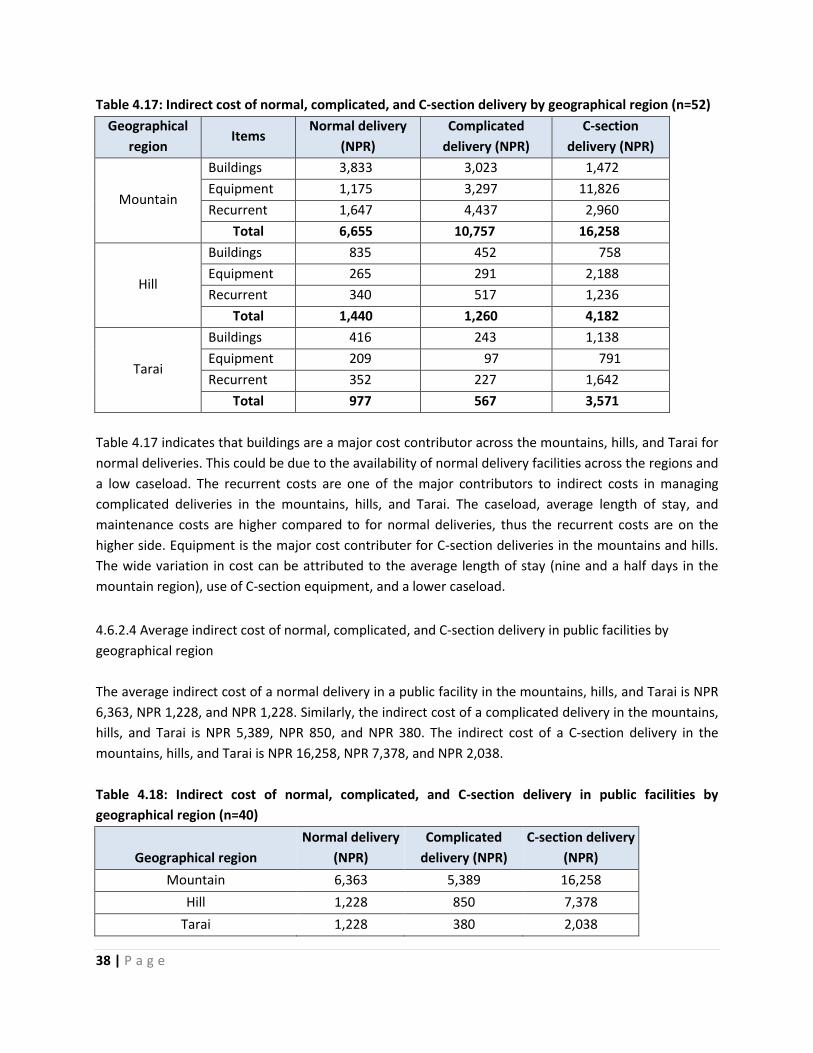
38 | P a g e
Table 4.17: Indirect cost of normal, complicated, and C-section delivery by geographical region (n=52)
Geographical
region Items
Normal delivery
(NPR)
Complicated
delivery (NPR)
C-section
delivery (NPR)
Mountain
Buildings 3,833 3,023 1,472
Equipment 1,175 3,297 11,826
Recurrent 1,647 4,437 2,960
Total 6,655 10,757 16,258
Hill
Buildings 835 452 758
Equipment 265 291 2,188
Recurrent 340 517 1,236
Total 1,440 1,260 4,182
Tarai
Buildings 416 243 1,138
Equipment 209 97 791
Recurrent 352 227 1,642
Total 977 567 3,571
Table 4.17 indicates that buildings are a major cost contributor across the mountains, hills, and Tarai for
normal deliveries. This could be due to the availability of normal delivery facilities across the regions and
a low caseload. The recurrent costs are one of the major contributors to indirect costs in managing
complicated deliveries in the mountains, hills, and Tarai. The caseload, average length of stay, and
maintenance costs are higher compared to for normal deliveries, thus the recurrent costs are on the
higher side. Equipment is the major cost contributer for C-section deliveries in the mountains and hills.
The wide variation in cost can be attributed to the average length of stay (nine and a half days in the
mountain region), use of C-section equipment, and a lower caseload.
4.6.2.4 Average indirect cost of normal, complicated, and C-section delivery in public facilities by
geographical region
The average indirect cost of a normal delivery in a public facility in the mountains, hills, and Tarai is NPR
6,363, NPR 1,228, and NPR 1,228. Similarly, the indirect cost of a complicated delivery in the mountains,
hills, and Tarai is NPR 5,389, NPR 850, and NPR 380. The indirect cost of a C-section delivery in the
mountains, hills, and Tarai is NPR 16,258, NPR 7,378, and NPR 2,038.
Table 4.18: Indirect cost of normal, complicated, and C-section delivery in public facilities by
geographical region (n=40)
Geographical region
Normal delivery
(NPR)
Complicated
delivery (NPR)
C-section delivery
(NPR)
Mountain 6,363 5,389 16,258
Hill 1,228 850 7,378
Tarai 1,228 380 2,038
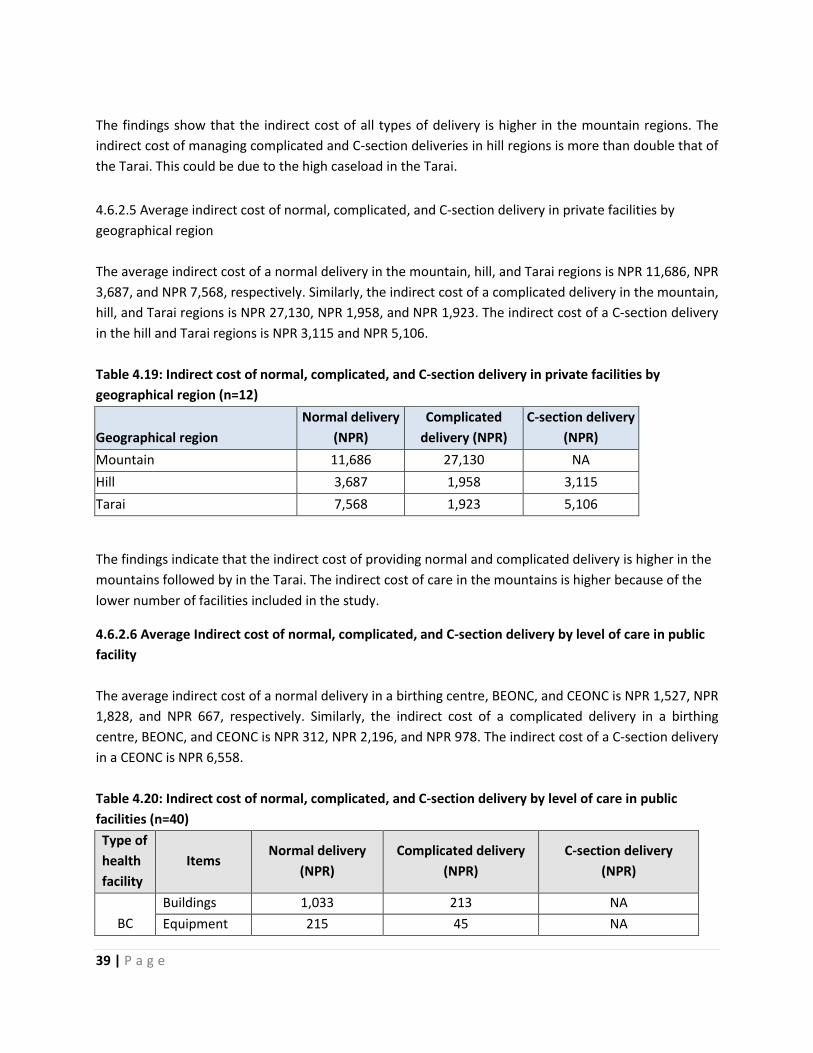
39 | P a g e
The findings show that the indirect cost of all types of delivery is higher in the mountain regions. The
indirect cost of managing complicated and C-section deliveries in hill regions is more than double that of
the Tarai. This could be due to the high caseload in the Tarai.
4.6.2.5 Average indirect cost of normal, complicated, and C-section delivery in private facilities by
geographical region
The average indirect cost of a normal delivery in the mountain, hill, and Tarai regions is NPR 11,686, NPR
3,687, and NPR 7,568, respectively. Similarly, the indirect cost of a complicated delivery in the mountain,
hill, and Tarai regions is NPR 27,130, NPR 1,958, and NPR 1,923. The indirect cost of a C-section delivery
in the hill and Tarai regions is NPR 3,115 and NPR 5,106.
Table 4.19: Indirect cost of normal, complicated, and C-section delivery in private facilities by
geographical region (n=12)
Geographical region
Normal delivery
(NPR)
Complicated
delivery (NPR)
C-section delivery
(NPR)
Mountain 11,686 27,130 NA
Hill 3,687 1,958 3,115
Tarai 7,568 1,923 5,106
The findings indicate that the indirect cost of providing normal and complicated delivery is higher in the
mountains followed by in the Tarai. The indirect cost of care in the mountains is higher because of the
lower number of facilities included in the study.
4.6.2.6 Average Indirect cost of normal, complicated, and C-section delivery by level of care in public
facility
The average indirect cost of a normal delivery in a birthing centre, BEONC, and CEONC is NPR 1,527, NPR
1,828, and NPR 667, respectively. Similarly, the indirect cost of a complicated delivery in a birthing
centre, BEONC, and CEONC is NPR 312, NPR 2,196, and NPR 978. The indirect cost of a C-section delivery
in a CEONC is NPR 6,558.
Table 4.20: Indirect cost of normal, complicated, and C-section delivery by level of care in public
facilities (n=40)
Type of
health
facility
Items Normal delivery
(NPR)
Complicated delivery
(NPR)
C-section delivery
(NPR)
BC
Buildings 1,033 213 NA
Equipment 215 45 NA

40 | P a g e
Recurrent 279 53 NA
Total 1,527 312 NA
BEONC
Buildings 813 663 NA
Equipment 320 488 NA
Recurrent 695 1,046 NA
Total 1,828 2,196 NA
CEONC
Buildings 203 279 917
Equipment 112 234 4,052
Recurrent 352 465 1,589
Total 667 978 6,558
The findings suggest that buildings are one of the major cost drivers for providing normal delivery across
birthing centres, BEONCs, and CEONCs. This could be due to the availability and use of services across
the levels of care. It also suggests that recurrent costs are one of the major contributors for providing
complicated deliveries in BEONCs and CEONCs. This could be due to a lower case load and higher utility
costs at BEONC level. Equipment is a major cost driver at CEONC level. An important point regarding
CEONCs is that the average length of stay varies from six to nine and a half days.
4.6.2.7 Average indirect cost of normal, complicated, and C-section delivery by level of care in private
facilities
The average indirect cost of a normal delivery birthing centre, BEONC, and CEONC level is NPR 9,978,
NPR 10,814, and NPR 930, respectively. Similarly, the indirect cost of a complicated delivery birthing
centre, BEONC, and CEONC level is NPR 27,130, NPR 4,226, and NPR 1,285. The indirect cost of a C-
section delivery at CEONC level is NPR 3,714.
Table 4.21: Indirect cost of normal, complicated, and C-section delivery by level of care in private
facilities (n=12)
Type of
health
facility
Items Normal delivery
(NPR)
Complicated delivery
(NPR)
C-section delivery
(NPR)
Birthing
centre
level
Buildings 2,577 7,531 NA
Equipment 3,793 9,502 NA
Recurrent 3,608 10,097 NA
Total 9,978 27,130 NA
BEONC
level
Buildings 2,227 1,345 NA
Equipment 3,249 1,212 NA
Recurrent 5,338 1,669 NA
Total 10,814 4,226 NA
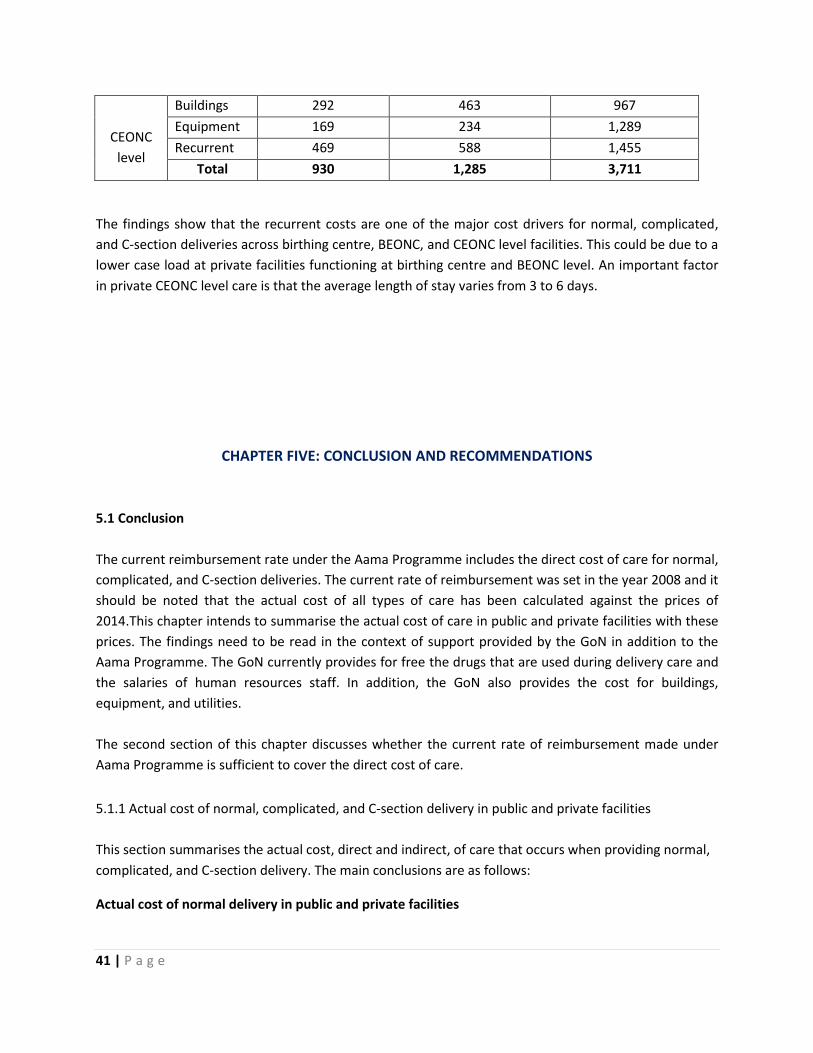
41 | P a g e
CEONC
level
Buildings 292 463 967
Equipment 169 234 1,289
Recurrent 469 588 1,455
Total 930 1,285 3,711
The findings show that the recurrent costs are one of the major cost drivers for normal, complicated,
and C-section deliveries across birthing centre, BEONC, and CEONC level facilities. This could be due to a
lower case load at private facilities functioning at birthing centre and BEONC level. An important factor
in private CEONC level care is that the average length of stay varies from 3 to 6 days.
CHAPTER FIVE: CONCLUSION AND RECOMMENDATIONS
5.1 Conclusion
The current reimbursement rate under the Aama Programme includes the direct cost of care for normal,
complicated, and C-section deliveries. The current rate of reimbursement was set in the year 2008 and it
should be noted that the actual cost of all types of care has been calculated against the prices of
2014.This chapter intends to summarise the actual cost of care in public and private facilities with these
prices. The findings need to be read in the context of support provided by the GoN in addition to the
Aama Programme. The GoN currently provides for free the drugs that are used during delivery care and
the salaries of human resources staff. In addition, the GoN also provides the cost for buildings,
equipment, and utilities.
The second section of this chapter discusses whether the current rate of reimbursement made under
Aama Programme is sufficient to cover the direct cost of care.
5.1.1 Actual cost of normal, complicated, and C-section delivery in public and private facilities
This section summarises the actual cost, direct and indirect, of care that occurs when providing normal,
complicated, and C-section delivery. The main conclusions are as follows:
Actual cost of normal delivery in public and private facilities

42 | P a g e
The total actual cost of providing care for a normal delivery is NPR 2,889. This is a weighted
average cost that includes direct and indirect costs in public and private facilities. The total cost
of a normal delivery in a public facility is NPR 2,536, which is less than national average. The
study further concludes that the cost of a normal delivery is NPR 6,880 in private facilities which
is higher than the national average. The cost of normal delivery care is lower in public facilities
and varies with the geographical region of the facility.
The study shows that the total actual cost of providing a normal delivery in a public facility is
NPR 2,283 in a birthing centre, NPR 2,643 in a BEONC, and NPR 1,911 in a CEONC. The total
actual cost of providing a normal delivery in private facilities is NPR 10,710 at birthing centre
level, NPR 12,054 at BEONC level, and NPR 2,223 at CEONC level. The study concludes that the
actual cost of providing a normal delivery is lower at CEONC level at both public and private
facilities. It also suggests that the actual cost for a normal delivery is relatively higher in private
facilities functioning at BEONC and birthing centre level.
Actual cost of a complicated delivery in public and private facilities
The total actual cost of providing care for complicated deliveries is NPR 4,422. It should be noted
that this includes direct and indirect costs in both public and private facilities. At a public facility,
the total cost for a complicated delivery comes to NPR 3,344. Similarly, the total cost of a
complicated delivery at a private facility is NPR 7,621. The study concludes that the cost of a
complicated delivery at a private facility is higher than the national average, higher than at
public facilities, and is higher across all geographical regions.
Further analysis of the total actual cost for providing a complicated delivery at a public facility by
level of care is NPR 2,470 at birthing centres, NPR 3,532 at BEONCs, and NPR 3,457 at CEONCs.
In private facilities, the cost of providing complicated delivery services is NPR 27,809 at birthing
centres, NPR 6,329 at BEONCs, and NPR 4,278 at CEONCs. This indicates that the cost of
providing a complicated delivery at the lowest level of private facility is generally far higher than
at a higher level facility.
Actual cost of C-section delivery in public and private facilities
The study concludes that the total actual cost for a C-section (direct/indirect and public/private)
is NPR 11,181. The actual cost for providing a C-section delivery in a public facility is NPR 12,250
and NPR 11,506 in a private facility. This suggests that there is little difference in cost in
providing a C-section delivery in public and private facility. No private facilities from the
mountain regions were sampled in the study.
The analysis of actual cost by level of care shows that the cost of C-section delivery in public
CEONCs is NPR 12,250 and is NPR 11,506 in private CEONCs. This is because C-section delivery is
provided mostly by CEONC facilities.

43 | P a g e
5.1.2 Sufficiency of the current rate of reimbursement against Aama Programme guidelines
This section summarises the direct actual cost occurring when providing normal, complicated, and C-
section deliveries at both public and private facilities. Following the current Aama Programme
guidelines, the rate of reimbursement for a normal delivery is NPR 1,000 for hospitals with less than 25
beds up to NPR 1,500 for hospitals with more than 25 beds. Similarly, the current rate of reimbursement
for a complicated delivery is NPR 3,000 and for C-section delivery is NPR 7,000. It should be noted that a
minimal incentive to health workers of NPR 300 is also included in all types of reimbursement rates.
The direct actual cost of a normal delivery in public and private facilities
The study concludes that the total direct cost of a normal delivery is NPR 1,039. This includes the
average direct cost for public and private facilities. Furthermore, analysis shows that the total
direct cost for a normal delivery at a public facility is NPR 1,001 and NPR 1,221 for a private
facility. This suggests that the current rate of reimbursement is sufficient to offset the direct cost
of care for a normal delivery in both public and private facilities. It should be noted that the
direct cost above also includes the cost of human resources.
The direct cost for a normal delivery by level of care in a public facility is NPR 756 at birthing
centre, NPR 815 at BEONC, and NPR 1,245 at CEONC level. Similarly, the direct actual cost at a
private facility functioning at birthing centre level is NPR 732, NPR 1,240 at BEONC level, and
NPR 1,292 at CEONC level. The study suggest that the current rate of reimbursement for a
normal delivery is sufficient to cover the cost at all levels at both public and private facilities. It
should be noted that the findings resemble the current provision of NPR 1,000 for lower level
facilities (with under 25 beds) and NPR 1,500 for higher level facilities (with over 25 beds).
The direct actual cost of a complicated delivery in public and private facilities
The direct actual cost for providing a complicated delivery (by public/private and level of care) is
NPR 2,397. The direct actual cost for a complicated delivery at a public facility is NPR 2,218 and
NPR 2,901 at a private facility. The actual direct cost of providing a complicated delivery is less at
public than at private facilities. The findings suggest that the current rate of reimbursement as
per the Aama Programme guidelines is sufficient to cover the cost of a complicated delivery in
both public and private facilities.
The analysis of the direct cost of a complicated delivery by level of care in public facilities shows
that the cost at birthing centres is NPR 2,158, at BEONCs is NPR 1,335, and at CEONCs is NPR
2,479. Similarly, the direct actual cost by level of care at private facilities shows that cost at
birthing centre level is NPR 679, at BEONC level is NPR 2,102, and at CEONC level is NPR 2,993.
The study suggests that the current rate of reimbursement (NPR3000) is sufficient to cover the
cost of a complicated delivery at each level of care at both public and private facilities.
The direct actual cost of a C-section delivery in public and private facilities

44 | P a g e
The direct actual cost for providing a C-section delivery (public/private and level of care) is NPR
6,345. The direct actual cost for a C-section delivery in a public facility is NPR 5,693 and NPR
7,794 in a private facility. This concludes that the actual direct cost of providing a C-section
delivery is less at public than at private facilities. The findings suggest that the current rate of
reimbursement as per the Aama Programme guidelines (NPR 7,000) is sufficient to cover the
cost of a C-section delivery at public facilities, and slightly insufficient to cover the cost of a C-
section at private facilities.
The analysis of actual cost by level of care shows that the cost of a C-section delivery at a public
CEONC is NPR 5,693 and at a private CEONC is NPR 7,794. This is because C-section delivery is
provided mostly at CEONC facilities.
5.2 Way Forward
The level of provision as per the current Aama Programme guidelines is sufficient to cover the direct
costs required to provide normal, complicated, and C-section deliveries. This provision is mandatory for
all public facilities providing delivery care functioning under the MoHP. However, it also includes
provision for private facilities to implement the programme. This is voluntary provision for private
facilities that are choose to participate. The general idea behind creating the opportunity for the private
sector was that the market determines the price of service and agreeing to implement the Aama
Programme would mean that the defined services could be provided within the current rate of
reimbursement. The benefit of implementing the Aama Programme in the private sector does not have
to be limited to the scope of the current level of direct reimbursement. The Aama Programme could
provide an opportunity to encourage more clients in the future and ensure the required patient flow for
teaching learning activities. Additionally, this study suggests that the current rate of reimbursement
under Aama programme is, in general, sufficient to offset the direct cost required for both public and
private facilities, different levels of facility, levels of care, and all geographical regions. To support the
MoHP in refining the Aama Programme, a number of issues need to be addressed:
It is important to note that public facilities receive funding for both direct and indirect costs
from general taxation. An option for providing total unit costs for delivery would be only be
appropriate if facilities were paid on a case-by-case basis. This may occur if the national social
health insurance programme is rolled out. Paying a higher amount to private facilities (including
indirect payments) would probably be necessary if the public wished to increase the role of the
private sector in providing the Aama Programme. Both of these options would be very
expensive, a key consideration given that the Aama Programme currently accounts for more
than 40% of the FHD’s budget
Another important factor to check is whether there are sufficient funds to cover the necessary
costs. Providing indirect costs to private facilities could be rationalised, however, for public
facilities it could not be fully justified to assign funds from a separate budget to offset their
indirect costs. Setting different levels of reimbursement for public and private might introduce

45 | P a g e
different levels of complexity. The occupancy of hospital beds and building situation have been
major determinants in driving costs in facilities. It is important to take into account the cost of
maintaining buildings and cost of inpatient care when setting levels of reimbursement.
Continuing with the present scenario might be the best option for public facilities where the
majority of costs are taken care of under a different budget heading.
The study has observed varied practices relating to care, the use of diagnostic services, and drug
prescribing patterns. It would be helpful to develop comprehensive national reproductive health
clinical protocols which would help to ensure that guidelines around delivery care practices,
drug prescribing patterns, involvement of trained health workers, use of diagnostics services,
and the use of supplies in both public and private health facilities are adhered to.
In the case of public facilities, almost all items filed under direct and indirect cost are covered
under a separate budget heading. For example, in facilities that are district level or below, drugs
are obtained from central, regional and district supplies under the free drugs programme. Some
of these drugs are used in providing delivery services. Similarly, salaries for staff and recurrent
costs necessary to run the facility (including the purchasing of equipment) are separately
covered under a different budget heading. Additionally, the public facilities are financed from a
separate budget overseen by a different department. The main issue is that these additional
budget lines are generally not linked to levels of facilities and types of activity. As a
consequence, very busy facilities are not compensated for providing services to additional
patients and so the quality of care possible can suffer.
Linking the Aama Programme with other schemes like the free essential drugs programme,
unconditional grants to hospitals, and reimbursement to lower level facilities for providing free
outpatient services would help reduce the administrative, management, monitoring, and
reporting costs and will ensure value for money.
Clear guidelines on how use the savings from the current rate of reimbursement would help
improve the delivery services in health facilities.
The study suggests that the private facilities functioning at a lower level demand higher costs for
complicated and C-section deliveries. Thus, one important step forward would be only continue
the Aama Programme in hospitals where there is a higher case load and they fully comply with
the Aama guidelines such as NGO/Mission/Community hospitals or teaching hospitals.
The broken-down costs of providing delivery care from this study would be useful for a national
social health insurance programme as a basis for the reimbursement of its accredited health
facilities.
The current rate of reimbursement is insufficient to reimburse the indirect cost of care. This has
serious implications for private facilities where enough money has to be made to offset the
share of indirect costs i.e. buildings, equipment, and recurrent costs. A major service expense
comes from the indirect costs in a private facility, especially if the bed occupancy of the facility is
low. A policy discussion is thus required on whether the Aama Programme should be expanded
to more private facilities including a consideration of the additional funding that this would
require.

46 | P a g e

47 | P a g e
References
Drummond, M. F. (2005). Methods for the economic evaluation of health care programme, Oxford:
Oxford University Press, 2005.
Ensor T and Witter S (2008). Proposed Revisions to the SDIP: Strengthening a Major National Initiative
for Safe Motherhood in Nepal. Oxford Policy Management.
FHD (2002). National Safe Motherhood Plan Family Health Division and Department of Health Services,
Kathmandu Nepal
FHD (2006). National Safe Motherhood and New born Health- Long Term Health Plan, Family Health
Division and Department of Health Services, Kathmandu, Nepal.
FHD (2005). Maternity Incentive Scheme Policy Guideline, Family Health Division and Department of
Health Services, Kathmandu, Nepal.
FHD (2006). Safe Delivery Incentive Scheme Policy Guideline, Family Health Division and Department of
Health Services, Kathmandu, Nepal.
FHD (2009). Aama Programme Policy Guideline, Family Health Division and Department of Health
Services, Kathmandu, Nepal.
FHD (2012). Aama Programme Policy Guideline Second Revision, Family Health Division and Department
of Health Services, Kathmandu, Nepal.
FHD and NHSSP (2013) Responding to Increased Demand for Institutional Childbirths at Referral
Hospitals in Nepal: Situational Analysis and Emerging Options. Family Health Division and Nepal
Health Sector Support Programme.
FHD (2007). Clinical Protocol for Medical Officer, Family Health Division, and Department of health
Services, Kathmandu, and Nepal.
Mogyorosy Z, Smith P, (2005). The main methodological issues in costing health care services: A
literature Review. Centre for Health Economics, University of York, UK.
MOHP (2012). Nepal Demographic and Health Survey. Ministry of Health and Population, New Era,
Kathmandu, Nepal.
NHEA (2004). Public Health Facility Efficiency Survey. Kathmandu: Nepal Health Economics Association.
Submitted to District Health Strengthening Project (DHSP)/British Council.
Powell-Jackson T, Tiwari S, Neupane BD, Singh M (2010). An Early Evaluation of the Aama “Free Delivery
Care” Programme. Kathmandu: Support to the Safe Motherhood Programme.
Powell-Jackson T, Hanson K (2012). Financial Incentives for Maternal Health: Impact of a National
Programme in Nepal. Journal of Health Economics 31: 271-284.
Powell-Jackson T, Neupane BD, Tiwari S, Morrison J, Costello A (2008). Evaluation of the Safe Delivery
Incentive Programme. Kathmandu: Support to Safe Motherhood Programme.
Sanders R. One Health Model Intervention Treatment Assumptions (2013). World health Organization,
Draft 28th September 2013.

48 | P a g e
Upreti SR, Baral S, Lamichhane P, Khanal MN, Tiwari S, Tandan M, Elsey H and Lievens T (2013). Rapid
Assessment of the Demand Side Financing Schemes: Aama and 4ANC Programmes (The Seventh).
WHO (2008) Managing prolonged and obstructed labour, Midwifery Education module 2nd Edition,
World Health Organization, Geneva Rapid Assessment. Kathmandu: Ministry of Health and
Population, Nepal Health Sector Support Programme and Health Research and Social
Development Forum.

49 | P a g e
Annex I: Standard Definition of Complications
S.N Condition Standard Definition
1 Antepartum
haemorrhage
Vaginal bleeding after 22 weeks of pregnancy
Vaginal bleeding in labour before delivery
2 Post-partum
haemorrhage
Bleeding from the genital tract of 1000ml or more following the
delivery of the baby, within the first 24 hours, or until six weeks from
delivery
3 Pre- eclampsia Pre-eclampsia: Gestational hypertension with significant proteinuria
(>= 0.3 g/l) after 20 weeks of gestation or during labour and/or within
48 hours of delivery
Mild pre-eclampsia: two readings of diastolic blood pressure ,110, four
hours apart after 20 weeks of gestation with proteinuria up to 2+
Severe pre-eclampsia: Diastolic BP 110 or more after 20 weeks of
gestation with proteinuria more than 2+
4 Eclampsia Convulsions occurring ante-, intra- or postpartum, associated with high
blood pressure and proteinuria
5 Retained placenta Placenta not delivered within 30 minutes after delivery
6 Puerperal sepsis Infection of the genital tract occurring any time between rupture of
membranes or labour and 42 day postpartum marked by pelvic pain,
fever, abnormal vaginal discharge, foul odour of discharge, and a delay
in the rate of reduction on the size of uterus (<2cm/day during the first
eight days).
7 Prolong/obstructed
labour
Prolonged labour: onset of regular, rhythmical, painful contractions
accompanied by cervical dilation where labour is longer than 24 hours
Obstructed labour: In spite of strong contractions of the uterus, the
foetus cannot descend through the pelvis because of a barrier
preventing its descent
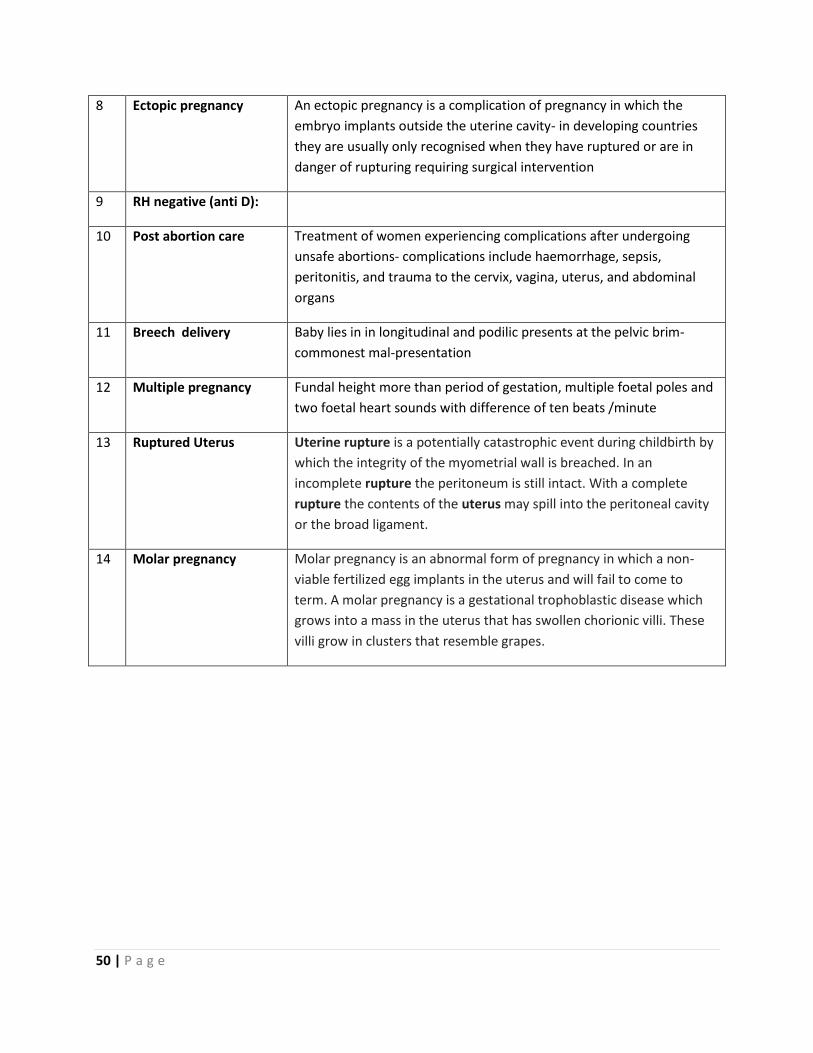
50 | P a g e
8 Ectopic pregnancy An ectopic pregnancy is a complication of pregnancy in which the
embryo implants outside the uterine cavity- in developing countries
they are usually only recognised when they have ruptured or are in
danger of rupturing requiring surgical intervention
9 RH negative (anti D):
10 Post abortion care Treatment of women experiencing complications after undergoing
unsafe abortions- complications include haemorrhage, sepsis,
peritonitis, and trauma to the cervix, vagina, uterus, and abdominal
organs
11 Breech delivery Baby lies in in longitudinal and podilic presents at the pelvic brim-
commonest mal-presentation
12 Multiple pregnancy Fundal height more than period of gestation, multiple foetal poles and
two foetal heart sounds with difference of ten beats /minute
13 Ruptured Uterus Uterine rupture is a potentially catastrophic event during childbirth by
which the integrity of the myometrial wall is breached. In an
incomplete rupture the peritoneum is still intact. With a complete
rupture the contents of the uterus may spill into the peritoneal cavity
or the broad ligament.
14 Molar pregnancy Molar pregnancy is an abnormal form of pregnancy in which a non-
viable fertilized egg implants in the uterus and will fail to come to
term. A molar pregnancy is a gestational trophoblastic disease which
grows into a mass in the uterus that has swollen chorionic villi. These
villi grow in clusters that resemble grapes.

51 | P a g e
Annex II: Conditions Listed for Complicated and C-Section in the Aama Programme
Conditions listed as complicated delivery service
in Aama guidelines for unit cost reimbursement
C-section conditions listed for C-section service
in Aama guidelines for unit cost reimbursement
1.Antepartum haemorrhages (APH)
2.Postpartum haemorrhages (PPH)
3.Pre-eclampsia
4.Eclampsia
5.Retained placenta
6.Puerperal sepsis
7.Instrumental deliveries
8.Multiple pregnancies/breech deliveries
9.RH negative (anti-D)
10.Post-abortion care
11.Prolonged/obstructed labour
12.Ectopic pregnancies
13.Ruptured uteruses
14.Post-abortion perforation

52 | P a g e
Annex III: 75 Districts Stratified by Functionality of CEONC and C-section Facility in Private
Ecological
region
Eastern
(n)=16
Central
(n)=19
Western
(n)=16
Mid-western
(n)=15
Far-western
(n)=9
No government CEONC
Mountain
Rasuwa
Manang
Mustang
Dolpa
Humla
Mugu
Hill
Sindhuli
Ramechap
Parbat
Jajarkot
Tarai
Government CEONC functional
Mountain
Sankhuwasab
ha
Solukhumbu
Taplejung
Dolakha
Jumla
Kalikot
Bajhang
Hill
Panchthar
Bhojpur
Illam
khotang
Terathum
Udaypur
Bhaktapur
Dhadhing
Makwanpur
Nuwakot
Baglung
Gorkha
Gulmi
Tanahu
Dailekh Rolpa
Pyuthan
Surkhet
Salyan
Doti
Dadeldhura
Tarai Saptari
Bara
Rautahat
Dhanusa
Mahottari
Kapilvastu
Nawalparasi
Bardiya Dang
Kailali
Government CEONC non functional
Mountain
Sindhupalch
owk
Darchula
Bajura
Hill
Dhankuta
Arghakanchi
Syangja
Myagdi
Baitadi
Tarai Sarlahi Kanchanpur
Both government CEONC and private with C-section
Mountain
Hill
Kathmandu Kaski Rukum Accham
Tarai
Morang
Sunsari
Jhapa
Siraha
Parsa
Chitwan
Rupandehi
Banke

53 | P a g e
Only Private with C-section
Mountain
Hill
Okhaldhunga
Kavre
Lalitpur
Lamjung
Palpa
Tarai

54 | P a g e
Annex IV: Government health facilities status of the study districts
S.N Districts Geographi
cal Region Health facility segregation Total
Central
hospital
Zonal
hospital
District
hospital PHCC
Health
post SHP
1 Solukhumbu Mountain 0 0 1 2 18 14 35
2 Dhankuta Hill 0 0 1 2 24 11 38
3 Kathmandu Hill 1 0 0 8 24 34 67
4 Sarlahi Tarai 0 0 1 5 10 84 100
5 Mustang Mountain 0 0 1 1 12 3 17
6 Lamjung Hill 0 0 0 2 20 38 60
7 Banke Tarai 0 1 0 3 20 24 48
8 Jajarkot Hill 0 0 1 3 15 21 40
9 Kailai Tarai 0 1 1 5 20 17 44
10 Doti Hill 0 0 1 2 20 29 52
Total 1 2 7 33 183 275 501
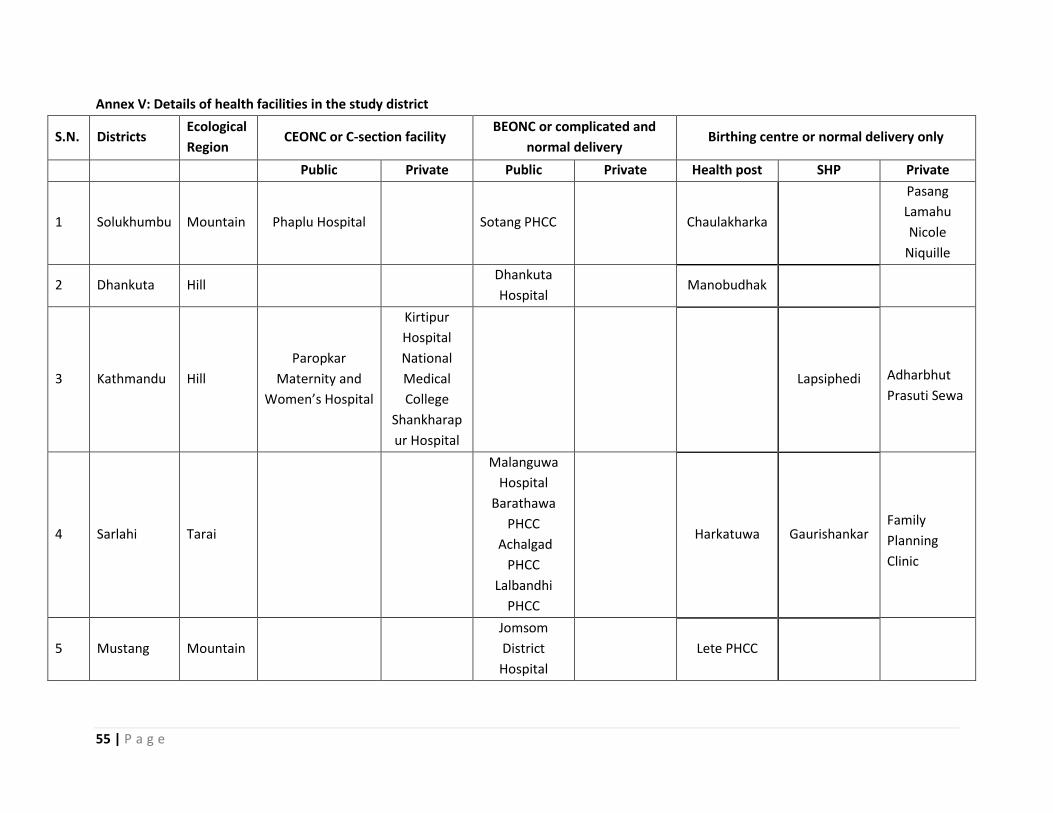
55 | P a g e
Annex V: Details of health facilities in the study district
S.N. Districts Ecological
Region CEONC or C-section facility
BEONC or complicated and
normal delivery Birthing centre or normal delivery only
Public Private Public Private Health post SHP Private
1 Solukhumbu Mountain Phaplu Hospital Sotang PHCC
Chaulakharka
Pasang
Lamahu
Nicole
Niquille
2 Dhankuta Hill Dhankuta
Hospital Manobudhak
3 Kathmandu Hill
Paropkar
Maternity and
Women’s Hospital
Kirtipur
Hospital
National
Medical
College
Shankharap
ur Hospital
Lapsiphedi Adharbhut
Prasuti Sewa
4 Sarlahi Tarai
Malanguwa
Hospital
Barathawa
PHCC
Achalgad
PHCC
Lalbandhi
PHCC
Harkatuwa Gaurishankar Family
Planning
Clinic
5 Mustang Mountain
Jomsom
District
Hospital
Lete PHCC
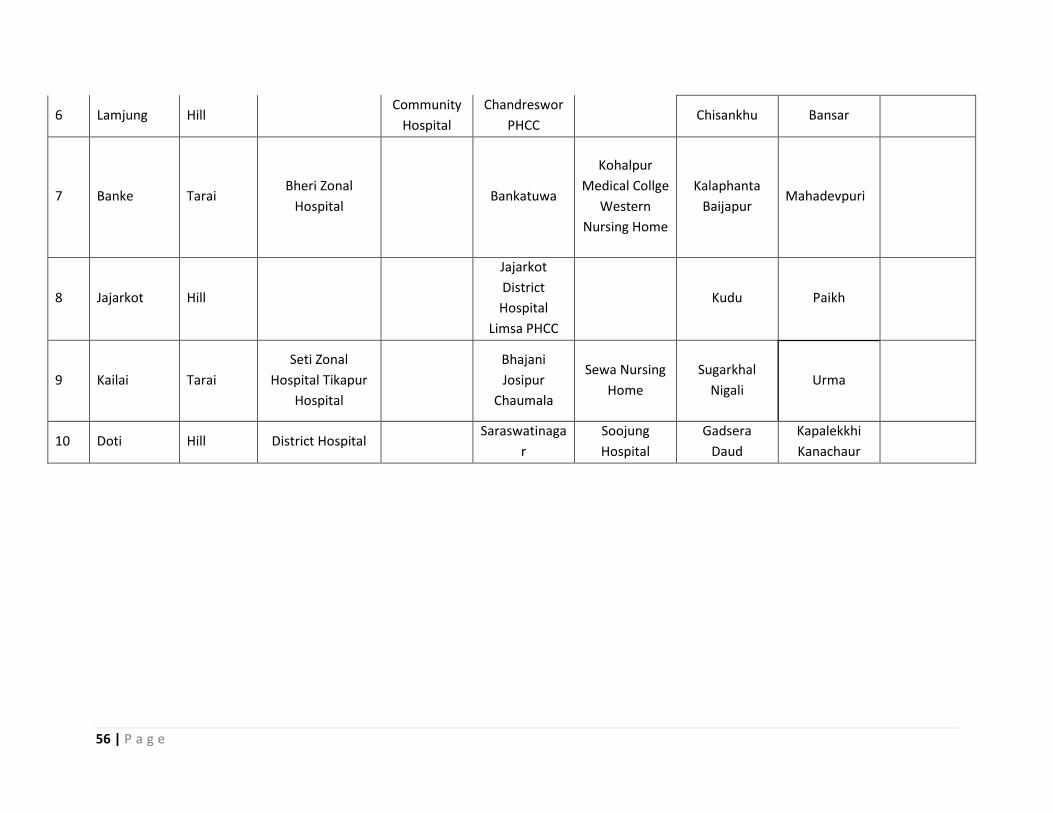
56 | P a g e
6 Lamjung Hill
Community
Hospital
Chandreswor
PHCC Chisankhu Bansar
7 Banke Tarai Bheri Zonal
Hospital Bankatuwa
Kohalpur
Medical Collge
Western
Nursing Home
Kalaphanta
Baijapur Mahadevpuri
8 Jajarkot Hill
Jajarkot
District
Hospital
Limsa PHCC
Kudu Paikh
9 Kailai Tarai
Seti Zonal
Hospital Tikapur
Hospital
Bhajani
Josipur
Chaumala
Sewa Nursing
Home
Sugarkhal
Nigali Urma
10 Doti Hill District Hospital Saraswatinaga
r
Soojung
Hospital
Gadsera
Daud
Kapalekkhi
Kanachaur
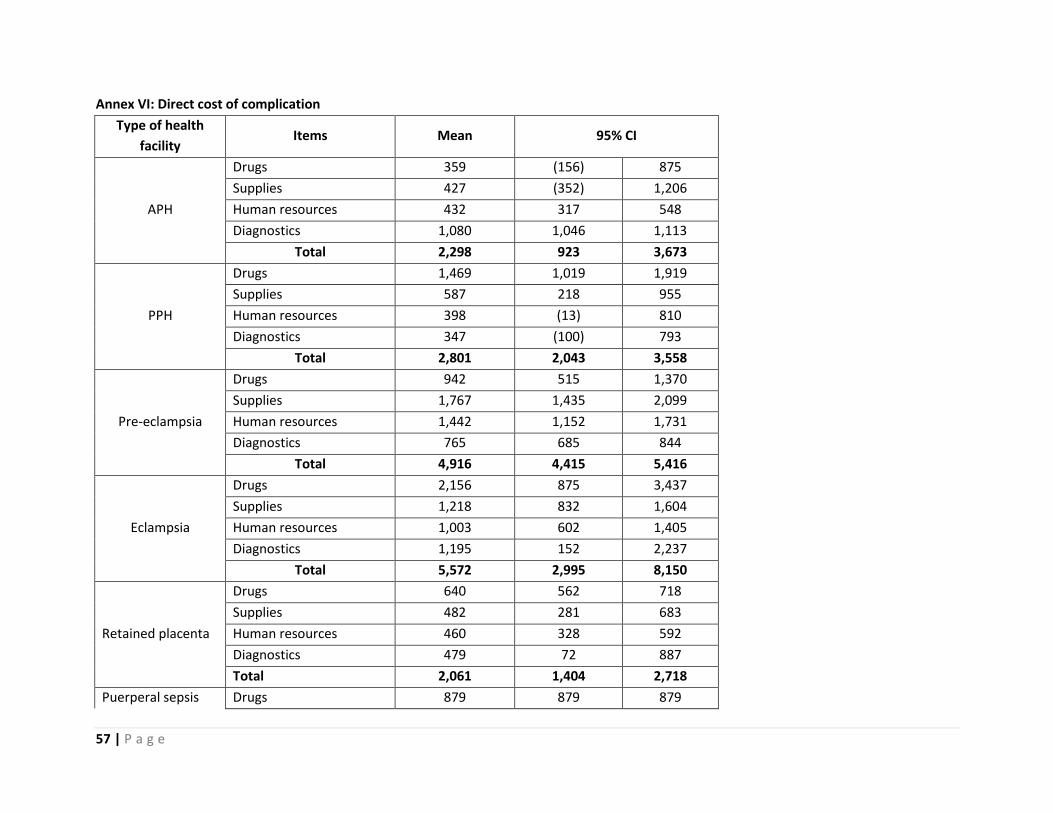
57 | P a g e
Annex VI: Direct cost of complication
Type of health
facility Items Mean 95% CI
APH
Drugs 359 (156) 875
Supplies 427 (352) 1,206
Human resources 432 317 548
Diagnostics 1,080 1,046 1,113
Total 2,298 923 3,673
PPH
Drugs 1,469 1,019 1,919
Supplies 587 218 955
Human resources 398 (13) 810
Diagnostics 347 (100) 793
Total 2,801 2,043 3,558
Pre-eclampsia
Drugs 942 515 1,370
Supplies 1,767 1,435 2,099
Human resources 1,442 1,152 1,731
Diagnostics 765 685 844
Total 4,916 4,415 5,416
Eclampsia
Drugs 2,156 875 3,437
Supplies 1,218 832 1,604
Human resources 1,003 602 1,405
Diagnostics 1,195 152 2,237
Total 5,572 2,995 8,150
Retained placenta
Drugs 640 562 718
Supplies 482 281 683
Human resources 460 328 592
Diagnostics 479 72 887
Total 2,061 1,404 2,718
Puerperal sepsis Drugs 879 879 879

58 | P a g e
Supplies 96 93 99
Human resources 306 306 307
Diagnostics 674 673 676
Total 1,955 1,955 1,957
Prolong/obstructed
labor
Drugs 1,139 931 1,347
Supplies 1,457 1,128 1,786
Human resources 1,005 698 1,313
Diagnostics 616 434 799
Total 4,217 3,261 5,173
Ectopic pregnancy
Drugs 2,103 1,342 2,865
Supplies 1,958 944 2,972
Human resources 1,271 21 2,520
Diagnostics 990 811 1,169
Total 6,322 3,150 9,494
RH Anti D/ normal
delivery
Drugs 327 180 475
Supplies 220 196 245
Human resources 307 217 398
Diagnostics 279 104 454
Total 1133 838 1429
RH Anti D/
complicated
delivery
Drugs 928 603 1252
Supplies 481 296 666
Human resources 431 267 595
Diagnostics 621 169 1074
Total 2461 2084 2837
Post abortion
complication
Drugs 689 561 816
Supplies 556 336 777
Human resources 535 436 634
Diagnostics 920 766 1,074
Total 2,700 2,474 2,925

59 | P a g e
Ruptured Uterus
Drugs 3,813 3,085 4,542
Supplies 2,147 1,178 3,115
Human resources 1,684 1,353 2,015
Diagnostics 2,130 1,427 2,833
Total 9,774 8,940 10,608
Molar pregnancy
Drugs 1,121 1,044 1,197
Supplies 305 168 443
Human resources 412 393 431
Diagnostics 1,349 1,308 1,391
Total 3,187 2,993 3,381
Note: The direct cost of twin and breech delivery does not influence the cost of care. It largely depends on the obstetric complication and
procedure utilised.

60 | P a g e
B
Type of health facility
Items Mean 95% CI
Vacuum delivery
Drugs 513 331 695
Supplies 480 317 644
Human resources 445 255 636
Diagnostics 468 231 705
Total 1,906 1,436 2,377
Forceps delivery
Drugs 1,018 (120) 2,157
Supplies 572 230 915
Human resources 869 659 1,078
Diagnostics 756 431 1,081
Total 3,215 1,946 4,485
C-section
Drugs 1,834 1,258 2,409
Supplies 2,223 1,471 2,976
Human resources 1,371 891 1,852
Diagnostics 745 590 900
Total 6,173 4,322 8,024
Laparotomy
Drugs 2,640 2,447 2,834
Supplies 1,932 1,180 2,684
Human resources 1,434 750 2,119
Diagnostics 1,335 1,182 1,489
Total 7,341 5,946 8,738
Evacuation
Drugs 878 839 917
Supplies 330 318 342
Human resources 400 394 407
Diagnostics 1,369 1,362 1,376
Total 2,977 2,925 3,030

61 | P a g e
MVA
Drugs 508 190 826
Supplies 517 171 863
Human resources 336 304 368
Diagnostics 737 535 940
Total 2,098 1,481 2,715
MRP
Drugs 621 536 706
Supplies 493 195 791
Human resources 438 317 559
Diagnostics 341 16 666
Total 1,893 1,311 2,475
Medical management
Drugs 1,209 440 1,978
Supplies 403 342 464
Human resources 377 61 693
Diagnostics 394 (115) 902
Total 2,383 2,200 2,565
D&C
Drugs 1,104 663 1,546
Supplies 1,473 1,140 1,807
Human resources 589 170 1,009
Diagnostics 823 612 1,033
Total 3,989 3,845 4,135


![Własności elastyczne komórek i tkanek od fizyki do zastosowań · 2019-01-31 · SNAP Protocol (COST Action TD1002) Scientific Reports 7 (2017) 5117 0 2000 4000 6000 8000 a.u.]](https://img.pdfslide.tips/doc/110x75/5f8fc34cc48fc024743d2399/wasnoci-elastyczne-komrek-i-tkanek-od-fizyki-do-zastosowa-2019-01-31-snap.jpg)