Embed Size (px)
Citation preview

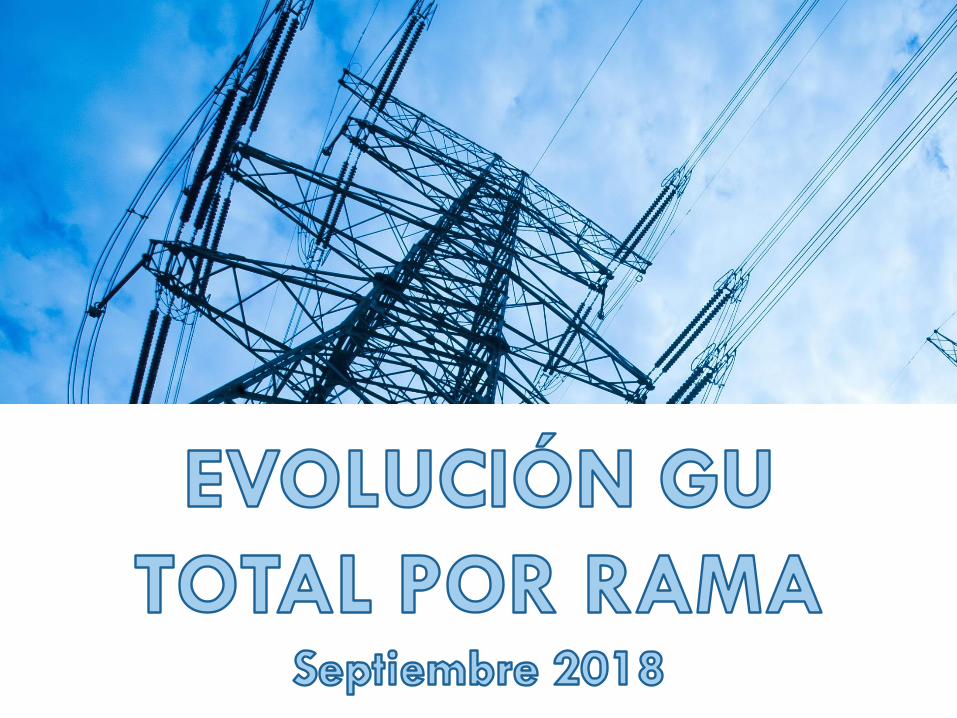
EVOLUCIÓN DE LA DEMANDA POR RAMA Y ACTIVIDAD
Septiembre 2018

INTRODUCCIÓNEn el presente trabajo se encuentra analizado el seguimiento de lagran demanda mayor, GU TOTAL, clasificados por rama y actividadde acuerdo a su producción o servicio que prestan, desde Enero 2011a la fecha.
Partiendo de una base de casi 7000 empresas entre GUMAs, GUMEsy GUDIs, que representan aprox. el 97% de la gran demanda mayora nivel país, se analiza la evolución de la demanda durante los últimosaños.
El informe comienza con un análisis de la demanda, dando unaimportancia mayor al mes de análisis, Septiembre 2018, detallandoel comportamiento y la evolución de la demanda clasificando a lamisma por rama y actividad.
El análisis termina con la comparación de la demanda totalrelacionada con los meses de este 2018, de Enero a Septiembre,respecto al mismo periodo del año anterior, observando elcomportamiento por trimestre, por rama y actividad.

CONCLUSIONES GU TOTALA diferencia de los meses anteriores, donde se presentó un crecimiento de la grandemanda, desde Junio 2018 se comenzó a observa una caída de la grandemanda. Septiembre 2018 no fue la excepción, con una variación negativarespecto al mismo período del año anterior.
Con crecimientos medios en la demanda desde el mes de Mayo 2017 en el ordendel 3.5%, en el mes de Septiembre 2018 la gran demanda tuvo una variaciónnegativa del orden de -5.9%.
Si miramos en detalle esta variación de la demanda, se observa una baja en losconsumos de casi todas las ramas de la industria relacionadas con Alimentación,Comercios y Servicios, Industrias, y Petróleo/Minerales
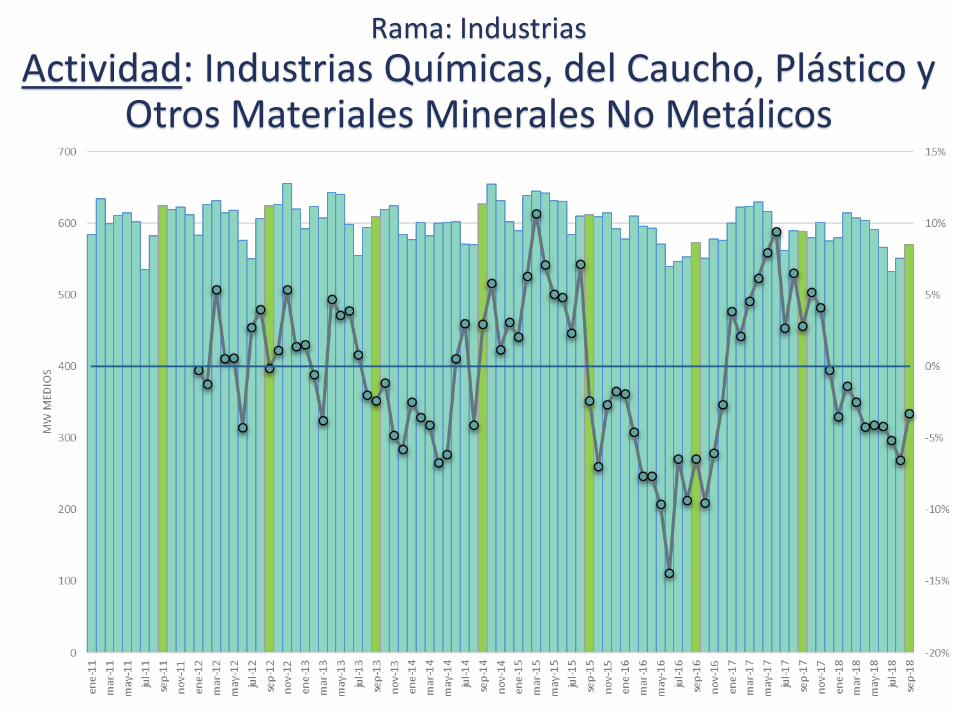
Observando por actividad e importancia de acuerdo a sus consumos, se presentauna disminución en la demanda en empresas cuyas actividades se relacionan con laindustria de la alimentación y artículos de consumo masivo, y la industrias químicas,del caucho, plástico y otros materiales minerales no metálicos.
En lo que va de este año 2018, observando los primeros 9 meses, Enero aSeptiembre, prácticamente no hay variación en la demanda.
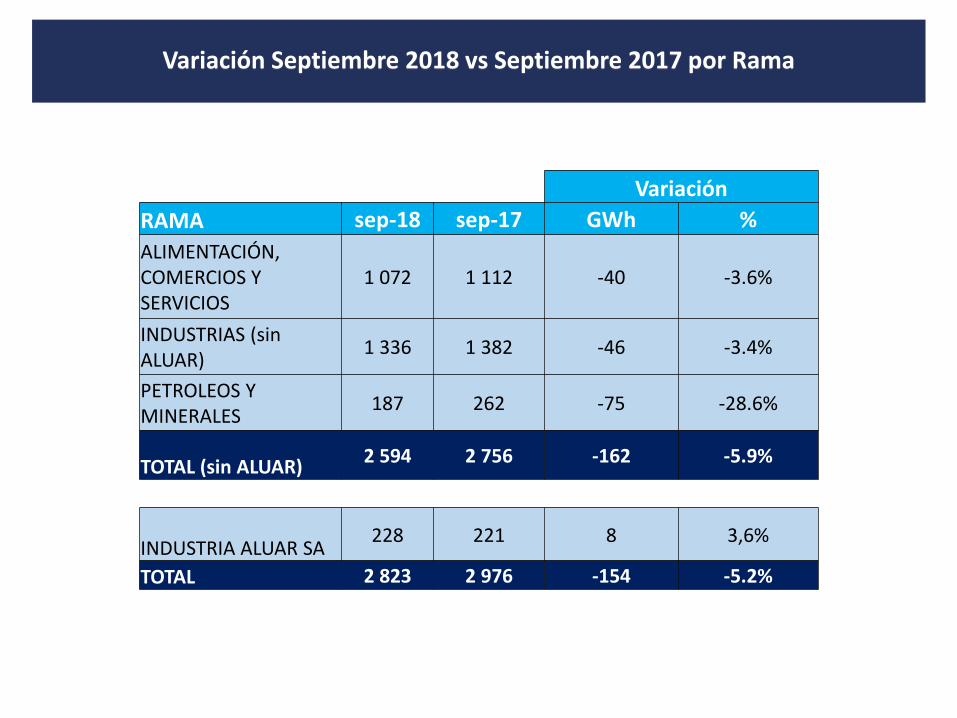
Variación Septiembre 2018 vs Septiembre 2017 por Rama
Variación
RAMA sep-18 sep-17 GWh %
ALIMENTACIÓN, COMERCIOS Y SERVICIOS
1 072 1 112 -40 -3.6%
INDUSTRIAS (sin ALUAR)
1 336 1 382 -46 -3.4%
PETROLEOS Y MINERALES
187 262 -75 -28.6%
TOTAL (sin ALUAR)2 594 2 756 -162 -5.9%
INDUSTRIA ALUAR SA228 221 8 3,6%
TOTAL 2 823 2 976 -154 -5.2%
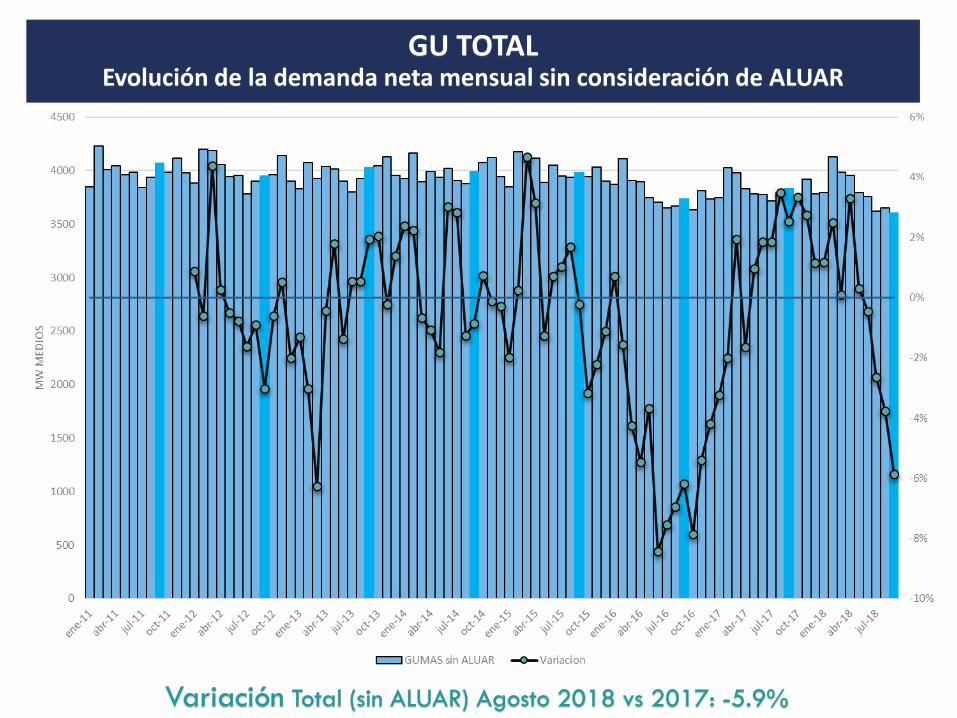
GU TOTALEvolución de la demanda neta mensual sin consideración de ALUAR
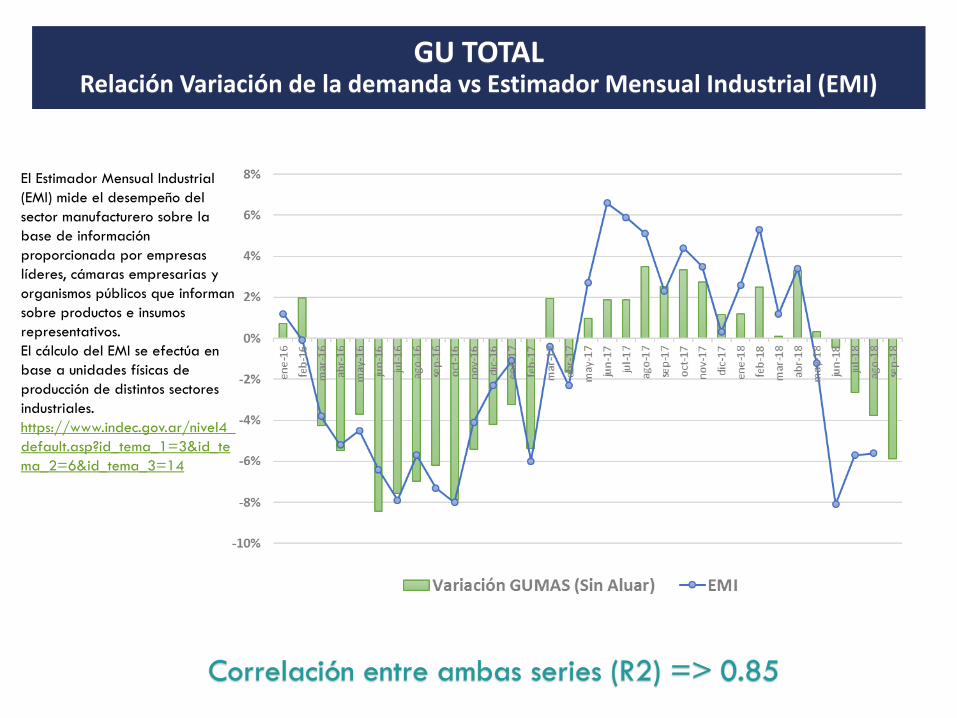
El Estimador Mensual Industrial
(EMI) mide el desempeño del
sector manufacturero sobre la
base de información
proporcionada por empresas
líderes, cámaras empresarias y
organismos públicos que informan
sobre productos e insumos
representativos.
El cálculo del EMI se efectúa en
base a unidades físicas de
producción de distintos sectores
industriales.
https://www.indec.gov.ar/nivel4_
default.asp?id_tema_1=3&id_te
ma_2=6&id_tema_3=14
GU TOTALRelación Variación de la demanda vs Estimador Mensual Industrial (EMI)
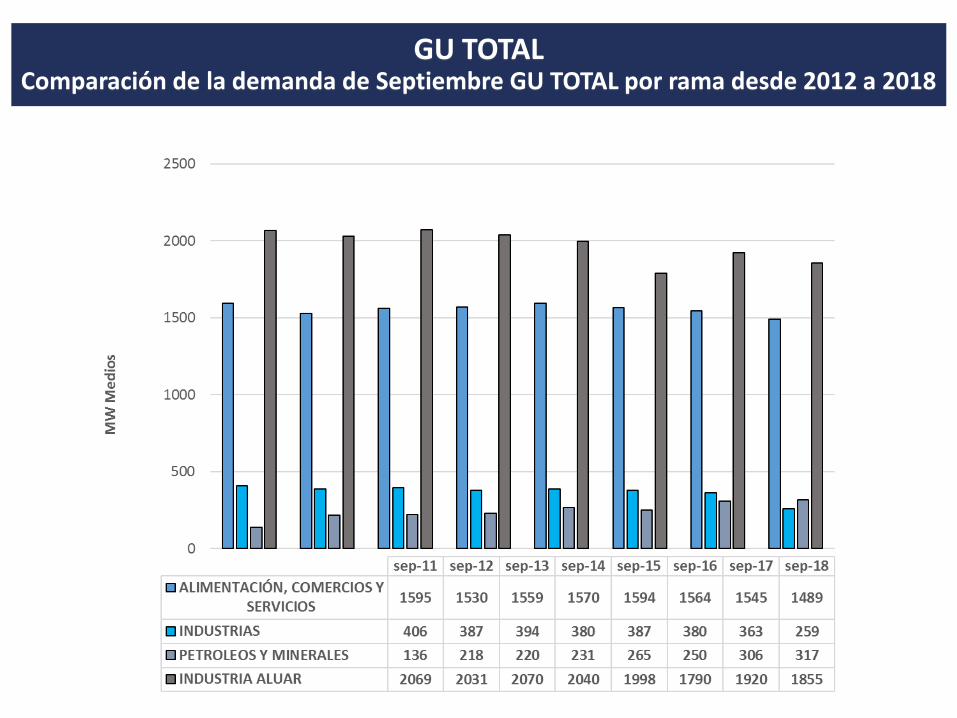
GU TOTALComparación de la demanda de Septiembre GU TOTAL por rama desde 2012 a 2018
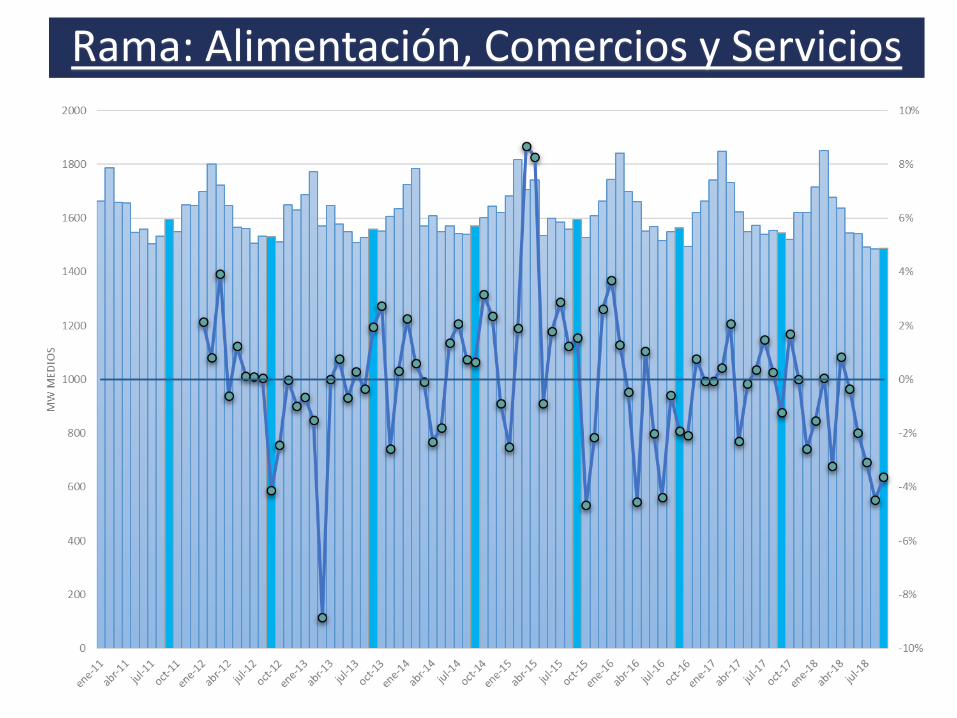
Rama: Alimentación, Comercios y Servicios
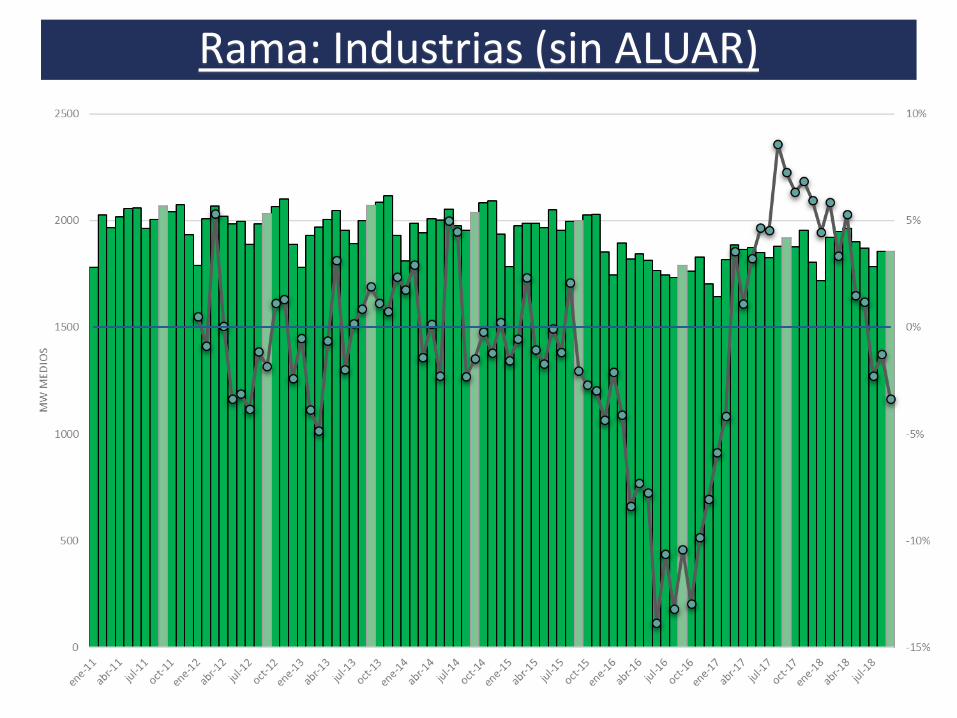
Rama: Industrias (sin ALUAR)

Rama: Petróleos y Minerales (*)
(*) AÑO 2018: Dentro de la rama PETROLEO y MINERALES, gran parte de la caída en la demanda se explica por la reducción en la producción de Minera Alumbrera en este
año 2018 por cambios en la modalidad de extracción.

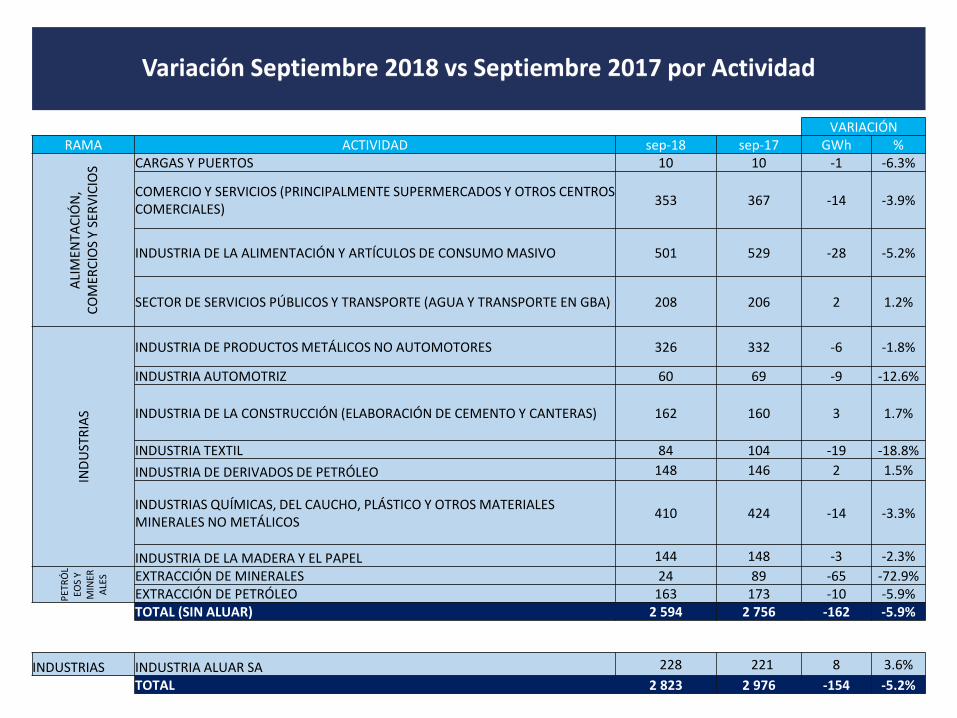
Variación Septiembre 2018 vs Septiembre 2017 por Actividad
VARIACIÓNRAMA ACTIVIDAD sep-18 sep-17 GWh %
ALI
MEN
TAC
IÓN
, C
OM
ERC
IOS
Y SE
RV
ICIO
S CARGAS Y PUERTOS 10 10 -1 -6.3%
COMERCIO Y SERVICIOS (PRINCIPALMENTE SUPERMERCADOS Y OTROS CENTROS COMERCIALES)
353 367 -14 -3.9%
INDUSTRIA DE LA ALIMENTACIÓN Y ARTÍCULOS DE CONSUMO MASIVO 501 529 -28 -5.2%
SECTOR DE SERVICIOS PÚBLICOS Y TRANSPORTE (AGUA Y TRANSPORTE EN GBA) 208 206 2 1.2%
IND
UST
RIA
S
INDUSTRIA DE PRODUCTOS METÁLICOS NO AUTOMOTORES 326 332 -6 -1.8%
INDUSTRIA AUTOMOTRIZ 60 69 -9 -12.6%
INDUSTRIA DE LA CONSTRUCCIÓN (ELABORACIÓN DE CEMENTO Y CANTERAS) 162 160 3 1.7%
INDUSTRIA TEXTIL 84 104 -19 -18.8%
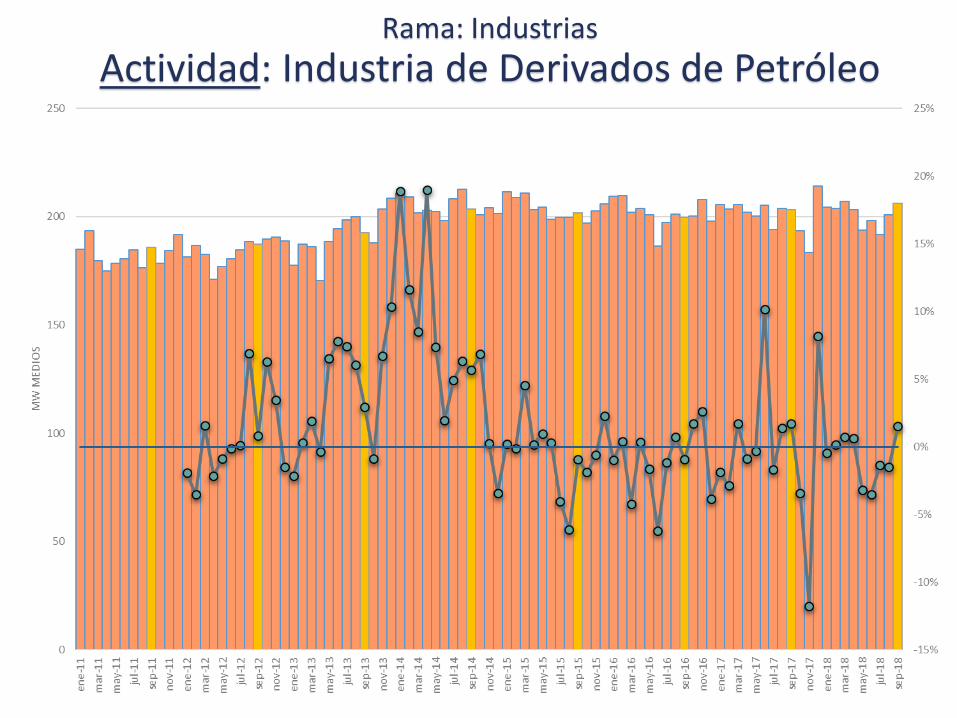
INDUSTRIA DE DERIVADOS DE PETRÓLEO 148 146 2 1.5%
INDUSTRIAS QUÍMICAS, DEL CAUCHO, PLÁSTICO Y OTROS MATERIALES MINERALES NO METÁLICOS
410 424 -14 -3.3%
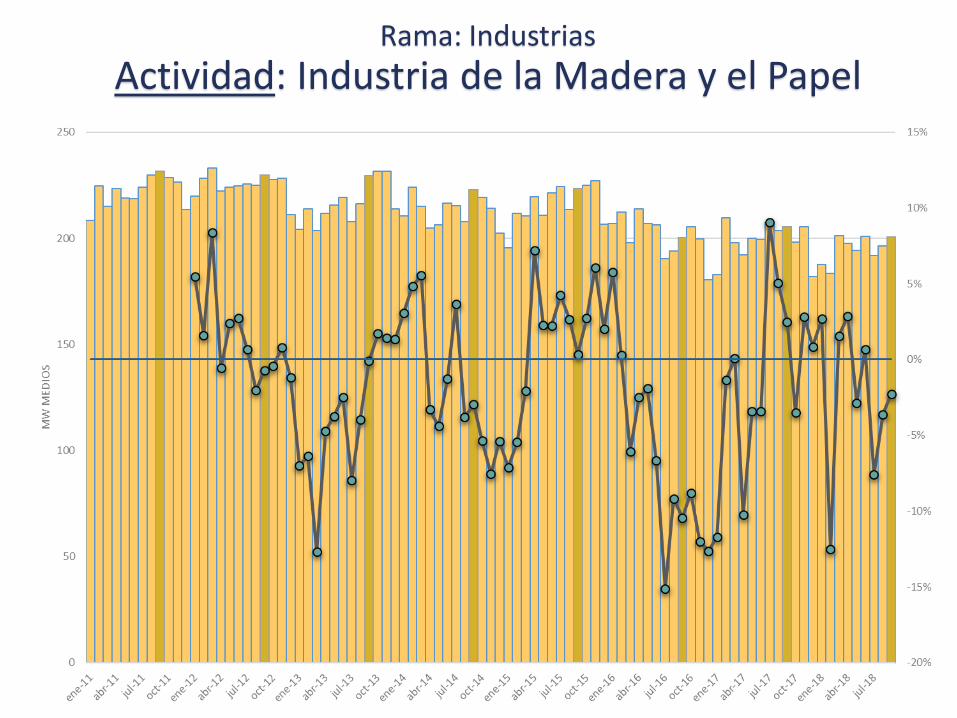
INDUSTRIA DE LA MADERA Y EL PAPEL 144 148 -3 -2.3%
PET
RÓ
LEO
S Y
MIN
ERA
LES EXTRACCIÓN DE MINERALES 24 89 -65 -72.9%
EXTRACCIÓN DE PETRÓLEO 163 173 -10 -5.9%TOTAL (SIN ALUAR) 2 594 2 756 -162 -5.9%
INDUSTRIAS INDUSTRIA ALUAR SA 228 221 8 3.6%
TOTAL 2 823 2 976 -154 -5.2%
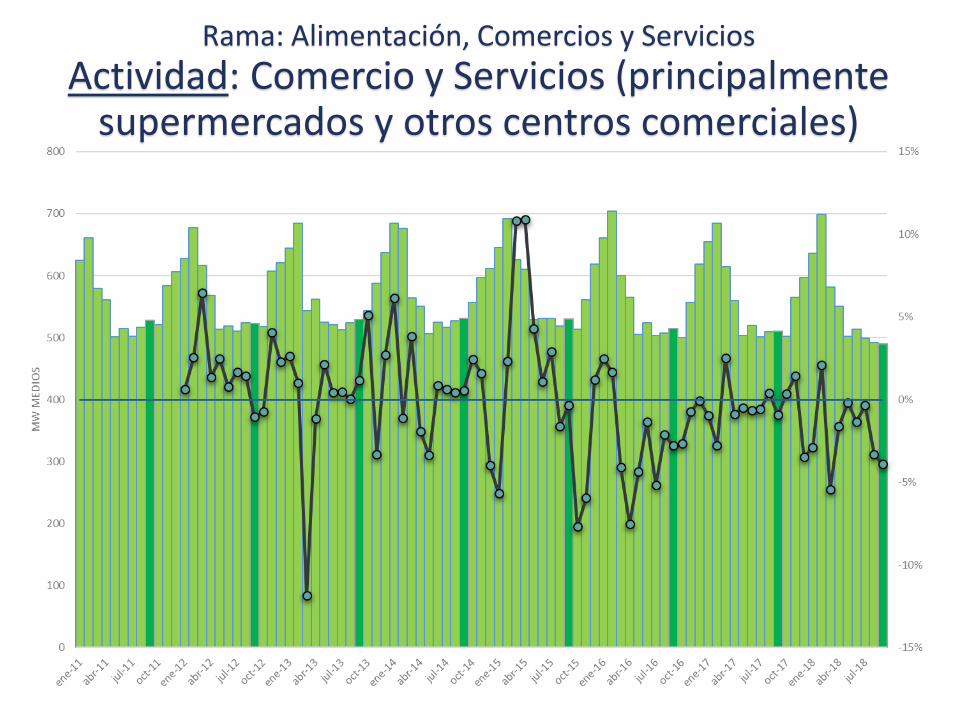
Rama: Alimentación, Comercios y Servicios
Actividad: Comercio y Servicios (principalmente supermercados y otros centros comerciales)

Rama: Alimentación, Comercios y Servicios
Actividad: Industria de la Alimentación y Artículos de Consumo Masivo
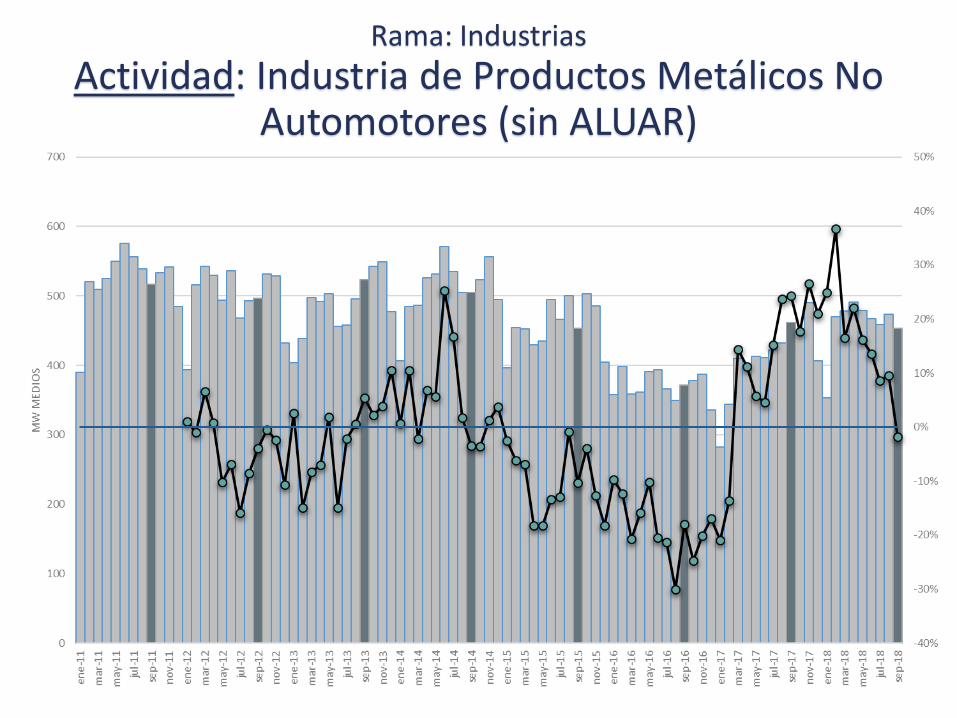
Rama: Industrias
Actividad: Industria de Productos Metálicos No Automotores (sin ALUAR)

Rama: Industrias
Actividad: Industria Automotriz

Rama: Industrias
Actividad: Industria de la Construcción (elaboración de cemento y canteras)

Rama: Industrias
Actividad: Industria Textil
Rama: Industrias
Actividad: Industria de Derivados de Petróleo
Rama: Industrias
Actividad: Industrias Químicas, del Caucho, Plástico y Otros Materiales Minerales No Metálicos
Rama: Industrias
Actividad: Industria de la Madera y el Papel
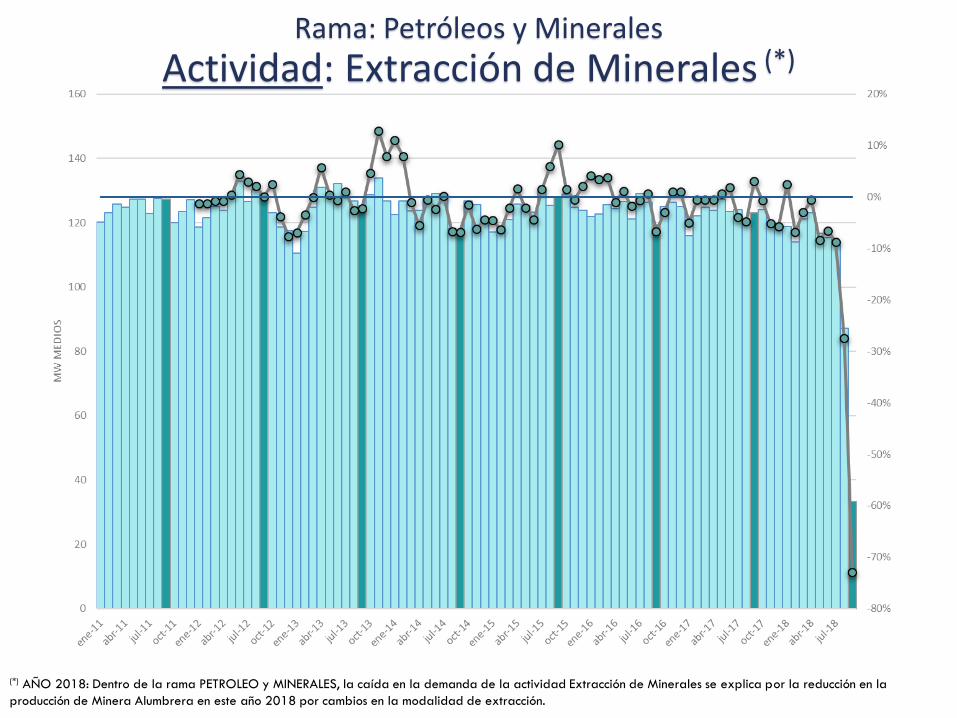
Rama: Petróleos y Minerales
Actividad: Extracción de Minerales (*)
(*) AÑO 2018: Dentro de la rama PETROLEO y MINERALES, la caída en la demanda de la actividad Extracción de Minerales se explica por la reducción en la
producción de Minera Alumbrera en este año 2018 por cambios en la modalidad de extracción.
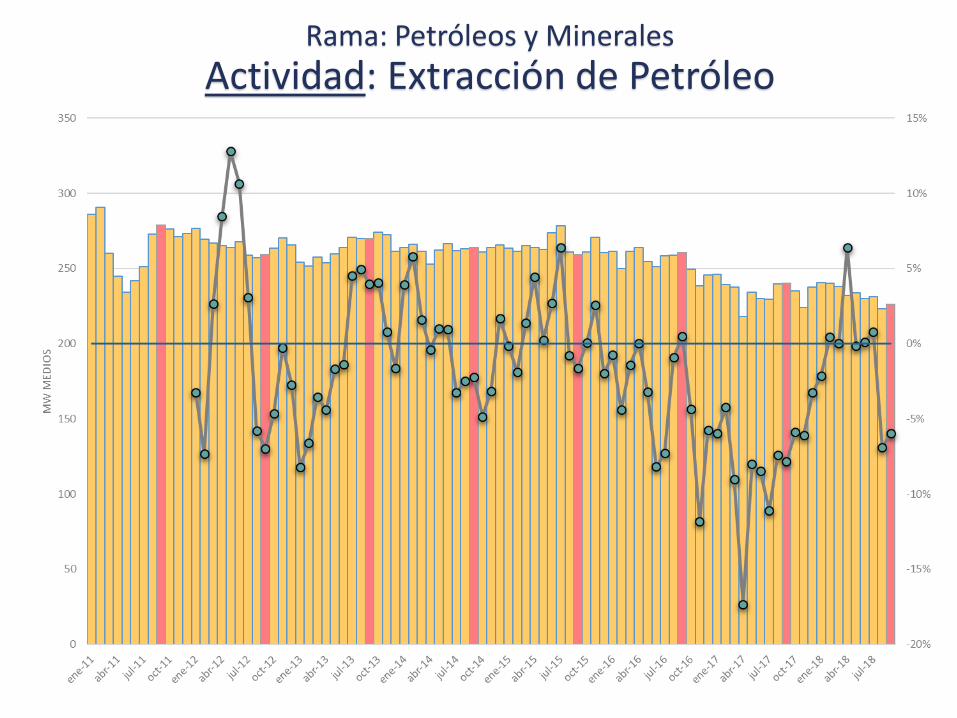
Rama: Petróleos y Minerales
Actividad: Extracción de Petróleo


Comparación GU TOTAL por Rama Enero a Septiembre 2018 vs 2017
Variación
RAMAEne a Sep 2018 Ene a Sep 2017 GWh %
ALIMENTACIÓN, COMERCIOS Y SERVICIOS
10 491 10 695 -204 -1.9%
INDUSTRIAS (sin ALUAR)
12 236 12 051 186 1.5%
PETROLEOS Y MINERALES
2 212 2 344 -132 -5.6%
TOTAL (sin ALUAR)24 939 25 089 -150 -0.6%
INDUSTRIA ALUAR SA
2 050 1 845 205 11.1%
TOTAL 26 988 26 934 54 0.2%
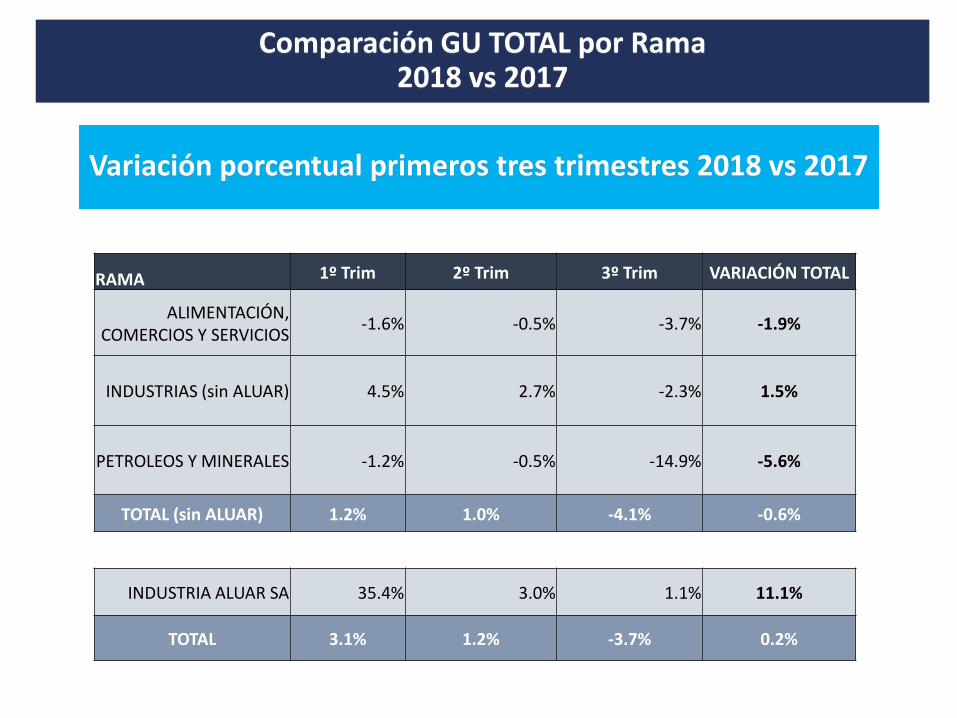
Comparación GU TOTAL por Rama 2018 vs 2017
Variación porcentual primeros tres trimestres 2018 vs 2017
RAMA 1º Trim 2º Trim 3º Trim VARIACIÓN TOTAL
ALIMENTACIÓN, COMERCIOS Y SERVICIOS
-1.6% -0.5% -3.7% -1.9%
INDUSTRIAS (sin ALUAR) 4.5% 2.7% -2.3% 1.5%
PETROLEOS Y MINERALES -1.2% -0.5% -14.9% -5.6%
TOTAL (sin ALUAR) 1.2% 1.0% -4.1% -0.6%
INDUSTRIA ALUAR SA 35.4% 3.0% 1.1% 11.1%
TOTAL 3.1% 1.2% -3.7% 0.2%
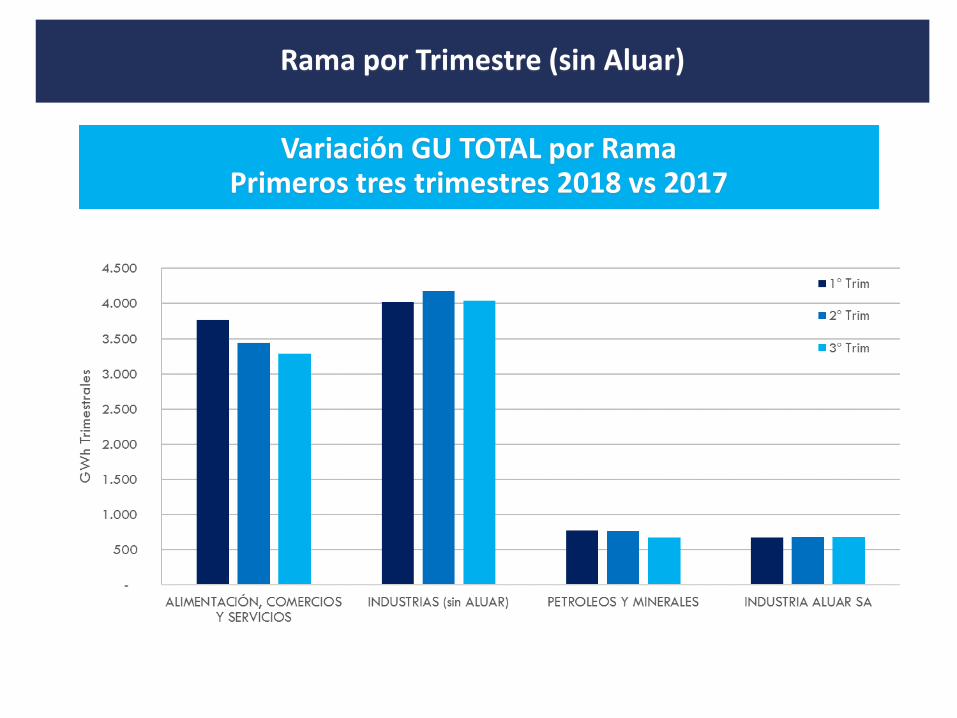
Rama por Trimestre (sin Aluar)
Variación GU TOTAL por Rama Primeros tres trimestres 2018 vs 2017
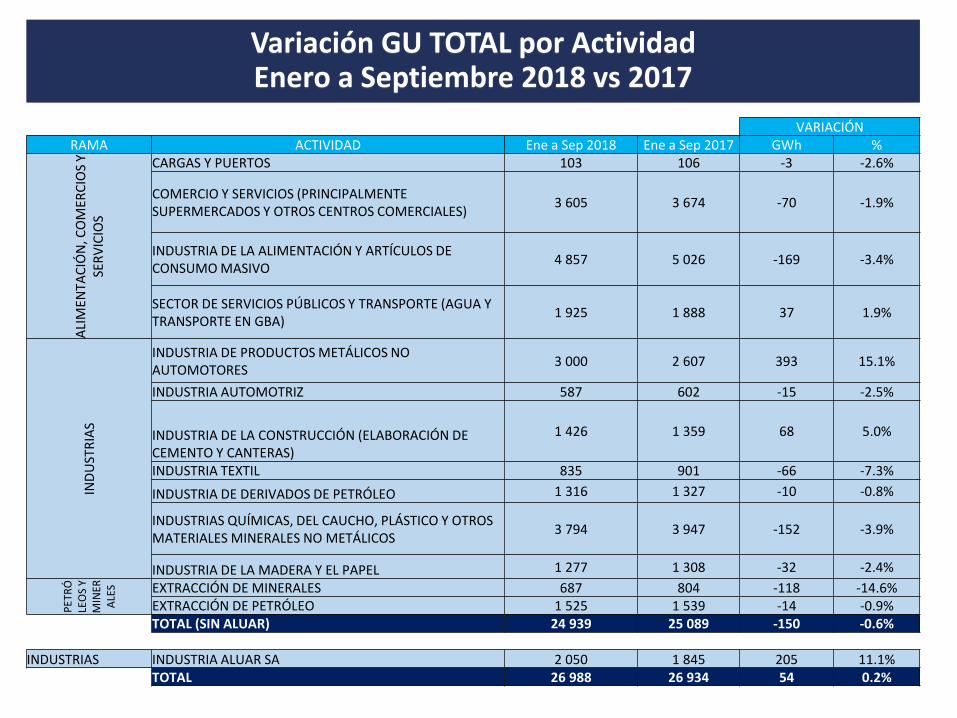
Variación GU TOTAL por ActividadEnero a Septiembre 2018 vs 2017
VARIACIÓNRAMA ACTIVIDAD Ene a Sep 2018 Ene a Sep 2017 GWh %
ALI
MEN
TAC
IÓN
, CO
MER
CIO
S Y
SER
VIC
IOS
CARGAS Y PUERTOS 103 106 -3 -2.6%
COMERCIO Y SERVICIOS (PRINCIPALMENTE SUPERMERCADOS Y OTROS CENTROS COMERCIALES)
3 605 3 674 -70 -1.9%
INDUSTRIA DE LA ALIMENTACIÓN Y ARTÍCULOS DE CONSUMO MASIVO
4 857 5 026 -169 -3.4%
SECTOR DE SERVICIOS PÚBLICOS Y TRANSPORTE (AGUA Y TRANSPORTE EN GBA)
1 925 1 888 37 1.9%
IND
UST
RIA
S
INDUSTRIA DE PRODUCTOS METÁLICOS NO AUTOMOTORES
3 000 2 607 393 15.1%
INDUSTRIA AUTOMOTRIZ 587 602 -15 -2.5%
INDUSTRIA DE LA CONSTRUCCIÓN (ELABORACIÓN DE CEMENTO Y CANTERAS)
1 426 1 359 68 5.0%
INDUSTRIA TEXTIL 835 901 -66 -7.3%
INDUSTRIA DE DERIVADOS DE PETRÓLEO 1 316 1 327 -10 -0.8%
INDUSTRIAS QUÍMICAS, DEL CAUCHO, PLÁSTICO Y OTROS MATERIALES MINERALES NO METÁLICOS
3 794 3 947 -152 -3.9%
INDUSTRIA DE LA MADERA Y EL PAPEL 1 277 1 308 -32 -2.4%
PET
RÓ
LEO
S Y
MIN
ERA
LES EXTRACCIÓN DE MINERALES 687 804 -118 -14.6%
EXTRACCIÓN DE PETRÓLEO 1 525 1 539 -14 -0.9%TOTAL (SIN ALUAR) 24 939 25 089 -150 -0.6%
INDUSTRIAS INDUSTRIA ALUAR SA 2 050 1 845 205 11.1%TOTAL 26 988 26 934 54 0.2%
Variación GU TOTAL por ActividadEnero a Septiembre 2018 vs 2017
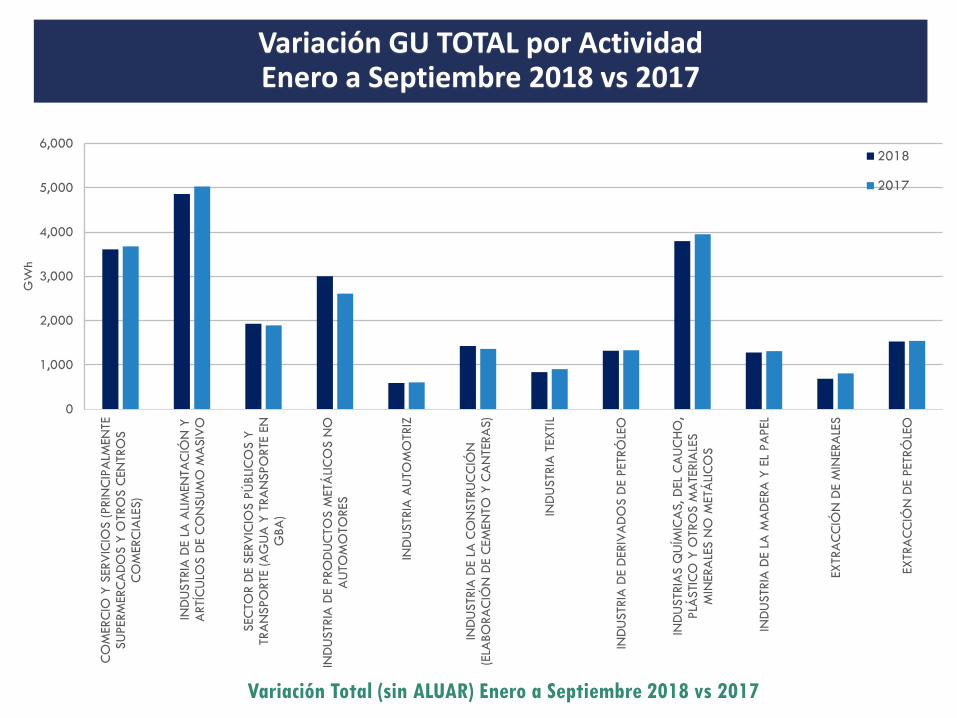
Variación Total (sin ALUAR) Enero a Septiembre 2018 vs 2017
0
1,000
2,000
3,000
4,000
5,000
6,000
CO
MER
CIO
Y S
ERV
ICIO
S (PRIN
CIP
ALM
EN
TE
SU
PERM
ERC
AD
OS Y
OTR
OS C
ENTR
OS
CO
MER
CIA
LES)
IND
USTR
IA D
E LA
ALI
MEN
TAC
IÓN
YA
RTÍ
CU
LOS D
E C
ON
SU
MO
MA
SIV
O
SEC
TOR D
E S
ERV
ICIO
S P
ÚBLI
CO
S Y
TRA
NSPO
RTE
(A
GU
A Y
TRA
NSPO
RTE
EN
GBA
)
IND
USTR
IA D
E PRO
DU
CTO
S M
ETÁ
LIC
OS N
OA
UTO
MO
TO
RES
IND
USTR
IA A
UTO
MO
TRIZ
IND
USTR
IA D
E LA
CO
NSTR
UC
CIÓ
N(E
LABO
RA
CIÓ
N D
E C
EM
EN
TO Y
CA
NTER
AS)
IND
USTR
IA T
EXTI
L
IND
USTR
IA D
E D
ERIV
AD
OS D
E P
ETR
ÓLE
O
IND
USTR
IAS Q
UÍM
ICA
S, D
EL C
AU
CH
O,
PLÁ
STI
CO
Y O
TRO
S M
ATE
RIA
LES
MIN
ERA
LES N
O M
ETÁ
LIC
OS
IND
USTR
IA D
E LA
MA
DERA
Y E
L PA
PEL
EXTR
AC
CIÓ
N D
E M
INER
ALE
S
EXTR
AC
CIÓ
N D
E P
ETR
ÓLE
O
GW
h
2018
2017

Comparación GU TOTAL por Actividad 2018 vs 2017
Variación porcentual primeros tres trimestres 2018 vs 2017
RAMA ACTIVIDAD 1º Trim. 2º Trim. 3º Trim.VARIACIÓN
TOTAL
ALI
MEN
TAC
IÓN
, CO
MER
CIO
S Y
SER
VIC
IOS
CARGAS Y PUERTOS -2.6% -0.5% -4.6% -2.6%
COMERCIO Y SERVICIOS (PRINCIPALMENTE SUPERMERCADOS Y OTROS CENTROS COMERCIALES)
-2.1% -1.1% -2.5% -1.9%
INDUSTRIA DE LA ALIMENTACIÓN Y ARTÍCULOS DE CONSUMO MASIVO -1.5% -1.4% -7.2% -3.4%
SECTOR DE SERVICIOS PÚBLICOS Y TRANSPORTE (AGUA Y TRANSPORTE EN GBA) -0.5% 3.1% 3.4% 1.9%
IND
UST
RIA
S
INDUSTRIA DE PRODUCTOS METÁLICOS NO AUTOMOTORES 25.1% 17.2% 5.4% 15.1%
INDUSTRIA AUTOMOTRIZ 0.2% -1.0% -6.4% -2.5%
INDUSTRIA DE LA CONSTRUCCIÓN (ELABORACIÓN DE CEMENTO Y CANTERAS) 7.9% 8.2% -0.7% 5.0%
INDUSTRIA TEXTIL -2.0% -5.3% -13.8% -7.3%
INDUSTRIA DE DERIVADOS DE PETRÓLEO 0.1% -2.0% -0.4% -0.8%
INDUSTRIAS QUÍMICAS, DEL CAUCHO, PLÁSTICO Y OTROS MATERIALES MINERALES NO METÁLICOS
-2.5% -4.2% -5.0% -3.9%
INDUSTRIA DE LA MADERA Y EL PAPEL -2.8% 0.2% -4.5% -2.4%
PET
RÓ
LEO
S Y
MIN
ER
ALE S
EXTRACCIÓN DE MINERALES -2.3% -5.2% -36.0% -14.6%EXTRACCIÓN DE PETRÓLEO -0.6% 2.0% -4.1% -0.9%
TOTAL (SIN ALUAR) 1.2% 1.0% -4.1% -0.6%
INDUSTRIAS INDUSTRIA ALUAR SA 35.4% 3.0% 1.1% 11.1%
TOTAL 3.1% 1.2% -3.7% 0.2%