Embed Size (px)
Citation preview

Akademin för Innovation, Design och Teknik
Examensarbete, produktionsutveckling
30 högskolepoäng, avancerad nivå
Materials Supply, Measurability and Guidelines towards efficiency
Anders Eklund
Presentationsdatum: 18 maj, 2010) Uppdragsgivare: Volvo CE op. Eskilstuna Handledare (företag): Tone Johansson, Anna Pettersson Handledare (högskola): Magnus Wiktorsson Examinator: Magnus Wiktorsson

2(69)
Abstract/Sammanfattning
Measurability in production is a cornerstone in all production, but to determine if chosen key performance indicators (KPI’s) are right and in the right amount, to be of help in the daily work, is a challenge. In materials supply processes, there are in some companies not easy to manage KPI’s, resulting in the end in overcapacity in different areas. The question is whether this is acceptable, or if it is a source of cost that has significant improvement potential? In many companies, you do not really know, since there is a lack of facts to draw conclusions from. Today materials supply is becoming more and more in focus within production development with many theses and ongoing research and development projects. In global companies, management has recognized the importance of the development of this area with new methods and routines for production improvements in the materials supply area. In this thesis, the author will try to deal with these challenges and give the reader some proposals and solutions. The first area is KPI’s and the author proposes some measurements to be used in the daily work within materials supply. The second area in the thesis is to develop guidelines for materials supply concepts to be used in different types of production set-ups. The author has made several case studies, in one case company as well as in three reference companies, as well as literature and document studies. Mätbarhet i produktionen är en hörnsten i all produktion, men att avgöra om valda nyckeltal (KPI) är rätt och i rätt mängd och är till hjälp i det dagliga arbetet, är en utmaning. I material-försörjningsprocesser, är det i vissa företag inte lätt att hantera nyckeltal, vilket kan resultera i överkapacitet inom olika områden. Frågan är om detta är acceptabelt eller om det är en källa till kostnader som har betydande förbättringspotential? I många företag, där vet man inte riktig, eftersom det är brist på fakta för att kunna dra slutsatser. Idag tenderar materialförsörjning bli mer och mer i fokus inom produktionsutveckling med många avhandlingar och pågående forsknings-och utvecklingsprojekt. I globala företag har ledningen insett vikten av utvecklingen av detta område med nya metoder och rutiner för produktion förbättringar av materialförsörjningsområdet. I denna avhandling kommer författaren försöka hantera dessa utmaningar och ge läsaren en del förslag och lösningar. Det första området är KPI och författaren föreslår vissa mätningar som kan användas i det dagliga arbetet inom materialförsörjningen. Det andra området i avhandlingen är att utveckla riktlinjer för materialförsörjningskoncept som kan användas i olika typer av produktionslayouter. Författaren har gjort flera fallstudier i ett fallföretag samt i tre referensföretag, samt litteratur och dokumentstudier.

3(69)
Foreword
The author would like to thank professor Mats Jackson, Magnus Wictorsson at Mälardalen University for this opportunity to this research. You have been of great help in the academic process of the work. I also would like to thank Tone Johansson, my manager at Volvo Construction Equipment operations Eskilstuna, for Your support and the talks we have had during the year this research have been going on and last but not the least, Anna Pettersson, my guiding star and well of inspiration for Your never ending energy and positivity during the whole journey.

4(69)
Table of Content
CHAPTER 1, INTRODUCTION .................................................................................................................................... 6
1.1 BACKGROUND .................................................................................................................................................. 6
CHAPTER 2, OBJECTIVES AND GOALS ................................................................................................................... 13
2.1 INTRODUCTION TO OBJECTIVES ...................................................................................................................... 13 2.2 OBJECTIVES AND GOALS................................................................................................................................. 14
CHAPTER 3, RESEARCH OBJECTIVE ....................................................................................................................... 15
CHAPTER 4, RESEARCH QUESTIONS ..................................................................................................................... 16
4.1 EXPECTED RESULTS ........................................................................................................................................ 16
CHAPTER 5, DELIMITATIONS ................................................................................................................................. 17
5.1 OUTLINE OF THE THESIS ................................................................................................................................. 17
CHAPTER 6, FRAME OF REFERENCE ...................................................................................................................... 18
THEORETICAL FRAME OF REFERENCE .................................................................................................................. 18
6.1 THE PRODUCTION SYSTEM .............................................................................................................................. 18 6.2 METRICS AND MEASUREMENTS ...................................................................................................................... 25 6.3 CHOICE OF MATERIALS HANDLING, GUIDELINES............................................................................................. 30
EMPIRICAL STUDIES ............................................................................................................................................... 33
6.4 THE PROCESS OF DESIGN AND SELECTION OF MATERIALS HANDLING CONCEPT IN COMPANY A...................... 33 6.5 CASE COMPANY A CONCEPTS FOR MATERIALS HANDLING ............................................................................. 35 6.6 SELECTION OF MATERIALS SUPPLY CONCEPT IN COMPANY A ......................................................................... 36 6.7 INTERVIEWS AT CASE COMPANY A ................................................................................................................. 40 6.8 METRICS ........................................................................................................................................................ 41 6.9 CONCLUDING THE INDUSTRIAL CHALLENGES IN THE STUDY AT THE COMPANY A .......................................... 42 6.10 IDENTIFIED PROBLEMS IN CASE STUDY I ....................................................................................................... 42 6.11 CASE STUDY II: BENCHMARKING ................................................................................................................. 43
6.11.2 Case company C ..................................................................................................................................... 45 6.11.3 Case company D .................................................................................................................................... 46
CHAPTER 7, RESEARCH METHODOLOGY .............................................................................................................. 48
7.1 RESEARCH APPROACH .................................................................................................................................... 48 7.2 RESEARCH STRATEGY .................................................................................................................................... 48 7.3 DATA COLLECTION ......................................................................................................................................... 51 7.4 DATA ANALYSIS ............................................................................................................................................. 51 7.5 THE RESEARCH PROCESS ................................................................................................................................ 53 7.6 RESEARCH QUALITY – RELIABILITY AND VALIDITY ........................................................................................ 54
CHAPTER 8, RESULT OF THE RESEARCH ............................................................................................................... 56
8.1 OBJECTIVE OF THIS RESEARCH AND THE RESEARCH QUESTIONS ..................................................................... 56
CHAPTER 9, ANALYSIS AND DISCUSSION FROM THE CASE STUDIES ................................................................. 60
8.1 DISCUSSION .................................................................................................................................................... 62
CHAPTER 10, CONCLUSIONS AND FUTURE WORK ............................................................................................... 63

5(69)
10.1 CONCLUSIONS .............................................................................................................................................. 63 10.2 FUTURE WORK ............................................................................................................................................. 64
REFERENCES ........................................................................................................................................................... 65
APPENDIX ................................................................................................................................................................ 67

6(69)
Chapter 1, introduction
This chapter gives an overview of the background and problem description of why this research project was initiated as well as the background to the research questions.
1.1 Background
The case company A is a component producer and is a provider of axles and transmissions to wheel loaders, articulated haulers and motor graders worldwide. The case company A has in recent years been engaged in a major change project in the factory for component manufacturing in Eskilstuna. In 2006, the long range plan showed that production volumes would dramatically increase in the following nine years and the capacity maximum would be passed despite continuous investments, improvements and outsourcing. As a result of this plan, a feasibility study was initiated to develop a new corporate production strategy. This strategy and the conclusions from the long range plan resulted in an industrial project called CS09 (Component Step 2009). Since the case company A had reached the capacity maximum limit, the company management decided to build a business case for gradually investing 1.1 billion SEK in the factory until year 2009. When the corporate strategy and the future production set-up were set, a business case was developed and presented for decision in the corporate steering committee. Lean production, and more specifically the case company production system philosophy (VPS), were decided to be the starting point of development and improvement for production as well as logistics. JIT was a prerequisite for all kinds of solutions when designing the materials handling process. Once this was done, key performance indicators (KPI) were set and aims and goals decided. The general key performance areas are: safety, with measurements of accidents with absence; quality, with measurements in ppm (parts per million); logistics, with measurements of delivery accuracy; economics, with measurements of productivity; as well as human resources, with measurements of in-service training and employee satisfaction. Each of the key performance indicators are monitored and acted upon. The next step in the development process is to communicate the goals to the organization. The different departments performed a goal break-down and took it to the tactic level. In this phase different solutions for concepts are developed and presented to the factory top management. The selected solution was monitored through a business case and tested to the strategic principles set in the steering committee. During the period from 2007-2009 a capacity improvement project was run, which aimed to create two main production flows in the factory to have a production system under "lean manufacturing". By this, the company was able to reach the anticipated future volume demands and to fully utilize the production system. The project CS09 was based upon four cornerstones (key criteria) for the strategic movement, presented in figure 1-4 below:
7(69)
Volvo Construction EquipmentCONFIDENTIAL
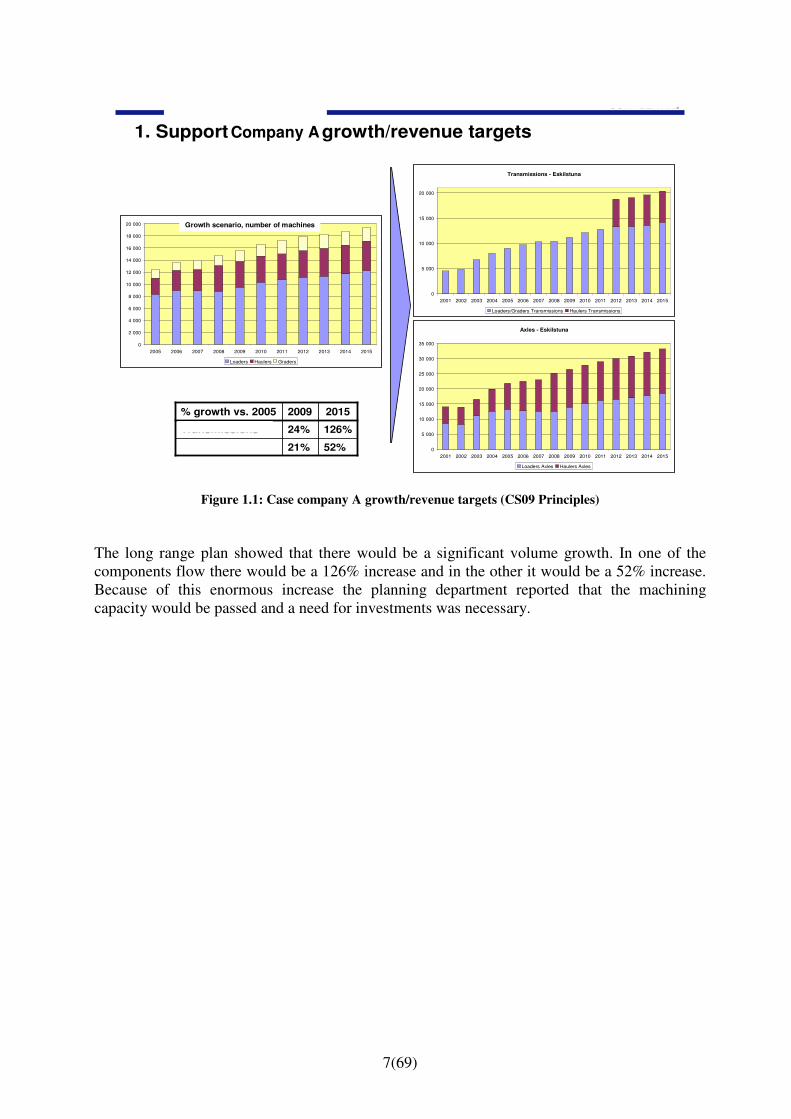
1. Support Volvo CE growth/revenue targets
Axles
52%21%Axles
126%24%Transmissions
20152009% growth vs. 2005
0
2 000
4 000
6 000
8 000
10 000
12 000
14 000
16 000
18 000
20 000
2005 2006 2007 2008 2009 2010 2011 2012 2013 2014 2015
Loaders Haulers Graders
Growth scenario, number of machines
Axles - Eskilstuna
0
5 000
10 000
15 000
20 000
25 000
30 000
35 000
2001 2002 2003 2004 2005 2006 2007 2008 2009 2010 2011 2012 2013 2014 2015
Loaders Axles Haulers Axles
Transmissions - Eskilstuna
0
5 000
10 000
15 000
20 000
2001 2002 2003 2004 2005 2006 2007 2008 2009 2010 2011 2012 2013 2014 2015
Loaders/Graders Transmissions Haulers Transmissions
Figure 1.1: Case company A growth/revenue targets (CS09 Principles)
The long range plan showed that there would be a significant volume growth. In one of the components flow there would be a 126% increase and in the other it would be a 52% increase. Because of this enormous increase the planning department reported that the machining capacity would be passed and a need for investments was necessary.
Company A

8(69)
Volvo Construction EquipmentCONFIDENTIAL
2. Secure Flexibility requirements from the market
• Customer Order Driven Production - 2 shifts Assembly and 3 shifts manufacturing as a base
• Meet flexibility requirements with working time arrangements
Seasonal order fluctuations and production flexibility ILLUSTRATIVE
Customer
Haulers
+/- 40%
Loaders
+/- 20%
Graders
+/- 15%
Order fluctuations Assembly capacity flexibility
Jan Feb Mar Apr May Jun Jul Aug Sep Oct Nov Dec
Actual produced volume
+/- 10%
Jan Feb Mar Apr May Jun Jul Aug Sep Oct Nov Dec
Actual produced volume
+/- 20%
+/- 10% flexibility requirements to CMP
+/- 20% flexibility requirements to CMP
+/- 15% flexibility (within 6 weeks)
requirements to CMP
+/- 15%
Jan Feb Mar Apr May Jun Jul Aug Sep Oct Nov Dec
Actual produced volume
Figure 1.2: Secure Flexibility requirements from the market (CS09 Principles)
The second cornerstone was to invest in capacity and harmonize the capacity between the parts manufacturing and the assembly increasing the flexibility, see figure 1.2. One way to secure the flexibility was to build in flexibility requirements in the working time. Another important decision was to change the production planning from forecast driven production to order driven production planning.
Product A
Product B
Product C

9(69)
Figure 1.3: What to manufacture In-house (CS09 Principles)
The make or buy strategy was also important to state. This is the cornerstone that was the base for the investment plan. The make or buy strategy was developed as a four field table and have axles of strategic importance and competitive position. In the table 1.3 the different articles are positioned which form the make or buy strategy.

10(69)
Volvo Construction EquipmentCONFIDENTIAL
Goderich, Canada
Pederneiras, Brazil
Asheville, US
Eskilstuna, SwedenArvika, SwedenBraås, Sweden
Optimize today’s Industrial System for organic growth
Figure 1.4: Industrial Footprint - Where and how to expand (CS09 Principles)
The manufacturing footprint states how the global structure of industry is set-up. The first statement was to decide where in the world the main manufacturer would be placed and where the product development should be done, see figure 1.4. After decisions in this matter, a decision of the sub-manufactures was also done. The main activities in the project are described below:
• A new production concept, from today's complex structure to a completely flow oriented system
• One flow for axles and one for transmissions
• Line assembly instead of station assembly
• New flow oriented machining cells
• Over 100 machines moved
• New test rigs
• New logistics set-up
• Lean production transformation of productions cells

11(69)
• A second oven in the hardening workshop
• Expansion of facility, from 53 000 till 63 000 sqm
• Expansion doubling the capacity
In the early phases for CS09 during 2006 the requirements on the new production set-up were formulated, presented in figure 1.5.
Figure 1.5: Main requirements on new set-up (CS09 Principles)
In this period, 30 different production cells were developed based on future volumes, needed machines, specified article production flow, layout and labor capacity. This production system was described in an early conceptual draft, called “micro design” and included a concept set-up and other requirements for the production flow. When the sub-projects later were set in detail, these micro designs were used as background material when the commission directive was formulated. When the production concept reached the detail design, the project had to be flexible and able to adjust to new and updated information. Some of the requirements were changed due to new knowledge. Since the organization and the agenda at the project gates were different along the projects progress the demanded requirements could vary between the gates. Based on the result of this study, the CS09 project formed requirements for a totally new production system. Five subprojects were started: building construction, implementation of master plan, logistics, lean implementation and quality. One issue was to change a push-

12(69)
production planning paradigm to a pull-production planning paradigm and solve the consequences that this would cause. The layout challenge was to re-arrange the factory from a functional factory layout to a flow factory layout with a transition puzzle of old machines and new machines in production cells in a successive flow. The greatest challenge was however, to change the corporate culture in alignment to lean production philosophy. This is a continuous improvement work. The challenge was to develop a more flexible production to meet variation in demand and at the same time a decreased level of inventory and work-in-progress (WIP). One way to deal with this was to change the production planning system from forecast-based to order-based system. The intention for this change was to promote decreased WIP, shortened lead time and increased flexibility by consumption on demand. Of high importance was to shorten set-up time for smaller batch sizes as well as to increase the batch frequency. Another identified sub-project was logistics with requirements for effective materials supply within the factory. This sub-project investigated and presented proposals for improvements in the logistics area. Phase I was to decrease in-house transportation with 25%. The second phase, starting now, is to develop in-house transportation methods, tools for measurement, follow up, improve materials handling and set new goals to minimize waste in the transportation area.

13(69)
Chapter 2, Objectives and goals
This chapter will introduce the key issues, objectives and goals that will be researched in this thesis.
2.1 Introduction to objectives
Current routine to facilitate in-plant materials supply is based on experience from a responsible management team. This is done in the budget process annually. Management analyses the current and previous years’ figures, which form the budget for the next year. A problem with this current process is that the figures and goals are not based on facts but is an assessment of previous years’ result. Since there are no measured facts documented, the management does not really know if the specified goals are correct. Another problem is when the company do changes in the delivery process, it is impossible to know how the change will affect the process. However, an experienced manager may have a long history of making budgets and can therefore make a reasonable check and determine whether the work is being done right. Today there is no defined way or process for measuring in-plant materials supply therefore it is not possible to analyze and determine the degree of utilization or efficiency in in-plant materials supply. In-plant material supply runs partly in a standardized way via IT-based messages from an IT-support system. But just to keep a record of these messages is not enough. There has to be some sort of process to analyze the process data, since only the numbers themselves does not give the basis for computation and analysis, there has to be more parameters to get a reliable result. It is important to increase the amount of measures and standardized work to promote continuous improvements to further reduce waste. It is of great importance are that the measurements themselves are easy enough to use in the daily routine that they don’t feel like a burden or an obstacle in the organization. Furthermore, the measurements have to be close to the employees and have to be easy to understand to be used by the employees. One important step for the production planning department is to change from a forecast based planning to an order based planning system. This affects the importance of measurable work in, for instance in-plant material supply. Today, in the case company A, there are few initiatives in machining cells that are in use. Implementing an order based planning system sets high requirements on stable processes and predictability in the entire production set-up, where materials supply makes an important component for success. Measuring the degree of utilization in in-plant materials supply is today not a prioritized area and often a problem in many automotive industries. The consequence of this affects the efficiency and, in the long run, the result for the company in a negative way. There will be difficulties in capacity planning of the in-plant fleet of forklifts and material supply work which leads to inefficient and ineffective in-plant material supply. .

14(69)
2.2 Objectives and goals
An important academic contribution for this project is to evaluate and find guidelines for determination in which different types of materials supply concepts are relevant. To develop KPI’s (key performance indicators) for in-plant materials supply, on a daily basis, is another important academic contribution for this project. There are a variety of ways to set up a concept for material supplies and to choose between concepts are indeed a complex task. The research in this thesis will formulate guidelines for when this concept is relevant for different manufacturing set-ups.

15(69)
Chapter 3, Research objective
The objective of this research is to propose relevant key performance indicators (KPI’s) to support in-plant materials supply to be able to evaluate material supply concepts. When these key performance indicators are implemented, it is possible to propose improvements and analyse the results for further improvements for an effective in-plant material supply. Furthermore the project will formulate guidelines for determination of which concept of materials supply is applicable for different types of production/manufacturing set-ups.

16(69)
Chapter 4, Research Questions
The purpose of this research is to identify metrics and KPI’s for in-plant materials supply to follow up and analyse efficiency in material supply and formulate guidelines for different types of production/manufacturing set-ups. Two research questions have been formulated to support this purpose, and they are:
RQ 1 – What type of KPI’(s) to measure in-plant materials supply is (/are) relevant?
In machining and in assembly there are several tools to measure performance but in in-plant materials supply there are very few that are applicable in all days work to measure efficiency. To choose materials handling concept is a complex task. It is often a consequence of production development and has to adjust to choices made from it. Therefore it is important to develop a guideline to choose materials handling concept. RQ 2 - What type of materials supply concepts are relevant for different types of production/manufacturing set-ups?
4.1 Expected results
The intention of this research is to generate KPI’s to measure utilization for in-plant materials supply for the industry and scientifically find guidelines for materials supply in different production set-ups.

17(69)
Chapter 5, Delimitations
This research will be performed in the field of materials supply and specifically in-house transportation. The environment is in automotive manufacturing with the starting point from the assembly line materials supply façade. The project requires a flow oriented plant layout. This project does not consider implementation of the concept, system adjustments, kanban card development or layout, technical solution for transportation vehicles, in- and outbound transports or shipping yard management. This research will be a prerequisite and a recommendation for phase II in materials supply at case company A.
5.1 Outline of the thesis
In chapter 1 the background from the case company is being described. This chapter also contain problem, purpose and research questions as well as the delimitations of the thesis. The research methodology is described in chapter 2 and motivated. Thereafter in chapter 3 the theoretical frame of reference is written with the empirical frame of reference in the following chapter. In the end of the thesis, findings, results and discussion are shown. The thesis ends with a proposition of future research.

18(69)
Chapter 6, Frame of reference This chapter introduces the theory used in this research project in order to gather relevant data, analysis, and reflection in the research area. First in this chapter there is a description of how the author defines different words and expressions. Definitions are based on existing literature and in related areas to give the reader an orientation in the in-plant supply topic. In the latter part of the chapter there will be an empirical frame of reference where the case company will be investigated
Theoretical frame of reference
In the first part of the chapter there is a broad description of what the author means by production, manufacturing and assembly. In the next part there are definitions on the materials supply and related areas.
6.1 The production system
A prerequisite in this research is that the case companies strive to act in the lean production philosophy. By having lean production as base, goals and targets strives to climb on the lean production path. One target is to change the mindset in the company culture to a waste elimination and a continuous improvement. Lean production is a production philosophy deriving from the Toyota Company and a spread all over the world. This philosophy is based on 14 management principles that claim to reduce or eliminate waste in the production processes. The principles are (Liker, (2004)):
• Base your management decisions on a long-term philosophy, even at the expense of short-term financial goals
• Create continuous process flow to bring problems to the surface
• Use pull systems to avoid overproduction
• Level out workload
• Build a culture of stopping to fix problems, to get quality right the first time
• Standardized tasks are the foundation for continuous improvement and employee empowerment
• Use visual control so no problems are hidden

19(69)
• Use only reliable, thoroughly tested technology that serves your people and processes
• Grow leaders who thoroughly understand the work, live the philosophy, and teach it to others
• Develop exceptional people and teams who follow your company’s philosophy
• Respect your extended network of partners and suppliers by challenging them and helping them improve
• Go and see for yourself to thoroughly understand the situation
• Make decisions slowly by consensus, thoroughly considering all options; implement decisions rapidly
• Become a learning organisation through relentless reflection and continuous improvement

20(69)
Manufacturing
We need to distinguish between different types of production. One type of production is the manufacturing production where a raw material is converted from one state, processed to another state. Examples are automotive component manufacturing, food processing, furniture manufacturing. Manufacturing in the automotive sector is often a metal industry process. Different machining set-ups occur and different production processes are used. In this thesis two main manufacturing processes are defined, batch process production and line process production. One-piece flow is used in machines that is machining centres and machines only a few different parts. Batch production is used when the machines have change-over time and a variety of articles are machined in a machine or a machining cell. In this report a focus will be in batch process production and line process production and functional production layout and flow production layout (Ritzman and Krajewski (2002)).
Figure 6.1: Points out where in the production layouts the reports focus is (Ritzman and Krajewski 2002)
Batch manufacturing
Batch manufacturing is production in lots or batches. It is also a highly repeated manufacturing process with parts that are similar. The different parts are manufactured in the same machine or machine centre. A batch manufacturing process has a moderately volume and the variety is too great to invest in totally dedicated machines for each part number. The patterns of the manufacturing flow are mixed up and have no standard path. However, the dominant flow pattern sets the layout for the machine centre. Production planning is often make to stock (Ritzman and Krajewski (2002)).
Line manufacturing
The manufacturing process is highly repetitive. One type of line manufacturing is manufacturing in a one-piece flow. This means production of pieces of items in large volumes processed one at the time. It is a typically mass production of simple items such as brackets, rings and appliances. In this kind of production there are clearly defined production flows with

21(69)
dedicated machines to support the flow. Line manufacturing has a low degree of customization and are standard parts and in high volumes (Ritzman and Krajewski (2002)).
Assembly
Assembly is production by assemble parts and/or components to a final product and is a sub-system of production that can be compared to manufacturing which also is a sub-system of production. There are different types of assembly set-ups, for example station and line. The difference between these is at an assembly station the assembly operator or operators assemble the component from start to finished goods. The line assembly consists of two or more successively arranged stations in a line. Each station has defined assembly content at a defined assembly time or takt-time. Another difference is whether the base object stands still at the station when assembling or if the base objects is moving forward in the assembly direction from the first station to the last according to takt-time during assembly. The base object can for example be placed on a floor-based load carrier, a table or on a hanging load carrier. The materials are usually delivered to the station or line in either packaging or prepared hanging on boards or laying on tables or in kits. Production planning for assembly can be made in different ways. The two main principles are forecast based production planning (push-system) and order based production planning (pull-system).
Layout
There will be two different production layout set-ups described in this report; functional production layout and flow oriented production layout. The functional production layout supports the machining process and the flow oriented production layout focuses on the production flow. The decisions to choose production layout needs to be monitored carefully to be successful (Bellgran, Säfsten (2005)). In a functional production layout the machines with the same kind of manufacturing process are placed together in a group e.g. turning machines or welding machines in a group. The production flows between the different machining groups, that consists of the same type of machining process, depending on what type of products the production order consist of. There is high flexibility and redundancy in production planning since the part may have different paths through the production and the overall equipment efficiency is relatively high. For production systems with products in high volumes and in a high amount of variants this is a usually preferred layout, but there may be disadvantages in production planning and coordination and high risks for queues and congestions. A large proportion of the throughput time consists of waiting between machine groups so production with relatively long machining time may be preferred for this kind of production layout. In production planning this layout got planning points to every machine. See figure 3.2. To develop a sufficient planning process the company need to have well trained and competent planning staff (Bellgran, Säfsten (2005)).

22(69)
Figure 6.2: Example on a functional machine group
Flow oriented production layouts arrange the production flow in cells. The machines are placed in the production flow and are dedicated to the products in the flow. This way there are possibilities to shorten lead time and decrease inventory levels. Between the machining cells or centres an intermediate buffer stock is usually established to level out production and decouple the flow from the different production cells. This way the production system handles disruptions and stoppage in the production flow. The different operations need to have as equal machining time as possible to obtain levelled production. Each machining cell is to be considered as one planning point and the bottleneck machine is the one that sets the limitations in capacity for the whole cell. Important for the cell is short change over times since flexibility is very important. Below, in figure 3.3, a schematic figure shows a production cell (Bellgran, Säfsten (2005)).
Figure 6.3: Example on a machine flow cell
In mass production of standardized products the machining cells or centres are placed in a successive and sequenced order. Line flow production layout, see figure 3.4, is equal to a machining cell in the sense that the production flows in the same direction and production capacity in the production system is limited to the bottleneck. As in a production cell intermediate buffer stocks are established to deal with uneven production time. Production planning in a line flow cell is focused to the bottleneck in the cell, this because the bottleneck have the longest process time in the cell. The bottleneck in a machine cell may differ due to

23(69)
product variants in the flow that have different steps in the production process (Bellgran, Säfsten (2005)).
Figure 6.4: Example on a production flow layout
Materials handling
Logistics is an area that stretches from production planning to the physical handling of the material. The planning process is the system part that precedes the physical flow of parts. Maybe the most important task the logistics system has is to coordinate recourses, human as well as administrative and physical. A definition Council of Logistics management has done is as follows: Logistics covers the strategic, tactical and operational with a holistic approach and taking into
account customer preferences and needs, manage, implement and control the materials, and
service flows and related information, and cash flows throughout the supply and distribution
chain in the best possible long-term business and environmental way (Storhagen N. G. (2003).
In this thesis the subject is related to in-plant materials supply. The following section will provide the reader the meaning of the term “in-plant materials supply”. In-plant materials supply is used, in this thesis, as a collective name for in-plant transportation of materials in a production facility. According to Hanson (2009) in-plant materials supply is related to both in-plant logistics and in-plant materials handling. By in-plant logistics Hanson defines the area that in-plant materials supply and in-plant materials handling include. The term “in-plant logistics” includes the product flow, manufacturing and assembly sequences and planning and control. “In-plant materials supply” describes the physical supply of materials to machining centres as well as assembly stations.

24(69)
Figure 6.5: Schematic figure to show the context of materials supply
Materials handling is sometimes considered as a component in in-plant materials supply in a factory, storage and manufacturing Öjmertz states according to Shingo (1981) and play an important role in logistics and have an impact in productivity, quality, safety and overall profitability mean Öjmertz according to White (1991). In literature, materials handling is seen as waste and should be minimized Öjmertz states according to Coyle et al (1996). This is however a misunderstanding that it is only waste according to Mather (1998). Mather states that materials handling consist of value-adding and non-value-adding activities where non-value-adding activities are something to eliminate. The higher share of value-add in materials handling the higher the efficiency. In lean production materials handling is not included in the seven wastes but is components in materials handling. On the other hand transportation, motion and processing are waste itself and should be minimized or eliminated. Öjmertz refers to Coyle et al. (1996) there are a number of principles listed. One is the ‘systems principle’ for integrating as many handling processes as practical in a coordinated system: the materials flow principle to make a sequence and a layout of equipment that optimizes the materials flow. This is also for eliminating and combining unnecessary movement or equipment. In transportation, materials handling is discussed by Ng et al. (1997), where the focus is on cycle time Öjmertz states. However two factors concerning materials handling are mentioned, elimination of dock congestion and bottlenecks, and equipment that facilitates shipment handling. Ng et al. states that the characteristics in transportation must be careful analysed to find anything that can result in wasted time or effort.
Replenishment to the assembly
To replenish material to manufacturing and assembly are the logistics departments’ responsibility. In the physical system, the goal is to provide the right parts or goods, in the right amount, Materials handling in production have a selection of concepts discussed in the following part (Polizzi, M. A. (1996)). Milkrun: Milkrun is a materials handling concept where a materials handler deliver materials to the assembly line in predetermined routes. It is a production system similar to that used in small supermarkets with a fixed amount of shelf space; the operator takes the necessary material for production and stocks the empty packages after consumption. The supermarket’s

25(69)
capacity must allow for material availability between two consecutive runs, so that the operator does not stop working. In the milkrun path, the empty packages are withdrawn. They are not replaced until the following path of the milkrun, when it restocks the material and withdraws any further empty packages that it finds. Therefore, the objective of the milkrun (sometimes helped by the kanban system) is to integrate the internal supply of parts with the supply in the assembly area (Domingo, R. et al. (2007). Water spider: A recent formulated solution is the concept of a “water spider” which is a further development of the milk run concept. The water spider concept stems from the view of the material handler as moving in a circular route pattern through the ‘value stream’ , in opposite direction for the flow and keeping the flow of production smooth and level (Bicheno, J. (2003)). Below is a definition of water spider or runner that function is called. A normal route for a material handler is a powerful concept. If the one who sets the pace in the production is the heart, then the material handler is the blood who circulates in the blood system. Materials handling are obviously a waste but instead of spreading the waste on a lot of people, earn wastage in terms of materials to a person and make this into an important part of the flow. A water spider is to follow a particular route which included collecting kanban, retrieval of materials in various buffers, and supplies for delivery to the assembly line. The person starts and ends at the pace maker (pacemaker or heijunkabox), thus initiating the next round of activity. The water spider together with the pace maker are those that essentially puts the level of production. Routes should be calculated with great precision to a standard time which is slightly shorter than the pulse permits. The water spider is also on the lookout for problems, whatever they may be. The person will have control of weaknesses or other risks of stopping along the entire flow of the value stream. Upon detection of problems, these must be addressed in the corresponding forum. Kitting: kitting is putting a kit of parts for assembling a component. Kitting has a quality proofing role as well as effectiveness role. Sequential deliveries: (Bicheno, J. (2003) in special cases it is important to have quick response between operations. Deliveries in sequence can be called for due to various reasons and create this by holding an intermediate buffer of parts and are called for or activated sequentially when a replacement is needed in the next operation.
6.2 Metrics and measurements
In a production environment there is a need for efficiency and effectiveness measurements. This is needed to be able to control whether the company is profitable or not. In a company there are key performance indicators in different levels. Some of them are monetary KPI’s and others are measuring effectiveness and efficiency in for instance throughput time. It is important that the company have an established business and production strategy and from this strategy form the measures and metrics in sufficient proportions. It also depend on if you ask the company’s customer or the company’s management what you want to know. In the overall

26(69)
level in the company, some sort of performance is accurate to measure, such as profitability, return on investment (ROI) or other financial metrics. In a production environment two main measurers are discussed by Bellgran and Säfsten (2005), productivity and effectiveness. The productivity is a measure that indicates the relationship between what has been achieved and the actions and recourses needed to achieve this. The formula is as follows,
Input
Outputtyproductivi =
And this means that all activities in the production system have to contribute to output if they are not considered as waste by this definition. The higher productivity rate the better. Bellgran and Säfsten argue that sometimes effectiveness and efficiency are measured in production and there is a slight difference between them. They refer effectiveness to external effectiveness and efficiency to internal effectiveness. Efficiency is measured when the company wants to control if they do things right and effectiveness is measured when the company wants to know whether they do the right things. And they mean that efficiency is linked to input and effectiveness is linked to output.
Figure 6.6: Productivity, efficiency and effectiveness in relation to the production system
Productivity can be measured in different levels and there are traditionally three levels or types metrics referred by Bellgran and Säfsten:
• Partial productivity – output in relation to one form of input, e.g. man-hours, materials
• Multi factor productivity – several of factors are included, both input and output
• Total productivity – all input and output factors are included in the analysis

27(69)
The levels have different advantages and disadvantages depending on what to measure. On company corporate level the total productivity level is probably the most accurate metric to measure. Measures in a part of the process the partial productivity would be the best choice. Choosing measurement in production is an important task and therefore needs to be thoroughly investigated and establish a measurement strategy. Performance in the production system shall be seen in total and cost efficiency and productivity needs to be supplemented with other metrics such as quality, flexibility and delivery accuracy and be evaluated from the strategy. From this level could other sub-levels of metrics be developed where it is of importance to be able to follow up performance more in detail. Simplicity and visuality are essential to gain in the measurement and in the follow-up since these aspects are considered as waste and risks to be a hindrance in the daily work. Therefore it is wise to choose metrics carefully. Another way to measure productivity is, according to Bellgran and Säfsten referring to Jackson and Peterson (1999), to use time as a metric by measure the amount of value-add time in relation to total time (output/input). Advantages for this way of measure are for instance:
• It is easy to understand
• Easy to measure
• Is independent of cost structure and therefore facilitates comparisons between factories
• Is independent of currencies and is easy to compare production between countries
• But there are a few disadvantages as well as:
• To choose value-add parameters is subjective
• The definition supports long production time
However, it is important to consider a set of measures to get the analysis becomes accurate and not dependent on just one metric. In manufacturing, overall equipment efficiency (OEE) is a well-known measure. It is a way to measure total equipment efficiency and consists of three parts:
• Availability
• Machine efficiency
• Quality outcome
The OEE-formula is:
OEE = availability x machine efficiency x quality outcome

28(69)
The figure below shows the different parts and how they are connected to each other.
Figure 6.7: Estimation of OEE
To use OEE as a metric is one way to measure machine or machine group efficiency. This may not be enough to analyse the whole company’s efficiency since it does not take manual work in the system in consideration. In a production where there is manual work there is a metric named manual assembly efficiency, MAE, which is applicable where OEE is not accurate. MAE takes any fluctuations in time in consideration due to manual work for instance variations of variants that shall be assembled. MAE can be calculated by following formula:
( )
( ) 100*1
UNPSTOTA
N
i
Rilai
tttN
tt
MAE−−
−
=
∑=
MAE = efficiency in manual assembly (%)
N = number of assembled unites (unites)
t tai = ideal assembly time per unit (time/unit)
t Ri = rework for i unites after assembly (time/unit)
N A = number of operators in work (number of)
t TOT = total time available (time)
t PS = total planned stoppage time (time)
t UN = unused time due to lack of order (time)

29(69)
The range of use for these formulas is as shown in figure 3.8 below. In the upper area of the figure 3.8 the grade of automation is shown and in the lower area the use of which metric is relevant.
Figure 6.8: Area of use of OEE and MAE metrics in the production system
Öjmertz notes that a performance measuring method is the value-add ratio (VAR) which she defines as “the ratio between total value-added time and total process cycle time”. This method can be used in different ways and can contribute to throughput time reduction and be the drivers for cost and quality improvements by identify non-value-add activities. This metrics is not directly affected by the cost but is time-based and therefore independent of selling or marketing margins and can be used in tests with other products. It is also helpful is finding the production of non value-adding activities. Logistics metrics
Delivery accuracy contains parameters such as safety and reliability both for parts as well as for humans. The metrics in use can be proportion of delivery on time, mean delay and proportion of products in inventory. Delivery precision measures the proportion of delivery on agreed time and deviations from it, both to and from the company and a third metric is delivery time which measures cycle time, time from suppliers, response time and lead-time. Load distance is a way to calculate the distance between two locations with consideration to carried load. It is a tool to determine which option is the most advantageous in a material supply system. Calculating load distance score is performed in the following way. Identify the distance between two locations and calculate the load that shall be moved. This makes the score for that particular load distance. Investigate more alternate distances and evaluate the different options to each other (Ritzman and Krajewski (2002)). The introduction of this chapter is an orientation of how the author sees the production system and in the environment the research is being done. The following section is a broad description of materials handling and different concepts that will be referred to in the empirical and result chapters. Different measurements are explained and discussed to give the reader a background. These are going to be the base for the thoughts and to be used to form a new KPI.

30(69)
6.3 Choice of materials handling, guidelines
When designing assembly systems it is vital to consider the assembly operations as well as the material handling operations, since the material handling in this kind of system is extensive and complex and has a big influence on the system behaviour (Wiktorsson, M., (2000)) Moreover, the characteristics of the entire assembly system are often created in the interaction of the assembly operation and the material handling. As stated by Öjmertz (1998), the performance of the materials flow systems plays a crucial part in pursuit of competitive advantage. The materials handling function contributes to the adding of value when, for example, mixing articles, packaging them as demanded by the customer, or orienting and positioning them for a later process step, as well as influences cost efficiency and throughput time. Öjmertz et al (1998) introduces a method for estimating the physical work load, the Work-Load Dose Method (WLD). The method is intended to be used in an early stage in the design of materials flow systems and to give the opportunity to evaluate the efficiency in materials handling and work-load. The WLD-Method consists of four steps. The first step is to identify activities, the second is to perform measurement of time required, the third is classification of the work-load and the last step is calculation of the whole work-load. In the second step the aim is to obtain a measurement of the required time for the activities.
totTime =
k
n
k
Time∑=1
Where n = number of defined activities
In the third step the task is to rate the work-load in all activities to obtain an average figures to represent the work-load, the Work-Load Rating (WLR). This figure serves as an indicator for risks of obtaining work-load disorders. In the fourth step these measures are used to state the total work-load dose for the system investigated.
Timek
n
k
kWRLWLD *1∑
=
= Where n = number of defined activities
In the work by Johansson (2006) design of materials supply system proposes to be integrated at an early stage of product development projects and it is illustrated how to effectively and efficiently design the materials supply system in parallel with the product and the rest of the production system. The proposed design process is structured in the phases: Planning, Concept development, System-level design, and Detail design. The system is modelled with materials flows as sub systems and six design areas as components: materials feeding, storage, transportation, handling, packaging, and manufacturing planning and control. According to Polizzi, a ten step framework structured in three phases (understanding, developing and implementing) is suitable to follow for implementing a materials handling system. In the understanding phase a macro perspective of how the production system and goals work. The second phase is the development phase. The focus is to go deeper in details of the new system and work must be done to improve logistics activities. Creating pull system has to be developed between buffer stocks and the assembly line. The third phase contains

31(69)
identification of key roles with associated responsibilities, communication, education and training. Last but not least, a control system has to be implemented to be able to monitor and maintain the system (Polizzi, M. A. (1996)). In the work of implementing a new material handling system there are a few basic key principles that have to be set before starting the work (Polizzi, M. A. (1996)).
• A specific delivery plan for every part.
• Elimination of non-value-add activities.
• Elimination of wasteful activities.
• Delivery of material to the line must be comprehensive, efficient and consistent.
• Every part must have a unique defined path through the whole delivery process, including storage locations.
• Simplicity by visual control that provides clear and essential information.
• 5-S is the foundation of the working culture.
• Pride must be created and maintained.
• The underlying philosophy in the logistics system is to provide “Right part in the Right amount in the Right place at the Right time, Every Time” (R4ET) (Polizzi, M. A. (1996)).
The requirements on the materials handling solution is given by an interactive design task with the production operations design and sometimes even with the product design. By early involvement and iterative procedures a solution with lower total cost and better performance can be reached. However, it is important to formulate both requirements as well as constraints for the design of the materials handling. One possible structure in requirement definition is to follow the structure proposed in (Wiktorsson, M., (2000)):
• Requirements on function - musts on performance in terms of volumes, sizes etc.
• Internal design constraints - musts on design solutions due to internal reasons such as current equipment, internal standards.
• External design constraints - musts on design solutions due to external reasons such as supplier containers, regulations.
• Winning abilities - wants on capabilities such as lowest possible running cost, shortest implementation.
Important design parameters in selection of concept are for example: production layout, packaging, production planning philosophy.

32(69)
It is vital to have an understanding of what is important when investigating and building a materials handling concept. This section shows methods developed containing crucial parameters to take into account when developing a concept that is asked for in RQ2. Both Öjmertz and Polizzi emphasizes that the logistics system is complex and need to be thoroughly examined.

33(69)
Empirical studies
This chapter describes an industrial case, the background, current status as well as a benchmarking study in three companies in the automotive industry. The case company A is a global manufacturer of the powertrain to road machinery vehicles. The purpose to choose this company is to develop metrics and guidelines to improve in-plant materials supply. The data for the research is collected from documents and from semi-structured interviews with relevant employees. The documents are selected and analysed from a logistics point of view and respondents are selected to match the research questions. The three benchmarking companies B, C and D are selected form the size and similarities in production.
6.4 The process of design and selection of materials handling concept in company A
The starting point in the case company was a big industrial investment project CS09 and in the selection of materials handling concept was the production philosophy and the strategic dialogue in the corporate steering committee, which was also described in chapter 1. The committee analysed future demand, core competences, industrial footprint and the industrial capacity, including productions flexibility. This was the base for development of the strategy for the industrial system. As part of this investment project, 5 sub projects were formalized. One of these sub projects had the responsibility to develop logistics issues. Four logistics sub-projects were started: establishing of a logistics centre, in-plant materials supply, outbound and shipping yard development and development of a new materials planning system. In the work of developing the solution of production and logistics, different tools and methods were used. Value stream mapping and micro design method were two commonly used tools. The value stream mapping tool was the first tool to use when examine current state, the next step was to create micro designs for the whole production including logistics and quality. The investment project part begun with the micro design process and then the logistics and quality processes started. The aim was to implement corporate lean production. See figure 4.1.
Figure 6.9: Development process to lean production in CS09

34(69)
The logistics micro design defined the base for the new concept of materials handling and delivery. The solution was documented in a recommendation for the logistics projects steering committee to make decisions from. The last filter the solution passed was the layout handbook and a layout gate meeting where second layer management and responsible people for the layout were the decision makers. After deciding which solution was preferred the implementation in the operational level where the facilitation of materials handling was being done.

35(69)
6.5 Case company A concepts for materials handling
The company in case I has a batch production of parts and components and strives to minimize container or packaging sizes as far as possible. In the machining department the goal is single piece flow but only where it is cost-efficient. This in order to gain flexibility and promote decreased WIP. The containers have a standardized covering time of items per article in the batches to cover the consumption matching two shifts at the assembly lines. The assembly lines are fixed lines with fixed materials facades. At the case company material is delivered in a few different concepts. For the materials in batches, taxi based delivery concept (chaotic deliveries) by forklift trucks initiated by IT-based messages are used. The forklifts trucks are collecting the batch material put in pallets from controlled buffer stocks and inventories and deliver the pallets to the assembly lines. A batching concept of materials supply uses IT-based messages as a replenishment-signal for moving materials from one location to another. This concept can be compared to a taxi business where the taxi-driver picks up the next assignment from some kind of board or messages from management. Often there is a computer in a forklift that receives messages. There may also be a functionality that optimizes the routing so the next assignment is as near as possible the location where the previous is ended. The plant is divided in a number of areas so the taxi-based delivery missions have a short stretch. The advantage of this is fewer meter of non-load assignments. This concept utilizes the materials supply efficiency. A disadvantage with this concept is that it is rather ineffective in the total perspective. This is because the material is delivered one pallet, rack or package is at the time. For large items, where the assembly line consumes one item, each takt-time requires materials handlers close to the line, serving the material in sequence. These items have the same covering time as the takt time at the line and needs special attention to obtain minimum risk for stoppage at the assembly line. The logistics management in the plant invested in a logistics centre where all material are received and distributed to predetermined storages. From this centre, a milkrun route was established to feed the assembly lines with sealing and brackets. Items with low value in high consumption like knobs and bolts are delivered in milkruns by a special made milkrun vehicle running in fixed routes and time intervals. The replenishment concept for this type of items is a flag pushed out from the assembly line façade signalling a need for refill of material. The major part of the assembly lines has a 2-bin system in which containers keep inventory for an item in two bins. The first bin contains as much inventory to cover backup items demand for replenishment of the empty second bin. A minor part of the items have a re-order point in the container. There is a predetermined level of items in one container that, when reached, trigger a replenishment. This level is calculated according to cove time of packaging. Items, where it is of great importance of cleanliness, runs through a washing operation and are successively picked in a variety of kits depending on what to assemble. The replenishment signal in this case is a minimum-maximum level file where the materials handling person control the current level and deliver material when the minimum level is reached. Another replenishment signal is sequential deliveries for large items in high frequency to the assembly line where the materials handler observes the takt-board at the line, typically casings in which the other items will be assembled in and to.

36(69)
6.6 Selection of materials supply concept in company A
In the case company there is a company specific interpretation of lean production called the case company A production system (VPS). This interpretation is widely spread in the whole company. In this production system there are tools and methods to use in different areas such as quality, improvement and logistics. The logistics area is called Just-In-Time principle and deals with materials supply, pull systems, takt time, continuous flow processing and material supply.
Figure 6.10: The case company A Production System (VPS) and the Just-In-Time principle
In these principles there are guidelines, methods and techniques how to set up and continuously improve the production system. When it comes to develop and improve the material supply there are guidelines developed to support the process. In the selection process for packaging there are principles and criteria to consider. The table 4.1 below shows a guideline to support the selection process.

37(69)
Table 6.1: Materials flow selecting criteria
The process is to select materials flow to the consumer of the material. This guideline is used when a change is being done at the point of consumption. The guideline, see figure 4.3 below, takes both the receiving station and the part and packaging into account. This decision tree helps the developer to find solutions for each and every part at the point of consumption location.

38(69)
Figure 6.11: Decision guide for materials flow
To continue the process is to identify what feeding principle is accurate for the material. The default delivery type is feeding with support of a milk run train but also other vehicles may come in selection such as forklifts depending on the properties of the parts that shall be moved. The starting point is feeding in a fixed route based on coverage or takt time in the packaging. In the table below a guideline is shown for help in the selection of material feeding concept.

39(69)
Table 6.2: Decision guide for feeding of material
The last guideline, shown in table 4.2, is a help to categorise parts depending on part properties, packaging and consumption volume. Even supplier flows are taken into account to be able to improve the inbound process and to calculate costs in the supply chain.

40(69)
Figure 6.12: Guide for supply and line feeding flows
6.7 Interviews at case company A
In this section, the result from interviews at case company A will be reported. The four respondents are the manager for in-plant materials supply, two logistics developers working with the CS09 project and a business controller. Decisions made to choose materials supply concept were taken in the industrial project CS09, described earlier in this report. The feasibility study, CS09, developed principles according to lean production as prerequisites for materials supply development. However, the requirements were up to the sub-project groups to develop. This way the concept solution became a consequence of the assembly and machining principles and concepts and a further development of existing concepts. The development and control of materials supply today is based on manager’s experience and derives from the long range plan (LRP) and the annual budget process. The case company A use a decision process described below. The process begins with choice of production strategy, which top management states in a strategy document. This is the foundation for the materials handling decision process. Once this is clarified the current state is analysed through a value stream mapping. This mapping is done by a cross functional team and led by the logistics development department (the understanding process). The result from the mapping will serve as a starting point for the future state development which will end in a

41(69)
business case together with a recommendation for the management to decide from (the development process), (Polizzi, M. A. (1996)). Decision process:
1. Type of production philosophy: functional or flow layout, lean production
2. Production planning: forecast based, customer order based (push or pull)
3. Type of assembly and machining: automated, manual, station, line (takt or piecework), fixed line, moving line, hybrid line
4. Type of material exposure in the façade: One-bin system (re-ordering point in the container), Two-bin system (re-ordering point when one container is empty), Sequence, Kitting (kits according to assembly sequence)
5. Plan for every part: volume, routing, covering time compared to takt-time in assembly, preceding operations, needs for re-packaging
6. Type of packaging: size, cover time, cleanliness requirements, quality aspects
7. Type of material, characteristics: Weight, Size, Volume
8. Type of material replenishment signals – visual, kanban cards, IT-based orders
9. Type of materials supply equipment: manual, semi automated, automated: AGV, forklifts, FMS
When the above described decisions are made, an implementation of the solution may be done. As in all production development processes, an involvement and support from top management is a success factor for the implementation process.
6.8 Metrics
The case company A have, as mentioned above, a few KPI’s for the logistics department. The KPI in the highest level is delivery accuracy (precision) to the customers. From this other underlying KPI’s are stated such as delivery accuracy from the suppliers, stoppage at the line caused by the logistics department, stoppage caused by lack of materials and number of dropped materials in the delivery to cell or line. An overall KPI is the impact different departments effects have on the cost at each component produced.

42(69)
6.9 Concluding the industrial challenges in the study at the company A
The industrial case illustrates a situation where a radical redesign of a manufacturing process poses critical requirements on an efficient materials handling process. Following an initial phase of system design and optimization, a second phase concerns the possibilities of measuring, monitoring and continuously improving the materials handling process. It is concluded that there is a need of improving the level of detail, in comparison to the current IT-system based transport orders. An increased level of detail would enable continuous improvements and eliminate waste. An important aspect is to describe the pros and cons with moving from forecast-based to order-based production planning, where predictability of the flow is of utmost importance. This poses strong requirements on stable processes in the entire flow, where materials handling is a vital enabling part. More specifically, one problem for the company is to facilitate the materials handling recourses to an optimum. Today the decisions are made by management in the budget process and are experience-based decisions. The problem with not knowing the optimal recourse utilisation is that the cost for materials handling is too high or in the other end there might be disturbance in the production due to lack of recourses. In some cases ‘preferred concepts’ can be defined for specific applications. One solution to optimize the materials handling recourses could then be to implement a preferred concept.
6.10 Identified problems in case study I
The concept decision process for in-plant materials supply is not a prioritized work in the case companies today. The in-plant solutions are more of a consequence of the production layout and have to adjust to the production. One underlying priority for in-plant materials supply is delivery performance as a level for service to the production. By interviewing the management and project leaders in logistics development and economics, gaps in the logistics development process have been identified. By not knowing the facts 100 % may cause a higher cost level in materials handling and uncertainties in result when improving the system. Therefore to create metrics that is easily used in daily work is a prerequisite to be used and analyzed to improve the production.

43(69)
6.11 Case study II: Benchmarking
In this chapter, case study II, three benchmarking case companies are described. The case companies produce components to the automotive industry and are sub-suppliers to the car or heavy vehicle market. The aim with this study is to monitor and analyse the case companies’ processes in the field of the research. The main questions to study in benchmarking companies B, C and D are type of production, development of concepts in materials supply and which metrics do the companies use to control the logistics activities. Of importance is even the production planning philosophy.
6.11.1 Case company B
The first case company is a manufacturer of engines to heavy duty truck vehicles and is a global market business company. The production in the investigated company consists of assembling parts and components into a finished component in a number of variants of the engines. The study of at the case company consisted of a semi-structured interview with the logistics manger and a plant tour to confirm and clarify any remaining question marks from the interview. The production
The production at the case company consists of assembly of engines. In the plant there is no manufacturing of parts. The company have however a number of machining plants but they are considered as any supplier. In the plant there are two lines that assembly all variants in the product range the customer demands. The lines are fixed but the base component moves along the assembly flow. The base component is mounted on a conveyor and moves in a predestined pace due to assembly takt-time. The materials facades are not fixed in the floor and are of a simple type which is easy to change and manipulate from the changes in demand from materials supply and production management. There is considerable variation in parts and components. Due to this fact the demand on an effective materials supply and production development is high.
Metrics
Metrics and measures in the case company are delivery accuracy in the highest level and as sub-KPI’s they measure number of stockouts in the assembly caused by in-plant materials supply. Another KPI is line stop caused by logistics department. To be able to evaluate the efficiency in in-plant materials supply this company measure number of milkruns per time unit. Materials supply concept
In the assembly plant there is a re-packing centre where parts and components are picked for a new efficient packaging. This occurs in the cases where suppliers fail to pack the parts and components in the efficient packaging from start. Covering time in the packaging is set from the case company’s covering time principle. This principle says that ideal covering time due to takt time at the assembly line is at least two hours but not longer than two shifts in the assembly. The principle implies also to move waste towards the supplier as far as possible and to move the waste to the supplier as far as possible and by rationalization of profit, not otherwise. This rationalization model the case company calls “the onion” because of its method to move waste in the materials supply processes. The tactics is to move waste from the assembly line towards the suppliers in layers. See figure 4.5 below.

44(69)
Figure 6.13: Non-value-add and waste elimination principle
In the re-packing centre the re-ordering point to the suppliers is established. When the materials supplier returns from the line he or she orders materials from the suppliers to the company. The production management decides the layout for the plant and the in-plant logistics is developed as a consequence of the assembly layout. The in-plant materials supply is developed as milkruns that starts in the re-packing centre and runs in established routes in an agreed pitch (no. times/time units). There are a number of sequential replenishment arrangements where the materials supplier prepares a special made table, rack or board to provide the line with materials. In the plant there are different stores to buffer materials for production. There are high bay storages where parts in pallet are put. For smaller parts like fasteners there are special carton storages and for miscellaneous parts. The case company uses kitting as a method to provide special selected parts to the assembly. Production planning
Production planning is a pull production planning system for the lines. The replenishment signals from the assembly lines is a kanban based system where the empty boxes, cartons or pallets gives the material supply person a signal for materials needed. The assembly line façade has a 2-bin system where each bin has at least two hours covering time and a high service degree of materials to the line is very important.

45(69)
6.11.2 Case company C
Case company C is a producer of security equipment to the automotive industry. The products are mainly airbags for cars and seatbelt stretchers. Another product segment is steering consoles for heavy duty vehicles. The company study of consisted of a semi-structured interview with the logistics develop manager and a plant tour to confirm and clarify any remaining question marks from the interview. The production
The production is assembly of airbags and steering consoles but no manufacturing of parts occurs. The case company have approximately 30 assembly lines or stations altogether in three different halls. Airbag assembly lines are separated from other assembly since there are explosive components in the content of the airbag, so this assembly hall is a high security production area. The takt-time in the assembly lines is between 30 seconds up to 6 minutes. Metrics
Metrics in logistics is delivery accuracy from suppliers and delivery accuracy to the customers. This is measured in percentages. Another metric is inventory levels and annual inventory turns. For materials supply there are number of stoppages at the line due to lack of materials and how long time the stoppage lasts. The last metric is transport damages measured in monetary means. Materials supply concept
The parts and items for the final components are delivered in standardized packaging developed especially for the case company. The packaging requirements are developed to fit the assembly and the parts and items. Exceptions can be made if the suppliers have packaging with the same sizes as required from the case company. Today the case company have a maximum weight at 12 kg but strives to lower this limit to 8 kg due to ergonomic matters. Covering time in each packaging is approximately one hour of production at the line. Production planning
Production planning is divided in aggregated planning for overall production and assembly planning for each assembly line. The aggregated production planning is made in two-weeks rolling periods and is agreed and committed in a production contract based on customer demand. This aggregated production plan can be varied internally between different product variant levels. Based on this plan the capacity planning is made which have different levels where the company increases or decreases the capacity needed. This is relatively easy to do since the share of manual assembly is high. The case company uses pull-production planning in the assembly with the heijunka box method and makes a MRP each day to note their suppliers to deliver materials in agreed delivery plans. Approximately 30 % of the companies use kanban as a replenishment signal. This is a kanban based system used in production planning. The production planners for the assembly lines have full responsibility from the beginning of the plan to finished goods inventory. The replenishment signals in production are kanban cards. There are three kanban loops. 1) is between the case company and chosen suppliers (app. 30%). 2) is a signal from the line to the storage feeding the line and 3) is daily production planning (heijunka box). To facilitate the replenishment of materials in the assembly have the facades a 2-bin system. A 2-bin system has two bins with equally numbers of items in the boxes placed in the assembly façade. Bin no 1 is facing the assembler and bin no 2 is right behind the first bin. When the first bin is empty the

46(69)
assembler takes away the empty box and the second bin automatically moves to the front in the façade facing the assembler. In the case company the material supply to the assembly lines is supported with a milkrun concept. The pitch for the milkrun train is one milkrun each half-hour for every assembly line. The material suppliers’ responsibility is to supply the assembly line with materials, pick up kanban cards to the storage and take away empty packaging. Totally in the assembly there are 13 material supply loops. In the storage area there are 3 forklift trucks serving the assembly loops materials. The storage layout is a high bay storage with a 2-bin system as well. In the high bay storage each item has a predetermined position in two stories. One position is the picking position and the second is the buffer position and when the picking position is empty a materials handler refills the picking position with materials. In the high bay storage the replenishment signal is kanban loop that goes from the high bay storage to goods receiving office. The goods receiving staff orders new materials from the suppliers with the help of IT-messages triggered by a handheld barcode scanner. The materials supply concept in case company C is a consequence of the decision of the assembly layout. The materials supplier belongs to the lines and is in most cases assemblers that are scheduled as a materials supplier periodically. This way the assembly lines have a certain overcapacity in predetermined levels and the flexibility is relatively high and the lines will not be as disturbance-sensitive. The case company do not measure materials supply loops especially as they value flexibility in production higher than the risk to disturbance due to lack of materials suppliers. The size of the materials supply recourses is experience based decisions from management.
6.11.3 Case company D
The production in case company D is to develop and build engines for road machinery vehicles in the global market. This semi-structured interview was performed with a group of the staff, both from production development department and from production management. The study of consisted of a company presentation and a presentation of a resent performed production development project. After the presentation, a plant tour was made to verify aims and goals fulfilled from the development project and a question section to answer the research questions. The production
The production of the studied company consists of assembly and testing of engines in a flow oriented layout and the materials supply concept is a consequence of the assembly concept. The assembly is a line concept with the base component on a moving load carrier that moves according to a predetermined pace. The materials facades are in fixed positions and the construction of the facades are of a simple kind the production engineers easily can make changes to. This is to gain the opportunity to be as flexible as possible when changes occur in for instance volume or variety in parts. Metrics
The metrics the case company uses in the production are delivery accuracy in the highest level which is degraded to lead time, inventory turns and balance security in the mid level and number of stockouts and duration time of stockouts at the assembly line due to logistics. The

47(69)
tactics for loss degradation is a method called, non-value add activity analysis (NVAA) to be able to eliminate waste in the production. Materials supply concept
The principles for selection of packaging are to use as much standardized package as possible and as small
package as possible according to coverage time and takt time in the assembly. In cases of needs for re-packing of materials, the first principle is to push this upstream in the materials flow to the suppliers. In the case this is done with lower cost within the company it will be done locally in the production plant.
Production planning
The production planning is pull planning using a heijunka box. There are a variety of storage
solutions in the plant. The variants are high bay storage, carton storage, kitting stations and
supermarket close to the assembly. The materials are delivered to the point of consumption in
different ways. Milkruns, forklifts and sequenced delivery are the different delivery methods
used. The replenishment signal in the line is a 2-bin system and a mini and max level re-
ordering point. A kanban signal is also implemented where the empty container is the
replenishment signal. The empty container is sent to the material centre where the materials
handler scans the barcode on the container to order a new shipment. For material inbound from
suppliers the company uses an internet based application called pipe chain which the suppliers
use for refilling the material to the case company. The responsibility to order material to the
point of consumption is shared between the assemblers and materials supply persons in an
agreement.

48(69)
Chapter 7, Research methodology
This chapter will describe research methodology in general and approach, strategy and process for this research specifically. The chapter will clarify the qualitative method used and risk management in this research project.
7.1 Research approach
Research in general can be performed with various methodological approaches. Arbnor and Bjerke (1994) differ between three methodological approaches:
• The analytical approach – reality is objective (positivistic approach)
• The actors’ approach – reality is a social construction (hermeneutic approach)
• The system approach – in a complex context reality is objectively achievable where components interact through relations and final understanding will be reached by mapping.
The positivistic approach, that is usually used in nature science, where the reality is objective, the hermeneutic approach is used in a social context where time, culture and individuals are dependent factors and the reality is subjective. The third approach is the system approach which is used in a complex context where a network of related activities is to be taken in consideration.
This thesis will be a research in the area of logistics in an industrial environment the system approach will be the applied approach. This is because of the complex, context-dependent system logistics is, where processes need to interact with each other and not be seen as separate parts. Lambert et al (1998) proposes the system approach for logistics, since logistics is a system itself. Two methods for knowledge development defined by Arbnor and Bjerke (1994) are induction and deduction. To form common laws from empirical observations of isolated cases, induction is a preferred method. Deduction aims to predict an isolated event based on common laws. System approach is neither inductive nor deductive and a third knowledge developing method is more appropriate, abduction, which is something in between and will be used in this research.
7.2 Research strategy
In this research, two case studies will be used. This is because a limited part of the supply chain in the production system will be studied (Ejvegård 1996), namely in-house transportation

49(69)
which is a small part of a bigger and more complex context. According to Yin (1994) there are three types of case study: exploratory, descriptive and explanatory. This chapter intends to present the scientific view for this thesis. Since there are different ways to perform scientific research Yin (1994) describes five different strategies:
• Experiments
• Surveys
• Archival analysis
• History
• Case study
Chosen strategy depends on the research goal and conditions. This research will perform two case studies to answer the research questions by “how” and “why”. The predominant part of the case studies were of descriptive type which fit the research questions well as this answer “how” and “why” questions.

50(69)
Table 7.1: – When to use which research strategy, Yin (1994).

51(69)
7.3 Data collection
There are six different sources of data for a case study according to Yin (1994): documents, archival records, direct observations, participant observations, interviews and physical artefacts. In the case studies (two), in this research project, the empirical data will be collected from documents, direct observations, participant observations and interviews. There will also be a “state-of-the-art” -study performed to scan the research field for research made in the area and to develop a foundation for future state. Documents are important in a case study. When using documents it is important to verify that they are accurate and valid for the research. Documents to use are for example OEE-charts, organisations charts and archival records in this thesis. Company 1 has a long history of saving data in different ways, such as PDS, a process data collection tool, OEE-charts in different manufacturing processes. This is used for process control and process improvements. Analysing historical documents from this company is a way to collect data and secure the quality of data. To make direct observations in a scientific way Kidder (1981) claims the following criteria to be fulfilled: a scientific aim, planned, systematically registered, and controlled in respect to reliability and validity. Direct observations formalised in a VSM (value stream mapping) will be used in the field of the research to collect data. Because of the field of research, direct observations are an accurate technique. The use of making a VSM in the physical environment is to develop a model of the logistics process in-house and to develop the base for interviews. This will also be used after the interviews for quality assurance in the data collected. The researcher will perform participant observations to test the future state developed in the participating company together with the blue collar workforce and the project group of the research. To become a part of the study, the researcher can collect data that is hard to obtain in another way (Yin 1994). This will be done to develop the future state. Interviews are an important technique for data collection when performing a case study. Interviews can be classified in four groups according to Lantz (1993): the structured; the semi-structured; the directed open; and the open interview. The structured and the semi-structured are suitable for objective data collection and the directed open and the open interview for more subjective data. Semi-structured and open interviews was performed in the research, this to have the possibility to clarify interview questions asked and to go deeper in the research area. This research will use interviews to find answers not found in the document study and to verify findings made therein. To be able to scan the area of the research, literature studies will be performed in relevant topics, such as academic papers and books in supply chain management. The purpose for this is to find a state-of-the-art within the research area.
7.4 Data analysis
In this thesis following approaches and analysis methods will be used as described below. When sufficient data is collected to make an analysis, conclusions can be drawn. In literature there are many approaches described. According to Yin (1994) pattern-matching logic is a

52(69)
good method for analysis in case studies. When comparing empirical patterns with predicted patterns, this technique is essential. In this research direct observations and archival records will be computed, analysed and compared. In case study two, there will also be benchmarking for the same type of observations in studied companies to get data to analyse in different types of industrial environment and set-ups. The researcher will perform the data collection techniques mentioned above. The researcher knows the studied company A well, as an employee since four years and is working with logistics development within the company. The researcher has also been a project leader for the logistics sub-project in the CS09-project that has developed current state for the logistics set-up. The researcher is well known in the company since been working with logistics development projects during the whole employment.

53(69)
7.5 The research process
Blessing and Chakrabarti (2007) has proposed a research methodology to address research questions and link them to the research in a systematic way. This method is called design research and intends to propose a work-process, in this case applicable to develop KPI’s for measurement in in-plant materials supply and to formulate guidelines for different concepts are appropriate for different types of manufacturing set-ups. See figure 2.1 below.
Figure 7.1: Describes the design research methodology process (Blessing and Chakrabarti 2007).
To relate this research to design research methodology the research questions are mapped as described in figure 2.2.
Figure 7.2: Design research methodology application related to research questions

54(69)
This research is being done in the logistics process point of view, and in a small part of the logistics organization. Case study I is performed in case company A and will be done to formulate the problem statement and clarify the objective for the research. Once this is done, a literature study will be performed to choose method or methods to be able to determine a sufficient research approach. The next step is to collect data for the empiric analysis. This is done in different ways, through documents, direct observations, interviews, and literature studies. The analysis of the collected data is expected to result in a current state description. This will be the starting point in case study II. The case study II is a multiple case study in the three benchmarking companies A, B and C. To start case study II there will be a review of case study I and the outcome of this will be the fundament in benchmarking in selected companies for the research. In the benchmarking there will be interviews from relevant personnel, direct observations and literature studies. The result of the data collection will be analysed and guidelines will be developed for deciding in-plant materials supply concepts and to propose KPI’s for in-plant materials supply.
7.6 Research quality – reliability and validity
To secure the quality and the results from the research there are a few techniques to use. Certain aspects have to be dealt with from the technique in use. Measurement, parameters, instruments for measure, tests and methods for investigation have to be reliable and valid to be suitable and useful. These prerequisites have to be fulfilled, if not, the research will be without scientific value (Ejvegård 1996). If the instruments for measure and chosen units and procedures can be repeated, giving the same results they are reliable and trustworthy. Validity is high if you really measure what is intended to measure. It is also important that you know what the chosen unit mean and use it consequently through out the research. In this research the intention is to perform interviews with personnel in key-positions with accurate field of knowledge to strengthen the validity in the data collection phase. This is to investigate the current state. Documents from recent investigations and production development projects will be analysed as well. The interview questions will be the same in company A as well as in companies B, C and D for benchmarking. Issues that can affect the reliability and validity in a negative way are if the financial crisis continues and the manufacturing is on a very low level. Then it is hard to get valid values for the value stream mapping. In this case historical documents will be investigated and analysed. There may also be a conflict of interest because the researcher is an employee and a former project leader in Research Company 1. There will be continuous steering committee meetings to grant the research quality. Another risk is if the researcher does not get to interview the right personnel in benchmarking companies. To minimize this risk, the researcher will examine the benchmarking together with the academic mentors. To ensure the research deliverables the result from the research will be compiled and a number of reference studies to other companies will be conducted to validate the proposed approach. To examine the extent to which this research project in line with reality, internal validity,

55(69)
triangulation will be used. Triangulation involves using multiple researchers, multiple information sources and multiple methods to confirm the results found retrospectively (Merriam, 1994). There will also be control of participation which involves controlling their interpretations of those interviewed or observed (Merriam, 1994). This research project is an initiative developed through collaboration between the case company A and Mälardalen University. The initiative has been named prepare and is a one-year exploratory research program. Emphasis will be placed on the industrial application of the results. Research will continue in parallel with, the applying the work at the case company A, which is why the time for research is limited.

56(69)
Chapter 8, Result of the research
Answering the research questions is a challenging task and needs to be thoroughly explored and researched. Many methods, guidelines and decision-trees have been developed during the years and to find a new guideline is indeed a challenging task. However, this report is a feasibility study to future research in the field and an attempt to fill a gap for better guidelines at the case company. The result of this research is how to set up KPI’s to support in-plant materials supply and a guideline for choosing materials supply and a proposition for further research.
8.1 Objective of this research and the research questions
The objective of this research has been a try to develop relevant KPI’s to measure in-plant materials supply and to develop a guideline for choosing an in-plant materials supply concept. The first research question deals with metrics in in-plant materials supply and the efficiency.
RQ 1 – What type of KPI’(s) to measure in-plant materials supply is (/ are) relevant?
On the corporate level the delivery accuracy KPI is the most accurate to use together with annually inventory turn. To go further down in the company these KPI’s need to be refined and become more usable. The KPI’s to measure in-plant supply is a mix of productivity, delivery accuracy and service degree. It is important to be able to use it in the daily work. The KPI proposed is an efficiency rate metric the author of this thesis calls Efficiency in Materials Supply (EMS). This metric is a modification of the manual assembly efficiency formula (MAE). The EMS-formula is defined as follows:
EMS = ((# N ass* t d ) – (# S log* t st)) / N v *(t TOT - t PS)*100
Nass = number of assignments to station (unites)
td = time per assignment (time/unite)
Slog = number of stoppage on station/line due to logistics (unites)
tst = duration of stoppage (time/unit)
Nv = number of vehicles in work (number of)
tTOT = total production time (time)
tPS = total planned stoppage time (time)
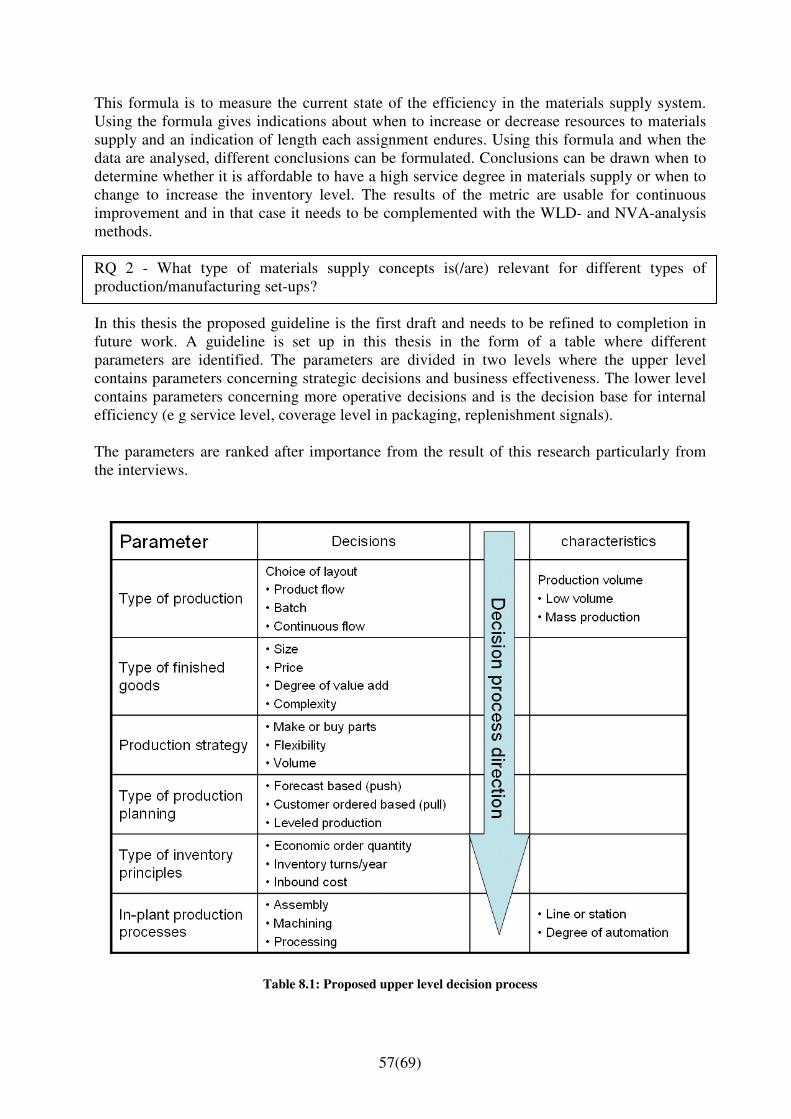
57(69)
This formula is to measure the current state of the efficiency in the materials supply system. Using the formula gives indications about when to increase or decrease resources to materials supply and an indication of length each assignment endures. Using this formula and when the data are analysed, different conclusions can be formulated. Conclusions can be drawn when to determine whether it is affordable to have a high service degree in materials supply or when to change to increase the inventory level. The results of the metric are usable for continuous improvement and in that case it needs to be complemented with the WLD- and NVA-analysis methods. RQ 2 - What type of materials supply concepts is(/are) relevant for different types of production/manufacturing set-ups? In this thesis the proposed guideline is the first draft and needs to be refined to completion in future work. A guideline is set up in this thesis in the form of a table where different parameters are identified. The parameters are divided in two levels where the upper level contains parameters concerning strategic decisions and business effectiveness. The lower level contains parameters concerning more operative decisions and is the decision base for internal efficiency (e g service level, coverage level in packaging, replenishment signals). The parameters are ranked after importance from the result of this research particularly from the interviews.
Table 8.1: Proposed upper level decision process

58(69)
In the table 8.1 above, the proposed decision process begins with production characteristics such as volume and what to produce. Production strategy tells the decision maker, the company’s view on capacity in manning and machine investments and the production planning give indications of inventory management as well as the inventory principles. The last parameter in the upper decision process describes the processes in more detail what and where to invest resources. In the lower level there are more tactic parameters to take in consideration. In the table below 8.2, these parameters are presented.
Table 8.2: Proposed lower level decision process
In this table 8.2 the service degree is the most important parameter and is the parameter that has the greatest impact on the choice of in-plant materials supply.

59(69)
Table 8.3: The table show criteria’s to choose materials supply concepts
The table 8.3 above show the criteria to choose from when it comes to materials supply concepts. This thesis elaborate on a vision of a process for realising an in-plant materials supply solution, based upon a review of earlier research on the subject of materials supply design, an industrial challenge and two case studies. The decision process for materials supply solution begins with the understanding part as Polizzi (1996) proposes. The overall decision process is first to consider the company objective’s from an overhead point of view. The business production strategy needs to be examined and what principles and processes it comprises of. The next step is to examine the production processes in detail in general and materials supply in specific. One criterion that affects the materials supply and is considered more important by the case companies in this research is service degree. A method to evaluate the processes is value stream mapping by making a plan fore every part and have the R4ET-principle as prerequisite. The result from the preceding process is a prerequisite to choose materials supply concept in the last table in the guideline.

60(69)
Chapter 9, Analysis and discussion from the
case studies
In this chapter of the thesis an analysis of the participating companies is being performed. Tables of arguments deriving from the empirical studies are set up and arguments will be compared to be able to draw conclusions from. The weight from the arguments in the table 9.1 below is a product from the analysis the researcher made from the interviews with the respondents. When analyzing the case companies’ KPI’s, it is reasonably clear that delivery accuracy and stoppage on line due to logistics are the most important parameters. See table 9.1. Company A and Company B has the same KPI’s in the same order and this indicates that they consider them as important. The other KPI’s differs in the rest of the case companies. This may of course depend on that the respondent in the interviews does not have the knowledge of all KPI’s in the company they represent, such as inventory turns annually but the outcome is rather clear.
Table 9.1: Table for use of metrics in case companies
A second table 9.2 is a comparison what is the most important arguments when choosing a materials supply concept or set-up. The arguments are chosen from the interview questionnaire used in the case study.

61(69)
Table 9.2: Table for materials supply concept
The findings from this table are that the type of production is the most important argument when choosing concepts for the case companies involved. The second most important argument for choice of materials supply is the service degree for material to the assembly and machining stations. Case company C had a deviation on this argument but it was a minor deviation comparing to the other case companies. Type of packaging have a great impact on the choice of materials supply and was the third most important argument when designing a concept according to the case companies. The layout at the receiving station was the fourth most important argument and the production planning the fifth. We can see that this is not entirely conform the companies in between since the case company C answers that the production planning process is the second most important argument. The requirements and type of the parts comes on the sixth place but the case company B valued the parts more important than the production planning. The inventory principles and replenishment signals from the stations were equally important for the case companies as a whole. Furthermore, findings are made from the case studies that the productions layout is the most important prerequisite for the development of materials supply that becomes a consequence of the production. The second most important parameter is the service level from the materials supply organisation. An interesting finding is that the packaging of the parts plays a more vital role than the part itself when it comes to materials supply in the case studies companies. Further, there are guidelines in at least two of the case companies to use for development of the materials supply area. The problem is the availability to know that these guidelines exist and make them accessible for the users.

62(69)
8.1 Discussion
In the area of materials supply there is a great deal of research being done. There are many theses and models developed in a high level but they may be complicated to use and the risk is that they will be forgotten and placed in the sea of wisdom forever. The trick is to develop KPI’s and guidelines that are so easy to use that they will be used frequent and not considered a hindrance in the daily work. In the studied companies there are production development activities going on constantly and different methods are created. These activities are mostly incremental improvement projects where minor decisions are taken. The radical productions development projects are few, as in case company A, but important ones. In these cases, guidelines need to be examined and used to be successful and the starting point is always in the highest possible level. In this thesis, big companies are being studied and for these companies there are guidelines and routines developed through many years of production development and they have much in common with theoretical models. In the small company, it is often the case that development of production is neglected due to lack of competence or recourses, but of course small incremental improvements are being done. The intention of this thesis is to develop an easy used set of KPI’s and an easy used guideline for improving the materials supply area in the manufacturing companies. It is important to consider the whole production system and understand the underlying strategies and principles to be able to develop the materials supply system. To have control over the current state is very important and a prerequisite to be able to improve it. The OEE and MAE formulas could be of use if they are changed and customized to materials supply.
63(69)
Chapter 10, Conclusions and Future Work
This chapter introduces conclusions of the case studies and the research as a whole by answering and discussing the research questions. The contributions and fulfilment of the objectives of the research are discussed and future work is presented.
10.1 Conclusions
Changing the in-plant materials supply in an established productions system is indeed a complex task. Therefore to create a guideline that is suitable in both existing production and in an early production development phase is hard. It seems to be a luxury to have the opportunity to be in the early production development phase and be able to affect the materials supply solution. In the case company and the benchmarked companies is the in-plant materials supply concept a consequence of the production development concepts. The case companies’ value high service degrees from the materials supply department and a minimum of inventory higher than optimized in-plant materials delivery organization. It is accepted in the companies to have overcapacity in the in-plant material feeding fleet with a high service degree. Today the investigated companies have an experience based decision method to decide the size of the in-plant materials supply department. Most changes or development in the materials supply area are incremental changes and therefore not a subject of a deeper analysis in the case companies. Methods like Work-Load Dose (WLD) become rather expensive to run. In the other end are different methods like value stream mapping and non-value add analyses more simple concepts and easy to use in the daily work. In the process of choosing effective in-plant materials supply lean production principles contributes to eliminate waste in daily work and have developed different tools to identify non-value added activities. This work is being done in continuous improvement groups who are established according to lean production philosophies. One key-factor not to underestimate is the support from top-management to become successful in improvement of the production. In the case of building a new production facility there are more accurate complex analysis methods to use. Another conclusion made is that in some companies, the experience based decisions are good enough and measuring efficiency in the departments is not a prioritized task. A few companies on the other hand have an established method to identify, analyse and eliminate waste in the productions as a whole, which affects in-plant materials supply as well. Often KPI’s are measured in a high level and are hard to canalize to a balanced scorecard that is easy to use in the daily work. Therefore it is vital to consider what KPI’s has the greatest effect and are easy to use daily to be of any help and support for the management. The point in having KPI’s is to be of help in the company control and a tool to find possible improvement areas.

64(69)
10.2 Future Work
This section is dedicated to give ideas for future work in the materials handling area. Since this thesis is a feasibility study for further research the results needs to be further developed and refined. In the area of metrics, the results in this thesis need to be developed further since the EMS metric is only theoretically tested. The KPI need to be further tested and verified in an industrial environment. There need to be a stronger connection between KPI’s in the highest level and the KPI’s used in the daily work. The point is to create tools, as easy to use so they do not feel as a hindrance in the work. The next step in this research is to create a decision tree to develop a final guideline for choice of in-plant materials supply in different stages of production development. Furthermore, there are a number of issues that are of interest for further research. There are issues both in line to the subject in this thesis and areas related to it:
• When in the productions development process, shall decisions in the logistics area be made? Is it vital that the logistics solution is decided early in the production development process or is the logistics solution a consequence from it? When is decision the most profitable for the company?
• When in the production development process shall materials handling concepts be considered?
In the area of assembly it is a great focus on effective materials handling and it is vital to identify and eliminate waste. In the manufacturing area, the focus is in the traditional production engineering areas such as metal cutting. The question is whether materials handling costs are negligible or if it has a great impact on pricing or not in the end and what parameters affect the most?

65(69)
References
Arbnor, I & Bjerke, B. (1994), Företagsekonomisk metodlära, studentlitteratur, Lund
Bellgran, M., Säfsten, K. (2005), Produktionsutveckling – Utveckling och drift av
produktionssystem, Studentlitteratur, Lund
Bicheno, J. (2003) The new lean toolbox towards fast, flexible flow. PICSIE Books, United Kingdom
Blessing, L. T. M., Chakrabarti, A., (2007), A design Research Methodology – An Approach to
Doing Design Research (DRAFT), London, Springer - Verlag
Domingo, R., Alvarez, R., Melodia Penã, M., Calvo R., (2007), Materials flow improvement in
a lean assembly line: a case study, Assembly Automation, Volume 27, Number 2, pp. 141-147(7)
Ejvegård, R. (1996), Vetenskaplig metod, 2nd edition, Studentlitteratur, Lund
Hanson, R., (2009), On the options available in the design of in-plant materials supply
systems, Licentiate Thesis, Department of Technology and Economics, Chalmers University of Technology: Sweden
Jackson, M., Petersson, P. (1999), Productivity – An Overall Measure of Competitiveness,
Proceedings of the 32nd CIRP International Seminar on Manufacturing Systems, Leuven, Belgium, pp. 573-581.
Johansson, E. (2006), Materials supply systems design during product development projects, Dissertation, Chalmers University of Technology: Sweden
Johansson, M. I., Karlsson, H., Mathisson-Öjmertz, B. Örtengren, R., (1998), Work-load and
efficiency considerations in early stages of materials flow system design, (submitted to journal) Department of Transportation and logistics, Chalmers University of Technology: Sweden
Lambert, D. M., Stock, J. R. & Ellram, L. M. (1998), Fundamentals of logistics management, McGraw-Hill Higher Education, United States of America.
Lantz, A. (1993), Intervjumetodik, Studentlitteratur, Lund
Liker, J. K (2004), The Toyota Way, McGraw-Hill, New York
Mather, H. (1998), Competitive manufacturing, Prentice Hall, Englewood Cliffs.
Merriam, S. B. (1994), Fallstudien som forskningsmetod, Studentlitteratur, Lund
Polizzi, M, A., (1996), Methodology for the synchronization of material flow in an assembly
plant, Thesis (M.S.) Massachusetts Institute of Technology, Sloan School of Management
Ritzman, L. P., Krajewski, L. J. (2002), Operations management - strategy and analysis, 6th edition, Prentice-Hall International Inc, United States of America.

66(69)
Storhagen, N. G., Logistik – grunder och möjligheter, 1st edition, Liber, Malmö
Wiktorsson, M. (2000), Performance Assessment of Assembly Systems Linking Strategy to
Analysis in - Early Stage Design of Large Assembly System, Dissertation. Assembly Systems. Royal Institute of Technology: Sweden
Yin, R. K. (1994), Case study research – design and methods, SAGE Publications Inc, London
Öjmertz, B. (1998), Materials Handling from a Value-Adding Perspective, Doctoral Thesis, Department of Transportation and logistics, Chalmers University of Technology: Sweden

67(69)
Appendix
In the thesis interviews were performed and the questionnaire used is the shown below.

68(69)

69(69)