Embed Size (px)
Citation preview
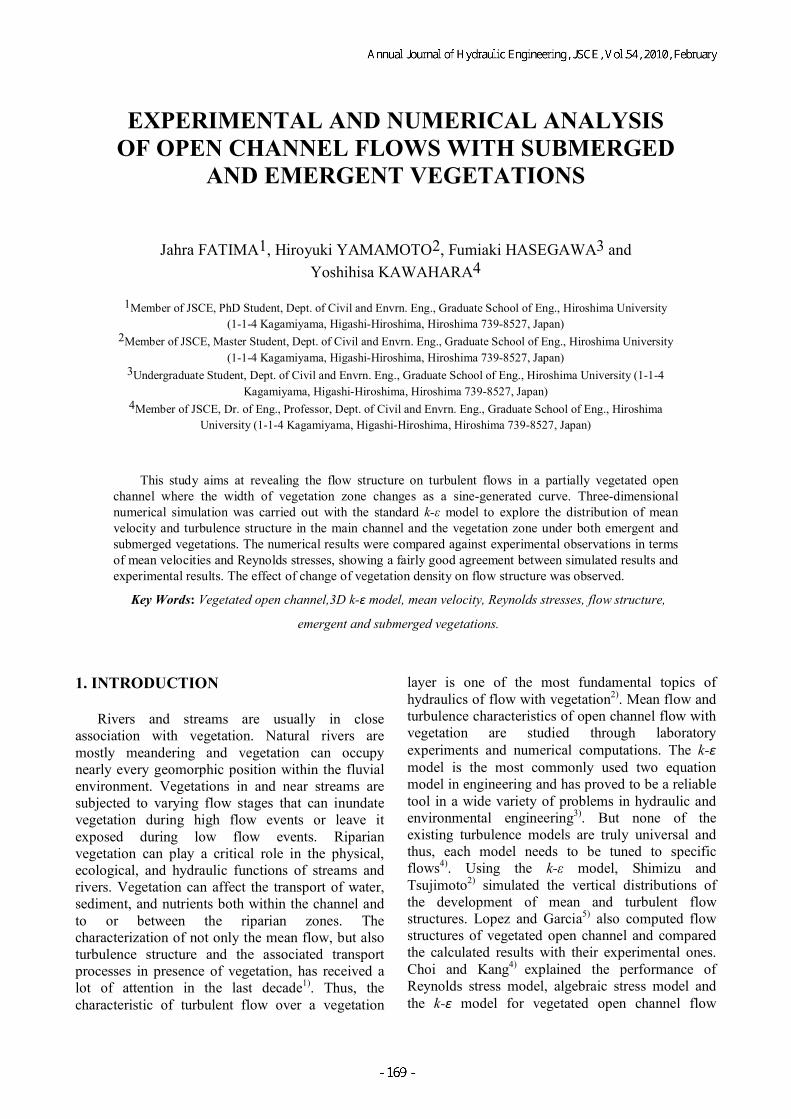
Annual Journal of Hydraulic Engineering, JSCE, Vol.54, 2010, February
EXPERIMENTAL AND NUMERICAL ANALYSIS OF OPEN CHANNEL FLOWS WITH SUBMERGED
AND EMERGENT VEGETATIONS
Jahra FATIMA1, Hiroyuki YAMAMOTO2, Fumiaki HASEGAWA3 and Yoshihisa KAWAHARA4
1Member of JSCE, PhD Student, Dept. of Civil and Envrn. Eng., Graduate School of Eng., Hiroshima University
(1-1-4 Kagamiyama, Higashi-Hiroshima, Hiroshima 739-8527, Japan) 2Member of JSCE, Master Student, Dept. of Civil and Envrn. Eng., Graduate School of Eng., Hiroshima University
(1-1-4 Kagamiyama, Higashi-Hiroshima, Hiroshima 739-8527, Japan) 3Undergraduate Student, Dept. of Civil and Envrn. Eng., Graduate School of Eng., Hiroshima University (1-1-4
Kagamiyama, Higashi-Hiroshima, Hiroshima 739-8527, Japan) 4Member of JSCE, Dr. of Eng., Professor, Dept. of Civil and Envrn. Eng., Graduate School of Eng., Hiroshima
University (1-1-4 Kagamiyama, Higashi-Hiroshima, Hiroshima 739-8527, Japan)
This study aims at revealing the flow structure on turbulent flows in a partially vegetated open channel where the width of vegetation zone changes as a sine-generated curve. Three-dimensional numerical simulation was carried out with the standard k-ε model to explore the distribution of mean velocity and turbulence structure in the main channel and the vegetation zone under both emergent and submerged vegetations. The numerical results were compared against experimental observations in terms of mean velocities and Reynolds stresses, showing a fairly good agreement between simulated results and experimental results. The effect of change of vegetation density on flow structure was observed.
Key Words: Vegetated open channel,3D k-ε model, mean velocity, Reynolds stresses, flow structure,
emergent and submerged vegetations.
1. INTRODUCTION Rivers and streams are usually in close association with vegetation. Natural rivers are mostly meandering and vegetation can occupy nearly every geomorphic position within the fluvial environment. Vegetations in and near streams are subjected to varying flow stages that can inundate vegetation during high flow events or leave it exposed during low flow events. Riparian vegetation can play a critical role in the physical, ecological, and hydraulic functions of streams and rivers. Vegetation can affect the transport of water, sediment, and nutrients both within the channel and to or between the riparian zones. The characterization of not only the mean flow, but also turbulence structure and the associated transport processes in presence of vegetation, has received a lot of attention in the last decade1). Thus, the characteristic of turbulent flow over a vegetation
layer is one of the most fundamental topics of hydraulics of flow with vegetation2). Mean flow and turbulence characteristics of open channel flow with vegetation are studied through laboratory experiments and numerical computations. The k-ε model is the most commonly used two equation model in engineering and has proved to be a reliable tool in a wide variety of problems in hydraulic and environmental engineering3). But none of the existing turbulence models are truly universal and thus, each model needs to be tuned to specific flows4). Using the k-ε model, Shimizu and Tsujimoto2) simulated the vertical distributions of the development of mean and turbulent flow structures. Lopez and Garcia5) also computed flow structures of vegetated open channel and compared the calculated results with their experimental ones. Choi and Kang4) explained the performance of Reynolds stress model, algebraic stress model and the k-ε model for vegetated open channel flow
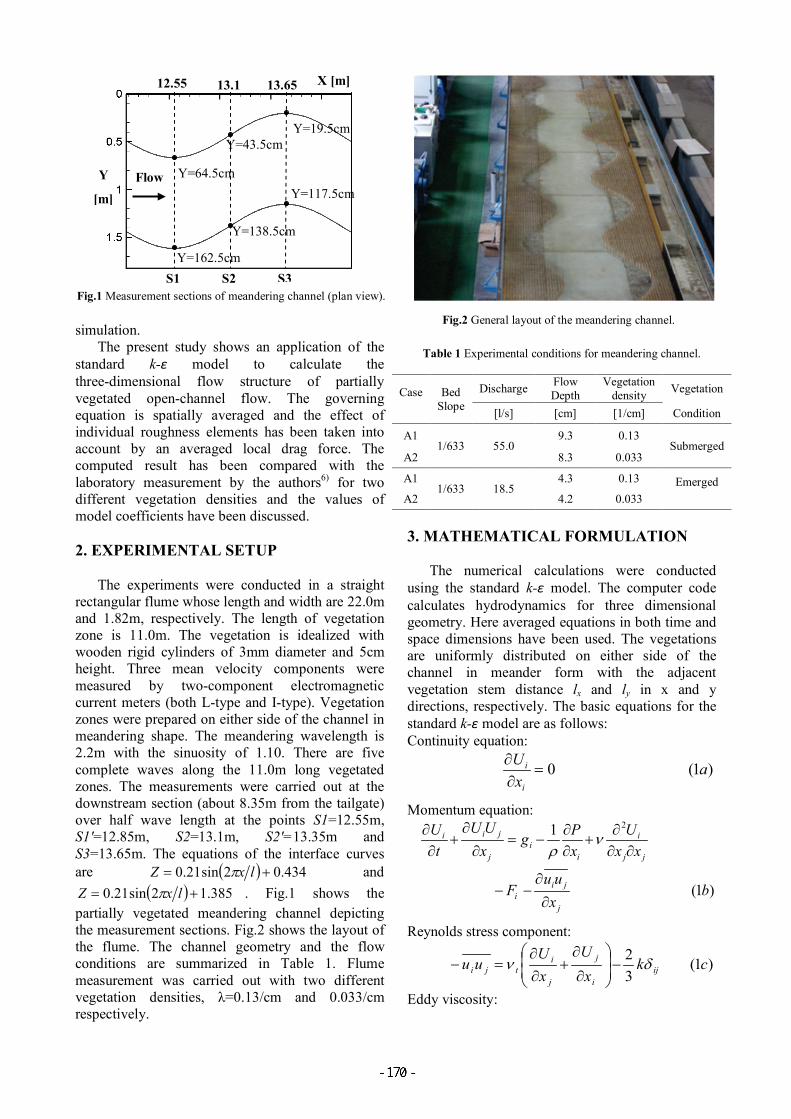
simulation. The present study shows an application of the standard k-ε model to calculate the three-dimensional flow structure of partially vegetated open-channel flow. The governing equation is spatially averaged and the effect of individual roughness elements has been taken into account by an averaged local drag force. The computed result has been compared with the laboratory measurement by the authors6) for two different vegetation densities and the values of model coefficients have been discussed. 2. EXPERIMENTAL SETUP The experiments were conducted in a straight rectangular flume whose length and width are 22.0m and 1.82m, respectively. The length of vegetation zone is 11.0m. The vegetation is idealized with wooden rigid cylinders of 3mm diameter and 5cm height. Three mean velocity components were measured by two-component electromagnetic current meters (both L-type and I-type). Vegetation zones were prepared on either side of the channel in meandering shape. The meandering wavelength is 2.2m with the sinuosity of 1.10. There are five complete waves along the 11.0m long vegetated zones. The measurements were carried out at the downstream section (about 8.35m from the tailgate) over half wave length at the points S1=12.55m, S1'=12.85m, S2=13.1m, S2'=13.35m and S3=13.65m. The equations of the interface curves are ( ) 434.02sin21.0 += lxZ π and
( ) 385.12sin21.0 += lxZ π . Fig.1 shows the partially vegetated meandering channel depicting the measurement sections. Fig.2 shows the layout of the flume. The channel geometry and the flow conditions are summarized in Table 1. Flume measurement was carried out with two different vegetation densities, λ=0.13/cm and 0.033/cm respectively.
Table 1 Experimental conditions for meandering channel.
Case
Bed Slope
Discharge Flow Depth
Vegetation density Vegetation
[l/s] [cm] [1/cm] Condition
A1 1/633 55.0
9.3 0.13 Submerged
A2 8.3 0.033
A1 1/633 18.5
4.3 0.13 Emerged A2 4.2 0.033
3. MATHEMATICAL FORMULATION The numerical calculations were conducted using the standard k-ε model. The computer code calculates hydrodynamics for three dimensional geometry. Here averaged equations in both time and space dimensions have been used. The vegetations are uniformly distributed on either side of the channel in meander form with the adjacent vegetation stem distance lx and ly in x and y directions, respectively. The basic equations for the standard k-ε model are as follows: Continuity equation:
)1(0 axU
i
i =∂∂
Momentum equation:
)1(
1 2
bxuu
F
xxU
xPg
xUU
tU
j
jii
jj
i
ii
j
jii
∂∂
−−
∂∂∂
+∂∂
−=∂
∂+
∂∂ ν
ρ
Reynolds stress component:
)1(32 ck
xU
xU
uu iji
j
j
itji δν −
∂
∂+
∂∂
=−
Eddy viscosity:
Y=117.5cm
Y=19.5cm
Y=138.5cm
Y=43.5cm
Y=162.5cm
Y=64.5cm Flow
S2 S1 S3
Y
[m]
Fig.2 General layout of the meandering channel.
13.65 X [m] 13.1 12.55
Fig.1 Measurement sections of meandering channel (plan view).
)1(2
dkCt εν µ=
The distribution of k and ε can be expressed by the following transport equations:
)1( ePUFC
xk
xxkU
tk
rodiifk
mk
t
mj
j
ε
νσν
−++
∂∂
+
∂∂
=∂∂
+∂∂
( ) )1(121 fUFCCCPCk
xxxU
t
iifrod
m
t
mj
j
εεεε
ε
εε
ενσνεε
+−+
∂∂
+
∂∂
=∂
∂+
∂∂
Production of turbulent kinetic energy:
)1( gxU
xU
xU
xUuuP
j
j
i
j
j
it
j
ijirod ∂
∂−
∂∂
+∂∂
=∂∂
−= ν
Drag force due to vegetation per unit volume of water:
)1(21 hUUUCF jjiDi λ=
where CD is drag coefficient, λ is vegetation density defined by
( )ill
Dyx
1=λ
The model constants are3): Cµ=0.09, σk=1.0, σε=1.3, Cε1=1.44 and Cε2=1.92. The model coefficients Cfk=1.0, Cfε=1.33 suggested by Lopez and Garcia 4)
have been adopted considering the result of model calibration. The basic equations are discredited by Finite volume method. The convective term has been discretized by Power-law scheme and the SIMPLE algorithm has been used. At the bottom and near the side walls “wall function” technique has been implemented. The wall boundary conditions for U, k and ε are applied at a point Z=Zp adjacent to the wall and in the log-law region. The region between point Zp and the actual wall is related by the following relationship3):
)1(,,ln1 3*
2**
*
jZ
UC
UkUZ
EkU
U
ppp
pr
p
κε
ν µ
==
=
where Er is the wall roughness parameter, Er=9.0 for smooth wall and sr kUE */30= for hydraulic rough wall. In this study, bed roughness has been considered, where, the equivalent roughness height ks=1 mm. At the inlet all variables are specified to have constant values whereas at the downstream end the longitudinal gradients of all variables are assumed to be zero. Free surface is treated as a symmetry plane.
4. EXPERIMENTAL AND NUMERICAL RESULTS
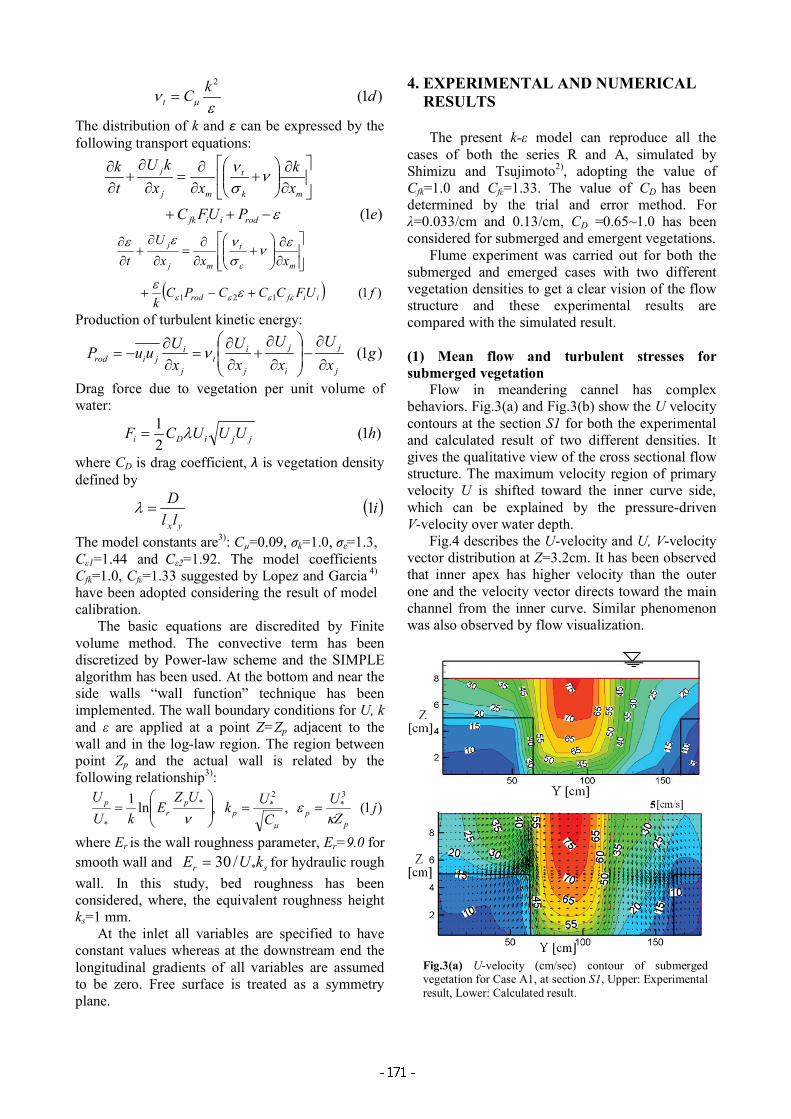
The present k-ε model can reproduce all the cases of both the series R and A, simulated by Shimizu and Tsujimoto2), adopting the value of Cfk=1.0 and Cfε=1.33. The value of CD has been determined by the trial and error method. For λ=0.033/cm and 0.13/cm, CD =0.65~1.0 has been considered for submerged and emergent vegetations. Flume experiment was carried out for both the submerged and emerged cases with two different vegetation densities to get a clear vision of the flow structure and these experimental results are compared with the simulated result. (1) Mean flow and turbulent stresses for submerged vegetation Flow in meandering cannel has complex behaviors. Fig.3(a) and Fig.3(b) show the U velocity contours at the section S1 for both the experimental and calculated result of two different densities. It gives the qualitative view of the cross sectional flow structure. The maximum velocity region of primary velocity U is shifted toward the inner curve side, which can be explained by the pressure-driven V-velocity over water depth.
Fig.4 describes the U-velocity and U, V-velocity vector distribution at Z=3.2cm. It has been observed that inner apex has higher velocity than the outer one and the velocity vector directs toward the main channel from the inner curve. Similar phenomenon was also observed by flow visualization.
Fig.3(a) U-velocity (cm/sec) contour of submerged vegetation for Case A1, at section S1, Upper: Experimental result, Lower: Calculated result.
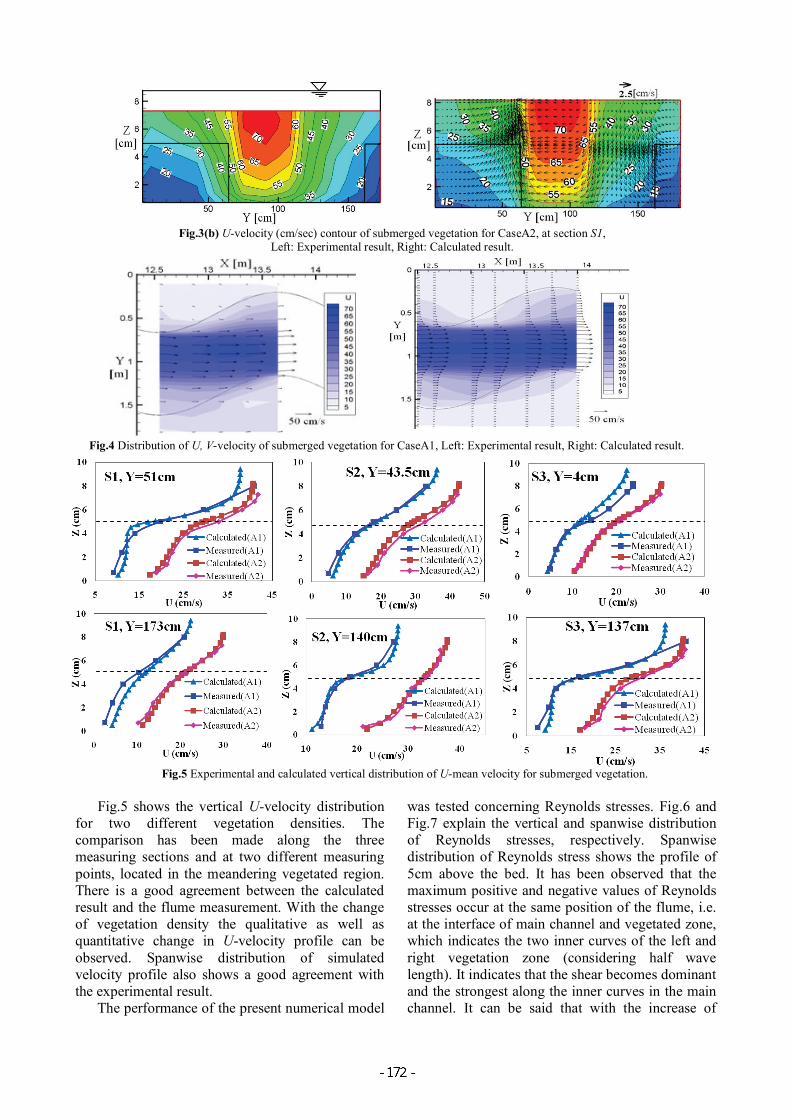
Fig.5 Experimental and calculated vertical distribution of U-mean velocity for submerged vegetation.
Fig.5 shows the vertical U-velocity distribution for two different vegetation densities. The comparison has been made along the three measuring sections and at two different measuring points, located in the meandering vegetated region. There is a good agreement between the calculated result and the flume measurement. With the change of vegetation density the qualitative as well as quantitative change in U-velocity profile can be observed. Spanwise distribution of simulated velocity profile also shows a good agreement with the experimental result.
The performance of the present numerical model
was tested concerning Reynolds stresses. Fig.6 and Fig.7 explain the vertical and spanwise distribution of Reynolds stresses, respectively. Spanwise distribution of Reynolds stress shows the profile of 5cm above the bed. It has been observed that the maximum positive and negative values of Reynolds stresses occur at the same position of the flume, i.e. at the interface of main channel and vegetated zone, which indicates the two inner curves of the left and right vegetation zone (considering half wave length). It indicates that the shear becomes dominant and the strongest along the inner curves in the main channel. It can be said that with the increase of
Fig.4 Distribution of U, V-velocity of submerged vegetation for CaseA1, Left: Experimental result, Right: Calculated result.
Fig.3(b) U-velocity (cm/sec) contour of submerged vegetation for CaseA2, at section S1, Left: Experimental result, Right: Calculated result.
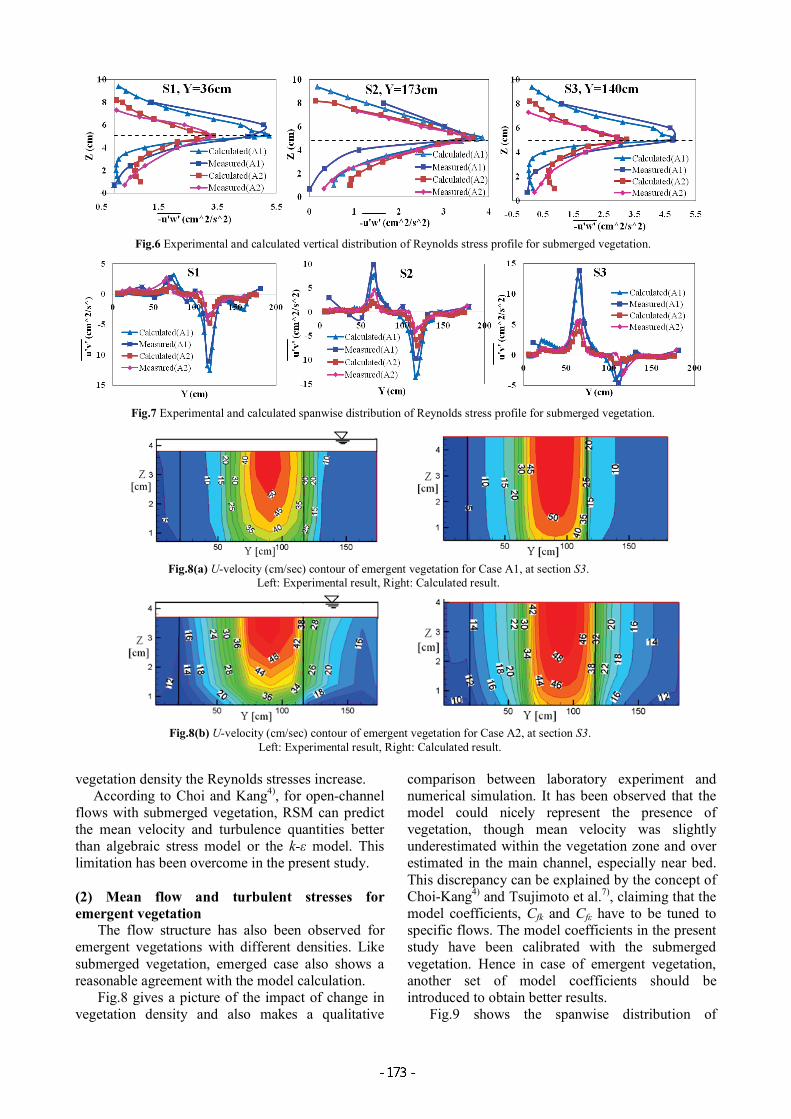
vegetation density the Reynolds stresses increase. According to Choi and Kang4), for open-channel
flows with submerged vegetation, RSM can predict the mean velocity and turbulence quantities better than algebraic stress model or the k-ε model. This limitation has been overcome in the present study. (2) Mean flow and turbulent stresses for emergent vegetation The flow structure has also been observed for emergent vegetations with different densities. Like submerged vegetation, emerged case also shows a reasonable agreement with the model calculation. Fig.8 gives a picture of the impact of change in vegetation density and also makes a qualitative
comparison between laboratory experiment and numerical simulation. It has been observed that the model could nicely represent the presence of vegetation, though mean velocity was slightly underestimated within the vegetation zone and over estimated in the main channel, especially near bed. This discrepancy can be explained by the concept of Choi-Kang4) and Tsujimoto et al.7), claiming that the model coefficients, Cfk and Cfε have to be tuned to specific flows. The model coefficients in the present study have been calibrated with the submerged vegetation. Hence in case of emergent vegetation, another set of model coefficients should be introduced to obtain better results. Fig.9 shows the spanwise distribution of
Fig.6 Experimental and calculated vertical distribution of Reynolds stress profile for submerged vegetation.
Fig.7 Experimental and calculated spanwise distribution of Reynolds stress profile for submerged vegetation.
Fig.8(b) U-velocity (cm/sec) contour of emergent vegetation for Case A2, at section S3. Left: Experimental result, Right: Calculated result.
Fig.8(a) U-velocity (cm/sec) contour of emergent vegetation for Case A1, at section S3. Left: Experimental result, Right: Calculated result.
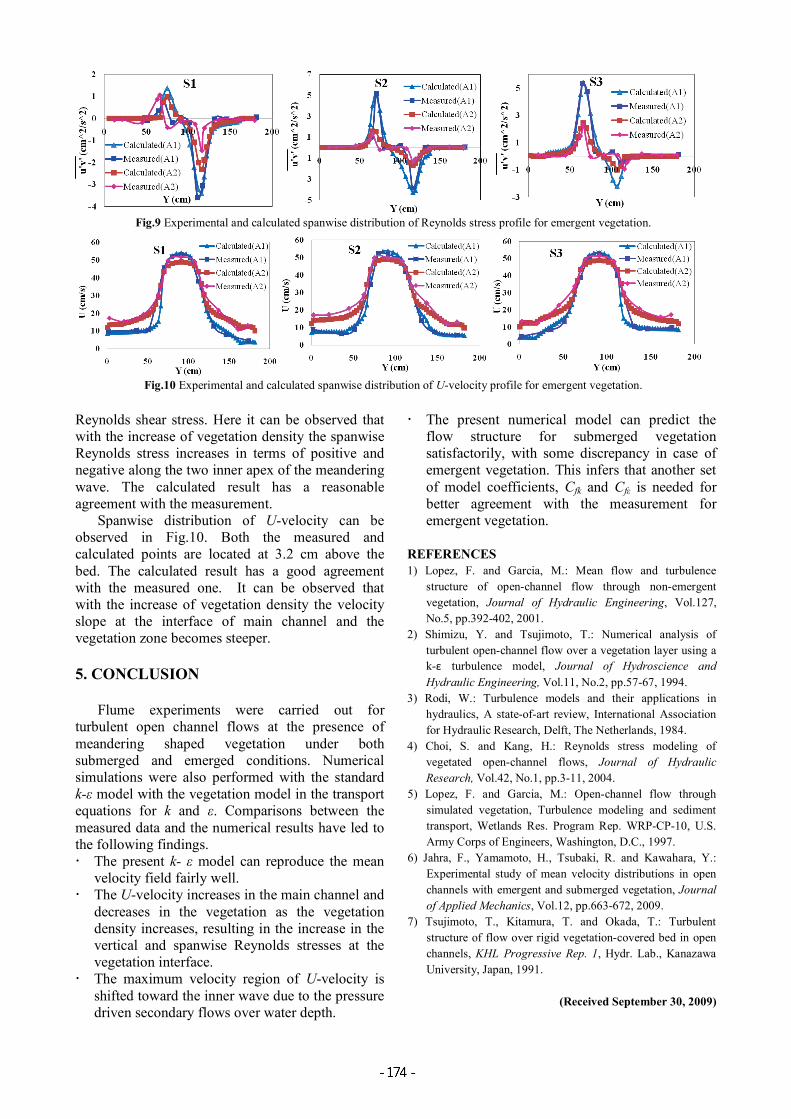
Reynolds shear stress. Here it can be observed that with the increase of vegetation density the spanwise Reynolds stress increases in terms of positive and negative along the two inner apex of the meandering wave. The calculated result has a reasonable agreement with the measurement. Spanwise distribution of U-velocity can be observed in Fig.10. Both the measured and calculated points are located at 3.2 cm above the bed. The calculated result has a good agreement with the measured one. It can be observed that with the increase of vegetation density the velocity slope at the interface of main channel and the vegetation zone becomes steeper. 5. CONCLUSION
Flume experiments were carried out for turbulent open channel flows at the presence of meandering shaped vegetation under both submerged and emerged conditions. Numerical simulations were also performed with the standard k-ε model with the vegetation model in the transport equations for k and ε. Comparisons between the measured data and the numerical results have led to the following findings. The present k- ε model can reproduce the mean
velocity field fairly well. The U-velocity increases in the main channel and
decreases in the vegetation as the vegetation density increases, resulting in the increase in the vertical and spanwise Reynolds stresses at the vegetation interface.
The maximum velocity region of U-velocity is shifted toward the inner wave due to the pressure driven secondary flows over water depth.
The present numerical model can predict the flow structure for submerged vegetation satisfactorily, with some discrepancy in case of emergent vegetation. This infers that another set of model coefficients, Cfk and Cfε is needed for better agreement with the measurement for emergent vegetation.
REFERENCES 1) Lopez, F. and Garcia, M.: Mean flow and turbulence
structure of open-channel flow through non-emergent vegetation, Journal of Hydraulic Engineering, Vol.127, No.5, pp.392-402, 2001.
2) Shimizu, Y. and Tsujimoto, T.: Numerical analysis of turbulent open-channel flow over a vegetation layer using a k-ε turbulence model, Journal of Hydroscience and Hydraulic Engineering, Vol.11, No.2, pp.57-67, 1994.
3) Rodi, W.: Turbulence models and their applications in hydraulics, A state-of-art review, International Association for Hydraulic Research, Delft, The Netherlands, 1984.
4) Choi, S. and Kang, H.: Reynolds stress modeling of vegetated open-channel flows, Journal of Hydraulic Research, Vol.42, No.1, pp.3-11, 2004.
5) Lopez, F. and Garcia, M.: Open-channel flow through simulated vegetation, Turbulence modeling and sediment transport, Wetlands Res. Program Rep. WRP-CP-10, U.S. Army Corps of Engineers, Washington, D.C., 1997.
6) Jahra, F., Yamamoto, H., Tsubaki, R. and Kawahara, Y.: Experimental study of mean velocity distributions in open channels with emergent and submerged vegetation, Journal of Applied Mechanics, Vol.12, pp.663-672, 2009.
7) Tsujimoto, T., Kitamura, T. and Okada, T.: Turbulent structure of flow over rigid vegetation-covered bed in open channels, KHL Progressive Rep. 1, Hydr. Lab., Kanazawa University, Japan, 1991.
(Received September 30, 2009)
Fig.9 Experimental and calculated spanwise distribution of Reynolds stress profile for emergent vegetation.
Fig.10 Experimental and calculated spanwise distribution of U-velocity profile for emergent vegetation.