Embed Size (px)
Citation preview
1
Experimental results of the gamma-ray imagingcapability with a Si/CdTe semiconductor
Compton cameraShin’ichiro Takeda, Hiroyuki Aono, Sho Okuyama, Shin-nosuke Ishikawa, Hirokazu Odaka, Shin Watanabe,
Motohide Kokubun, Tadayuki Takahashi, Kazuhiro Nakazawa, Hiro Tajima, Naoki Kawachi
Abstract—A semiconductor Compton camera that combinessilicon (Si) and Cadmium Telluride (CdTe) detectors was de-veloped, and its imaging capability was examined with variouskinds of gamma-ray targets such as a point source, arrangedpoint sources and an extended source. The camera consists ofone double-sided Si strip detector and four layers of CdTe paddetectors, and was designed to minimize the distance between ascatterer and the target. This is because the spatial resolutionwith Compton imaging improves as the target approaches thescatterer. This new camera realizes a minimum distance of25 mm. By placing the target at a distance of 30 mm from thedetector, resolving power better than 3 mm was demonstratedexperimentally for a 364 keV (131I) gamma-ray. Positional deter-mination with accuracy of 1 mm was also demonstrated. As adeconvolution method, we selected the iteration algorithm (calledList-Mode Expectation-Maximizing Maximum Likelihood), andapplied it to several kinds of experimental data. The Comptonback projection images of the arranged point sources and anextended object were successfully deconvolved.
Index Terms—Gamma-ray imaging, Silicon strip detector,CdTe detector, Compton Camera
I. INTRODUCTION
COMPTON imaging is an attractive technology used ingamma-ray detection for various applications. In high
energy astrophysics, high-sensitivity gamma-ray observation isrequired for studying nucleosynthesis and particle acceleration,the phenomena of which are widely observed throughout thevast universe. The technology is also applicable to nuclearmedical imaging and/or non-destructive inspection [1] [2],since it can directly locate the position of gamma-ray signalswith a wide field of view, as well as a wide energy band.
We have developed a Compton camera – the Si/CdTeCompton camera [3]–[6] – based on the combination ofSilicon (Si) and Cadmium Telluride (CdTe) semiconductordetectors. It consists of many layers of thin Si and CdTe
S. Takeda, H. Aono, S. Ishikawa, H. Odaka, S. Watanabe, M. Kokubun,and T. Takahashi are members of the Institute of Space and AstronauticalScience, Japan Aerospace Exploration Agency, Kanagawa 229-8510, Japan,and also the department of physics, University of Tokyo, Tokyo 113-0033,Japan (e-mail: [email protected])
S. Okuyama and K. Nakazawa are members of department of physics,University of Tokyo.
H. Tajima is with the Stanford Linear Accelerator Center in Menlo Park,CA 94025 USA.
N. Kawachi is from the Quantum Beam Science Directorate, Japan AtomicEnergy Agency, 1233 Watanuki, Takasaki, Gunma 370-1292, Japan.
This work was supported in part by Gumma University’s Faculty ofMedicine and the Japan Atomic Energy Agency under grant JSPS COE(biomedical research using accelerator technology).
Fig. 1. Photograph of the Compton Camera
position-sensitive detectors. The design leads to a high-angularresolution thanks to the high-energy and position resolutionof these semiconductor detectors, including dedicated low-noise analog ASICs. Si is a suitable scatterer material, givenits smaller Doppler broadening effect than that of any othersemiconductor devices [7]. This effect is caused by the non-zero momenta of electrons, and imposes a theoretical limiton angular resolution. CdTe works very nicely as an absorberthanks to its large atomic numbers (48, 52) and high density(5.8 g/cm3).
In our previous work, we developed a prototype Comptoncamera that was primarily designed for future balloon-borneastrophysics experiments [8], and verified its performance.The Compton reconstruction was successfully performed andthe gamma-ray images of point sources were obtained from662 keV down to 59.5 keV. The typical resolution of scatteringangle (the Angular Resolution Measure or ARM) was 3.5 ◦
Full-Width-at-Half-Maximum (FWHM) and 2.5 ◦ (FWHM) at356 keV and 511 keV, respectively.
A Compton camera with an angular resolution of a fewdegrees is an attractive detector applicable not only to astro-physics, but also to nuclear medical imaging. Such applica-tions require spatial resolution at the mm level. In this paper,we report the experimental results of Compton imaging usinga new detector designed for high spatial resolution in short-distance imaging. Fig.1 shows a photo of the detector system.Section II describes our approach to obtaining high spatialresolution. Section III describes the key detectors mountedon the Compton camera and the camera’s design. Section IV
2
1st scatterer
2nd scatterer
absorber
Δθ
1st scatterer
2nd scatterer
absorber
Δθ
ΔX2
d1
d2
(a) (b)
ΔX1 = (d1/d2)(ΔX2)
Fig. 2. Schematic of a Compton camera consisting of two scatterers and oneabsorber. Case (a) has a factor of (d1/d2) better spatial resolution, as derivedfrom the angular resolution multiplied by the distance.
describes the procedure of Compton imaging, and Section Vsummarizes the imaging results.
II. DESIGN APPROACH TO HIGH SPATIAL RESOLUTION
In order to achieve the high spatial resolution of a short-distance target by using Compton imaging, designing the ar-rangement of detectors requires special care. Fig. 2 shows theschematic of a Compton camera consisting of two scatterersand one absorber. A gamma-ray photon emitted from a targetis detected through two major scenarios: (a) scattered in the 1stscatterer or (b) in the 2nd scatterer, and then absorbed in theabsorber detector. The direction of incident photons is obtainedas a cone in the sky (Compton cone) based on informationabout the interaction positions and related energy deposits inboth the scatterer and absorber. By simply assuming that cases(a) and (b) have the same angular resolution, case (a) hasa factor of (d1/d2) better spatial resolution, as derived fromthe angular resolution multiplied by the distance. Generallyspeaking, the spatial resolution in Compton imaging graduallydeteriorates as the distance increases between the target andscatterer.
In our previous Compton camera [8], we used a Si scattererconsisting of four layers of a double-sided silicon strip de-tector (DSSD described in Section III-A) in order to improvedetection efficiency [8] [9]. For astrophysical imaging, onlythe angular resolution and detection efficiency are essentialsince the targets are located virtually indefinitely in the fardistance. Conversely, in a short-distance application, the 2nd to4th layer of the scatterer degrades the spatial resolution, giventhe increasing distance to the target. Therefore, we employedone DSSD layer for the scatterer in the Compton cameradescribed in this paper. It is also important to minimize thedistance between 1st scatterer and a target. When consideringthe few degrees of angular resolution, the interval must belimited within a few tens of mm to obtain mm-scale spatialresolution. In our case, a minimum distance of 25 mm to atarget was achieved.
III. COMPTON CAMERA SETUP
A. Double-sided silicon strip detector (DSSD)As a scattering part of the Compton camera, we developed a
low-noise double-sided silicon strip detector (DSSD) [9]–[12].
VA64TA
VA
64TA
(the re
vers
e)
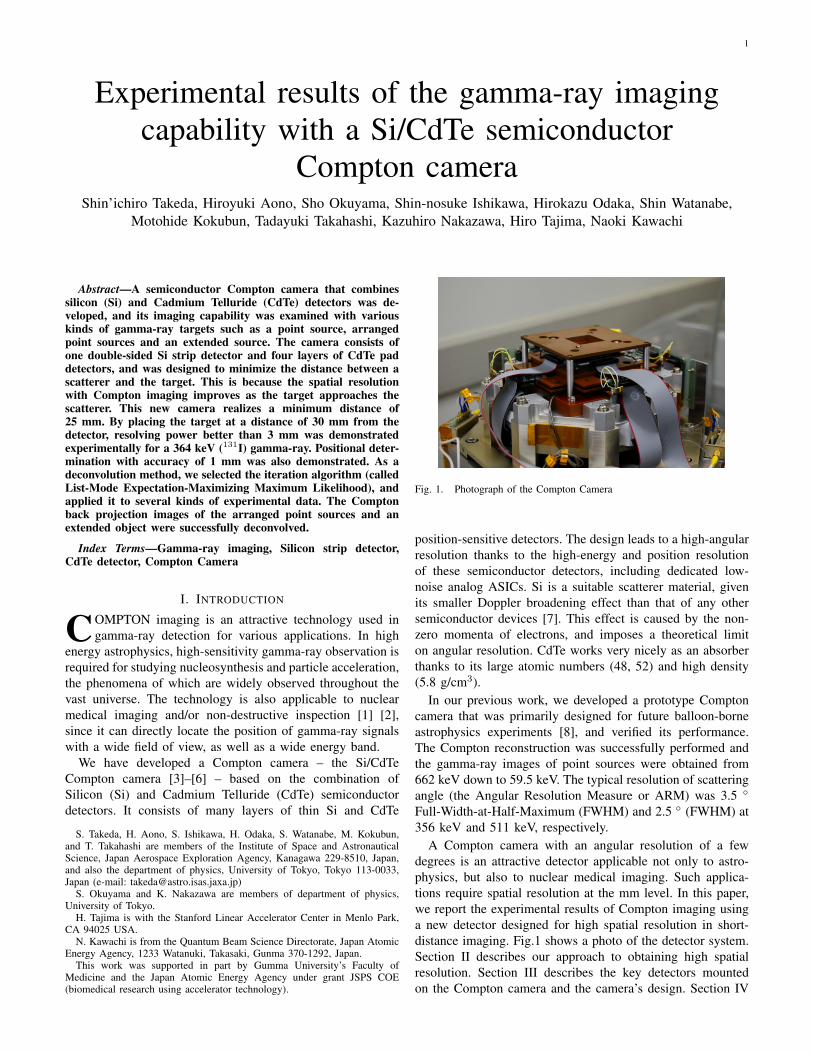
Fig. 3. Photograph of a DSSD board
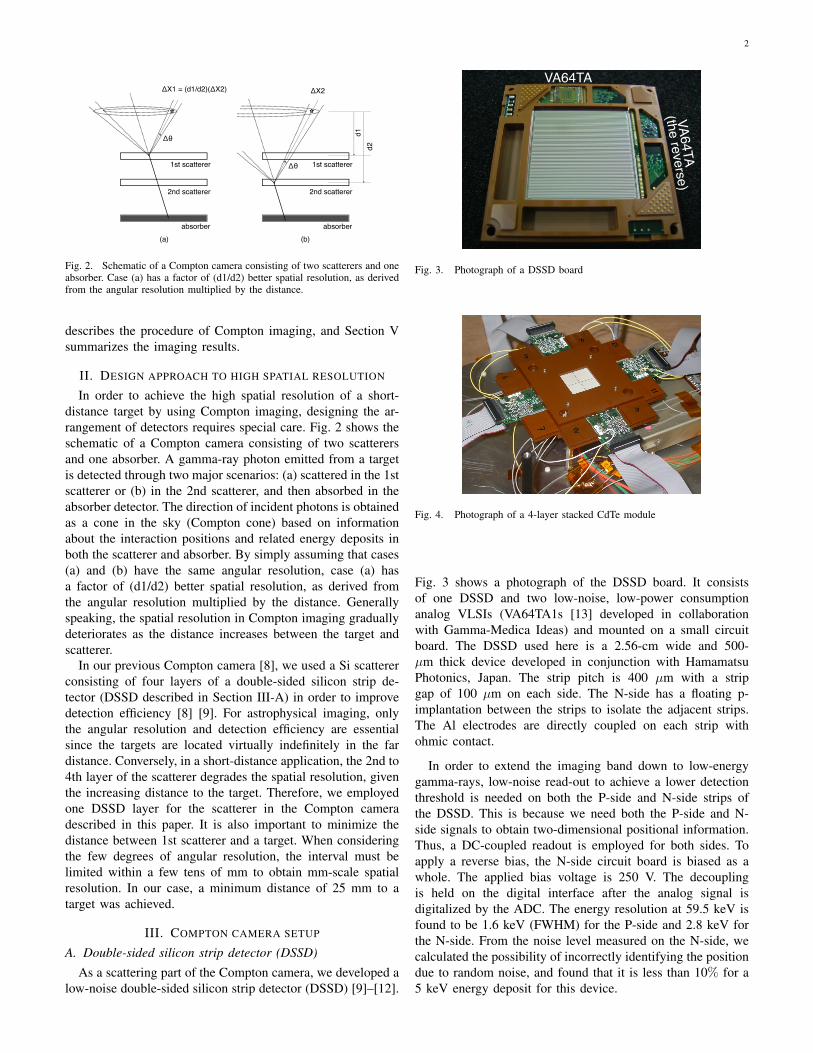
Fig. 4. Photograph of a 4-layer stacked CdTe module
Fig. 3 shows a photograph of the DSSD board. It consistsof one DSSD and two low-noise, low-power consumptionanalog VLSIs (VA64TA1s [13] developed in collaborationwith Gamma-Medica Ideas) and mounted on a small circuitboard. The DSSD used here is a 2.56-cm wide and 500-µm thick device developed in conjunction with HamamatsuPhotonics, Japan. The strip pitch is 400 µm with a stripgap of 100 µm on each side. The N-side has a floating p-implantation between the strips to isolate the adjacent strips.The Al electrodes are directly coupled on each strip withohmic contact.
In order to extend the imaging band down to low-energygamma-rays, low-noise read-out to achieve a lower detectionthreshold is needed on both the P-side and N-side strips ofthe DSSD. This is because we need both the P-side and N-side signals to obtain two-dimensional positional information.Thus, a DC-coupled readout is employed for both sides. Toapply a reverse bias, the N-side circuit board is biased as awhole. The applied bias voltage is 250 V. The decouplingis held on the digital interface after the analog signal isdigitalized by the ADC. The energy resolution at 59.5 keV isfound to be 1.6 keV (FWHM) for the P-side and 2.8 keV forthe N-side. From the noise level measured on the N-side, wecalculated the possibility of incorrectly identifying the positiondue to random noise, and found that it is less than 10% for a5 keV energy deposit for this device.
3
B. 4-layer stacked CdTe module
The absorber consists of a total 16 CdTe pad detectorsbased on the technology of a high-resolution CdTe Schottkydiode [14]–[16]. The production and pixelation of CdTe wereperformed by ACRORAD, Japan. Each detector is 13.2-mmwide and 500-µm thick. In the CdTe detector, a commonelectrode made of Indium (In) is used as the anode, andpixelated electrodes divided into 64 pads made of Platinum(Pt) are used as the cathode. The size of each pad of thecathode electrode is 1.35 mm2, with a gap of 50 µm betweenthe electrodes. A guard-ring electrode surrounds the pads. Dueto a high Schottky barrier and the guard-ring electrode, leakagecurrent as low as 10 pA per pad is obtained under bias voltageof 700 V. Good energy resolution is realized thanks to thehigher efficiency of charge collection.
Fig. 4 shows the 4-layer stacked CdTe module with a stackpitch of 2 mm [16]. One layer consists of four CdTe paddetectors configured in 2×2 geometry and two FECs (FrontEnd Cards) on which four VA64TA1s are mounted. Energyresolution of 2.0 keV (FWHM) is achieved at 81 keV and thatof ∆E/E ∼1% (FWHM) is at 511 keV under temperature of–20◦C, and bias voltage of 600 V. Under these conditions, nosignificant degradation in spectrum performance was observedduring continuous operation of up to two weeks.
C. Setup of the Compton camera
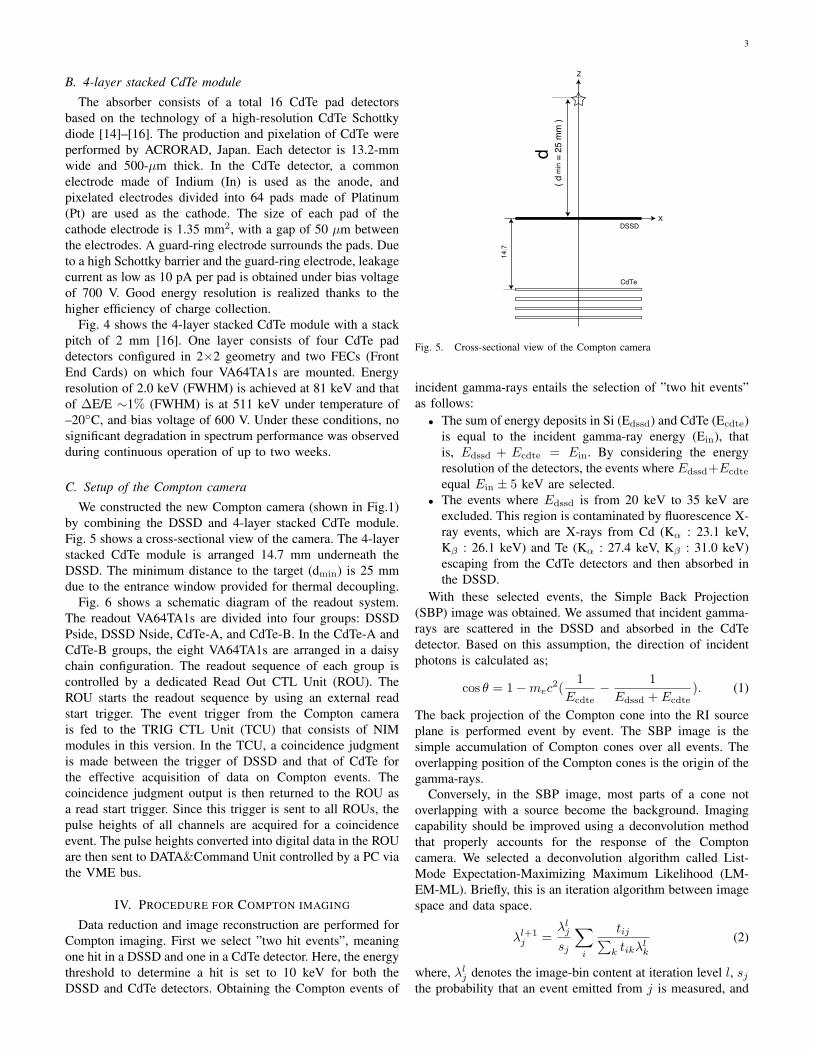
We constructed the new Compton camera (shown in Fig.1)by combining the DSSD and 4-layer stacked CdTe module.Fig. 5 shows a cross-sectional view of the camera. The 4-layerstacked CdTe module is arranged 14.7 mm underneath theDSSD. The minimum distance to the target (dmin) is 25 mmdue to the entrance window provided for thermal decoupling.
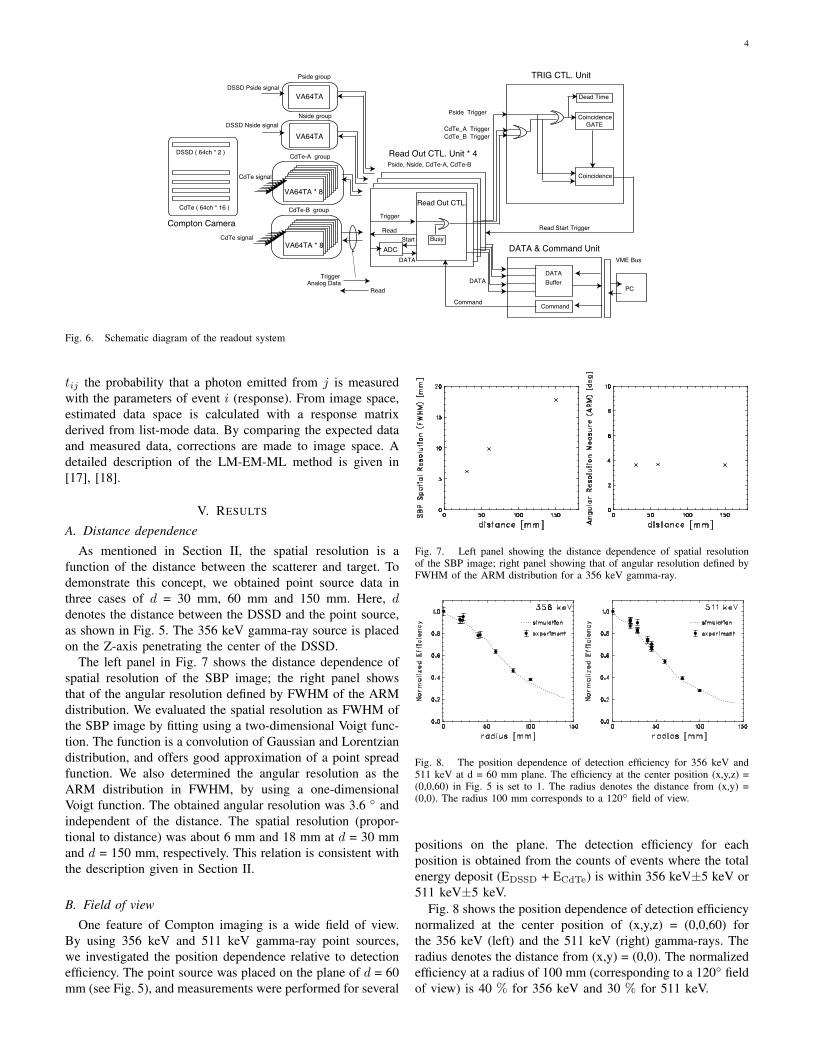
Fig. 6 shows a schematic diagram of the readout system.The readout VA64TA1s are divided into four groups: DSSDPside, DSSD Nside, CdTe-A, and CdTe-B. In the CdTe-A andCdTe-B groups, the eight VA64TA1s are arranged in a daisychain configuration. The readout sequence of each group iscontrolled by a dedicated Read Out CTL Unit (ROU). TheROU starts the readout sequence by using an external readstart trigger. The event trigger from the Compton camerais fed to the TRIG CTL Unit (TCU) that consists of NIMmodules in this version. In the TCU, a coincidence judgmentis made between the trigger of DSSD and that of CdTe forthe effective acquisition of data on Compton events. Thecoincidence judgment output is then returned to the ROU asa read start trigger. Since this trigger is sent to all ROUs, thepulse heights of all channels are acquired for a coincidenceevent. The pulse heights converted into digital data in the ROUare then sent to DATA&Command Unit controlled by a PC viathe VME bus.
IV. PROCEDURE FOR COMPTON IMAGING
Data reduction and image reconstruction are performed forCompton imaging. First we select ”two hit events”, meaningone hit in a DSSD and one in a CdTe detector. Here, the energythreshold to determine a hit is set to 10 keV for both theDSSD and CdTe detectors. Obtaining the Compton events of
14.7
X
Z
DSSD
CdTe
( d min = 25 mm )
d
Fig. 5. Cross-sectional view of the Compton camera
incident gamma-rays entails the selection of ”two hit events”as follows:
• The sum of energy deposits in Si (Edssd) and CdTe (Ecdte)is equal to the incident gamma-ray energy (Ein), thatis, Edssd + Ecdte = Ein. By considering the energyresolution of the detectors, the events where Edssd+Ecdte
equal Ein ± 5 keV are selected.• The events where Edssd is from 20 keV to 35 keV are
excluded. This region is contaminated by fluorescence X-ray events, which are X-rays from Cd (Kα : 23.1 keV,Kβ : 26.1 keV) and Te (Kα : 27.4 keV, Kβ : 31.0 keV)escaping from the CdTe detectors and then absorbed inthe DSSD.
With these selected events, the Simple Back Projection(SBP) image was obtained. We assumed that incident gamma-rays are scattered in the DSSD and absorbed in the CdTedetector. Based on this assumption, the direction of incidentphotons is calculated as;
cos θ = 1 − mec2(
1Ecdte
− 1Edssd + Ecdte
). (1)
The back projection of the Compton cone into the RI sourceplane is performed event by event. The SBP image is thesimple accumulation of Compton cones over all events. Theoverlapping position of the Compton cones is the origin of thegamma-rays.
Conversely, in the SBP image, most parts of a cone notoverlapping with a source become the background. Imagingcapability should be improved using a deconvolution methodthat properly accounts for the response of the Comptoncamera. We selected a deconvolution algorithm called List-Mode Expectation-Maximizing Maximum Likelihood (LM-EM-ML). Briefly, this is an iteration algorithm between imagespace and data space.
λl+1j =
λlj
sj
∑i
tij∑k tikλl
k
(2)
where, λlj denotes the image-bin content at iteration level l, sj
the probability that an event emitted from j is measured, and
4
DSSD ( 64ch * 2 )
CdTe ( 64ch * 16 )
VA64TA * 8
VA64TA * 8
VA64TA
Read O ut CTL. Unit * 4
TRIG CTL. Unit
DATA & Com m and Unit
DSSD Pside signal
CdTe signal
CdTe signal
Read O ut CTL.
Trigger
Read
Busy
Analog Data
ADC
Start
DSSD Nside signal
VA64TA
DATA
Pside group
Nside group
CdTe-A group
CdTe-B group
CdTe_A Trigger
CdTe_B Trigger
Pside, Nside, CdTe-A, CdTe-B
Pside Trigger
Dead Tim e
Coincidence
G ATE
Coincidence
Read Start Trigger
VM E Bus
PC
DATA
Buffer
Com m and Com m and
DATA
Trigger
ReadCom pton Cam era
Fig. 6. Schematic diagram of the readout system
tij the probability that a photon emitted from j is measuredwith the parameters of event i (response). From image space,estimated data space is calculated with a response matrixderived from list-mode data. By comparing the expected dataand measured data, corrections are made to image space. Adetailed description of the LM-EM-ML method is given in[17], [18].
V. RESULTS
A. Distance dependence
As mentioned in Section II, the spatial resolution is afunction of the distance between the scatterer and target. Todemonstrate this concept, we obtained point source data inthree cases of d = 30 mm, 60 mm and 150 mm. Here, ddenotes the distance between the DSSD and the point source,as shown in Fig. 5. The 356 keV gamma-ray source is placedon the Z-axis penetrating the center of the DSSD.
The left panel in Fig. 7 shows the distance dependence ofspatial resolution of the SBP image; the right panel showsthat of the angular resolution defined by FWHM of the ARMdistribution. We evaluated the spatial resolution as FWHM ofthe SBP image by fitting using a two-dimensional Voigt func-tion. The function is a convolution of Gaussian and Lorentziandistribution, and offers good approximation of a point spreadfunction. We also determined the angular resolution as theARM distribution in FWHM, by using a one-dimensionalVoigt function. The obtained angular resolution was 3.6 ◦ andindependent of the distance. The spatial resolution (propor-tional to distance) was about 6 mm and 18 mm at d = 30 mmand d = 150 mm, respectively. This relation is consistent withthe description given in Section II.
B. Field of view
One feature of Compton imaging is a wide field of view.By using 356 keV and 511 keV gamma-ray point sources,we investigated the position dependence relative to detectionefficiency. The point source was placed on the plane of d = 60mm (see Fig. 5), and measurements were performed for several
Fig. 7. Left panel showing the distance dependence of spatial resolutionof the SBP image; right panel showing that of angular resolution defined byFWHM of the ARM distribution for a 356 keV gamma-ray.
Fig. 8. The position dependence of detection efficiency for 356 keV and511 keV at d = 60 mm plane. The efficiency at the center position (x,y,z) =(0,0,60) in Fig. 5 is set to 1. The radius denotes the distance from (x,y) =(0,0). The radius 100 mm corresponds to a 120◦ field of view.
positions on the plane. The detection efficiency for eachposition is obtained from the counts of events where the totalenergy deposit (EDSSD + ECdTe) is within 356 keV±5 keV or511 keV±5 keV.
Fig. 8 shows the position dependence of detection efficiencynormalized at the center position of (x,y,z) = (0,0,60) forthe 356 keV (left) and the 511 keV (right) gamma-rays. Theradius denotes the distance from (x,y) = (0,0). The normalizedefficiency at a radius of 100 mm (corresponding to a 120◦ fieldof view) is 40 % for 356 keV and 30 % for 511 keV.
5
For a detailed evaluation of detection efficiency, we devel-oped a simulator [19] based on the Geant4 toolkit. In thesimulation, we included the G4LECS [20] extension in order toestimate the effect of Doppler broadening. The mass model isconstructed not only with the detector material, but also withvarious passive support structures. The energy and positionresolutions of the detectors are parameterized based on theexperimental results. Fig. 8 shows the normalized efficiencycalculated by the simulator, together with the experimentaldata. The simulation reproduced the experimental results verywell. The absolute efficiency derived from the simulator ison the order of 10−2 % at the center position for 356 keVgamma-rays.
C. Imaging of grid sources
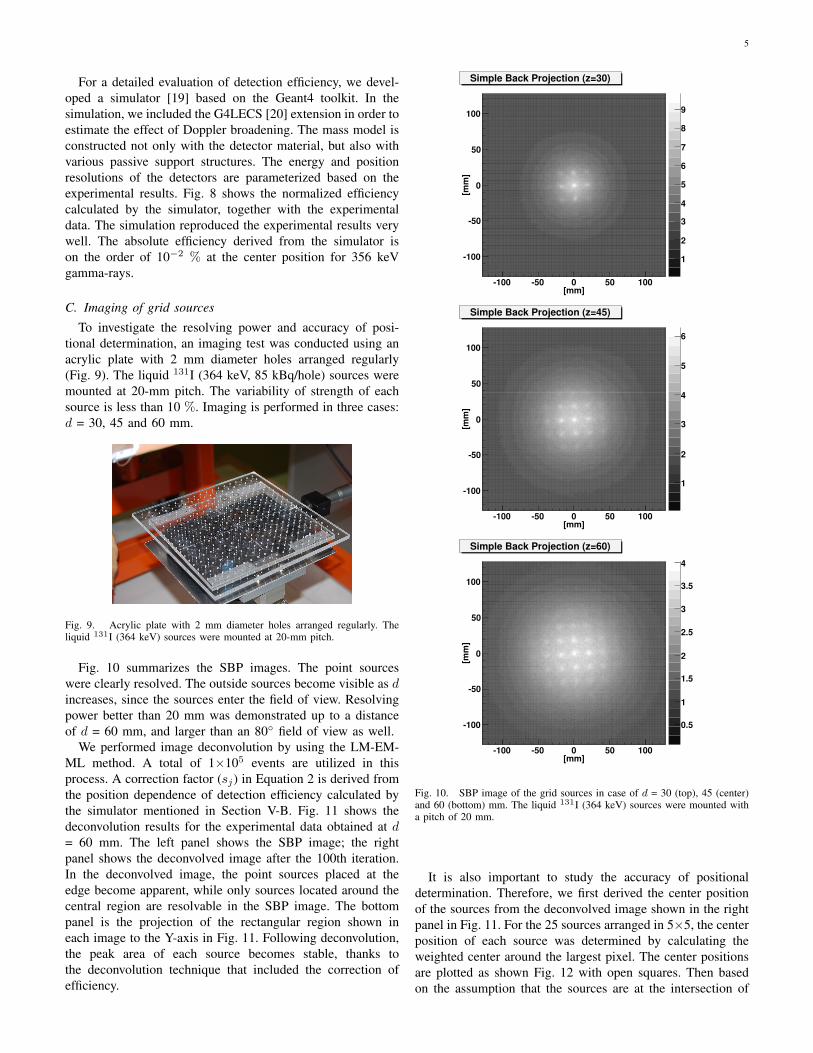
To investigate the resolving power and accuracy of posi-tional determination, an imaging test was conducted using anacrylic plate with 2 mm diameter holes arranged regularly(Fig. 9). The liquid 131I (364 keV, 85 kBq/hole) sources weremounted at 20-mm pitch. The variability of strength of eachsource is less than 10 %. Imaging is performed in three cases:d = 30, 45 and 60 mm.
Fig. 9. Acrylic plate with 2 mm diameter holes arranged regularly. Theliquid 131I (364 keV) sources were mounted at 20-mm pitch.
Fig. 10 summarizes the SBP images. The point sourceswere clearly resolved. The outside sources become visible as dincreases, since the sources enter the field of view. Resolvingpower better than 20 mm was demonstrated up to a distanceof d = 60 mm, and larger than an 80◦ field of view as well.
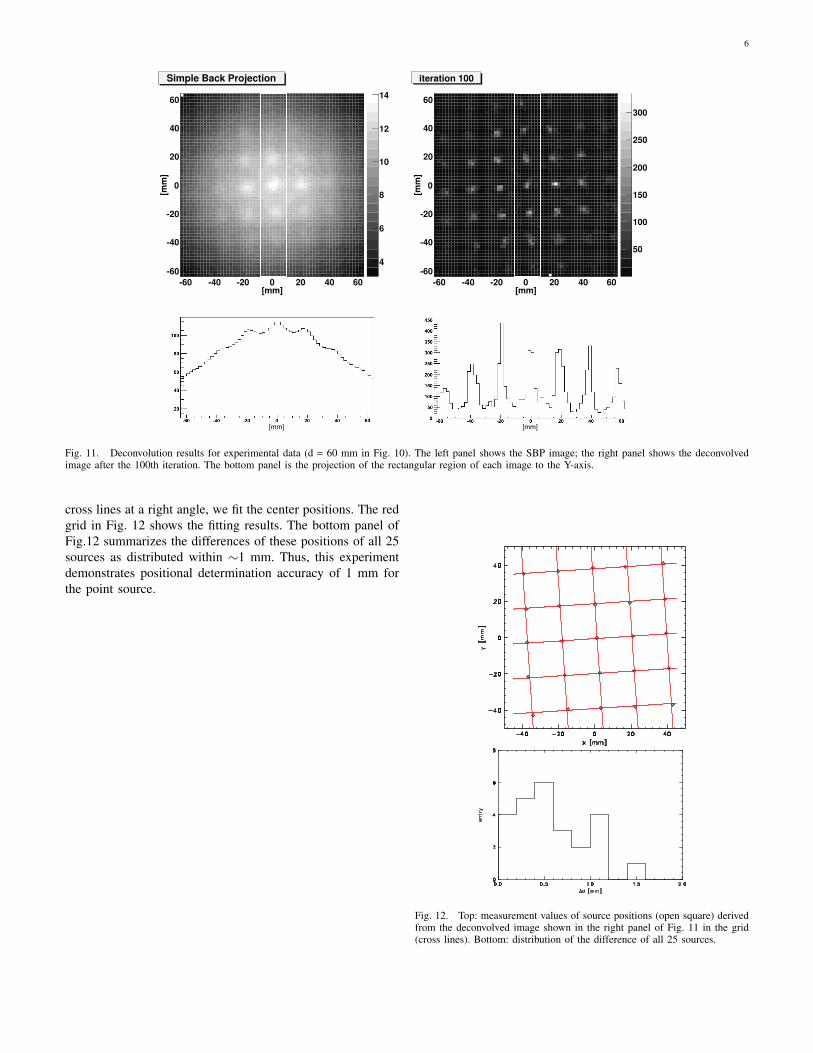
We performed image deconvolution by using the LM-EM-ML method. A total of 1×10⁵ events are utilized in thisprocess. A correction factor (sj) in Equation 2 is derived fromthe position dependence of detection efficiency calculated bythe simulator mentioned in Section V-B. Fig. 11 shows thedeconvolution results for the experimental data obtained at d= 60 mm. The left panel shows the SBP image; the rightpanel shows the deconvolved image after the 100th iteration.In the deconvolved image, the point sources placed at theedge become apparent, while only sources located around thecentral region are resolvable in the SBP image. The bottompanel is the projection of the rectangular region shown ineach image to the Y-axis in Fig. 11. Following deconvolution,the peak area of each source becomes stable, thanks tothe deconvolution technique that included the correction ofefficiency.
[mm]-100 -50 0 50 100
[mm
]
-100
-50
0
50
100
1
2
3
4
5
6
7
8
9
Simple Back Projection (z=30)
[mm]-100 -50 0 50 100
[mm
]
-100
-50
0
50
100
1
2
3
4
5
6
Simple Back Projection (z=45)
[mm]-100 -50 0 50 100
[mm
]
-100
-50
0
50
100
0.5
1
1.5
2
2.5
3
3.5
4
Simple Back Projection (z=60)
Fig. 10. SBP image of the grid sources in case of d = 30 (top), 45 (center)and 60 (bottom) mm. The liquid 131I (364 keV) sources were mounted witha pitch of 20 mm.
It is also important to study the accuracy of positionaldetermination. Therefore, we first derived the center positionof the sources from the deconvolved image shown in the rightpanel in Fig. 11. For the 25 sources arranged in 5×5, the centerposition of each source was determined by calculating theweighted center around the largest pixel. The center positionsare plotted as shown Fig. 12 with open squares. Then basedon the assumption that the sources are at the intersection of
6
[mm]-60 -40 -20 0 20 40 60
[mm
]
-60
-40
-20
0
20
40
60
4
6
8
10
12
14
Simple Back Projection
[mm]-60 -40 -20 0 20 40 60
[mm
]
-60
-40
-20
0
20
40
60
50
100
150
200
250
300
iteration 100
[mm] [mm]
Fig. 11. Deconvolution results for experimental data (d = 60 mm in Fig. 10). The left panel shows the SBP image; the right panel shows the deconvolvedimage after the 100th iteration. The bottom panel is the projection of the rectangular region of each image to the Y-axis.
cross lines at a right angle, we fit the center positions. The redgrid in Fig. 12 shows the fitting results. The bottom panel ofFig.12 summarizes the differences of these positions of all 25sources as distributed within ∼1 mm. Thus, this experimentdemonstrates positional determination accuracy of 1 mm forthe point source.
Fig. 12. Top: measurement values of source positions (open square) derivedfrom the deconvolved image shown in the right panel of Fig. 11 in the grid(cross lines). Bottom: distribution of the difference of all 25 sources.
7
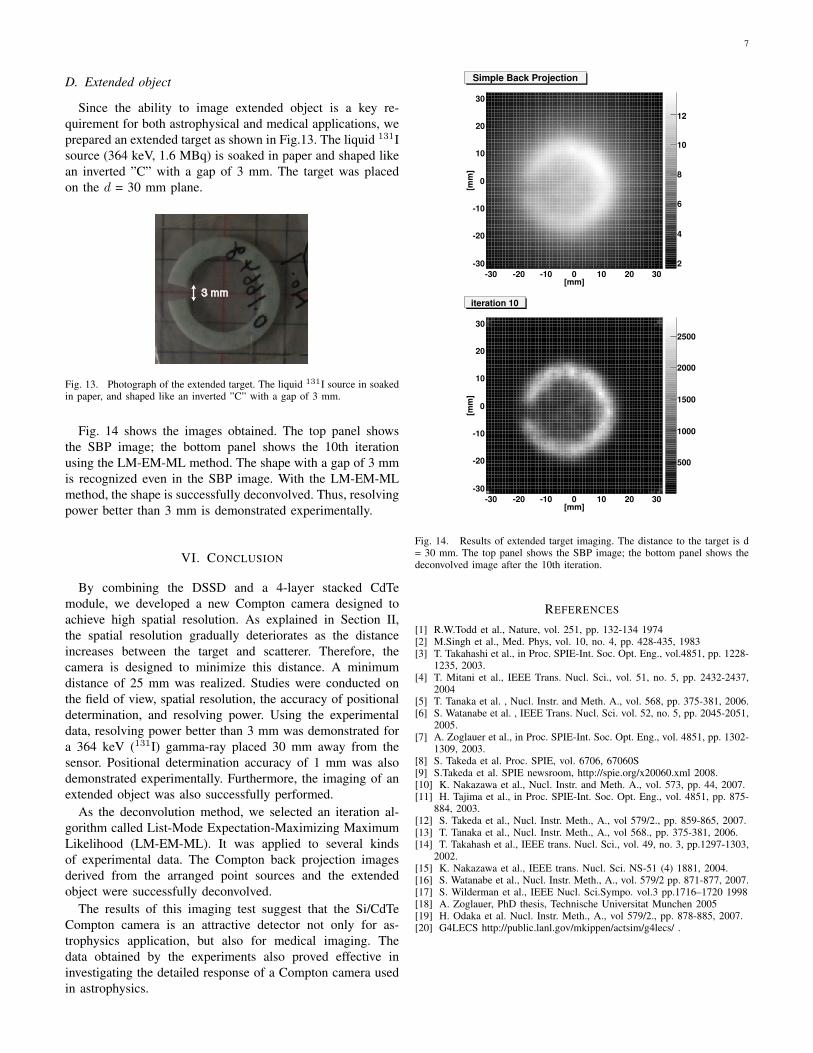
D. Extended object
Since the ability to image extended object is a key re-quirement for both astrophysical and medical applications, weprepared an extended target as shown in Fig.13. The liquid 131Isource (364 keV, 1.6 MBq) is soaked in paper and shaped likean inverted ”C” with a gap of 3 mm. The target was placedon the d = 30 mm plane.
3 mm
Fig. 13. Photograph of the extended target. The liquid 131I source in soakedin paper, and shaped like an inverted ”C” with a gap of 3 mm.
Fig. 14 shows the images obtained. The top panel showsthe SBP image; the bottom panel shows the 10th iterationusing the LM-EM-ML method. The shape with a gap of 3 mmis recognized even in the SBP image. With the LM-EM-MLmethod, the shape is successfully deconvolved. Thus, resolvingpower better than 3 mm is demonstrated experimentally.
VI. CONCLUSION
By combining the DSSD and a 4-layer stacked CdTemodule, we developed a new Compton camera designed toachieve high spatial resolution. As explained in Section II,the spatial resolution gradually deteriorates as the distanceincreases between the target and scatterer. Therefore, thecamera is designed to minimize this distance. A minimumdistance of 25 mm was realized. Studies were conducted onthe field of view, spatial resolution, the accuracy of positionaldetermination, and resolving power. Using the experimentaldata, resolving power better than 3 mm was demonstrated fora 364 keV (131I) gamma-ray placed 30 mm away from thesensor. Positional determination accuracy of 1 mm was alsodemonstrated experimentally. Furthermore, the imaging of anextended object was also successfully performed.
As the deconvolution method, we selected an iteration al-gorithm called List-Mode Expectation-Maximizing MaximumLikelihood (LM-EM-ML). It was applied to several kindsof experimental data. The Compton back projection imagesderived from the arranged point sources and the extendedobject were successfully deconvolved.
The results of this imaging test suggest that the Si/CdTeCompton camera is an attractive detector not only for as-trophysics application, but also for medical imaging. Thedata obtained by the experiments also proved effective ininvestigating the detailed response of a Compton camera usedin astrophysics.
[mm]-30 -20 -10 0 10 20 30
[mm
]
-30
-20
-10
0
10
20
30
2
4
6
8
10
12
Simple Back Projection
[mm]-30 -20 -10 0 10 20 30
[mm
]
-30
-20
-10
0
10
20
30
500
1000
1500
2000
2500
iteration 10
Fig. 14. Results of extended target imaging. The distance to the target is d= 30 mm. The top panel shows the SBP image; the bottom panel shows thedeconvolved image after the 10th iteration.
REFERENCES
[1] R.W.Todd et al., Nature, vol. 251, pp. 132-134 1974[2] M.Singh et al., Med. Phys, vol. 10, no. 4, pp. 428-435, 1983[3] T. Takahashi et al., in Proc. SPIE-Int. Soc. Opt. Eng., vol.4851, pp. 1228-
1235, 2003.[4] T. Mitani et al., IEEE Trans. Nucl. Sci., vol. 51, no. 5, pp. 2432-2437,
2004[5] T. Tanaka et al. , Nucl. Instr. and Meth. A., vol. 568, pp. 375-381, 2006.[6] S. Watanabe et al. , IEEE Trans. Nucl. Sci. vol. 52, no. 5, pp. 2045-2051,
2005.[7] A. Zoglauer et al., in Proc. SPIE-Int. Soc. Opt. Eng., vol. 4851, pp. 1302-
1309, 2003.[8] S. Takeda et al. Proc. SPIE, vol. 6706, 67060S[9] S.Takeda et al. SPIE newsroom, http://spie.org/x20060.xml 2008.[10] K. Nakazawa et al., Nucl. Instr. and Meth. A., vol. 573, pp. 44, 2007.[11] H. Tajima et al., in Proc. SPIE-Int. Soc. Opt. Eng., vol. 4851, pp. 875-
884, 2003.[12] S. Takeda et al., Nucl. Instr. Meth., A., vol 579/2., pp. 859-865, 2007.[13] T. Tanaka et al., Nucl. Instr. Meth., A., vol 568., pp. 375-381, 2006.[14] T. Takahash et al., IEEE trans. Nucl. Sci., vol. 49, no. 3, pp.1297-1303,
2002.[15] K. Nakazawa et al., IEEE trans. Nucl. Sci. NS-51 (4) 1881, 2004.[16] S. Watanabe et al., Nucl. Instr. Meth., A., vol. 579/2 pp. 871-877, 2007.[17] S. Wilderman et al., IEEE Nucl. Sci.Sympo. vol.3 pp.1716–1720 1998[18] A. Zoglauer, PhD thesis, Technische Universitat Munchen 2005[19] H. Odaka et al. Nucl. Instr. Meth., A., vol 579/2., pp. 878-885, 2007.[20] G4LECS http://public.lanl.gov/mkippen/actsim/g4lecs/ .