Embed Size (px)
Citation preview
ラオス国
電力セクタープログラムに関する開発指標
等評価(プログラム評価分析)
報告書
平成 25 年 3 月
(2013 年)
独立行政法人国際協力機構
ラオス事務所

1
略語:Abbreviations and Acronyms
ADB Asian Development Bank
ASEAN Association of Southeast Asian Nations
AusAID Australian Agency for International Development
BOL Bank of the Lao PDR
BOP Balance of Payment
CA Concession Agreement
DAC Development Assistance Committee
DEB (MEM) Department of Energy Business
DEM (MEM) Department of Energy Management
DEPD (MEM) Department of Energy Promotion and Development
DEPP (MEM) Department of Energy Policy and Planning
DOE Department of Energy (Philippines)
DSM Demand Side Management
DSR Debt Service Ratio
EDL Electricité du Laos
EDL-Gen EDL-Generation Public Company
EGAT Electricity Generating Authority of Thailand
EIA (1) Environmental Impact Assessment
EIA (2) Energy Information Administration (U.S.)
EPDP Power Development Plan of EDL (EDL-PDP)
EPPO Energy Policy and Planning Office (Ministry of Energy, Thailand)
ERAV Electricity Regulatory Authority of Vietnam
ERC Energy Regulatory Commission (The Philippines)
ESCO Energy Service Company
ESIA Environmental and Social Impact Assessment
FDI Foreign Direct Investment
GDP Gross Domestic Product
GMS Greater Mekong Sub-region
GOL The Government of the Lao People's Democratic Republic
HAPUA Head of ASEAN Power Utilities/Authorities
HHI Herfindnal=Hitshman index
IDA International Development Agency
IE Institute of Energy (Vietnam)
IMF International Monetary Fund
IPO Initial Public Offering
IPP Independent Power Producer
IPP (d) IPP for domestic supply
2
IPP (e) IPP for export
IREP Institute of Renewable Energy and Promotion
IRR Internal Rate of Return
ISPM Improvement of Power Sector Management
JICA Japan International Cooperation Agency
LDC Least Developed Country
LEPTS Lao Electric Power Technical Standard
LHSE Lao Holding State Enterprise
LRMC Long Run Marginal Cost
MAF Ministry of Agriculture and Forestry
MDGs Millennium Development Goals
MEA Metropolitan Electricity Authority of Thailand
MEM Ministry of Energy and Mines
MEMR Ministry of Energy and Mineral Resources(Indonesia)
MIC Ministry of Industry and Commerce
MOE Ministry of Energy
MOF Ministry of Finance
MOIT Ministry of Industry and Trade(Vietnam)
MONRE Ministry of Natural Resources and Environment
MOU Memorandum of Understanding
MPI Ministry of Planning and Investment
MPWT Ministry of Public Work and Transportation
NERI National Economic Research Institute
NPC National Power Corporation (of the Philippines)
NSEDP National Socio-Economic Development Plan
NPDP National Power Development Plan
NPEP National Poverty Eradication Program
ODA Official Development Assistance
PDA Project Development Agreement
PDP Power Development Plan
PEA Provincial Electricity Authority of Thailand
PPP(1) Public and Private Partnership
PPP(2) Purchasing Power Parity
RE Renewable energy
RESD Renewable Energy Development Strategy
REP Rural Electrification Project (World Bank)
ROA Return on Asset
ROE Return on Equity
3
SAIDI System Average Interruption Duration Index
SAIFI System Average Interruption Frequency Index
SEA Strategic Environmental Assessment
SPC Special Purpose Company
SPP Small Power Producer (Thailand)
TA Technical Assistance
TNB Tenaga National Berhad (of Malaysia)
TOU Time of use
UN the United Nations
WB World Bank
WDI World Development Indicators
WREA Water Resource and Environment Administration
4
ラオス国電力セクタープログラムに関する開発指標等評価
(プログラム評価分析)
目次
地図
略語表
目次
図表リスト
要約
第 1 章 調査の概要
1-1 調査の背景
1-2 調査の目的
1-3 調査団構成
1-4 現地調査日程
1-5 主要面談者
第 2 章 ラオス国電力セクター及び協力プログラム開発指標等の分析
1. ラオス国における電気産業の特徴
1.1 産業構造上の特徴
1.1.1 輸出入構造
1.1.2 セクター組織構造
1.1.3 主要データの国際比較
1.1.4 EDL の財務分析
1.1.4.1 EDL の業績推移
1.1.4.2 EDL とアジア電力会社の比較
1.2 ラオス国電力産業における主な問題点
1.3 ラオス国の Cross-SWOT 分析
1.4 ラオス国電力セクターのパフォーマンス全体評価
2. ラオス国電力開発指標に関するこれまでの JICA の取り組み
3. ラオス国電力セクターのプログラム評価
3.1 妥当性の検証
3.2 有効性の検証
5
3.3 成果指標項目の再検討
4. 電力開発指標の提案
4.1 電力開発指標に関する先行研究
4.2 開発指標の提案
4.2.1 開発指標に対するアプローチ
4.2.2 本業務での Indicator の採用
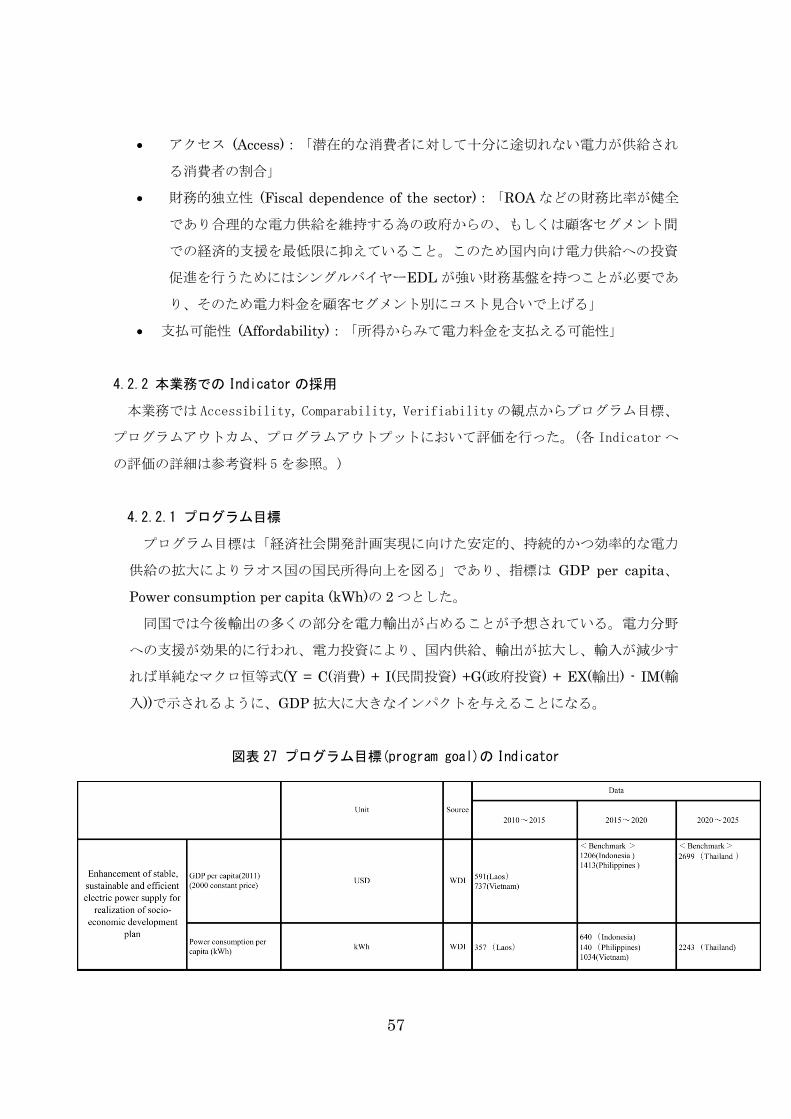
4.2.2.1 プログラム目標
4.2.2.2 プログラムアウトカム(社会経済活動への貢献)
4.2.2.3 プログラム成果
4.2.3 電力指標間のインパクト
4.3 結論:電力開発指標
5. 世界銀行、ADB の活動の概要
6. 電力開発指標構築を通したラオス国電力政策への提案
6.1 国家電力開発指標を制度化(Institutionalize)するための準備
6.1.1 国家電力開発指標設定の準備
6.1.2 国家電力開発指標の設定手順
6.2 電力産業の目指すべき組織体制
7. 電力整備プログラムにおける JICA の果たす役割
<参考資料>
1. プロジェクト別電力輸出入
2. アジア各国での電源 HHI の計測
3. 世界銀行の支援プロジェクト
4. ADB の支援プロジェクト
5. 開発指標の評価
6. アジア 6 カ国のデータ比較
参考文献
参照データ
収集資料リスト
6
図表リスト
図表1. ラオス国における輸出構造の推移
図表2. 2012年における総発電量における IPP比率
図表3. 2012年の月別輸入比率
図表4. ラオス国をめぐる電力輸出入の状況(2011)
図表5. ラオス国政府、EDL、IPP等の金銭面のフロー
図表6. ナムトゥン 2 プロジェクトの組成
図表7. アジア各国の産業用および住民用の電力料金比率
図表8. Elasticity of Electricity Consumption to GDP
図表9. Transmission & Distribution loss (%)
図表10. Household Access (%) vs. GDP per capita (PPP)
図表11. T&D loss vs. GDP per capita PPP
図表12. T&D loss (%) vs. Population density (people/km2)
図表13. Average residential tariff vs. GDP per capita PPP
図表14. EDL の売上、利益率推移
図表15. EDL の ROA及び ROE推移
図表16. EDL と EDL-Genの売上、利益率比較(2011)
図表17. EDL、EDL-Genの 1人あたり売上と利益(2011)
図表18-1 アジア電力会社との売上、利益比較
図表18-2 アジア電力会社との 1人あたり売上額、利益比較
図表19. アジア電力会社との ROA、ROE比較
図表20. ラオス国の Cross-SWOT分析
図表21. ラオス電力セクターのパフォーマンス評価
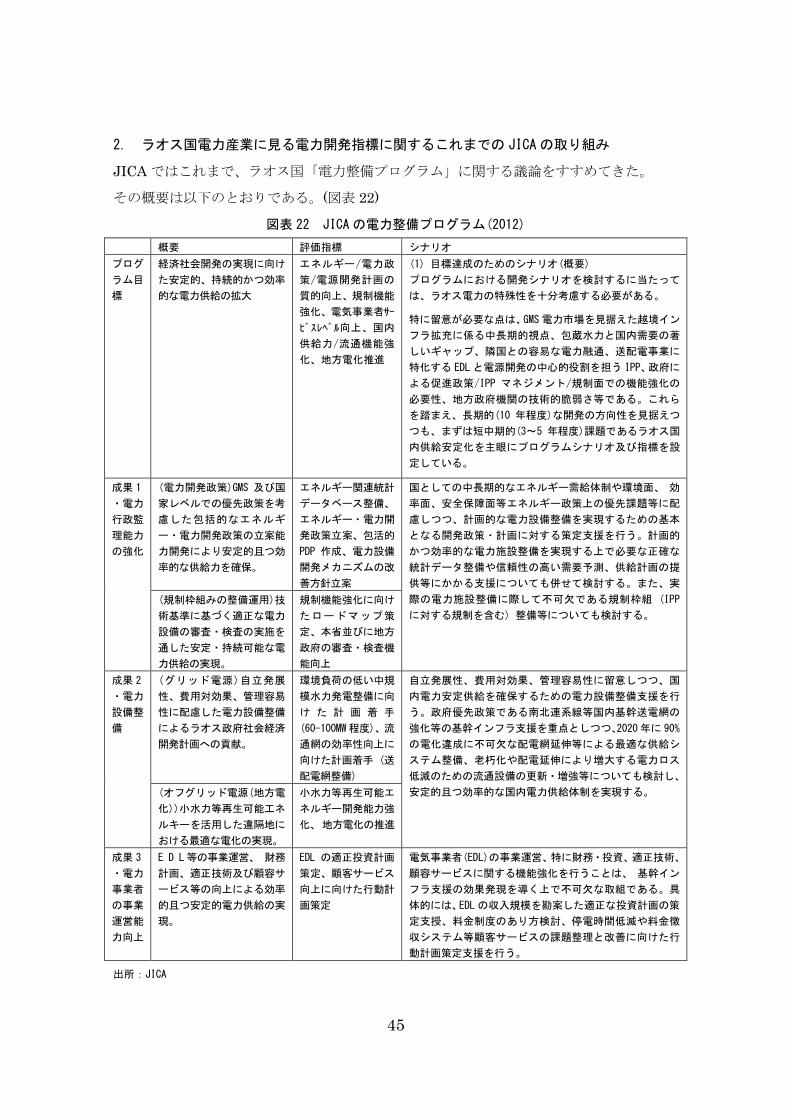
図表22. JICAの電力整備プログラム(2012)
図表23. ラオス「電力整備プログラム」:概念図(案)
図表24. プログラム各項目内の検証
図表25. 本プログラムの妥当性、有効性の検証
図表26. 電力開発インディケーター選択のプロセス
図表27. プログラム目標(program goal)の Indicator
図表28. プログラムアウトカムの Indicator
図表29. プログラム成果(output)の Indicator
図表30. 電力セクター全体のパフォーマンスをみる Indicator
図表31. 電力開発指標間のインパクトフロー
7
図表32. 世界銀行、ADB等によるラオス国への支援活動(1996~2008)
図表33. 世界銀行、ADB等によるラオス国への支援活動(2007~現在)
図表34. 世界銀行、ADB等によるラオス国への支援活動(2012~現在計画中)
図表35. 電力市場タイプ別部局各種役割比較
図表36. 2013年現在のラオス国における部局別役割
図表37. アジア国における電力規制機関の職務
図表38. プログラム目標における JICAの果たす役割
図表39. プログラムアウトカムの中での JICA の果たす役割(1)
図表40. プログラムアウトカムの中での JICA の果たす役割(2)
図表41. プログラム成果の中での JICAの果たす役割
図表42. 主要な問題に対するプログラム対応状況
参考図表 1 プロジェクト別電力輸出(2011)
参考図表 2 東南アジア各国の電力 HHI
8
Executive Summary(要約)
1 ラオス国における電気産業の特徴
ラオス国は豊富な河川水量を持つ河川に恵まれ、電力輸出は鉱産物と並び重要な輸
出製品でありインドシナのバッテリーと呼ばれている。しかしながら総供給力の 8 割
方が輸出を行う IPP によるものである。国内需要を満たす十分な供給が本来はあるも
ののタイ国の EGAT 等、海外のオフテイカーとの PPA 契約により、その多くを輸出
しなければならない。
更に国内の送電線の制約から、乾季において大幅な輸入比率になっている。2012 年
3 月には輸入比率(輸入/国内需要)は 66%にもなった。ベトナム、中国、タイから国営
電力会社 EDL が電力を輸入する状況にある。
EDLから2010年に発電部門をEDL-Genとして分離した。これによってEDLはシング
ルバイヤーとなった。この背景には発電分野に外国からの投資を呼び込む目的があった
とされている。
ラオス国の電力セクターのその他特徴としては、EDL以外に政府(財務省)出資会社とし
てLHSEを設立し、ここを通じてナムトゥン2等のSPC(特別目的会社)のIPPsに投資を行
なっていることがある。
2 ラオス国電力セクターにおける主な問題点
ラオス国電力セクターにおける主な問題点は、1)国内への電力の安定供給、2)国内経済へ
の貢献、3)環境のそれぞれに対し、問題があげられる。
1) 国内への電力の安定供給
1-1) エネルギーセキュリティの問題
エネルギー安全保障では、水力発電に輸出、国家歳入上、過度に依存するリスクが
ある。大幅な供給力があるものの、輸出向けが大半であるため乾季に輸入が増える
という国内供給力上の問題(2012年 3月分の輸入比率は 66%)と、国庫の収入の多く
を水力発電に関連するロイヤリティ、各種 Taxが占めるリスクである。
1-2) 投資促進にかかわるガバナンスの問題
以下 a)〜c)の問題が投資促進上の問題となっている。
a) 電力セクターガバナンスの問題
電力セクターガバナンスでは、電力セクターの統治機能が不十分 (エネルギー/電
9
力分野の政策立案/規制等)であり、電気事業者の事業運営能力不足 (財務健全性/
人材育成等組織運営/維持管理能力)があげられる。
特に Solicited IPP入札(シングルバイヤーが長期電源開発計画を作り、そのうえで
参入 IPPの開発時期、規模、燃料などを指定する入札方式)を行うための準備が出来
ていない。
b) 国内送電線、国際送電線への公平なアクセス
EDLの国内系統が分断され、国内を貫通した送電線網が未整備である。対輸出用の
国際送電線も EDLが独自に整備する財政能力がないため、IPPが独自に整備せざる
を得ない。例えば Nam Ngum2(ナムグム 2)が自前で建設した送電線(Navon変電所-国
境の間)を Nam Ngum3(ナムグム 3)、Nam Ngiep1(ナムニェップ 1)も使えるようにし
た方が、経済性があるが託送料金(Wheeling Charge)の額を巡りまだ調整中である。
この例に見られるように送電線が中立であるわけなく、それを内外の新規参入者が
公平に使えるわけではない。
c) データの未整備
エネルギー政策立案、省エネ政策、水資源管理等の基礎となる各種統計データ、デ
ータベースの収集方法や更新等が未整備である。例えば、各省庁で保有するデータ
(例:電力輸出入量、額)において食い違いがみられる。
1-3) EDLの財務的独立性の問題
EDLの財務上の問題は EDLのオフテイカーリスクとなり、投資促進を阻害している。
利益率が低く、従業員 1人当たりの売上、利益も周辺国と比べて低い。LRMCコストを
下回る料金設定であり、直接の補助金はないが交差補助金(Cross-Subsidy)があるため
料金体系が歪んでいる。
電気料金の設定も EDLの財務的独立性に大きな影響を与えている。以下の 3点が大
きな問題である。
a) ピーク・オフピークの設定がないこと。
輸出入はピーク料金の設定が行われているが、ラオス国内向けにピーク料金の設定は
行われていない。ピーク料金設定が行われていないため流れ込み式発電所が増え、水
の最適利用が行われにくくなる。
東南アジアではタイ、マレーシア、フィリピンで既に導入されているが時間帯別の計
量ができるメーターが必要となる。
b)セグメントごとにコストを反映した電気料金体系になっていないこと
同国は電力セクターへの直接の補助金はないが、Cross-subsidyが存在する。
c) 従量料金のみの設定である。
10
基本料金(Basic charge)と従量料金(Energy charge)を分けた設定もされておらず従量
料金のままである。東南アジアではカンボジアも従量料金のみの設定である。
このようにラオス国の資源配分を最適化するためにも料金制度は大幅な改正が必要と
なる。
1-4) 国際収支の問題
外貨準備高が 2ヶ月しかなく、乾季の大幅な電力輸入が必要なこともこの問題に影響
を与えている。
2) 国家経済への貢献
2-1)貧困削減
国内電力供給力不足・送配電未整備、地方山間部における低い電化率等のため、ビ
エンチャンなど都市部と地方の電気普及率の差が、経済格差に影響を及ぼしている。
2-2)水資源の有効活用
水資源の最適管理がなされていない問題がある。発電、灌漑、洪水対策など水資源
を包括的に最適利用するシステムが省庁間で確立していない。
2-3)工業の発展
急速な需要増に対応する為、タイなど隣国からの輸入電力も用い対応する為、EDL
が逆ザヤになる。
3) 環境への配慮
環境規制の先行きが不透明なままその厳格化によって F/S時の Due diligenceが事業
開始後当てはまらなくなってしまう。結果、水力発電事業の収益性が当初予定より低
下してしまう。
石炭発電を拡大することはエネルギーセキュリティや国内外の乾季時に電力を供給
する意味で貢献度が高いが CO2の排出を増やすという問題がある。
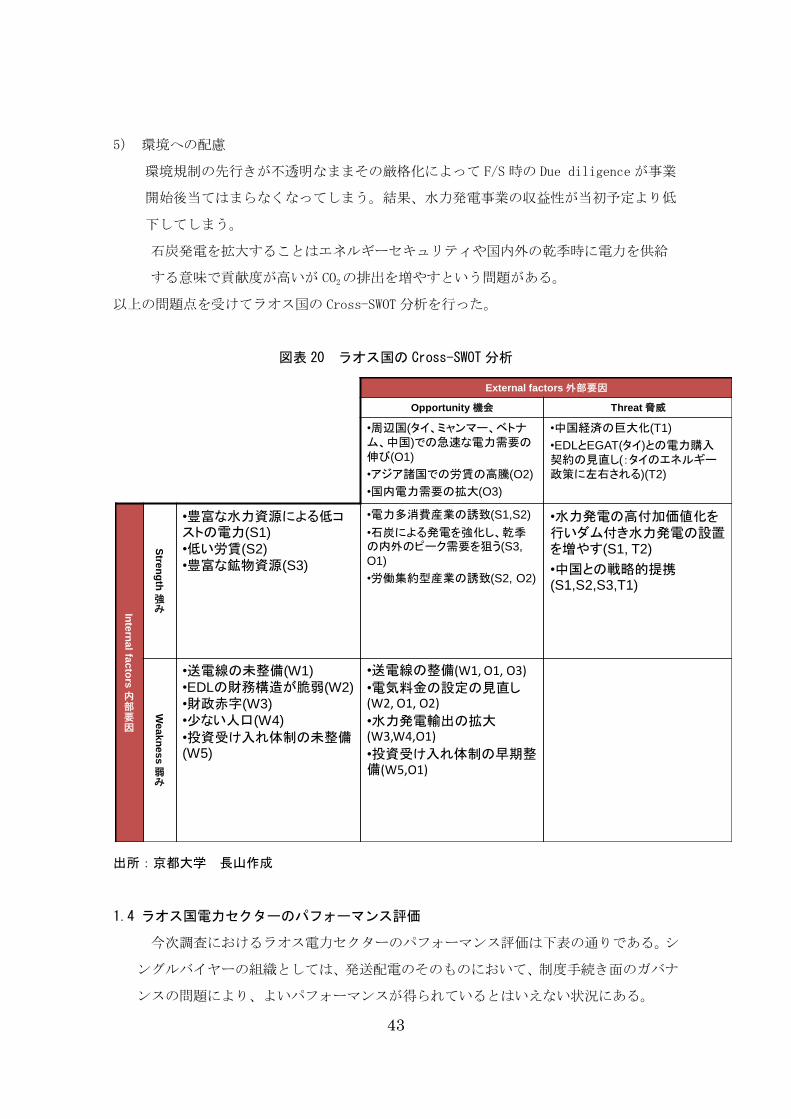
以上の問題点を受けてラオス国の Cross-SWOT 分析を行った。
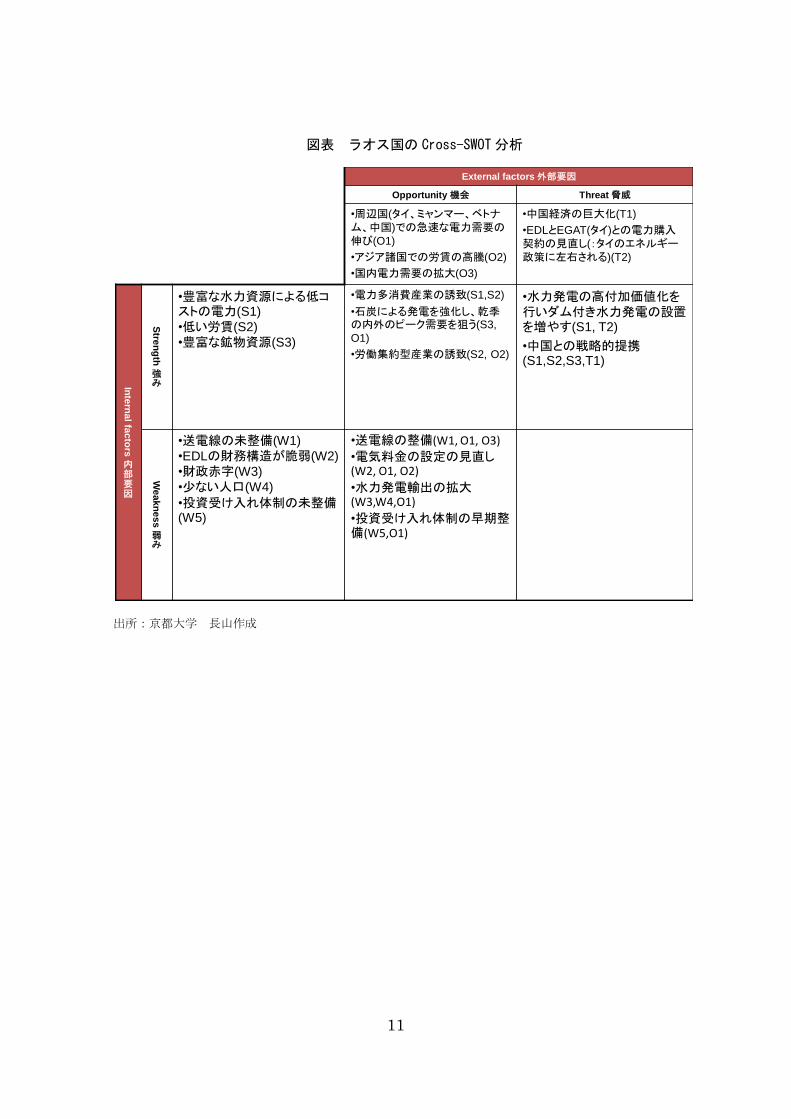
11
図表 ラオス国の Cross-SWOT分析
出所:京都大学 長山作成
External factors 外部要因
Opportunity 機会 Threat 脅威
•周辺国(タイ、ミャンマー、ベトナム、中国)での急速な電力需要の伸び(O1)
•アジア諸国での労賃の高騰(O2)
•国内電力需要の拡大(O3)
•中国経済の巨大化(T1)
•EDLとEGAT(タイ)との電力購入契約の見直し(:タイのエネルギー政策に左右される)(T2)
Inte
rna
l fac
tors
内部要因
Stre
ng
th
強み
•豊富な水力資源による低コストの電力(S1)
•低い労賃(S2)
•豊富な鉱物資源(S3)
•電力多消費産業の誘致(S1,S2)
•石炭による発電を強化し、乾季の内外のピーク需要を狙う(S3,
O1)
•労働集約型産業の誘致(S2, O2)
•水力発電の高付加価値化を行いダム付き水力発電の設置を増やす(S1, T2)
•中国との戦略的提携(S1,S2,S3,T1)
We
ak
ne
ss
弱み
•送電線の未整備(W1)
•EDLの財務構造が脆弱(W2)
•財政赤字(W3)
•少ない人口(W4)
•投資受け入れ体制の未整備(W5)
•送電線の整備(W1, O1, O3)
•電気料金の設定の見直し(W2, O1, O2)
•水力発電輸出の拡大(W3,W4,O1)
•投資受け入れ体制の早期整備(W5,O1)
12
3 提案された電力開発指標の妥当性・有効性の検証
DAC5 項目における妥当性(relevance)は開発援助と、ターゲットグループ・相手
国・ドナーの優先度並びに政策・方針との整合性の度合いである。有効性
(effectiveness)は開発援助の目標の達成度合いを測る尺度である。プログラム目標の
達成のためには、プログラムアウトカムの作成が必要であり、プログラムアウトカ
ムの達成のためには、事業実施面での直接効果を見られるプログラムアウトプット
の達成が必要となる。
3.1 妥当性の検証
本電力整備プログラムは我が国のラオス国への援助の基本方針(大目標):MDGs 達
成及び LDC からの脱却への支援の方針に適合し、重点分野(中目標)の経済・社会イン
フラ整備の中で「安全かつ安定的な電力供給の拡大による国内の電力へのアクセス格
差是正と電力輸出に向けた支援」に資するものである。
わが国の課題別指針<エネルギー供給>との関係では 4 つの重点課題に対応した協
力となっている。
1) 持続的経済発展を確保するための電力の安定供給 (総合エネルギー政策の立案、
電力開発計画の策定、発送配電施設の計画作成・建設及び運用維持管理、電力技術
基準の作成、電力分野技術者の育成)
2) 人間の安全保障の視点からの地方電化の推進
3) 電力セクター改革に伴う制度設計
4) 環境に配慮したエネルギー供給
特に上記 1)に対しては「Data collection Study on Energy Sector in Lao PDR(2012)」
ではラオス国の電力・エネルギー分野における基礎データを整備した。「Project
Improvement of the Government Mechanism for Sustainable Power Development
Planning(2013 年終了見込み):以下セクターガバナンス強化プロジェクト」にて、本
格的な国家長期電力開発計画(NPDP: National Power Development)立案支援の準備
を行っている。
「電力セクター事業管理能力強化プロジェクト: Improvement of Power Sector
Management(IPSM):(2013)」ではラオス電力技術基準(LEPTS: Lao-Electric Power
Technical Standard)を導入するための支援プロジェクトを行っている。
これらを通じて同国の電力分野技術者の養成を図ってきた。
2)及び 4)では「小規模水力開発ポテンシャル調査に対する技術支援(水力計画調査)」
により、地方電化及び環境に配慮したエネルギー供給を推進している。
ラオス国の政策との整合性では本プログラムの目標である「経済社会開発実現に向
13
けた安定的、持続的かつ効率的な電力供給の拡大により国民所得(GDP)の向上を図る」
は、同国の第 7 次社会・経済開発計画 National Socio-Economic Development Plan の
(2010-2015 年)の中における基本政策である
① 送配電線の延長及びオフグリッドにおける地方電化により、電化率を向上させる。
② 増加する電力需要を満たすために、国内供給力を増強させる。
③ EDL の運営を商業原理に基づき適正化する。
等に合致する。しかしながら、プログラムアウトカムとして設定した
i) 電力の安定供給
ii) 国家経済への貢献
iii) 環境配慮
を考慮すると、その上位性から現在のプログラム目標を「経済社会開発実現に向け
た安定的、持続的かつ効率的な電力供給の拡大を通じてラオス国の実質国内総生産
(GDP)の向上を図る」と変更することが望ましい。
この目標設定の変更により、本プログラム目標は第 7 次社会・経済開発計画
(2010-2015 年)の「少なくとも GDP 成長率年率 8%及び 1 人当たり GDP が 1700 ド
ル以上を目指す」「2015 年までに MDG を達成し、2020 年までに LDC を脱する為
の技術導入や環境の整備を進める」という目標に適合するものとなる。
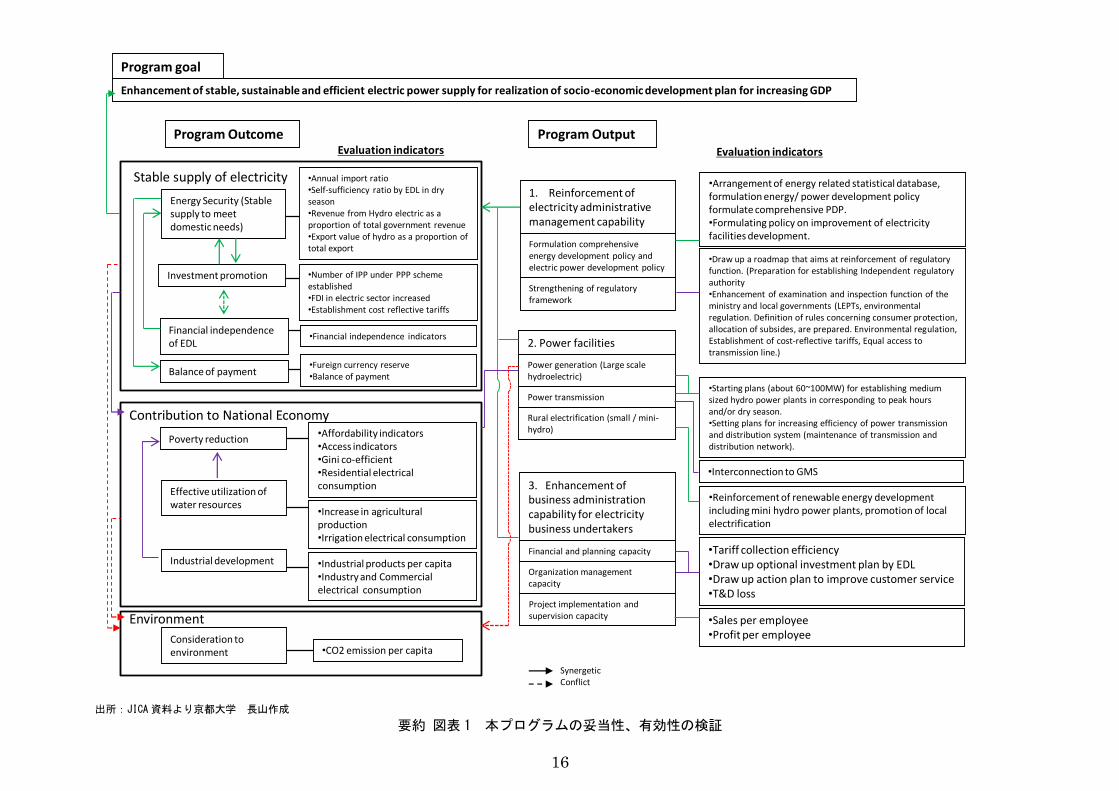
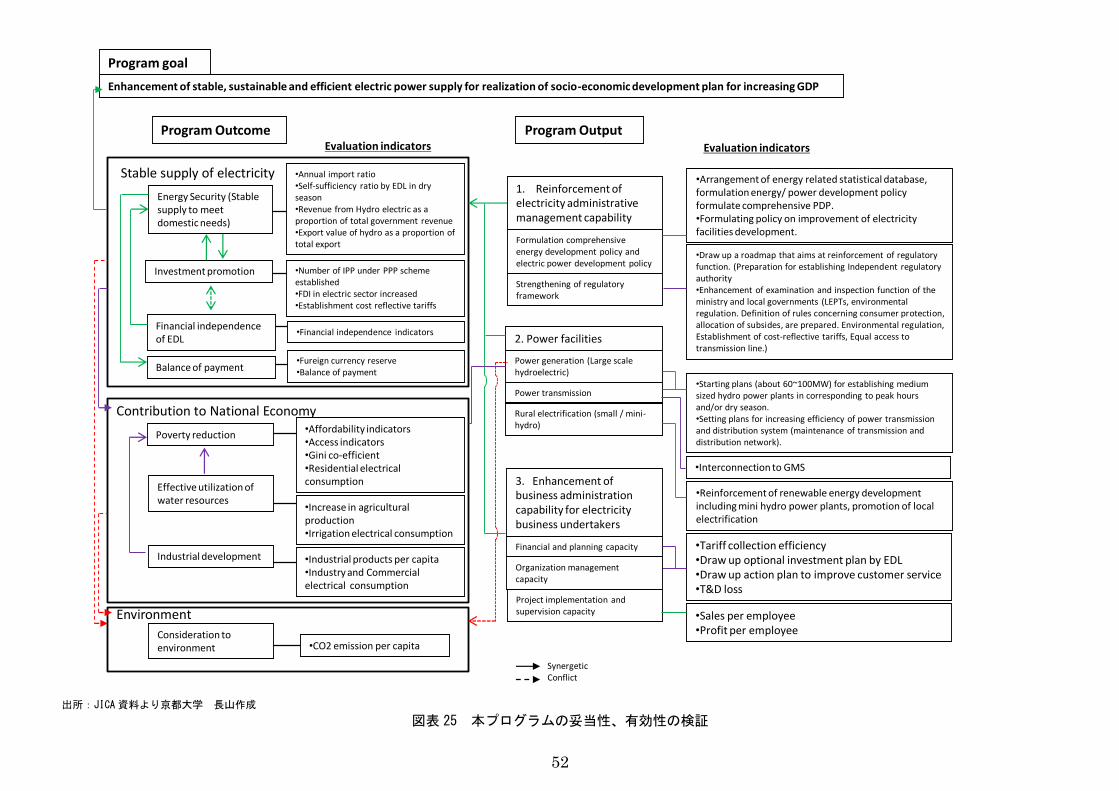
3.2 有効性の検証
2-1) プログラム目標とプログラムアウトカム(社会経済活動)の整合性
プログラムアウトカムである電力の安定供給、国家経済への貢献、環境への配慮は
本プログラムの有効性、妥当性の検証をしたところ互いに整合が取れている。
電力の安定供給(Stable supply of electricity)によりエネルギーセキュリティ、投資促
進、EDL の財務的独立性、輸出を通した国際収支への貢献が図られるべきである。国
内への低廉な電力供給や、水資源の有効活用を通じて工業生産高や農業生産高が上が
り、経済格差の是正、貧困削減に寄与することで国家経済に貢献(Contribution to
National Economy)する。しかしながら、CO2、水資源管理を含めた環境への配慮
(Consideration to Environment)は重要であり、プログラム目標達成にはこの点が考慮
されなければならない。
2-2) プログラムアウトカム(Outcome)とプログラム成果(Output)の整合性
プログラム成果の結果、プログラムアウトカムが達成できるのであり、こ
の意味で両者の整合性は取れている。
14
アウトプット(成果)1 の「電力行政管理能力の強化(Reinforcement of electricity
administrative management capacity)」は効率的な電力セクターの再編(独立した
電力規制局の設立を含む)を通じて電力の安定供給に資することになる。
特にエネルギー開発政策・電力開発政策見直し支援(Formulation comprehensive
energy development policy and electric power development policy)プロジェクト
は直接 EDL-Gen、IPP(d)、IPP(e)の電源計画に大きなインパクトを与えることにな
る。規制枠組みの強化(Strengthening of regulatory framework)は、EDL の財務体
質改善や投資促進を通じた電力投資の拡大、水資源の有効管理を通じて電力供給力
を拡大することになる。
アウトプット(成果)2 の「電力施設整備(Power facilities)」は、その物理的な設備
の形成により電力の安定供給に資する。電力施設整備(Power Facilities)は発送配電、
地方電化における供給力拡大、送配電ロス低減、GMS との連結による送配電効率
化を通じて電力の安定供給に貢献することになる。しかしながら環境規制に対して
電力設備の形成は環境配慮とマッチしたものでなければ国としてのバランスのとれ
た発展は望めない。
アウトプット(成果)3 の「電気事業者の事業運営能力向上(Enhancement of
business administration capability for electricity business undertakers)」は、そ
の効率的な事業体の構築により電力の安定供給に資することになる。財務・計画能
力(Financial and Planning capacity)、組織運営能力(Organization management
capacity)、事業実施・監理能力(Project implementation and Supervision capacity)
はEDLの事業運営能力の向上を通してEDLの財務体質の強化につながることにな
る。
開発戦略への貢献(指標についての考え方)ではラオス国においては数値目標が電
化率と再生可能エネルギー導入比率の 2 つしか存在せず、今回「ラオス国電力セク
タープログラムに関する開発指標等評価」にてプログラム評価分析を行ったことに
よりアウトプット、アウトカムそれぞれの Indicator(定性値を含む)の設定を行うと
ともに両者間の関係性を明らかにすることが出来た。今後は今回設定された開発戦
略目標(Indicator)に対して、他援助機関と協力し、その目標達成のための事業実施
とモニタリングが必要となる。
2-3) 世界銀行グループ、ADB との連携
世界銀行グループ、ADB との連携については JICA を含むそれぞれの機関における
人員体制、投入資金、プロジェクトの進捗がまちまちであり、協力プログラム目標達
15
成のためのシナリオは適切に設定されているとは客観的に認めがたい。プログラムに
一貫性を持たせるには、案件間の計画・実施の段階に於いて他援助機関との緊密な連
携コミュニケーションが必要である。例えば、
1). 水資源の有効管理では世界銀行の水資源法整備プロジェクト及び流域管理/モ
デリング支援プロジェクトと JICA の「国家発電計画 NPDP プロジェクト(実
施予定案件)」
2). 投資促進のためのガバナンス強化では、世界銀行の「IPP 契約管理プロジェク
ト」と JICA の「電力セクターガバナンス強化プロジェクト」
3). 小水力発電への支援では世界銀行の小水力民間投資促進、ADB の小水力 F/S
支援、JICA の「小規模水力開発ポテンシャル調査に対する技術支援(水力計画
調査)」
がより連携されるべきである。
3.3 成果指標項目の再検討
当初の評価指標に関し、有効性の観点から以下の指標を付け加えた。
成果 1:電力行政管理の監理強化
独立した規制委員会の設立、コストを反映した料金設定、経済のバランスのとれ
た発展、環境規制を加えた。
成果 2:電力設備整備
ピーク時間帯、乾季での中小規模(60-100MW)水力発電設備を加えた。
成果 3:電力事業者の事業運営能力向上
事業運営能力向上の数値目標として、送配電ロスの低減、料金回収率の向上、従業
員あたり売上、従業員あたり利益を加えた。
16
出所:JICA資料より京都大学 長山作成
要約 図表 1 本プログラムの妥当性、有効性の検証
Program goal
Program Outcome Program Output
Energy Security (Stable supply to meet domestic needs)
Poverty reduction
Consideration to environment
Investment promotion
Financial independence of EDL
Evaluation indicators
•Annual import ratio•Self-sufficiency ratio by EDL in dry season•Revenue from Hydro electric as a proportion of total government revenue•Export value of hydro as a proportion of total export
•Affordability indicators•Access indicators•Gini co-efficient•Residential electrical consumption
•CO2 emission per capita
•Number of IPP under PPP scheme established•FDI in electric sector increased•Establishment cost reflective tariffs
•Financial independence indicators
Enhancement of stable, sustainable and efficient electric power supply for realization of socio-economic development plan for increasing GDP
1. Reinforcement of electricity administrative management capability
2. Power facilities
3. Enhancement of business administration capability for electricity business undertakers
Formulation comprehensive energy development policy and electric power development policy
Strengthening of regulatory framework
Power generation (Large scale hydroelectric)
Power transmission
Rural electrification (small / mini-hydro)
•Tariff collection efficiency•Draw up optional investment plan by EDL•Draw up action plan to improve customer service•T&D loss
Effective utilization of water resources
•Increase in agricultural production•Irrigation electrical consumption
Industrial development •Industrial products per capita•Industry and Commercial electrical consumption
•Arrangement of energy related statistical database, formulation energy/ power development policy formulate comprehensive PDP. •Formulating policy on improvement of electricity facilities development.
•Draw up a roadmap that aims at reinforcement of regulatory function. (Preparation for establishing Independent regulatory authority•Enhancement of examination and inspection function of the ministry and local governments (LEPTs, environmental regulation. Definition of rules concerning consumer protection, allocation of subsides, are prepared. Environmental regulation, Establishment of cost-reflective tariffs, Equal access to transmission line.)
•Starting plans (about 60~100MW) for establishing medium sized hydro power plants in corresponding to peak hours and/or dry season.•Setting plans for increasing efficiency of power transmission and distribution system (maintenance of transmission and distribution network).
•Reinforcement of renewable energy development including mini hydro power plants, promotion of local electrification
Financial and planning capacity
Organization management capacity
Project implementation and supervision capacity
Evaluation indicators
•Sales per employee•Profit per employee
Stable supply of electricity
Contribution to National Economy
Environment
SynergeticConflict
•Interconnection to GMS
Balance of payment•Fureign currency reserve•Balance of payment
17
4 本業務における開発指標の提案
4.1 開発指標に対するアプローチ
本業務では JICA により作られたラオス国「電力整備プログラム」に基づき、はじ
めに個別事業により得られる成果(output)についての Indicator、次に成果の結果
得られる outcome、最後にプログラム目標の Indicator についてそれぞれの指標を
構築した。
尚、本業務では整備された Indicator に対し、1)データ入手可能性(Accessibility)、
2)データ比較可能性(Comparability)、3)データの検証可能性(Verifiability)、4)ア
ウトカム・アウトプット等との関連性の 4 つの視点から個別に評価を行った。これ
に加えてラオス国特有の状況や問題も考慮に入れた。
1) データの入手可能性についてはラオス国の場合、統計データが整備されていな
いことが多く、例えばラオス中央銀行の公式統計では 2011 年の電力輸出額は
75.97(百万ドル)であるが、NERI がマクロ予測に使うデータでは 280(百万ド
ル)、MEM の年報(2011-2012)では 435(百万ドル)となっている。このように、
本来通関で把握すべきデータが正しく捉えられていないことは問題である。投
資を促進すべき MPI 及び国家統計局にて各省庁からのデータを一元的に管理
すべきである。
2) データ比較可能性(Comparability)はラオス国とベンチマークとして周辺諸国
との比較ができやすいこととした。WDI、EIA などのデータは国際比較ができ
るため、これらを使えればそれを使用することとした。
3) 検証可能性(Verifiability)は今後モニターを行っていくに際し、同じデータが今
後も継続して入手可能でありそうか等を考慮した。例えば、電力輸入量のデー
タ入手には制約がある。電力輸入については NERI も正確な予測が出来ていな
いとしている。これは、国内送電線網の整備の状況如何によって、ベトナム、
中国、タイからの輸入量に影響があるからである。
4) アウトカム・アウトプット等との関連性は、互いに Irrelevant な指標の場合、
実務的に意味のある指標とならない。1)のデータ入手可能性との関連もあるた
め、定性的な観点からの指標も入れた。
本開発指標の構築にあたっては、各政策の達成度に対する定義付けが必要となる。
本稿の中で電力の安定供給、エネルギーセキュリティ、アクセス、財務的独立性、支払可
能性については以下のように定義を行った。
18
電力の安定供給(Stable Supply of Electricity):「電力輸出を拡大し、国庫収入へ
の寄与を増大させる」及び「国内向け電力供給を拡大し、低廉な電力を国内産業
及び住民に供給し、新たな産業を興す」
エネルギーセキュリティ(Energy Security):「水力発電に総発電量の 99%を依存
するラオス国として、年を通した電力輸出入収支、とりわけ乾季の電力輸入量比
率を低減すること、輸出比率及び国家歳入に占める水力発電の比率を低減させる
こと、このため石炭発電を拡大し、乾季での電力輸入を抑制すること、隣国との
交渉力を強化することに加え、輸出電力の価値を高めることで、輸出入価格ギャ
ップを低減すること」
アクセス (Access):「潜在的な消費者に対して十分に途切れない電力が供給され
る消費者の割合」
財務的独立性 (Fiscal dependence of the sector):「ROA などの財務比率が健全
であり合理的な電力供給を維持する為の政府からの、もしくは顧客セグメント間
での経済的支援を最低限に抑えていること。このため国内向け電力供給への投資
促進を行うためにはシングルバイヤーEDL が強い財務基盤を持つことが必要であ
り、そのため電力料金を顧客セグメント別にコスト見合いで上げる」
支払可能性 (Affordability):「所得からみて電力料金を支払える可能性」
本業務では Accessibility, Comparability, Verifiability の観点からプログラム目標、
プログラムアウトカム、プログラムアウトプットにおいて評価を行った。
プログラム目標
プログラム目標は「経済社会開発計画実現に向けた安定的、持続的かつ効率的な電力
供給の拡大によりラオス国の国民所得向上を図る」であり、指標は GDP per capita、
Power consumption per capita (kWh)の 2 つとした。
同国では今後輸出の大きな部分を電力輸出が占めることが予想されている。電力分野へ
の支援が効果的に行われ、電力投資により、国内供給、輸出が拡大し、輸入が減少すれば
単純なマクロ恒等式(Y = C(消費) + I(民間投資) +G(政府投資) + EX(輸出) - IM(輸入))で示さ
れるように、GDP 拡大に大きなインパクトを与えることになる。
19
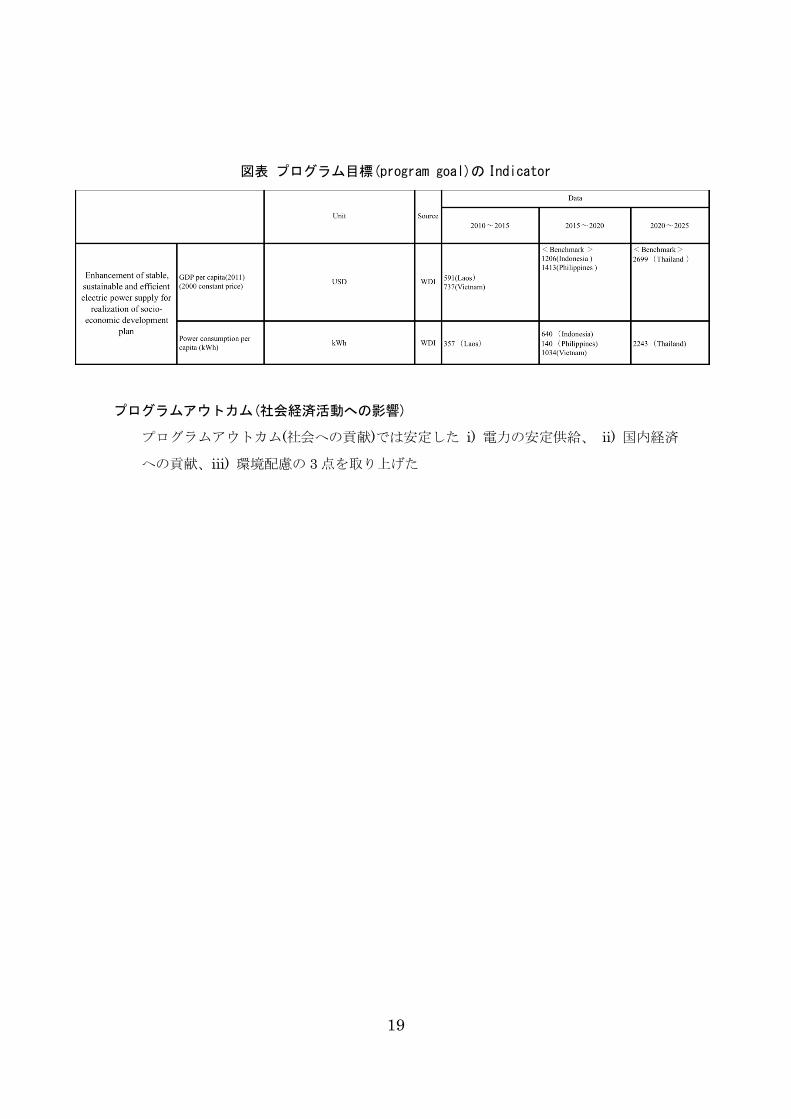
図表 プログラム目標(program goal)の Indicator
プログラムアウトカム(社会経済活動への影響)
プログラムアウトカム(社会への貢献)では安定した i) 電力の安定供給、 ii) 国内経済
への貢献、iii) 環境配慮の 3 点を取り上げた
20
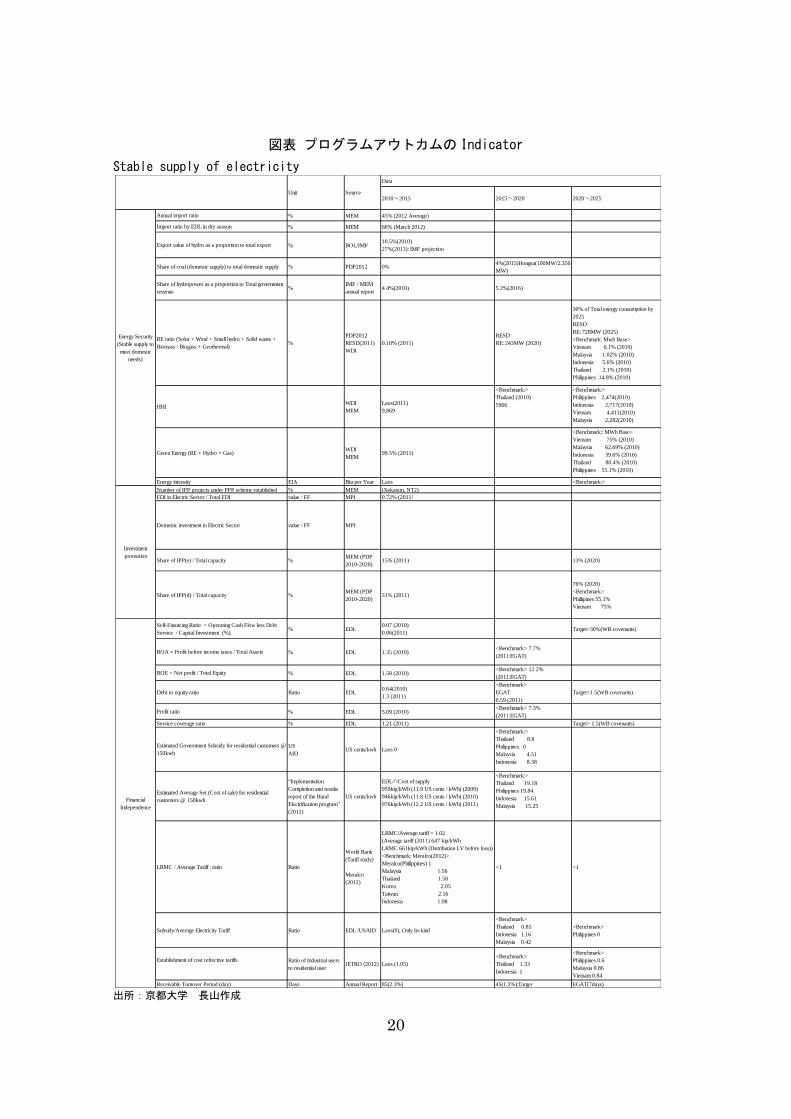
図表 プログラムアウトカムの Indicator
Stable supply of electricity
出所:京都大学 長山作成
% MEM 45% (2012 Average)
% MEM 66% (March 2012)
% BOL/IMF10.5%(2010)
27%(2013): IMF projection
% PDP2012 0%4%(2015)Hongsa(100MW/2,356
MW)
%IMF / MEM
annual report4.4%(2010) 5.2%(2016)
%
PDP2012
RESD(2011)
WDI
0.18% (2011)
RESD
RE: 243MW (2020)
30% of Total energy consumption by
2025
RESD
RE: 728MW (2025)
<Benchmark: Mwh Base>
Vietnam 0.1% (2010)
Malaysia 1.02% (2010)
Indonesia 5.6% (2010)
Thailand 2.1% (2010)
Philippines 14.8% (2010)
WDI
MEM
Laos(2011)
9,869
<Benchmark:>
Thailand (2010)
5966
<Benchmark:>
Philippines 2,474(2010)
Indonesia 2,717(2010)
Vietnam 4,411(2010)
Malaysia 2,282(2010)
WDI
MEM99.5% (2011)
<Benchmark:: MWh Base>
Vietnam 75% (2010)
Malaysia 62.69% (2010)
Indonesia 39.6% (2010)
Thailand 80.4% (2010)
Philippines 55.1% (2010)
EIA Btu per Year
2005 U.S.D
Laos
10,832(2010)
<Benchmark:>
Thailand (2010) 20,585% MEM (Xekatam, NT2)
value / FF MPI 0.72% (2011)
value / FF MPI
%MEM (PDP
2010-2020)15% (2011) 13% (2020)
%MEM (PDP
2010-2020)31% (2011)
76% (2020)
<Benchmark>
Phillipines 55.1%
Vietnam 75%
% EDL0.07 (2010)
0.06(2011)Target>30%(WB covenants)
% EDL 1.35 (2010)<Benchmark> 7.7%
(2011:EGAT)
% EDL 1.58 (2010)<Benchmark> 12.2%
(2011:EGAT)
Ratio EDL0.64(2010)
1.3 (2011)
<Benchmark>
EGAT
0.59 (2011)
Target<1.5(WB covenants)
% EDL 5.09 (2010)<Benchmark> 7.3%
(2011:EGAT)
% EDL 1.21 (2011) Target> 1.5(WB covenants)
US
AIDUS cents/kwh Laos 0
<Benchmark:>
Thailand 8.8
Philippines 0
Malaysia 4.51
Indonesia 8.38
“Implementation
Completion and results
report of the Rural
Electrification program”
(2012)
US cents/kwh
EDLのCost of supply
959kip/kWh (11.9 US cents / kWh) (2009)
946kip/kWh (11.8 US cents / kWh) (2010)
976kip/kWh (12.2 US cents / kWh) (2011)
<Benchmark:>
Thailand 19.18
Philippines 19.84
Indonesia 15.61
Malaysia 15.25
Ratio
World Bank
(Tariff study)
Meralco
(2012)
LRMC/Average tariff = 1.02
(Average tariff (2011) 647 kip/kWh
LRMC 661kip/kWh (Distribution LV before loss))
<Benchmark: Meralco(2012)>
Meralco(Philippines) 1
Malaysia 1.56
Thailand 1.58
Korea 2.05
Taiwan 2.16
Indonesia 1.98
<1 <1
Ratio EDL /USAID Laos(0), Only In-kind
<Benchmark>
Thailand 0.85
Indonesia 1.16
Malaysia 0.42
<Benchmark>
Philippines 0
Ratio of Industrial users
to residential userJETRO (2012) Laos (1.05)
<Benchmark>
Thailand 1.33
Indonesia 1
<Benchmark>
Philippines 0.6
Malaysia 0.86
Vietnam 0.84
Days Annual Report 85(2.3%) 45(1.2%):Targer EGAT(7days)
Financial
Independence
Estimated Government Subsidy for residential customers @
150kwh
Estimated Average Set (Cost of sale) for residential
customers @ 150kwh
Share of IPP(e) / Total capacity
Share of IPP(d) / Total capacity
Self-Financing Ratio = Operating Cash Flow less Debt
Service / Capital Investment (%).
ROA = Profit before income taxes / Total Assets
Share of coal (domestic supply) to total domestic supply
Share of hydropower as a proportion to Total government
revenue
Source
Data
2010~2015 2015~2020
Annual import ratio
2020~2025
Import ratio by EDL in dry season
Investment
promotion
LRMC / Average Tariff : ratio
Subsidy/Average Electricity Tariff
RE ratio (Solar + Wind + Small hydro + Solid waste +
Biomass / Biogass + Geothermal)
Unit
Debt to equity ratio
Profit ratio
Energy Security
(Stable supply to
meet domestic
needs)
Export value of hydro as a proportion to total export
Establishment of cost refrective tariffs
Receivable Turnover Period (day)
HHI
Green Energy (RE + Hydro + Gas)
Energy intensity
Number of IPP projects under PPP scheme established
ROE = Net profit / Total Equity
Service coverage ratio
FDI in Electric Sector / Total FDI
Domestic investment in Electric Sector
21
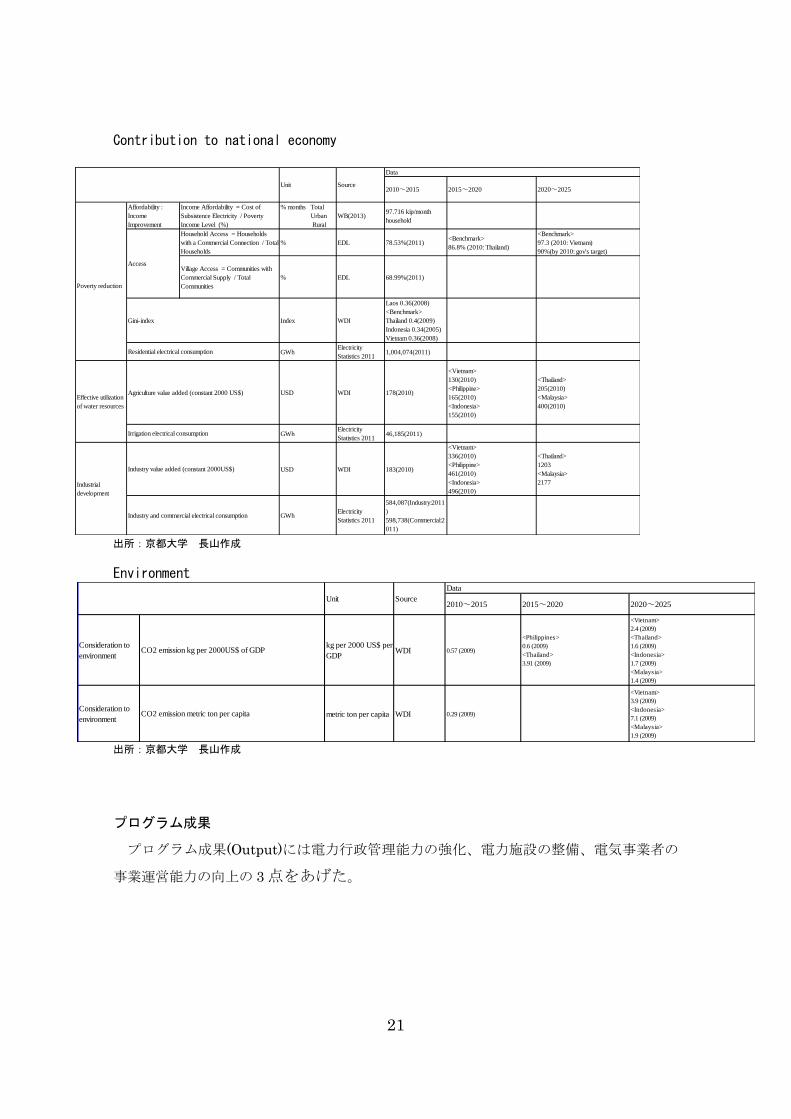
Contribution to national economy
出所:京都大学 長山作成
Environment
出所:京都大学 長山作成
プログラム成果
プログラム成果(Output)には電力行政管理能力の強化、電力施設の整備、電気事業者の
事業運営能力の向上の 3 点をあげた。
Affordability :
Income
Improvement
Income Affordability = Cost of
Subsistence Electricity / Poverty
Income Level (%)
% months Total
Urban
Rural
WB(2013)97.716 kip/month
household
Household Access = Households
with a Commercial Connection / Total
Households
% EDL 78.53%(2011)<Benchmark>
86.8% (2010: Thailand)
<Benchmark>
97.3 (2010: Vietnam)
90%(by 2010: gov's target)
Village Access = Communities with
Commercial Supply / Total
Communities
% EDL 68.99%(2011)
Index WDI
Laos 0.36(2008)
<Benchmark>
Thailand 0.4(2009)
Indonesia 0.34(2005)
Vietnam 0.36(2008)
GWhElectricity
Statistics 20111,004,074(2011)
USD WDI 178(2010)
<Vietnam>
130(2010)
<Philippine>
165(2010)
<Indonesia>
155(2010)
<Thailand>
205(2010)
<Malaysia>
400(2010)
GWhElectricity
Statistics 201146,185(2011)
USD WDI 183(2010)
<Vietnam>
336(2010)
<Philippine>
461(2010)
<Indonesia>
496(2010)
<Thailand>
1203
<Malaysia>
2177
GWhElectricity
Statistics 2011
584,087(Industry:2011
)
598,738(Commercial:2
011)
Unit
Access
Gini-index
Agriculture value added (constant 2000 US$)
Industry value added (constant 2000US$)
Source
Data
2010~2015 2015~2020 2020~2025
Poverty reduction
Residential electrical consumption
Effective utilization
of water resources
Irrigation electrical consumption
Industrial
development
Industry and commercial electrical consumption
Consideration to
environment
kg per 2000 US$ per
GDPWDI 0.57 (2009)
<Philippines>
0.6 (2009)
<Thailand>
3.91 (2009)
<Vietnam>
2.4 (2009)
<Thailand>
1.6 (2009)
<Indonesia>
1.7 (2009)
<Malaysia>
1.4 (2009)
Consideration to
environmentmetric ton per capita WDI 0.29 (2009)
<Vietnam>
3.9 (2009)
<Indonesia>
7.1 (2009)
<Malaysia>
1.9 (2009)
CO2 emission metric ton per capita
Unit Source
Data
2010~2015 2015~2020
CO2 emission kg per 2000US$ of GDP
2020~2025
22
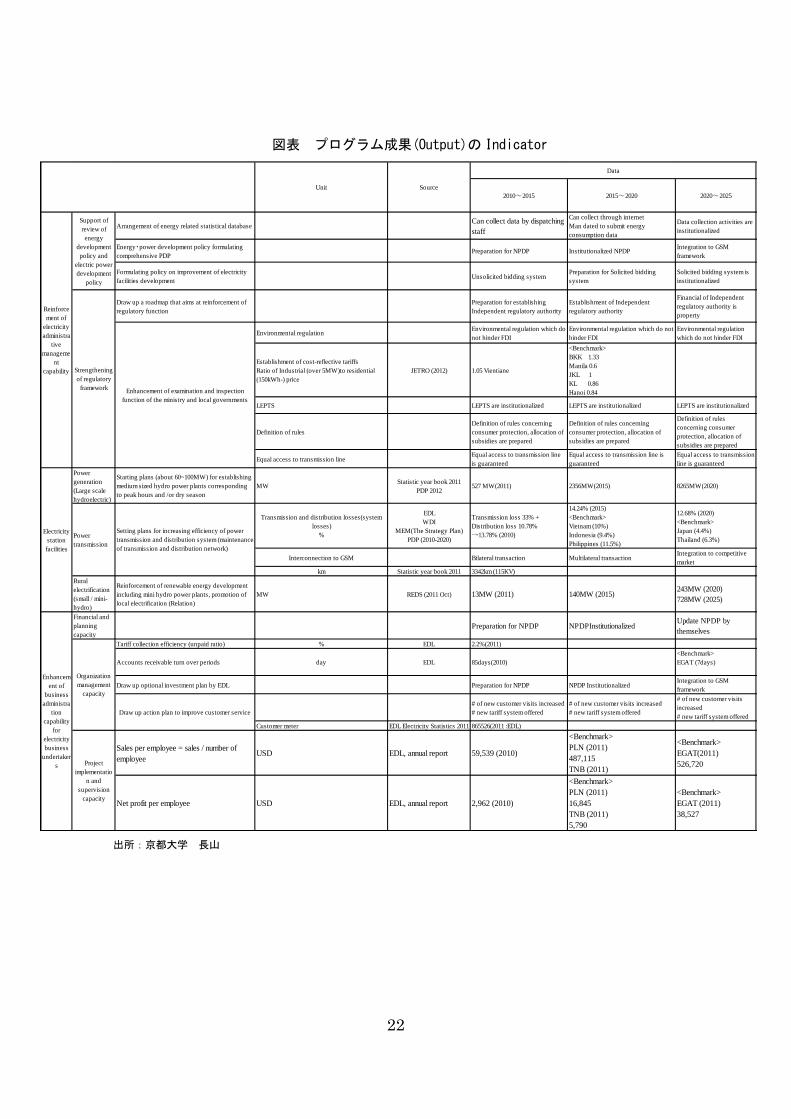
図表 プログラム成果(Output)の Indicator
出所:京都大学 長山
Arrangement of energy related statistical databaseCan collect data by dispatching
staff
Can collect through internet
Man dated to submit energy
consumption data
Data collection activities are
institutionalized
Energy・power development policy formulating
comprehensive PDPPreparation for NPDP Institutionalized NPDP
Integration to GSM
framework
Formulating policy on improvement of electricity
facilities developmentUnsolicited bidding system
Preparation for Solicited bidding
system
Solicited bidding system is
institutionalized
Draw up a roadmap that aims at reinforcement of
regulatory function
Preparation for establishing
Independent regulatory authority
Establishment of Independent
regulatory authority
Financial of Independent
regulatory authority is
property
Environmental regulationEnvironmental regulation which do
not hinder FDI
Environmental regulation which do not
hinder FDI
Environmental regulation
which do not hinder FDI
Establishment of cost-reflective tariffs
Ratio of Industrial (over 5MW)to residential
(150kWh-) price
JETRO (2012) 1.05 Vientiane
<Benchmark>
BKK 1.33
Manila 0.6
JKL 1
KL 0.86
Hanoi 0.84
LEPTS LEPTS are institutionalized LEPTS are institutionalized LEPTS are institutionalized
Definition of rules
Definition of rules concerning
consumer protection, allocation of
subsidies are prepared
Definition of rules concerning
consumer protection, allocation of
subsidies are prepared
Definition of rules
concerning consumer
protection, allocation of
subsidies are prepared
Equal access to transmission lineEqual access to transmission line
is guaranteed
Equal access to transmission line is
guaranteed
Equal access to transmission
line is guaranteed
Power
generation
(Large scale
hydroelectric)
Starting plans (about 60~100MW) for establishing
medium sized hydro power plants corresponding
to peak hours and /or dry season
MWStatistic year book 2011
PDP 2012527 MW(2011) 2356MW(2015) 8265MW(2020)
Transmission and distribution losses(system
losses)
%
EDL
WDI
MEM(The Strategy Plan)
PDP (2010-2020)
Transmission loss 33% +
Distribution loss 10.78%
→13.78% (2010)
14.24% (2015)
<Benchmark>
Vietnam (10%)
Indonesia (9.4%)
Philippines (11.5%)
12.68% (2020)
<Benchmark>
Japan (4.4%)
Thailand (6.3%)
Interconnection to GSM Bilateral transaction Multilateral transactionIntegration to competitive
market
km Statistic year book 2011 3342km (115KV)
Rural
electrification
(small / mini-
hydro)
Reinforcement of renewable energy development
including mini hydro power plants, promotion of
local electrification (Relation)
MW REDS (2011 Oct) 13MW (2011) 140MW (2015)243MW (2020)
728MW (2025)
Financial and
planning
capacity
Preparation for NPDP NPDPInstitutionalizedUpdate NPDP by
themselves
Tariff collection efficiency (unpaid ratio) % EDL 2.2%(2011)
Accounts receivable turn over periods day EDL 85days(2010)
<Benchmark>
EGAT (7days)
Draw up optional investment plan by EDL Preparation for NPDP NPDP InstitutionalizedIntegration to GSM
framework
# of new customer visits increased
# new tariff system offered
# of new customer visits increased
# new tariff system offered
# of new customer visits
increased
# new tariff system offered
Customer meter EDL Electricity Statistics 2011 865526(2011 :EDL)
Sales per employee = sales / number of
employeeUSD EDL, annual report 59,539 (2010)
<Benchmark>
PLN (2011)
487,115
TNB (2011)
301,963
<Benchmark>
EGAT(2011)
526,720
Net profit per employee USD EDL, annual report 2,962 (2010)
<Benchmark>
PLN (2011)
16,845
TNB (2011)
5,790
<Benchmark>
EGAT (2011)
38,527
2010~2015 2015~2020 2020~2025
Reinforce
ment of
electricity
administra
tive
manageme
nt
capability Strengthening
of regulatory
frameworkEnhancement of examination and inspection
function of the ministry and local governments
Project
implementatio
n and
supervision
capacity
Data
Support of
review of
energy
development
policy and
electric power
development
policy
Electricity
station
facilities
Power
transmission
Setting plans for increasing efficiency of power
transmission and distribution system (maintenance
of transmission and distribution network)
Enhancem
ent of
business
administra
tion
capability
for
electricity
business
undertaker
s
Organization
management
capacity
Draw up action plan to improve customer service
Unit Source
23
4.3 結論:電力開発指標
本稿ではラオス国電力セクターを例として、発展途上国電力セクター支援に係る指標構
築を行った。これまで電力に係る指標として Affordability, Access, Energy security な
どの指標が構築されていたが、本稿においては発展途上国支援の視点から、その指標設
定に新たに階層を設けた。 上位からプログラム目標(Program Goal)、プログラムア
ウトカム(Program outcome)、プログラム成果(Program Output)である。プログラム
目標は、支援国、被支援国双方の発展計画に連動するものである。
プログラムアウトプットは、支援プロジェクトの直接の効果を受けたもの、プログラム
アウトカムは、プログラムアウトプットの結果達成される目標となる。
本稿で得られた電力指標構築に係る教訓は以下の通りである。
1) その国特有の事情を考慮した指標を構築し、その定義を明確にすること
2) 指標目標の達成には、時間軸からの優先順位を設けること
3) 定性的な指標も加えられるべきこと
4) 階層間の連動性に注目してモニターされるべきものであること
である。
24
5 国家電力開発指標を制度化(Institutionalize)するための準備
5.1 国家電力開発指標設定の準備
今後ラオス国にとって重要なテーマはプログラムの貢献度を高めるため、相手国政府
及び他ドナーとの間でその目標を共有することである。
そのためには以下が必要となる。
1) 電力セクターとしての経済成長シナリオ別発展シナリオ作成と時間軸の中で政策的
優先順位をたてること。例えば投資促進を行うため、EDL の財務体質改善のための
電気料金値上げはどのタイミングで行うべきか等。
2) 政策目標の定義をつけること。例えばエネルギーセキュリティにおいても各国にお
いてその定義は異なるため、ラオス国としての定義を確立する必要がある。
3) 各指標のラオス国における発展段階を考慮した他国とのベンチマーク比較を行い、
絶えず目標設定の見直しを行うこと。
4) マルチセクトラルなアプローチをとること。最適水資源の管理は MAF、MPWT、デ
ータベース整備では、MPI(NERI)、MOF との協力が不可欠となる。
5.2国家電力開発指標の設定手順
電力開発指標に関する設定準備及びデータ更新については、以下の方法を提案する。
尚、今回の調査では 3)まで下記の手順に従い指標設定の検討を行った。4)以降は MEM
等ラオス国政府との協議の上で今後の実施も含め検討するのが望ましい。
1) 国際的データとラオス国の状況を比較検討すること
2) 公表された指標とその必要データについての入手、整合性の確認を行うこと 例 1)
ラオス語のものを含め、最新のエネルギーセクターに関するデータレポートを整理
する 例 2) 輸入額など各種データソースでの整合性を確認すること
3) 現時点で入手ができないデータリストを作る。 例)SAIFI, SAIDI
4) それらのデータの入手可能性について検討すること 例)MEM、MPWT、MAF 等
5) NERI 等と連携し、国のいくつかの経済発展シナリオを作り、それに連動した指標
ターゲットを作ること(例:タイの例:Jutamanee, M and S, Kumar(2012))
6)望ましい指標(Appropriate indicator)について MEM と合意すること
7) 数年ごとにモニタリングを行い、政策の効果について確認すること(例:メキシコの
例:Claudia et al (2012))
25
5.3 電力セクター産業組織
上記の開発指標を作り、持続的にモニタリングする仕組みを構築するには、現在の
組織からの改変が必要である。
現在のラオス国電力産業の段階はシングルバイヤーであり、MEM はこのため同様の
シングルバイヤーにあるタイ国、インドネシア国とほぼ同様の役割分担となっている。
しかしながら、理想的にはタイ型とベトナム型の折衷が望ましい。つまり、現在の
DEPP は NEPO と同様に、エネルギー政策と GMS、ASEAN 等を含む国際関係を担
当する。これ以外の DEM、DEB は独立した規制委員会に移行するのが望ましい。規
制機関は当初は MEM 傘下の機関(例:ベトナムの ERAV)であっても、最終的には政治
的、財政的な独立を目指す。
このように独立した規制機関の設立は、現在の EDL の財政状況に対応(address)する
ためにも必要な措置である。現在のラオス国の組織 MEM 内の DEM、DEB、IREP、
さらには電気料金の許可権を持つ首相府が含まれるだろう。
6.電力整備プログラムの中で JICAが果たす役割
電力整備プログラムの中で JICA が果たす役割はプログラム目標(Program goal)、プロ
グラムアウトカム(Program outcome)では直接のインパクトは見えにくいが、プログラ
ム成果(Program output)の中では JICA、世界銀行、ADB のデマケーションは比較的
容易に行うことができる。プログラム成果の効果を高めるには、世銀、ADB が規制の
枠組みをつくること、JICA が技術トレーニングなどを分担して担当するのがよいだろ
う。
26
第1章 調査の概要
1-1調査の背景
近年の政府開発援助予算の削減に伴う事業の選択と集中の必要性、援助調和化・予見性向
上に係る要請等、国民の理解を得つつ ODA を効果的に実施していくためには、援助の戦
略性を強化していくことが求められている。平成 22 年 6 月、日本政府は「 ODA のあり方
に関する検討最終とりまとめ」を発表し、プログラム・アプローチを推進する方針を決定し
た。
JICA においても、従来援助の三層構造(援助重点分野、開発課題、協力プログラム)の下、
各国において協力プログラムを設定し事業を展開しており、平成 21 年 7 月には「協力プロ
グラムの戦略性強化に係るガイドライン」を策定するなど、プログラム化の推進に取り組ん
できている。また、平成 23 年に策定された「 JICA 中期事業戦略」では、「プログラム化
推進」及び「プログラム化推進に向けた体制面の整備」を提言し、これを受け、同年 8 月
より電力セクターのプログラム・マネージャーをラオス事務所に配置している。
ラオスの電力セクターは、ラオスの社会経済開発における重要性及びマネジメント方法改
善を通した ODA 事業の効果向上の潜在性等に鑑み、「戦略的・効果的な援助の実施に向
けて」( 2011 年外務省)においてパイロット・プログラム「電力整備プログラム」(以下「電
力プログラム」という)として選定されている。 JICA は 2012 年 2 月に電力プログラムド
ラフトを作成し、 8 月には外務省等と暫定版に基づき意見交換を実施した。
1-2調査の目的
本業務は、 JICA、ラオス政府エネルギー鉱業省(以下「 C/P 機関」という)及びラオス国
関係機関等との協議を通して、 ①電力プログラム最終版作成に向けて、問題分析や対応策
等の分析過程や提案されている成果の妥当性の検証を行うとともに、 ②相手国の開発計
画・目標と整合した成果指標の設定等につき検討することを通して、電力プログラムの開
発効果向上を図ることを目的としている。
本調査では、プログラム目標、問題分析及び対応策の分析方法、提案されている成果の妥
当性、有効性について検討を行った。また、プログラムの進捗を効率的・効果的にモニタ
リングするための指標の妥当性についても併せて検討した。
27
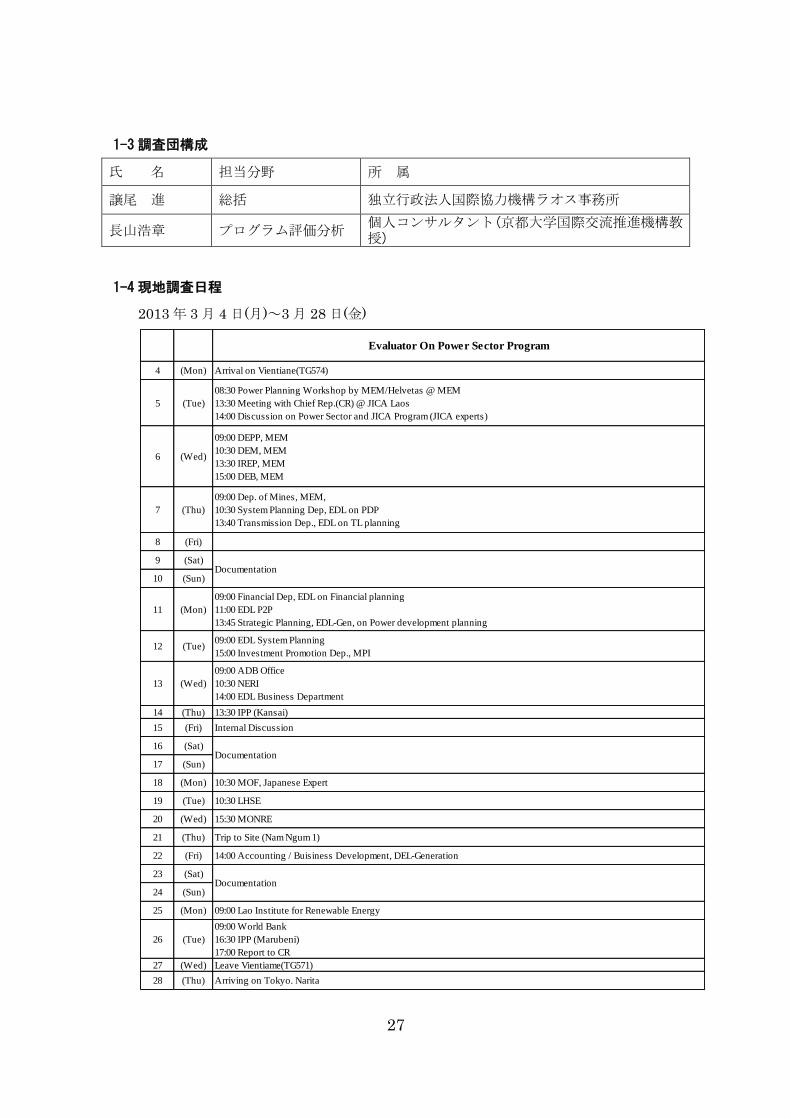
1-3調査団構成
氏 名 担当分野 所 属
譲尾 進 総括 独立行政法人国際協力機構ラオス事務所
長山浩章 プログラム評価分析 個人コンサルタント(京都大学国際交流推進機構教授)
1-4現地調査日程
2013 年 3 月 4 日(月)~3 月 28 日(金)
Evaluator On Power Sector Program
4 (Mon) Arrival on Vientiane(TG574)
5 (Tue)
08:30 Power Planning Workshop by MEM/Helvetas @ MEM
13:30 Meeting with Chief Rep.(CR) @ JICA Laos
14:00 Discussion on Power Sector and JICA Program (JICA experts)
6 (Wed)
09:00 DEPP, MEM
10:30 DEM, MEM
13:30 IREP, MEM
15:00 DEB, MEM
7 (Thu)
09:00 Dep. of Mines, MEM,
10:30 System Planning Dep, EDL on PDP
13:40 Transmission Dep., EDL on TL planning
8 (Fri)
9 (Sat)
10 (Sun)
11 (Mon)
09:00 Financial Dep, EDL on Financial planning
11:00 EDL P2P
13:45 Strategic Planning, EDL-Gen, on Power development planning
12 (Tue)09:00 EDL System Planning
15:00 Investment Promotion Dep., MPI
13 (Wed)
09:00 ADB Office
10:30 NERI
14:00 EDL Business Department
14 (Thu) 13:30 IPP (Kansai)
15 (Fri) Internal Discussion
16 (Sat)
17 (Sun)
18 (Mon) 10:30 MOF, Japanese Expert
19 (Tue) 10:30 LHSE
20 (Wed) 15:30 MONRE
21 (Thu) Trip to Site (Nam Ngum 1)
22 (Fri) 14:00 Accounting / Buisiness Development, DEL-Generation
23 (Sat)
24 (Sun)
25 (Mon) 09:00 Lao Institute for Renewable Energy
26 (Tue)
09:00 World Bank
16:30 IPP (Marubeni)
17:00 Report to CR
27 (Wed) Leave Vientiame(TG571)
28 (Thu) Arriving on Tokyo. Narita
Documentation
Documentation
Documentation
28
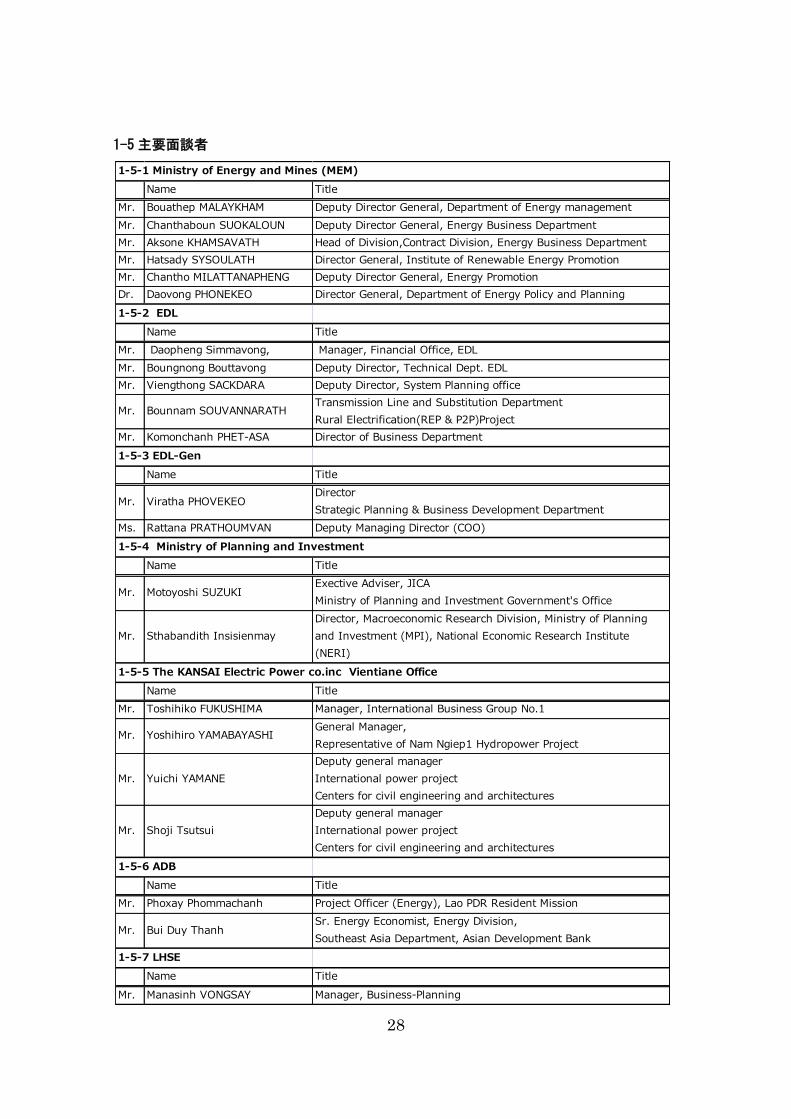
1-5主要面談者
1-5-1 Ministry of Energy and Mines (MEM)
Name Title
Mr. Bouathep MALAYKHAM Deputy Director General, Department of Energy management
Mr. Chanthaboun SUOKALOUN Deputy Director General, Energy Business Department
Mr. Aksone KHAMSAVATH Head of Division,Contract Division, Energy Business Department
Mr. Hatsady SYSOULATH Director General, Institute of Renewable Energy Promotion
Mr. Chantho MILATTANAPHENG Deputy Director General, Energy Promotion
Dr. Daovong PHONEKEO Director General, Department of Energy Policy and Planning
1-5-2 EDL
Name Title
Mr. Daopheng Simmavong, Manager, Financial Office, EDL
Mr. Boungnong Bouttavong Deputy Director, Technical Dept. EDL
Mr. Viengthong SACKDARA Deputy Director, System Planning office
Mr. Bounnam SOUVANNARATHTransmission Line and Substitution Department
Rural Electrification(REP & P2P)Project
Mr. Komonchanh PHET-ASA Director of Business Department
1-5-3 EDL-Gen
Name Title
Mr. Viratha PHOVEKEODirector
Strategic Planning & Business Development Department
Ms. Rattana PRATHOUMVAN Deputy Managing Director (COO)
1-5-4 Ministry of Planning and Investment
Name Title
Mr. Motoyoshi SUZUKIExective Adviser, JICA
Ministry of Planning and Investment Government's Office
Mr. Sthabandith Insisienmay
Director, Macroeconomic Research Division, Ministry of Planning
and Investment (MPI), National Economic Research Institute
(NERI)
1-5-5 The KANSAI Electric Power co.inc Vientiane Office
Name Title
Mr. Toshihiko FUKUSHIMA Manager, International Business Group No.1
Mr. Yoshihiro YAMABAYASHIGeneral Manager,
Representative of Nam Ngiep1 Hydropower Project
Mr. Yuichi YAMANE
Deputy general manager
International power project
Centers for civil engineering and architectures
Mr. Shoji Tsutsui
Deputy general manager
International power project
Centers for civil engineering and architectures
1-5-6 ADB
Name Title
Mr. Phoxay Phommachanh Project Officer (Energy), Lao PDR Resident Mission
Mr. Bui Duy ThanhSr. Energy Economist, Energy Division,
Southeast Asia Department, Asian Development Bank
1-5-7 LHSE
Name Title
Mr. Manasinh VONGSAY Manager, Business-Planning
29
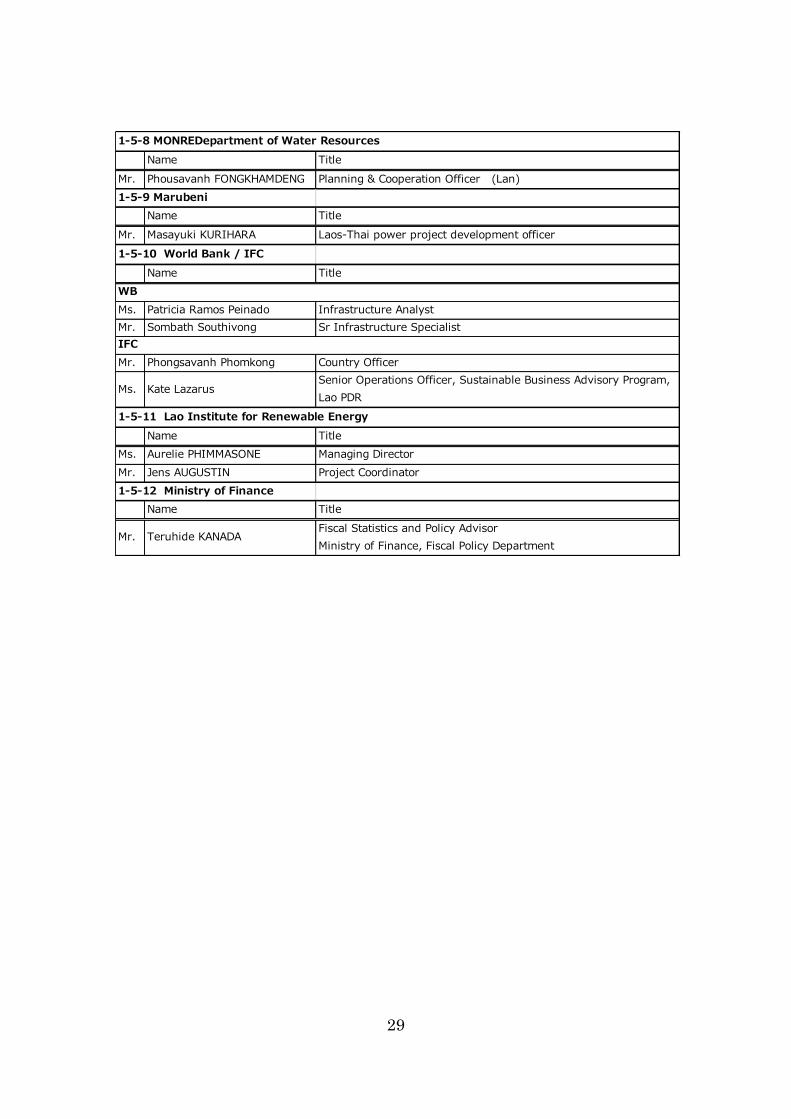
1-5-8 MONREDepartment of Water Resources
Name Title
Mr. Phousavanh FONGKHAMDENG Planning & Cooperation Officer (Lan)
1-5-9 Marubeni
Name Title
Mr. Masayuki KURIHARA Laos-Thai power project development officer
1-5-10 World Bank / IFC
Name Title
Ms. Patricia Ramos Peinado Infrastructure Analyst
Mr. Sombath Southivong Sr Infrastructure Specialist
Mr. Phongsavanh Phomkong Country Officer
Ms. Kate LazarusSenior Operations Officer, Sustainable Business Advisory Program,
Lao PDR
1-5-11 Lao Institute for Renewable Energy
Name Title
Ms. Aurelie PHIMMASONE Managing Director
Mr. Jens AUGUSTIN Project Coordinator
1-5-12 Ministry of Finance
Name Title
Mr. Teruhide KANADAFiscal Statistics and Policy Advisor
Ministry of Finance, Fiscal Policy Department
IFC
WB
30
第2章 ラオス国電力セクター及び協力プログラム開発指標等の分
析
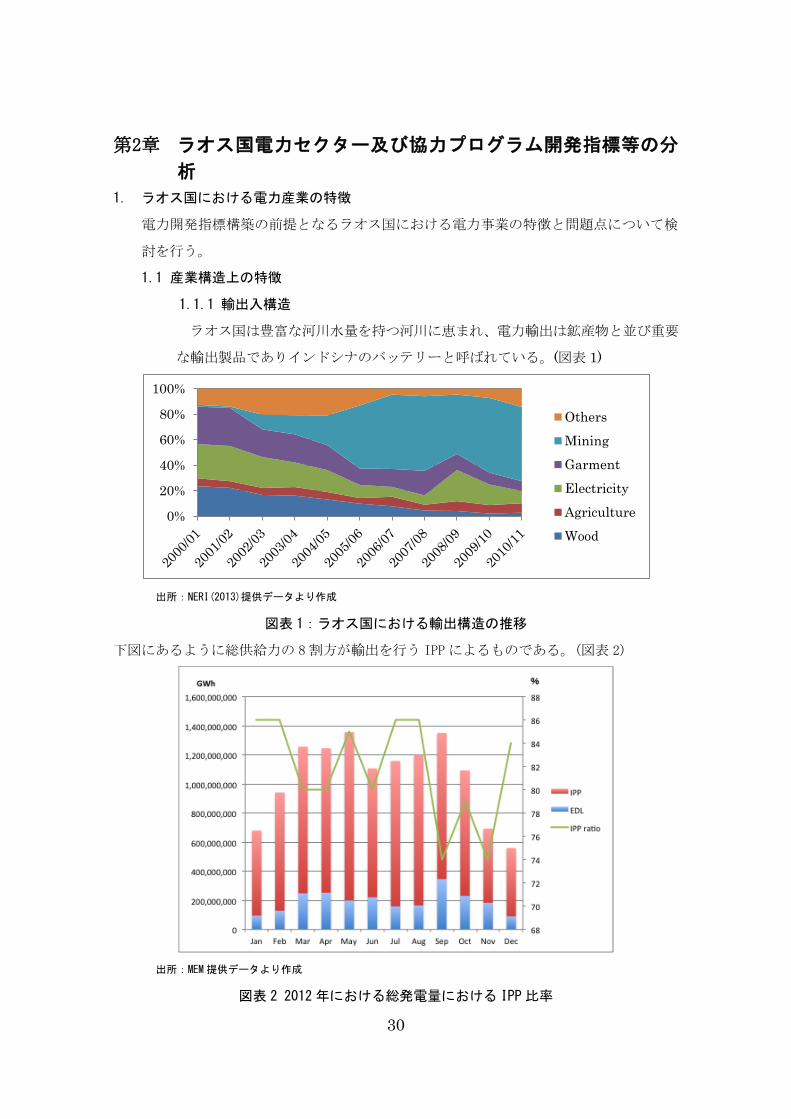
1. ラオス国における電力産業の特徴
電力開発指標構築の前提となるラオス国における電力事業の特徴と問題点について検
討を行う。
1.1 産業構造上の特徴
1.1.1 輸出入構造
ラオス国は豊富な河川水量を持つ河川に恵まれ、電力輸出は鉱産物と並び重要
な輸出製品でありインドシナのバッテリーと呼ばれている。(図表 1)
出所:NERI(2013)提供データより作成
図表 1:ラオス国における輸出構造の推移
下図にあるように総供給力の 8割方が輸出を行う IPPによるものである。(図表 2)
出所:MEM提供データより作成
図表 2 2012年における総発電量における IPP比率
0%
20%
40%
60%
80%
100%
Others
Mining
Garment
Electricity
Agriculture
Wood
31
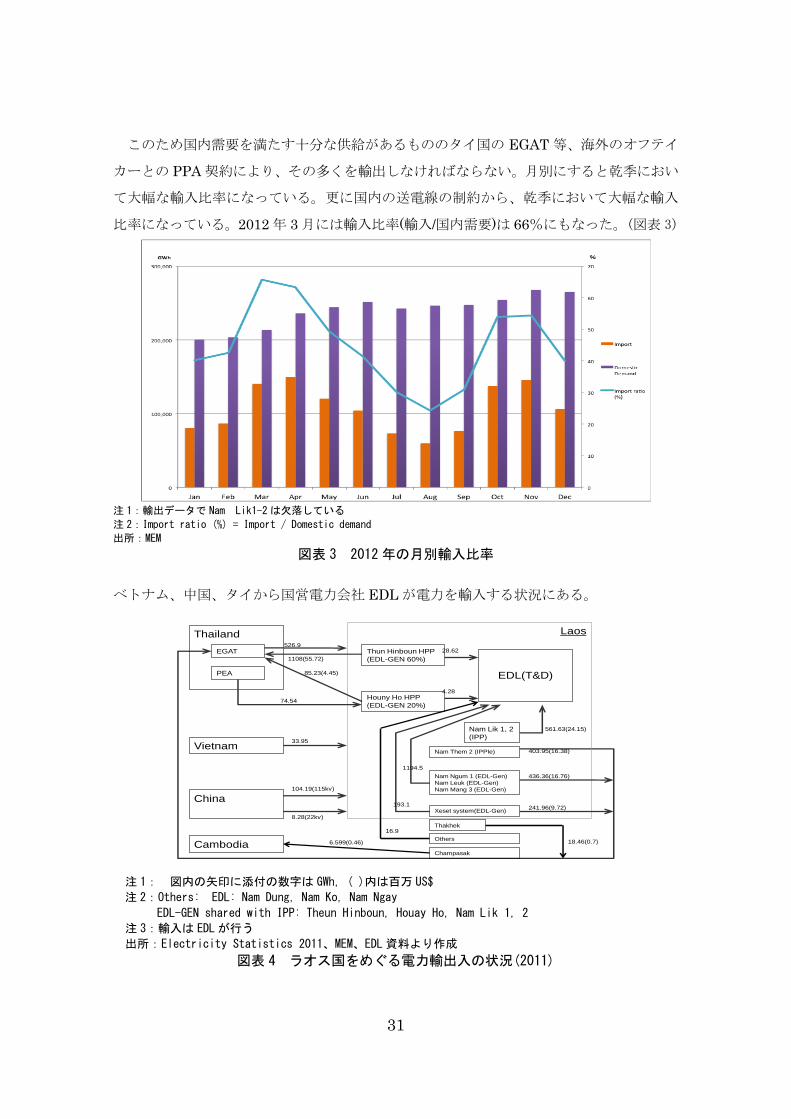
このため国内需要を満たす十分な供給があるもののタイ国の EGAT 等、海外のオフテイ
カーとの PPA 契約により、その多くを輸出しなければならない。月別にすると乾季におい
て大幅な輸入比率になっている。更に国内の送電線の制約から、乾季において大幅な輸入
比率になっている。2012 年 3 月には輸入比率(輸入/国内需要)は 66%にもなった。(図表 3)
注 1:輸出データで Nam Lik1-2は欠落している
注 2:Import ratio (%) = Import / Domestic demand
出所:MEM
図表 3 2012年の月別輸入比率
ベトナム、中国、タイから国営電力会社 EDL が電力を輸入する状況にある。
Thailand
EGAT
PEA
Laos
EDL(T&D)
Vietnam
China
Others
526.9
1108(55.72)
85.23(4.45)
74.54
33.95
104.19(115kv)
8.28(22kv)
28.62
4.28
403.95(16.38)
436.36(16.76)
241.96(9.72)
1194.5
193.1
16.9
561.63(24.15)
Thun Hinboun HPP
(EDL-GEN 60%)
Houny Ho HPP
(EDL-GEN 20%)
Nam Them 2 (IPPle)
Nam Ngum 1 (EDL-Gen)
Nam Leuk (EDL-Gen)
Nam Mang 3 (EDL-Gen)
Xeset system(EDL-Gen)
Thakhek
18.46(0.7)
Champasak
Cambodia 6.599(0.46)
Nam Lik 1, 2
(IPP)
注 1: 図内の矢印に添付の数字は GWh, ( )内は百万 US$
注 2:Others: EDL: Nam Dung, Nam Ko, Nam Ngay
EDL-GEN shared with IPP: Theun Hinboun, Houay Ho, Nam Lik 1, 2
注 3:輸入は EDLが行う
出所:Electricity Statistics 2011、MEM、EDL資料より作成
図表 4 ラオス国をめぐる電力輸出入の状況(2011)
32
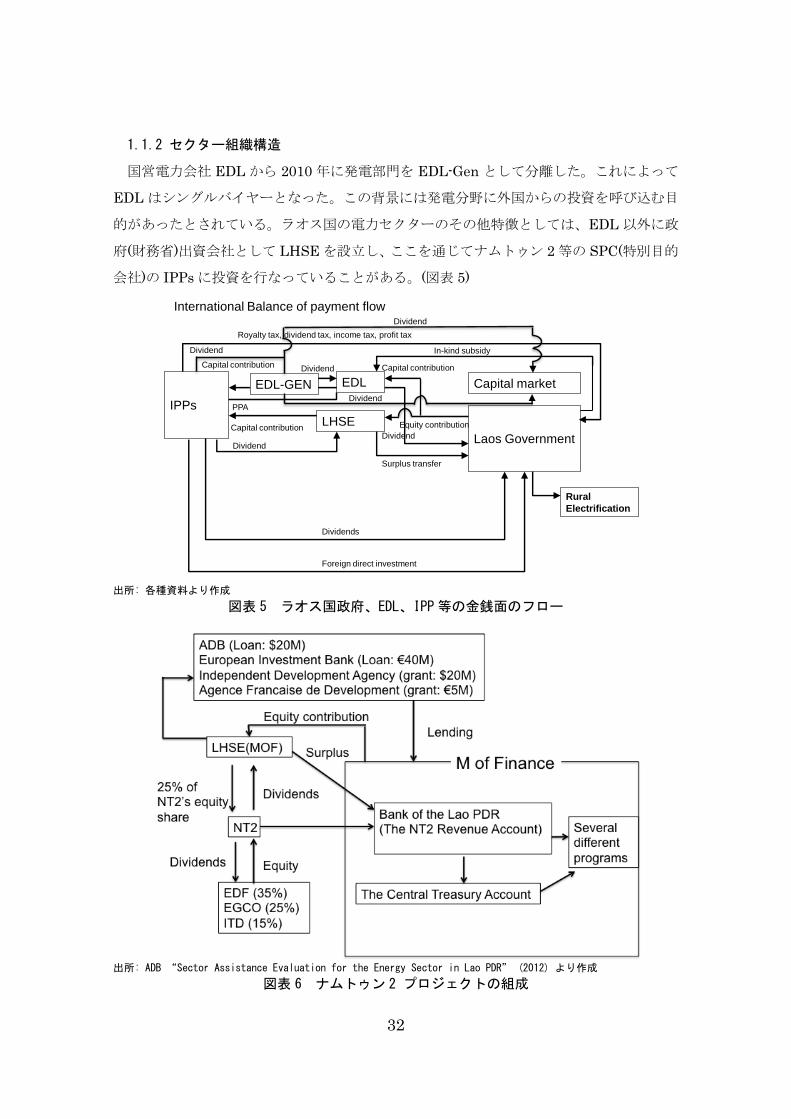
1.1.2 セクター組織構造
国営電力会社 EDL から 2010 年に発電部門を EDL-Gen として分離した。これによって
EDL はシングルバイヤーとなった。この背景には発電分野に外国からの投資を呼び込む目
的があったとされている。ラオス国の電力セクターのその他特徴としては、EDL 以外に政
府(財務省)出資会社として LHSE を設立し、ここを通じてナムトゥン 2 等の SPC(特別目的
会社)の IPPs に投資を行なっていることがある。(図表 5)
出所: 各種資料より作成
図表 5 ラオス国政府、EDL、IPP等の金銭面のフロー
出所: ADB “Sector Assistance Evaluation for the Energy Sector in Lao PDR” (2012) より作成
図表 6 ナムトゥン 2 プロジェクトの組成
Source: Created by author
International Balance of payment flow
IPPs
EDL
LHSE
Laos Government
Capital market
Capital contribution
Capital contribution
Capital contribution
Dividends
Foreign direct investment
PPA
Dividend
Surplus transfer
Royalty tax, dividend tax, income tax, profit tax
Rural
Electrification
Dividend
Dividend
In-kind subsidy
Dividend
Equity contribution
EDL-GEN
Dividend
Dividend
33
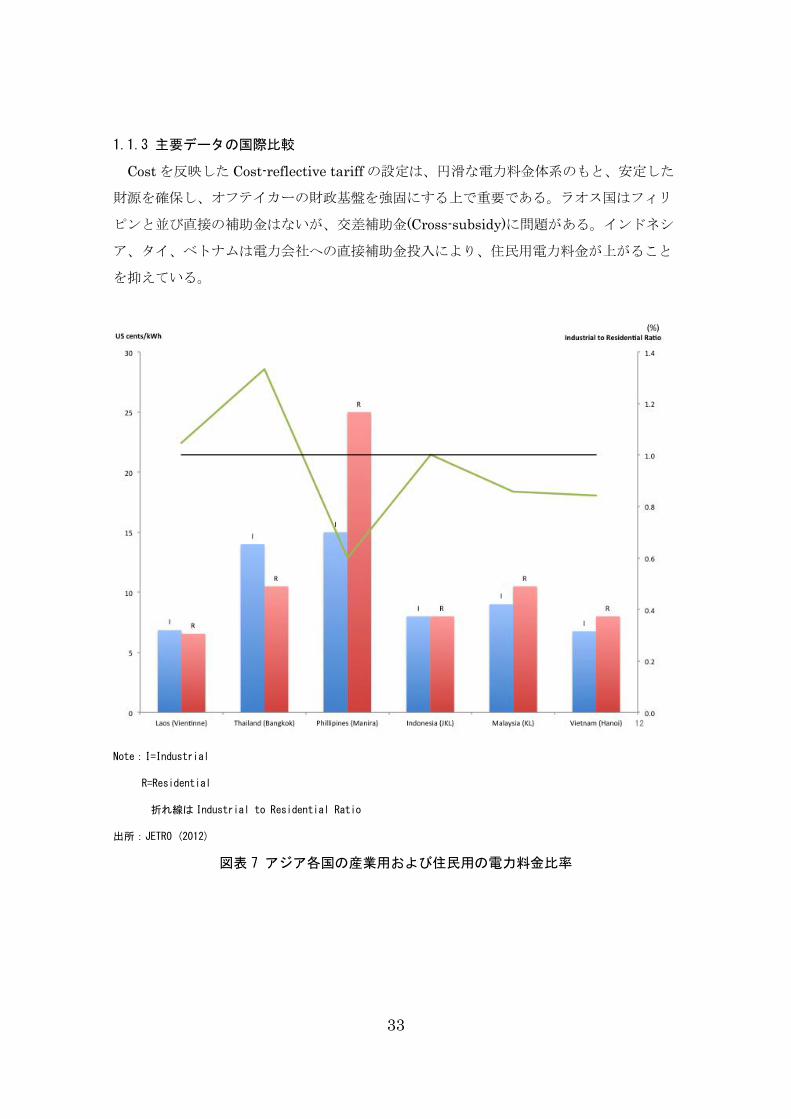
1.1.3 主要データの国際比較
Cost を反映した Cost-reflective tariff の設定は、円滑な電力料金体系のもと、安定した
財源を確保し、オフテイカーの財政基盤を強固にする上で重要である。ラオス国はフィリ
ピンと並び直接の補助金はないが、交差補助金(Cross-subsidy)に問題がある。インドネシ
ア、タイ、ベトナムは電力会社への直接補助金投入により、住民用電力料金が上がること
を抑えている。
Note:I=Industrial
R=Residential
折れ線は Industrial to Residential Ratio
出所:JETRO (2012)
図表 7 アジア各国の産業用および住民用の電力料金比率
34
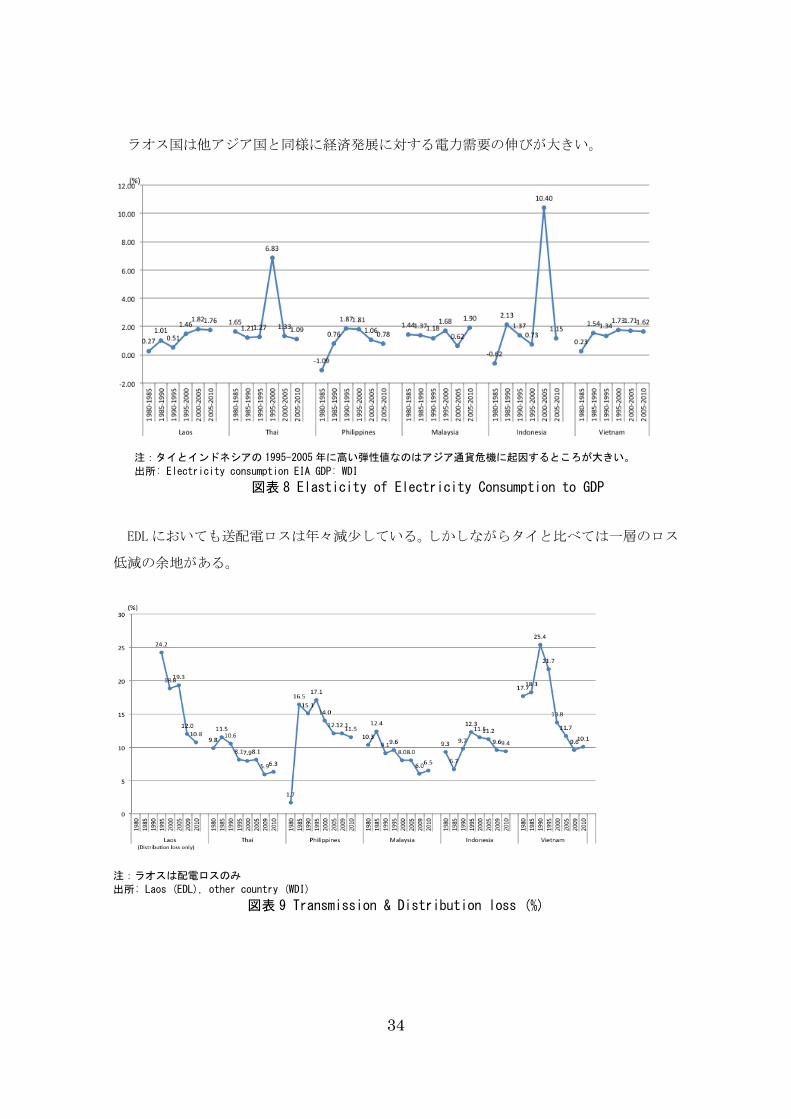
ラオス国は他アジア国と同様に経済発展に対する電力需要の伸びが大きい。
注:タイとインドネシアの 1995-2005年に高い弾性値なのはアジア通貨危機に起因するところが大きい。
出所: Electricity consumption EIA GDP: WDI
図表 8 Elasticity of Electricity Consumption to GDP
EDLにおいても送配電ロスは年々減少している。しかしながらタイと比べては一層のロス
低減の余地がある。
注:ラオスは配電ロスのみ
出所: Laos (EDL), other country (WDI)
図表 9 Transmission & Distribution loss (%)
35
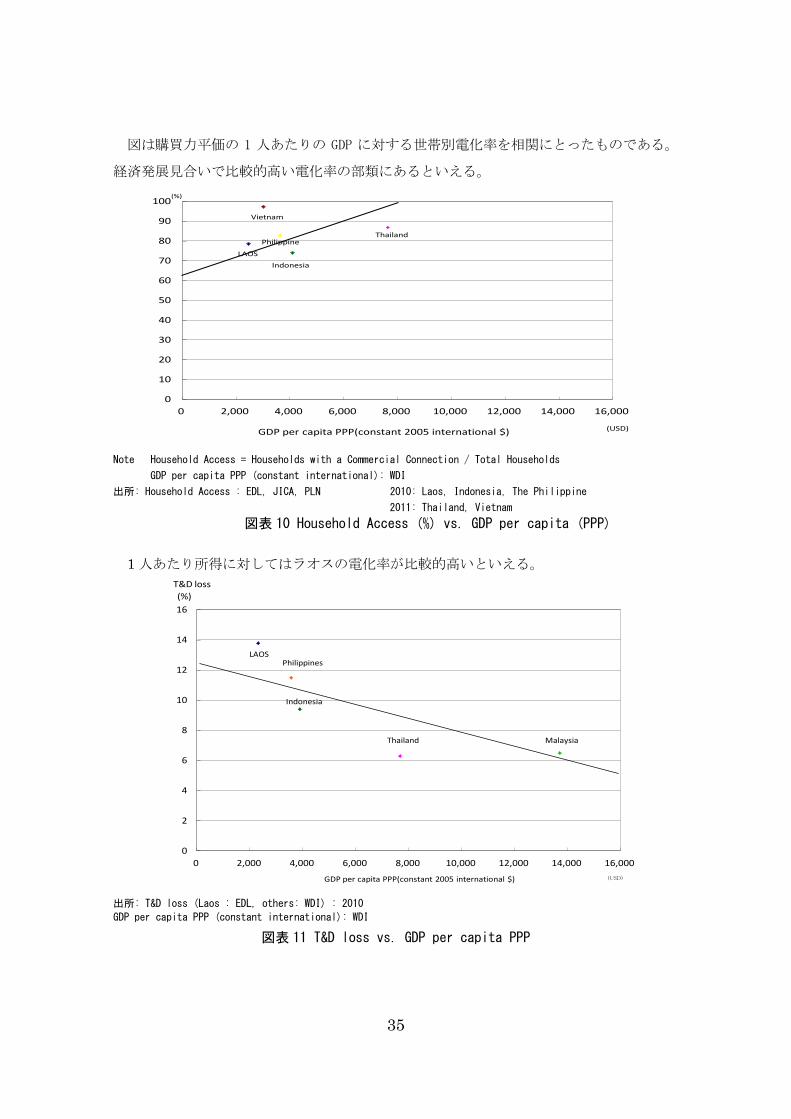
図は購買力平価の 1 人あたりの GDP に対する世帯別電化率を相関にとったものである。
経済発展見合いで比較的高い電化率の部類にあるといえる。
0
10
20
30
40
50
60
70
80
90
100
0 2,000 4,000 6,000 8,000 10,000 12,000 14,000 16,000
LAOS
Vietnam
Thailand
Indonesia
GDP per capita PPP(constant 2005 international $)
Household Access (%) = Households with a Commercial Connection (B)/Total Households(C)
(%)
(USD)
Philippine
Note Household Access = Households with a Commercial Connection / Total Households
GDP per capita PPP (constant international): WDI
出所: Household Access : EDL, JICA, PLN 2010: Laos, Indonesia, The Philippine
2011: Thailand, Vietnam
図表 10 Household Access (%) vs. GDP per capita (PPP)
1 人あたり所得に対してはラオスの電化率が比較的高いといえる。
0
2
4
6
8
10
12
14
16
0 2,000 4,000 6,000 8,000 10,000 12,000 14,000 16,000
LAOS
Thailand
Indonesia
GDP per capita PPP(constant 2005 international $)
T&D loss
Philippines
Malaysia
(USD)
(%)
出所: T&D loss (Laos : EDL, others: WDI) : 2010
GDP per capita PPP (constant international): WDI
図表 11 T&D loss vs. GDP per capita PPP
36
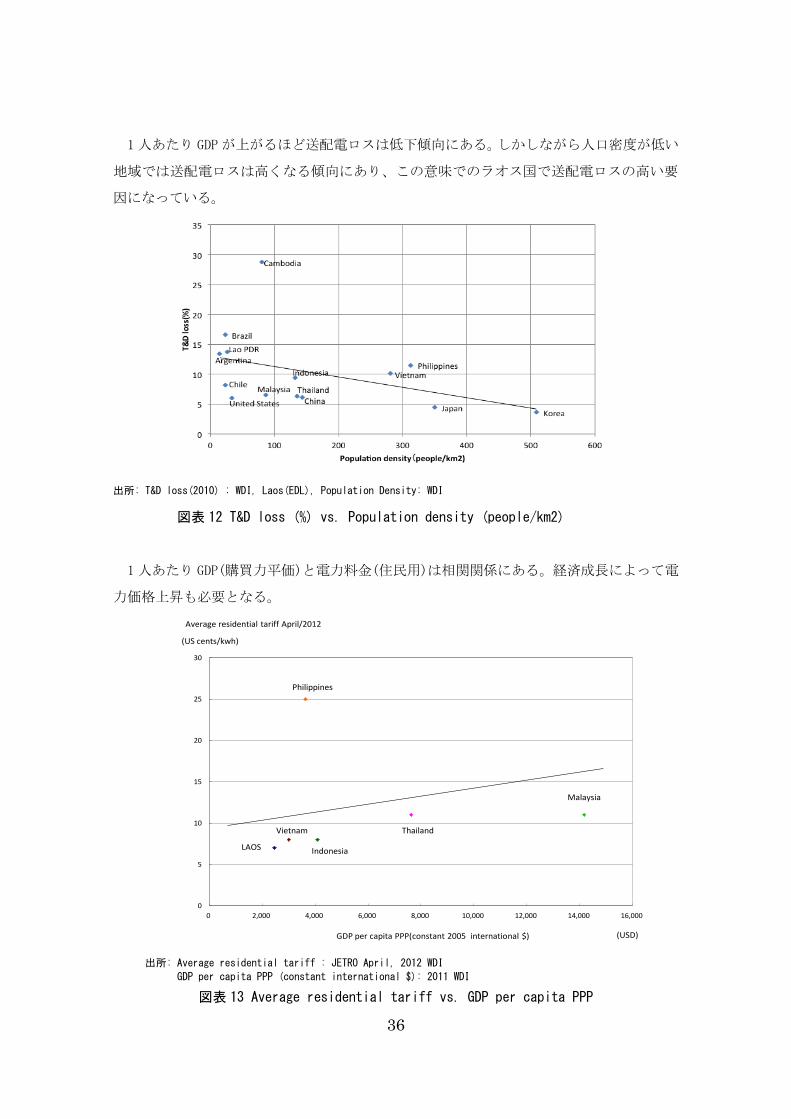
1人あたり GDPが上がるほど送配電ロスは低下傾向にある。しかしながら人口密度が低い
地域では送配電ロスは高くなる傾向にあり、この意味でのラオス国で送配電ロスの高い要
因になっている。
出所: T&D loss(2010) : WDI, Laos(EDL), Population Density: WDI
図表 12 T&D loss (%) vs. Population density (people/km2)
1人あたり GDP(購買力平価)と電力料金(住民用)は相関関係にある。経済成長によって電
力価格上昇も必要となる。
0
5
10
15
20
25
30
0 2,000 4,000 6,000 8,000 10,000 12,000 14,000 16,000
LAOS
Vietnam Thailand
Indonesia
GDP per capita PPP(constant 2005 international $)
Average residential tariff April/2012
Philippines
Malaysia
(USD)
(US cents/kwh)
出所: Average residential tariff : JETRO April, 2012 WDI
GDP per capita PPP (constant international $): 2011 WDI
図表 13 Average residential tariff vs. GDP per capita PPP
37
1.1.4 EDLの財務分析
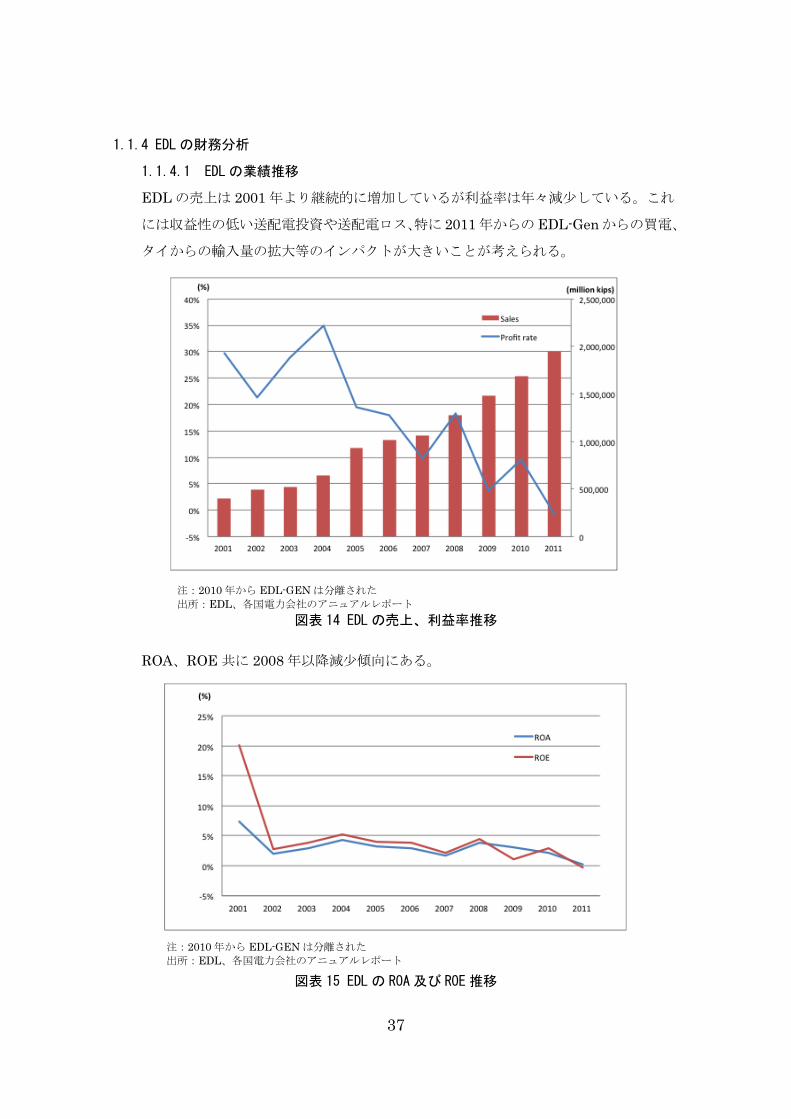
1.1.4.1 EDLの業績推移
EDL の売上は 2001 年より継続的に増加しているが利益率は年々減少している。これ
には収益性の低い送配電投資や送配電ロス、特に 2011 年からの EDL-Gen からの買電、
タイからの輸入量の拡大等のインパクトが大きいことが考えられる。
注:2010 年から EDL-GEN は分離された
出所:EDL、各国電力会社のアニュアルレポート
図表 14 EDLの売上、利益率推移
ROA、ROE 共に 2008 年以降減少傾向にある。
注:2010 年から EDL-GEN は分離された
出所:EDL、各国電力会社のアニュアルレポート
図表 15 EDLの ROA及び ROE推移
38
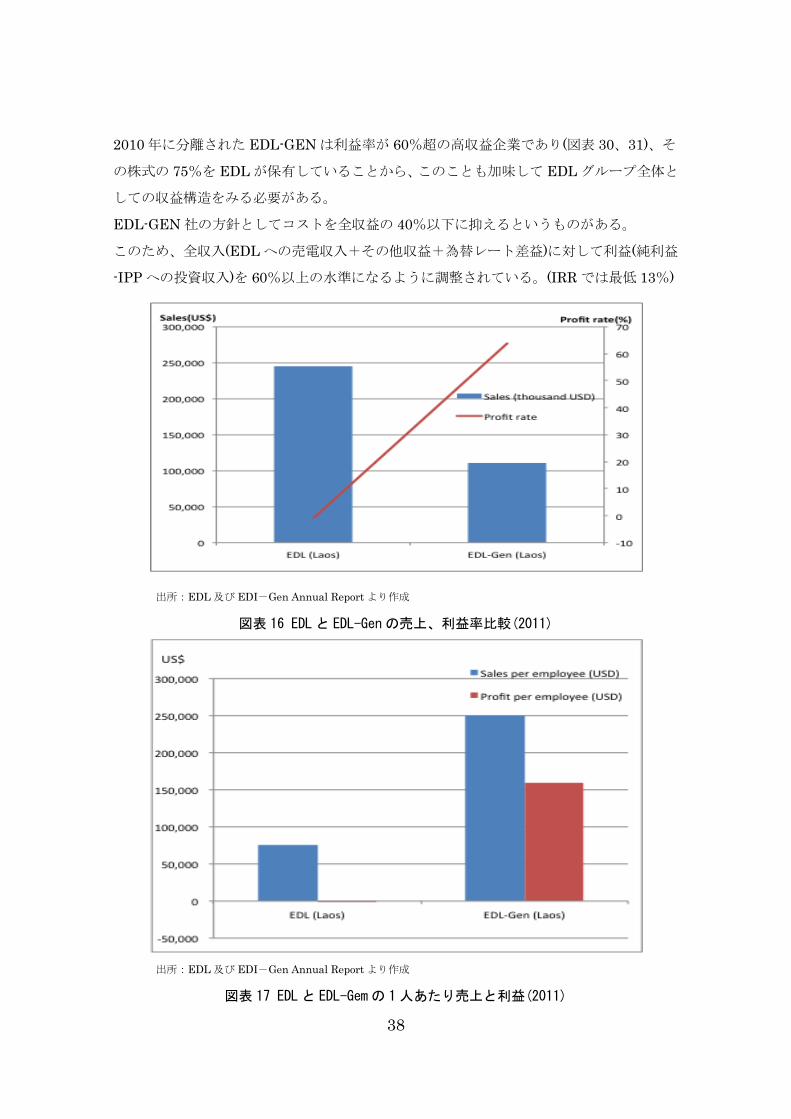
2010 年に分離された EDL-GEN は利益率が 60%超の高収益企業であり(図表 30、31)、そ
の株式の 75%を EDL が保有していることから、このことも加味して EDL グループ全体と
しての収益構造をみる必要がある。
EDL-GEN 社の方針としてコストを全収益の 40%以下に抑えるというものがある。
このため、全収入(EDL への売電収入+その他収益+為替レート差益)に対して利益(純利益
-IPP への投資収入)を 60%以上の水準になるように調整されている。(IRR では最低 13%)
出所:EDL 及び EDI-Gen Annual Report より作成
図表 16 EDLと EDL-Genの売上、利益率比較(2011)
出所:EDL 及び EDI-Gen Annual Report より作成
図表 17 EDLと EDL-Gemの 1 人あたり売上と利益(2011)
39
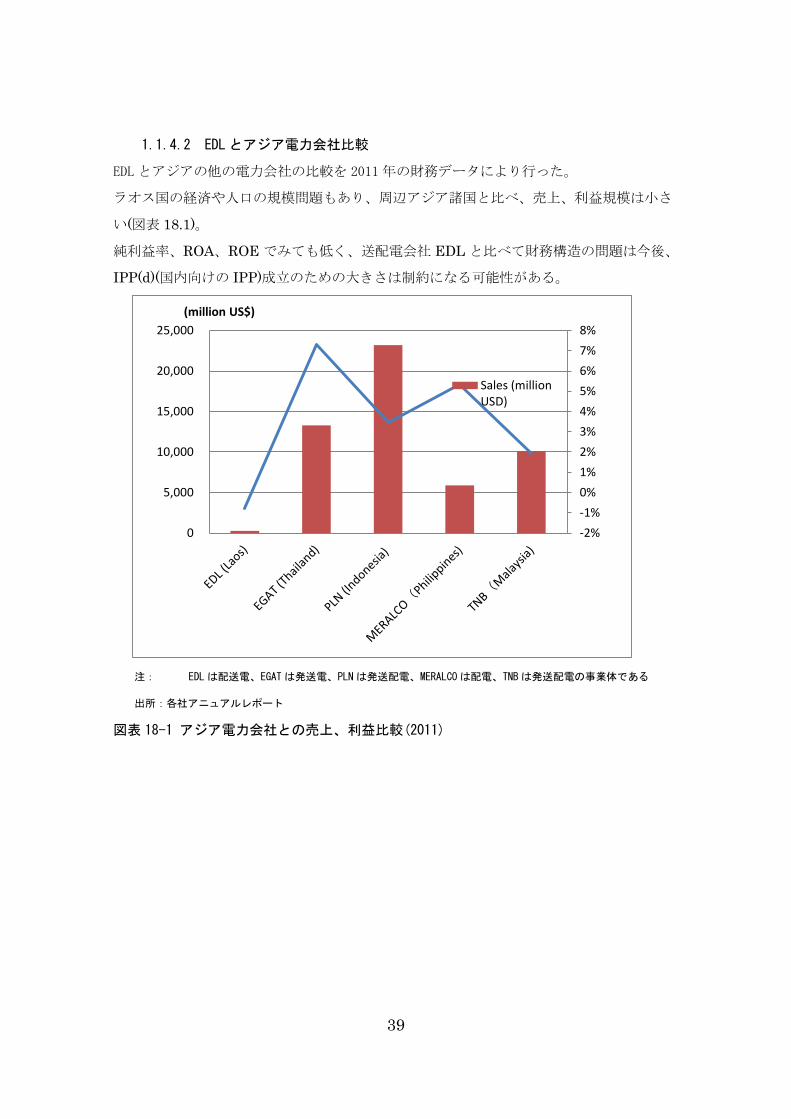
1.1.4.2 EDLとアジア電力会社比較
EDLとアジアの他の電力会社の比較を 2011年の財務データにより行った。
ラオス国の経済や人口の規模問題もあり、周辺アジア諸国と比べ、売上、利益規模は小さ
い(図表 18.1)。
純利益率、ROA、ROE でみても低く、送配電会社 EDL と比べて財務構造の問題は今後、
IPP(d)(国内向けの IPP)成立のための大きさは制約になる可能性がある。
注: EDLは配送電、EGATは発送電、PLNは発送配電、MERALCOは配電、TNBは発送配電の事業体である
出所:各社アニュアルレポート
図表 18-1 アジア電力会社との売上、利益比較(2011)
-2%
-1%
0%
1%
2%
3%
4%
5%
6%
7%
8%
0
5,000
10,000
15,000
20,000
25,000
(million US$)
Sales (millionUSD)
40
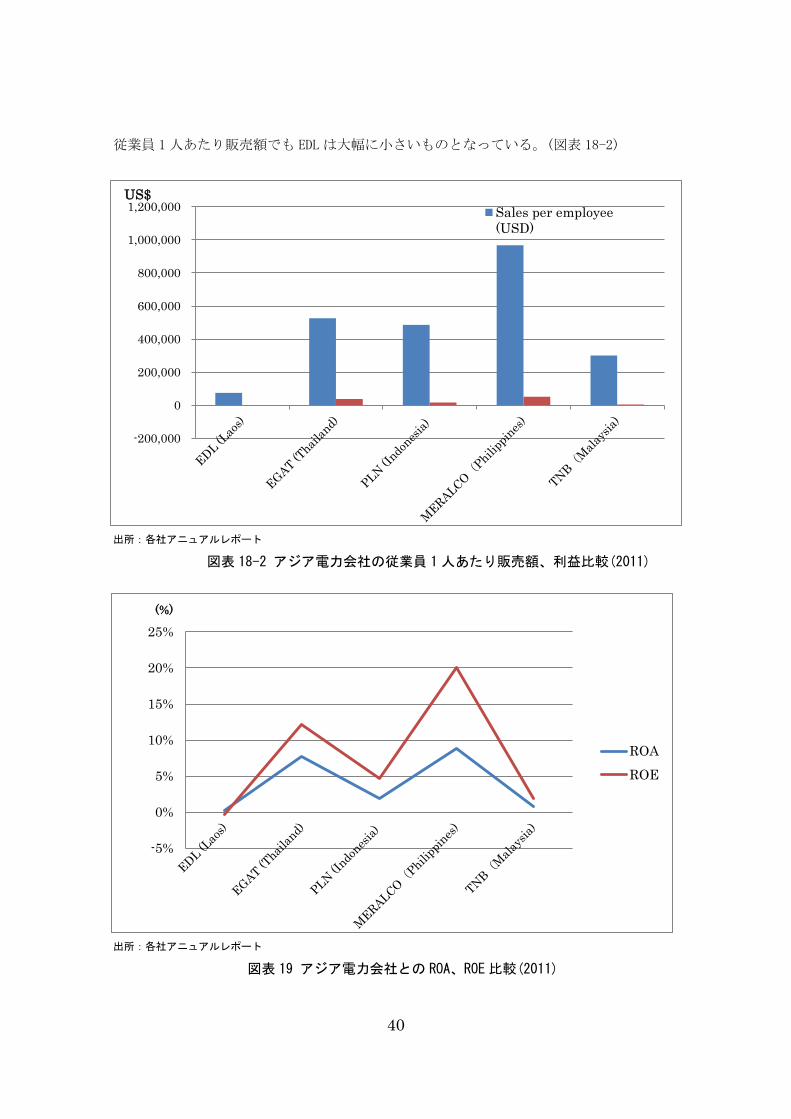
従業員 1人あたり販売額でも EDLは大幅に小さいものとなっている。(図表 18-2)
出所:各社アニュアルレポート
図表 18-2 アジア電力会社の従業員 1人あたり販売額、利益比較(2011)
出所:各社アニュアルレポート
図表 19 アジア電力会社との ROA、ROE比較(2011)
-5%
0%
5%
10%
15%
20%
25%
(%)
ROA
ROE
-200,000
0
200,000
400,000
600,000
800,000
1,000,000
1,200,000 Sales per employee
(USD)
US$
41
1.2 ラオス国電力セクターにおける主な問題点
ラオス国電力セクターにおける主な問題点は、1)国内への電力の安定供給、2)国家経済への
貢献、3)環境のそれぞれに対し、問題があげられる。
1) 国内への電力の安定供給
1-1) エネルギーセキュリティの問題
エネルギー保障では、水力発電に輸出、国家歳入上、過度に依存するリスクがあ
る。大幅な供給力があるものの、輸出向けが大半であるため乾季に輸入が増える
という国内供給力上の問題(2012 年 3 月分の輸入比率は 66%)と、国庫の収入の多
くを水力発電に関連するロイヤリティ、各種 Tax が占めるリスクである。
1-2) 投資促進にかかわるガバナンスの問題
以下 a)〜c)の問題が投資促進上の問題となっている。
a) 電力セクターガバナンスの問題
電力セクターガバナンスでは、電力セクターの統治機能が不十分 (エネルギー/電
力分野の政策立案/規制等)であり、電気事業者の事業運営能力不足 (財務健全性/
人材育成等組織運営/維持管理能力)があげられる。
特に Solicited IPP入札(シングルバイヤーが長期電源開発計画を作り、そのうえで
参入 IPPの開発時期、規模、燃料などを指定する入札方式)を行うための準備が出来
ていない。
b) 国内送電線、国際送電線への公平なアクセス
EDLの国内系統が分断され、国内を貫通した送電線網が未整備であること。対輸出
用の国際送電線も EDLが独自に整備する財政能力がないため、IPP が独自に整備せ
ざるを得ない。例えば Nam Ngum2(ナムグム 2)が自前で建設した送電線(Navon変電
所-国境の間)を Nam Ngum3(ナムグム 3)、Nam Ngiep1(ナムニェップ 1)も使えるよう
にした方が、経済性があるが託送料金(Wheeling Charge)の額を巡りまだ調整中であ
る。この例に見られるように送電線が中立であるわけなく、それを公平に使えるわ
けではない。
c) データの未整備
エネルギー政策立案、省エネ政策、水資源管理等の基礎となる各種統計データ、デ
ータベースの収集方法や更新等が未整備である。例えば、各省庁で保有するデータ
(例:電力輸出入量、額)において食い違いがみられる。
42
1-3) EDLの財務的独立性の問題
EDL の財務上の問題は EDL のオフテイカーリスクとなり、投資促進を阻害する。
利益率が低く、従業員 1 人当たりの売上、利益も周辺国と比べて低い。LRMC コス
トを下回る料金設定であり、直接の補助金はないが交差補助金(Cross-Subsidy)があ
るため料金体系が歪んでいる。
特に電気料金の設定が EDL の財務的独立性に大きな影響を与えている。電気料金
設定では以下の 3 点が大きな問題である。
1) ピーク・オフピークの設定がないこと。
輸出入はピーク料金の設定が行われているが、ラオス国内向けにピーク料金の設
定は行われていない。ピーク料金設定が行われていないため流れ込み式発電所が
増え、水の最適利用が行われにくくなる。
東南アジアではタイ、マレーシア、フィリピンで既に導入されているが時間帯別
の計量ができるメーターが必要となる。
2)セグメントごとにコストを反映した電気料金体系になっていないこと
同国は電力セクターへの直接の補助金はないが、Cross-subsidy が存在する。
3) 従量料金のみの設定である。
基本料金(Basic charge)と従量料金(Energy charge)を分けた設定もされておらず
従量料金のままである。東南アジアではカンボジアも従量料金のみの設定である。
このようにラオス国の資源配分を最適化するためにも料金制度は大幅な改正が
必要となる。
1-4) 国際収支の問題
外貨準備高が 2 ヶ月しかなく、乾季の大幅な電力輸入が必要なこともこの問題に
影響を与えている
4) 国家経済への貢献
2-1)貧困削減
国内電力供給力不足・送配電未整備、地方山間部における低い電化率等のため、ビ
エンチャンなど都市部と地方の電気普及率の差が、経済格差に影響を及ぼしている。
2-2)水資源の有効活用
水資源の最適管理がなされていない問題がある。発電、灌漑、洪水対策など水資源
を包括的に最適利用するシステムが省庁間で確立していない。
2-3)工業の発展
急速な需要増に対応する為、タイなど隣国からの輸入電力も用い対応する為、EDL
が逆ザヤになる。
43
5) 環境への配慮
環境規制の先行きが不透明なままその厳格化によって F/S時の Due diligenceが事業
開始後当てはまらなくなってしまう。結果、水力発電事業の収益性が当初予定より低
下してしまう。
石炭発電を拡大することはエネルギーセキュリティや国内外の乾季時に電力を供給
する意味で貢献度が高いが CO2の排出を増やすという問題がある。
以上の問題点を受けてラオス国の Cross-SWOT 分析を行った。
図表 20 ラオス国の Cross-SWOT分析
出所:京都大学 長山作成
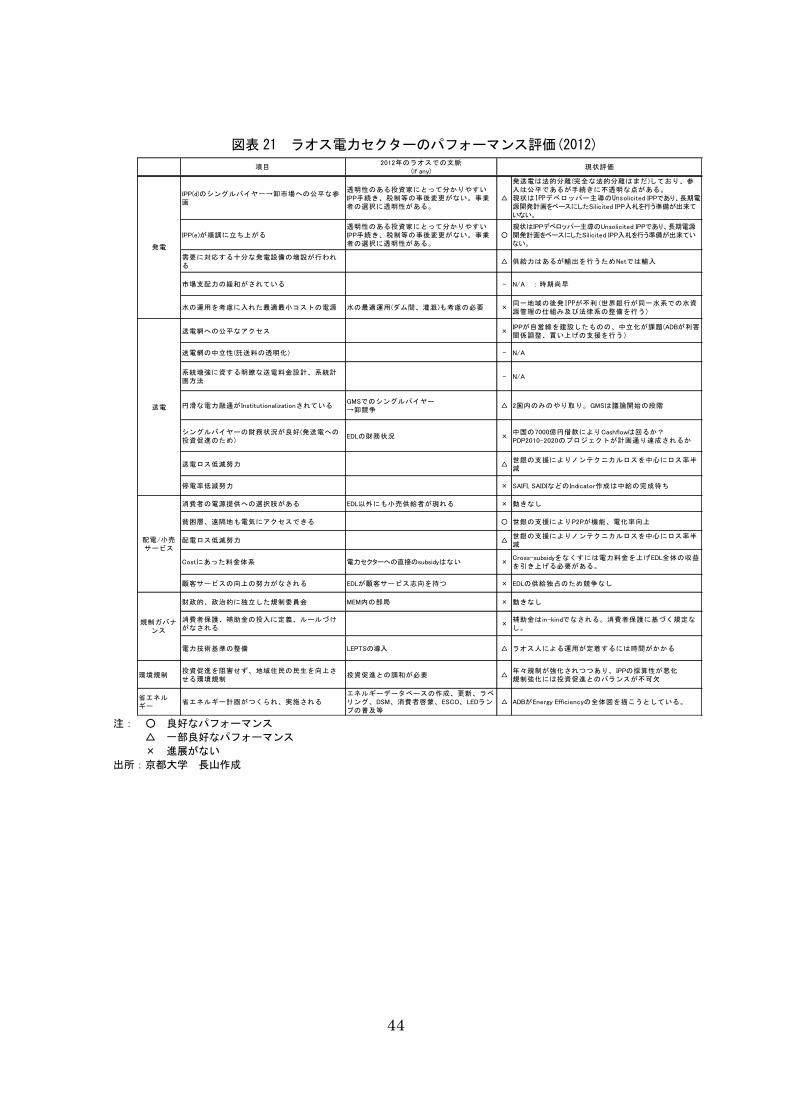
1.4 ラオス国電力セクターのパフォーマンス評価
今次調査におけるラオス電力セクターのパフォーマンス評価は下表の通りである。シ
ングルバイヤーの組織としては、発送配電のそのものにおいて、制度手続き面のガバナ
ンスの問題により、よいパフォーマンスが得られているとはいえない状況にある。
External factors 外部要因
Opportunity 機会 Threat 脅威
•周辺国(タイ、ミャンマー、ベトナム、中国)での急速な電力需要の伸び(O1)
•アジア諸国での労賃の高騰(O2)
•国内電力需要の拡大(O3)
•中国経済の巨大化(T1)
•EDLとEGAT(タイ)との電力購入契約の見直し(:タイのエネルギー政策に左右される)(T2)
Inte
rna
l fac
tors
内部要因
Stre
ng
th
強み
•豊富な水力資源による低コストの電力(S1)
•低い労賃(S2)
•豊富な鉱物資源(S3)
•電力多消費産業の誘致(S1,S2)
•石炭による発電を強化し、乾季の内外のピーク需要を狙う(S3,
O1)
•労働集約型産業の誘致(S2, O2)
•水力発電の高付加価値化を行いダム付き水力発電の設置を増やす(S1, T2)
•中国との戦略的提携(S1,S2,S3,T1)
We
ak
ne
ss
弱み
•送電線の未整備(W1)
•EDLの財務構造が脆弱(W2)
•財政赤字(W3)
•少ない人口(W4)
•投資受け入れ体制の未整備(W5)
•送電線の整備(W1, O1, O3)
•電気料金の設定の見直し(W2, O1, O2)
•水力発電輸出の拡大(W3,W4,O1)
•投資受け入れ体制の早期整備(W5,O1)
44
図表 21 ラオス電力セクターのパフォーマンス評価(2012)
注: ○ 良好なパフォーマンス
△ 一部良好なパフォーマンス
× 進展がない
出所:京都大学 長山作成
IPP(d)のシングルバイヤー→卸市場への公平な参画
透明性のある投資家にとって分かりやすいIPP手続き、税制等の事後変更がない。事業者の選択に透明性がある。
△
発送電は法的分離(完全な法的分離はまだ)しており、参入は公平であるが手続きに不透明な点がある。現状はIPPデベロッパー主導のUnsolicited IPPであり、長期電源開発計画をベースにしたSilicited IPP入札を行う準備が出来ていない。
IPP(e)が順調に立ち上がる透明性のある投資家にとって分かりやすいIPP手続き、税制等の事後変更がない。事業者の選択に透明性がある。
○現状はIPPデベロッパー主導のUnsolicited IPPであり、長期電源開発計画をベースにしたSilicited IPP入札を行う準備が出来ていない。
需要に対応する十分な発電設備の増設が行われる
△ 供給力はあるが輸出を行うためNetでは輸入
市場支配力の緩和がされている - N/A :時期尚早
水の運用を考慮に入れた最適最小コストの電源 水の最適運用(ダム間、灌漑)も考慮の必要 ×同一地域の後発IPPが不利(世界銀行が同一水系での水資源管理の仕組み及び法律系の整備を行う)
送電網への公平なアクセス ×IPPが自営線を建設したものの、中立化が課題 (ADBが利害関係調整、買い上げの支援を行う)
送電網の中立性(託送料の透明化) - N/A
系統増強に資する明瞭な送電料金設計、系統計画方法
- N/A
円滑な電力融通が InstitutionalizationされているGMSでのシングルバイヤー→卸競争
△ 2国内のみのやり取り。GMSは議論開始の段階
シングルバイヤーの財務状況が良好 (発送電への投資促進のため)
EDLの財務状況 ×中国の7000億円借款によりCashflowは回るか?PDP2010-2020のプロジェクトが計画通り達成されるか
送電ロス低減努力 △世銀の支援によりノンテクニカルロスを中心にロス率半減
停電率低減努力 × SAIFI, SAIDIなどの Indicator作成は中給の完成待ち
消費者の電源提供への選択肢がある EDL以外にも小売供給者が現れる × 動きなし
貧困層、遠隔地も電気にアクセスできる ○ 世銀の支援によりP2Pが機能、電化率向上
配電ロス低減努力 △世銀の支援によりノンテクニカルロスを中心にロス率半減
Costにあった料金体系 電力セクターへの直接のsubsidyはない ×Cross-subsidyをなくすには電力料金を上げEDL全体の収益を引き上げる必要がある。
顧客サービスの向上の努力がなされる EDLが顧客サービス志向を持つ × EDLの供給独占のため競争なし
財政的、政治的に独立した規制委員会 MEM内の部局 × 動きなし
消費者保護、補助金の投入に定義、ルールづけがなされる
×補助金は in-kindでなされる。消費者保護に基づく規定なし。
電力技術基準の整備 LEPTSの導入 △ ラオス人による運用が定着するには時間がかかる
環境規制投資促進を阻害せず、地域住民の民生を向上させる環境規制
投資促進との調和が必要 △年々規制が強化されつつあり、 IPPの採算性が悪化規制強化には投資促進とのバランスが不可欠
省エネルギー
省エネルギー計画がつくられ、実施されるエネルギーデータベースの作成、更新、ラベリング、DSM、消費者啓蒙、ESCO、LEDランプの普及等
△ ADBがEnergy Efficiencyの全体図を描こうとしている。
規制ガバナンス
現状評価
発電
送電
配電/小売サービス
項目2012年のラオスでの文脈
(if any)
45
2. ラオス国電力産業に見る電力開発指標に関するこれまでの JICAの取り組み
JICA ではこれまで、ラオス国「電力整備プログラム」に関する議論をすすめてきた。
その概要は以下のとおりである。(図表 22)
図表 22 JICAの電力整備プログラム(2012)
概要 評価指標 シナリオ
プログ
ラム目
標
経済社会開発の実現に向け
た安定的、持続的かつ効率
的な電力供給の拡大
エネルギー/電力政
策/電源開発計画の
質的向上、規制機能
強化、電気事業者サー
ビスレベル向上、国内
供給力/流通機能強
化、地方電化推進
(1) 目標達成のためのシナリオ(概要)
プログラムにおける開発シナリオを検討するに当たって
は、ラオス電力の特殊性を十分考慮する必要がある。
特に留意が必要な点は、GMS電力市場を見据えた越境イン
フラ拡充に係る中長期的視点、包蔵水力と国内需要の著
しいギャップ、隣国との容易な電力融通、送配電事業に
特化する EDLと電源開発の中心的役割を担う IPP、政府に
よる促進政策/IPP マネジメント/規制面での機能強化の
必要性、地方政府機関の技術的脆弱さ等である。これら
を踏まえ、長期的(10 年程度)な開発の方向性を見据えつ
つも、まずは短中期的(3~5 年程度)課題であるラオス国
内供給安定化を主眼にプログラムシナリオ及び指標を設
定している。
成果 1
・電力
行政監
理能力
の強化
(電力開発政策)GMS 及び国
家レベルでの優先政策を考
慮した包括的なエネルギ
ー・電力開発政策の立案能
力開発により安定的且つ効
率的な供給力を確保。
エネルギー関連統計
データベース整備、
エネルギー・電力開
発政策立案、包活的
PDP 作成、電力設備
開発メカニズムの改
善方針立案
国としての中長期的なエネルギー需給体制や環境面、 効
率面、安全保障面等エネルギー政策上の優先課題等に配
慮しつつ、計画的な電力設備整備を実現するための基本
となる開発政策・計画に対する策定支援を行う。計画的
かつ効率的な電力施設整備を実現する上で必要な正確な
統計データ整備や信頼性の高い需要予測、供給計画の提
供等にかかる支援についても併せて検討する。また、実
際の電力施設整備に際して不可欠である規制枠組 (IPP
に対する規制を含む) 整備等についても検討する。
(規制枠組みの整備運用)技
術基準に基づく適正な電力
設備の審査・検査の実施を
通した安定・持続可能な電
力供給の実現。
規制機能強化に向け
たロードマップ策
定、本省並びに地方
政府の審査・検査機
能向上
成果 2
・電力
設備整
備
(グリッド電源)自立発展
性、費用対効果、管理容易
性に配慮した電力設備整備
によるラオス政府社会経済
開発計画への貢献。
環境負荷の低い中規
模水力発電整備に向
け た 計 画 着 手
(60-100MW程度)、流
通網の効率性向上に
向けた計画着手 (送
配電網整備)
自立発展性、費用対効果、管理容易性に留意しつつ、国
内電力安定供給を確保するための電力設備整備支援を行
う。政府優先政策である南北連系線等国内基幹送電網の
強化等の基幹インフラ支援を重点としつつ、2020年に 90%
の電化違成に不可欠な配電網延伸等による最適な供給シ
ステム整備、老朽化や配電延伸により増大する電力ロス
低減のための流通設備の更新・増強等についても検討し、
安定的且つ効率的な国内電力供給体制を実現する。 (オフグリッド電源(地方電
化))小水力等再生可能工ネ
ルキーを活用した違隔地に
おける最適な電化の実現。
小水力等再生可能エ
ネルギー開発能力強
化、 地方電化の推進
成果 3
・電力
事業者
の事業
運営能
力向上
E D L等の事業運営、 財務
計画、適正技術及び顧容サ
ービス等の向上による効率
的且つ安定的電力供給の実
現。
EDL の適正投資計画
策定、顧客サービス
向上に向けた行動計
画策定
電気事業者(EDL)の事業運営、特に財務・投資、適正技術、
願容サービスに関する機能強化を行うことは、 基幹イン
フラ支援の効果発現を導く上で不可欠な取組である。具
体的には、EDLの収入規模を勘案した適正な投資計画の策
定支授、料金制度のあり方検討、停電時間低滅や料金徴
収システム等顧客サービスの課題整理と改善に向けた行
動計画策定支援を行う。
出所:JICA
46
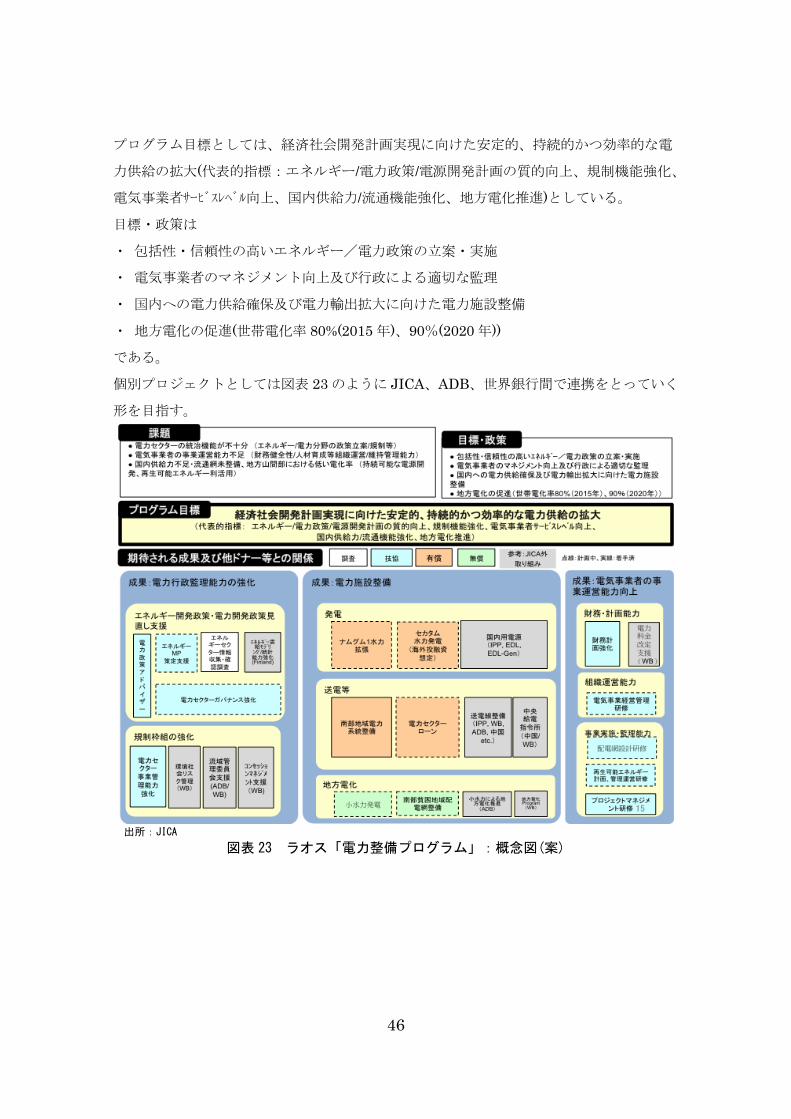
プログラム目標としては、経済社会開発計画実現に向けた安定的、持続的かつ効率的な電
力供給の拡大(代表的指標:エネルギー/電力政策/電源開発計画の質的向上、規制機能強化、
電気事業者サービスレベル向上、国内供給力/流通機能強化、地方電化推進)としている。
目標・政策は
・ 包括性・信頼性の高いエネルギー/電力政策の立案・実施
・ 電気事業者のマネジメント向上及び行政による適切な監理
・ 国内への電力供給確保及び電力輸出拡大に向けた電力施設整備
・ 地方電化の促進(世帯電化率 80%(2015 年)、90%(2020 年))
である。
個別プロジェクトとしては図表 23 のように JICA、ADB、世界銀行間で連携をとっていく
形を目指す。
出所:JICA
図表 23 ラオス「電力整備プログラム」:概念図(案)
47
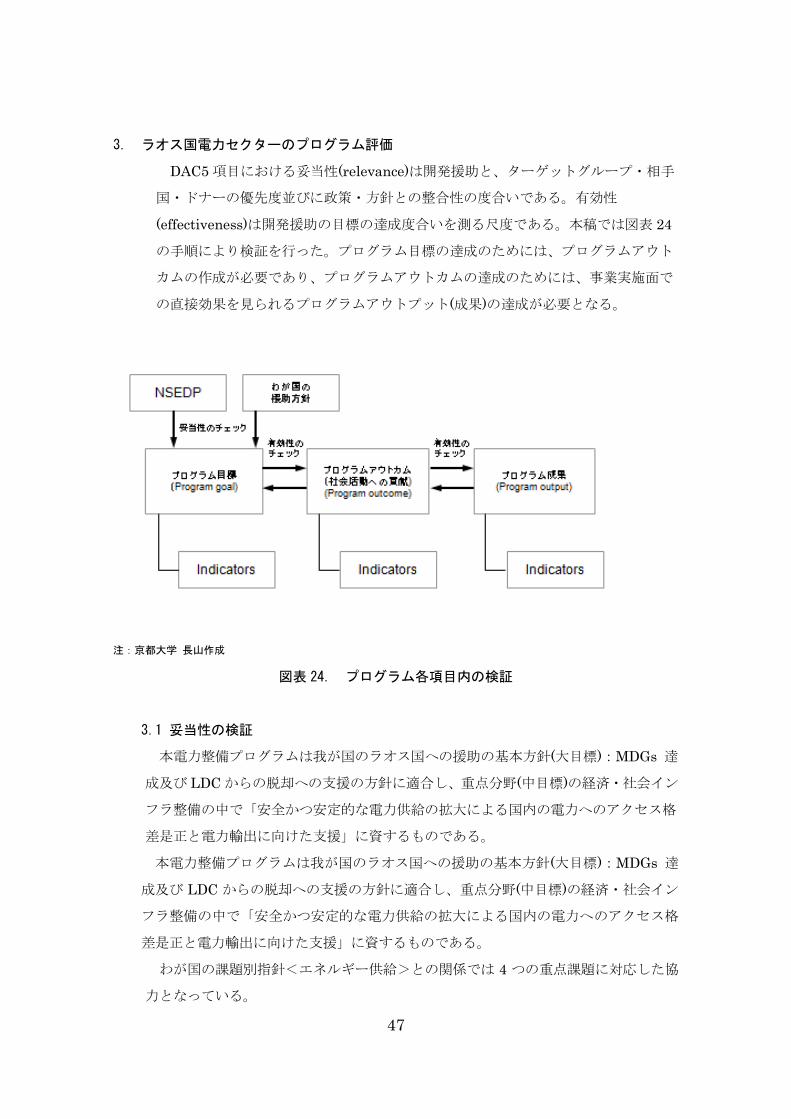
3. ラオス国電力セクターのプログラム評価
DAC5 項目における妥当性(relevance)は開発援助と、ターゲットグループ・相手
国・ドナーの優先度並びに政策・方針との整合性の度合いである。有効性
(effectiveness)は開発援助の目標の達成度合いを測る尺度である。本稿では図表 24
の手順により検証を行った。プログラム目標の達成のためには、プログラムアウト
カムの作成が必要であり、プログラムアウトカムの達成のためには、事業実施面で
の直接効果を見られるプログラムアウトプット(成果)の達成が必要となる。
注:京都大学 長山作成
図表 24. プログラム各項目内の検証
3.1 妥当性の検証
本電力整備プログラムは我が国のラオス国への援助の基本方針(大目標):MDGs 達
成及び LDC からの脱却への支援の方針に適合し、重点分野(中目標)の経済・社会イン
フラ整備の中で「安全かつ安定的な電力供給の拡大による国内の電力へのアクセス格
差是正と電力輸出に向けた支援」に資するものである。
本電力整備プログラムは我が国のラオス国への援助の基本方針(大目標):MDGs 達
成及び LDC からの脱却への支援の方針に適合し、重点分野(中目標)の経済・社会イン
フラ整備の中で「安全かつ安定的な電力供給の拡大による国内の電力へのアクセス格
差是正と電力輸出に向けた支援」に資するものである。
わが国の課題別指針<エネルギー供給>との関係では 4 つの重点課題に対応した協
力となっている。
48
1)持続的経済発展を確保するための電力の安定供給 (総合エネルギー政策の
立案、電力開発計画の策定、発送配電施設の計画作成・建設及び運用維持
管理、電力技術基準の作成、電力分野技術者の育成)
2)人間の安全保障の視点からの地方電化の推進
3)電力セクター改革に伴う制度設計
4)環境に配慮したエネルギー供給
特に上記 1)に対しては「Data collection Study on Energy Sector in Lao PDR(2012)」
ではラオス国の電力・エネルギー分野における基礎データを整備した。「Project
Improvement of the Government Mechanism for Sustainable Power Development
Planning(2013 年終了見込み):以下セクターガバナンス強化プロジェクト」にて、本
格的な国家長期電力開発計画(NPDP: National Power Development)立案支援の準備
を行っている。
「電力セクター事業管理能力強化プロジェクト: Improvement of Power Sector
Management(IPSM):(2013)」ではラオス電力技術基準(LEPTS: Lao-Electric Power
Technical Standard)を導入するための支援プロジェクトを行っている。
これらを通じて同国の電力分野技術者の養成を図ってきた。
2)及び 4)では「小規模水力開発ポテンシャル調査に対する技術支援(水力計画調査)」
により、地方電化及び環境に配慮したエネルギー供給を推進している。
ラオス国の政策との整合性では本プログラムの目標である「経済社会開発実現に向
けた安定的、持続的かつ効率的な電力供給の拡大により国民所得(GDP)の向上を図る」
は、同国の第 7 次社会・経済開発計画 National Socio-Economic Development Plan の
(2010-2015 年)の中における基本政策である
① 送配電線の延長及びオフグリッドにおける地方電化により、電化率を向上させる。
② 増加する電力需要を満たすために、国内供給力を増強させる。
③ EDL の運営を商業原理に基づき適正化する。
等に合致する。しかしながら、プログラムアウトカムとして設定した
i) 電力の安定供給
ii) 国家経済への貢献
iii) 環境配慮
を考慮すると、その上位性から現在のプログラム目標を「経済社会開発実現に向け
た安定的、持続的かつ効率的な電力供給の拡大を通じてラオス国の実質国内総生産
(GDP)の向上を図る」と変更することが望ましい。
この目標設定の変更により、本プログラム目標は第 7 次社会・経済開発計画(2010-2015
49
年)の「少なくとも GDP 成長率年率 8%及び 1 人当たり GDP が 1700 ドル以上を目指
す」「2015 年までに MDG を達成し、2020 年までに LDC を脱する為の技術導入や環
境の整備を進める」という目標に適合するものとなる。
3.2 有効性の検証
2-1) プログラム目標とプログラムアウトカム(社会経済活動)の整合性
プログラムアウトカムである電力の安定供給、国家経済への貢献、環境への
配慮は本プログラムの有効性、妥当性の検証をしたところ互いに整合が取れて
いる(図表 24)。
電力の安定供給(Stable supply of electricity)によりエネルギーセキュリティ、
投資促進、EDL の財務的独立性、輸出を通した国際収支への貢献が図られるべ
きである。国内への低廉な電力供給や、水資源の有効活用を通じて工業生産高
や農業生産高が上がり、経済格差の是正、貧困削減に寄与することで国家経済
への貢献(Contribution to National Economy)する。しかしながら、CO2、水資
源管理を含めた環境への配慮(Consideration to Environment)は重要であり、
プログラム目標達成にはこの点が考慮されなければならない。
2-2) プログラムアウトカム(Outcome)とプログラム成果(Output)の整合性
図表 24 で見られるように、プログラム成果の結果、プログラムアウトカム
が達成できるのであり、この意味で両者の整合性は取れている。
アウトプット(成果)1 の「電力行政管理能力の強化(Reinforcement of electricity
administrative management capacity)」は効率的な電力セクターの再編(独立した
電力規制局の設立を含む)を通じて電力の安定供給に資することになる。特にエネル
ギー開発政策・電力開発政策見直し支援(Formulation comprehensive energy
development policy and electric power development policy)は直接 EDL-Gen、
IPP(d)、IPP(e)の電源計画に大きなインパクトを与えることになる。規制枠組みの
強化(Strengthening of regulatory framework)は、EDL の財務体質改善や投資促進
を通じた電力投資の拡大、水資源の有効管理を通じて電力供給力を拡大することに
なる。
アウトプット(成果)2 の「電力施設整備(Power facilities)」は、その物理的な設備
の形成により電力の安定供給に資する。しかしながら環境規制に対して電力設備の
形成は環境配慮とマッチしたものでなければ国としてのバランスのとれた発展は望
めない。電力施設整備(Power Facilities)は発送配電、地方電化における供給力拡大、
50
送配電ロス低減、GMS との連結による送配電効率化を通じて電力の安定供給に貢
献することになる。
アウトプット(成果)3 の「電気事業者の事業運営能力向上(Enhancement of
business administration capability for electricity business undertakers)」は、そ
の効率的な事業体の構築により電力の安定供給に資することになる。財務・計画能
力(Financial and Planning capacity)、組織運営能力(Organization management
capacity)、事業実施・監理能力(Project implementation and Supervision capacity)
はEDLの事業運営能力の向上を通してEDLの財務体質の強化につながることにな
る。
開発戦略への貢献(指標についての考え方)ではラオス国においては数値目標が電
化率と再生可能エネルギー導入比率の 2 つしか存在せず、今回「ラオス国電力セク
タープログラムに関する開発指標等評価」にてプログラム評価分析を行ったことに
よりアウトプット、アウトカムそれぞれの Indicator(定性値を含む)の設定を行うと
ともに両者間の関係性を明らかにすることが出来た。今後は今回設定された開発戦
略目標(Indicator)に対して、他援助機関と協力し、その目標達成のための事業実施
とモニタリングが必要となる。
2-3) 世界銀行グループ、ADB との連携
世界銀行グループ、ADB との連携については JICA を含むそれぞれの機関における
人員体制、投入資金、プロジェクトの進捗がまちまちであり、協力プログラム目標達
成のためのシナリオは適切に設定されているとは客観的に認めがたい。プログラムに
一貫性を持たせるには、案件間の計画・実施の段階に於いて他援助機関との緊急な連
携コミュニケーションが必要である。例えば、
4). 水資源の有効管理では世界銀行の水資源法整備プロジェクト及び流域管理/モ
デリング支援プロジェクトと JICA の「国家発電計画 NPDP プロジェクト(実
施予定案件)」
5). 投資促進のためのガバナンス強化では、世界銀行の「IPP 契約管理プロジェク
ト」と JICA の「電力セクターガバナンス強化プロジェクト」
6). 小水力発電への支援では世界銀行の小水力民間投資促進、ADB の小水力 F/S
支援、JICA の「小規模水力開発ポテンシャル調査に対する技術支援(水力計画
調査)」
がより連携されるべきである。
51
3.3 成果指標項目の再検討
当初の評価指標に関し、有効性の観点から以下の指標を付け加えた。
成果 1:電力行政管理の監理強化
独立した規制委員会の設立、コストを反映した料金設定、経済のバランスのとれ
た発展、環境規制を加えた。
成果 2:電力設備整備
ピーク時間帯、乾季での中小規模(60-100MW)水力発電設備を加えた。
成果 3:電力事業者の事業運営能力向上
事業運営能力向上の数値目標として、送配電ロスの低減、料金回収率の向上、従業
員あたり売上、従業員あたり利益を加えた。
52
出所:JICA資料より京都大学 長山作成
図表 25 本プログラムの妥当性、有効性の検証
Program goal
Program Outcome Program Output
Energy Security (Stable supply to meet domestic needs)
Poverty reduction
Consideration to environment
Investment promotion
Financial independence of EDL
Evaluation indicators
•Annual import ratio•Self-sufficiency ratio by EDL in dry season•Revenue from Hydro electric as a proportion of total government revenue•Export value of hydro as a proportion of total export
•Affordability indicators•Access indicators•Gini co-efficient•Residential electrical consumption
•CO2 emission per capita
•Number of IPP under PPP scheme established•FDI in electric sector increased•Establishment cost reflective tariffs
•Financial independence indicators
Enhancement of stable, sustainable and efficient electric power supply for realization of socio-economic development plan for increasing GDP
1. Reinforcement of electricity administrative management capability
2. Power facilities
3. Enhancement of business administration capability for electricity business undertakers
Formulation comprehensive energy development policy and electric power development policy
Strengthening of regulatory framework
Power generation (Large scale hydroelectric)
Power transmission
Rural electrification (small / mini-hydro)
•Tariff collection efficiency•Draw up optional investment plan by EDL•Draw up action plan to improve customer service•T&D loss
Effective utilization of water resources
•Increase in agricultural production•Irrigation electrical consumption
Industrial development •Industrial products per capita•Industry and Commercial electrical consumption
•Arrangement of energy related statistical database, formulation energy/ power development policy formulate comprehensive PDP. •Formulating policy on improvement of electricity facilities development.
•Draw up a roadmap that aims at reinforcement of regulatory function. (Preparation for establishing Independent regulatory authority•Enhancement of examination and inspection function of the ministry and local governments (LEPTs, environmental regulation. Definition of rules concerning consumer protection, allocation of subsides, are prepared. Environmental regulation, Establishment of cost-reflective tariffs, Equal access to transmission line.)
•Starting plans (about 60~100MW) for establishing medium sized hydro power plants in corresponding to peak hours and/or dry season.•Setting plans for increasing efficiency of power transmission and distribution system (maintenance of transmission and distribution network).
•Reinforcement of renewable energy development including mini hydro power plants, promotion of local electrification
Financial and planning capacity
Organization management capacity
Project implementation and supervision capacity
Evaluation indicators
•Sales per employee•Profit per employee
Stable supply of electricity
Contribution to National Economy
Environment
SynergeticConflict
•Interconnection to GMS
Balance of payment•Fureign currency reserve•Balance of payment
53
4. 電力開発指標の提案
4.1 電力開発指標に関する先行研究
エネルギー、電力について IAEA(2005)等を中心に Indicator 作りが行われてい
る。ADB/JBIC/WB(2005)はアジアのインフラ整備に関連して 37 のエネルギー
Indicator をデザインした。Grubb et al (2009)はエネルギーセキュリティにつき
HHI(Herfindahl-Hirschman Index)等、数値で計測可能な Indicator を提案して
いる。
Konstantiuns et al (2008)は Sustainable energy policy indicator について方法
論(Methodologies)、Indicator の開発者/出所(developer)を整理したあと、持続性
のある指標(Sustainable indicator)選択の基準(criteria)として Appropriateness,
Completeness、Flexibility の 3 つの要素を挙げた。Appropriateness は、Realistic
description, Transparency, Simplicity, Ability of comparison の各指標を挙げて
いる。Completeness は Technical and scientific adequacy, International
acknowledgement の各指標を挙げている。Flexibility は, Easy calculation,
Existence of right quality data, Ability of mapping changes, Easy connection
with other models が必要な Indicator とした。また、Security of energy supply、
competitive energy market、environmental protection のそれぞれの項目につい
て Energy Indicator を設定した。
Bert et al (2009)では、APERC(2007)が行った 4 つの分類;
Availability (elements relating to geological existence)、Accessibility
(geopolitical elements)、Affordability (economical elements)、Acceptability
(environmental and societal elements)を長期の SOS (Security of Supply)の観点
から分類整理を行なっている。エネルギーセキュリティを見る簡単に取れる
Simple indicator として Resource estimates、Reserves to production ratios、
Diversity indices、Import dependence、Political stability、the energy price、
mean variance portfolio theory、share of zero-carbon fuels、Market liquidity、
demand-side indicators を取った。またエネルギーセキュリティを見る複合指標
(Aggregated indicators)として Shannon index based、The IEA’s energy security
index、Supply-demand index、Willingness to pay、oil vulnerability index 等の
指標を挙げている。
1カ国のSecurityの観点からの Indicatorを扱ったものは Jutamanee. M and S.
Kumar (2012) がある。同論文ではタイ国の Security に焦点をあて、Indicator を
設立し、1986 年から 2030 年の 45 年間にわたり Monitoring を行う。
54
3 つのシナリオ
“High economic growth and least cost option (HEGR & LC)”
“Low carbon society (LCS)”及び“Current Policy (CP)”
をつくり、さらにそれぞれのシナリオの場合、どのような追加的政策(例えば省エ
ネ)などが必要かを提示している。
同様にメキシコのエネルギー政策と Sustainability indicators をみたものに
Claudia et al (2012)がある。8 つの Indicator(Autarky1, Robustness2,
Productivity3, Electricity coverage4, Coverage of basic energy needs5, Relative
purity6, Renewable energy sources7, Depletion fuels8)より総合的な
Sustainability Indicators を構築し、1990 年と 2008 年を比較した。結果、2008
年は 1990 年より less sustainable な結果となった。
電力セクターパフォーマンス指標としての研究では、Jamasb et al.(2004) は
“Core Indicators for Determinants and Performance of Electricity Sector in
Developing Countries” で は電力セクターにおいて広い範囲を代表する約 150
個の指標を提案した。
Jamasb et al(2004)では指標(indicator)について、以下の点に基づいて評価を
行うことを提案している。1)比較可能性(comparability)、一貫性(consistency)と
可測性(measurability) 2)政策立案との関連性と政策変更への感度(relevance to
policymaking and sensitivity to policy change) 3)データ収集方法による異な
るコストと便益(cost and benefits of different forms of data collection methods)
4)データソースの選択によって発生する暗黙のトレードオフ(tradeoffs that are
implicit in the choice of data sources) 5)主要指標(core indicators)がグローバル
に通用できること、また多国間の比較を可能にし、途上国のコミュニティーが途
上国を効率的に援助する為に取るべき戦略を効率的に提案できること等である。
同報告書ではさらに以下のような属性を持つことが電力セクターの指標におい
て望ましいと論じられている。(Jamasb et al (2004))
援助組織の電力セクターにおける目標と密接に関連すること
1 Autarky: Energy supply for a long-term period would be guaranteed by own resources. 2 Robustness: Economy vulnerability in relation to related foreign changes to energy sector. 3 Energy Productivity: The inverse of energy intensity. 4 Electricity Coverage: The share of dwelling with electricity on the national territory. 5 Coverage of basic energy needs: Final energy consumption of residential sector x transportation efficiency
given by the energy economic information system from Latin-American Energy Organization 6 Relative Purity in the use of energy: Carbon dioxide emissions 7 Renewable energy sources: The share of renewable energy source in relation to national energy consumption 8 Deletion of fossil funnels quotient between oils reserves and gross annual oil production.
55
(be closely connected with aid organizations’ objectives in the power sector)
多国間の比較が可能であること
(be suitable for cross-country comparison)
一般的に容認されており、比較的容易に測定可能であること
(have generally accepted conventions and be relatively easy to measure)
定義、測定方法、データ収集が一貫していること(時系列に比較可能であること)
(be consistent in definition, measurement method and data assembly (should
be comparable over time))
現実的かつ合理的なコストと努力で可能であること
(be available at realistic and reasonable levels of cost and effort)
信頼が出来、理想的であり、相互にクロスチェックされていること
(be reliable and ideally, cross-checked)
4.2 開発指標の提案
4.2.1 開発指標に対するアプローチ
本業務では JICA により作られたラオス国「電力整備プログラム」に基づき、はじ
めに個別事業により得られる成果(output)についての Indicator、次に成果の結果
得られる outcome、最後にプログラム目標の Indicator についてそれぞれの指標を
構築した。
尚、本業務では整備された Indicator に対し、1)データ入手可能性(Accessibility)、
2)データ比較可能性(Comparability)、3)データの検証可能性(Verifiability)、4)ア
ウトカム・アウトプット等との関連性の 4 つの視点から個別に評価を行った。これ
に加えてラオス国特有の状況や問題も考慮に入れた。
1) データの入手可能性についてはラオス国の場合、統計データが整備されていな
いことが多く、例えばラオス中央銀行の公式統計では 2011 年の電力輸出額は
75.97(百万ドル)であるが、NERI がマクロ予測に使うデータでは 280(百万ド
ル)、MEM の年報(2011-2012)では 435(百万ドル)となっている。このように、
本来通関で把握すべきデータが正しく捉えられていないことは問題である。投
資を促進すべき MPI 及び国家統計局にて各省庁からのデータを一元的に管理
すべきである。
2) データ比較可能性(Comparability)はラオス国とベンチマークとして周辺諸国
との比較ができやすいこととした。WDI、EIA などのデータは国際比較ができ
るため、これらを使えればそれを使用することとした。
56
3) 検証可能性(Verifiability)は今後モニターを行っていくに際し、同じデータが
今後も継続して入手可能でありそうか等を考慮した。例えば、電力輸入量のデ
ータ入手には制約がある。電力輸入については NERI も正確な予測が出来て
いないとしている。これは、国内送電線網の整備の状況如何によって、ベトナ
ム、中国、タイからの輸入量に影響があるからである。
4) アウトカム・アウトプット等との関連性は、互いに Irrelevant な指標の場合、
実務的に意味のある指標とならない。1)のデータ入手可能性との関連もあるた
め、定性的な観点からの指標も入れた。
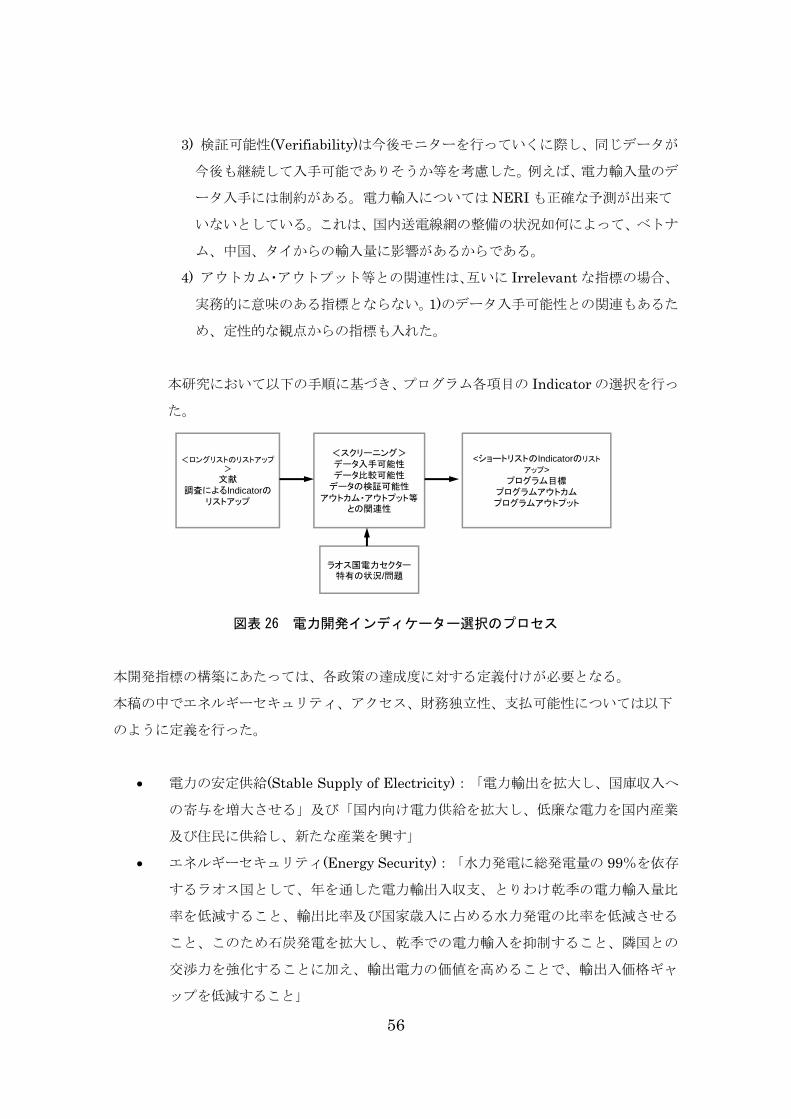
本研究において以下の手順に基づき、プログラム各項目の Indicator の選択を行っ
た。
<ロングリストのリストアップ>
文献調査によるIndicatorの
リストアップ
<スクリーニング>データ入手可能性データ比較可能性
データの検証可能性
アウトカム・アウトプット等との関連性
ラオス国電力セクター特有の状況/問題
<ショートリストのIndicatorのリスト
アップ>
プログラム目標プログラムアウトカムプログラムアウトプット
図表 26 電力開発インディケーター選択のプロセス
本開発指標の構築にあたっては、各政策の達成度に対する定義付けが必要となる。
本稿の中でエネルギーセキュリティ、アクセス、財務独立性、支払可能性については以下
のように定義を行った。
電力の安定供給(Stable Supply of Electricity):「電力輸出を拡大し、国庫収入へ
の寄与を増大させる」及び「国内向け電力供給を拡大し、低廉な電力を国内産業
及び住民に供給し、新たな産業を興す」
エネルギーセキュリティ(Energy Security):「水力発電に総発電量の 99%を依存
するラオス国として、年を通した電力輸出入収支、とりわけ乾季の電力輸入量比
率を低減すること、輸出比率及び国家歳入に占める水力発電の比率を低減させる
こと、このため石炭発電を拡大し、乾季での電力輸入を抑制すること、隣国との
交渉力を強化することに加え、輸出電力の価値を高めることで、輸出入価格ギャ
ップを低減すること」
57
アクセス (Access):「潜在的な消費者に対して十分に途切れない電力が供給され
る消費者の割合」
財務的独立性 (Fiscal dependence of the sector):「ROA などの財務比率が健全
であり合理的な電力供給を維持する為の政府からの、もしくは顧客セグメント間
での経済的支援を最低限に抑えていること。このため国内向け電力供給への投資
促進を行うためにはシングルバイヤーEDL が強い財務基盤を持つことが必要であ
り、そのため電力料金を顧客セグメント別にコスト見合いで上げる」
支払可能性 (Affordability):「所得からみて電力料金を支払える可能性」
4.2.2 本業務での Indicator の採用
本業務では Accessibility, Comparability, Verifiabilityの観点からプログラム目標、
プログラムアウトカム、プログラムアウトプットにおいて評価を行った。(各 Indicatorへ
の評価の詳細は参考資料 5を参照。)
4.2.2.1 プログラム目標
プログラム目標は「経済社会開発計画実現に向けた安定的、持続的かつ効率的な電力
供給の拡大によりラオス国の国民所得向上を図る」であり、指標は GDP per capita、
Power consumption per capita (kWh)の 2 つとした。
同国では今後輸出の多くの部分を電力輸出が占めることが予想されている。電力分野
への支援が効果的に行われ、電力投資により、国内供給、輸出が拡大し、輸入が減少す
れば単純なマクロ恒等式(Y = C(消費) + I(民間投資) +G(政府投資) + EX(輸出) - IM(輸
入))で示されるように、GDP 拡大に大きなインパクトを与えることになる。
図表 27 プログラム目標(program goal)の Indicator
58
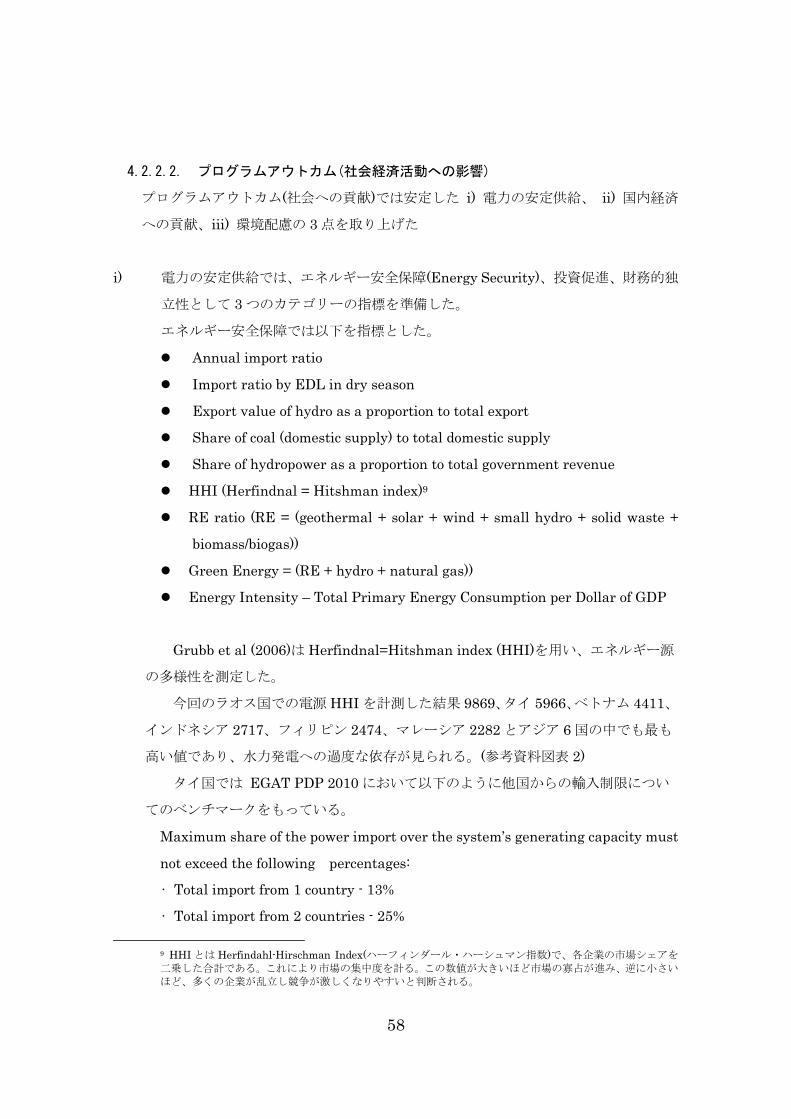
4.2.2.2. プログラムアウトカム(社会経済活動への影響)
プログラムアウトカム(社会への貢献)では安定した i) 電力の安定供給、 ii) 国内経済
への貢献、iii) 環境配慮の 3 点を取り上げた
i) 電力の安定供給では、エネルギー安全保障(Energy Security)、投資促進、財務的独
立性として 3 つのカテゴリーの指標を準備した。
エネルギー安全保障では以下を指標とした。
Annual import ratio
Import ratio by EDL in dry season
Export value of hydro as a proportion to total export
Share of coal (domestic supply) to total domestic supply
Share of hydropower as a proportion to total government revenue
HHI (Herfindnal = Hitshman index)9
RE ratio (RE = (geothermal + solar + wind + small hydro + solid waste +
biomass/biogas))
Green Energy = (RE + hydro + natural gas))
Energy Intensity – Total Primary Energy Consumption per Dollar of GDP
Grubb et al (2006)は Herfindnal=Hitshman index (HHI)を用い、エネルギー源
の多様性を測定した。
今回のラオス国での電源 HHI を計測した結果 9869、タイ 5966、ベトナム 4411、
インドネシア 2717、フィリピン 2474、マレーシア 2282 とアジア 6 国の中でも最も
高い値であり、水力発電への過度な依存が見られる。(参考資料図表 2)
タイ国では EGAT PDP 2010 において以下のように他国からの輸入制限につい
てのベンチマークをもっている。
Maximum share of the power import over the system’s generating capacity must
not exceed the following percentages:
• Total import from 1 country - 13%
• Total import from 2 countries - 25%
9 HHI とは Herfindahl-Hirschman Index(ハーフィンダール・ハーシュマン指数)で、各企業の市場シェアを
二乗した合計である。これにより市場の集中度を計る。この数値が大きいほど市場の寡占が進み、逆に小さいほど、多くの企業が乱立し競争が激しくなりやすいと判断される。
59
• Total import from 3 countries - 33%
• Total import from 4 countries - 38%
投資促進として
Number of IPP projects under PPP scheme established
FDI in Electric Sector
Debt equity ratio (= Debt to Equity)
Share of IPP(e) / Total capacity
Share of IPP(d) / Total capacity
但し、FDI は認可ベースでしかデータが取れないため実際の投資が行われたデータ
がとれないなど制約もある。
財務的独立性として
Self-Financing Ratio = Operating Cash Flow less Debt Service / Capital
Investment (%).
ROA=Profit before income taxes / Total Assets
ROE = Net profit / Total Equity
Debt ratio = Total Liabilities / Total Equity and Liabilities
Profit ratio = Net profit / Total revenue
Debt service ratio
Long run MC(長期限界費用) / Average Tariff : ratio
Subsidy/Average Electricity Tariff
Establishment of cost reflective tariffs (Ratio of industrial users to
residential users)
Receivable Turnover Period (day)
を指標とした。
尚、財務独立性がアウトプット(Output)ではなく、アウトカム(Outcome)にあ
るのは、EDLの事業体質改善には、EDL自身の経営努力によるものの他に、電
力料金設定、EDL-GEN からの卸買い取り価格の設定、タイ等隣国からの輸入政策
など、複合的な要因が関係するためである。
IDA の Tariff study update project (Final Report:2009)では LRMC(2007 年
-2016 年: before loss: Add through level) は配電の low voltage level で
661kips/kWh、送電レベルで 534kips/kWh、発電レベルで 448 kips/kWh としてい
る。Cost of service はすでに LRMC を上回っているとし、純固定資産に対する 5%
60
の利益率を確保するには、電気料金は 2016 年に平均で 1270 kips/kWh は必要であ
ると提言した。(2011 年の現状は 647 kips/kWh、New Electricity Price (2012 年 9
月 3 日の MEM 発出)でも 2016 年に 700 kips/kWh としている。)
世界銀行の“Implementation Completion and results report of the Rural
Electrification program” (2012) では EDL tariff plan (2012) を元に EDL の Cost
of supply を 959kip/kWh (11.9 US cents / kWh) (2009) 、946kip/kWh (11.8 US
cents / kWh) (2010) 、976kip/kWh (12.2 US cents / kWh) (2011) としている。
尚、世界銀行/IDA(2009)では Self-financing ratio > 30%、Debt equity ratio < 1.5、
Debt service ratio > 1.5 の 3 つの covenants を設けている。(その後 2013 年 3 月 26
日の世界銀行/IFC との面談でも同 covenants に変更がないことが確認された。)
売掛金の回転期間が 85 日(2.3%)と長いのは政府機関や灌漑設備の電気料金支払
いに関する制度的なものである。直接財務省(MOF)から EDL に支払う制度にする
等、短絡化(45 日(2.2%))をターゲットとしている。
ii) 国家経済への貢献としては、貧困削減(Poverty reduction)、水資源の有効利用
(Utilization of water resource)、産業の発展(Industrial development)をあげた。
貧困削減としては Affordability, Accessibility, Gini-係数を上げた。
Affordability は各種の指標を挙げたが、現状のラオス国では関係するデータがクリ
アーな形で存在していない。家計に占める電力の消費は、 Department
Statistics(2007/2008)によると、”Water and electricity”の項目で 2007/2008 年
で全消費に占める割合の 1.5%(33,200kip/月・世帯)であった。Urban では 2.2%
(65,300kip/月・世帯)Rural では With Access to Road で 1.1%(21,000kip/月・世
帯)、Without Access to Road で 0.4%(6,200kip/月・世帯)であった。
EDL と世界銀行が推進している People to people project で 70 万 kip(85 ドル)を一
家庭当たり配電線に新規につなげる時に支援を行う事、借りた家庭は月に 2 万キッ
プを返済することが出来る能力を示す事がベンチマークとなりうる。
世界銀行は同行レポート”Implementation Completion and Results Report of the
Rural Electrification Program(2013)”で WTP (Willingness to Pay)を 97.716 kip/
月・世帯としている。
Lao Institute for Renewable Energy では同 NGO がプロジェクトを行う村落で、
Willingness to pay の内容を聞いており、それによりケロシンによる電化のプロジ
ェクトでは 60,000-80,000kip/月・世帯、Pico 水力、ソーラーの場合 18,000
-30,000kip/月・世帯の返済としてプロジェクトを組んでいる。
61
Accessibility は以下の指標を挙げた。
Household Access (%) = Households with a Commercial Connection / Total
Households
Village Access (%) = Communities with Commercial Supply / Total
Communities
水資源の有効利用としては
Agriculture value added (constant 2000 US$)
産業発展のベンチマークとして
Industry value added (constant 2000US$)
をとりあげた。
国家収支改善としては
Import of electricity as a proportion to total import
Export of electricity as a proportion to total export
をとりあげた。
電力輸出により国の歳入が増えると投資勘定(Capital expenditure)で使える額が増
え、国全体で被益することになる。
DSR(元利支払いの輸出に対する割合)は 2.3%と近隣のベトナム、カンボジアに比べ
て良好であるが、外貨準備高が 2 カ月と少ないため、4 か月分程度は必要なため、
電力輸入を抑え、電力輸入を抑え電力輸出を拡大する努力は必要である。
環境としては
CO2 emission kg per 2000US$ of GDP
CO2 emission metric ton per capita
をとりあげた。
環境関係の Indicator の候補としては今回挙げた CO2(Climate change の要素)他に
も Air Quality、 Water Quality、Soil Quality、Forest/Biodiversity などがある
(Grubb et al (2006), IAEA (2005))が CO2以外はラオス国のデータ入手は現状難し
い。
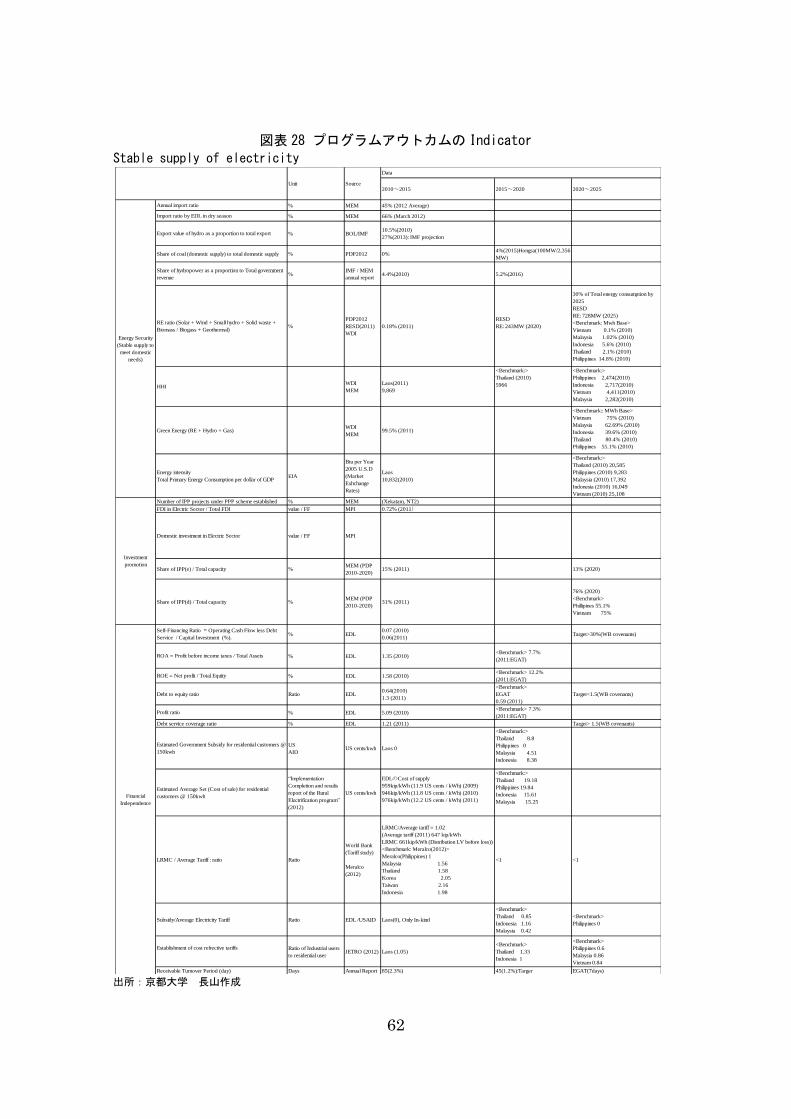
62
図表 28 プログラムアウトカムの Indicator Stable supply of electricity
出所:京都大学 長山作成
% MEM 45% (2012 Average)
% MEM 66% (March 2012)
% BOL/IMF10.5%(2010)
27%(2013): IMF projection
% PDP2012 0%4%(2015)Hongsa(100MW/2,356
MW)
%IMF / MEM
annual report4.4%(2010) 5.2%(2016)
%
PDP2012
RESD(2011)
WDI
0.18% (2011)
RESD
RE: 243MW (2020)
30% of Total energy consumption by
2025
RESD
RE: 728MW (2025)
<Benchmark: Mwh Base>
Vietnam 0.1% (2010)
Malaysia 1.02% (2010)
Indonesia 5.6% (2010)
Thailand 2.1% (2010)
Philippines 14.8% (2010)
WDI
MEM
Laos(2011)
9,869
<Benchmark:>
Thailand (2010)
5966
<Benchmark:>
Philippines 2,474(2010)
Indonesia 2,717(2010)
Vietnam 4,411(2010)
Malaysia 2,282(2010)
WDI
MEM99.5% (2011)
<Benchmark:: MWh Base>
Vietnam 75% (2010)
Malaysia 62.69% (2010)
Indonesia 39.6% (2010)
Thailand 80.4% (2010)
Philippines 55.1% (2010)
EIA
Btu per Year
2005 U.S.D
(Market
Exhchange
Rates)
Laos
10,832(2010)
<Benchmark:>
Thailand (2010) 20,585
Philippines (2010) 9,283
Malaysia (2010) 17,392
Indonesia (2010) 16,049
Vietnam (2010) 25,108
% MEM (Xekatam, NT2)
value / FF MPI 0.72% (2011)
value / FF MPI
%MEM (PDP
2010-2020)15% (2011) 13% (2020)
%MEM (PDP
2010-2020)31% (2011)
76% (2020)
<Benchmark>
Phillipines 55.1%
Vietnam 75%
% EDL0.07 (2010)
0.06(2011)Target>30%(WB covenants)
% EDL 1.35 (2010)<Benchmark> 7.7%
(2011:EGAT)
% EDL 1.58 (2010)<Benchmark> 12.2%
(2011:EGAT)
Ratio EDL0.64(2010)
1.3 (2011)
<Benchmark>
EGAT
0.59 (2011)
Target<1.5(WB covenants)
% EDL 5.09 (2010)<Benchmark> 7.3%
(2011:EGAT)
% EDL 1.21 (2011) Target> 1.5(WB covenants)
US
AIDUS cents/kwh Laos 0
<Benchmark:>
Thailand 8.8
Philippines 0
Malaysia 4.51
Indonesia 8.38
“Implementation
Completion and results
report of the Rural
Electrification program”
(2012)
US cents/kwh
EDLのCost of supply
959kip/kWh (11.9 US cents / kWh) (2009)
946kip/kWh (11.8 US cents / kWh) (2010)
976kip/kWh (12.2 US cents / kWh) (2011)
<Benchmark:>
Thailand 19.18
Philippines 19.84
Indonesia 15.61
Malaysia 15.25
Ratio
World Bank
(Tariff study)
Meralco
(2012)
LRMC/Average tariff = 1.02
(Average tariff (2011) 647 kip/kWh
LRMC 661kip/kWh (Distribution LV before loss))
<Benchmark: Meralco(2012)>
Meralco(Philippines) 1
Malaysia 1.56
Thailand 1.58
Korea 2.05
Taiwan 2.16
Indonesia 1.98
<1 <1
Ratio EDL /USAID Laos(0), Only In-kind
<Benchmark>
Thailand 0.85
Indonesia 1.16
Malaysia 0.42
<Benchmark>
Philippines 0
Ratio of Industrial users
to residential userJETRO (2012) Laos (1.05)
<Benchmark>
Thailand 1.33
Indonesia 1
<Benchmark>
Philippines 0.6
Malaysia 0.86
Vietnam 0.84
Days Annual Report 85(2.3%) 45(1.2%):Targer EGAT(7days)
Share of coal (domestic supply) to total domestic supply
Share of hydropower as a proportion to Total government
revenue
Financial
Independence
Estimated Government Subsidy for residential customers @
150kwh
Estimated Average Set (Cost of sale) for residential
customers @ 150kwh
Share of IPP(e) / Total capacity
Share of IPP(d) / Total capacity
Self-Financing Ratio = Operating Cash Flow less Debt
Service / Capital Investment (%).
ROA = Profit before income taxes / Total Assets
Establishment of cost refrective tariffs
Source
Data
2010~2015 2015~2020
Annual import ratio
2020~2025
Import ratio by EDL in dry season
Investment
promotion
LRMC / Average Tariff : ratio
Subsidy/Average Electricity Tariff
RE ratio (Solar + Wind + Small hydro + Solid waste +
Biomass / Biogass + Geothermal)
Unit
Debt to equity ratio
Profit ratio
Energy Security
(Stable supply to
meet domestic
needs)
Export value of hydro as a proportion to total export
Receivable Turnover Period (day)
HHI
Green Energy (RE + Hydro + Gas)
Energy intensity
Total Primary Energy Consumption per dollar of GDP
Number of IPP projects under PPP scheme established
ROE = Net profit / Total Equity
Debt service coverage ratio
FDI in Electric Sector / Total FDI
Domestic investment in Electric Sector
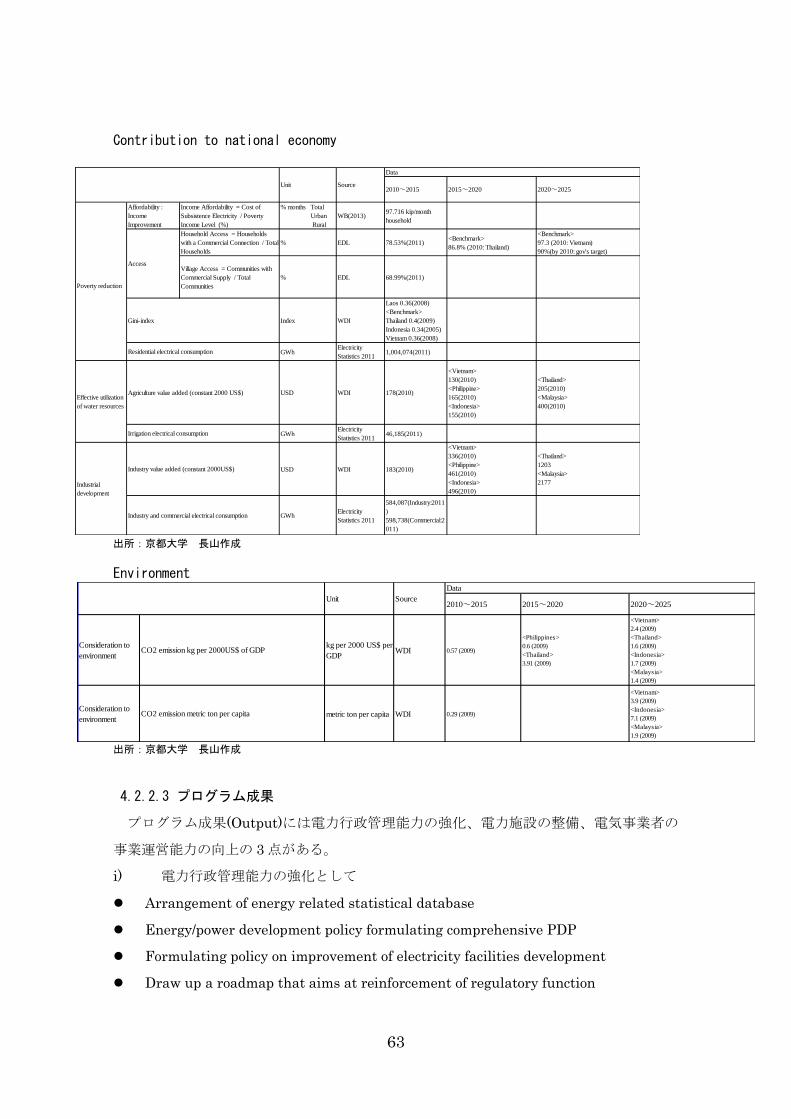
63
Contribution to national economy
出所:京都大学 長山作成
Environment
出所:京都大学 長山作成
4.2.2.3 プログラム成果
プログラム成果(Output)には電力行政管理能力の強化、電力施設の整備、電気事業者の
事業運営能力の向上の 3 点がある。
i) 電力行政管理能力の強化として
Arrangement of energy related statistical database
Energy/power development policy formulating comprehensive PDP
Formulating policy on improvement of electricity facilities development
Draw up a roadmap that aims at reinforcement of regulatory function
Affordability :
Income
Improvement
Income Affordability = Cost of
Subsistence Electricity / Poverty
Income Level (%)
% months Total
Urban
Rural
WB(2013)97.716 kip/month
household
Household Access = Households
with a Commercial Connection / Total
Households
% EDL 78.53%(2011)<Benchmark>
86.8% (2010: Thailand)
<Benchmark>
97.3 (2010: Vietnam)
90%(by 2010: gov's target)
Village Access = Communities with
Commercial Supply / Total
Communities
% EDL 68.99%(2011)
Index WDI
Laos 0.36(2008)
<Benchmark>
Thailand 0.4(2009)
Indonesia 0.34(2005)
Vietnam 0.36(2008)
GWhElectricity
Statistics 20111,004,074(2011)
USD WDI 178(2010)
<Vietnam>
130(2010)
<Philippine>
165(2010)
<Indonesia>
155(2010)
<Thailand>
205(2010)
<Malaysia>
400(2010)
GWhElectricity
Statistics 201146,185(2011)
USD WDI 183(2010)
<Vietnam>
336(2010)
<Philippine>
461(2010)
<Indonesia>
496(2010)
<Thailand>
1203
<Malaysia>
2177
GWhElectricity
Statistics 2011
584,087(Industry:2011
)
598,738(Commercial:2
011)
Unit
Access
Gini-index
Agriculture value added (constant 2000 US$)
Industry value added (constant 2000US$)
Source
Data
2010~2015 2015~2020 2020~2025
Poverty reduction
Residential electrical consumption
Effective utilization
of water resources
Irrigation electrical consumption
Industrial
development
Industry and commercial electrical consumption
Consideration to
environment
kg per 2000 US$ per
GDPWDI 0.57 (2009)
<Philippines>
0.6 (2009)
<Thailand>
3.91 (2009)
<Vietnam>
2.4 (2009)
<Thailand>
1.6 (2009)
<Indonesia>
1.7 (2009)
<Malaysia>
1.4 (2009)
Consideration to
environmentmetric ton per capita WDI 0.29 (2009)
<Vietnam>
3.9 (2009)
<Indonesia>
7.1 (2009)
<Malaysia>
1.9 (2009)
CO2 emission metric ton per capita
Unit Source
Data
2010~2015 2015~2020
CO2 emission kg per 2000US$ of GDP
2020~2025
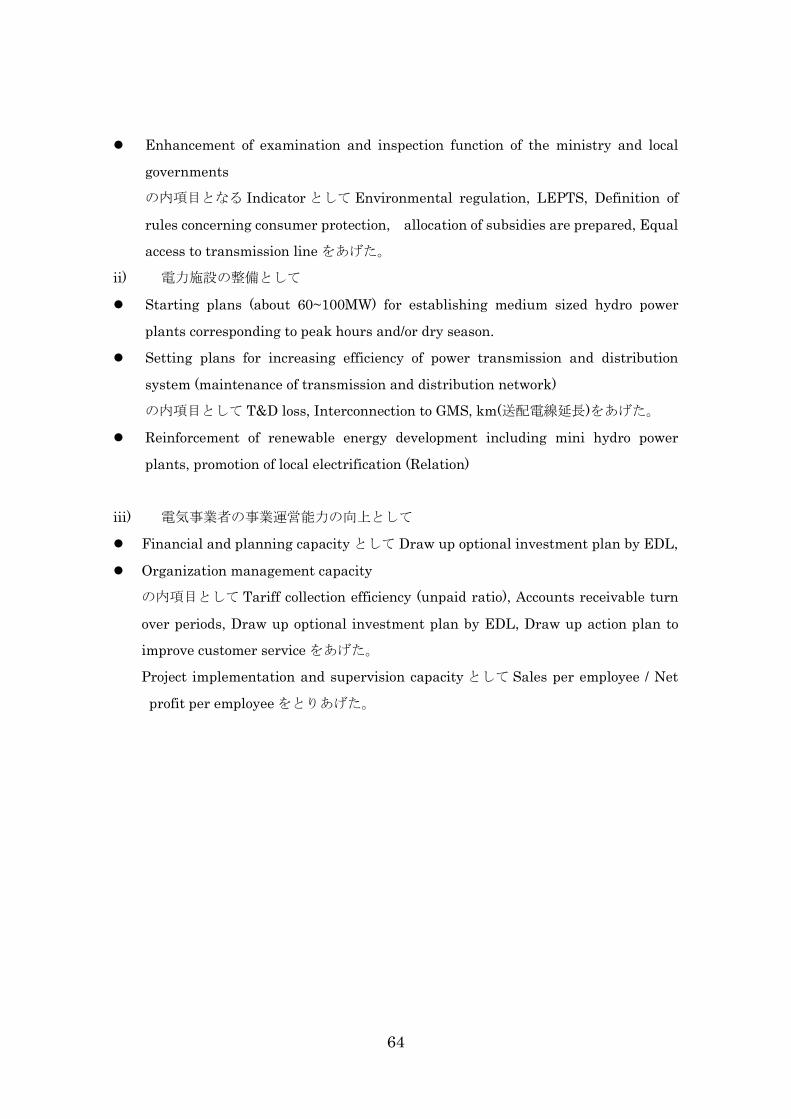
64
Enhancement of examination and inspection function of the ministry and local
governments
の内項目となる Indicator として Environmental regulation, LEPTS, Definition of
rules concerning consumer protection, allocation of subsidies are prepared, Equal
access to transmission line をあげた。
ii) 電力施設の整備として
Starting plans (about 60~100MW) for establishing medium sized hydro power
plants corresponding to peak hours and/or dry season.
Setting plans for increasing efficiency of power transmission and distribution
system (maintenance of transmission and distribution network)
の内項目として T&D loss, Interconnection to GMS, km(送配電線延長)をあげた。
Reinforcement of renewable energy development including mini hydro power
plants, promotion of local electrification (Relation)
iii) 電気事業者の事業運営能力の向上として
Financial and planning capacity として Draw up optional investment plan by EDL,
Organization management capacity
の内項目として Tariff collection efficiency (unpaid ratio), Accounts receivable turn
over periods, Draw up optional investment plan by EDL, Draw up action plan to
improve customer service をあげた。
Project implementation and supervision capacity として Sales per employee / Net
profit per employee をとりあげた。
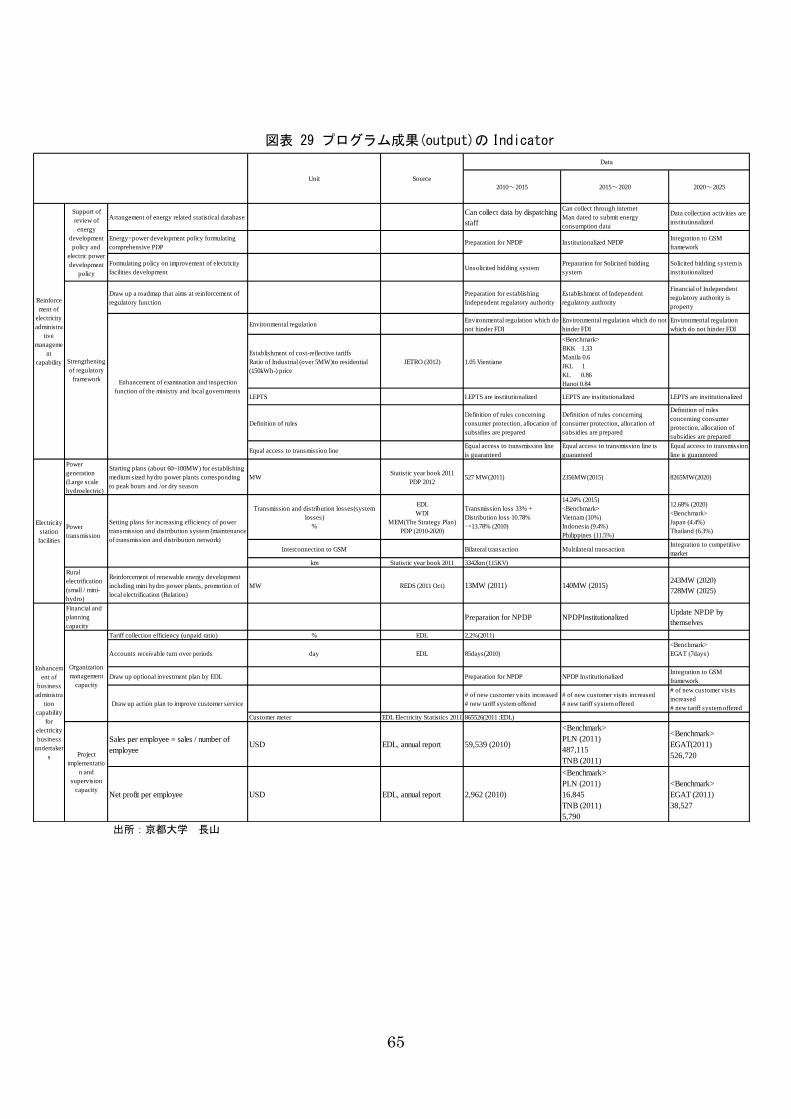
65
図表 29 プログラム成果(output)の Indicator
出所:京都大学 長山
Arrangement of energy related statistical databaseCan collect data by dispatching
staff
Can collect through internet
Man dated to submit energy
consumption data
Data collection activities are
institutionalized
Energy・power development policy formulating
comprehensive PDPPreparation for NPDP Institutionalized NPDP
Integration to GSM
framework
Formulating policy on improvement of electricity
facilities developmentUnsolicited bidding system
Preparation for Solicited bidding
system
Solicited bidding system is
institutionalized
Draw up a roadmap that aims at reinforcement of
regulatory function
Preparation for establishing
Independent regulatory authority
Establishment of Independent
regulatory authority
Financial of Independent
regulatory authority is
property
Environmental regulationEnvironmental regulation which do
not hinder FDI
Environmental regulation which do not
hinder FDI
Environmental regulation
which do not hinder FDI
Establishment of cost-reflective tariffs
Ratio of Industrial (over 5MW)to residential
(150kWh-) price
JETRO (2012) 1.05 Vientiane
<Benchmark>
BKK 1.33
Manila 0.6
JKL 1
KL 0.86
Hanoi 0.84
LEPTS LEPTS are institutionalized LEPTS are institutionalized LEPTS are institutionalized
Definition of rules
Definition of rules concerning
consumer protection, allocation of
subsidies are prepared
Definition of rules concerning
consumer protection, allocation of
subsidies are prepared
Definition of rules
concerning consumer
protection, allocation of
subsidies are prepared
Equal access to transmission lineEqual access to transmission line
is guaranteed
Equal access to transmission line is
guaranteed
Equal access to transmission
line is guaranteed
Power
generation
(Large scale
hydroelectric)
Starting plans (about 60~100MW) for establishing
medium sized hydro power plants corresponding
to peak hours and /or dry season
MWStatistic year book 2011
PDP 2012527 MW(2011) 2356MW(2015) 8265MW(2020)
Transmission and distribution losses(system
losses)
%
EDL
WDI
MEM(The Strategy Plan)
PDP (2010-2020)
Transmission loss 33% +
Distribution loss 10.78%
→13.78% (2010)
14.24% (2015)
<Benchmark>
Vietnam (10%)
Indonesia (9.4%)
Philippines (11.5%)
12.68% (2020)
<Benchmark>
Japan (4.4%)
Thailand (6.3%)
Interconnection to GSM Bilateral transaction Multilateral transactionIntegration to competitive
market
km Statistic year book 2011 3342km (115KV)
Rural
electrification
(small / mini-
hydro)
Reinforcement of renewable energy development
including mini hydro power plants, promotion of
local electrification (Relation)
MW REDS (2011 Oct) 13MW (2011) 140MW (2015)243MW (2020)
728MW (2025)
Financial and
planning
capacity
Preparation for NPDP NPDPInstitutionalizedUpdate NPDP by
themselves
Tariff collection efficiency (unpaid ratio) % EDL 2.2%(2011)
Accounts receivable turn over periods day EDL 85days(2010)
<Benchmark>
EGAT (7days)
Draw up optional investment plan by EDL Preparation for NPDP NPDP InstitutionalizedIntegration to GSM
framework
# of new customer visits increased
# new tariff system offered
# of new customer visits increased
# new tariff system offered
# of new customer visits
increased
# new tariff system offered
Customer meter EDL Electricity Statistics 2011 865526(2011 :EDL)
Sales per employee = sales / number of
employeeUSD EDL, annual report 59,539 (2010)
<Benchmark>
PLN (2011)
487,115
TNB (2011)
301,963
<Benchmark>
EGAT(2011)
526,720
Net profit per employee USD EDL, annual report 2,962 (2010)
<Benchmark>
PLN (2011)
16,845
TNB (2011)
5,790
<Benchmark>
EGAT (2011)
38,527
2010~2015 2015~2020 2020~2025
Reinforce
ment of
electricity
administra
tive
manageme
nt
capability Strengthening
of regulatory
frameworkEnhancement of examination and inspection
function of the ministry and local governments
Project
implementatio
n and
supervision
capacity
Data
Support of
review of
energy
development
policy and
electric power
development
policy
Electricity
station
facilities
Power
transmission
Setting plans for increasing efficiency of power
transmission and distribution system (maintenance
of transmission and distribution network)
Enhancem
ent of
business
administra
tion
capability
for
electricity
business
undertaker
s
Organization
management
capacity
Draw up action plan to improve customer service
Unit Source
66
その他全体的な電力セクターパフォーマンスをみる Indicator として
"Blackout ratio / SAIDI / SAIFI
Duration of Outage (SAIDI) = Total Duration of Forced Outage per Year / Total
number of Customers (Hours Forced Outage per Customer per Year)."
Reserve Margin = (Available generation capacity (MW) - Historical Peak Load
(MW)) /Historical Peak Load (MW). (%)
Labor Productivity = No of Customers / Employee
Average Plant Load Factor = Total Annual Generation Output (MWh)
/8,780(hr)∗ Installed Capacity (MW)
Consumption Density = Annual Energy Sales / Total length system distribution
network (MWh/km)
"Electricity of electricity consumption to GDP = Δin Electricity consumption ÷
Δin GDP"
しかしながら、上記 Indicator の内 SAIDI、SAIFI、Reserve Margin 等のデータは現在の
ところ入手不可能なのが現状である。
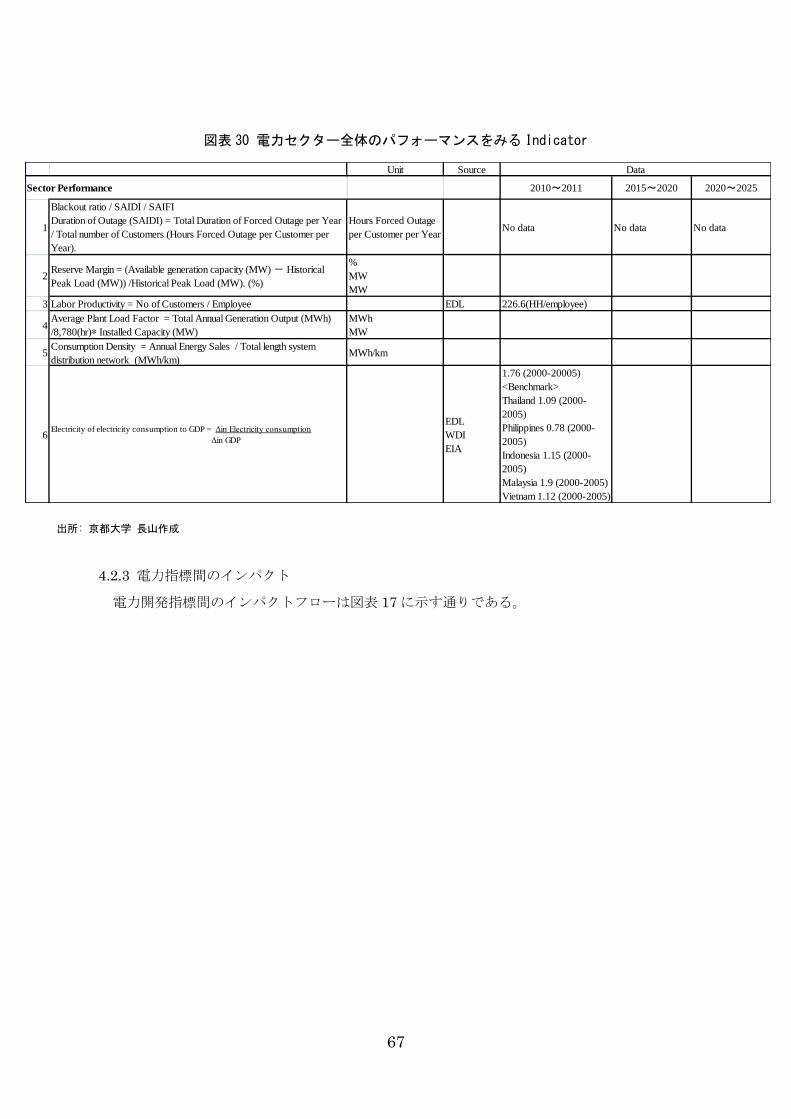
67
図表 30 電力セクター全体のパフォーマンスをみる Indicator
出所: 京都大学 長山作成
4.2.3 電力指標間のインパクト
電力開発指標間のインパクトフローは図表 17 に示す通りである。
Unit Source
Sector Performance 2010~2011 2015~2020 2020~2025
1
Blackout ratio / SAIDI / SAIFI
Duration of Outage (SAIDI) = Total Duration of Forced Outage per Year
/ Total number of Customers (Hours Forced Outage per Customer per
Year).
Hours Forced Outage
per Customer per YearNo data No data No data
2Reserve Margin = (Available generation capacity (MW) - Historical
Peak Load (MW)) /Historical Peak Load (MW). (%)
%
MW
MW
3 Labor Productivity = No of Customers / Employee EDL 226.6(HH/employee)
4Average Plant Load Factor = Total Annual Generation Output (MWh)
/8,780(hr)∗ Installed Capacity (MW)
MWh
MW
5Consumption Density = Annual Energy Sales / Total length system
distribution network (MWh/km)MWh/km
6Electricity of electricity consumption to GDP = Δin Electricity consumption
Δin GDP
EDL
WDI
EIA
1.76 (2000-20005)
<Benchmark>
Thailand 1.09 (2000-
2005)
Philippines 0.78 (2000-
2005)
Indonesia 1.15 (2000-
2005)
Malaysia 1.9 (2000-2005)
Vietnam 1.12 (2000-2005)
Data
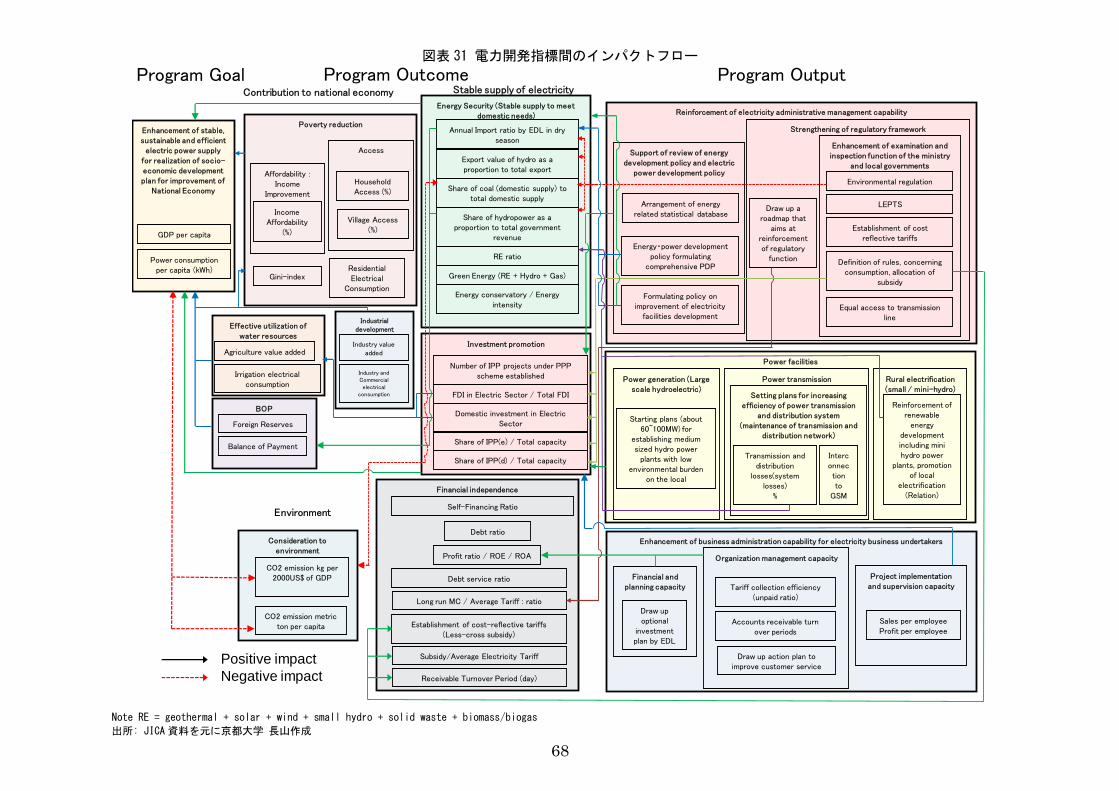
68
図表 31 電力開発指標間のインパクトフロー
Note RE = geothermal + solar + wind + small hydro + solid waste + biomass/biogas
出所: JICA資料を元に京都大学 長山作成
Power facilities
Reinforcement of electricity administrative management capability
Strengthening of regulatory framework
Support of review of energy development policy and electric
power development policy
Arrangement of energy related statistical database
Energy・power development policy formulating
comprehensive PDP
Formulating policy on improvement of electricity
facilities development
Draw up a roadmap that
aims at reinforcement of regulatory
function
Enhancement of examination and inspection function of the ministry
and local governments
Environmental regulation
LEPTS
Definition of rules, concerning consumption, allocation of
subsidy
Equal access to transmission line
Power generation (Large scale hydroelectric)
Starting plans (about 60~100MW) for
establishing medium sized hydro power
plants with low environmental burden
on the local
Power transmission
Setting plans for increasing efficiency of power transmission
and distribution system (maintenance of transmission and
distribution network)
Rural electrification (small / mini-hydro)
Reinforcement of renewable
energy development including mini hydro power
plants, promotion of local
electrification (Relation)
Enhancement of business administration capability for electricity business undertakers
Financial and planning capacity
Draw up optional
investment plan by EDL
Organization management capacity
Tariff collection efficiency (unpaid ratio)
Accounts receivable turn over periods
Draw up action plan to improve customer service
Project implementation and supervision capacity
Sales per employeeProfit per employee
Program Output
Transmission and distribution
losses(system losses)
%
Interconnection to
GSM
Poverty reduction
Affordability : Income
Improvement
Income Affordability
(%)
Access
Household Access (%)
Village Access(%)
Gini-index
Effective utilization of water resources
Agriculture value added
Industrial development
Industry value added
BOP
Foreign Reserves
Balance of Payment
Contribution to national economy
Environment
Consideration to environment
CO2 emission kg per 2000US$ of GDP
CO2 emission metric ton per capita
Program Outcome
Enhancement of stable, sustainable and efficient electric power supply
for realization of socio-economic development plan for improvement of
National Economy
GDP per capita
Power consumption per capita (kWh)
Program Goal
Energy Security (Stable supply to meet domestic needs)
Annual Import ratio by EDL in dry season
Export value of hydro as a proportion to total export
Share of coal (domestic supply) to total domestic supply
Share of hydropower as a proportion to total government
revenue
RE ratio
Investment promotion
Green Energy (RE + Hydro + Gas)
Energy conservatory / Energy intensity
Number of IPP projects under PPP scheme established
FDI in Electric Sector / Total FDI
Domestic investment in Electric Sector
Share of IPP(e) / Total capacity
Share of IPP(d) / Total capacity
Financial independence
Self-Financing Ratio
Debt ratio
Profit ratio / ROE / ROA
Debt service ratio
Long run MC / Average Tariff : ratio
Subsidy/Average Electricity Tariff
Receivable Turnover Period (day)
Establishment of cost-reflective tariffs (Less-cross subsidy)
Positive impact
Negative impact
Stable supply of electricity
Establishment of cost reflective tariffs
Residential Electrical
Consumption
Irrigation electrical consumption
Industry and Commercial electrical
consumption
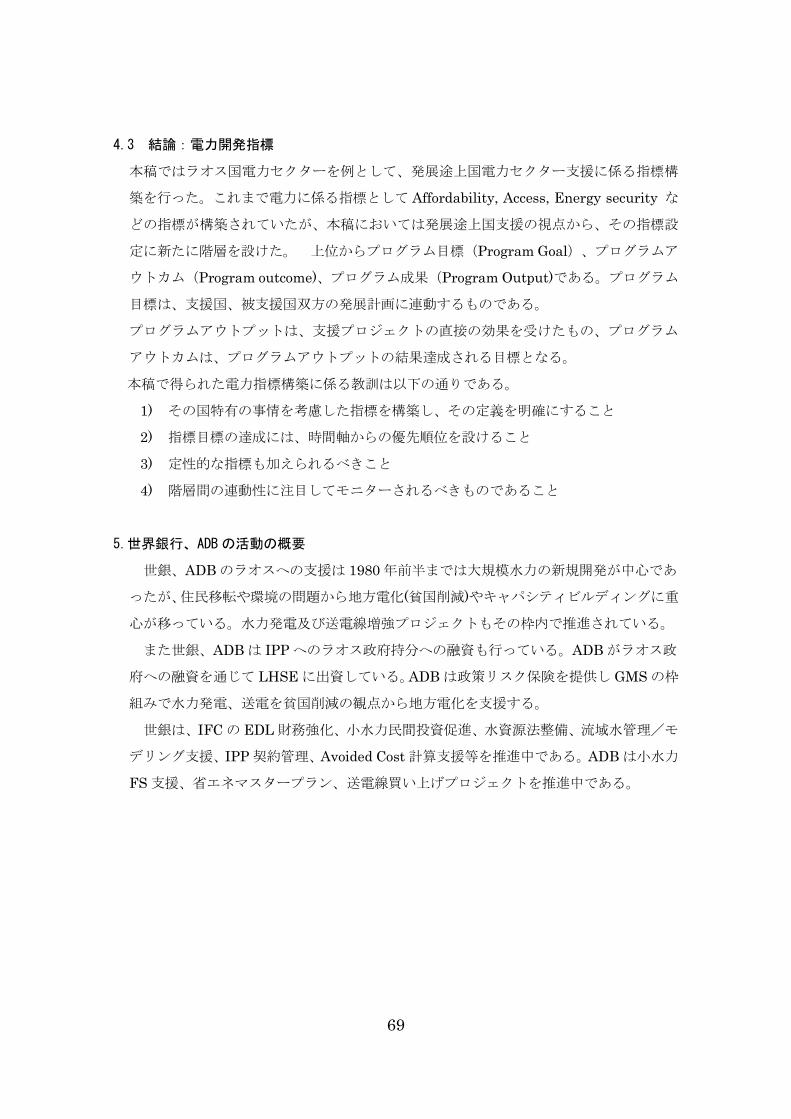
69
4.3 結論:電力開発指標
本稿ではラオス国電力セクターを例として、発展途上国電力セクター支援に係る指標構
築を行った。これまで電力に係る指標として Affordability, Access, Energy security な
どの指標が構築されていたが、本稿においては発展途上国支援の視点から、その指標設
定に新たに階層を設けた。 上位からプログラム目標(Program Goal)、プログラムア
ウトカム(Program outcome)、プログラム成果(Program Output)である。プログラム
目標は、支援国、被支援国双方の発展計画に連動するものである。
プログラムアウトプットは、支援プロジェクトの直接の効果を受けたもの、プログラム
アウトカムは、プログラムアウトプットの結果達成される目標となる。
本稿で得られた電力指標構築に係る教訓は以下の通りである。
1) その国特有の事情を考慮した指標を構築し、その定義を明確にすること
2) 指標目標の達成には、時間軸からの優先順位を設けること
3) 定性的な指標も加えられるべきこと
4) 階層間の連動性に注目してモニターされるべきものであること
5.世界銀行、ADBの活動の概要
世銀、ADB のラオスへの支援は 1980 年前半までは大規模水力の新規開発が中心であ
ったが、住民移転や環境の問題から地方電化(貧国削減)やキャパシティビルディングに重
心が移っている。水力発電及び送電線増強プロジェクトもその枠内で推進されている。
また世銀、ADB は IPP へのラオス政府持分への融資も行っている。ADB がラオス政
府への融資を通じて LHSE に出資している。ADB は政策リスク保険を提供し GMS の枠
組みで水力発電、送電を貧国削減の観点から地方電化を支援する。
世銀は、IFC の EDL 財務強化、小水力民間投資促進、水資源法整備、流域水管理/モ
デリング支援、IPP 契約管理、Avoided Cost 計算支援等を推進中である。ADB は小水力
FS 支援、省エネマスタープラン、送電線買い上げプロジェクトを推進中である。
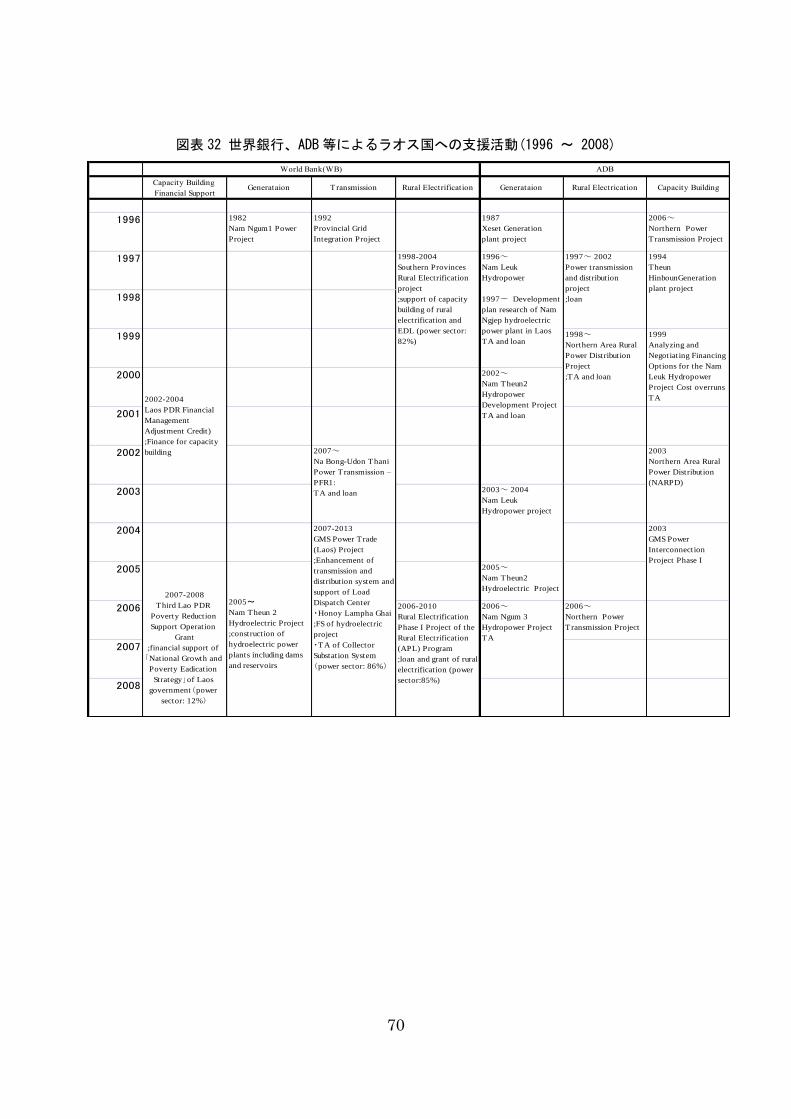
70
図表 32 世界銀行、ADB等によるラオス国への支援活動(1996 ~ 2008)
Capacity Building
Financial SupportGenerataion Transmission Rural Electrification Generataion Rural Electrication Capacity Building
1996 1982
Nam Ngum1 Power
Project
1992
Provincial Grid
Integration Project
1987
Xeset Generation
plant project
2006~
Northern Power
Transmission Project
1997
1998
1999
2000
2001
2002
2003
2004
2005 2005~
Nam Theun2
Hydroelectric Project
2006 2006~
Northern Power
Transmission Project
2007
2008
2003
Northern Area Rural
Power Distribution
(NARPD)
2003
GMS Power
Interconnection
Project Phase I
1997~ 2002
Power transmission
and distribution
project
;loan
1998~
Northern Area Rural
Power Distribution
Project
;TA and loan
1994
Theun
HinbounGeneration
plant project
1999
Analyzing and
Negotiating Financing
Options for the Nam
Leuk Hydropower
Project Cost overruns
TA
2007~
Na Bong-Udon Thani
Power Transmission –
PFR1:
TA and loan
2007-2013
GMS Power Trade
(Laos) Project
;Enhancement of
transmission and
distribution system and
support of Load
Dispatch Center
・Honoy Lampha Ghai
;FS of hydroelectric
project
・TA of Collector
Substation System
(power sector: 86%)
2006-2010
Rural Electrification
Phase I Project of the
Rural Electrification
(APL) Program
;loan and grant of rural
electrification (power
sector:85%)
1998-2004
Southern Provinces
Rural Electrification
project
;support of capacity
building of rural
electrification and
EDL (power sector:
82%)
1996~
Nam Leuk
Hydropower
1997〜 Development
plan research of Nam
Ngjep hydroelectric
power plant in Laos
TA and loan
2002~
Nam Theun2
Hydropower
Development Project
TA and loan
2003~ 2004
Nam Leuk
Hydropower project
2006~
Nam Ngum 3
Hydropower Project
TA
2002-2004
Laos PDR Financial
Management
Adjustment Credit)
;Finance for capacity
building
2007-2008
Third Lao PDR
Poverty Reduction
Support Operation
Grant
;financial support of
「National Growth and
Poverty Eadication
Strategy」of Laos
government(power
sector: 12%)
2005~
Nam Theun 2
Hydroelectric Project
;construction of
hydroelectric power
plants including dams
and reservoirs
World Bank(WB) ADB
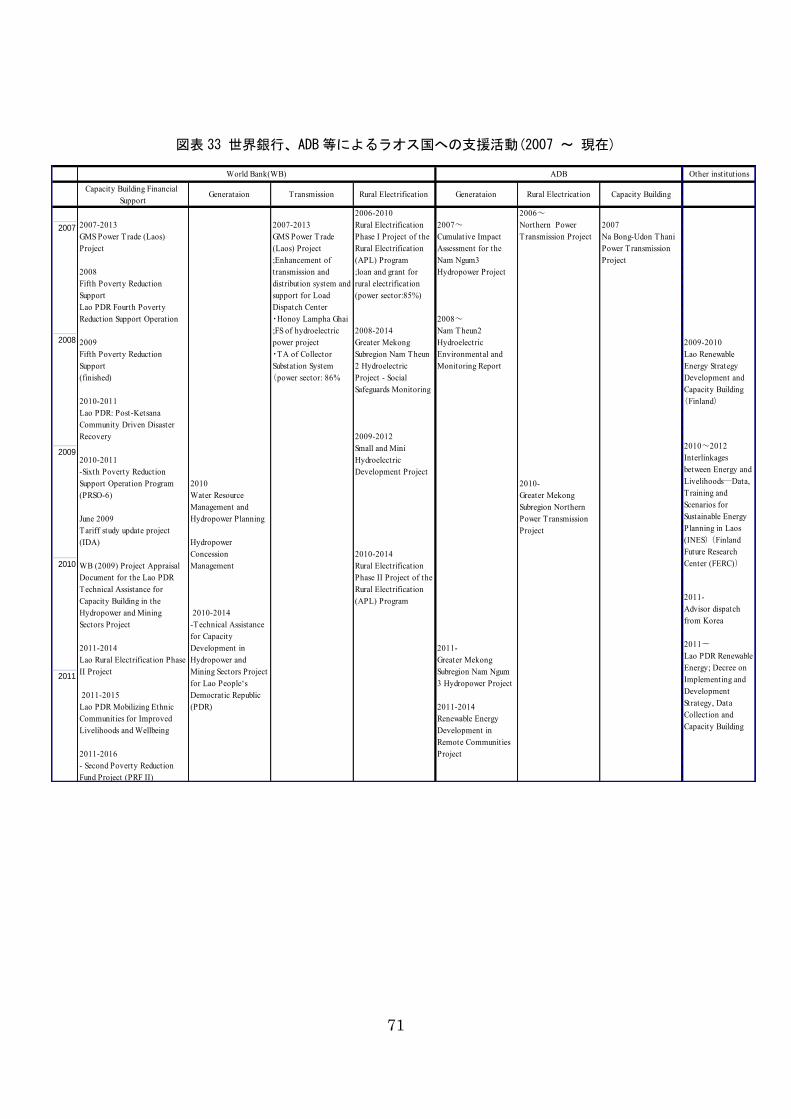
71
図表 33 世界銀行、ADB等によるラオス国への支援活動(2007 ~ 現在)
Other institutions
Capacity Building Financial
SupportGenerataion Transmission Rural Electrification Generataion Rural Electrication Capacity Building
2007
2008
2009
2010
2011
2009-2010
Lao Renewable
Energy Strategy
Development and
Capacity Building
(Finland)
2010~2012
Interlinkages
between Energy and
Livelihoods―Data,
Training and
Scenarios for
Sustainable Energy
Planning in Laos
(INES) (Finland
Future Research
Center (FERC))
2011-
Advisor dispatch
from Korea
2011〜
Lao PDR Renewable
Energy; Decree on
Implementing and
Development
Strategy, Data
Collection and
Capacity Building
World Bank(WB) ADB
2007-2013
GMS Power Trade (Laos)
Project
2008
Fifth Poverty Reduction
Support
Lao PDR Fourth Poverty
Reduction Support Operation
2009
Fifth Poverty Reduction
Support
(finished)
2010-2011
Lao PDR: Post-Ketsana
Community Driven Disaster
Recovery
2010-2011
-Sixth Poverty Reduction
Support Operation Program
(PRSO-6)
June 2009
Tariff study update project
(IDA)
WB (2009) Project Appraisal
Document for the Lao PDR
Technical Assistance for
Capacity Building in the
Hydropower and Mining
Sectors Project
2011-2014
Lao Rural Electrification Phase
II Project
2011-2015
Lao PDR Mobilizing Ethnic
Communities for Improved
Livelihoods and Wellbeing
2011-2016
- Second Poverty Reduction
Fund Project (PRF II)
2007
Na Bong-Udon Thani
Power Transmission
Project
2006~
Northern Power
Transmission Project
2010-
Greater Mekong
Subregion Northern
Power Transmission
Project
2007~
Cumulative Impact
Assessment for the
Nam Ngum3
Hydropower Project
2008~
Nam Theun2
Hydroelectric
Environmental and
Monitoring Report
2011-
Greater Mekong
Subregion Nam Ngum
3 Hydropower Project
2011-2014
Renewable Energy
Development in
Remote Communities
Project
2006-2010
Rural Electrification
Phase I Project of the
Rural Electrification
(APL) Program
;loan and grant for
rural electrification
(power sector:85%)
2008-2014
Greater Mekong
Subregion Nam Theun
2 Hydroelectric
Project - Social
Safeguards Monitoring
2009-2012
Small and Mini
Hydroelectric
Development Project
2010-2014
Rural Electrification
Phase II Project of the
Rural Electrification
(APL) Program
2007-2013
GMS Power Trade
(Laos) Project
;Enhancement of
transmission and
distribution system and
support for Load
Dispatch Center
・Honoy Lampha Ghai
;FS of hydroelectric
power project
・TA of Collector
Substation System
(power sector: 86%
2010
Water Resource
Management and
Hydropower Planning
Hydropower
Concession
Management
2010-2014
-Technical Assistance
for Capacity
Development in
Hydropower and
Mining Sectors Project
for Lao People‘s
Democratic Republic
(PDR)
72
図表 34 世界銀行、ADB等によるラオス国への支援活動(2012~現在計画中)
Other institutions
Capacity Building
Financial SupportGenerataion Transmission Rural Electrification Generataion Rural Electrication Capacity Building
2012
2012
Lao Seventh Poverty
Reduction Support
2012
Lao-People’s
Democratic Republic
and Mekong River
Commission – Mekong
Integrated Water
Resources
Management Project
Institutional,
Technical, Financial
and Legal Advisory
Services for
Hydropower
Concession
Management
2012-
Greater Mekong
Subregion Nam Ngum
3 Hydropower Project
(Underplanning)
Nam Ngiep 1
Hydropower Project
(Underplanning)
Nam Ngiep 3
Hydropower Project
(Underplanning)
Xepian
XenamnoyGeneration
plant project
(under planning )
Nabong 500 kV
Substation and
Transmission Facility
Project
(Underplanning)
GMS Northern Power
Transmission2
World Bank(WB) ADB
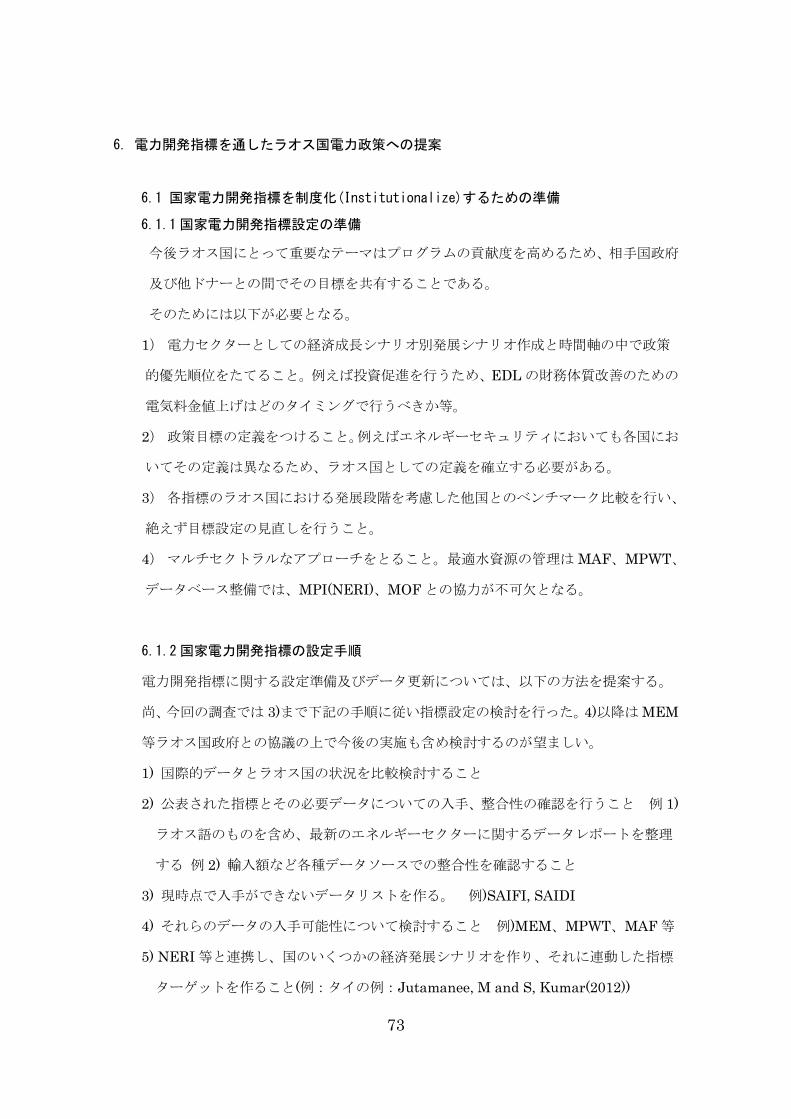
73
6. 電力開発指標を通したラオス国電力政策への提案
6.1 国家電力開発指標を制度化(Institutionalize)するための準備
6.1.1国家電力開発指標設定の準備
今後ラオス国にとって重要なテーマはプログラムの貢献度を高めるため、相手国政府
及び他ドナーとの間でその目標を共有することである。
そのためには以下が必要となる。
1) 電力セクターとしての経済成長シナリオ別発展シナリオ作成と時間軸の中で政策
的優先順位をたてること。例えば投資促進を行うため、EDL の財務体質改善のための
電気料金値上げはどのタイミングで行うべきか等。
2) 政策目標の定義をつけること。例えばエネルギーセキュリティにおいても各国にお
いてその定義は異なるため、ラオス国としての定義を確立する必要がある。
3) 各指標のラオス国における発展段階を考慮した他国とのベンチマーク比較を行い、
絶えず目標設定の見直しを行うこと。
4) マルチセクトラルなアプローチをとること。最適水資源の管理は MAF、MPWT、
データベース整備では、MPI(NERI)、MOF との協力が不可欠となる。
6.1.2国家電力開発指標の設定手順
電力開発指標に関する設定準備及びデータ更新については、以下の方法を提案する。
尚、今回の調査では 3)まで下記の手順に従い指標設定の検討を行った。4)以降は MEM
等ラオス国政府との協議の上で今後の実施も含め検討するのが望ましい。
1) 国際的データとラオス国の状況を比較検討すること
2) 公表された指標とその必要データについての入手、整合性の確認を行うこと 例 1)
ラオス語のものを含め、最新のエネルギーセクターに関するデータレポートを整理
する 例 2) 輸入額など各種データソースでの整合性を確認すること
3) 現時点で入手ができないデータリストを作る。 例)SAIFI, SAIDI
4) それらのデータの入手可能性について検討すること 例)MEM、MPWT、MAF 等
5) NERI 等と連携し、国のいくつかの経済発展シナリオを作り、それに連動した指標
ターゲットを作ること(例:タイの例:Jutamanee, M and S, Kumar(2012))
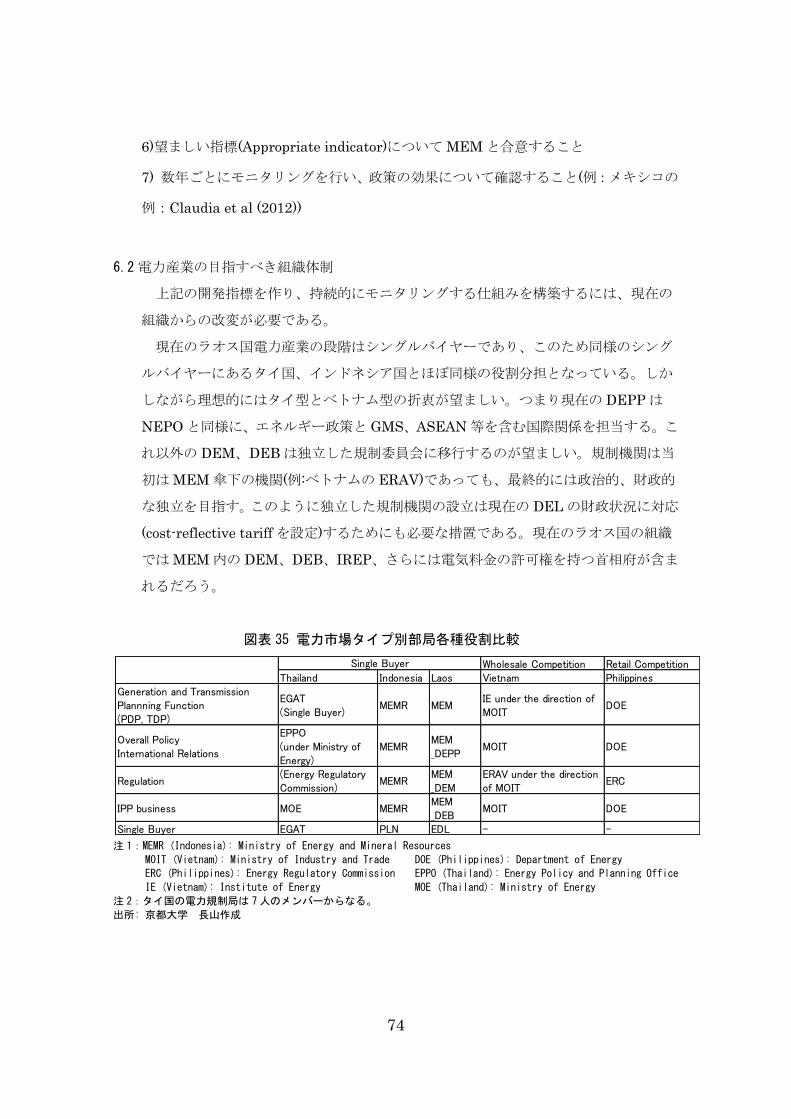
74
6)望ましい指標(Appropriate indicator)について MEM と合意すること
7) 数年ごとにモニタリングを行い、政策の効果について確認すること(例:メキシコの
例:Claudia et al (2012))
6.2電力産業の目指すべき組織体制
上記の開発指標を作り、持続的にモニタリングする仕組みを構築するには、現在の
組織からの改変が必要である。
現在のラオス国電力産業の段階はシングルバイヤーであり、このため同様のシング
ルバイヤーにあるタイ国、インドネシア国とほぼ同様の役割分担となっている。しか
しながら理想的にはタイ型とベトナム型の折衷が望ましい。つまり現在の DEPP は
NEPO と同様に、エネルギー政策と GMS、ASEAN 等を含む国際関係を担当する。こ
れ以外の DEM、DEB は独立した規制委員会に移行するのが望ましい。規制機関は当
初は MEM 傘下の機関(例:ベトナムの ERAV)であっても、最終的には政治的、財政的
な独立を目指す。このように独立した規制機関の設立は現在の DEL の財政状況に対応
(cost-reflective tariff を設定)するためにも必要な措置である。現在のラオス国の組織
では MEM 内の DEM、DEB、IREP、さらには電気料金の許可権を持つ首相府が含ま
れるだろう。
図表 35 電力市場タイプ別部局各種役割比較
注 1:MEMR (Indonesia): Ministry of Energy and Mineral Resources
MOIT (Vietnam): Ministry of Industry and Trade DOE (Philippines): Department of Energy
ERC (Philippines): Energy Regulatory Commission EPPO (Thailand): Energy Policy and Planning Office
IE (Vietnam): Institute of Energy MOE (Thailand): Ministry of Energy
注 2:タイ国の電力規制局は 7人のメンバーからなる。
出所: 京都大学 長山作成
Wholesale Competition Retail CompetitionThailand Indonesia Laos Vietnam Philippines
Generation and TransmissionPlannning Function(PDP, TDP)
EGAT(Single Buyer)
MEMR MEMIE under the direction ofMOIT
DOE
Overall PolicyInternational Relations
EPPO(under Ministry ofEnergy)
MEMRMEM_DEPP
MOIT DOE
Regulation(Energy RegulatoryCommission)
MEMRMEM_DEM
ERAV under the directionof MOIT
ERC
IPP business MOE MEMRMEM_DEB
MOIT DOE
Single Buyer EGAT PLN EDL - -
Single Buyer
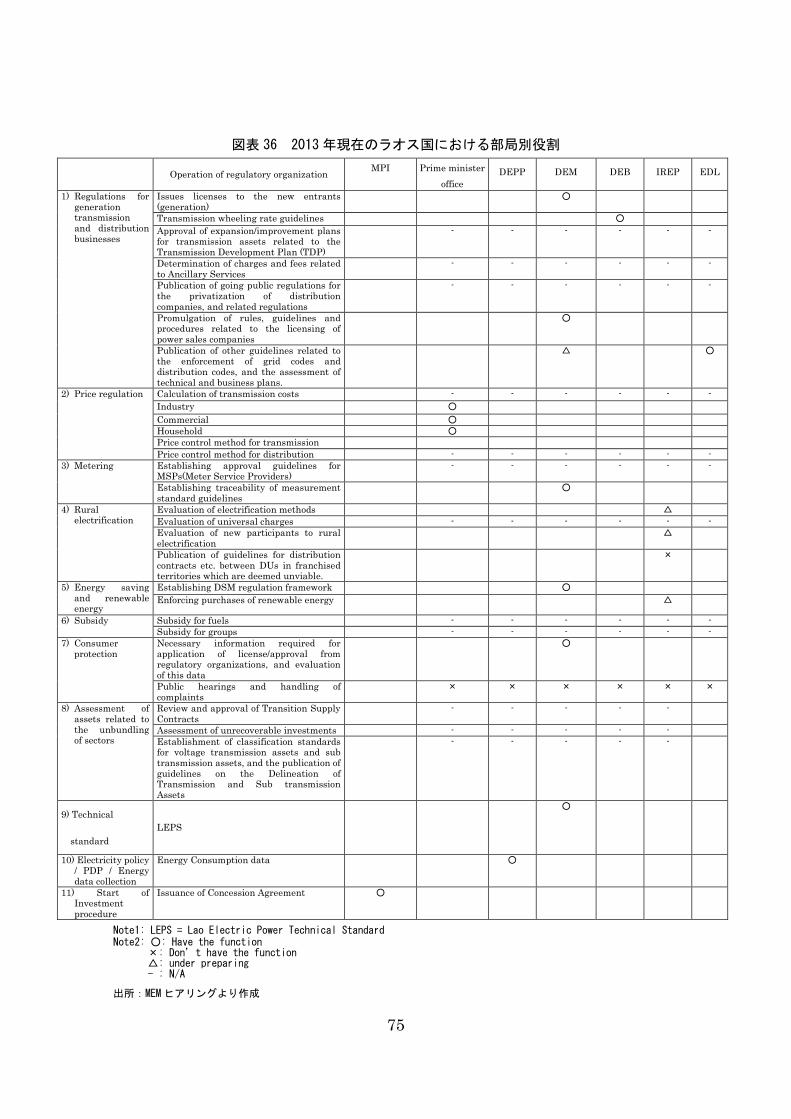
75
図表 36 2013年現在のラオス国における部局別役割
Operation of regulatory organization MPI Prime minister
office
DEPP DEM DEB IREP EDL
1) Regulations for generation transmission and distribution businesses
Issues licenses to the new entrants (generation)
○
Transmission wheeling rate guidelines ○
Approval of expansion/improvement plans for transmission assets related to the Transmission Development Plan (TDP)
- - - - - -
Determination of charges and fees related to Ancillary Services
- - - - - -
Publication of going public regulations for the privatization of distribution companies, and related regulations
- - - - - -
Promulgation of rules, guidelines and procedures related to the licensing of power sales companies
○
Publication of other guidelines related to the enforcement of grid codes and distribution codes, and the assessment of technical and business plans.
△ ○
2) Price regulation Calculation of transmission costs - - - - - -
Industry ○
Commercial ○
Household ○
Price control method for transmission
Price control method for distribution - - - - - -
3) Metering
Establishing approval guidelines for MSPs(Meter Service Providers)
- - - - - -
Establishing traceability of measurement standard guidelines
○
4) Rural electrification
Evaluation of electrification methods △
Evaluation of universal charges - - - - - -
Evaluation of new participants to rural electrification
△
Publication of guidelines for distribution contracts etc. between DUs in franchised territories which are deemed unviable.
×
5) Energy saving and renewable energy
Establishing DSM regulation framework ○
Enforcing purchases of renewable energy △
6) Subsidy Subsidy for fuels - - - - - -
Subsidy for groups - - - - - -
7) Consumer protection
Necessary information required for application of license/approval from regulatory organizations, and evaluation of this data
○
Public hearings and handling of complaints
× × × × × ×
8) Assessment of assets related to the unbundling of sectors
Review and approval of Transition Supply Contracts
- - - - -
Assessment of unrecoverable investments - - - - -
Establishment of classification standards for voltage transmission assets and sub transmission assets, and the publication of guidelines on the Delineation of Transmission and Sub transmission Assets
- - - - -
9) Technical
standard
LEPS
○
10) Electricity policy / PDP / Energy data collection
Energy Consumption data ○
11) Start of Investment procedure
Issuance of Concession Agreement ○
Note1: LEPS = Lao Electric Power Technical Standard Note2: ○: Have the function
×: Don’t have the function △: under preparing - : N/A
出所:MEMヒアリングより作成
76
図表 37 アジア国における電力規制機関の職務
Operation of regulatory
organization
Cambodia
(EAC)
Vietnam
(ERAV)
Thailand
(Energy
regulatory
commission)
The Philippines
ERC
VM3 VM→SB SB RC
Total staff 52 53 - 249
Total staff/sector 52 53 - 249
#of professional staff 32 - - -
Budget(thousand US$) 510 - - 2860.7
Budget/sector(thousand US$) 510 - - 2861
Budget/person(thousand US$) 9.81 - - 11.49
1) Regulations for generation, transmission/distribution
Issues licenses to the new entrants (Generation)
○ ○ ○ -
Transmission wheeling rate guidelines
○ ○ - ○
Approval of expansion/improvement plans for transmission assets related to the Transmission Development Plan (TDP)
x ○ - ○
Determination of charges and fees related to Ancillary Services
x ○ - ○
Promulgation of rules, guidelines and procedures related to the licensing of power sales companies
○ ○ ○ ○
Publication of other guidelines related to the enforcement of grid codes and distribution codes, and the assessment of technical and business plans.
x ○ ○ ○
Calculation of transmission costs - ○ ○ ○
2) Price regulation
Tariff permit for industry ○ ○ ○ ○
Tariff permit for commercial ○ ○ ○ ○
Tariff permit for household ○ ○ ○ ○
Price control method for transmission
- Not yet define ROR RC
Price control method for distribution
ROR Not yet regulated ROR PC, ROR
Establishing approval guidelines for MSPs(Meter Service Providers)
x x ○
3) Metering Establishing traceability of measurement standard guidelines
x x ○
Evaluation of electrification methods
x x x ○
4) Rural electrification
Evaluation of universal charges x ○ ○ ○
Evaluation of new participants x ○ ○ ○
Publication of guidelines for distribution contracts etc. between DUs in franchised territories which are deemed unviable.
- x N/A ○
Establishing DSM regulation framework
x ○ ○
5) Energy saving and renewable energy
Enforcing purchases of renewable energy
x ○ ○
6) Subsidy Subsidy for fuels No subsidy for fuels
No ×
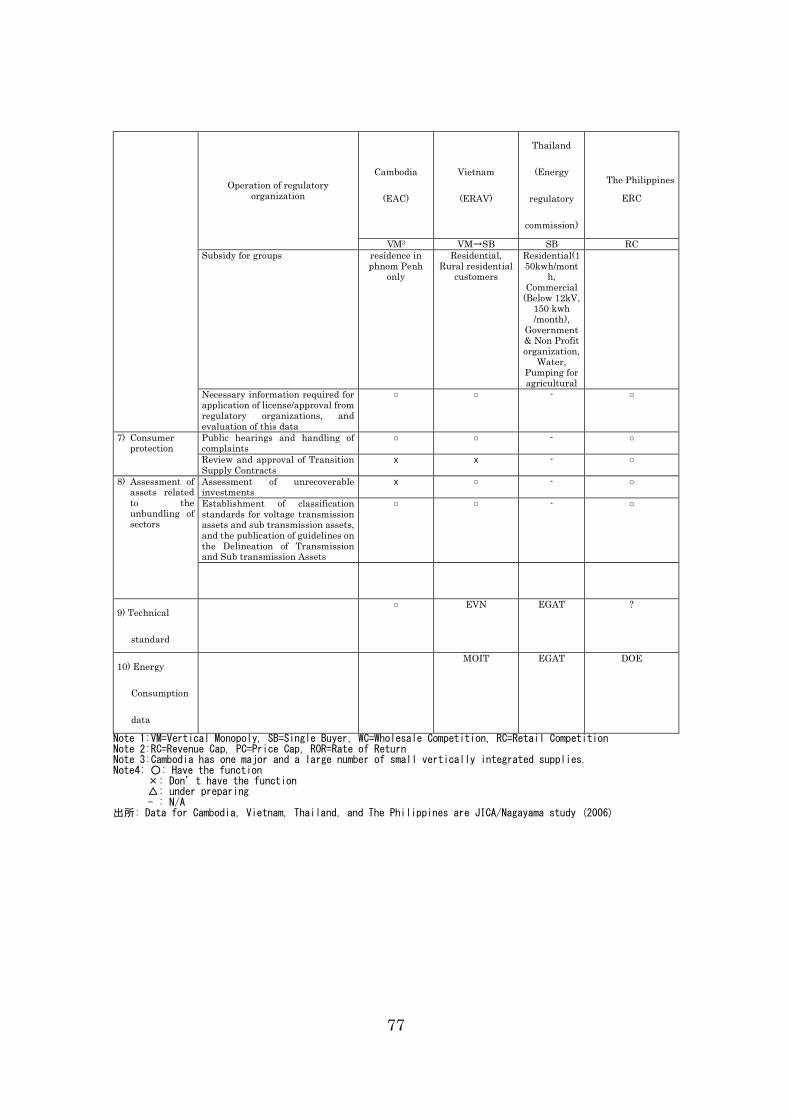
77
Operation of regulatory
organization
Cambodia
(EAC)
Vietnam
(ERAV)
Thailand
(Energy
regulatory
commission)
The Philippines
ERC
VM3 VM→SB SB RC
Subsidy for groups residence in phnom Penh
only
Residential, Rural residential
customers
Residential(150kwh/mont
h, Commercial
(Below 12kV, 150 kwh /month),
Government & Non Profit organization,
Water, Pumping for agricultural
Necessary information required for application of license/approval from regulatory organizations, and evaluation of this data
○ ○ - ○
7) Consumer protection
Public hearings and handling of complaints
○ ○ - ○
Review and approval of Transition Supply Contracts
x x - ○
8) Assessment of assets related to the unbundling of sectors
Assessment of unrecoverable investments
x ○ - ○
Establishment of classification standards for voltage transmission assets and sub transmission assets, and the publication of guidelines on the Delineation of Transmission and Sub transmission Assets
○ ○ - ○
9) Technical
standard
○ EVN EGAT ?
10) Energy
Consumption
data
MOIT EGAT DOE
Note 1: VM=Vertical Monopoly, SB=Single Buyer, WC=Wholesale Competition, RC=Retail Competition Note 2: RC=Revenue Cap, PC=Price Cap, ROR=Rate of Return Note 3: Cambodia has one major and a large number of small vertically integrated supplies. Note4: ○: Have the function
×: Don’t have the function △: under preparing - : N/A
出所: Data for Cambodia, Vietnam, Thailand, and The Philippines are JICA/Nagayama study (2006)
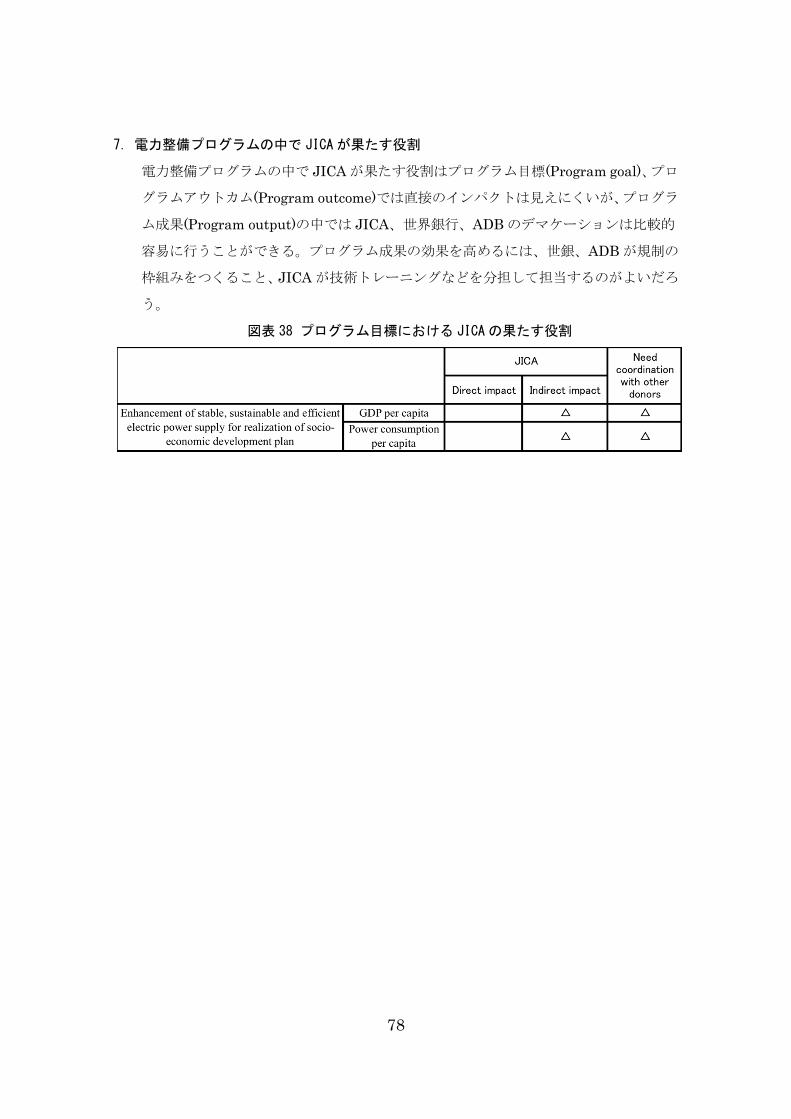
78
7.電力整備プログラムの中で JICAが果たす役割
電力整備プログラムの中で JICA が果たす役割はプログラム目標(Program goal)、プロ
グラムアウトカム(Program outcome)では直接のインパクトは見えにくいが、プログラ
ム成果(Program output)の中では JICA、世界銀行、ADB のデマケーションは比較的
容易に行うことができる。プログラム成果の効果を高めるには、世銀、ADB が規制の
枠組みをつくること、JICA が技術トレーニングなどを分担して担当するのがよいだろ
う。
図表 38 プログラム目標における JICAの果たす役割
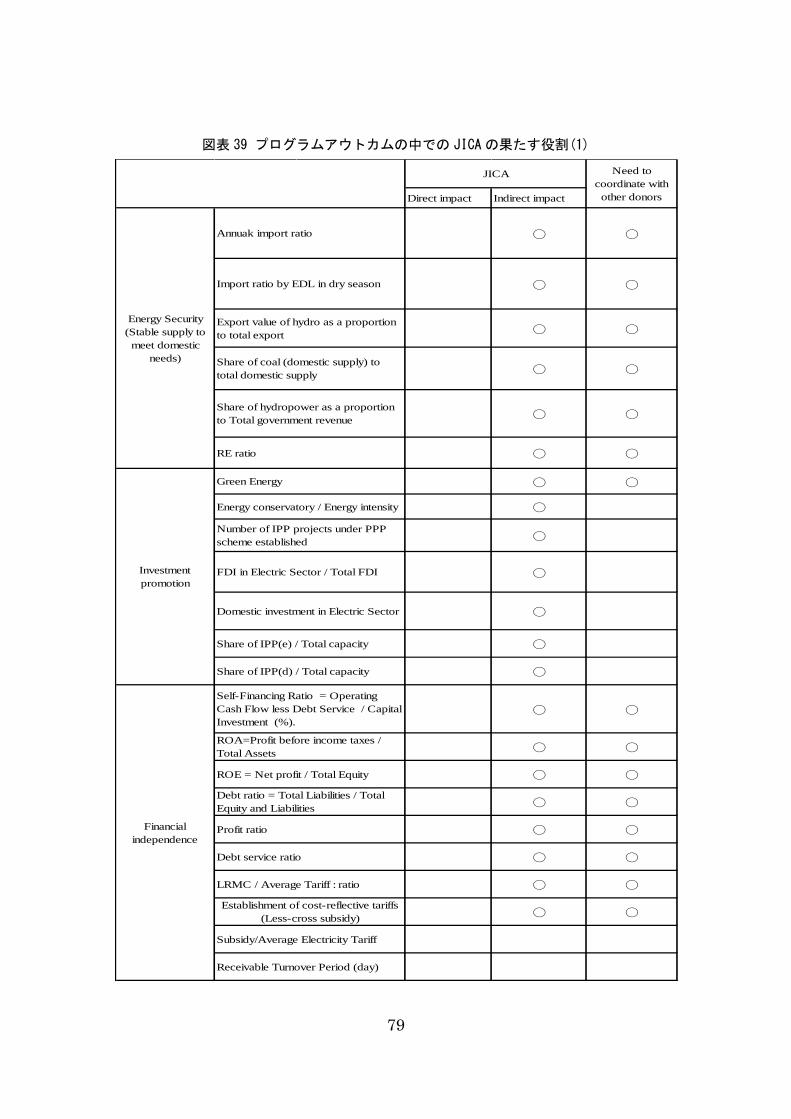
79
図表 39 プログラムアウトカムの中での JICAの果たす役割(1)
Direct impact Indirect impact
◯ ◯
◯ ◯
◯ ◯
◯ ◯
◯ ◯
◯ ◯
◯ ◯
◯
◯
◯
◯
◯
◯
◯ ◯
◯ ◯
◯ ◯
◯ ◯
◯ ◯
◯ ◯
◯ ◯
◯ ◯
Investment
promotion
Green Energy
Energy conservatory / Energy intensity
Number of IPP projects under PPP
scheme established
FDI in Electric Sector / Total FDI
Energy Security
(Stable supply to
meet domestic
needs)
Annuak import ratio
Export value of hydro as a proportion
to total export
Share of coal (domestic supply) to
total domestic supply
Share of hydropower as a proportion
to Total government revenue
Receivable Turnover Period (day)
Debt service ratio
LRMC / Average Tariff : ratio
Subsidy/Average Electricity Tariff
Self-Financing Ratio = Operating
Cash Flow less Debt Service / Capital
Investment (%).
ROA=Profit before income taxes /
Total Assets
ROE = Net profit / Total Equity
Debt ratio = Total Liabilities / Total
Equity and Liabilities
Profit ratio
Import ratio by EDL in dry season
RE ratio
Need to
coordinate with
other donors
JICA
Financial
independence
Establishment of cost-reflective tariffs
(Less-cross subsidy)
Domestic investment in Electric Sector
Share of IPP(e) / Total capacity
Share of IPP(d) / Total capacity
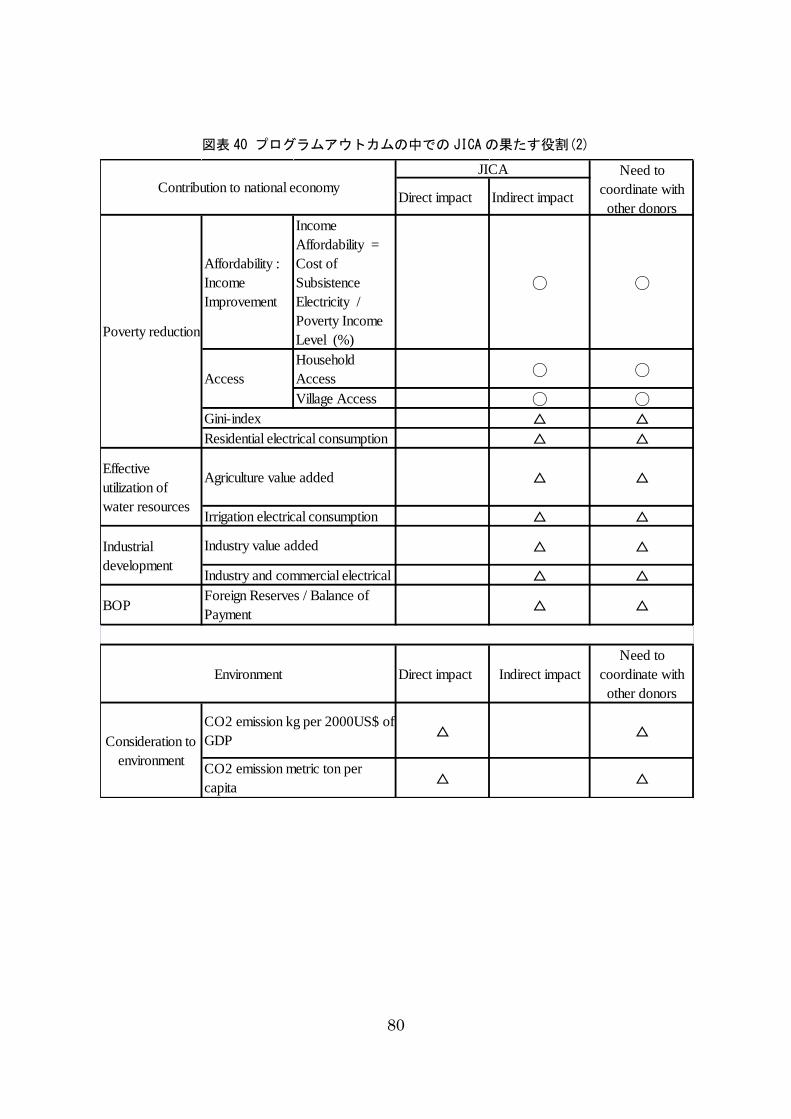
80
図表 40 プログラムアウトカムの中での JICAの果たす役割(2)
Direct impact Indirect impact
Affordability :
Income
Improvement
Income
Affordability =
Cost of
Subsistence
Electricity /
Poverty Income
Level (%)
◯ ◯
Household
Access◯ ◯
Village Access ◯ ◯
△ △
△ △
△ △
△ △
△ △
△ △
BOP △ △
Direct impact Indirect impact
Need to
coordinate with
other donors
△ △
△ △
Contribution to national economy
JICA Need to
coordinate with
other donors
CO2 emission kg per 2000US$ of
GDP
CO2 emission metric ton per
capita
Consideration to
environment
Environment
Access
Gini-index
Agriculture value added
Industry value added
Foreign Reserves / Balance of
Payment
Poverty reduction
Residential electrical consumption
Effective
utilization of
water resourcesIrrigation electrical consumption
Industrial
developmentIndustry and commercial electrical
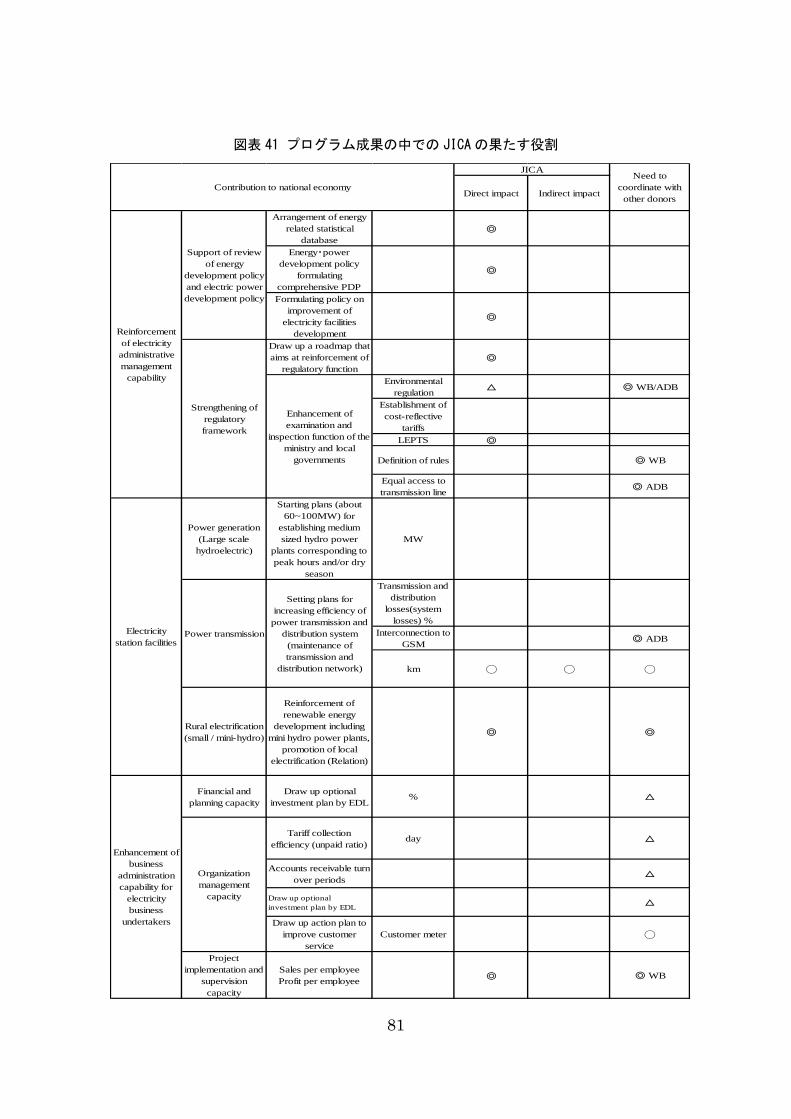
81
図表 41 プログラム成果の中での JICAの果たす役割
Direct impact Indirect impact
Arrangement of energy
related statistical
database
◎
Energy・power
development policy
formulating
comprehensive PDP
◎
Formulating policy on
improvement of
electricity facilities
development
◎
Draw up a roadmap that
aims at reinforcement of
regulatory function
◎
Environmental
regulation△ ◎ WB/ADB
Establishment of
cost-reflective
tariffs
LEPTS ◎
Definition of rules ◎ WB
Equal access to
transmission line◎ ADB
Power generation
(Large scale
hydroelectric)
Starting plans (about
60~100MW) for
establishing medium
sized hydro power
plants corresponding to
peak hours and/or dry
season
MW
Transmission and
distribution
losses(system
losses) %
Interconnection to
GSM◎ ADB
km ◯ ◯ ◯
Rural electrification
(small / mini-hydro)
Reinforcement of
renewable energy
development including
mini hydro power plants,
promotion of local
electrification (Relation)
◎ ◎
Financial and
planning capacity
Draw up optional
investment plan by EDL% △
Tariff collection
efficiency (unpaid ratio)day △
Accounts receivable turn
over periods△
Draw up optional
investment plan by EDL△
Draw up action plan to
improve customer
service
Customer meter ◯
Project
implementation and
supervision
capacity
Sales per employee
Profit per employee◎ ◎ WB
JICANeed to
coordinate with
other donors
Contribution to national economy
Organization
management
capacity
Enhancement of
business
administration
capability for
electricity
business
undertakers
Reinforcement
of electricity
administrative
management
capability
Support of review
of energy
development policy
and electric power
development policy
Strengthening of
regulatory
framework
Enhancement of
examination and
inspection function of the
ministry and local
governments
Electricity
station facilitiesPower transmission
Setting plans for
increasing efficiency of
power transmission and
distribution system
(maintenance of
transmission and
distribution network)
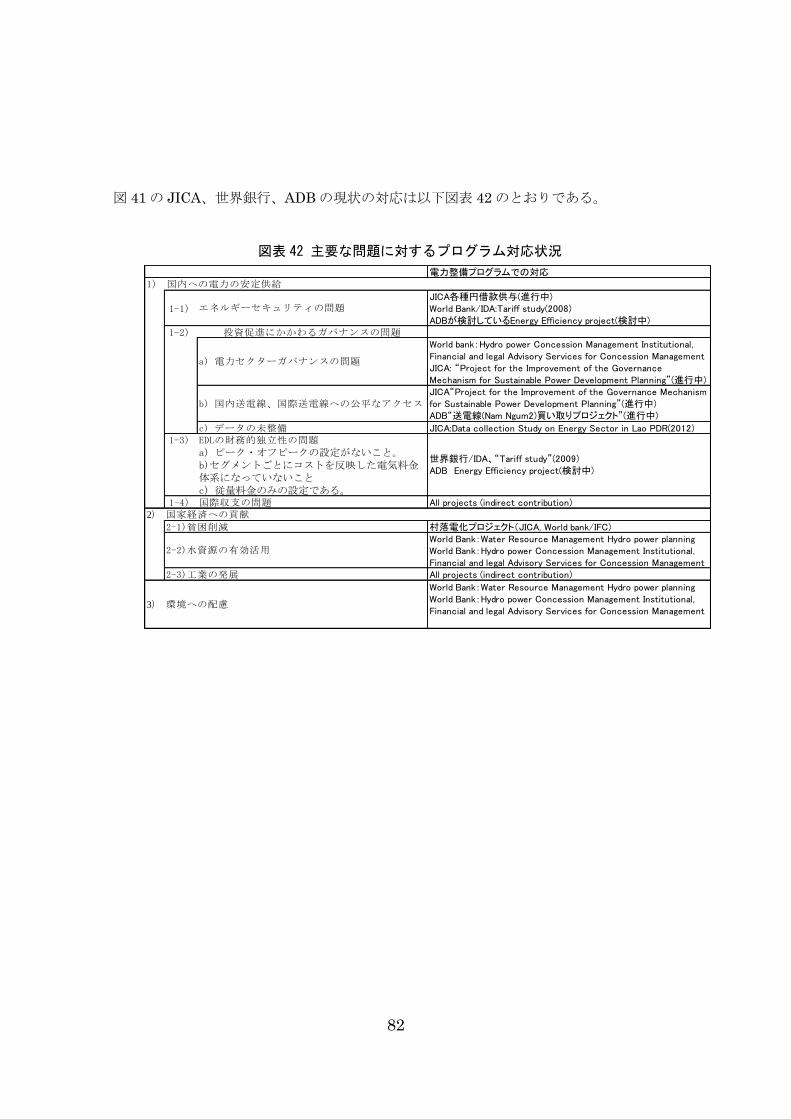
82
図 41 の JICA、世界銀行、ADB の現状の対応は以下図表 42 のとおりである。
図表 42 主要な問題に対するプログラム対応状況
電力整備プログラムでの対応
1-1)JICA各種円借款供与(進行中)World Bank/IDA:Tariff study(2008)ADBが検討しているEnergy Efficiency project(検討中)
1-2)World bank:Hydro power Concession Management Institutional,Financial and legal Advisory Services for Concession ManagementJICA: “Project for the Improvement of the GovernanceMechanism for Sustainable Power Development Planning”(進行中)JICA“Project for the Improvement of the Governance Mechanismfor Sustainable Power Development Planning”(進行中)ADB“送電線(Nam Ngum2)買い取りプロジェクト”(進行中)
JICA:Data collection Study on Energy Sector in Lao PDR(2012)1-3)
1-4) All projects (indirect contribution)
村落電化プロジェクト(JICA, World bank/IFC)World Bank:Water Resource Management Hydro power planningWorld Bank:Hydro power Concession Management Institutional,Financial and legal Advisory Services for Concession ManagementAll projects (indirect contribution)
World Bank:Water Resource Management Hydro power planningWorld Bank:Hydro power Concession Management Institutional,Financial and legal Advisory Services for Concession Management
3) 環境への配慮
エネルギーセキュリティの問題
EDLの財務的独立性の問題
投資促進にかかわるガバナンスの問題
国際収支の問題c) 従量料金のみの設定である。
2-1)貧困削減
2-2)水資源の有効活用
2-3)工業の発展
a) 電力セクターガバナンスの問題
b) 国内送電線、国際送電線への公平なアクセス
c) データの未整備
a) ピーク・オフピークの設定がないこと。b)セグメントごとにコストを反映した電気料金体系になっていないこと
2) 国家経済への貢献
1) 国内への電力の安定供給
世界銀行/IDA、“Tariff study”(2009)ADB Energy Efficiency project(検討中)
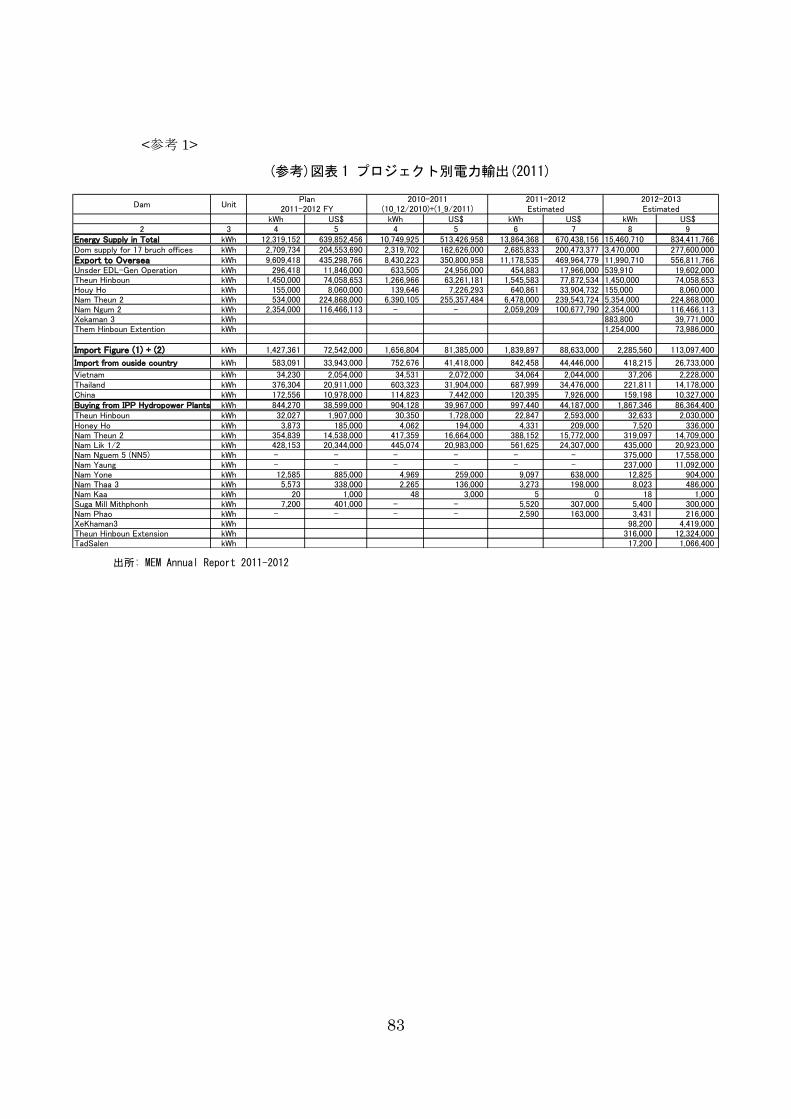
83
<参考 1>
(参考)図表 1 プロジェクト別電力輸出(2011)
出所: MEM Annual Report 2011-2012
Dam Unit
kWh US$ kWh US$ kWh US$ kWh US$2 3 4 5 4 5 6 7 8 9
Energy Supply in Total kWh 12,319,152 639,852,456 10,749,925 513,426,958 13,864,368 670,438,156 15,460,710 834,411,766Dom supply for 17 bruch offices kWh 2,709,734 204,553,690 2,319,702 162,626,000 2,685,833 200,473,377 3,470,000 277,600,000Export to Oversea kWh 9,609,418 435,298,766 8,430,223 350,800,958 11,178,535 469,964,779 11,990,710 556,811,766Unsder EDL-Gen Operation kWh 296,418 11,846,000 633,505 24,956,000 454,883 17,966,000 539,910 19,602,000Theun Hinboun kWh 1,450,000 74,058,653 1,266,966 63,261,181 1,545,583 77,872,534 1,450,000 74,058,653Houy Ho kWh 155,000 8,060,000 139,646 7,226,293 640,861 33,904,732 155,000 8,060,000Nam Theun 2 kWh 534,000 224,868,000 6,390,105 255,357,484 6,478,000 239,543,724 5,354,000 224,868,000Nam Ngum 2 kWh 2,354,000 116,466,113 - - 2,059,209 100,677,790 2,354,000 116,466,113Xekaman 3 kWh 883,800 39,771,000Them Hinboun Extention kWh 1,254,000 73,986,000
Import Figure (1) + (2) kWh 1,427,361 72,542,000 1,656,804 81,385,000 1,839,897 88,633,000 2,285,560 113,097,400
Import from ouside country kWh 583,091 33,943,000 752,676 41,418,000 842,458 44,446,000 418,215 26,733,000
Vietnam kWh 34,230 2,054,000 34,531 2,072,000 34,064 2,044,000 37,206 2,228,000Thailand kWh 376,304 20,911,000 603,323 31,904,000 687,999 34,476,000 221,811 14,178,000China kWh 172,556 10,978,000 114,823 7,442,000 120,395 7,926,000 159,198 10,327,000Buying from IPP Hydropower Plants kWh 844,270 38,599,000 904,128 39,967,000 997,440 44,187,000 1,867,346 86,364,400Theun Hinboun kWh 32,027 1,907,000 30,350 1,728,000 22,847 2,593,000 32,633 2,030,000Honey Ho kWh 3,873 185,000 4,062 194,000 4,331 209,000 7,520 336,000Nam Theun 2 kWh 354,839 14,538,000 417,359 16,664,000 388,152 15,772,000 319,097 14,709,000Nam Lik 1/2 kWh 428,153 20,344,000 445,074 20,983,000 561,625 24,307,000 435,000 20,923,000Nam Nguem 5 (NN5) kWh - - - - - - 375,000 17,558,000Nam Yaung kWh - - - - - - 237,000 11,092,000Nam Yone kWh 12,585 885,000 4,969 259,000 9,097 638,000 12,825 904,000Nam Thaa 3 kWh 5,573 338,000 2,265 136,000 3,273 198,000 8,023 486,000Nam Kaa kWh 20 1,000 48 3,000 5 0 18 1,000Suga Mill Mithphonh kWh 7,200 401,000 - - 5,520 307,000 5,400 300,000Nam Phao kWh - - - - 2,590 163,000 3,431 216,000XeKhaman3 kWh 98,200 4,419,000Theun Hinboun Extension kWh 316,000 12,324,000TadSalen kWh 17,200 1,066,400
2012-2013Estimated
Plan2011-2012 FY
2010-2011(10_12/2010)+(1_9/2011)
2011-2012Estimated
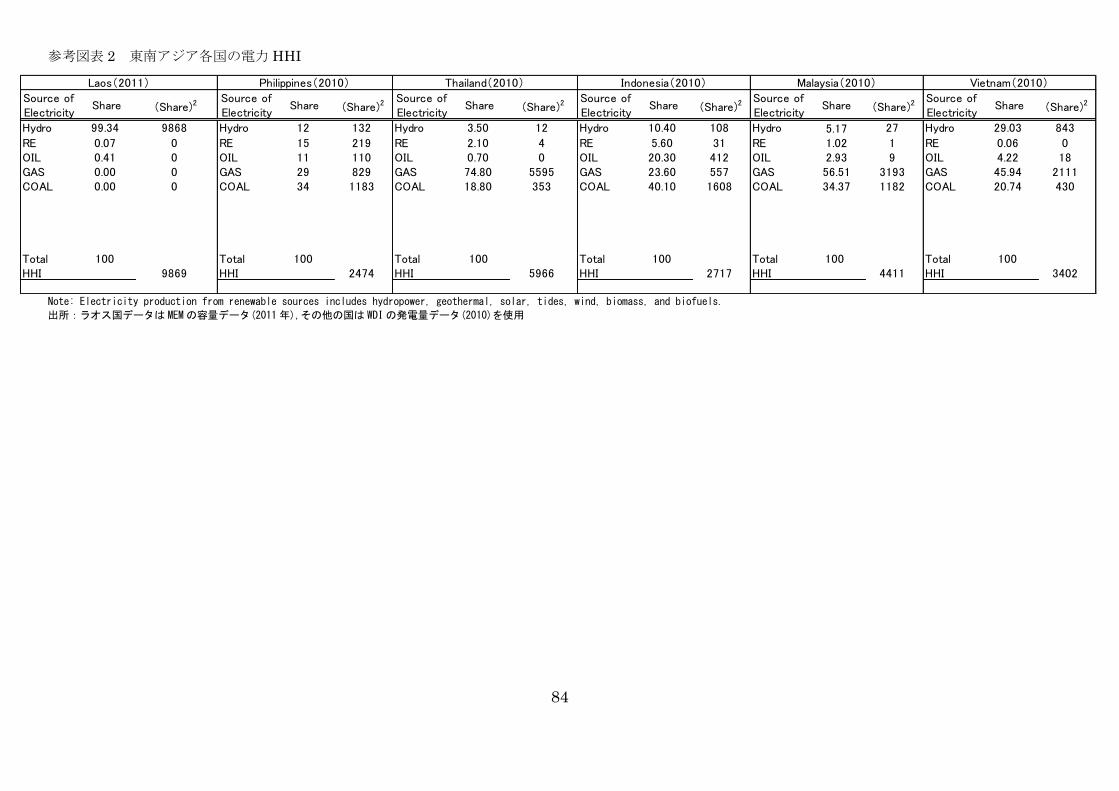
84
参考図表 2 東南アジア各国の電力 HHI
Note: Electricity production from renewable sources includes hydropower, geothermal, solar, tides, wind, biomass, and biofuels.
出所:ラオス国データは MEMの容量データ(2011年),その他の国は WDIの発電量データ(2010)を使用
Source ofElectricity
Share (Share)2 Source ofElectricity
Share (Share)2 Source ofElectricity
Share (Share)2 Source ofElectricity
Share (Share)2 Source ofElectricity
Share (Share)2 Source ofElectricity
Share (Share)2
Hydro 99.34 9868 Hydro 12 132 Hydro 3.50 12 Hydro 10.40 108 Hydro 5.17 27 Hydro 29.03 843
RE 0.07 0 RE 15 219 RE 2.10 4 RE 5.60 31 RE 1.02 1 RE 0.06 0OIL 0.41 0 OIL 11 110 OIL 0.70 0 OIL 20.30 412 OIL 2.93 9 OIL 4.22 18GAS 0.00 0 GAS 29 829 GAS 74.80 5595 GAS 23.60 557 GAS 56.51 3193 GAS 45.94 2111COAL 0.00 0 COAL 34 1183 COAL 18.80 353 COAL 40.10 1608 COAL 34.37 1182 COAL 20.74 430
Total 100 Total 100 Total 100 Total 100 Total 100 Total 100HHI 9869 HHI 2474 HHI 5966 HHI 2717 HHI 4411 HHI 3402
Laos(2011) Philippines(2010) Thailand(2010) Indonesia(2010) Malaysia(2010) Vietnam(2010)
85
<参考 3. 世界銀行の支援プロジェクト>
■ Nam Ngum1 Power Project(1982 年)
● 目的:Nam Ngum1 発電所 5 号機設置
● 金額:20.0 (IDA Loan 他)
●出所:JICA 専門家報告書 2013
■ 地方グリッド統合プロジェクト Provincial Grid Integration Project (1992 年)
● 目的:中部・南部県 EDL Grid 延伸、EDL 運転管理
● 金額:36.0 (IDA Loan)
●出所:JICA 専門家報告書 2013
■ 南部地域電化プロジェクト Southern Provinces Rural Electrification Project (1998
年 3 月~2004 年 12 月)
● 目的:七つの中部と南部の県で地方電化を拡大するとともに、EDL が商業ベースで電化
への投資を進める計画・実行能力の強化を図る。プロジェクトのコンポーネントは次のとお
り。
• 配電線延長:配電線の低コストな延伸(電化地域の下位送電システム
を含む)
• オフグリッド電化:独立型システム(再生可能エネルギーを含む)。
• 制度構築:プロジェクトマネジメントと商業化について EDL を支援。
● プロジェクトコスト:USD34.7 million(全額 IBRD/IDA)。
● 出所:The World Bank HP
■ Nam Theun 2 (NT2) 水力発電プロジェクト (2005 年 3 月~NA)
● 目的:プロジェクトは、ダム貯水池を含む水力発電所の建設(タイ向けの 995MW と国内
向けの 75MW)および Nakai 台地の環境社会影響の管理からなる。
Nam Theun 2 プロジェクトは天然資源管理の実践的な好例として発展した
● プロジェクトコスト:USD1450 million(IDA は USD42 million)
● 出所
The World Bank HP
International development association and international finance corporation "Country
86
Partnership Strategy for Lao Peoples Democratic Republic" P. 8
■ 地方電化プログラムのフェーズ 1 地方電化プロジェクト
Rural Electrification Phase I Project of the Rural Electrification (APL) Program (2006 年
4 月~2010 年 3 月)
● 目的:目的は、地方の家庭に対する電気へのアクセスの増加および電力部門の財務状況
の改善。プロジェクトのコンポーネントは次の二つ。
• 地方部の 4 万 2000 世帯の EDL グリッドへの接続。
• オフグリッドによる 1 万世帯の電化。
● プロジェクトコスト:USD36.3 million(うち、IBRD/IDA が USD10 million、GEF が
USD3.75 million)
● 出所:The World Bank HP
■ GMS 電力融通プロジェクト
GMS Power Trade (Laos) Project (2007 年 6 月~2013 年 12 月)
● 目的:GMS 電力グリッドの合理化と参加国の経済発展を進める。プロジェクトのコン
ポーネントは次のとおり。
• ラオスの Ban Hat 変電所から国境までの 115kV 送電線の建設。
• タイ、ラオス、カンボジアの 115kV 送電線の連系。
• 上記二つの設計と管理のためのコンサルティング・サービス。
• 給電司令センターの設置。
• Houay Lamphan Gnai 水力発電プロジェクトのフィージビリティ
調査。
• コレクター変電システムの検討に係わる TA
● プロジェクトコスト:USD18.8 million(うち、IBRD/IDA は USD15 million)
● 出所:The World Bank HP
■ ラオス PDR 第 4 次貧困削減支援管理
Lao PDR Fourth Poverty Reduction Support Operation (2008 年 6 月 17 日〜2009 年 3 月
31 日)
● 目的:ラオス国、IDA の設定した貧困削減戦略を目指し成長の維持、社会環境の整備を
政策の柱とする。そのために次の 2 つを改善する。
・投資環境、競争、ビジネスの開発
87
・公的経営システムとサービス提供
・PRSO(Poverty Reduction and Support Operation)は政策問題の対話に効果的なプラット
フォームにその期間中ますます国主導となっていくプロセスを提供した。その枠組みは改革
者、とくに財務省、さらには他の組織の立場を強くし、彼らは改革の意思を内外に伝達させ
るために PRSO を採用した。
The PRSOs provided an effective platform for dialogue on policy issues with the process
becoming increasingly country-led during the period. The framework strengthened the
position of reformers, in particular in the Ministry of Finance, but also in other agencies,
and they adopted the PRSOs to communicate reform intentions, both internally and
externally.
● プロジェクトコスト:USD10 million
● 出所
The World Bank HP
International development association and international finance corporation "Country
Partnership Strategy for Lao Peoples Democratic Republic" P. 47
■ 第 5 次貧困削減支援
Fifth Poverty Reduction Support (2009 年 8 月 26 日〜2010 年 3 月 31 日)
● 目的:成長を維持し社会環境を整えるために次の国家援助戦略を支えていく
• 地域合併、民間セクターの発展、地方の開発、自然資源の管理により成長を維持
• 公共経営システム、サービス提供能力の強化、貧困削減プログラムを通じて社会環境の
向上を図る
• 能力改善、国家社会経済開発計画の支援に向けた戦略を採用
• 収益管理システムを重視した水力発電の導入(第二次 Nam Theun 水力発電プロジェク
ト)の推進
● プロジェクトコスト:USD20 million
● 出所:The World Bank HP
■ Lao PDR: Post-Ketsana Community Driven Disaster Recovery (2010 年 9 月 30 日〜
2011 年 12 月 31 日)
● プロジェクトコスト:USD0.47 million
● 出所:The World Bank HP
88
■ 第 6 次貧困削減支援運営プログラム
Sixth Poverty Reduction Support Operation Program (2010 年〜2011 年)
● 目的:国家社会経済開発計画の枠組みとして設定された成長維持、社会環境整備という
ラオス国の戦略を支援する。
● プロジェクトコスト:USD20 million
● 出所:The World Bank HP
■ 水力発電および鉱山部門における開発能力への技術支援
Technical Assistance for Capacity Development in Hydropower and Mining Sectors
(2010 年〜2014 年)
● 目的:これは水力発電及び鉱山における人材育成に係る支援で、下記の4つの component
から構成されている。
• 水力発電および鉱山学習結合プログラム(2.26 MUS$)
“部門の専門家たちの学習プログラムの継続
“教育部門支援
“株主への奉仕活動および情報共有
• 水力発電部門開発(2.71 MUS$)
“水力発電計画
“水力発電利権管理
“水力発電経営と NPSH の実現
• 鉱山部門開発(2.31 MUS$)
“セクターガバナンスの向上と環境整備
“政府の監視能力の強化
“鉱物開発促進プログラム
• プロジェクト管理と経営 (0.72 MUS$)
● プロジェクトコスト: USD8 million
● 出所
専門家報告書(2013)
Technical Assistance for Capacity Building for the Hydropower and Mining Sectors
(HMTA) Hydropower Concession Management
■ラオス民主主義人民共和国とメコン川の嘱託 – メコン統合水資源管理プロジェクト
Lao-People’s Democratic Republic and Mekong River Commission – Mekong
89
Integrated Water Resources Management Project
●目的:地域、国家、準国家レベルでのメコン川下流域の水資源管理のための法整備
提案されたメコン統合水資源管理プロジェクトは水部門支援のプラットフォームを提供し、
銀行は現在のラオスの社会環境プロジェクトのフォローアップとして環境部門管理の強化
を目的としてより広い環境および自然資源管理プロジェクトを開始する計画である。
● 出所
The World Bank HP
International development association and international finance corporation "Country
Partnership Strategy for Lao Peoples Democratic Republic" P. 27
■ 地方電化プログラムの地方電化フェーズ 2 プロジェクト
Rural Electrification Phase II Project of the Rural Electrification (APL) Program
● 目的:Phase 1 からさらに資金が投下されることで次の 2 つの目標に向けての活動規模
を拡大して行なっていく。
・地方世帯の電力へのアクセスの改善
・ラオス電力の経営パフォーマンスの改善
● プロジェクトコスト: USD10.45 million
● 出所:The World Bank HP
■ GEF プロジェクト:ラオス地方電化フェーズ 2 プロジェクト
GEF Project: Lao Rural Electrification Phase II Project (2011 年〜2014 年)
●目的:地方農村世帯の電力へのアクセスの向上及び EDL の経営パフォーマンス向上
●コスト:USD 10.45
millionhttp://www.worldbank.org/projects/P117177/gef-project-lao-rural-electrification-
phase-ii-project?lang=en
● 出所:The World Bank HP
■生活改善と裕福になるためのラオス PDR 民族社会動員
Lao PDR Mobilizing Ethnic Communities for Improved Livelihoods and Wellbeing (2012
年〜)
●コスト: USD 2.86 million
● 出所:The World Bank HP
90
■ LA Poverty Reduction Fund II (PRF II) (2011-2016)
●目的: 持続可能な方法で対象地域の基本的インフラ、サービスへのアクセスを
向上させること
PRF の受益者と技術評価は健康、教育、交通機関へのアクセスに結果的に結び付く。
●コスト:USD 57 million
● 出所
The World Bank HP
International development association and international finance corporation "Country
Partnership Strategy for Lao Peoples Democratic Republic" P. 58
■第 7 次貧困削減支援管理(PRSO7)プログラム
Seventh Poverty Reduction Support Operation (PRSO7) Program (2011-2012)
●目的:中期的な持続的成長を確実なものにすると共に利潤の移動を円滑にし、
貧困削減戦略に利用可能な資源を十分に確保する
●コスト:USD 10 million
● 出所:The World Bank HP
■ Water Resource Management and Hydropower Planning (水資源管理及び水力発電計
画) (2011〜)
●目的:ラオス国の水力発電開発をサポートしキャパシティビルディングを行う。
■ Hydropower Concession Management (水力発電コンセッション管理)
●目的 :Technical Assistance for Capacity Building in the Hydropower and Mining
Sectors
プロジェクトにおける建設、操業がコンセッション契約に沿って行われるようにする。
■ラオス PDR – 主流な災害および気候のリスクマネジメントを投資の意思決定に含める。
Lao PDR – Mainstreaming Disaster and Climate Risk Management into Investment
Decisions (November 28th 2011~)
●プロジェクトコスト:USD 2.72 million
● 出所:The World Bank HP
■南部地域電化プロジェクト Southern Provinces Electrification Project (1987~1994)
91
●目的:低コストな電力供給の解決及び電力セクターインフラの整備。また、電力サブセク
ターにおける機関 、特に EDL と南部の電力機関の機能の改善、115kV 送電線(タイ国境~
Xeset 発電所)、Pakse 変電所、南部県地方電化、水力発電計画調査
●プロジェクトコスト:USD 25.8 million
● 出所:The World Bank HP
■ Institutional, Technical, Financial and Legal Advisory Services for Hydropower
Concession Management(2011 年〜)
●目的
・ Institutional development advisory input (to advise DEB on the
establishment of a suitable IPP Concession Management Unit
which would be responsible for managing and monitoring the
DEB mandate on a day to day basis)
・ Technical advisory input (to provide technical advice and support
services to DEB on all hydropower projects undertaken by DEB
with an installed capacity of 50MW or greater)
・ Financial advisory input
・ Legal advisory input
・ Training seminars/workshops
● 出所
Terms of Reference “Institutional, Technical, Financial and Legal Advisory Services for
Hydropower Concession Management” P.49-54
92
<参考 4. ADB の支援プロジェクト>
■ Xeset 発電所建設(1987 年)
● 目的:水力発電所と送電線
● 金額:12.04 MUS$ Loan
●出所:JICA 専門家報告書 2013
■ Nam Ngum-Luangprabang 送電線建設(1988 年)
● 目的:Nam Ngum-Luangprabang 間 115kV 送電線
● 金額:15.6 MUS$ Loan
●出所:JICA 専門家報告書 2013
■Theun Hinboun 発電所建設(1994 年)
● 目的:水力発電所と送電線
● 金額:57.7 MUS$ Loan((NDF 7.3, 他 7.5))
●出所:JICA 専門家報告書 2013
■ 送配電プロジェクト
Power Transmission and Distribution Project (1997~2002)
●目的
ラオス北部の系統の整備等を通じ、EDL の運営効率を上げるためにローンを供与
ラオス北部の Xanakham, Xayaburi, Xiengkhuang 地域にグリッドを拡張すると同時に、
北部のより多くの地域に配電できるようにする。
●プロジェクトコスト:USD58.31(million)
● 出所:Asian Development Bank HP
Asian Development Bank Independent Evaluation Department “Sector Assistance
Program Evaluation for the Energy Sector in Lao People’s Democratic Republic” P.20
■Nam Leuk 水力発電プロジェクト(2002~)
● 目的
Nam Leuk 水力発電所の建設(ダム、トンネル、発電機など Civil works)のためのローン
防衛庁により管理される生物多様性保護区の管理、保護を強化することも主な目的の一つで
あり、観光開発プランを含む、また保護プログラムと開発プログラムの統合をするマネジメ
93
ントプランの導入を補助することが期待された。
● プロジェクトコスト:USD107(million)
● 出所
Asian Development Bank, Operations Evaluation Department, "Project performance
audit report on the Nam Leuk Hydropower Project in Lao People's Democratic Republic"
Asian Development Bank Independent Evaluation Department “Sector Assistance
Program Evaluation for the Energy Sector in Lao People’s Democratic Republic” P.118
■ 北部地域配電 Northern Area Rural Power Distribution
● 目的:NARPD : 北部 115kV 送変電設備及び配電線
北部地域への送電網を拡張し、地方電化を達成
● 金額:30 MUS$ Loan (NDF10.0, 他 11.5)
● 出所:JICA 専門家報告書 2013
Asian Development Bank Independent Evaluation Department “Sector Assistance
Program Evaluation for the Energy Sector in Lao People’s Democratic Republic”
Executive summary P.iii
■ Nam Theun 2 水力発電プロジェクト融資 (2005~)
● 内容
ローンの提供
● プロジェクトコスト
プロジェクトコストは USD1250million
出資 USD350million
負債 USD900million
内 ADB は USD20mllion を、ラオス政府を通じて供与(30 年返済、6 年据え置き)、NTPC
(Nam Theun 2 Power Company Limited)にはラオス政府の政府保証なしで USD50million
を供与
さらに USD50million まで、民間投資を促進するための政策リスク保険 Political Risk
guarantee を供与
● 出所:Asian Development Bank HP
■ Nam Theun 2 Hydropower Development Project フェーズ 1(TA:2003~2004)
● 目的
94
Nam Theun (1070MW (うち 95%をタイに輸出)
コンポーネントは
1)プロジェクトの累積的影響調査 Cumulative impact study (CIA)を行う
2)ラオス政府が水力プロジェクトを行うための制度的なキャパビル、特に社会、環境におけ
る影響緩和 Impact mitigation, プロジェクト管理 project management
3)政府がすべてのステイクホルダーと効果的なコミュニケーションを行うためのキャパシ
ティビルディング
4)ダムにより水没する地域での補償
5)NGO を通じた市民社会との協調
●プロジェクトコスト
USD700,000(グラントベースの TA)
● 出所:Asian Development Bank HP
■ Nam Ngum 3 水力発電プロジェクトの累積的影響調査
Cumulative Impact Assessment for the Nam Ngum 3 Hydropower Project (2007~)
● 内容
NN3 プロジェクトについての CIA 分析を含む環境、社会分析を行う。
● コスト
USD1.158 (million)
● 出所:Asian Development Bank HP
■ GMS 電力融通プロジェクトフェーズ 1(2003 年)
GMS Power Interconnection Project Phase I
● 目的: タイ、ラオス、ベトナムの電力システムの相互接続を可能にし、これらの国での
地方電力のやりとりを促す。
● 出所:Asian Development Bank HP
■ Nam Theun 2 水力発電開発プロジェクト
Nam Theun 2 Hydropower Development Project (Phase 2) (2004~)
●内容
フェーズ 2 プロジェクトで出資者の 1 人である EdFl (Elictricité de France International)
が 1 度撤退し、それから戻るという事態が発生したため、due diligence の見直しの調査を
行った。
95
世界銀行は NT2 プロジェクトに対して財務、経済インパクト及び需要の予測評価の点で関
与している。ADB はこの世銀の分析を review する。
• NT2 プロジェクトの使益がタイ、ラオス、EDL その他民間投資家、ラオスの消費者
の間で適切に分配されるか
• ADB と世銀は共同で〝National Poverty Eradication program〟(国家的貧困削減プ
ログラム)を実行するためのファンドを管理する Agency のガバナンスについてもレ
ビューする。
●プロジェクトコスト(TA)
USD 1million
● 出所:Asian Development Bank HP
■Small and Mini Hydroelectric Development Project(2009 年〜)
●目的
小水力開発に係る政策立案、建設のための計画調査を支援しているもので、1~15MW 規
模の幾つかの水力計画地点に対する FS 調査実施後、建設に係る支援を行う予定
送配電でのロスを減らし、電力供給を安定化する
●プロジェクトコスト(TA)
USD 0.6 million
● 出所:Asian Development Bank HP
Asian Development Bank Independent Evaluation Department “Sector Assistance
Program Evaluation for the Energy Sector in Lao People’s Democratic Republic” P.12
■ Na Bong-Udon Thani 送電プロジェクト(2007 年〜)
Na Bong-Udon Thani Power Transmission Project
● 目的: 環境、社会にとって持続可能な方法で水力発電を開発することでラオスの経済成
長を促す。また、GMS における電力取引を促す。
● 出所:Asian Development Bank HP
■遠隔地域での再生可能エネルギー開発プロジェクト
Renewable Energy Development in Remote Communities Project (2011〜)
●目的
太陽光による家庭発電、RET によるミニグリッド発電により 5.5MW のオフグリッド発
電を可能にする
96
● 出所:Asian Development Bank HP
■大メコン流域送電プロジェクト(2010~)
Greater Mekong Sub region Northern Power Transmission Project
●目的:Western Vientiane, Xaignabouli, Phongsali 県の顧客をターゲットに電力供給を
行うため、
オングリッドな地方電化をおこなうこと (韓国 Exim-Bank も一部出資)
●プロジェクトコスト:USD 20 million
● 出所:Asian Development Bank HP
■ 大メコン流域 Nam Ngum 3 水力発電プロジェクト(2011 年〜)
Greater Mekong Sub region Nam Ngum 3 Hydropower Project
●目的 http://www.adb.org/projects/41385-013/main?ref=countries/lao-pdr/projects
440MW の発電量の水力発電所を Nam Ngum ダムに設置
●プロジェクトコスト:USD 115.62 million
● 出所:Asian Development Bank HP
■Nabong 500 kV 変電送電施設プロジェクト
Nabong 500 kV Substation and Transmission Facility Project
●目的
初めての高圧変電送電施設の設置
●プロジェクトコスト:USD 89 million
● 出所:Asian Development Bank HP
■Nam Ngiep 1 水力発電プロジェクト
Nam Ngiep 1 Hydropower Project
●目的
経済成長と外貨獲得の源とし、貧困削減戦略に役立てる
■社会環境プログラム Environmental and Social Program---ESP
●目的
環境社会計画管理(新規水力開発の際のひな形となるグッドプラクティスとなっている)
97
■Nam Ngum3 発電所建設
● 目的:環境、社会へのセーフガードの遵守を高い水準で維持した上で、水力発電事業へ
のプライベートセクターの参入を促す
● 出所:JICA 専門家報告書 2013
Asian Development Bank Independent Evaluation Department “Sector Assistance
Program Evaluation for the Energy Sector in Lao People’s Democratic Republic” P.12
■Xepian Xenammoy 発電所建設
●出所:JICA 専門家報告書 2013
■GMS Northern Power Transmission 2
●目的:北部送電線建設
●出所:JICA 専門家報告書 2013
その他国機関
■ラオス再生可能エネルギー戦略開発およびキャパシティビルディング
Lao Renewable Energy Strategy Development and Capacity Building (2009-2010)(フィ
ンランド)
・目的:再生可能エネルギー開発戦略 (Renewable Energy Development Strategy---REDS)
作成につき支援、その後政府承認され、現在、政府が進める再生可能エネルギー開発におけ
る基本構想の柱となっている。
より有効なフレームワーク、規制、税制と、再生可能エネルギーのためのより効率的な行政
システムを確保する。
●出所:JICA 専門家報告書 2013
Republic of Finland - Ministry for Foreign Affairs “Ministry of Energy and Mines,
Department of Electricity, Lao Peoples Democratic Republic” P.3
■フィンランド未来研究センターFinland Future Research Center (FERC) 「エネルギー
と生活のつながり-ラオスでのデータ、人材育成、持続可能なエネルギー計画のシナリオ
Inter linkages between Energy and Livelihoods―Data, Training and Scenarios for
Sustainable Energy Planning in Laos (INES : 2010~2012 年 12 月)(フィンランド)
・目的:エネルギー計画作成のための人材育成支援(エネルギー消費・調達調査、エネルギ
98
ー需要想定、エネルギー計画モデル策定等)を MEM/PDEM 職員を対象に実施
出所:JICA 専門家報告書 2013
■Lao PDR Renewable Energy; Decree on Implementing and Development Strategy,
Data Collection and Capacity Building(2011 年〜)
・目的
再生可能エネルギーの利用料を増やす、再生可能エネルギーの効率的な利用を促す
・主な内容
1.法的枠組み、データ収集の準備
2. 中央、地方政府の短期的なキャパシティビルディング
3. バイオ燃料についての認知度を高める
4. 風力データロガーの追加的導入
5. データ収集
6. REN ストラテジーの開始
・費用
188,241 EUR (フィンランド政府より)
Source: Republic of Finland - Ministry for Foreign Affairs” Lao Peoples Democratic
Republic, Ministry of Energy and Mines, Department of Electricity, Renewable Unit”
99
<参考資料 5. 開発指標の評価>
プログラム目標の評価
Note 3: High evaluation 2: Middle evaluation 1: Low evaluation 0: No data available
Power consumption per
capita (kWh)kWh WDI 357(Laos)
640(Indonesia)
140(Philippines)
1034(Vietnam)
2243(Thailand) 3 3 3 N/A 9
Evaluation Criteria
<Benchmark>
2699(Thailand )
CommentsReference
Accessibility
3 3 9
Comparability Verifiability
Enhancement of stable,
sustainable and efficient
electric power supply for
realization of socio-
economic development
plan
GDP per capita(2011)
(2000 constant price)USD WDI
591(Laos)
737(Vietnam)
Data
Unit Source
2010~2015 2015~2020 2020~2025
<Benchmark >
1206(Indonesia )
1413(Philippines )
Total
3
Fit between
output and
outcome
N/A
100
プログラムアウトカムの評価(1) Stable supply of electricity
Note 3: High evaluation 2: Middle evaluation 1: Low evaluation 0: No data available
Reference Comments
% MEM 45% (2012 Average)
% MEM 66% (March 2012) 2 2 2 3 9
% BOL/IMF10.5%(2010)
27%(2013): IMF projection2 2 2 3 9
% PDP2012 0%4%(2015)Hongsa(100MW/2,356
MW)2 2 2 3 9
%IMF / MEM
annual report4.4%(2010) 5.2%(2016) 3 3 3 3 12
In MEM annual report,
there are data for IPP,
EDL respectively
%
PDP2012
RESD(2011)
WDI
0.18% (2011)
RESD
RE: 243MW (2020)
30% of Total energy consumption by
2025
RESD
RE: 728MW (2025)
<Benchmark: Mwh Base>
Vietnam 0.1% (2010)
Malaysia 1.02% (2010)
Indonesia 5.6% (2010)
Thailand 2.1% (2010)
Philippines 14.8% (2010)
3 3 3 3 12
WDI
MEM
Laos(2011)
9,869
<Benchmark:>
Thailand (2010)
5966
<Benchmark:>
Philippines 2,474(2010)
Indonesia 2,717(2010)
Vietnam 4,411(2010)
Malaysia 2,282(2010)
3
WDI
MEM99.5% (2011)
<Benchmark:: MWh Base>
Vietnam 75% (2010)
Malaysia 62.69% (2010)
Indonesia 39.6% (2010)
Thailand 80.4% (2010)
Philippines 55.1% (2010)
3 3 3 3 12
EIA
Btu per Year
2005 U.S.D
(Market
Exhchange
Rates)
Laos
10,832(2010)
<Benchmark:>
Thailand (2010) 20,585
Philippines (2010) 9,283
Malaysia (2010) 17,392
Indonesia (2010) 16,049
Vietnam (2010) 25,108
3 3 3 3 12
% MEM (Xekatam, NT2) 2 2 2 3 9
value / FF MPI 0.72% (2011) 3 3 3 3 12
value / FF MPI 3 3 3 3 12
%MEM (PDP
2010-2020)15% (2011) 13% (2020) 3 3 3 3 12
%MEM (PDP
2010-2020)31% (2011)
76% (2020)
<Benchmark>
Phillipines 55.1%
Vietnam 75%
3 3 3 3 12
% EDL0.07 (2010)
0.06(2011)Target>30%(WB covenants) 2 2 2 2 8
% EDL 1.35 (2010)<Benchmark> 7.7%
(2011:EGAT)3 3 3 3 12
% EDL 1.58 (2010)<Benchmark> 12.2%
(2011:EGAT)3 3 3 3 12
Ratio EDL0.64(2010)
1.3 (2011)
<Benchmark>
EGAT
0.59 (2011)
Target<1.5(WB covenants) 3 3 3 3 12
% EDL 5.09 (2010)<Benchmark> 7.3%
(2011:EGAT)3 3 3 3 12
% EDL 1.21 (2011) Target> 1.5(WB covenants) 2 2 2 2 8
US
AIDUS cents/kwh Laos 0
<Benchmark:>
Thailand 8.8
Philippines 0
Malaysia 4.51
Indonesia 8.38
1 1 1 3 6
“Implementation
Completion and results
report of the Rural
Electrification program”
(2012)
US cents/kwh
EDLのCost of supply
959kip/kWh (11.9 US cents / kWh) (2009)
946kip/kWh (11.8 US cents / kWh) (2010)
976kip/kWh (12.2 US cents / kWh) (2011)
<Benchmark:>
Thailand 19.18
Philippines 19.84
Indonesia 15.61
Malaysia 15.25
1 1 1 1 4
Ratio
World Bank
(Tariff study)
Meralco
(2012)
LRMC/Average tariff = 1.02
(Average tariff (2011) 647 kip/kWh
LRMC 661kip/kWh (Distribution LV before loss))
<Benchmark: Meralco(2012)>
Meralco(Philippines) 1
Malaysia 1.56
Thailand 1.58
Korea 2.05
Taiwan 2.16
Indonesia 1.98
<1 <1 1 1 1 1 4
Ratio EDL /USAID Laos(0), Only In-kind
<Benchmark>
Thailand 0.85
Indonesia 1.16
Malaysia 0.42
<Benchmark>
Philippines 01 1 1 1 4
Ratio of Industrial users
to residential userJETRO (2012) Laos (1.05)
<Benchmark>
Thailand 1.33
Indonesia 1
<Benchmark>
Philippines 0.6
Malaysia 0.86
Vietnam 0.84
1 1 1 1 4
Days Annual Report 85(2.3%) 45(1.2%):Targer EGAT(7days) 3 3 3 3 12
Share of coal (domestic supply) to total domestic supply
Share of hydropower as a proportion to Total government
revenue
Financial
Independence
Estimated Government Subsidy for residential customers @
150kwh
Estimated Average Set (Cost of sale) for residential
customers @ 150kwh
Share of IPP(e) / Total capacity
Share of IPP(d) / Total capacity
Self-Financing Ratio = Operating Cash Flow less Debt
Service / Capital Investment (%).
ROA = Profit before income taxes / Total Assets
Establishment of cost refrective tariffs
Source
Data
2010~2015 2015~2020
Evaluation Criteria
Fit between
output and
outcome
Annual import ratio
Accessibility Comparability2020~2025 Verifiability Total
Import ratio by EDL in dry season
Investment
promotion
LRMC / Average Tariff : ratio
Subsidy/Average Electricity Tariff
RE ratio (Solar + Wind + Small hydro + Solid waste +
Biomass / Biogass + Geothermal)
Unit
Debt to equity ratio
Profit ratio
Energy Security
(Stable supply to
meet domestic
needs)
Export value of hydro as a proportion to total export
Receivable Turnover Period (day)
HHI
Green Energy (RE + Hydro + Gas)
Energy intensity
Total Primary Energy Consumption per dollar of GDP
Number of IPP projects under PPP scheme established
ROE = Net profit / Total Equity
Debt service coverage ratio
FDI in Electric Sector / Total FDI
Domestic investment in Electric Sector
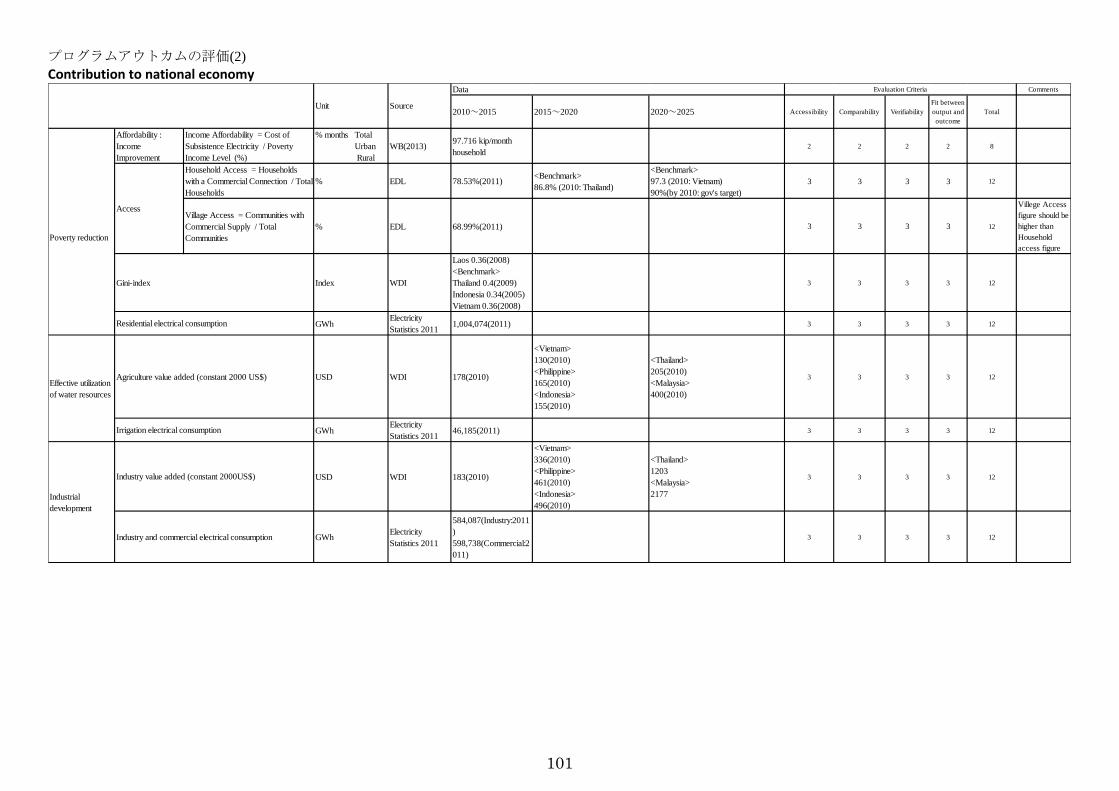
101
プログラムアウトカムの評価(2)
Contribution to national economy
Comments
Affordability :
Income
Improvement
Income Affordability = Cost of
Subsistence Electricity / Poverty
Income Level (%)
% months Total
Urban
Rural
WB(2013)97.716 kip/month
household2 2 2 2 8
Household Access = Households
with a Commercial Connection / Total
Households
% EDL 78.53%(2011)<Benchmark>
86.8% (2010: Thailand)
<Benchmark>
97.3 (2010: Vietnam)
90%(by 2010: gov's target)
3 3 3 3 12
Village Access = Communities with
Commercial Supply / Total
Communities
% EDL 68.99%(2011) 3 3 3 3 12
Villege Access
figure should be
higher than
Household
access figure
Index WDI
Laos 0.36(2008)
<Benchmark>
Thailand 0.4(2009)
Indonesia 0.34(2005)
Vietnam 0.36(2008)
3 3 3 3 12
GWhElectricity
Statistics 20111,004,074(2011) 3 3 3 3 12
USD WDI 178(2010)
<Vietnam>
130(2010)
<Philippine>
165(2010)
<Indonesia>
155(2010)
<Thailand>
205(2010)
<Malaysia>
400(2010)
3 3 3 3 12
GWhElectricity
Statistics 201146,185(2011) 3 3 3 3 12
USD WDI 183(2010)
<Vietnam>
336(2010)
<Philippine>
461(2010)
<Indonesia>
496(2010)
<Thailand>
1203
<Malaysia>
2177
3 3 3 3 12
GWhElectricity
Statistics 2011
584,087(Industry:2011
)
598,738(Commercial:2
011)
3 3 3 3 12
Unit
Access
Gini-index
Agriculture value added (constant 2000 US$)
Industry value added (constant 2000US$)
TotalSource
Data
2010~2015 2015~2020 2020~2025Fit between
output and
outcome
Evaluation Criteria
Accessibility Comparability Verifiability
Poverty reduction
Residential electrical consumption
Effective utilization
of water resources
Irrigation electrical consumption
Industrial
development
Industry and commercial electrical consumption
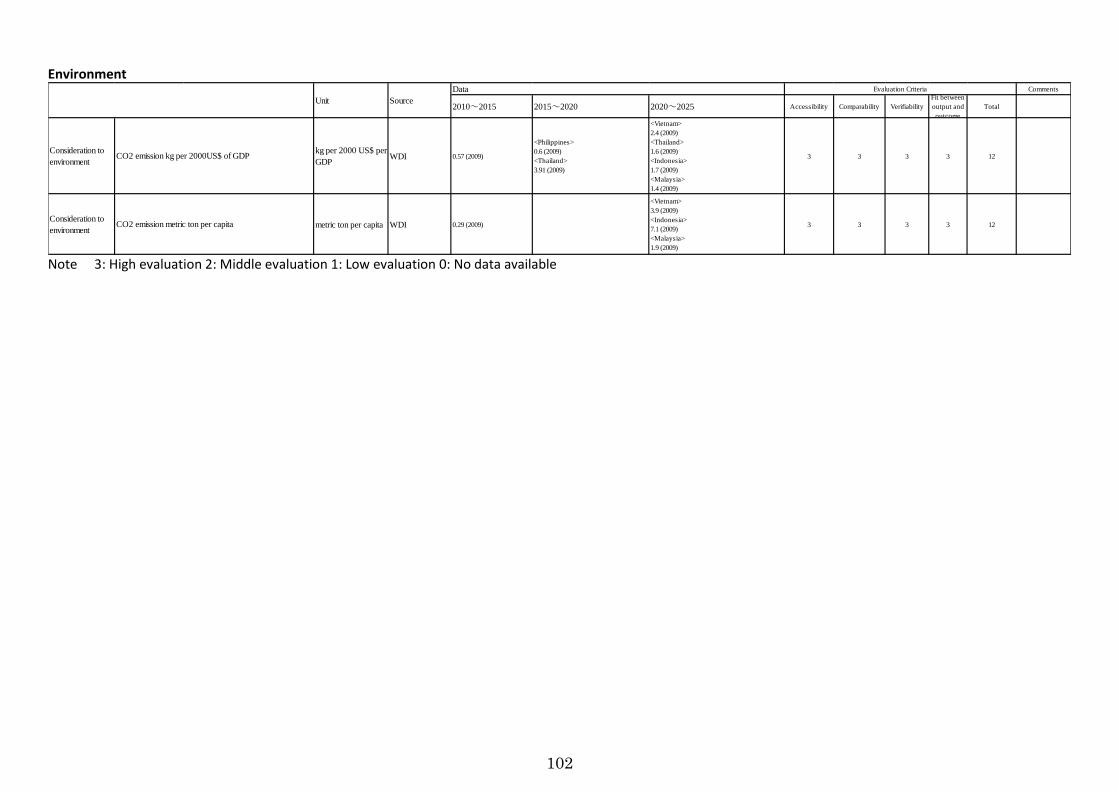
102
Environment
Note 3: High evaluation 2: Middle evaluation 1: Low evaluation 0: No data available
Comments
Consideration to
environment
kg per 2000 US$ per
GDPWDI 0.57 (2009)
<Philippines>
0.6 (2009)
<Thailand>
3.91 (2009)
<Vietnam>
2.4 (2009)
<Thailand>
1.6 (2009)
<Indonesia>
1.7 (2009)
<Malaysia>
1.4 (2009)
3 3 3 3 12
Consideration to
environmentmetric ton per capita WDI 0.29 (2009)
<Vietnam>
3.9 (2009)
<Indonesia>
7.1 (2009)
<Malaysia>
1.9 (2009)
3 3 3 3 12
Fit between
output and
outcome
CO2 emission metric ton per capita
Unit Source
Data
2010~2015 2015~2020
CO2 emission kg per 2000US$ of GDP
2020~2025
Evaluation Criteria
Accessibility Comparability Verifiability Total
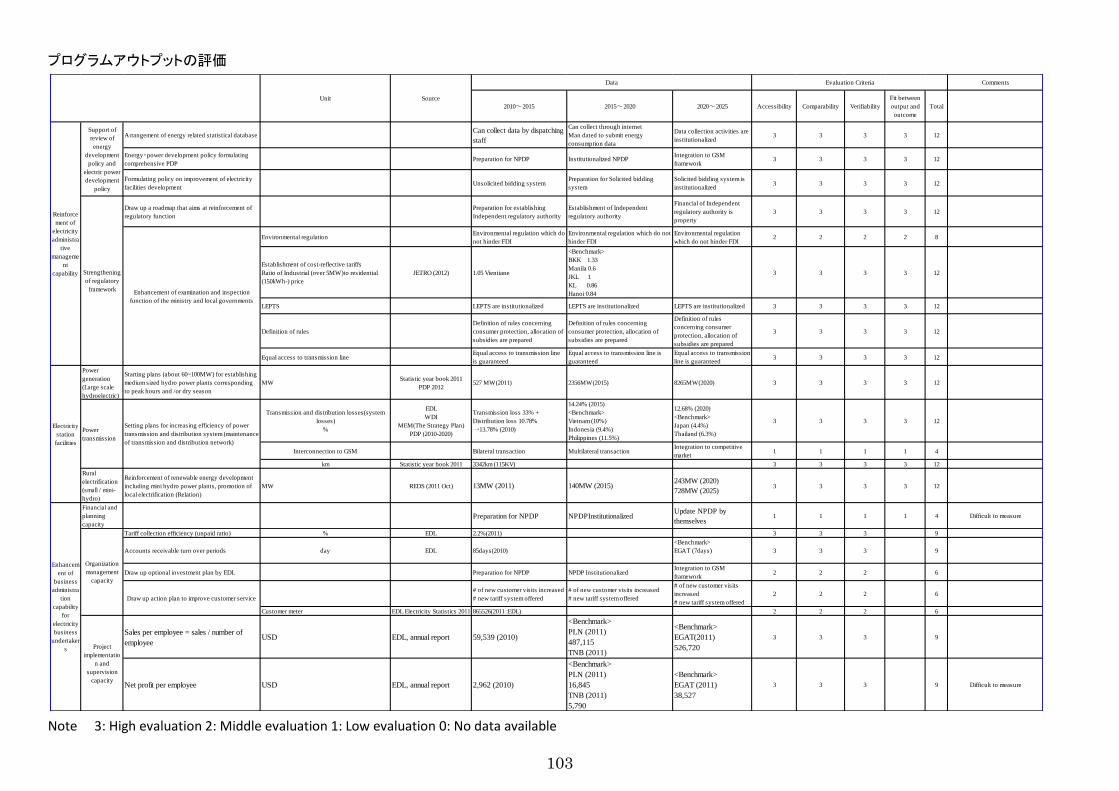
103
プログラムアウトプットの評価
Note 3: High evaluation 2: Middle evaluation 1: Low evaluation 0: No data available
Comments
Arrangement of energy related statistical databaseCan collect data by dispatching
staff
Can collect through internet
Man dated to submit energy
consumption data
Data collection activities are
institutionalized3 3 3 3 12
Energy・power development policy formulating
comprehensive PDPPreparation for NPDP Institutionalized NPDP
Integration to GSM
framework3 3 3 3 12
Formulating policy on improvement of electricity
facilities developmentUnsolicited bidding system
Preparation for Solicited bidding
system
Solicited bidding system is
institutionalized3 3 3 3 12
Draw up a roadmap that aims at reinforcement of
regulatory function
Preparation for establishing
Independent regulatory authority
Establishment of Independent
regulatory authority
Financial of Independent
regulatory authority is
property
3 3 3 3 12
Environmental regulationEnvironmental regulation which do
not hinder FDI
Environmental regulation which do not
hinder FDI
Environmental regulation
which do not hinder FDI2 2 2 2 8
Establishment of cost-reflective tariffs
Ratio of Industrial (over 5MW)to residential
(150kWh-) price
JETRO (2012) 1.05 Vientiane
<Benchmark>
BKK 1.33
Manila 0.6
JKL 1
KL 0.86
Hanoi 0.84
3 3 3 3 12
LEPTS LEPTS are institutionalized LEPTS are institutionalized LEPTS are institutionalized 3 3 3 3 12
Definition of rules
Definition of rules concerning
consumer protection, allocation of
subsidies are prepared
Definition of rules concerning
consumer protection, allocation of
subsidies are prepared
Definition of rules
concerning consumer
protection, allocation of
subsidies are prepared
3 3 3 3 12
Equal access to transmission lineEqual access to transmission line
is guaranteed
Equal access to transmission line is
guaranteed
Equal access to transmission
line is guaranteed3 3 3 3 12
Power
generation
(Large scale
hydroelectric)
Starting plans (about 60~100MW) for establishing
medium sized hydro power plants corresponding
to peak hours and /or dry season
MWStatistic year book 2011
PDP 2012527 MW(2011) 2356MW(2015) 8265MW(2020) 3 3 3 3 12
Transmission and distribution losses(system
losses)
%
EDL
WDI
MEM(The Strategy Plan)
PDP (2010-2020)
Transmission loss 33% +
Distribution loss 10.78%
→13.78% (2010)
14.24% (2015)
<Benchmark>
Vietnam (10%)
Indonesia (9.4%)
Philippines (11.5%)
12.68% (2020)
<Benchmark>
Japan (4.4%)
Thailand (6.3%)
3 3 3 3 12
Interconnection to GSM Bilateral transaction Multilateral transactionIntegration to competitive
market1 1 1 1 4
km Statistic year book 2011 3342km (115KV) 3 3 3 3 12
Rural
electrification
(small / mini-
hydro)
Reinforcement of renewable energy development
including mini hydro power plants, promotion of
local electrification (Relation)
MW REDS (2011 Oct) 13MW (2011) 140MW (2015)243MW (2020)
728MW (2025)3 3 3 3 12
Financial and
planning
capacity
Preparation for NPDP NPDPInstitutionalizedUpdate NPDP by
themselves1 1 1 1 4 Difficult to measure
Tariff collection efficiency (unpaid ratio) % EDL 2.2%(2011) 3 3 3 9
Accounts receivable turn over periods day EDL 85days(2010)
<Benchmark>
EGAT (7days) 3 3 3 9
Draw up optional investment plan by EDL Preparation for NPDP NPDP InstitutionalizedIntegration to GSM
framework2 2 2 6
# of new customer visits increased
# new tariff system offered
# of new customer visits increased
# new tariff system offered
# of new customer visits
increased
# new tariff system offered
2 2 2 6
Customer meter EDL Electricity Statistics 2011 865526(2011 :EDL) 2 2 2 6
Sales per employee = sales / number of
employeeUSD EDL, annual report 59,539 (2010)
<Benchmark>
PLN (2011)
487,115
TNB (2011)
301,963
<Benchmark>
EGAT(2011)
526,720
3 3 3 9
Net profit per employee USD EDL, annual report 2,962 (2010)
<Benchmark>
PLN (2011)
16,845
TNB (2011)
5,790
<Benchmark>
EGAT (2011)
38,527
3 3 3 9 Difficult to measure
Evaluation Criteria
Accessibility Comparability Verifiability Total2010~2015 2015~2020 2020~2025
Fit between
output and
outcome
Reinforce
ment of
electricity
administra
tive
manageme
nt
capability Strengthening
of regulatory
frameworkEnhancement of examination and inspection
function of the ministry and local governments
Project
implementatio
n and
supervision
capacity
Data
Support of
review of
energy
development
policy and
electric power
development
policy
Electricity
station
facilities
Power
transmission
Setting plans for increasing efficiency of power
transmission and distribution system (maintenance
of transmission and distribution network)
Enhancem
ent of
business
administra
tion
capability
for
electricity
business
undertaker
s
Organization
management
capacity
Draw up action plan to improve customer service
Unit Source
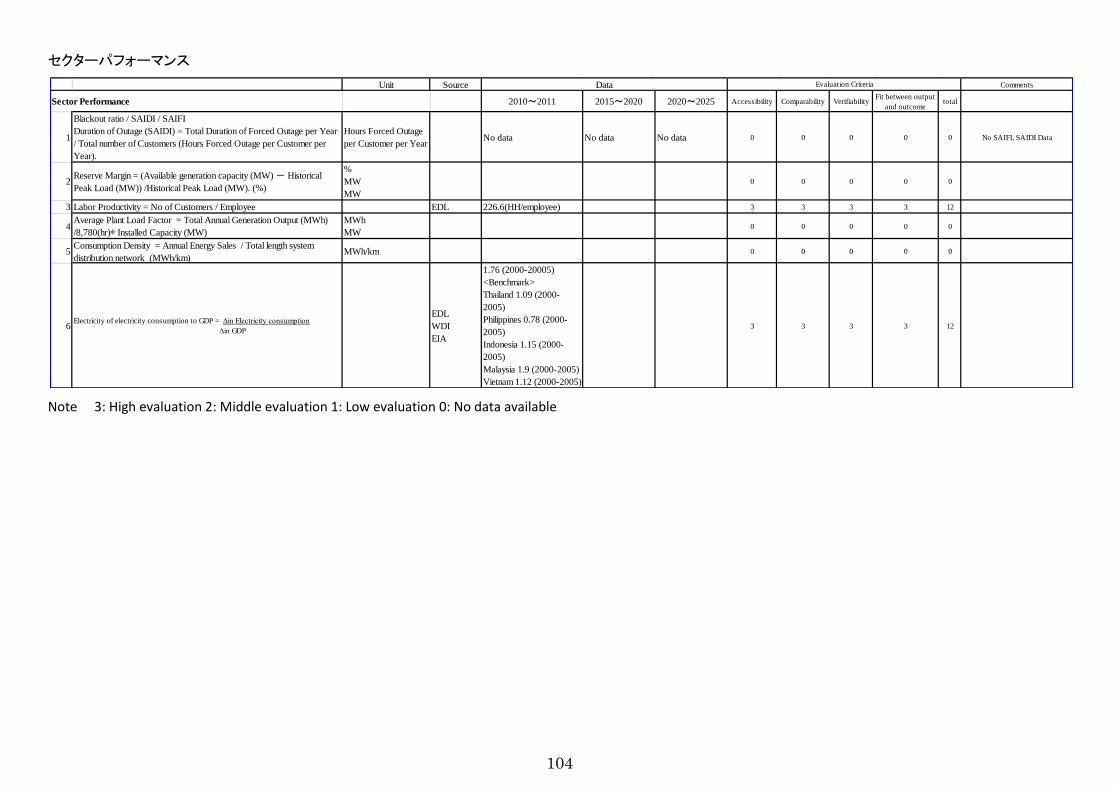
104
セクターパフォーマンス
Note 3: High evaluation 2: Middle evaluation 1: Low evaluation 0: No data available
Unit Source Comments
Sector Performance 2010~2011 2015~2020 2020~2025 Accessibility Comparability VerifiabilityFit between output
and outcometotal
1
Blackout ratio / SAIDI / SAIFI
Duration of Outage (SAIDI) = Total Duration of Forced Outage per Year
/ Total number of Customers (Hours Forced Outage per Customer per
Year).
Hours Forced Outage
per Customer per YearNo data No data No data 0 0 0 0 0 No SAIFI, SAIDI Data
2Reserve Margin = (Available generation capacity (MW) - Historical
Peak Load (MW)) /Historical Peak Load (MW). (%)
%
MW
MW
0 0 0 0 0
3 Labor Productivity = No of Customers / Employee EDL 226.6(HH/employee) 3 3 3 3 12
4Average Plant Load Factor = Total Annual Generation Output (MWh)
/8,780(hr)∗ Installed Capacity (MW)
MWh
MW0 0 0 0 0
5Consumption Density = Annual Energy Sales / Total length system
distribution network (MWh/km)MWh/km 0 0 0 0 0
6Electricity of electricity consumption to GDP = Δin Electricity consumption
Δin GDP
EDL
WDI
EIA
1.76 (2000-20005)
<Benchmark>
Thailand 1.09 (2000-
2005)
Philippines 0.78 (2000-
2005)
Indonesia 1.15 (2000-
2005)
Malaysia 1.9 (2000-2005)
Vietnam 1.12 (2000-2005)
3 3 3 3 12
Data Evaluation Criteria
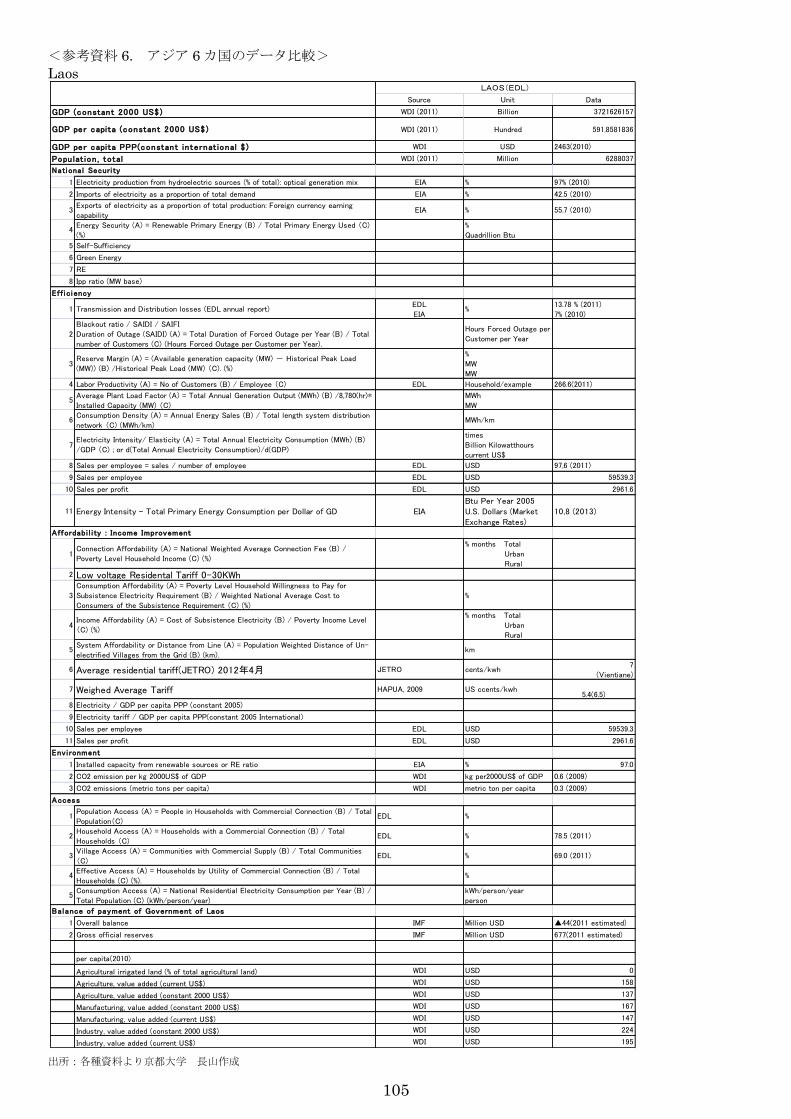
105
<参考資料 6. アジア 6 カ国のデータ比較>
Laos
出所:各種資料より京都大学 長山作成
Source Unit Data
GDP (constant 2000 US$) WDI (2011) Billion 3721626157
GDP per capita (constant 2000 US$) WDI (2011) Hundred 591.8581836
GDP per capita PPP(constant in ternat ional $ ) WDI USD 2463(2010)
Popu lat ion , total WDI (2011) Million 6288037
Nationa l Securi ty
1 Electricity production from hydroelectric sources (% of total): optical generation mix EIA % 97% (2010)
2 Imports of electricity as a proportion of total demand EIA % 42.5 (2010)
3Exports of electricity as a proportion of total production: Foreign currency earningcapability
EIA % 55.7 (2010)
4Energy Security (A) = Renewable Primary Energy (B) / Total Primary Energy Used (C)(%)
%Quadrillion Btu
5 Self-Sufficiency
6 Green Energy
7 RE
8 Ipp ratio (MW base)
Ef f i ci ency
1 Transmission and Distribution losses (EDL annual report)EDLEIA
%13.78 % (2011)7% (2010)
2Blackout ratio / SAIDI / SAIFIDuration of Outage (SAIDI) (A) = Total Duration of Forced Outage per Year (B) / Totalnumber of Customers (C) (Hours Forced Outage per Customer per Year).
Hours Forced Outage perCustomer per Year
3Reserve Margin (A) = (Available generation capacity (MW) - Historical Peak Load(MW)) (B) /Historical Peak Load (MW) (C). (%)
%MWMW
4 Labor Productivity (A) = No of Customers (B) / Employee (C) EDL Household/example 266.6(2011)
5Average Plant Load Factor (A) = Total Annual Generation Output (MWh) (B) /8,780(hr)∗Installed Capacity (MW) (C)
MWhMW
6Consumption Density (A) = Annual Energy Sales (B) / Total length system distributionnetwork (C) (MWh/km)
MWh/km
7Electricity Intensity/ Elasticity (A) = Total Annual Electricity Consumption (MWh) (B)
/GDP (C) ; or d(Total Annual Electricity Consumption)/d(GDP)
timesBillion Kilowatthours
current US$
8 Sales per employee = sales / number of employee EDL USD 97,6 (2011)
9 Sales per employee EDL USD 59539.3
10 Sales per profit EDL USD 2961.6
11 Energy Intensity – Total Primary Energy Consumption per Dollar of GD EIABtu Per Year 2005U.S. Dollars (MarketExchange Rates)
10,8 (2013)
Affordabi l i ty : Income Improvement
1Connection Affordability (A) = National Weighted Average Connection Fee (B) /Poverty Level Household Income (C) (%)
% months Total Urban Rural
2 Low voltage Residental Tariff 0-30KWh
3Consumption Affordability (A) = Poverty Level Household Willingness to Pay forSubsistence Electricity Requirement (B) / Weighted National Average Cost to
Consumers of the Subsistence Requirement (C) (%)
%
4Income Affordability (A) = Cost of Subsistence Electricity (B) / Poverty Income Level(C) (%)
% months Total Urban Rural
5System Affordability or Distance from Line (A) = Population Weighted Distance of Un-electrified Villages from the Grid (B) (km).
km
6 Average residential tariff(JETRO) 2012年4月 JETRO cents/kwh7
(Vientiane)
7 Weighed Average Tariff HAPUA, 2009 US ccents/kwh5.4(6.5)
8 Electricity / GDP per capita PPP (constant 2005)
9 Electricity tariff / GDP per capita PPP(constant 2005 International)
10 Sales per employee EDL USD 59539.3
11 Sales per profit EDL USD 2961.6
Env i ronment
1 Installed capacity from renewable sources or RE ratio EIA % 97.0
2 CO2 emission per kg 2000US$ of GDP WDI kg per2000US$ of GDP 0.6 (2009)
3 CO2 emissions (metric tons per capita) WDI metric ton per capita 0.3 (2009)
Access
1Population Access (A) = People in Households with Commercial Connection (B) / TotalPopulation(C)
EDL %
2Household Access (A) = Households with a Commercial Connection (B) / TotalHouseholds (C)
EDL % 78.5 (2011)
3Village Access (A) = Communities with Commercial Supply (B) / Total Communities
(C)EDL % 69.0 (2011)
4Effective Access (A) = Households by Utility of Commercial Connection (B) / TotalHouseholds (C) (%).
%
5Consumption Access (A) = National Residential Electricity Consumption per Year (B) /
Total Population (C) (kWh/person/year)
kWh/person/year
person
Balance of payment of Government of Laos
1 Overall balance IMF Million USD ▲44(2011 estimated)
2 Gross official reserves IMF Million USD 677(2011 estimated)
per capita(2010)
Agricultural irrigated land (% of total agricultural land) WDI USD 0
Agriculture, value added (current US$) WDI USD 158
Agriculture, value added (constant 2000 US$) WDI USD 137
Manufacturing, value added (constant 2000 US$) WDI USD 167
Manufacturing, value added (current US$) WDI USD 147
Industry, value added (constant 2000 US$) WDI USD 224
Industry, value added (current US$) WDI USD 195
LAOS(EDL)
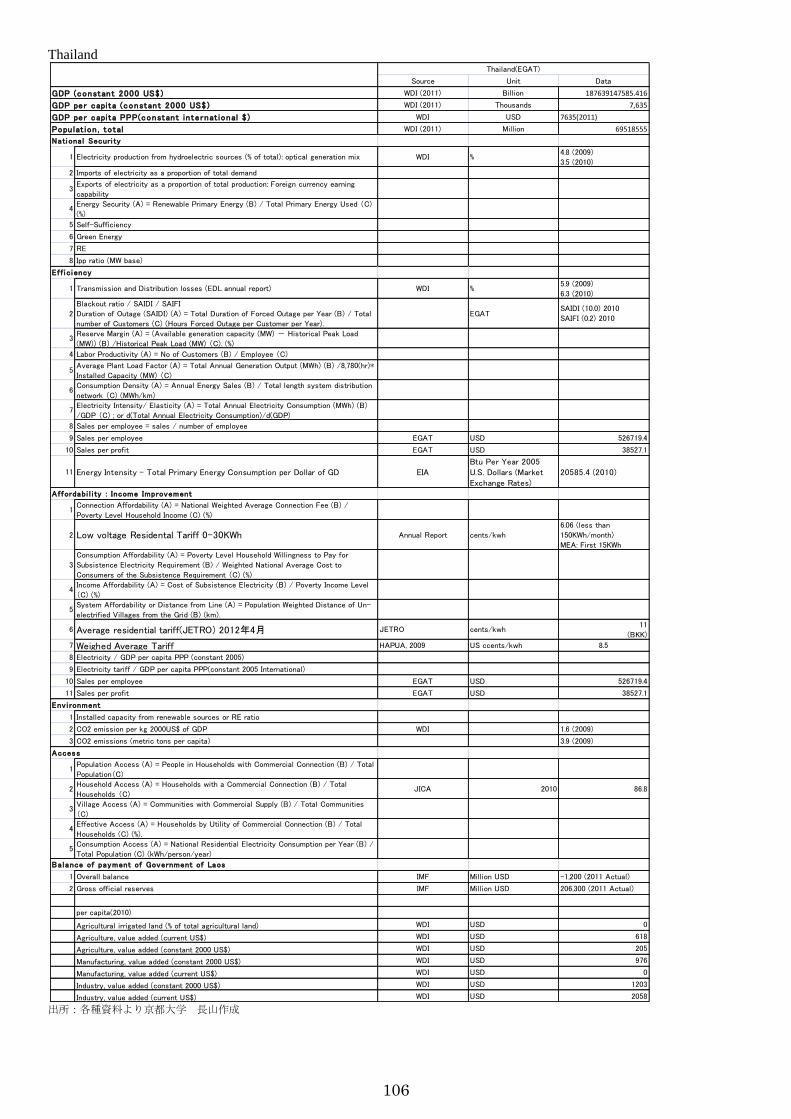
106
Thailand
出所:各種資料より京都大学 長山作成
Source Unit Data
GDP (constant 2000 US$) WDI (2011) Billion 187639147585.416
GDP per capita (constant 2000 US$) WDI (2011) Thousands 7,635
GDP per capita PPP(constant in ternat ional $ ) WDI USD 7635(2011)
Popu lat ion , total WDI (2011) Million 69518555
Nationa l Securi ty
1 Electricity production from hydroelectric sources (% of total): optical generation mix WDI %4.8 (2009)3.5 (2010)
2 Imports of electricity as a proportion of total demand
3Exports of electricity as a proportion of total production: Foreign currency earningcapability
4Energy Security (A) = Renewable Primary Energy (B) / Total Primary Energy Used (C)(%)
5 Self-Sufficiency
6 Green Energy
7 RE
8 Ipp ratio (MW base)
Ef f i ci ency
1 Transmission and Distribution losses (EDL annual report) WDI %5.9 (2009)6.3 (2010)
2Blackout ratio / SAIDI / SAIFIDuration of Outage (SAIDI) (A) = Total Duration of Forced Outage per Year (B) / Totalnumber of Customers (C) (Hours Forced Outage per Customer per Year).
EGATSAIDI (10.0) 2010SAIFI (0.2) 2010
3Reserve Margin (A) = (Available generation capacity (MW) - Historical Peak Load(MW)) (B) /Historical Peak Load (MW) (C). (%)
4 Labor Productivity (A) = No of Customers (B) / Employee (C)
5Average Plant Load Factor (A) = Total Annual Generation Output (MWh) (B) /8,780(hr)∗Installed Capacity (MW) (C)
6Consumption Density (A) = Annual Energy Sales (B) / Total length system distribution
network (C) (MWh/km)
7Electricity Intensity/ Elasticity (A) = Total Annual Electricity Consumption (MWh) (B)/GDP (C) ; or d(Total Annual Electricity Consumption)/d(GDP)
8 Sales per employee = sales / number of employee
9 Sales per employee EGAT USD 526719.4
10 Sales per profit EGAT USD 38527.1
11 Energy Intensity – Total Primary Energy Consumption per Dollar of GD EIABtu Per Year 2005U.S. Dollars (MarketExchange Rates)
20585.4 (2010)
Affordabi l i ty : Income Improvement
1Connection Affordability (A) = National Weighted Average Connection Fee (B) /
Poverty Level Household Income (C) (%)
2 Low voltage Residental Tariff 0-30KWh Annual Report cents/kwh6.06 (less than150KWh/month)
MEA: First 15KWh
3Consumption Affordability (A) = Poverty Level Household Willingness to Pay forSubsistence Electricity Requirement (B) / Weighted National Average Cost toConsumers of the Subsistence Requirement (C) (%)
4Income Affordability (A) = Cost of Subsistence Electricity (B) / Poverty Income Level(C) (%)
5System Affordability or Distance from Line (A) = Population Weighted Distance of Un-
electrified Villages from the Grid (B) (km).
6 Average residential tariff(JETRO) 2012年4月 JETRO cents/kwh11
(BKK)
7 Weighed Average Tariff HAPUA, 2009 US ccents/kwh 8.5
8 Electricity / GDP per capita PPP (constant 2005)
9 Electricity tariff / GDP per capita PPP(constant 2005 International)
10 Sales per employee EGAT USD 526719.4
11 Sales per profit EGAT USD 38527.1
Env i ronment
1 Installed capacity from renewable sources or RE ratio
2 CO2 emission per kg 2000US$ of GDP WDI 1.6 (2009)
3 CO2 emissions (metric tons per capita) 3.9 (2009)
Access
1Population Access (A) = People in Households with Commercial Connection (B) / TotalPopulation(C)
2Household Access (A) = Households with a Commercial Connection (B) / TotalHouseholds (C)
JICA 2010 86.8
3Village Access (A) = Communities with Commercial Supply (B) / Total Communities(C)
4Effective Access (A) = Households by Utility of Commercial Connection (B) / Total
Households (C) (%).
5Consumption Access (A) = National Residential Electricity Consumption per Year (B) /Total Population (C) (kWh/person/year)
Ba lance of payment of Government of Laos
1 Overall balance IMF Million USD -1,200 (2011 Actual)
2 Gross official reserves IMF Million USD 206,300 (2011 Actual)
per capita(2010)
Agricultural irrigated land (% of total agricultural land) WDI USD 0
Agriculture, value added (current US$) WDI USD 618
Agriculture, value added (constant 2000 US$) WDI USD 205
Manufacturing, value added (constant 2000 US$) WDI USD 976
Manufacturing, value added (current US$) WDI USD 0
Industry, value added (constant 2000 US$) WDI USD 1203
Industry, value added (current US$) WDI USD 2058
Thailand(EGAT)
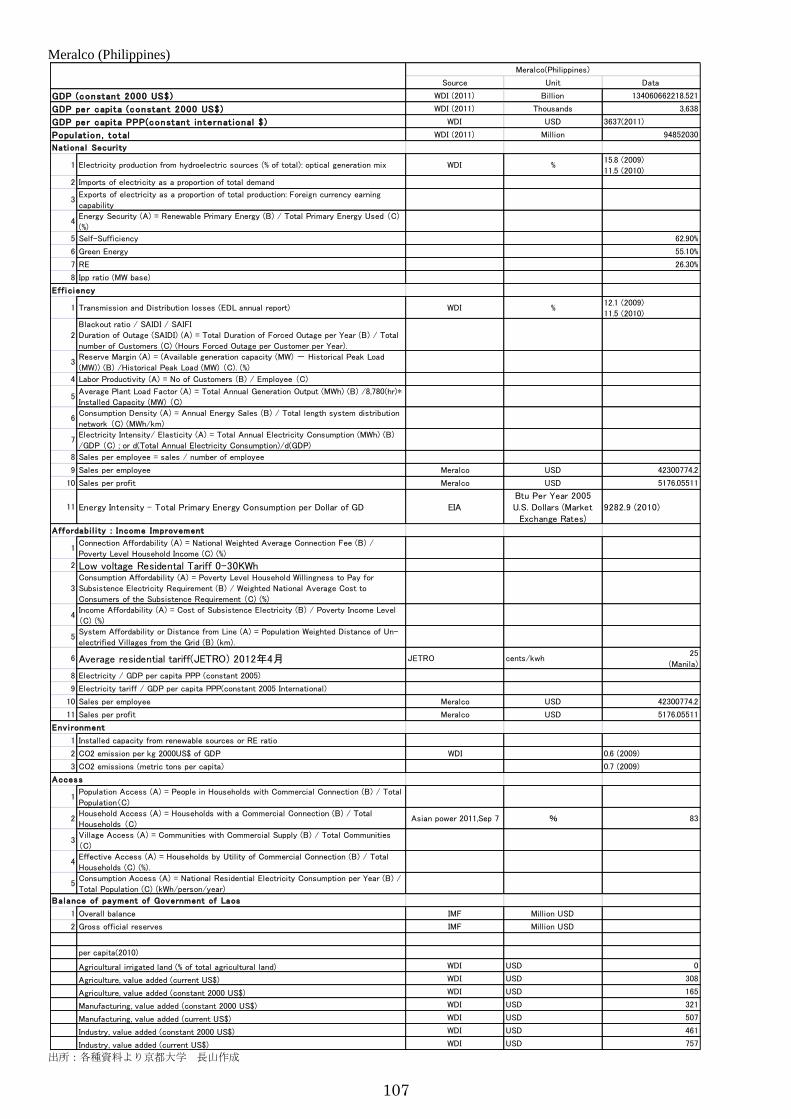
107
Meralco (Philippines)
出所:各種資料より京都大学 長山作成
Source Unit Data
GDP (constant 2000 US$) WDI (2011) Billion 134060662218.521
GDP per capita (constant 2000 US$) WDI (2011) Thousands 3,638
GDP per capita PPP(constant in ternat ional $ ) WDI USD 3637(2011)
Popu lat ion , total WDI (2011) Million 94852030
Nationa l Securi ty
1 Electricity production from hydroelectric sources (% of total): optical generation mix WDI %15.8 (2009)
11.5 (2010)
2 Imports of electricity as a proportion of total demand
3Exports of electricity as a proportion of total production: Foreign currency earning
capability
4Energy Security (A) = Renewable Primary Energy (B) / Total Primary Energy Used (C)
(%)
5 Self-Sufficiency 62.90%
6 Green Energy 55.10%
7 RE 26.30%
8 Ipp ratio (MW base)
Ef f i ci ency
1 Transmission and Distribution losses (EDL annual report) WDI %12.1 (2009)
11.5 (2010)
2
Blackout ratio / SAIDI / SAIFI
Duration of Outage (SAIDI) (A) = Total Duration of Forced Outage per Year (B) / Total
number of Customers (C) (Hours Forced Outage per Customer per Year).
3Reserve Margin (A) = (Available generation capacity (MW) - Historical Peak Load
(MW)) (B) /Historical Peak Load (MW) (C). (%)
4 Labor Productivity (A) = No of Customers (B) / Employee (C)
5Average Plant Load Factor (A) = Total Annual Generation Output (MWh) (B) /8,780(hr)∗
Installed Capacity (MW) (C)
6Consumption Density (A) = Annual Energy Sales (B) / Total length system distribution
network (C) (MWh/km)
7Electricity Intensity/ Elasticity (A) = Total Annual Electricity Consumption (MWh) (B)
/GDP (C) ; or d(Total Annual Electricity Consumption)/d(GDP)
8 Sales per employee = sales / number of employee
9 Sales per employee Meralco USD 42300774.2
10 Sales per profit Meralco USD 5176.05511
11 Energy Intensity – Total Primary Energy Consumption per Dollar of GD EIABtu Per Year 2005U.S. Dollars (Market
Exchange Rates)9282.9 (2010)
Affordabi l i ty : Income Improvement
1Connection Affordability (A) = National Weighted Average Connection Fee (B) /
Poverty Level Household Income (C) (%)
2 Low voltage Residental Tariff 0-30KWh
3
Consumption Affordability (A) = Poverty Level Household Willingness to Pay for
Subsistence Electricity Requirement (B) / Weighted National Average Cost to
Consumers of the Subsistence Requirement (C) (%)
4Income Affordability (A) = Cost of Subsistence Electricity (B) / Poverty Income Level
(C) (%)
5System Affordability or Distance from Line (A) = Population Weighted Distance of Un-
electrified Villages from the Grid (B) (km).
6 Average residential tariff(JETRO) 2012年4月 JETRO cents/kwh25
(Manila)
8 Electricity / GDP per capita PPP (constant 2005)
9 Electricity tariff / GDP per capita PPP(constant 2005 International)
10 Sales per employee Meralco USD 42300774.2
11 Sales per profit Meralco USD 5176.05511
Envi ronment
1 Installed capacity from renewable sources or RE ratio
2 CO2 emission per kg 2000US$ of GDP WDI 0.6 (2009)
3 CO2 emissions (metric tons per capita) 0.7 (2009)
Access
1Population Access (A) = People in Households with Commercial Connection (B) / Total
Population(C)
2Household Access (A) = Households with a Commercial Connection (B) / Total
Households (C)Asian power 2011,Sep 7 % 83
3Village Access (A) = Communities with Commercial Supply (B) / Total Communities
(C)
4Effective Access (A) = Households by Utility of Commercial Connection (B) / Total
Households (C) (%).
5Consumption Access (A) = National Residential Electricity Consumption per Year (B) /
Total Population (C) (kWh/person/year)
Ba lance of payment of Government of Laos
1 Overall balance IMF Million USD
2 Gross official reserves IMF Million USD
per capita(2010)
Agricultural irrigated land (% of total agricultural land) WDI USD 0
Agriculture, value added (current US$) WDI USD 308
Agriculture, value added (constant 2000 US$) WDI USD 165
Manufacturing, value added (constant 2000 US$) WDI USD 321
Manufacturing, value added (current US$) WDI USD 507
Industry, value added (constant 2000 US$) WDI USD 461
Industry, value added (current US$) WDI USD 757
Meralco(Philippines)
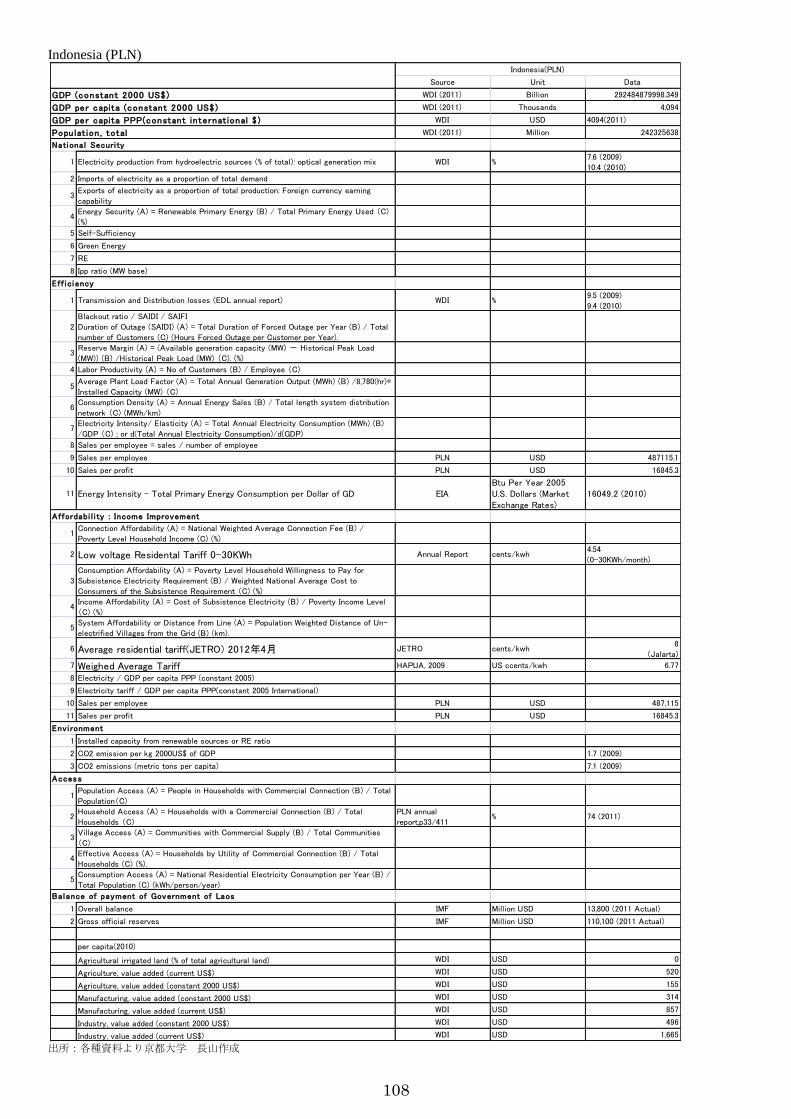
108
Indonesia (PLN)
出所:各種資料より京都大学 長山作成
Source Unit Data
GDP (constant 2000 US$) WDI (2011) Billion 292484879998.349
GDP per capita (constant 2000 US$) WDI (2011) Thousands 4,094
GDP per capita PPP(constant in ternat ional $ ) WDI USD 4094(2011)
Popu lat ion , total WDI (2011) Million 242325638
Nationa l Securi ty
1 Electricity production from hydroelectric sources (% of total): optical generation mix WDI %7.6 (2009)
10.4 (2010)
2 Imports of electricity as a proportion of total demand
3Exports of electricity as a proportion of total production: Foreign currency earning
capability
4Energy Security (A) = Renewable Primary Energy (B) / Total Primary Energy Used (C)
(%)
5 Self-Sufficiency
6 Green Energy
7 RE
8 Ipp ratio (MW base)
Ef f i ci ency
1 Transmission and Distribution losses (EDL annual report) WDI %9.5 (2009)
9.4 (2010)
2
Blackout ratio / SAIDI / SAIFI
Duration of Outage (SAIDI) (A) = Total Duration of Forced Outage per Year (B) / Total
number of Customers (C) (Hours Forced Outage per Customer per Year).
3Reserve Margin (A) = (Available generation capacity (MW) - Historical Peak Load
(MW)) (B) /Historical Peak Load (MW) (C). (%)
4 Labor Productivity (A) = No of Customers (B) / Employee (C)
5Average Plant Load Factor (A) = Total Annual Generation Output (MWh) (B) /8,780(hr)∗
Installed Capacity (MW) (C)
6Consumption Density (A) = Annual Energy Sales (B) / Total length system distribution
network (C) (MWh/km)
7Electricity Intensity/ Elasticity (A) = Total Annual Electricity Consumption (MWh) (B)
/GDP (C) ; or d(Total Annual Electricity Consumption)/d(GDP)
8 Sales per employee = sales / number of employee
9 Sales per employee PLN USD 487115.1
10 Sales per profit PLN USD 16845.3
11 Energy Intensity – Total Primary Energy Consumption per Dollar of GD EIABtu Per Year 2005U.S. Dollars (MarketExchange Rates)
16049.2 (2010)
Affordabi l i ty : Income Improvement
1Connection Affordability (A) = National Weighted Average Connection Fee (B) /
Poverty Level Household Income (C) (%)
2 Low voltage Residental Tariff 0-30KWh Annual Report cents/kwh4.54
(0-30KWh/month)
3
Consumption Affordability (A) = Poverty Level Household Willingness to Pay for
Subsistence Electricity Requirement (B) / Weighted National Average Cost to
Consumers of the Subsistence Requirement (C) (%)
4Income Affordability (A) = Cost of Subsistence Electricity (B) / Poverty Income Level
(C) (%)
5System Affordability or Distance from Line (A) = Population Weighted Distance of Un-
electrified Villages from the Grid (B) (km).
6 Average residential tariff(JETRO) 2012年4月 JETRO cents/kwh8
(Jalarta)
7 Weighed Average Tariff HAPUA, 2009 US ccents/kwh 6.77
8 Electricity / GDP per capita PPP (constant 2005)
9 Electricity tariff / GDP per capita PPP(constant 2005 International)
10 Sales per employee PLN USD 487,115
11 Sales per profit PLN USD 16845.3
Env i ronment
1 Installed capacity from renewable sources or RE ratio
2 CO2 emission per kg 2000US$ of GDP 1.7 (2009)
3 CO2 emissions (metric tons per capita) 7.1 (2009)
Access
1Population Access (A) = People in Households with Commercial Connection (B) / Total
Population(C)
2Household Access (A) = Households with a Commercial Connection (B) / Total
Households (C)
PLN annual
report,p33/411% 74 (2011)
3Village Access (A) = Communities with Commercial Supply (B) / Total Communities
(C)
4Effective Access (A) = Households by Utility of Commercial Connection (B) / Total
Households (C) (%).
5Consumption Access (A) = National Residential Electricity Consumption per Year (B) /
Total Population (C) (kWh/person/year)
Ba lance of payment of Government of Laos
1 Overall balance IMF Million USD 13,800 (2011 Actual)
2 Gross official reserves IMF Million USD 110,100 (2011 Actual)
per capita(2010)
Agricultural irrigated land (% of total agricultural land) WDI USD 0
Agriculture, value added (current US$) WDI USD 520
Agriculture, value added (constant 2000 US$) WDI USD 155
Manufacturing, value added (constant 2000 US$) WDI USD 314
Manufacturing, value added (current US$) WDI USD 857
Industry, value added (constant 2000 US$) WDI USD 496
Industry, value added (current US$) WDI USD 1,665
Indonesia(PLN)
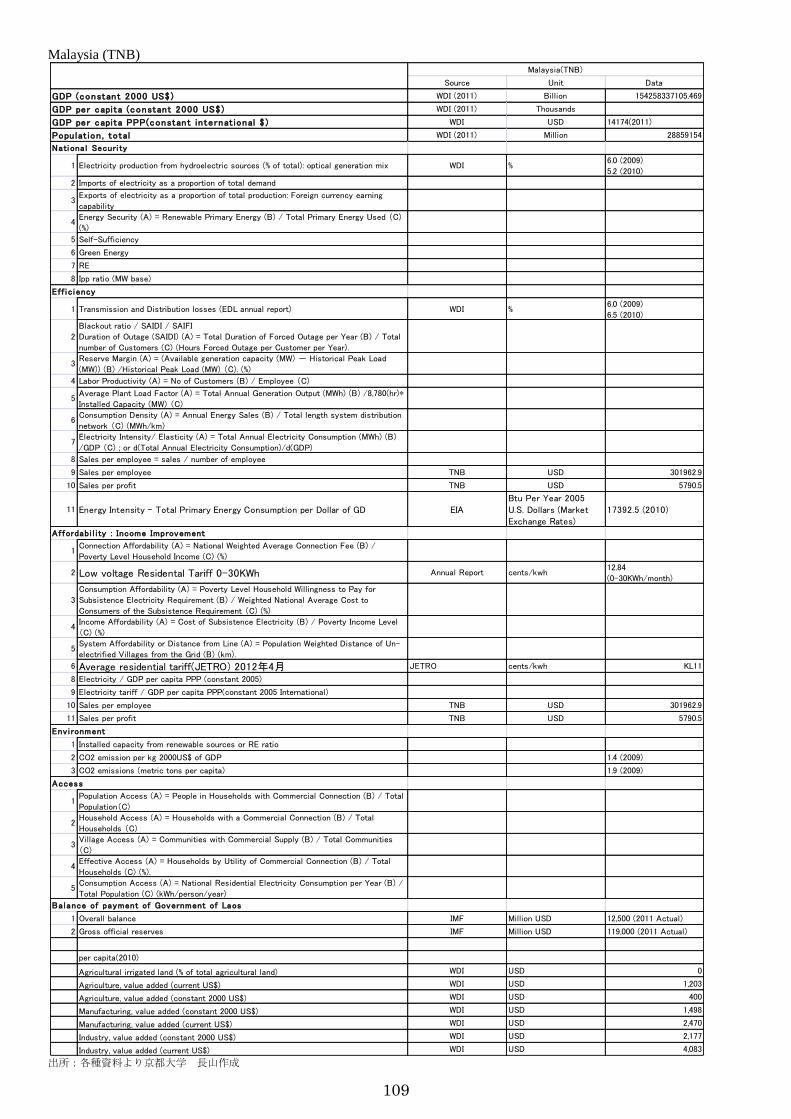
109
Malaysia (TNB)
出所:各種資料より京都大学 長山作成
Source Unit Data
GDP (constant 2000 US$) WDI (2011) Billion 154258337105.469
GDP per capita (constant 2000 US$) WDI (2011) Thousands
GDP per capita PPP(constant in ternat ional $ ) WDI USD 14174(2011)
Popu lat ion , total WDI (2011) Million 28859154
Nationa l Securi ty
1 Electricity production from hydroelectric sources (% of total): optical generation mix WDI %6.0 (2009)5.2 (2010)
2 Imports of electricity as a proportion of total demand
3Exports of electricity as a proportion of total production: Foreign currency earningcapability
4Energy Security (A) = Renewable Primary Energy (B) / Total Primary Energy Used (C)(%)
5 Self-Sufficiency
6 Green Energy
7 RE
8 Ipp ratio (MW base)
Ef f i ci ency
1 Transmission and Distribution losses (EDL annual report) WDI %6.0 (2009)
6.5 (2010)
2Blackout ratio / SAIDI / SAIFIDuration of Outage (SAIDI) (A) = Total Duration of Forced Outage per Year (B) / Total
number of Customers (C) (Hours Forced Outage per Customer per Year).
3Reserve Margin (A) = (Available generation capacity (MW) - Historical Peak Load(MW)) (B) /Historical Peak Load (MW) (C). (%)
4 Labor Productivity (A) = No of Customers (B) / Employee (C)
5Average Plant Load Factor (A) = Total Annual Generation Output (MWh) (B) /8,780(hr)∗Installed Capacity (MW) (C)
6Consumption Density (A) = Annual Energy Sales (B) / Total length system distributionnetwork (C) (MWh/km)
7Electricity Intensity/ Elasticity (A) = Total Annual Electricity Consumption (MWh) (B)
/GDP (C) ; or d(Total Annual Electricity Consumption)/d(GDP)
8 Sales per employee = sales / number of employee
9 Sales per employee TNB USD 301962.9
10 Sales per profit TNB USD 5790.5
11 Energy Intensity – Total Primary Energy Consumption per Dollar of GD EIABtu Per Year 2005U.S. Dollars (MarketExchange Rates)
17392.5 (2010)
Affordabi l i ty : Income Improvement
1Connection Affordability (A) = National Weighted Average Connection Fee (B) /Poverty Level Household Income (C) (%)
2 Low voltage Residental Tariff 0-30KWh Annual Report cents/kwh12.84
(0-30KWh/month)
3Consumption Affordability (A) = Poverty Level Household Willingness to Pay forSubsistence Electricity Requirement (B) / Weighted National Average Cost to
Consumers of the Subsistence Requirement (C) (%)
4Income Affordability (A) = Cost of Subsistence Electricity (B) / Poverty Income Level(C) (%)
5System Affordability or Distance from Line (A) = Population Weighted Distance of Un-electrified Villages from the Grid (B) (km).
6 Average residential tariff(JETRO) 2012年4月 JETRO cents/kwh KL11
8 Electricity / GDP per capita PPP (constant 2005)
9 Electricity tariff / GDP per capita PPP(constant 2005 International)
10 Sales per employee TNB USD 301962.9
11 Sales per profit TNB USD 5790.5
Env i ronment
1 Installed capacity from renewable sources or RE ratio
2 CO2 emission per kg 2000US$ of GDP 1.4 (2009)
3 CO2 emissions (metric tons per capita) 1.9 (2009)
Access
1Population Access (A) = People in Households with Commercial Connection (B) / Total
Population(C)
2Household Access (A) = Households with a Commercial Connection (B) / TotalHouseholds (C)
3Village Access (A) = Communities with Commercial Supply (B) / Total Communities(C)
4Effective Access (A) = Households by Utility of Commercial Connection (B) / Total
Households (C) (%).
5Consumption Access (A) = National Residential Electricity Consumption per Year (B) /Total Population (C) (kWh/person/year)
Ba lance of payment of Government of Laos
1 Overall balance IMF Million USD 12,500 (2011 Actual)
2 Gross official reserves IMF Million USD 119,000 (2011 Actual)
per capita(2010)
Agricultural irrigated land (% of total agricultural land) WDI USD 0
Agriculture, value added (current US$) WDI USD 1,203
Agriculture, value added (constant 2000 US$) WDI USD 400
Manufacturing, value added (constant 2000 US$) WDI USD 1,498
Manufacturing, value added (current US$) WDI USD 2,470
Industry, value added (constant 2000 US$) WDI USD 2,177
Industry, value added (current US$) WDI USD 4,083
Malaysia(TNB)
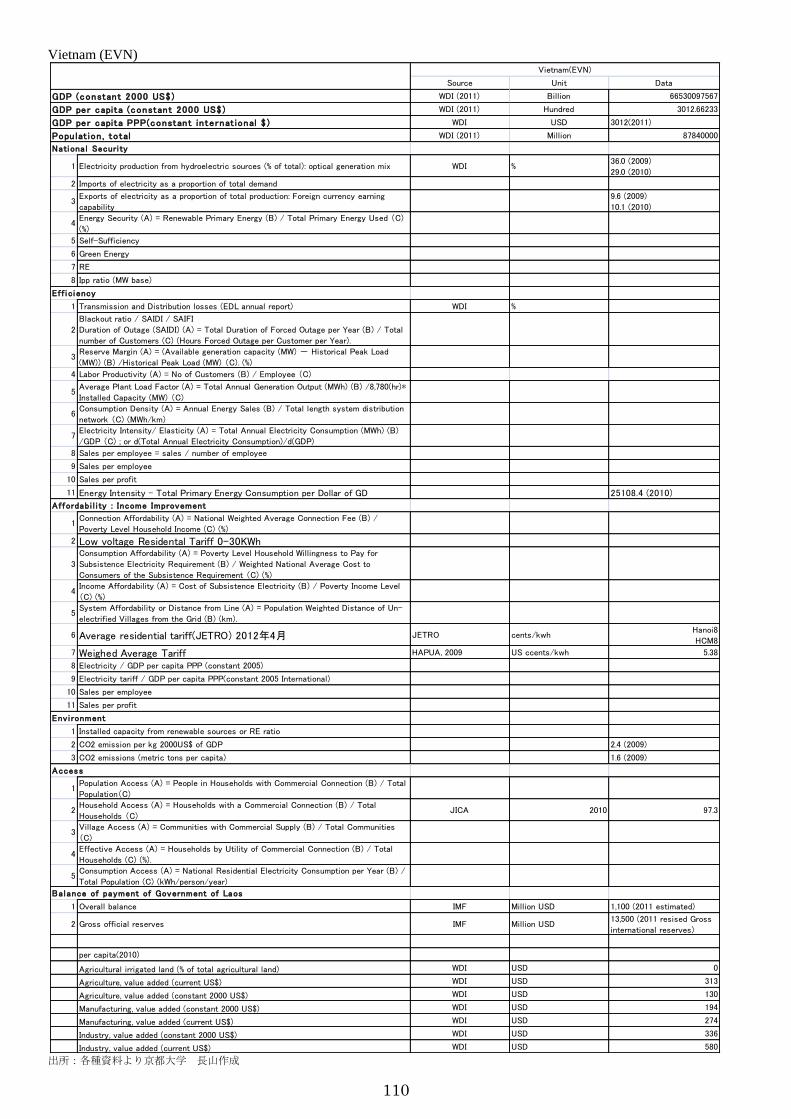
110
Vietnam (EVN)
出所:各種資料より京都大学 長山作成
Source Unit Data
GDP (constant 2000 US$) WDI (2011) Billion 66530097567
GDP per capita (constant 2000 US$) WDI (2011) Hundred 3012.66233
GDP per capita PPP(constant in ternat ional $ ) WDI USD 3012(2011)
Popu lat ion , total WDI (2011) Million 87840000
Nationa l Securi ty
1 Electricity production from hydroelectric sources (% of total): optical generation mix WDI %36.0 (2009)29.0 (2010)
2 Imports of electricity as a proportion of total demand
3Exports of electricity as a proportion of total production: Foreign currency earningcapability
9.6 (2009)10.1 (2010)
4Energy Security (A) = Renewable Primary Energy (B) / Total Primary Energy Used (C)(%)
5 Self-Sufficiency
6 Green Energy
7 RE
8 Ipp ratio (MW base)
Ef f i ci ency
1 Transmission and Distribution losses (EDL annual report) WDI %
2Blackout ratio / SAIDI / SAIFIDuration of Outage (SAIDI) (A) = Total Duration of Forced Outage per Year (B) / Totalnumber of Customers (C) (Hours Forced Outage per Customer per Year).
3Reserve Margin (A) = (Available generation capacity (MW) - Historical Peak Load(MW)) (B) /Historical Peak Load (MW) (C). (%)
4 Labor Productivity (A) = No of Customers (B) / Employee (C)
5Average Plant Load Factor (A) = Total Annual Generation Output (MWh) (B) /8,780(hr)∗Installed Capacity (MW) (C)
6Consumption Density (A) = Annual Energy Sales (B) / Total length system distribution
network (C) (MWh/km)
7Electricity Intensity/ Elasticity (A) = Total Annual Electricity Consumption (MWh) (B)/GDP (C) ; or d(Total Annual Electricity Consumption)/d(GDP)
8 Sales per employee = sales / number of employee
9 Sales per employee
10 Sales per profit
11 Energy Intensity – Total Primary Energy Consumption per Dollar of GD 25108.4 (2010)
Affordabi l i ty : Income Improvement
1Connection Affordability (A) = National Weighted Average Connection Fee (B) /Poverty Level Household Income (C) (%)
2 Low voltage Residental Tariff 0-30KWh
3Consumption Affordability (A) = Poverty Level Household Willingness to Pay forSubsistence Electricity Requirement (B) / Weighted National Average Cost toConsumers of the Subsistence Requirement (C) (%)
4Income Affordability (A) = Cost of Subsistence Electricity (B) / Poverty Income Level(C) (%)
5System Affordability or Distance from Line (A) = Population Weighted Distance of Un-
electrified Villages from the Grid (B) (km).
6 Average residential tariff(JETRO) 2012年4月 JETRO cents/kwhHanoi8HCM8
7 Weighed Average Tariff HAPUA, 2009 US ccents/kwh 5.38
8 Electricity / GDP per capita PPP (constant 2005)
9 Electricity tariff / GDP per capita PPP(constant 2005 International)
10 Sales per employee
11 Sales per profit
Env i ronment
1 Installed capacity from renewable sources or RE ratio
2 CO2 emission per kg 2000US$ of GDP 2.4 (2009)
3 CO2 emissions (metric tons per capita) 1.6 (2009)
Access
1Population Access (A) = People in Households with Commercial Connection (B) / TotalPopulation(C)
2Household Access (A) = Households with a Commercial Connection (B) / Total
Households (C)JICA 2010 97.3
3Village Access (A) = Communities with Commercial Supply (B) / Total Communities(C)
4Effective Access (A) = Households by Utility of Commercial Connection (B) / TotalHouseholds (C) (%).
5Consumption Access (A) = National Residential Electricity Consumption per Year (B) /
Total Population (C) (kWh/person/year)
Ba lance of payment of Government of Laos
1 Overall balance IMF Million USD 1,100 (2011 estimated)
2 Gross official reserves IMF Million USD13,500 (2011 resised Grossinternational reserves)
per capita(2010)
Agricultural irrigated land (% of total agricultural land) WDI USD 0
Agriculture, value added (current US$) WDI USD 313
Agriculture, value added (constant 2000 US$) WDI USD 130
Manufacturing, value added (constant 2000 US$) WDI USD 194
Manufacturing, value added (current US$) WDI USD 274
Industry, value added (constant 2000 US$) WDI USD 336
Industry, value added (current US$) WDI USD 580
Vietnam(EVN)
111
<参考文献>
・ Asia Pacific Energy Research Centre (APERC), 2007. A Quest for Energy Security in
the 21st century; Institute of energy economics, Japan. Available at
/www.ieej.or.jp/apercS (27-8-2007). Awerbuch, S., Stirling, A., Jansen, J.C.,
Beurskens
・ ADB, JBIC, World Bank (2005) “Connecting East Asia; A New Framework for
Infrastructure”
http://siteresources.worldbank.org/INTEASTASIAPACIFIC/Resources/Co
nnecting-East-Asia.pdf
・ B Kruyt, van DP van Vuuren, de Vries HJM, Groenenberg H. Indicators for energy
security. Energy Policy 2009; 37:2166–81.
・ Claudia Sheinbaum-Pardo, Belizza JanetRuiz-Mendoza, Victor Rodriguez-Padilla, July
2012, Mexican energy policy and sustainability indicators Original Research Article,
Energy Policy, Volume 46, pp278-283
・ Grubb M, Butler L,Twomey P, “Diversity and security in UK electricity generation:
the influence oflow-carbon objectives” Energy Policy 2006;34: 4050?62
・ International Development Association (2009) “Tariff Study update project (Final
report)”
・ International Atomic Energy Agency (2005) “Energy Indicators for Sustainable
Development : Guidelines and Methodologies”
http://www-pub.iaea.org/MTCD/publications/PDF/Pub1222_web.pdf
・ Ivan Vera, Lucille Langlois, June 2007,Energy indicators for sustainable development
Original Research Article, Energy, Volume 32, Issue 6, pp 875-882
・ Jutamanee Martchamadol, S. Kumar, October2012, Thailand’s energy security
indicators Review Article, Renewable and Sustainable Energy Reviews, Volume 16,
Issue 8, pp6103-6122
・ Konstantinos D. Patlitzianas, Haris Doukas, Argyris G. Kagiannas, John Psarras
・ Jamasb T, D newbery, and Mopollitt (2004), “Core Indicators for Determinants and
Performance of Electricity Sector in Developing Countries, Department of Applied
Economics”, University of Cambridge
・ The World Bank (2007), “Preparation of Electricity Sector Core Performance
Indicators”
・ The World Bank (2013) “Implementation completion and results report of the Rural
112
Electrification (APL) program” (IDA-H2180 TF-96084 TF-56700))
・ 橋本信雄(JICA 専門家)「ラオス国 エネルギー・電力セクターの現状と課題」, 2013 年 2
月
<参照データ>
・ Electricity Generating Authority of Thailand (EGAT) Summary of Thailand
Power Development Plan (PDP 2010) 2010-2030 Report no. 912000-5305 System
Planning Division (April 2010)
・ EIA(U.S. Energy Information Administration) www.eia.gov/
・ JETRO (2012 年 4 月)「第 22 回アジア・オセアニア主要都市の地域の投資関連コスト
比較」
・ Electricity Information by the International Energy Agency (IEA)
・ World Development Indicators by the World Bank
<政府資料>
・ Annual Report 2011 Lao Holding State Enterprise
・ Draft National Water Resource Strategy from now until 2020 and Water Resource
Action Plan for 2011-2015 (Draft No.8) The Government Cabinet office
・ Electricity Statistics Year Book 2010 of Lao PER Ministry of Energy and Mines
・ Government Finance Statistics Annual Report for 2010-11 Ministry of Finance
・ Renewable Energy Development Strategy in Lao PDR
・ "The Revision of the Law on Water and Water Resources Draft issues paper" Ministry of
Natural Resources and Environment (MONRE)
・ SUMMARY OF THAILAND POWER DEVELOPMENT PLAN 2012 – 2030 (PDP2010:
REVISION 3) MINISTRY OF ENERGY
・ Ministry of Planning and Investment Department, Department of Statistics “The
Household of Lao PDR – Social and Economic Indicators”2007/2008 (May 2009)
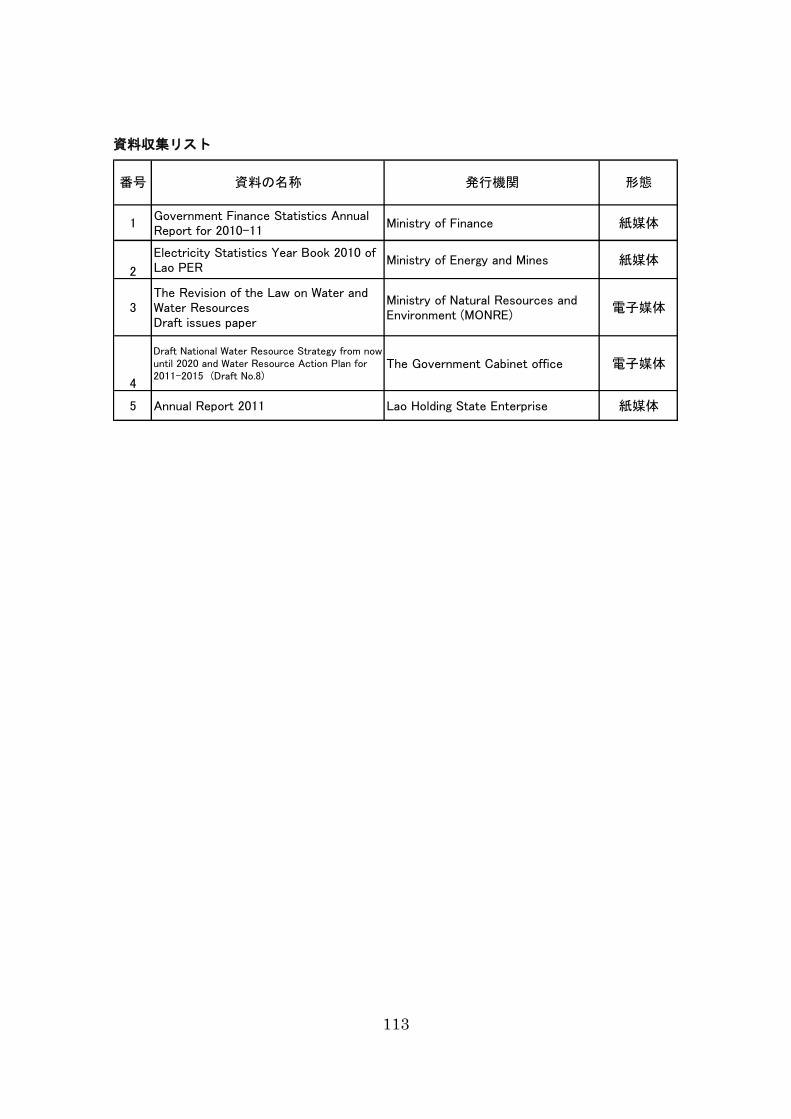
113
資料収集リスト
1Government Finance Statistics Annual Report for 2010-11
Ministry of Finance 紙媒体
2
Electricity Statistics Year Book 2010 of Lao PER
Ministry of Energy and Mines 紙媒体
3The Revision of the Law on Water and Water ResourcesDraft issues paper
Ministry of Natural Resources and Environment (MONRE)
電子媒体
4
Draft National Water Resource Strategy from now until 2020 and Water Resource Action Plan for 2011-2015 (Draft No.8)
The Government Cabinet office 電子媒体
5 Annual Report 2011 Lao Holding State Enterprise 紙媒体
番号 資料の名称 発行機関 形態