Embed Size (px)
Citation preview

F - i
F. PRELIMINARY DESIGN
F - ii
TABLE OF CONTENTS
Page
F.1 GENERAL .................................................................................................................. F - 1
F.2 OBJECTIVE PRIORITY PROJECTS ............................................................................... F - 1
F.2.1 Drainage Channel Facilities ..................................................................................... F - 1
F.2.2 Drainage Pumping Stations...................................................................................... F - 3
F.2.3 Non-Structural and Supporting Measures ................................................................ F - 3
F.3 PRELIMINARY DESIGN OF DRAINAGE CHANNEL FACILITIES ................................... F - 4
F.3.1 General ..................................................................................................................... F - 4
F.3.2 Inventory Survey of Underground and Related Facilities........................................ F - 4
F.3.3 Design Criteria for Drainage Facilities .................................................................... F - 5
F.3.4 Preliminary Design of Drainage Channel Facilities in North Manila .................... F - 10
F.3.5 Preliminary Design of Drainage Channel Facilities in South Manila .................... F - 18
F.3.6 Further Issues for Next Stage of Detailed Design.................................................. F - 28
F.4 REHABILITATION OF DRAINAGE PUMPING STATIONS ............................................ F - 29
F.4.1 General ................................................................................................................... F - 29
F.4.2 Rehabilitation Criteria for Drainage Pumping stations .......................................... F - 29
F.4.3 Rehabilitation of Drainage Pumping Stations ........................................................ F - 31
F.5 NON-STRUCTURAL AND SUPPORTING MEASURES ................................................. F - 35
ANNEX F.1 BLUMENTRITT INTERCEPTOR
ANNEX F.2 BUENDIA OUTFALL
ANNEX F.3 ZOBEL ROXAS DRAINAGE MAIN
ANNEX F.4 FARADAY DRAINAGE MAIN
ANNEX F.5 STRUCTURAL STUDY
F - iii
LIST OF TABLES
Page
Table F.3.1 Existing Depths of Earth Covering at Questioned Intersections ...................... F - 4
Table F.3.2 Present Conditions of Maintenance Holes ....................................................... F - 5
Table F.3.3 Design Scale for Additional Works.................................................................. F - 6
Table F.3.4 Major Soil Data in Pr iority Projects Areas....................................................... F - 7
Table F.3.5 Dimensions of Longitudinal Pr ofile of Estero de Sunog Apog...................... F - 12
Table F.3.6 Dimensions of Additional Box Culvert.......................................................... F - 15
Table F.3.7 Dimensions of Additional Box Culvert.......................................................... F - 24
Table F.3.8 Dimensions of Additional Box Culvert.......................................................... F - 26
Table F.4.1 Drainage Capacity of Pumping Stations ........................................................ F - 29
Table F.4.2 Present Pump Start/Stop Levels for Drainage Pumping Station .................... F - 30
Table F.4.3 Working Life of Pump Equi pment and Appurtenant Facilities...................... F - 31
Table F.4.4 Tentative Detailed Work Items to be Taken Up in Rehabilitation ................. F - 33
Table F.5.1 Increase of Run-off Ratio by Basins of Drainage Pumping Stations ............. F - 36
Table F.5.2 Work Quantity of Observation Network ........................................................ F - 40
LIST OF FIGURES
Page
Figure F.2.1 Locations of Priority Projects......................................................................... F - 2
Figure F.3.1 Image of Rehabilitation of Open Drainage Channels
(Estero/Creek/Canal) ...................................................................................... F - 8
Figure F.3.2 Ideal Typical Section of Open Channel and Its Easement ............................. F - 9
Figure F.3.3 Location Map of Priority Projects in North Manila ..................................... F - 10
Figure F.3.4 Schematic Location of Estero de Sunog Apog............................................. F - 11
Figure F.3.5 Route of Existing Blumentritt Interceptors .................................................. F - 12
Figure F.3.6 Image of Modification of Closed Maintenance Hole ................................... F - 13
Figure F.3.7 Cross Section of Stop Log Gate to be Installed............................................ F - 13
Figure F.3.8 Proposed Route of Additional Blumentritt Interceptor ................................ F - 14
Figure F.3.9 Design Discharge of Additional Blumentritt Interceptor ............................. F - 15
Figure F.3.10 Image of Additional Box Culvert at Section of Rizal Avenue..................... F - 16
Figure F.3.11 Image of Inlet for Road Surface Flow.......................................................... F - 16
Figure F.3.12 Locations of Narrow sect ion of Existing Box Culvert ................................. F - 17
Figure F.3.13 Location Map of Priority Projects in South Manila ..................................... F - 18
Figure F.3.14 Schematic Locations of Objectiv e Channels to be Dredged/Cleaned .......... F - 19
Figure F.3.15 Schematic Route of Buendia Outfall............................................................ F - 21
Figure F.3.16 Present Condition of Outlet of Buendia Outfall ........................................... F - 21
Figure F.3.17 Existing and Proposed Routes of Zobel Roxas Drainage Main ................... F - 22
Figure F.3.18 Design Discharge of Zobel Roxas Drainage Main....................................... F - 23
Figure F.3.19 Schematic Location Map of Pasong Tamo Drainage Main.......................... F - 24
Figure F.3.20 Existing and Additional Proposed Route of Faraday Drainage Main .......... F - 25
Figure F.3.21 Design Discharge of Faraday Drainage Main .............................................. F - 26
Figure F.5.1 Sample of Storm Water Retention Facility (Park) ....................................... F - 36
Figure F.5.2 Sample of Storm Water Retention Facility (Ground in School/University) F - 37
Figure F.5.3 Sample of Storm Water Retention by Permeable Pavement (Parking Area) F - 37
F - iv
Figure F.5.4 Sample of Storm Water Retention Facility (Apartment Building)............... F - 37
Figure F.5.5 Sample of Storm Water Retention Facility (Tennis Court).......................... F - 38
Figure F.5.6 Sample of Various Storm Water Retention Facilities .................................. F - 38
Figure F.5.7 Locations of Additional Hydrological Equipment ....................................... F - 40
F - 1
F.1 GENERAL
The priority projects subject to a feasibility study were selected within the scope of the
formulated drainage master plan. The scope of works of the priority projects consist of 1)
rehabilitation and additional works for the drainage facilities and 2) rehabilitation and additional
works for the drainage pumping stations. A preliminary design for the drainage facilities is
made in this stage. Subsequently, a more detailed rehabilitation plan of the drainage pumping
stations is examined with identification of rehabilitation work items by stations for the 12
stations. The result of the above design/study is described in the following.
F.2 OBJECTIVE PRIORITY PROJECTS
F.2.1 DRAINAGE CHANNEL FACILITIES
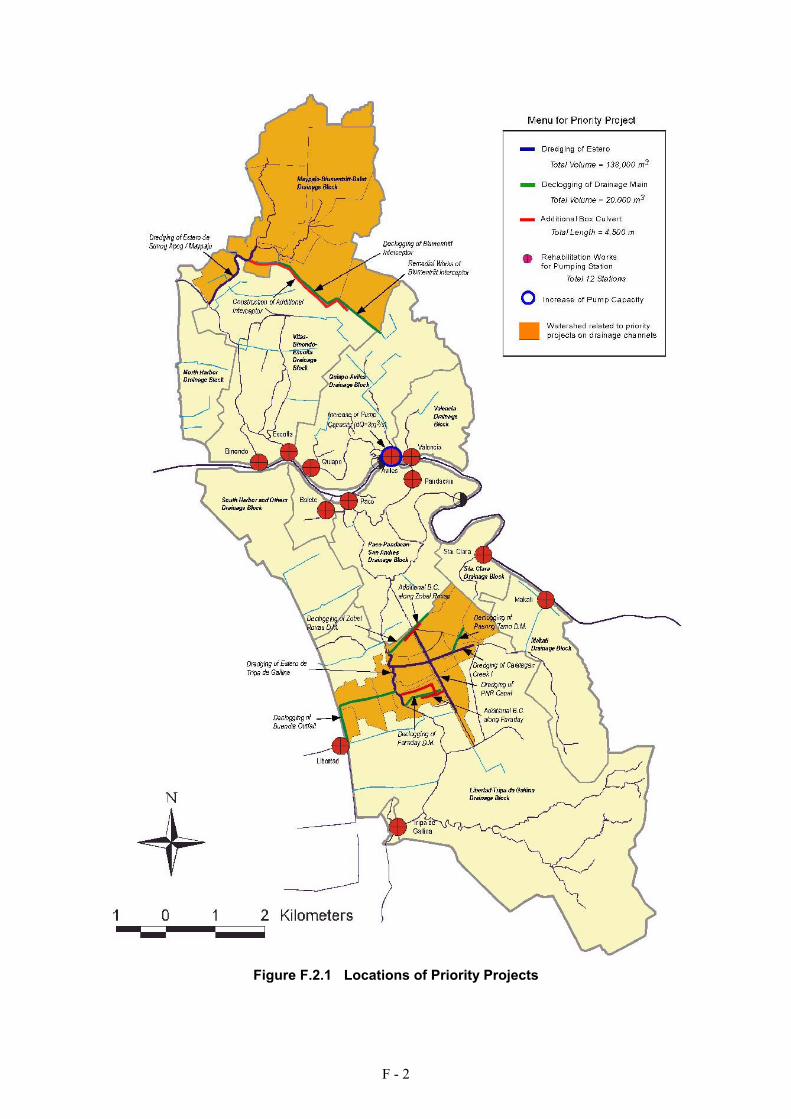
The priority projects for the drainage channel f acilities identified in the master plan consist of
rehabilitation and additional works for drainage channel facilities of estero/creek/canal/drainage
main. Locations of objective drainage faciliti es and drainage pumping stations are presented
in Figure F. 2.1. The following are the objective drainage facilities.
(1) Rehabilitation and Additional Works of Drainage Channel Facilities in North
Manila
Estero de Sunog Apog
- Dredging (Clearing)
Blumentritt Interceptor
- Declogging of existing interceptor and related works
- Construction of additional interceptor by box culvert and remedial works
(2) Rehabilitation and Additional Works of Drainage Channel Facilities in South
Manila
Estero de Tripa de Gallina, PNR Canal and Calatagan Creek I
- Dredging (Clearing)
Buendia Outfall
- Declogging and related works
Zobel Roxas Drainage Main
- Declogging and construction of additional box culvert
Pasong Tamo Drainage Main
- Declogging
Faraday Drainage Main
- Declogging and construction of additional box culvert
F - 2
Figure F.2.1 Locations of Priority Projects
F - 3
F.2.2 DRAINAGE PUMPING STATIONS
Presently there are 15 major drainage pumping stations in the core area. For the objective 12
aged drainage pumping stations identified in the master plan, a further detailed rehabilitation
work items of repair and replacement of pump equipment and apparatus by stations will be
examined in this stage. Those locations of aged pumping stations are shown in Figure F.2.1.
The objective pumping stations will be as follows.
- Aviles,
At Aviles station, increase of pump capacity of 3m3/s is proposed in connection with the
rehabilitation works as an additional work.
- Quiapo,
- Valencia,
- Pandacan,
- Paco,
- Sta. Clara,
- Tripa de Gallina,
- Libertad,
- Makati,
- Binondo,
- Escolta and Balete
F.2.3 NON-STRUCTURAL AND SUPPORTING MEASURES
The following non-structural and supporting measures are incorporated with the priority
projects in the drainage improvement. In this preliminary design, further description will be
made in the later section for 1) recommendation of countermeasures for rapid urbanization, 2)
recommendation of application of existing floodplain management system, and 3) proposed
additional hydrological equipment in connection with improvement of operation and
maintenance activities, respectively. Others are explained in the respective sector reports.
Non-Structural Measures
1) Recommendation of countermeasures for rapid urbanization
2) Recommendation of application of existing floodplain management systems
Supporting Measures
1) Improvement of Operation and Maintenance Organization and Activities and Promotion of
Community-Involved Activities
- Improvement of the existing O&M organiza tion and activities including establishment of
community-involved O&M
- Community-Involved Solid Waste Management
2) Installation of Additional Hydrological Equipment
3) Introduction of Emergency Operation and Maintenance Equipment
4) Preparation of Guideline for Resettlement
F - 4
F.3 PRELIMINARY DESIGN OF DRAINAGE CHANNEL FACILITIES
F.3.1 GENERAL
A preliminary design is conducted for the objective drainage channel facilities such as estero,
creek and drainage main. The preliminary design results for the drainage channel facilities are
described in this section covering inventory survey result of underground and related facilities,
rehabilitation and design criteria, result of preliminary design of drainage channel facilities and
proposed work quantities, as follows.
F.3.2 INVENTORY SURVEY OF UNDERGROUND AND RELATED FACILITIES
Prior to planning and designing of the additional works of the priority projects, an inventory
survey on underground facilities and maintenance holes, etc., was conducted mainly by
collection of related documents/drawings, site reconnaissance and interview with persons in
charge.
(1) Water Supply Pipe
There exist various underground facilities such as drainage pipes, water supply pipes, sewerage
pipes, etc. Such underground facilities are mostly placed within 1 m depth from the ground
surface. These facilities would not be obstacle to construct additional box culverts. However,
a main obstacle will be a water supply steel pipe installed under the main streets in the core area
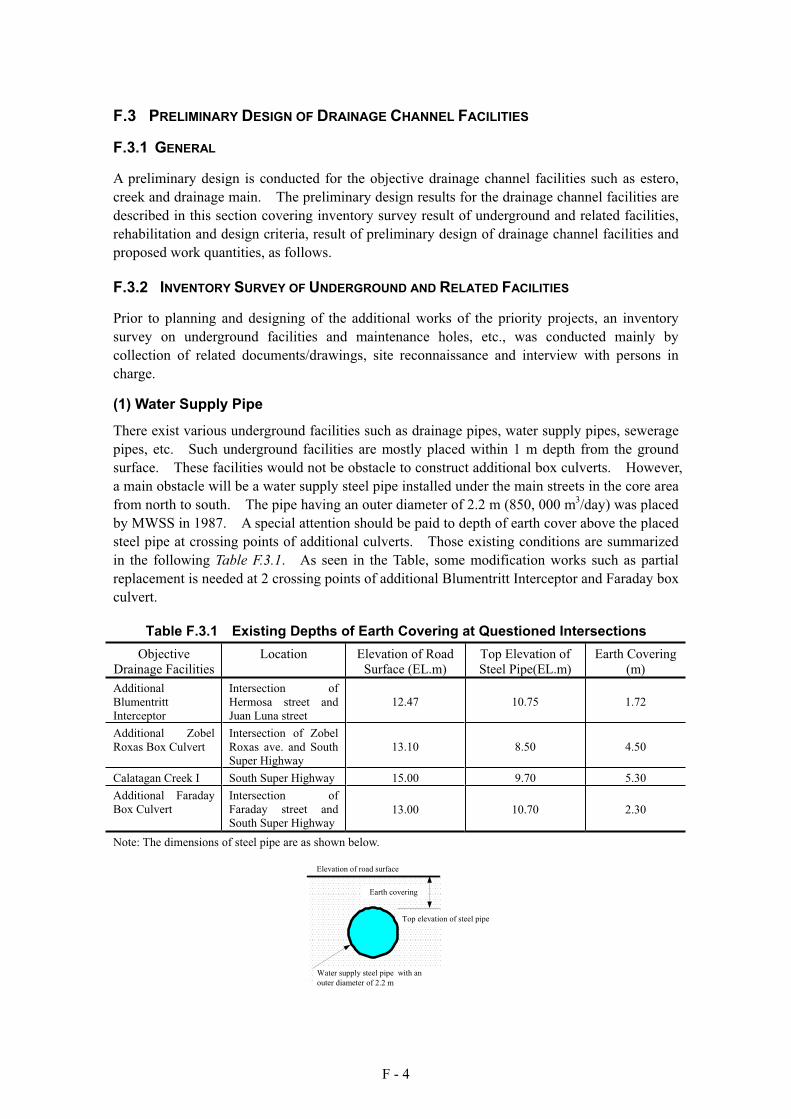
from north to south. The pipe having an outer diameter of 2.2 m (850, 000 m3/day) was placed
by MWSS in 1987. A special attention should be paid to depth of earth cover above the placed
steel pipe at crossing points of additional culverts. Those existing conditions are summarized
in the following Table F.3.1. As seen in the Table, some modification works such as partial
replacement is needed at 2 crossing points of additional Blumentritt Interceptor and Faraday box
culvert.
Table F.3.1 Existing Depths of Earth Covering at Questioned Intersections
Objective
Drainage Facilities
Location Elevation of Road
Surface (EL.m)
Top Elevation of
Steel Pipe(EL.m)
Earth Covering
(m)
Additional
Blumentritt
Interceptor
Intersection of
Hermosa street and
Juan Luna street
12.47 10.75 1.72
Additional Zobel
Roxas Box Culvert
Intersection of Zobel
Roxas ave. and South
Super Highway
13.10 8.50 4.50
Calatagan Creek I South Super Highway 15.00 9.70 5.30
Additional Faraday
Box Culvert
Intersection of
Faraday street and
South Super Highway13.00 10.70 2.30
Note: The dimensions of steel pipe are as shown below.
Elevation of road surface
Water supply steel pipe with an
outer diameter of 2.2 m
Earth covering
Top elevation of steel pipe
F - 5
(2) Foundation of Light Rail Transit (LRT) in Rizal Avenue
A Light Rail Transit (LRT) is running on the medi an (strip) of Rizal Avenue in north Manila
which is partially to be the proposed route of additional Blumentritt Interceptor. The
additional interceptor is to place in the underground of seaside lane of the Rizal Avenue whereas
existing interceptor runs in the opposite lane. For construction of additional interceptor, it was
confirmed that required space for box culvert is available in the underground of the seaside lane.
(3) Maintenance Hole
Maintenance holes have been constructed on the box culvert for maintenance activities of
cleaning/declogging of culvert. Principally, maintenance holes have been installed at an
interval of 50 m. However, some maintenance holes are not functioning due to artificial
covering by asphalting or earth embankment. Considering proper and effective maintenance
works of the culvert, modification works will be made to the covered maintenance holes.
An inventory survey was conducted throughout site inspection and using available drawings in
order to clarify the present conditions of maintenance holes for the objective 5 drainage box
culverts for Blumentritt Interceptor, Buendia Outfall, Zobel Roxas Drainage Main, Pasong
Tamo Drainage Main and Faraday Drainage Main to be declogged in the priority projects.
Table F.3.2 is the results of inventory survey and those locations are indicated in Databook II
(Drawings).
Table F.3.2 Present Conditions of Maintenance Holes
Channel Total Number of Maintenance
Hole
Number of Covered Maintenance
Holes
Blumentritt Interceptor 91 20
Buendia Outfall 47 29
Zobel Roxas Drainage Main 17 3
Pasomg Tamo Drainage Main 13 0
Faraday Drainage Main 43 0
F.3.3 DESIGN CRITERIA FOR DRAINAGE FACILITIES
(1) Target of Rehabilitation Works and Design Scale for Additional Works
The menus for preliminary design are rehabilitation of drainage channels by
dredging/declogging and additional and/or remedial works for the interceptors (or box culverts).
The rehabilitation works for the existing drainage channels are designed to recover the original
flow area (or cross-sectional area) of channels and box culverts so as to convey storm water
properly. Accordingly, the rehabilitation work is to dredge or declog the bottom deposits in the
channels and culverts, including related works like installation of stop logs and improvement of
maintenance holes (or manholes) for enabling proper maintenance activities.
Aside from the above, that of the additional works is to construct new box culverts and remedial
works for improvement of the existing drainage conditions. For Blumentritt Interceptor,
preliminary design of additional box culvert and remedial works for road surface flow inlets and
widening of narrow sections are conducted. The design scale of drainage main shown in Table
F.3.3 is applied for additional works.
F - 6
Table F.3.3 Design Scale for Additional Works
Objective Channel Design Scale
Secondary Channels
(Blumentritt Interceptor, Zobel Roxa D.M., Faraday D.M.)
3-year return period
(60 mm/hour)
(2) Basic Data to be used
Basic topographic maps and other data to be used in the preliminary design will be as follows.
Topographic Maps
- The most recent available topographic information based on 1:5,000 topographic map
prepared in 2004, with low-lying areas modified using the result of manhole survey in 2000,
is utilized for preliminary design.
- Primary benchmark is BM-ML3 located in Quezon City.
- Elevation above DPWH datum of 10.475 m is equivalent to Mean Sea Level (MSL).
Channel Cross-Sections and Profiles
- For rehabilitation works, cross-sections and longitudinal profiles of the channels surveyed
in the master plan stage and in SEDLMM (2000) are used as basis to retrieve original
channel section.
- For additional works, cross-sections (ground elevation) at major points (100m interval) and
longitudinal profiles (ground elevation) were surveyed in the feasibility stage of 2004 is
used as basis to design of box culvert channel.
Design High Water Levels at Surroundings
- Mean Spring High Tide Level (El. 11.34 m) is applied for design high tide level on
Manila Bay.
- Completion of on-going Pasig-Marikina River Improvement Project is assumed. The
design high water level along the Pasig River determined by the on-going Pasig-Marikina
River Improvement Project is applied.
Soil Conditions
- Soil investigation by boring and soil analysis was conducted in the feasibility stage.
Major soil data obtained from the above is u tilized in the design of additional works and
construction method, etc., and summarized in Table F.3.4.
F - 7
Table F.3.4 Major Soil Data in Priority Projects Areas
Blumentritt Interceptor Zobel Roxas
DM
Faraday
DMFeature
1 2 3 4 5 5A 6 7 8
1.N-value
0-1 m 10 7 0 4 7 4 - 2 3
1-3 m 5 22 3 26 29 8 23 5 7
3-5 m 5 47 14 58 55 21 8 20 29
5-7 m 25 50 11 57 42 42 6 37 tuff
7-10 m 60 55 24 tuff 60 51 10 tuff
2.Specific gravity 2.57 2.48 2.41 2.58 2.46 2.47 2.63 2.41 2.48
3.Unit weight(g/cu.cm) 1.67 1.73 1.81 1.72
4.Unconfined compression
test, qu (kg/sq.cm) 47.04 12.29 41.25 15.48
5.Water table (m) 1.50 1.00 1.60 1.85 2.90 1.90 2.50 1.00 1.00
6.Workability
Depth of sample taken (m) 14 6 2 12 8
Liquid limit (LL) 49 70 62 61 48
Plastic limit (PL) 27 29 26 26 25
Referred Guidelines and References
- Design Guidelines, Criteria and Standards for Public Works and Highways, Volume-II
(Orange Book) DPWH
- Technical Standards and Guidelines for Planning and Design, Volume-II, Urban Drainage,
DPWH
- Technical Standard for River and Sabo Works, River Association of Japan, Ministry of
Land, Infrastructure and Transport (MLIT)
(3) Hydraulic Analysis
Discharge capacities of the drainage channels and box culverts are estimated respectively as
follows.
Discharge capacities after dredging of open channels are estimated with the following
conditions.
- Uniform flow
- Bankfull flow
- Resistance law: Manning formula
- Manning’s coefficient: 0.025 for open channels
- Surface water slope: Average bed slope or planned bed slope
Discharge capacity (estimation of required cross-sectional area) for a box culvert is determined
as the discharge without overflow at any manholes along the questioned culvert. For box
culvert, the design discharge estimated in the master plan is applied to design. Applied design
discharges will be explained in the following respective sections of designing of additional box
culvert. To estimate it, pressure flow is assumed because when large flood comes, the water
level becomes almost equal to bank elevation in esteros/creeks. In such situation, pressure
flow in the box culvert would occur. The water level at the following downstream ends is
assumed as follows.
- Esteros/creeks: Top level of drainage main (culvert)
- Drainage mains: Top level of drainage main (culvert)
- Pumping stations: Pump start level
F - 8
Other conditions are as follows.
- Resistance law: Manning formula
- Manning’s coefficient: 0.015 for box culvert
After necessary or recovered dimension of the drainage channels is determined, a more
sophisticated unsteady, hydrodynamic simulation by MOUSE is executed to confirm its validity.
(4) Basic Line for Dredging and Declogging of Drainage Channels and Related
Works
The following are the basic lines for dredging (clearing) and declogging of drainage channels
including related works.
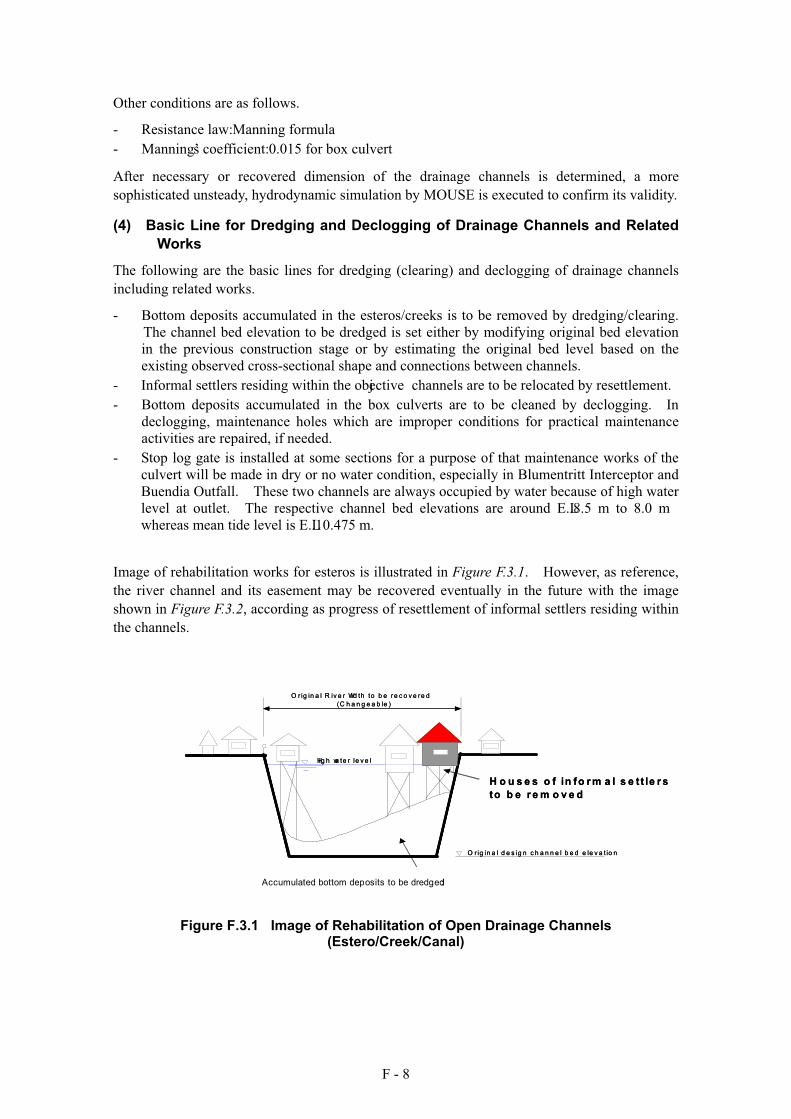
- Bottom deposits accumulated in the esteros/creeks is to be removed by dredging/clearing.
The channel bed elevation to be dredged is set either by modifying original bed elevation
in the previous construction stage or by estimating the original bed level based on the
existing observed cross-sectional shape and connections between channels.
- Informal settlers residing within the objective channels are to be relocated by resettlement.
- Bottom deposits accumulated in the box culverts are to be cleaned by declogging. In
declogging, maintenance holes which are improper conditions for practical maintenance
activities are repaired, if needed.
- Stop log gate is installed at some sections for a purpose of that maintenance works of the
culvert will be made in dry or no water condition, especially in Blumentritt Interceptor and
Buendia Outfall. These two channels are always occupied by water because of high water
level at outlet. The respective channel bed elevations are around E.L.8.5 m to 8.0 m
whereas mean tide level is E.L.10.475 m.
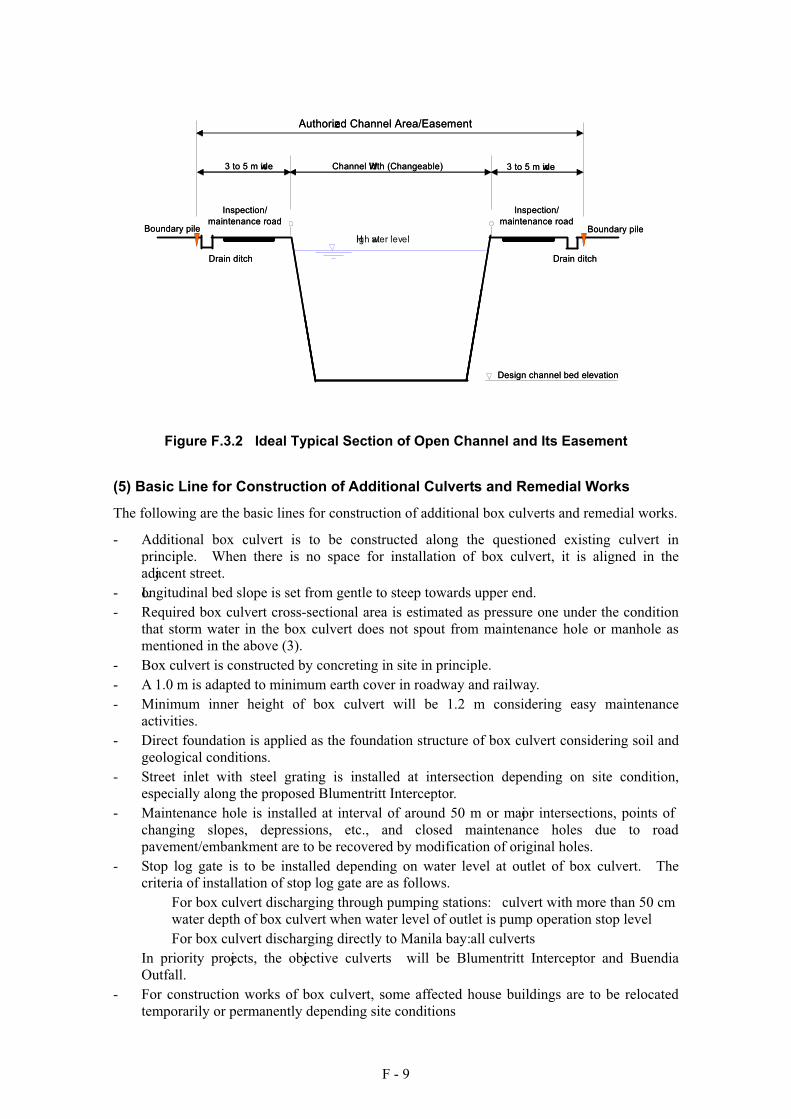
Image of rehabilitation works for esteros is illustrated in Figure F.3.1. However, as reference,
the river channel and its easement may be recovered eventually in the future with the image
shown in Figure F.3.2, according as progress of resettlement of informal settlers residing within
the channels.
Hig h wa te r le v e l
O r ig in a l d e s ig n c h a n n e l b e d e le v a t io n
O r ig in a l R iv e r Wid th to b e re c o v e re d
(C h a n g e a b le )
A c c u m u la te d s e d im e n t /g a r b a g e /w a s te to b e d r e d g e d
H o u s e s o f in fo r m a l s e t t le r s
to b e r e m o v e d
Accumulated bottom deposits to be dredged
Figure F.3.1 Image of Rehabilitation of Open Drainage Channels (Estero/Creek/Canal)
F - 9
Design high water level
Drain ditchDrain ditch
Inspection/
maintenance road
Inspection/
maintenance road
Design channel bed elevation
Authorized Channel Area/ Easement
3 to 5 m wide 3 to 5 m wideChannel Width (Changeable)
Boundary pile Boundary pileHigh water level
Design high water level
Drain ditchDrain ditch
Inspection/
maintenance road
Inspection/
maintenance road
Design channel bed elevation
Authorized Channel Area/ Easement
3 to 5 m wide 3 to 5 m wideChannel Width (Changeable)
Boundary pile Boundary pileHigh water level
Figure F.3.2 Ideal Typical Section of Open Channel and Its Easement
(5) Basic Line for Construction of Additional Culverts and Remedial Works
The following are the basic lines for construction of additional box culverts and remedial works.
- Additional box culvert is to be constructed along the questioned existing culvert in
principle. When there is no space for installation of box culvert, it is aligned in the
adjacent street.
- Longitudinal bed slope is set from gentle to steep towards upper end.
- Required box culvert cross-sectional area is estimated as pressure one under the condition
that storm water in the box culvert does not spout from maintenance hole or manhole as
mentioned in the above (3).
- Box culvert is constructed by concreting in site in principle.
- A 1.0 m is adapted to minimum earth cover in roadway and railway.
- Minimum inner height of box culvert will be 1.2 m considering easy maintenance
activities.
- Direct foundation is applied as the foundation structure of box culvert considering soil and
geological conditions.
- Street inlet with steel grating is installed at intersection depending on site condition,
especially along the proposed Blumentritt Interceptor.
- Maintenance hole is installed at interval of around 50 m or major intersections, points of
changing slopes, depressions, etc., and closed maintenance holes due to road
pavement/embankment are to be recovered by modification of original holes.
- Stop log gate is to be installed depending on water level at outlet of box culvert. The
criteria of installation of stop log gate are as follows.
For box culvert discharging through pumping stations: culvert with more than 50 cm
water depth of box culvert when water level of outlet is pump operation stop level
For box culvert discharging directly to Manila bay: all culverts
In priority projects, the objective culverts will be Blumentritt Interceptor and Buendia
Outfall.
- For construction works of box culvert, some affected house buildings are to be relocated
temporarily or permanently depending site conditions
F - 10
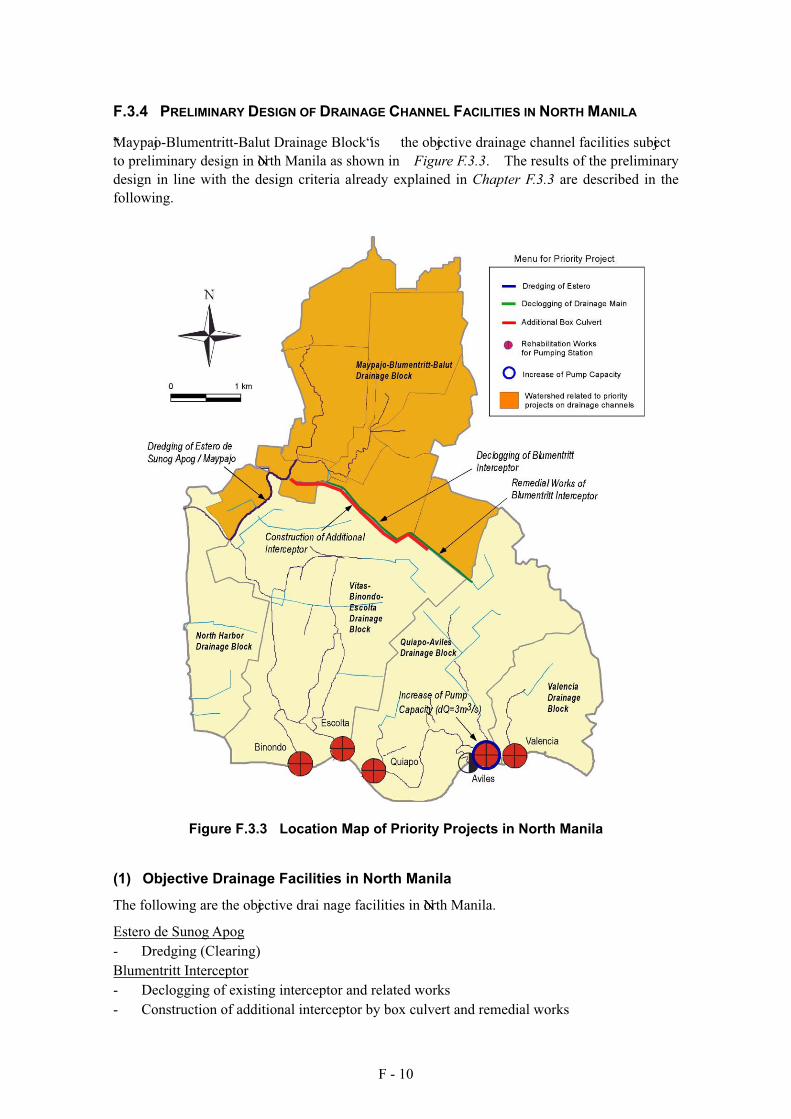
F.3.4 PRELIMINARY DESIGN OF DRAINAGE CHANNEL FACILITIES IN NORTH MANILA
“Maypajo-Blumentritt-Balut Drainage Block“ is the objective drainage channel facilities subject
to preliminary design in North Manila as shown in Figure F.3.3. The results of the preliminary
design in line with the design criteria already explained in Chapter F.3.3 are described in the
following.
Figure F.3.3 Location Map of Priority Projects in North Manila
(1) Objective Drainage Facilities in North Manila
The following are the objective drai nage facilities in North Manila.
Estero de Sunog Apog
- Dredging (Clearing)
Blumentritt Interceptor
- Declogging of existing interceptor and related works
- Construction of additional interceptor by box culvert and remedial works
F - 11
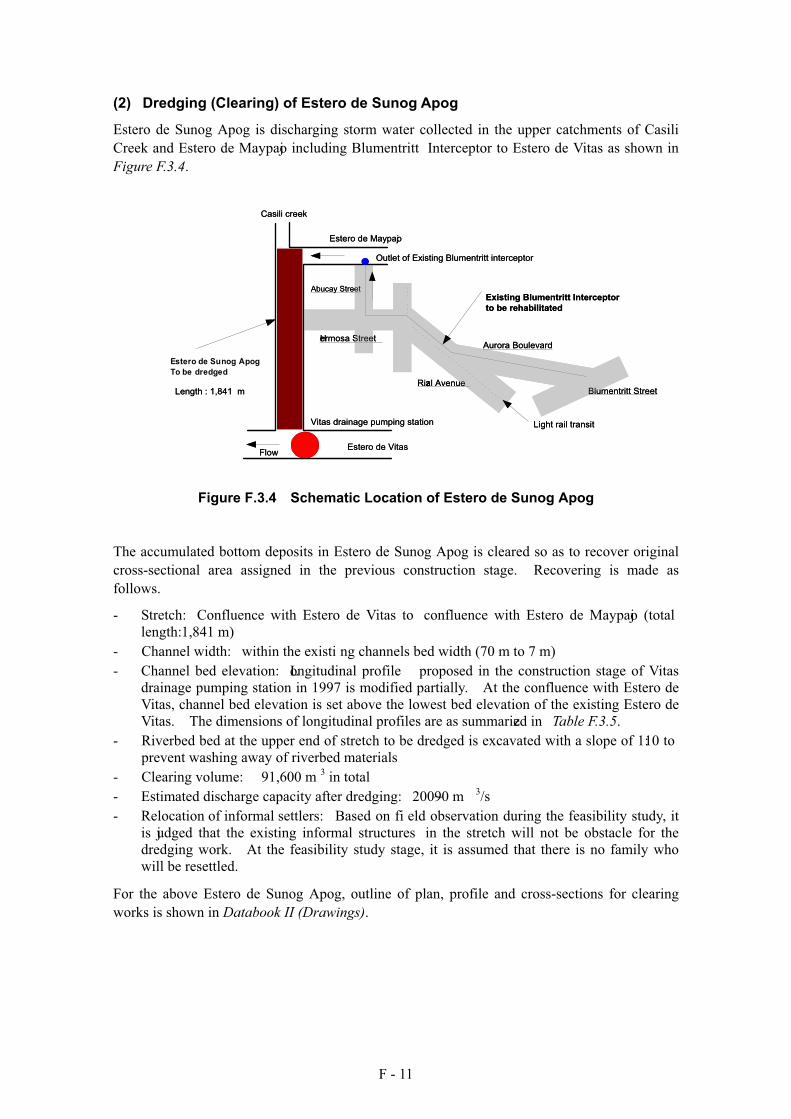
(2) Dredging (Clearing) of Estero de Sunog Apog
Estero de Sunog Apog is discharging storm water collected in the upper catchments of Casili
Creek and Estero de Maypajo including Blumentritt Interceptor to Estero de Vitas as shown in
Figure F.3.4.
Estero de Maypajo
Estero de Sunog Apog
to be deredgedRizal Avenue
Blumentritt Street
Hermosa StreetAurora Boulevard
Outlet of Existing Blumentritt interceptor
Light rail transit
Existing Blumentritt Interceptor
to be rehabilitated
Estero de Vitas
Vitas drainage pumping station
Length : 1,841 m
Casili creek
Flow
Abucay Street
Estero de Sunog Apog
To be dredged
Figure F.3.4 Schematic Location of Estero de Sunog Apog
The accumulated bottom deposits in Estero de Sunog Apog is cleared so as to recover original
cross-sectional area assigned in the previous construction stage. Recovering is made as
follows.
- Stretch: Confluence with Estero de Vitas to confluence with Estero de Maypajo (total
length: 1,841 m)
- Channel width: within the existi ng channels bed width (70 m to 7 m)
- Channel bed elevation: Longitudinal profile proposed in the construction stage of Vitas
drainage pumping station in 1997 is modified partially. At the confluence with Estero de
Vitas, channel bed elevation is set above the lowest bed elevation of the existing Estero de
Vitas. The dimensions of longitudinal profiles are as summarized in Table F.3.5.
- Riverbed bed at the upper end of stretch to be dredged is excavated with a slope of 1:10 to
prevent washing away of riverbed materials
- Clearing volume: 91,600 m 3 in total
- Estimated discharge capacity after dredging: 200~90 m 3/s
- Relocation of informal settlers: Based on fi eld observation during the feasibility study, it
is judged that the existing informal structures in the stretch will not be obstacle for the
dredging work. At the feasibility study stage, it is assumed that there is no family who
will be resettled.
For the above Estero de Sunog Apog, outline of plan, profile and cross-sections for clearing
works is shown in Databook II (Drawings).
F - 12
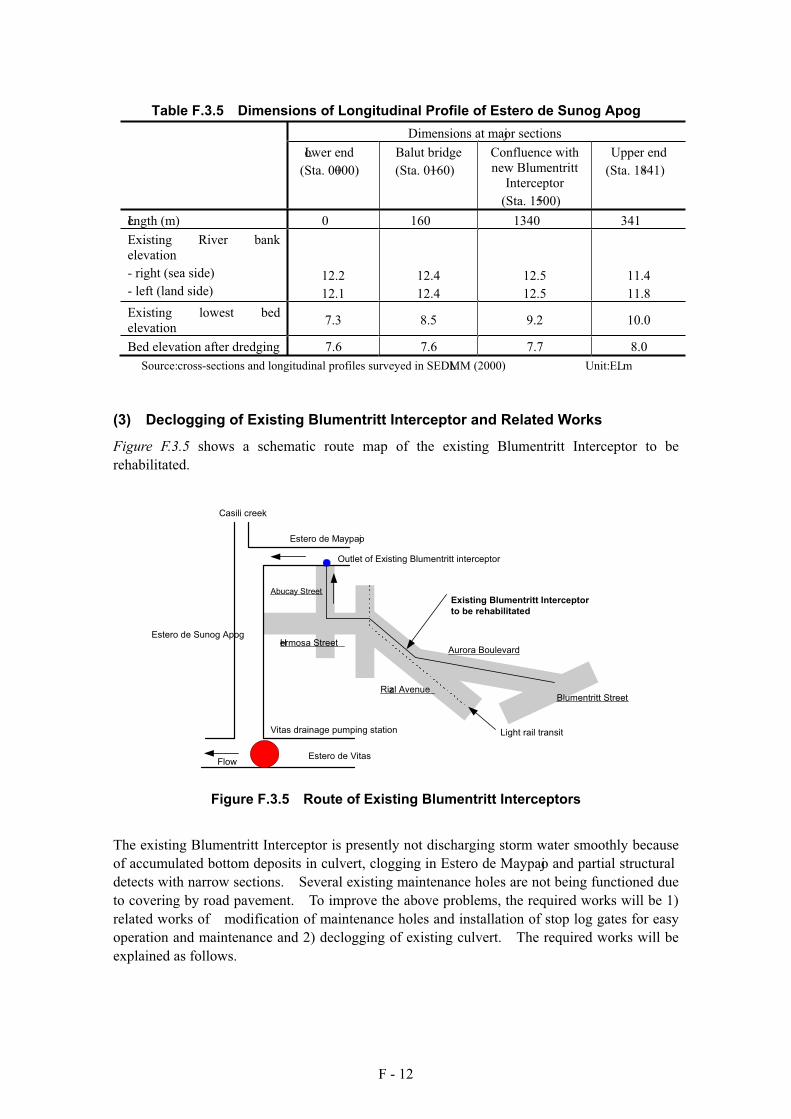
Table F.3.5 Dimensions of Longitudinal Profile of Estero de Sunog Apog
Dimensions at major sections
Lower end
(Sta. 0+000)
Balut bridge
(Sta. 0+160)
Confluence with
new Blumentritt
Interceptor
(Sta. 1+500)
Upper end
(Sta. 1+841)
Length (m) 0 160 1340 341
Existing River bank
elevation
- right (sea side)
- left (land side)
12.2
12.1
12.4
12.4
12.5
12.5
11.4
11.8
Existing lowest bed
elevation7.3 8.5 9.2 10.0
Bed elevation after dredging 7.6 7.6 7.7 8.0
Source: cross-sections and longitudinal profiles surveyed in SEDLMM (2000) Unit: EL. m
(3) Declogging of Existing Blumentritt Interceptor and Related Works
Figure F.3.5 shows a schematic route map of the existing Blumentritt Interceptor to be
rehabilitated.
Estero de Maypajo
Rizal AvenueBlumentritt Street
Hermosa StreetAurora Boulevard
Outlet of Existing Blumentritt interceptor
Light rail transit
Existing Blumentritt Interceptor
to be rehabilitated
Estero de Vitas
Vitas drainage pumping station
Casili creek
Flow
Abucay Street
Estero de Sunog Apog
Figure F.3.5 Route of Existing Blumentritt Interceptors
The existing Blumentritt Interceptor is presently not discharging storm water smoothly because
of accumulated bottom deposits in culvert, clogging in Estero de Maypajo and partial structural
detects with narrow sections. Several existing maintenance holes are not being functioned due
to covering by road pavement. To improve the above problems, the required works will be 1)
related works of modification of maintenance holes and installation of stop log gates for easy
operation and maintenance and 2) declogging of existing culvert. The required works will be
explained as follows.
F - 13
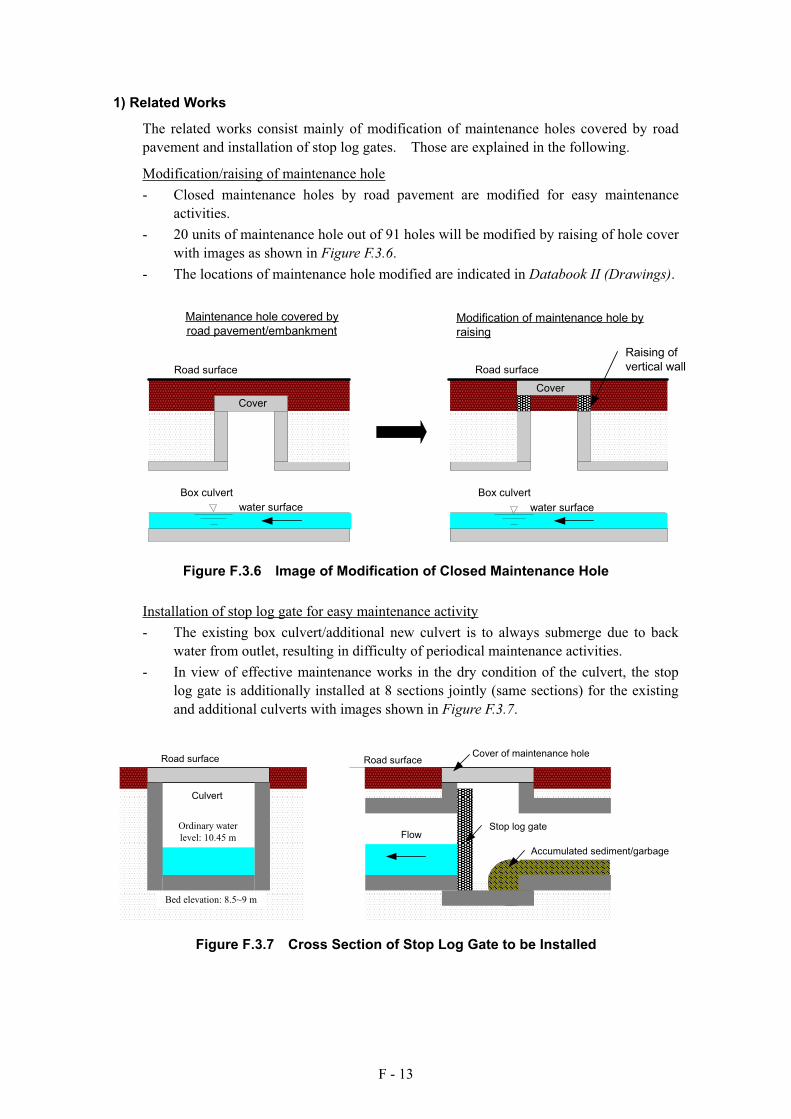
1) Related Works
The related works consist mainly of modification of maintenance holes covered by road
pavement and installation of stop log gates. Those are explained in the following.
Modification/raising of maintenance hole
- Closed maintenance holes by road pavement are modified for easy maintenance
activities.
- 20 units of maintenance hole out of 91 holes will be modified by raising of hole cover
with images as shown in Figure F.3.6.
- The locations of maintenance hole modified are indicated in Databook II (Drawings).
Road surface
Raising of
vertical wall
Modification of maintenance hole by
raising
Box culvert
Cover
water surface
Maintenance hole covered by
road pavement/embankment
Box culvert
Road surface
Cover
water surface
Figure F.3.6 Image of Modification of Closed Maintenance Hole
Installation of stop log gate for easy maintenance activity
- The existing box culvert/additional new culvert is to always submerge due to back
water from outlet, resulting in difficulty of periodical maintenance activities.
- In view of effective maintenance works in the dry condition of the culvert, the stop
log gate is additionally installed at 8 sections jointly (same sections) for the existing
and additional culverts with images shown in Figure F.3.7.
FlowStop log gate
Accumulated sediment/garbage
Cover of maintenance holeRoad surface
Culvert
Road surface
Bed elevation: 8.5~9 m
Ordinary water
level: 10.45 m
Figure F.3.7 Cross Section of Stop Log Gate to be Installed
F - 14
2) Declogging of Existing Blumentritt Interceptor
In parallel with related works of the existing interceptor, declogging for a total length of
2,655 m from the closing section at Hermosa Street to the upper end of the intersection of
Dapitan Street will be made as described below.
- Stretch: Section to be closed at Hermosa Street to upper end of the intersection of
Dapitan street (total length: 2,655 m)
- The dimensions of longitudinal profiles of the interceptor are as presented in
Databook II (Drawings).
- Declogging volume: 9,800 m 3 in total
- Estimated discharge capacity after declogging: 8 m 3/s
For the above the existing Blumentritt Interceptor, plan, profile and cross-sections for
remedial works and declogging are presented in Databook II (Drawings).
(4) Construction of Additional Blumentritt Interceptor and Remedial Works
The additional Blumentritt Interceptor with a total length of 2,570 m is newly constructed along
the existing interceptor. Also widening of existing box culvert at narrow sections and
construction of inlets for road surface flow will be additionally made as remedial works. The
results are as follows and the details are presented in Annex F.1 and F.5 and in Databook II
(Drawings).
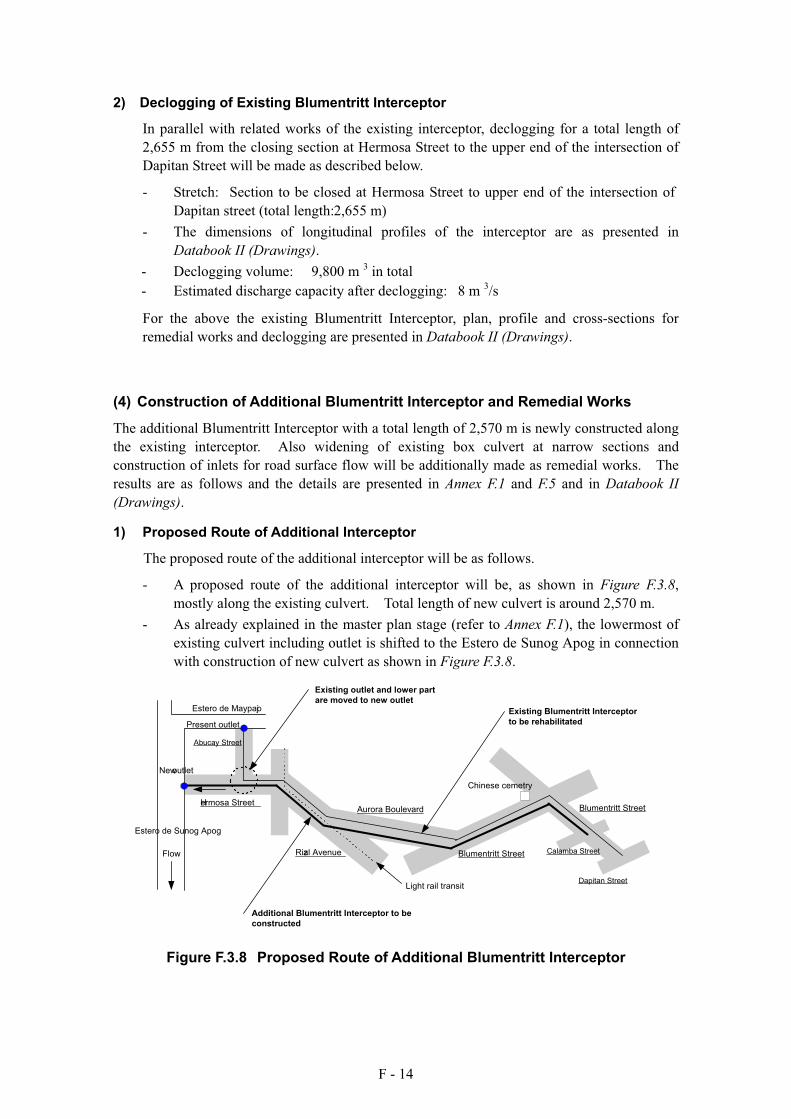
1) Proposed Route of Additional Interceptor
The proposed route of the additional interceptor will be as follows.
- A proposed route of the additional interceptor will be, as shown in Figure F.3.8,
mostly along the existing culvert. Total length of new culvert is around 2,570 m.
- As already explained in the master plan stage (refer to Annex F.1), the lowermost of
existing culvert including outlet is shifted to the Estero de Sunog Apog in connection
with construction of new culvert as shown in Figure F.3.8.
Estero de Maypajo
Estero de Sunog Apog
Rizal Avenue Blumentritt Street
Hermosa StreetAurora Boulevard Blumentritt Street
Present outlet
New outlet
Light rail transit
Existing Blumentritt Interceptor
to be rehabilitated
Additional Blumentritt Interceptor to be
constructed
Existing outlet and lower part
are moved to new outlet
Calamba Street
Dapitan Street
Flow
Abucay Street
Chinese cemetry
Figure F.3.8 Proposed Route of Additional Blumentritt Interceptor
F - 15
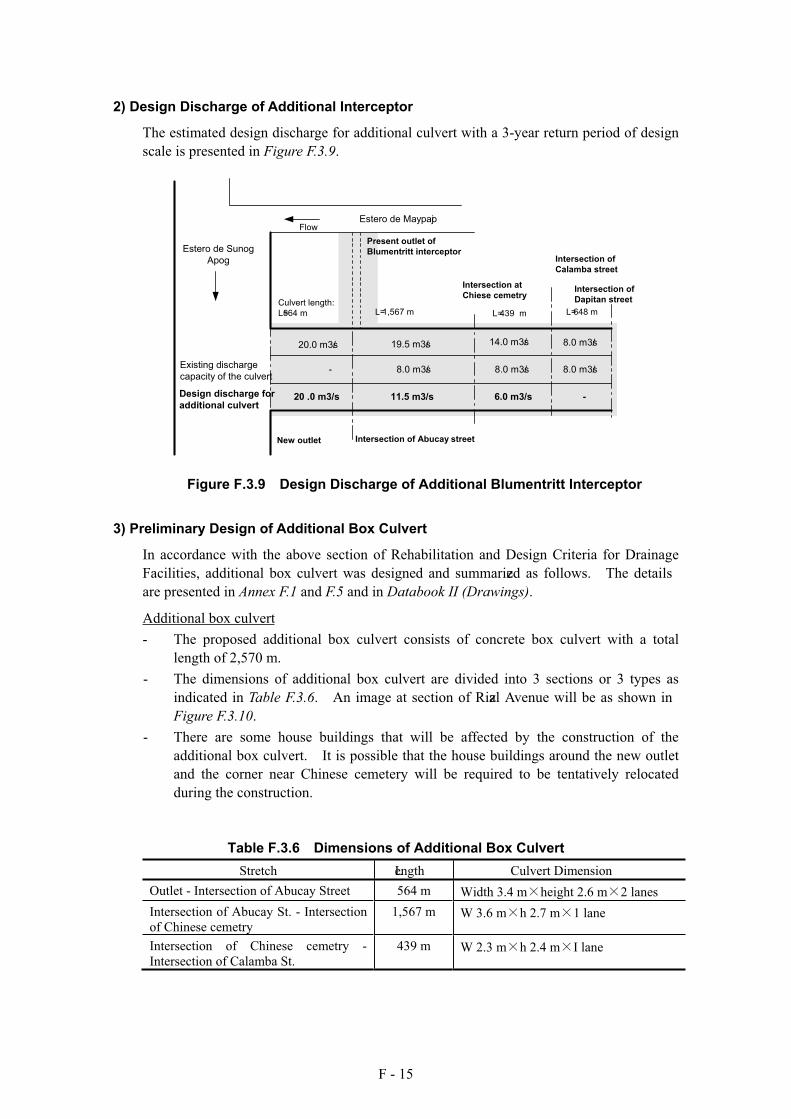
2) Design Discharge of Additional Interceptor
The estimated design discharge for additional culvert with a 3-year return period of design
scale is presented in Figure F.3.9.
Estero de Sunog
Apog Intersection of
Calamba street
Existing discharge
capacity of the culvert
Design discharge for
additional culvert
New outlet
20.0 m3/s
6.0 m3/s11.5 m3/s20 .0 m3/s
8.0 m3/s8.0 m3/s8.0 m3/s-
8.0 m3/s14.0 m3/s19.5 m3/s
-
Intersection of Abucay street
Intersection at
Chiese cemetry
Present outlet of
Blumentritt interceptor
Estero de Maypajo
Culvert length:
L=564 m L= 1,567 m L= 439 m L= 648 m
Flow
Intersection of
Dapitan street
Figure F.3.9 Design Discharge of Additional Blumentritt Interceptor
3) Preliminary Design of Additional Box Culvert
In accordance with the above section of Rehabilitation and Design Criteria for Drainage
Facilities, additional box culvert was designed and summarized as follows. The details
are presented in Annex F.1 and F.5 and in Databook II (Drawings).
Additional box culvert
- The proposed additional box culvert consists of concrete box culvert with a total
length of 2,570 m.
- The dimensions of additional box culvert are divided into 3 sections or 3 types as
indicated in Table F.3.6. An image at section of Rizal Avenue will be as shown in
Figure F.3.10.
- There are some house buildings that will be affected by the construction of the
additional box culvert. It is possible that the house buildings around the new outlet
and the corner near Chinese cemetery will be required to be tentatively relocated
during the construction.
Table F.3.6 Dimensions of Additional Box Culvert
Stretch Length Culvert Dimension
Outlet - Intersection of Abucay Street 564 m Width 3.4 m height 2.6 m 2 lanes
Intersection of Abucay St. - Intersection
of Chinese cemetry
1,567 m W 3.6 m h 2.7 m 1 lane
Intersection of Chinese cemetry -
Intersection of Calamba St.
439 m W 2.3 m h 2.4 m I lane

F - 16
Existing Box CulvertAdditional Box Culvert
(seaside)
Light Rail Transit
Foundation
Pile with 1 m diameter
Road surface Road surface
5.25 m 5.95 m
1.8 m1.8 m
3.9 m
3.6 m
8.5 m
1.0 m
2.2 m
1.0 m
2.7 m
Figure F.3.10 Image of Additional Box Culvert at Section of Rizal Avenue
Inlet for road surface flow
- In order to drain road surface flow into the box culvert smoothly and effectively,
inlets are newly installed at 10 sections which shall be located at intersections in the
upper Blumentritt street from intersection of Chinese cemetery to Dapitan Street.
- Inlet ditch is installed on the whole carriageway width as imaged in Figure F.3.11 and
covered by steel grating.
Blumentritt Street
Dapitan Street
Inlet for road
surface flow and
ditch flow by
steel grating
Box culvert
Surface flow
from hilly areas
Box culvert
Blumentritt StreetDapitan Street
Flow Road surface
Image Plan of Inlet for Road
Surface and Ditch Flow
Cross Section of Inlet
Desilting basin
Figure F.3.11 Image of Inlet for Road Surface Flow
F - 17
Maintenance hole
- In order to operate and maintain the new box culvert smoothly and effectively,
maintenance holes are installed at an interval of 50 m. The number of maintenance
holes will be 51 places.
- As mentioned in the above, stop log gate will be jointly installed at 8 sections of the
proposed maintenance holes.
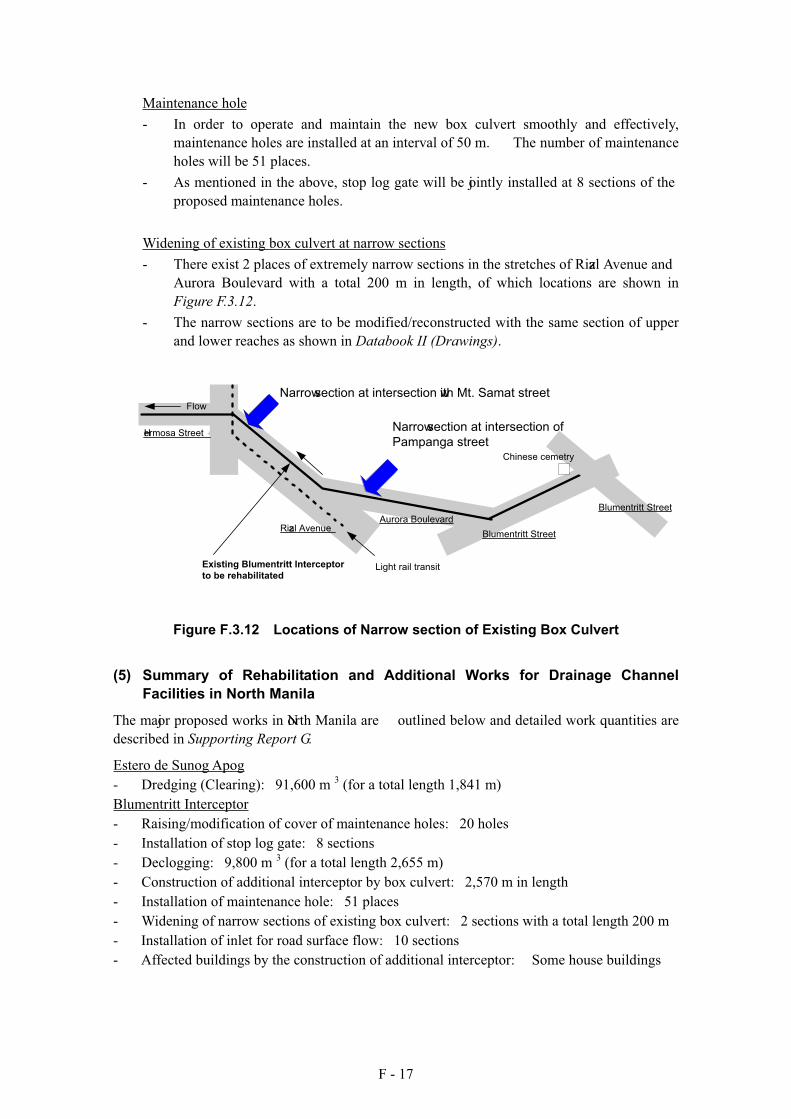
Widening of existing box culvert at narrow sections
- There exist 2 places of extremely narrow sections in the stretches of Rizal Avenue and
Aurora Boulevard with a total 200 m in length, of which locations are shown in
Figure F.3.12.
- The narrow sections are to be modified/reconstructed with the same section of upper
and lower reaches as shown in Databook II (Drawings).
Rizal Avenue
Light rail transit
Aurora Boulevard
Blumentritt Street
Hermosa Street
Narrow section at intersection with Mt. Samat street
Narrow section at intersection of
Pampanga street
Blumentritt Street
Existing Blumentritt Interceptor
to be rehabilitated
Flow
Chinese cemetry
Figure F.3.12 Locations of Narrow section of Existing Box Culvert
(5) Summary of Rehabilitation and Additional Works for Drainage Channel
Facilities in North Manila
The major proposed works in North Manila are outlined below and detailed work quantities are
described in Supporting Report G.
Estero de Sunog Apog
- Dredging (Clearing): 91,600 m 3 (for a total length 1,841 m)
Blumentritt Interceptor
- Raising/modification of cover of maintenance holes: 20 holes
- Installation of stop log gate: 8 sections
- Declogging: 9,800 m 3 (for a total length 2,655 m)
- Construction of additional interceptor by box culvert: 2,570 m in length
- Installation of maintenance hole: 51 places
- Widening of narrow sections of existing box culvert: 2 sections with a total length 200 m
- Installation of inlet for road surface flow: 10 sections
- Affected buildings by the construction of additional interceptor: Some house buildings
F - 18
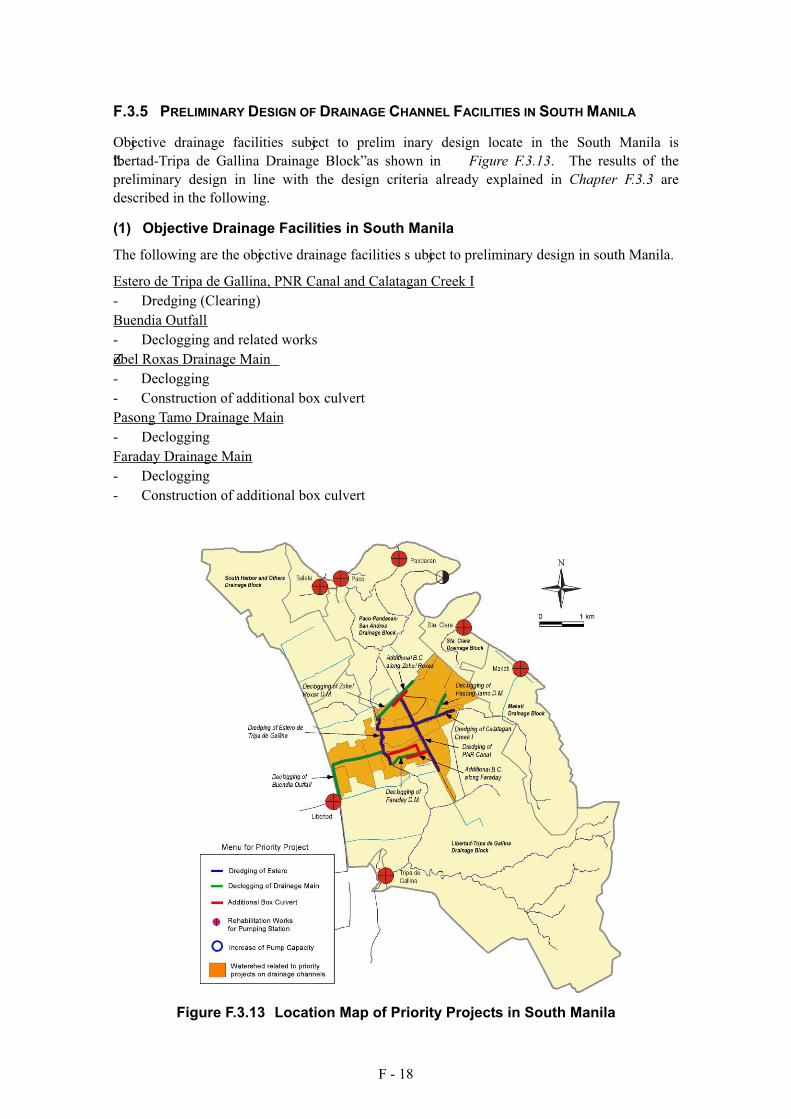
F.3.5 PRELIMINARY DESIGN OF DRAINAGE CHANNEL FACILITIES IN SOUTH MANILA
Objective drainage facilities subject to prelim inary design locate in the South Manila is
“Libertad-Tripa de Gallina Drainage Block” as shown in Figure F.3.13. The results of the
preliminary design in line with the design criteria already explained in Chapter F.3.3 are
described in the following.
(1) Objective Drainage Facilities in South Manila
The following are the objective drainage facilities s ubject to preliminary design in south Manila.
Estero de Tripa de Gallina, PNR Canal and Calatagan Creek I
- Dredging (Clearing)
Buendia Outfall
- Declogging and related works
Zobel Roxas Drainage Main
- Declogging
- Construction of additional box culvert
Pasong Tamo Drainage Main
- Declogging
Faraday Drainage Main
- Declogging
- Construction of additional box culvert
Figure F.3.13 Location Map of Priority Projects in South Manila
F - 19
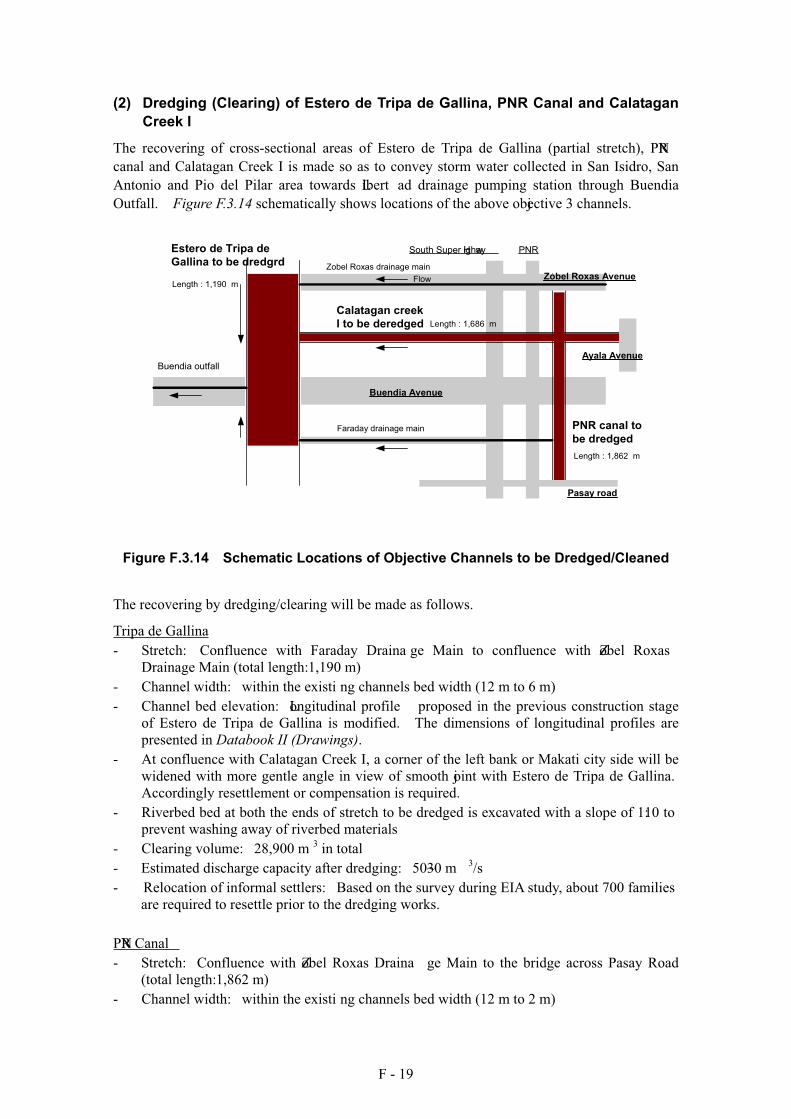
(2) Dredging (Clearing) of Estero de Tripa de Gallina, PNR Canal and Calatagan
Creek I
The recovering of cross-sectional areas of Estero de Tripa de Gallina (partial stretch), PNR
canal and Calatagan Creek I is made so as to convey storm water collected in San Isidro, San
Antonio and Pio del Pilar area towards Libert ad drainage pumping station through Buendia
Outfall. Figure F.3.14 schematically shows locations of the above objective 3 channels.
Estero de Tripa de
Gallina to be dredgrd
Buendia outfall
Zobel Roxas drainage main
Calatagan creek
I to be deredged
PNR canal to
be dredged
Buendia Avenue
Zobel Roxas Avenue
South Super Highway PNR
Faraday drainage main
Ayala Avenue
Pasay road
Length : 1,190 m
Length : 1,686 m
Length : 1,862 m
Flow
Figure F.3.14 Schematic Locations of Objective Channels to be Dredged/Cleaned
The recovering by dredging/clearing will be made as follows.
Tripa de Gallina
- Stretch: Confluence with Faraday Draina ge Main to confluence with Zobel Roxas
Drainage Main (total length: 1,190 m)
- Channel width: within the existi ng channels bed width (12 m to 6 m)
- Channel bed elevation: Longitudinal profile proposed in the previous construction stage
of Estero de Tripa de Gallina is modified. The dimensions of longitudinal profiles are
presented in Databook II (Drawings).
- At confluence with Calatagan Creek I, a corner of the left bank or Makati city side will be
widened with more gentle angle in view of smooth joint with Estero de Tripa de Gallina.
Accordingly resettlement or compensation is required.
- Riverbed bed at both the ends of stretch to be dredged is excavated with a slope of 1:10 to
prevent washing away of riverbed materials
- Clearing volume: 28,900 m 3 in total
- Estimated discharge capacity after dredging: 50~30 m 3/s
- Relocation of informal settlers: Based on the survey during EIA study, about 700 families
are required to resettle prior to the dredging works.
PNR Canal
- Stretch: Confluence with Zobel Roxas Draina ge Main to the bridge across Pasay Road
(total length: 1,862 m)
- Channel width: within the existi ng channels bed width (12 m to 2 m)
F - 20
- Channel bed elevation: Bed elevation is set by estimating the original bed level based on
the existing observed cross-sectional shape and connections between channels. The
dimensions of longitudinal profiles are as presented in Databook II (Drawings).
- Clearing volume: 5,000 m 3 in total
- Estimated discharge capacity after declogging: 10~4 m 3/s
- Relocation of informal settlers: Based on fi eld observation during the feasibility study, it
is judged that the existing informal structures in the stretch will not be obstacle for the
dredging work. At the feasibility study stage, it is assumed that there is no family who
will be resettled.
Calatagan Creek I
- Stretch: Confluence with Estero de Tripa de Gallina to the upper end (total length: 1,686
m)
- Channel width: within the existing channels bed width (8 m to 3 m)
- Channel bed elevation: Bed elevation is set by estimating the original bed level based on
the existing observed cross-sectional shape and connections between channels. The
dimensions of longitudinal profiles are as presented in Databook II (Drawings).
- Clearing volume: 13,200 m 3 in total
- Estimated discharge capacity after dredging: 20~15 m 3/s
- Relocation of informal settlers: Based on fi eld observation during the feasibility study, it
is judged that the existing informal structures in the stretch will not be obstacle for the
dredging work. At the feasibility study stage, it is assumed that there is no family who
will be resettled.
For the above 3 drainage channels, the drawings are shown in Databook II (Drawings).
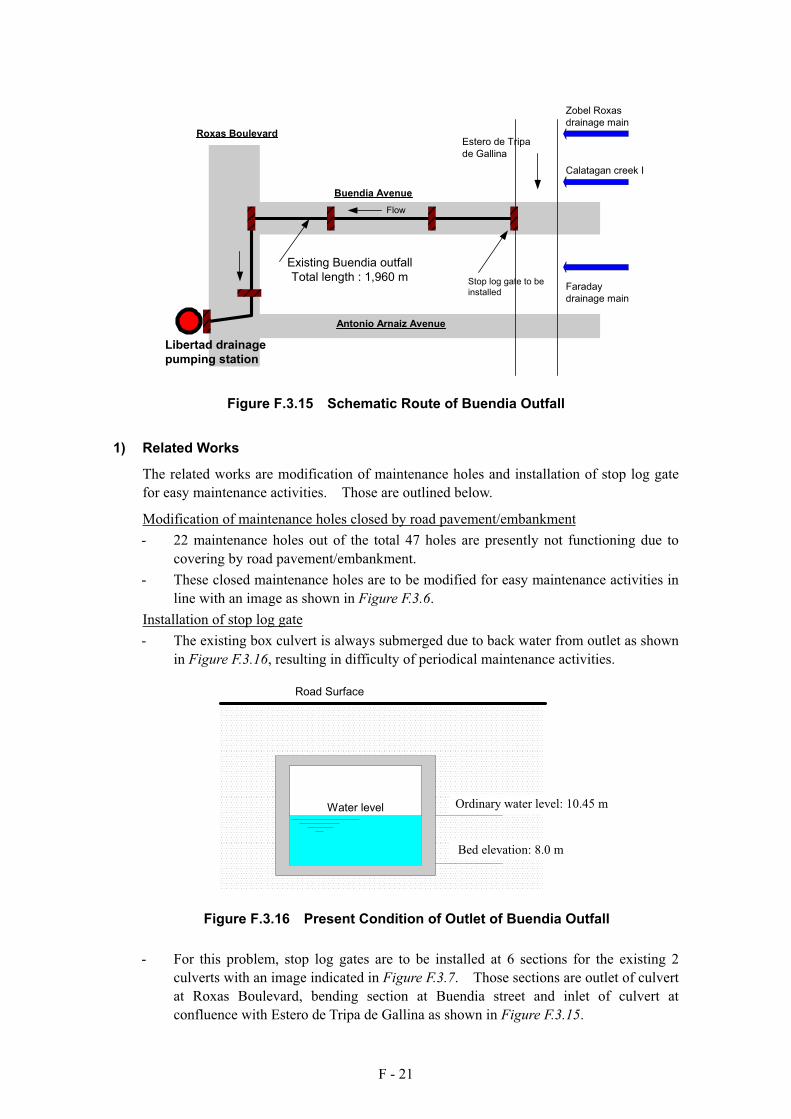
(3) Declogging of Buendia Outfall and Related Works
Storm water collected in Estero de Tripa de Gallina in the stretch selected in the priority projects
is discharged through 2 box culverts of Buendia Outfall into Libertad drainage pumping station
as shown in Figure F.3.15. The total length of the existing culvert will be around 1,960 m.
In the existing Buendia Outfall, there are sufficient numbers of maintenance holes for periodical
maintenance activities installed with a 50 m interval, however, such maintenance holes are
mostly not functioning due to covering by asphalt pavement and botanical gardens developed
upward of the box culvert of Buendia Outfall. Also the existing box culverts are always
submerged due to back water from outlet resulting in difficulty of periodical maintenance
activities.
The required works for Buendia Outfall consist of 1) related works of modification of covered
maintenance holes and installation of stop log gates for maintenance activities and 2)
declogging of the accumulated bottom deposits in the box culvert. For the above, the following
related and declogging works will be proposed.
F - 21
Calatagan creek I
Antonio Arnaiz Avenue
Buendia Avenue
Estero de Tripa
de Gallina
Libertad drainage
pumping station
Roxas Boulevard
Existing Buendia outfall
Total length : 1,960 m
Zobel Roxas
drainage main
Faraday
drainage main
Stop log gate to be
installed
Flow
Figure F.3.15 Schematic Route of Buendia Outfall
1) Related Works
The related works are modification of maintenance holes and installation of stop log gate
for easy maintenance activities. Those are outlined below.
Modification of maintenance holes closed by road pavement/embankment
- 22 maintenance holes out of the total 47 holes are presently not functioning due to
covering by road pavement/embankment.
- These closed maintenance holes are to be modified for easy maintenance activities in
line with an image as shown in Figure F.3.6.
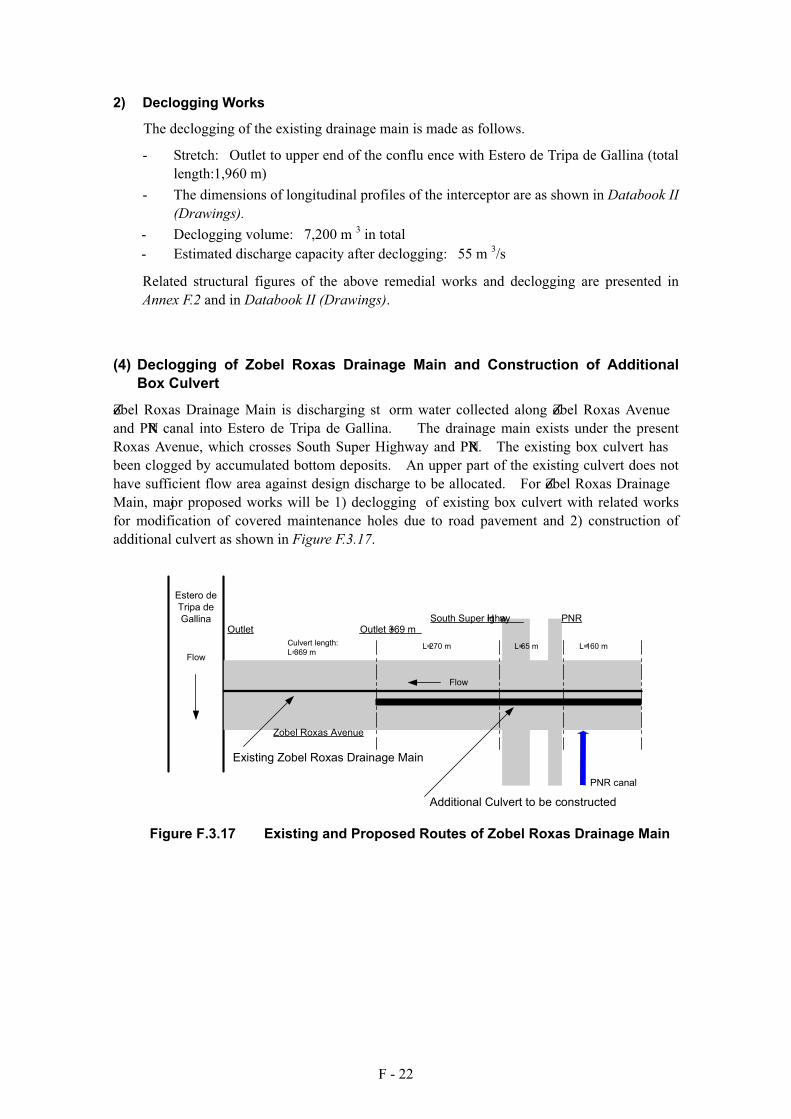
Installation of stop log gate
- The existing box culvert is always submerged due to back water from outlet as shown
in Figure F.3.16, resulting in difficulty of periodical maintenance activities.
Bed elevation: 8.0 m
Ordinary water level: 10.45 m
Road Surface
Water level
Figure F.3.16 Present Condition of Outlet of Buendia Outfall
- For this problem, stop log gates are to be installed at 6 sections for the existing 2
culverts with an image indicated in Figure F.3.7. Those sections are outlet of culvert
at Roxas Boulevard, bending section at Buendia street and inlet of culvert at
confluence with Estero de Tripa de Gallina as shown in Figure F.3.15.
F - 22
2) Declogging Works
The declogging of the existing drainage main is made as follows.
- Stretch: Outlet to upper end of the conflu ence with Estero de Tripa de Gallina (total
length: 1,960 m)
- The dimensions of longitudinal profiles of the interceptor are as shown in Databook II
(Drawings).
- Declogging volume: 7,200 m 3 in total
- Estimated discharge capacity after declogging: 55 m 3/s
Related structural figures of the above remedial works and declogging are presented in
Annex F.2 and in Databook II (Drawings).
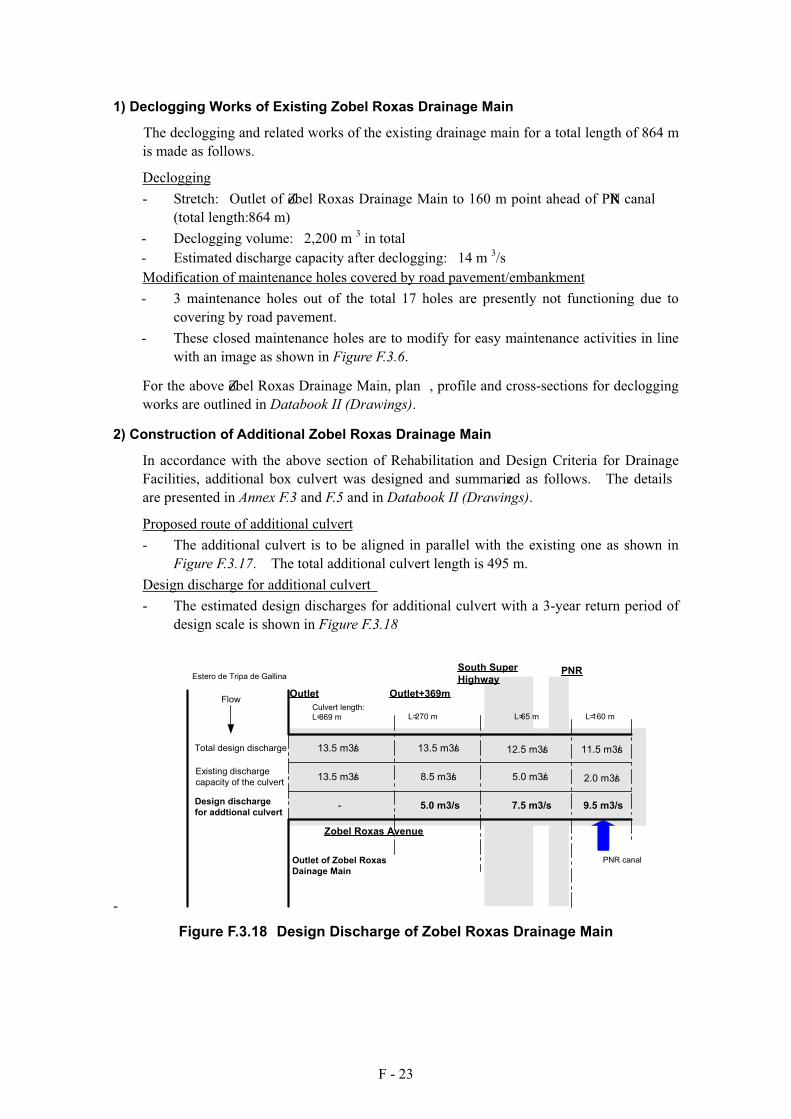
(4) Declogging of Zobel Roxas Drainage Main and Construction of Additional
Box Culvert
Zobel Roxas Drainage Main is discharging st orm water collected along Zobel Roxas Avenue
and PNR canal into Estero de Tripa de Gallina. The drainage main exists under the present
Roxas Avenue, which crosses South Super Highway and PNR. The existing box culvert has
been clogged by accumulated bottom deposits. An upper part of the existing culvert does not
have sufficient flow area against design discharge to be allocated. For Zobel Roxas Drainage
Main, major proposed works will be 1) declogging of existing box culvert with related works
for modification of covered maintenance holes due to road pavement and 2) construction of
additional culvert as shown in Figure F.3.17.
Estero de
Tripa de
Gallina
Existing Zobel Roxas Drainage Main
PNRSouth Super Highway
Zobel Roxas Avenue
PNR canal
Additional Culvert to be constructed
Flow
Culvert length:
L= 369 mL= 270 m L= 160 mL= 65 m
Flow
Outlet +369 mOutlet
Figure F.3.17 Existing and Proposed Routes of Zobel Roxas Drainage Main
F - 23
1) Declogging Works of Existing Zobel Roxas Drainage Main
The declogging and related works of the existing drainage main for a total length of 864 m
is made as follows.
Declogging
- Stretch: Outlet of Zobel Roxas Drainage Main to 160 m point ahead of PNR canal
(total length: 864 m)
- Declogging volume: 2,200 m 3 in total
- Estimated discharge capacity after declogging: 14 m 3/s
Modification of maintenance holes covered by road pavement/embankment
- 3 maintenance holes out of the total 17 holes are presently not functioning due to
covering by road pavement.
- These closed maintenance holes are to modify for easy maintenance activities in line
with an image as shown in Figure F.3.6.
For the above Zobel Roxas Drainage Main, plan , profile and cross-sections for declogging
works are outlined in Databook II (Drawings).
2) Construction of Additional Zobel Roxas Drainage Main
In accordance with the above section of Rehabilitation and Design Criteria for Drainage
Facilities, additional box culvert was designed and summarized as follows. The details
are presented in Annex F.3 and F.5 and in Databook II (Drawings).
Proposed route of additional culvert
- The additional culvert is to be aligned in parallel with the existing one as shown in
Figure F.3.17. The total additional culvert length is 495 m.
Design discharge for additional culvert
- The estimated design discharges for additional culvert with a 3-year return period of
design scale is shown in Figure F.3.18
-
Estero de Tripa de Gallina
PNR canal
PNRSouth Super
Highway
Culvert length:
L= 369 m L= 270 m L= 160 mL= 65 m
Outlet of Zobel Roxas
Dainage Main
Total design discharge
Existing discharge
capacity of the culvert
13.5 m3/s 11.5 m3/s
7.5 m3/s
5.0 m3/s
12.5 m3/s
5.0 m3/s
8.5 m3/s
13.5 m3/s
-
13.5 m3/s
9.5 m3/s
2.0 m3/s
Design discharge
for addtional culvert
Zobel Roxas Avenue
FlowOutlet+369mOutlet
Figure F.3.18 Design Discharge of Zobel Roxas Drainage Main
F - 24
Dimensions of additional culvert
- The proposed additional box culvert consists of concrete box culvert with a total
length of 495 m.
- The additional box culvert is divided into 3 sections or 3 types as indicated in Table
F.3.7 .
Table F.3.7 Dimensions of Additional Box Culvert
Stretch Length Culvert Dimension
Outlet+369 m - South super highway 270 m Width 1.7 m height 1.6 m 2 lanes
South super highway - PNR 65 m W 1.8 m h 1.5 m 2 lanes
PNR - upperend 160 m W 2.3 m h 1.5 m 2 lanes
Maintenance hole
- In order to operate and maintain the box culvert smoothly and effectively,
maintenance holes are installed at an interval of 50 m. The number of maintenance
holes will be 10 places.
For the above additional culvert of Zobel Roxas Drainage Main, plan, profile and
cross-sections are outlined in Annex F.3 and F.5 and in Databook II (Drawings).
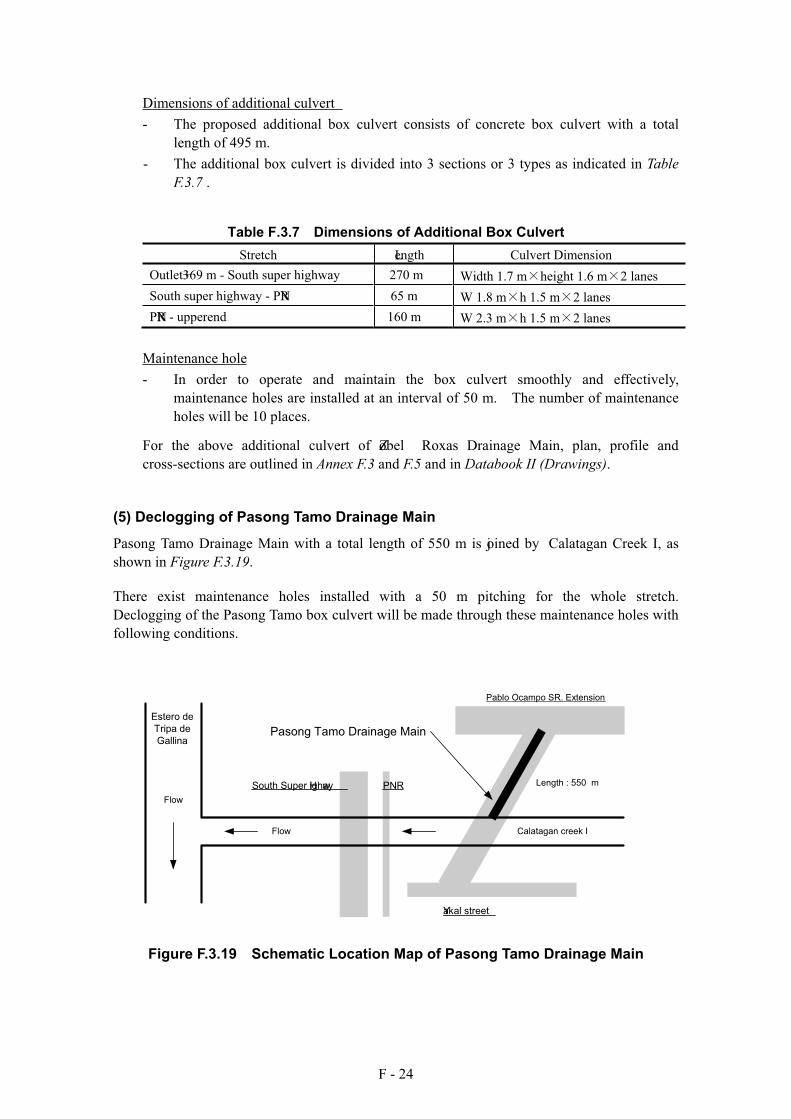
(5) Declogging of Pasong Tamo Drainage Main
Pasong Tamo Drainage Main with a total length of 550 m is joined by Calatagan Creek I, as
shown in Figure F.3.19.
There exist maintenance holes installed with a 50 m pitching for the whole stretch.
Declogging of the Pasong Tamo box culvert will be made through these maintenance holes with
following conditions.
South Super Highway
Estero de
Tripa de
Gallina
Pablo Ocampo SR. Extension
Yakal street
Calatagan creek I
Flow
Pasong Tamo Drainage Main
Length : 550 mPNR
Flow
Figure F.3.19 Schematic Location Map of Pasong Tamo Drainage Main
F - 25
- Stretch: Confluence with Calatagan cr eek I to intersection of Pablo Ocampo SR.
Extension with a total length of 550 m
- The dimensions of longitudinal profiles of the drainage main are as presented in Databook
II (Drawings).
- Declogging volume: 900 m 3 in total
- Estimated discharge capacity after declogging: 12 m 3/s
For the above Pasong Tamo Drainage Main, plan, profile and cross-sections for declogging
works are outlined in Databook II (Drawings).
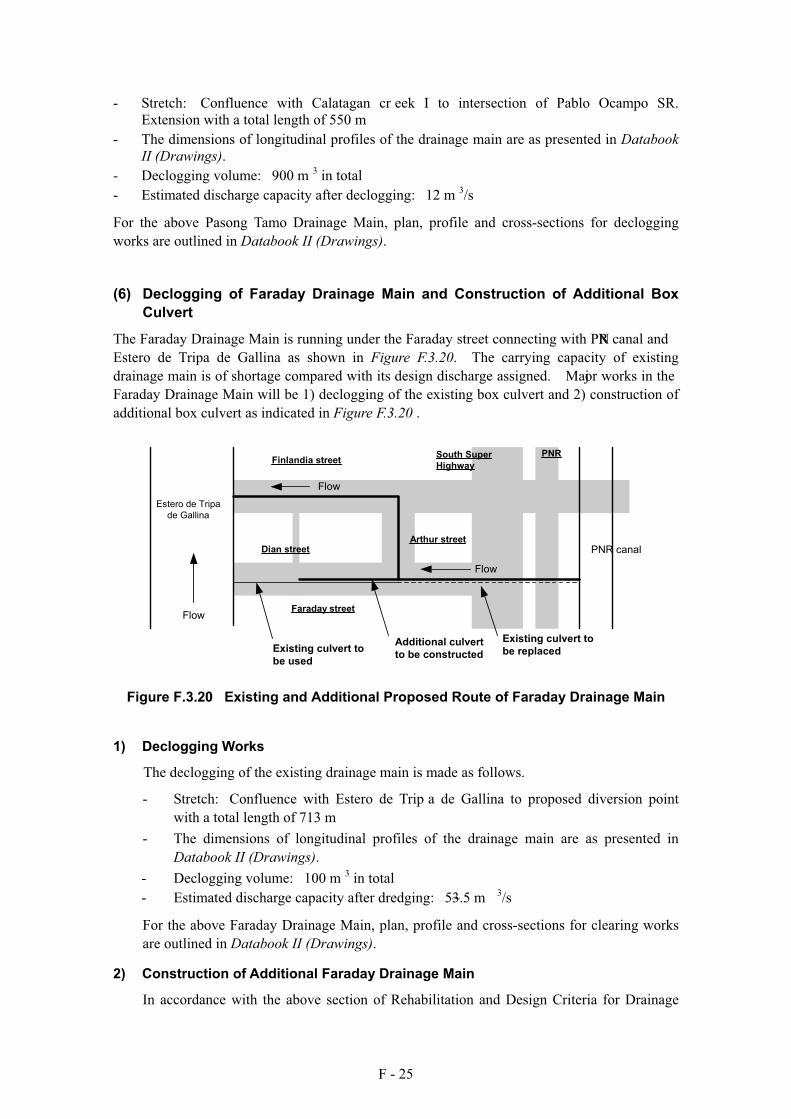
(6) Declogging of Faraday Drainage Main and Construction of Additional Box
Culvert
The Faraday Drainage Main is running under the Faraday street connecting with PNR canal and
Estero de Tripa de Gallina as shown in Figure F.3.20. The carrying capacity of existing
drainage main is of shortage compared with its design discharge assigned. Major works in the
Faraday Drainage Main will be 1) declogging of the existing box culvert and 2) construction of
additional box culvert as indicated in Figure F.3.20 .
Estero de Tripa
de Gallina
South Super
Highway
PNR
PNR canal
Finlandia street
Arthur street
Faraday street
Additional culvert
to be constructedExisting culvert to
be used
Dian street
Flow
Flow
Flow
Existing culvert to
be replaced
Figure F.3.20 Existing and Additional Proposed Route of Faraday Drainage Main
1) Declogging Works
The declogging of the existing drainage main is made as follows.
- Stretch: Confluence with Estero de Trip a de Gallina to proposed diversion point
with a total length of 713 m
- The dimensions of longitudinal profiles of the drainage main are as presented in
Databook II (Drawings).
- Declogging volume: 100 m 3 in total
- Estimated discharge capacity after dredging: 5~3.5 m 3/s
For the above Faraday Drainage Main, plan, profile and cross-sections for clearing works
are outlined in Databook II (Drawings).
2) Construction of Additional Faraday Drainage Main
In accordance with the above section of Rehabilitation and Design Criteria for Drainage
F - 26
Facilities, additional box culvert was designed and summarized as follows. The details
are presented in Annex F.4 and F.5 and in Databook II (Drawings).
Proposed route of additional culvert
- An additional box culvert is basically to be constructed along the existing culvert.
However, in the lower reach, there is no space for construction of additional one.
Accordingly, the additional culvert is also to be constructed under the Finlandia and
Arthur streets as shown in Figure F.3.20.
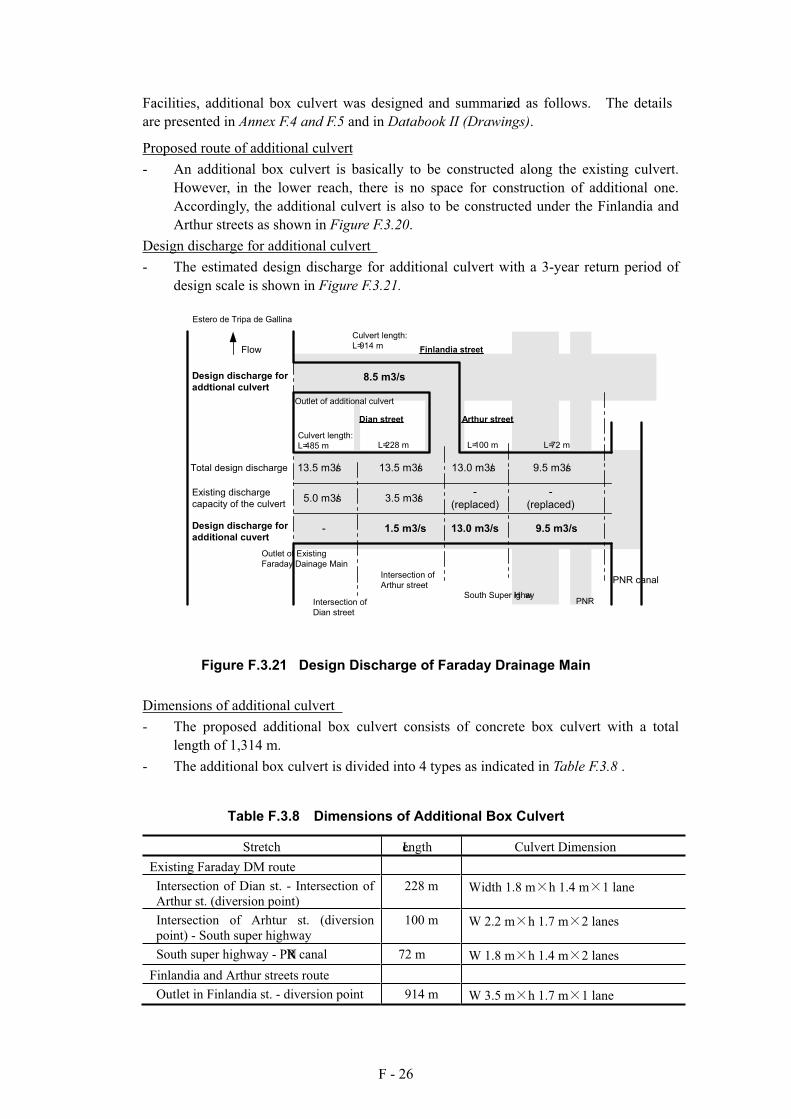
Design discharge for additional culvert
- The estimated design discharge for additional culvert with a 3-year return period of
design scale is shown in Figure F.3.21.
Design discharge for
additional cuvert
Total design discharge
Existing discharge
capacity of the culvert
Outlet of Existing
Faraday Dainage Main
Outlet of additional culvert
Culvert length:
L= 914 m
Culvert length:
L= 485 m L= 100 m L= 72 m
South Super HighwayPNR
Intersection of
Arthur streetPNR canal
Estero de Tripa de Gallina
8.5 m3/s
9.5 m3/s
9.5 m3/s
13.0 m3/s
-
(replaced)
13.0 m3/s
1.5 m3/s
5.0 m3/s
13.5 m3/s
3.5 m3/s
-
13.5 m3/s
Design discharge for
addtional culvert
Intersection of
Dian street
L= 228 m
Flow
-
(replaced)
Finlandia street
Arthur streetDian street
Figure F.3.21 Design Discharge of Faraday Drainage Main
Dimensions of additional culvert
- The proposed additional box culvert consists of concrete box culvert with a total
length of 1,314 m.
- The additional box culvert is divided into 4 types as indicated in Table F.3.8 .
Table F.3.8 Dimensions of Additional Box Culvert
Stretch Length Culvert Dimension
Existing Faraday DM route
Intersection of Dian st. - Intersection of
Arthur st. (diversion point)
228 m Width 1.8 m h 1.4 m 1 lane
Intersection of Arhtur st. (diversion
point) - South super highway
100 m W 2.2 m h 1.7 m 2 lanes
South super highway - PNR canal 72 m W 1.8 m h 1.4 m 2 lanes
Finlandia and Arthur streets route
Outlet in Finlandia st. - diversion point 914 m W 3.5 m h 1.7 m 1 lane
F - 27
Maintenance hole
- In order to operate and maintain the box culvert smoothly and effectively,
maintenance holes are installed at an interval of 50 m. The number of maintenance
holes will be 26 places.
Affected House Buildings
- There are some house buildings that will be affected by the construction of the
additional box culvert. It is possible that the house buildings around the inlet of
Faraday Drainage Main on PNR canal will be required to tentatively relocate during
the construction.
For the above Faraday additional culvert, plan, profile and cross-sections are presented in
Annex F.4 and F.5 and in Databook II (Drawings).
(7) Summary of Quantity for Rehabilitation and Additional Works for Drainage
Facilities in South Manila
The proposed works in north Manila are outlined below and detailed work quantities are
described in Supporting Report G.
Estero de Tripa de Gallina, PNR Canal and Calatagan Creek I
- Dredging (Clearing) of Tripa de Gallina: 28,900 m 3 (for a total length of 1,190 m)
- Dredging (Clearing) of PNR canal: 5,000 m 3 (for a total length of 1,862 m)
- Dredging (Clearing) of Calatagan creek I: 13,200 m 3 (for a total length of 1,686 m)
- Resettlement prior to the dredging works: About 700 families
Buendia Outfall
- Raising/modification of cover of maintenance hole: 22 holes
- Installation of stop log gate: 6 sections
- Declogging: 7,200 m 3 (for a total length of 1,960 m)
Zobel Roxas Drainage Main
- Raising/modification of maintenance hole: 3 holes
- Declogging: 2,200 m 3 (for a total length of 864 m)
- Construction of additional box culvert: 495 m
- Installation of maintenance hole: 10 places
Pasong Tamo Drainage Main
- Declogging: 900 m 3 (for a total length of 550 m)
Faraday Drainage Main
- Declogging: 100 m 3 (for a total length of 713 m)
- Construction of additional box culvert: 1,314 m
- Installation of maintenance hole: 26 places
- Affected buildings by the construction of additional box culvert: Some house buildings
F - 28
F.3.6 FURTHER ISSUES FOR NEXT STAGE OF DETAILED DESIGN
Subsequent works for the priority projects will be a detailed design for rehabilitation and
additional works of drainage facilities and pumping stations. In order to conduct the detailed
design especially for rehabilitation and additional works of drainage channels, a cross-sectional
survey of drainage channels is firstly required. It is necessary to clarify the detail of original
cross-sectional area of drainage channels. An interval of cross-sections to be surveyed will be
minimum 20 m including partial narrow points and sections.
Subsequently, based on the results of surveyed cross-sections and detailed site reconnaissance,
the following considerations will be widely made in the coming detailed design stage.
- Clarification of original boundary line of drainage channels
- Clarification of original boundary of easement as maintenance road, if planned
- Clarification of locations of local narrow points/ sections
In line with the above clarification results, required works will be studied to secure original
cross-sectional area of drainage channels with considering stability of concerned riverbank
structures.
F - 29
F.4 REHABILITATION OF DRAINAGE PUMPING STATIONS
F.4.1 GENERAL
The rehabilitation works consist of 2 categories of repair and replacement of pump equipment
and appurtenants facilities for the 12 pumping stations. Prior to execution of the rehabilitation
works, it is proposed to conduct a careful and thorough technical investigation and analysis
including overhauling at 12 pumping stations. Based on the above investigation and analysis
results, a detailed rehabilitation program is to be prepared. In this stage, detailed rehabilitation
work items are clarified for the 12 drainage pumping stations based on the diagnosis results
conducted in the master plan stage of this study and previous reports on Metro Manila Drainage
System Rehabilitation Project (Phase II), Japan Consulting Institute, Sept. 1999 and Follow-Up
Service Report on Metro Manila Drainage System Rehabilitation Project (Phase II), Japan Plant
Association, Feb. 2002.
F.4.2 REHABILITATION CRITERIA FOR DRAINAGE PUMPING STATIONS
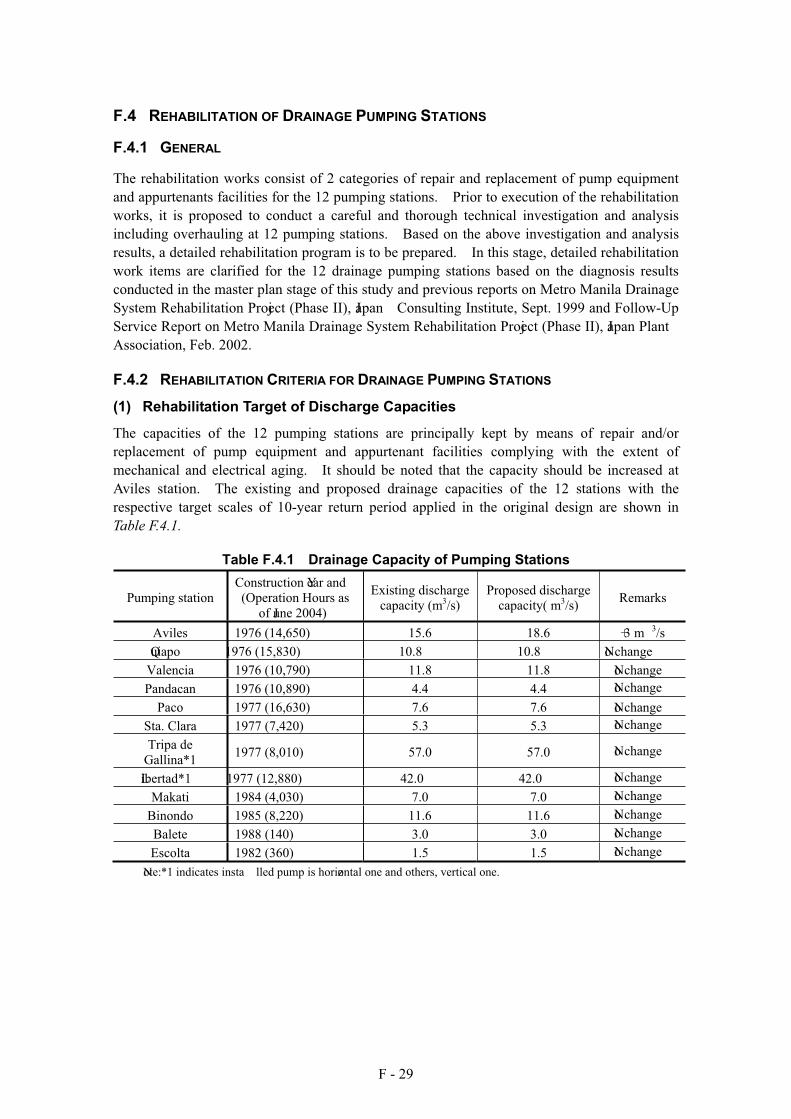
(1) Rehabilitation Target of Discharge Capacities
The capacities of the 12 pumping stations are principally kept by means of repair and/or
replacement of pump equipment and appurtenant facilities complying with the extent of
mechanical and electrical aging. It should be noted that the capacity should be increased at
Aviles station. The existing and proposed drainage capacities of the 12 stations with the
respective target scales of 10-year return period applied in the original design are shown in
Table F.4.1.
Table F.4.1 Drainage Capacity of Pumping Stations
Pumping station
Construction Year and
(Operation Hours as
of June 2004)
Existing discharge
capacity (m3/s)
Proposed discharge
capacity( m3/s)Remarks
Aviles 1976 (14,650) 15.6 18.6 + 3 m 3/s
Quiapo 1976 (15,830) 10.8 10.8 No change
Valencia 1976 (10,790) 11.8 11.8 No change
Pandacan 1976 (10,890) 4.4 4.4 No change
Paco 1977 (16,630) 7.6 7.6 No change
Sta. Clara 1977 (7,420) 5.3 5.3 No change
Tripa de
Gallina*1 1977 (8,010) 57.0 57.0 No change
Libertad*1 1977 (12,880) 42.0 42.0 No change
Makati 1984 (4,030) 7.0 7.0 No change
Binondo 1985 (8,220) 11.6 11.6 No change
Balete 1988 (140) 3.0 3.0 No change
Escolta 1982 (360) 1.5 1.5 No change
Note: *1 indicates insta lled pump is horizontal one and others, vertical one.
F - 30
(2) Basic Lines for Rehabilitation of Drainage Pumping Stations
In rehabilitation works of the drainage pumping stations, the basic lines to be considered are as
follows:
- In the implementation stage, a further careful and thorough technical investigation and
analysis through overhauling at the12 drainage pumping stations is to be conducted for
formulation of a detailed rehabilitation program. The rehabilitation works are to be made
based on the above detailed rehabilitation program consisting of 2 categories of repair and
replacement works.
- In principle, no action is considered to the pump houses and other civil works.
- Detailed work items by the above categories for the 12 stations are to be clarified.
- Based on the diagnosis results conducted in the master plan stage, the categorization of
detailed work items for repair and replacement of pump equipment and appurtenant
facilities is to be made.
- Mean spring high tide level (El. 11.34 m) is applied for design high tide level on Manila
Bay.
- On-going Pasig-Marikina River Improvement Project is assumed to be completed. The
design high water level along the Pasig River determined by the on-going Pasig-Marikina
River Improvement Project is applied.
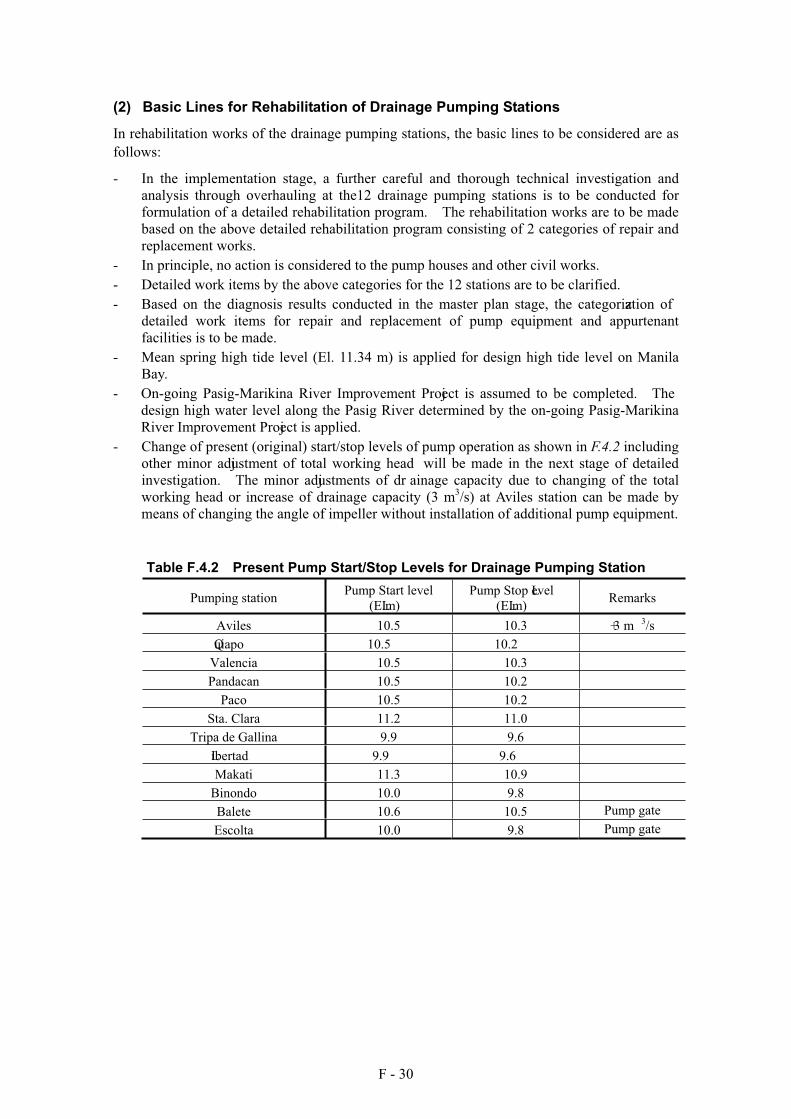
- Change of present (original) start/stop levels of pump operation as shown in F.4.2 including
other minor adjustment of total working head will be made in the next stage of detailed
investigation. The minor adjustments of dr ainage capacity due to changing of the total
working head or increase of drainage capacity (3 m3/s) at Aviles station can be made by
means of changing the angle of impeller without installation of additional pump equipment.
Table F.4.2 Present Pump Start/Stop Levels for Drainage Pumping Station
Pumping station Pump Start level
(EL.m)
Pump Stop Level
(EL.m) Remarks
Aviles 10.5 10.3 + 3 m 3/s
Quiapo 10.5 10.2
Valencia 10.5 10.3
Pandacan 10.5 10.2
Paco 10.5 10.2
Sta. Clara 11.2 11.0
Tripa de Gallina 9.9 9.6
Libertad 9.9 9.6
Makati 11.3 10.9
Binondo 10.0 9.8
Balete 10.6 10.5 Pump gate
Escolta 10.0 9.8 Pump gate
F - 31
- Manual of Rehabilitation of Pump Equipment and Appurtenant Facilities, Ministry of Land,
Infrastructure and Transport (MLIT), Japan will be referred to in the rehabilitation works.
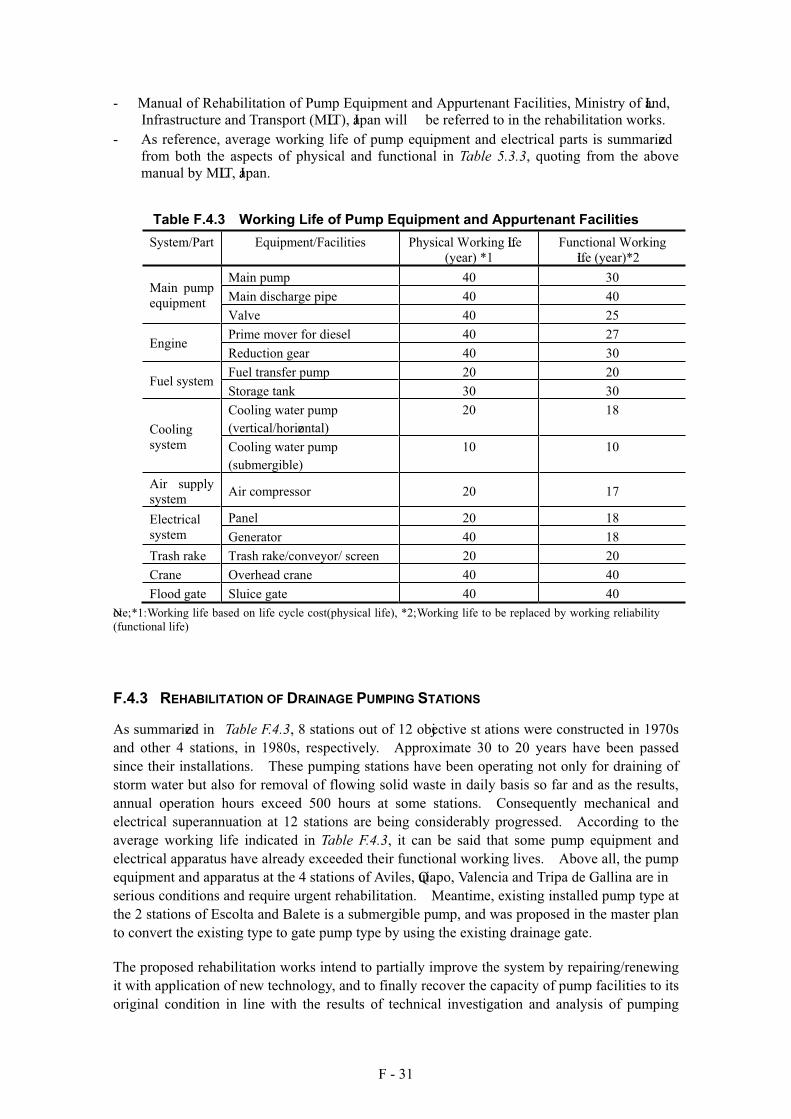
- As reference, average working life of pump equipment and electrical parts is summarized
from both the aspects of physical and functional in Table 5.3.3, quoting from the above
manual by MLIT, Japan.
Table F.4.3 Working Life of Pump Equipment and Appurtenant Facilities
System/Part Equipment/Facilities Physical Working Life
(year) *1
Functional Working
Life (year)*2
Main pump 40 30
Main discharge pipe 40 40 Main pump
equipment Valve 40 25
Prime mover for diesel 40 27 Engine
Reduction gear 40 30
Fuel transfer pump 20 20 Fuel system
Storage tank 30 30
Cooling water pump
(vertical/horizontal)
20 18
Cooling
system Cooling water pump
(submergible)
10 10
Air supply
system Air compressor 20 17
Panel 20 18 Electrical
system Generator 40 18
Trash rake Trash rake/conveyor/ screen 20 20
Crane Overhead crane 40 40
Flood gate Sluice gate 40 40
Note; *1: Working life based on life cycle cost(physical life), *2; Working life to be replaced by working reliability
(functional life)
F.4.3 REHABILITATION OF DRAINAGE PUMPING STATIONS
As summarized in Table F.4.3, 8 stations out of 12 objective st ations were constructed in 1970s
and other 4 stations, in 1980s, respectively. Approximate 30 to 20 years have been passed
since their installations. These pumping stations have been operating not only for draining of
storm water but also for removal of flowing solid waste in daily basis so far and as the results,
annual operation hours exceed 500 hours at some stations. Consequently mechanical and
electrical superannuation at 12 stations are being considerably progressed. According to the
average working life indicated in Table F.4.3, it can be said that some pump equipment and
electrical apparatus have already exceeded their functional working lives. Above all, the pump
equipment and apparatus at the 4 stations of Aviles, Quiapo, Valencia and Tripa de Gallina are in
serious conditions and require urgent rehabilitation. Meantime, existing installed pump type at
the 2 stations of Escolta and Balete is a submergible pump, and was proposed in the master plan
to convert the existing type to gate pump type by using the existing drainage gate.
The proposed rehabilitation works intend to partially improve the system by repairing/renewing
it with application of new technology, and to finally recover the capacity of pump facilities to its
original condition in line with the results of technical investigation and analysis of pumping
F - 32
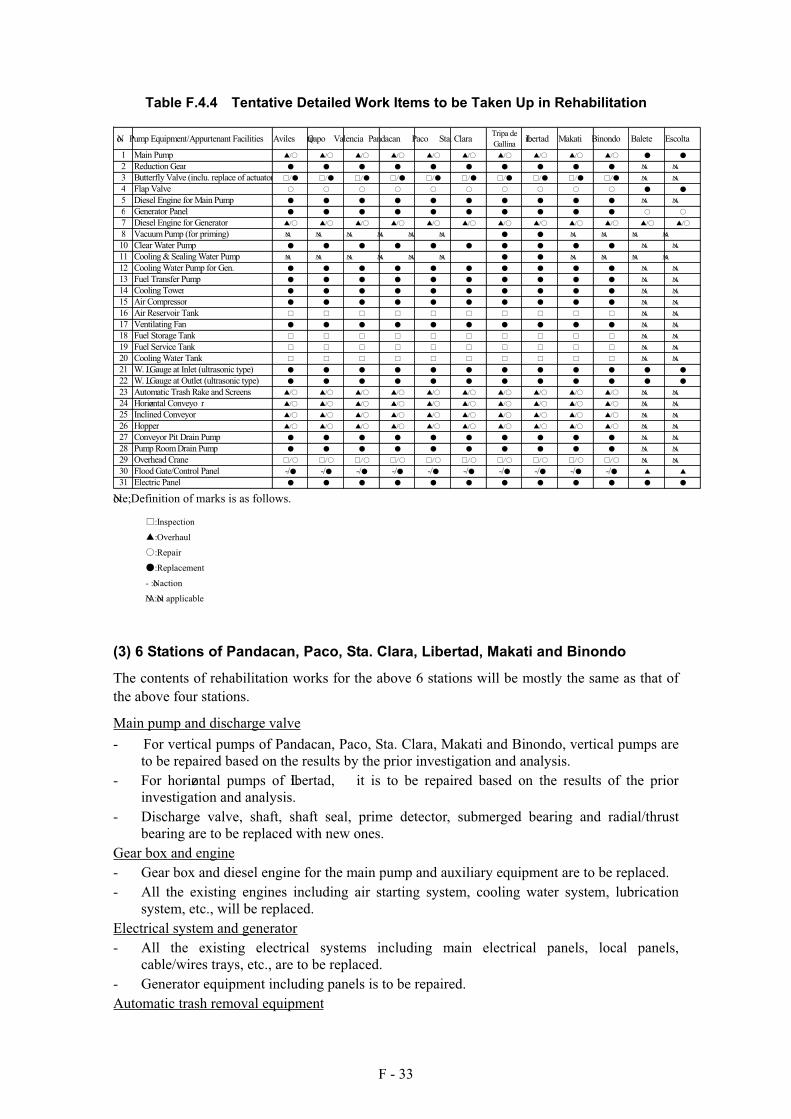
stations scheduled ahead of the actual rehabilitation works. In this section, rehabilitation
works are discussed, by dividing the 12 pumping stations into 3 groups of: 1) 4 stations of very
old and serious conditions, 2) 6 stations of old and marginal service life, and 3) 2 stations with
submergible pumps of outdoor type. The detailed work items taken up in the rehabilitation are
summarized in Table F.4.4 and major work items are discussed below.
(1) Technical Investigation and Analysis of Pumping Station
As already explained, a further careful and thorough technical investigation and analysis
through overhauling at the 12 drainage pumping stations are to be conducted for formulation of
a detailed rehabilitation program in the next implementation stage. Accordingly, the detailed
rehabilitation work items is to be finalized based on the results of the above technical
investigation and analysis.
The rehabilitation works of drainage pumping stations consist of 1) repair and replacement
works of pump equipment and appurtenant facilities, and 2) supply of spare parts and
consumables.
(2) 4 Stations of Aviles, Quiapo, Valencia and Tripa de Gallina
The contents of rehabilitation works for the aged four stations required for urgent rehabilitation
are summarized as follows.
Main pump and discharge valve
- For vertical pumps of Quiapo, Aviles and Valenc ia, vertical pumps including main pipe are
to be repaired based on the results by the prior investigation and analysis.
- For horizontal pumps of Tripa de Gallina, horiz ontal pumps are to be repaired based on the
results by the prior investigation and analysis.
- Discharge valve, shaft, shaft seal, prime detector, submerged bearing and radial/thrust
bearing are to be replaced with new ones.
Gear box and engine
- Gear box and diesel engine for the main pump and auxiliary equipment are to be replaced.
- All the existing engines including air starting system, cooling water system, lubrication
system, etc., are to be replaced.
Electrical system and generator
- All the existing electrical systems including main electrical panels, local panels,
cable/wires trays, etc., are to be replaced.
- Generator equipment including panels is to be repaired.
Automatic trash removal equipment
- Automatic trash rake and screen and horizonta l/inclined conveyor are to be repaired.
Replacement of some minor parts is to be included.
Water level gauging
- The existing water level gauging facilities are to be replaced by new one of ultrasonic type.
Table F.4.4 summarizes rehabilitation work items by each part of the 4 stations.
F - 33
Table F.4.4 Tentative Detailed Work Items to be Taken Up in Rehabilitation
No. Pump Equipment/Appurtenant Facilities Aviles Quiapo Valencia Pandacan Paco Sta. ClaraTripa de
GallinaLibertad Makati Binondo Balete Escolta
1 Main Pump / / / / / / / / / /
2 Reduction Gear N/A N/A
3 Butterfly Valve (inclu. replace of actuator N/A N/A
4 Flap Valve
5 Diesel Engine for Main Pump N/A N/A
6 Generator Panel
7 Diesel Engine for Generator / / / / / / / / / / / /
8 Vacuum Pump (for priming) N/A N/A N/A N/A N/A N/A N/A N/A N/A N/A
10 Clear Water Pump N/A N/A
11 Cooling & Sealing Water Pump N/A N/A N/A N/A N/A N/A N/A N/A N/A N/A
12 Cooling Water Pump for Gen. N/A N/A
13 Fuel Transfer Pump N/A N/A
14 Cooling Tower N/A N/A
15 Air Compressor N/A N/A
16 Air Reservoir Tank N/A N/A
17 Ventilating Fan N/A N/A
18 Fuel Storage Tank N/A N/A
19 Fuel Service Tank N/A N/A
20 Cooling Water Tank N/A N/A
21 W. L. Gauge at Inlet (ultrasonic type)
22 W. L. Gauge at Outlet (ultrasonic type)
23 Automatic Trash Rake and Screens / / / / / / / / / / N/A N/A
24 Horizontal Conveyo r / / / / / / / / / / N/A N/A
25 Inclined Conveyor / / / / / / / / / / N/A N/A
26 Hopper / / / / / / / / / / N/A N/A
27 Conveyor Pit Drain Pump N/A N/A
28 Pump Room Drain Pump N/A N/A
29 Overhead Crane N/A N/A
30 Flood Gate/Control Panel -/ -/ -/ -/ -/ -/ -/ -/ -/ -/
31 Electric Panel
Note; Definition of marks is as follows.
: Inspection
: Overhaul
: Repair
: Replacement
- : No action
N/A: Not applicable
(3) 6 Stations of Pandacan, Paco, Sta. Clara, Libertad, Makati and Binondo
The contents of rehabilitation works for the above 6 stations will be mostly the same as that of
the above four stations.
Main pump and discharge valve
- For vertical pumps of Pandacan, Paco, Sta. Clara, Makati and Binondo, vertical pumps are
to be repaired based on the results by the prior investigation and analysis.
- For horizontal pumps of Libertad, it is to be repaired based on the results of the prior
investigation and analysis.
- Discharge valve, shaft, shaft seal, prime detector, submerged bearing and radial/thrust
bearing are to be replaced with new ones.
Gear box and engine
- Gear box and diesel engine for the main pump and auxiliary equipment are to be replaced.
- All the existing engines including air starting system, cooling water system, lubrication
system, etc., will be replaced.
Electrical system and generator
- All the existing electrical systems including main electrical panels, local panels,
cable/wires trays, etc., are to be replaced.
- Generator equipment including panels is to be repaired.
Automatic trash removal equipment
F - 34
- Automatic trash rake and screen and horizonta l/inclined conveyor are to be repaired.
Replacement of some minor parts is to be included.
Water level gauging
- The existing water level gauging is to be replaced by new one of ultrasonic type.
The rehabilitation work items by each part are summarized in Table F.4.4.
(4) 2 Stations of Escolta and Balete
The contents of rehabilitation works for the above 2 stations are outlined as follows.
Main pump
- The existing submergible pumps at the 2 stations are to be converted into a gate pump type.
- The gate pumps are to be installed in the existing floodgates with due investigation of their
mechanical durability.
Electrical system and generator
- All the existing electrical systems including main electrical panels, local panels,
cable/wires trays, etc., are to be replaced.
- Generator equipment including panels is to be repaired.
Automatic trash removal equipment
- A small type automatic trash rake and screen and horizontal/inclined conveyor are to be
additionally installed, if necessary, based on the technical investigation and analysis in due
time.
Water level gauging
- The existing water level gauging facilities are to be replaced by a new one of ultrasonic
type.
The rehabilitation work items by each part are summarized in Table F.4.4.
(5) Other Countermeasures for Environmental Preservation and O/M Activities of
Drainage Pumping Stations
At present, solid waste flowing in the drainage channels are mostly collecting at automatic trash
rakes installed at pumping stations and accumulated in the stock yard for several days, then
transported into disposal sites. Meantime, engine exhausts fume and noise are generating
during pump operation. To improve such negative environmental impacts and to operate pump
and auxiliary equipment properly, the following countermeasures are proposed through the
rehabilitation works.
- A detailed management of accumulated bottom deposits will be considered in combination
with the proposed solid waste management, and improvement of O/M organization and
activities for the drainage channels and pumping stations.
- Amount of engine exhaust fume and noise to be generated by pump operation will be
mitigated within the allowable levels in Metropolitan Manila by using modern technology.
- In line with the above improvement of operation and maintenance organization and
activities for drainage system, an effective and appropriate management system will be
taken into the daily operation and maintenance for the 15 drainage pumping stations.
(6) Summary of Quantity for Rehabilitation Works of Drainage Pumping Stations
Work categories and quantities of drainage pumping stations for rehabilitation works are
summarized as follows.
- Technical investigation and analysis including overhaul: 12 stations
- Supply of spare part and consumable: 12 stations
- Rehabilitation works of pump equipment and appurtenant facilities: 12 stations
F - 35
F.5 NON-STRUCTURAL AND SUPPORTING MEASURES
Objectives of the non-structural and supporting measures are to support and sustain the original
functions of structural measures assigned in the rehabilitated drainage facilities by means of
reducing damageable objects or lowering vulnerab ility against repeating disasters. In this
study, the following measures are taken up.
Non-Structural Measures
- Recommendation of countermeasures for rapid urbanization
- Recommendation of application of existing floodplain management systems
Supporting Measures
- Establishment of community-involved operation and maintenance
- Installation of additional hydrological equipment
- Introduction of emergency operation and maintenance equipment
- Preparation of guideline for resettlement
Out of the above, 1) Recommendation of countermeasures for rapid urbanization, 2)
Recommendation of application of existing floodplain management system and 3) Installation
of additional hydrological equipment in connection with improvement of O/M activities are
described.
(1) Recommendation of Countermeasures for Rapid Urbanization
Urbanization has been highly progressing in the core area of Metropolitan Manila and thereby
open and green spaces, ponds, forest, etc., are decreasing year by year. Consequently, both the
capacities of storm water retention and infiltration into underground are lowered. Eventually,
run-off volumes towards drainage channels are significantly increased especially in the case of
unexpected urbanization.
The extent of increase of runoff coefficient by land use conditions in the past 35 years was
studied in the master plan stage. It reveals that 15 to 20% by drainage basins increased in the
period from 1970s to 2004 in North Manila and 10 to 23% in South Manila, respectively as
summarized in Table F.5.1.
For such situation, only improvement of drainage facilities can not be coped with remarkable
increase of runoff coefficient resulting in frequent inundations. An implementation of special
countermeasures is required to compulsively reduce runoff volumes and to sustain
capability/function of the present drainage system. As one of options, construction of storm
water retention facilities is recommended in combination with urban development plans under
the related LGUs. The following samples are appli cable ones in the core area of Metropolitan
Manila, which is from The Guideline of Urban Drainage Improvement, MLIT, Japan.
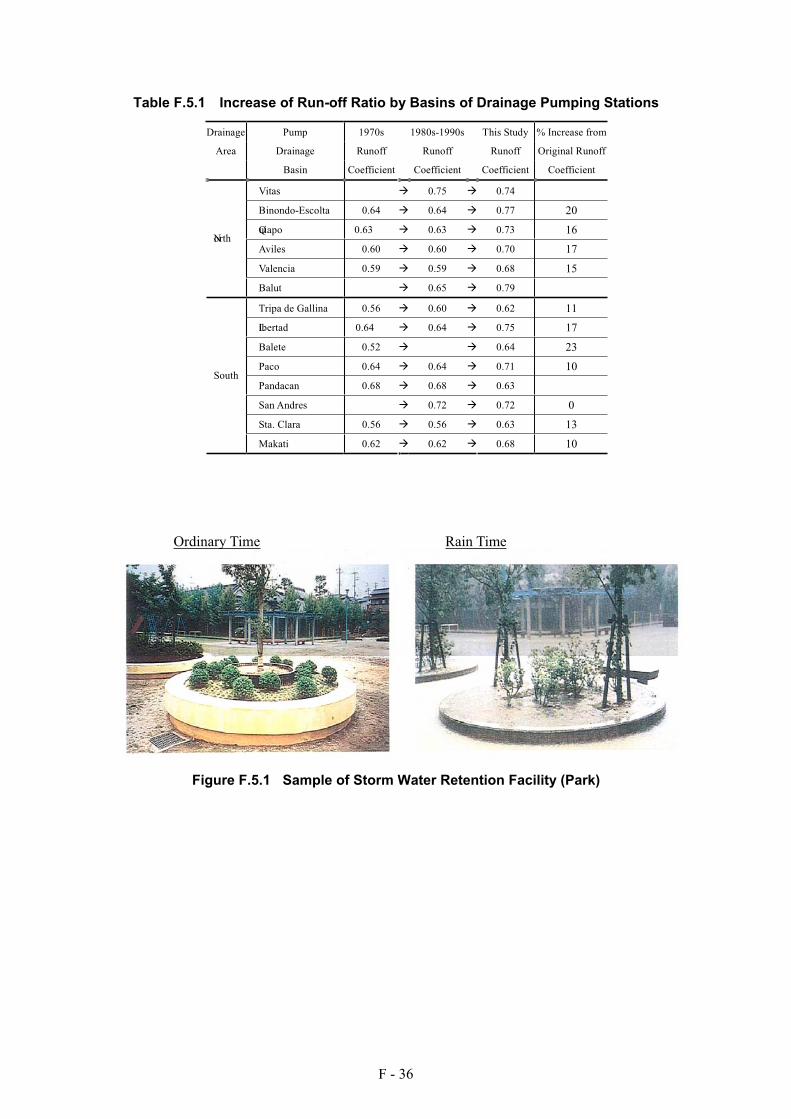
F - 36
Table F.5.1 Increase of Run-off Ratio by Basins of Drainage Pumping Stations
Ordinary Time Rain Time
Figure F.5.1 Sample of Storm Water Retention Facility (Park)
Drainage Pump 1970s 1980s-1990s This Study % Increase from
Area Drainage Runoff Runoff Runoff Original Runoff
Basin Coefficient Coefficient Coefficient Coefficient
Vitas 0.75 0.74
Binondo-Escolta 0.64 0.64 0.77 20
Quiapo 0.63 0.63 0.73 16
Aviles 0.60 0.60 0.70 17
Valencia 0.59 0.59 0.68 15
North
Balut 0.65 0.79
Tripa de Gallina 0.56 0.60 0.62 11
Libertad 0.64 0.64 0.75 17
Balete 0.52 0.64 23
Paco 0.64 0.64 0.71 10
Pandacan 0.68 0.68 0.63
San Andres 0.72 0.72 0
Sta. Clara 0.56 0.56 0.63 13
South
Makati 0.62 0.62 0.68 10
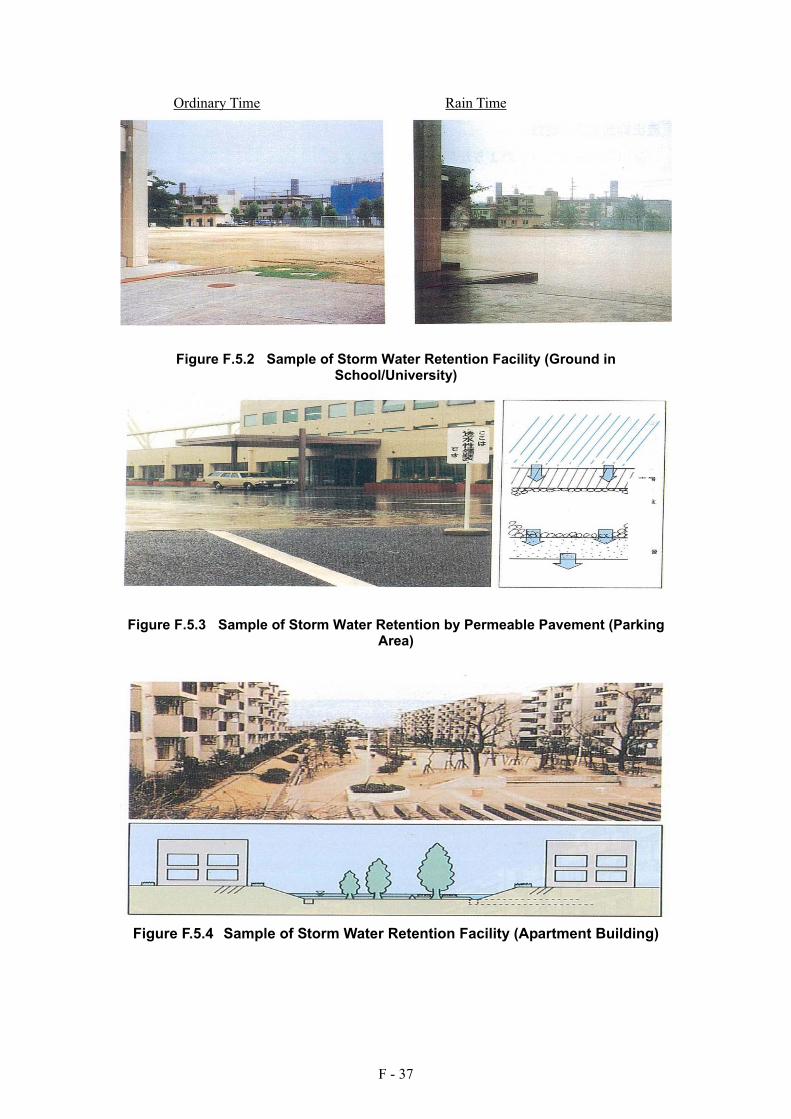
F - 37
Ordinary Time Rain Time
Figure F.5.2 Sample of Storm Water Retention Facility (Ground in School/University)
Figure F.5.3 Sample of Storm Water Retention by Permeable Pavement (Parking Area)
Figure F.5.4 Sample of Storm Water Retention Facility (Apartment Building)
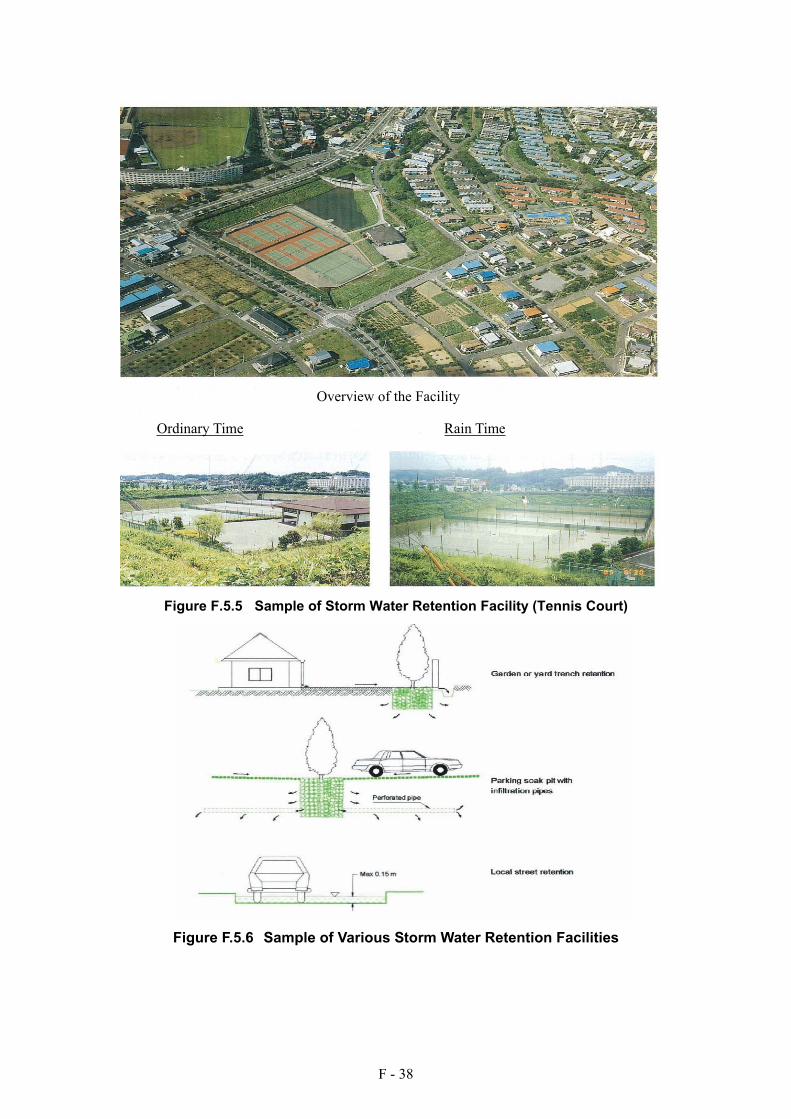
F - 38
Figure F.5.5 Sample of Storm Water Retention Facility (Tennis Court)
Figure F.5.6 Sample of Various Storm Water Retention Facilities
Overview of the Facility
Ordinary Time Rain Time
F - 39
(2) Application of Existing Various Disaster Preparedness Systems
In the Metropolitan Manila, existing systems of EFCOS, Inter-Agencies Floodplain
Management, Disaster Management System, etc., are available for emergency countermeasures
for disasters preparedness. Especially in the disaster management system, it is being
developing by a disaster coordination committee consisting of national and regional levels
including barangay level and a special fund allotment is available for emergency times.
The core area of Metropolitan Manila is a center of the capital of the Philippines. In a case of
severe inundation, a tremendous loss of casualty, properties, and stagnation of social and
economic activities resulting from traffic interruption will be brought about into the core area.
To prevent such emergency cases, it is recommended to put in practice positively the above
various existing systems in the core area of Metropolitan Manila.
(3) Installation of additional hydrological equipment
1) Observatory Network
Within the core area of Metropolitan Manila, available data on rainfall and water level is quite
limited to conducting hydrological analysis. Only one station of Port Area is available for
rainfall data, while water level data recorded are available at respective 15 drainage pumping
stations. However, there exists no water level data in the major esteros. It is considerably
important to observe and accumulate such rainfall and water level data for hydrological and
hydraulic analysis such as rainfall patterns, total amounts, intensities, flow conditions of
channels, etc., in view of further future procedure for drainage improvement in the core area of
Metropolitan Manila. In order to supplement such limited data, rainfall stations and water
level gauges are to be newly installed, and those proposed sites are considered in the following.
Such accumulated rainfall and water level data shall highly contribute to the necessary
procedure for future drainage improvement including effective operation of the present drainage
channels and drainage pumping stations.
From this aspect, additional rainfall observation stations are to be proposed at appropriate
locations. Taking into consideration of aerial distribution of rainfall in the core area, the 3
stations are proposed at the respective drainage pumping stations of Vitas, Paco and Libertad as
shown in Figure F.5.7. The rainfall observatory equipment will be an automatic rain gauge.
On the other hand, at 15 drainage pumping stations, water levels are recorded at 2 sides; inlet
and outlet of the stations. However, no water level data is presently available in the esteros in
the core area of Metropolitan Manila. In order to supplement water level data in the esteros,
installation of staff gauge is proposed. The proposed sites of staff gauge will be 15 sites in the
major esteros joining to the drainage pumping stations as shown in Figure F.5.7.
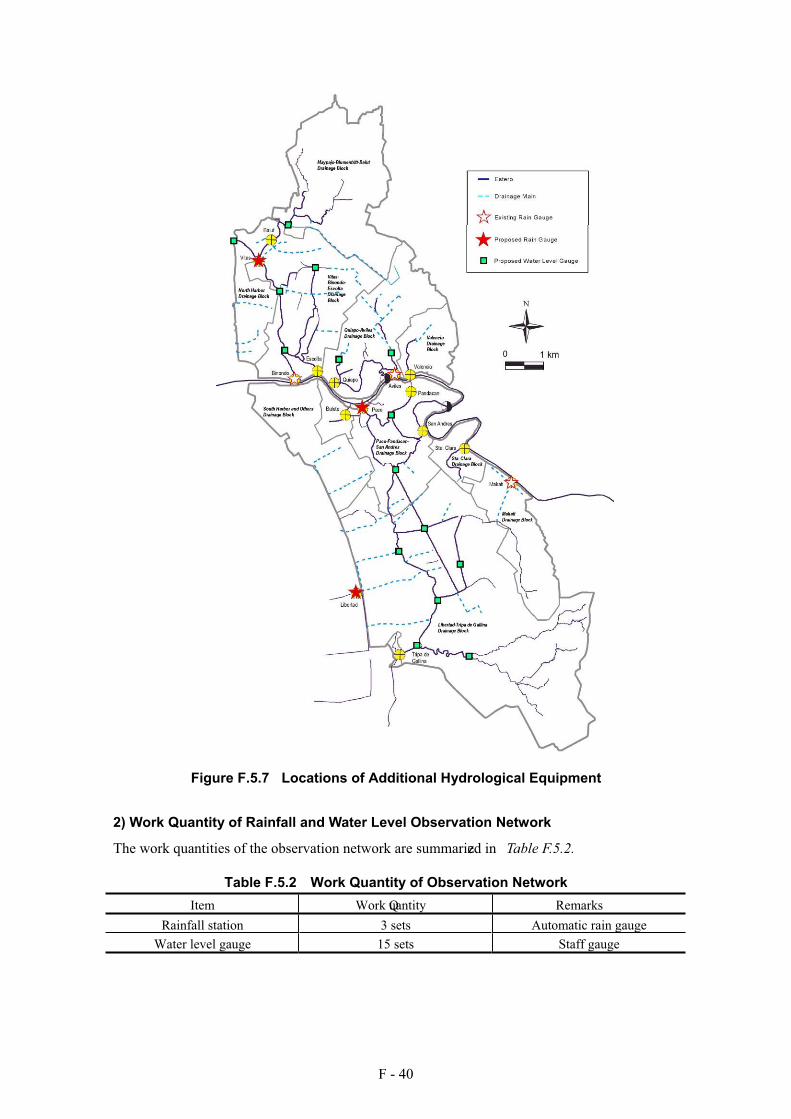
F - 40
Figure F.5.7 Locations of Additional Hydrological Equipment
2) Work Quantity of Rainfall and Water Level Observation Network
The work quantities of the observation network are summarized in Table F.5.2.
Table F.5.2 Work Quantity of Observation Network
Item Work Quantity Remarks
Rainfall station 3 sets Automatic rain gauge
Water level gauge 15 sets Staff gauge
ANNEX F.1
BLUMENTRITT INTERCEPTOR
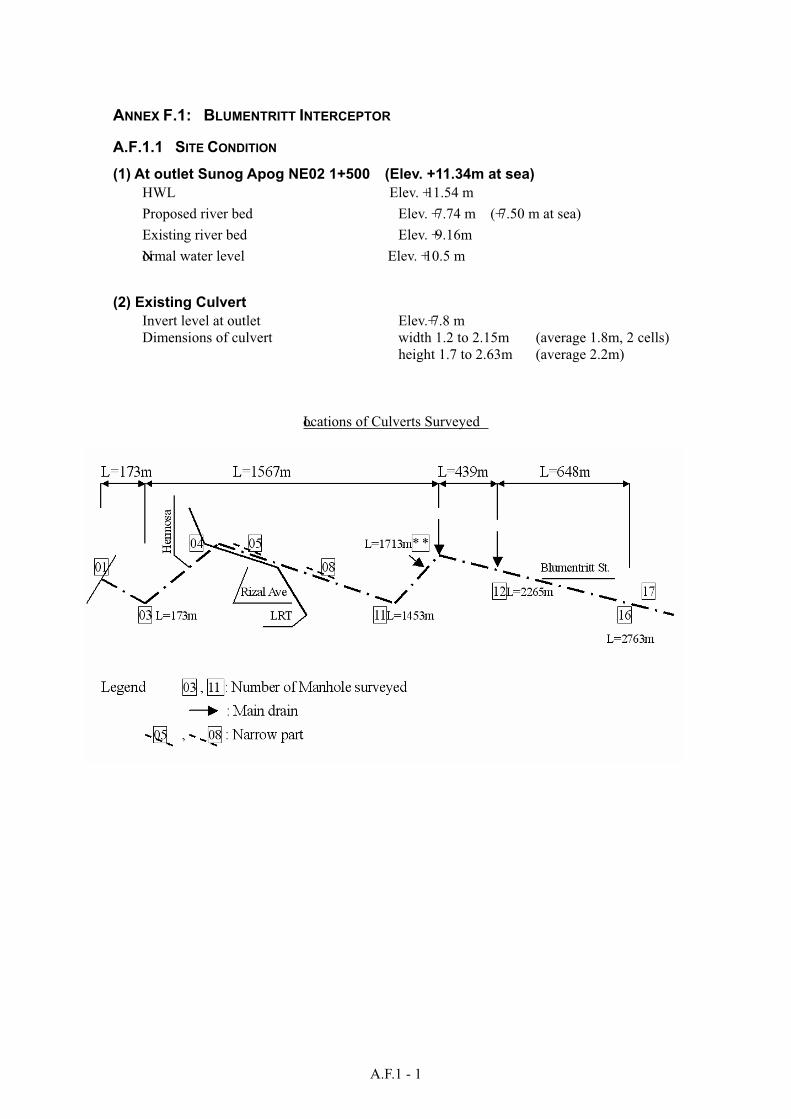
A.F.1 - 1
ANNEX F.1: BLUMENTRITT INTERCEPTOR
A.F.1.1 SITE CONDITION
(1) At outlet Sunog Apog NE02 1+500 (Elev. +11.34m at sea)
HWL Elev. + 11.54 m
Proposed river bed Elev. + 7.74 m (+ 7.50 m at sea)
Existing river bed Elev. + 9.16m
Normal water level Elev. + 10.5 m
(2) Existing Culvert
Invert level at outlet Elev.+ 7.8 m
Dimensions of culvert width 1.2 to 2.15m (average 1.8m, 2 cells)
height 1.7 to 2.63m (average 2.2m)
Locations of Culverts Surveyed
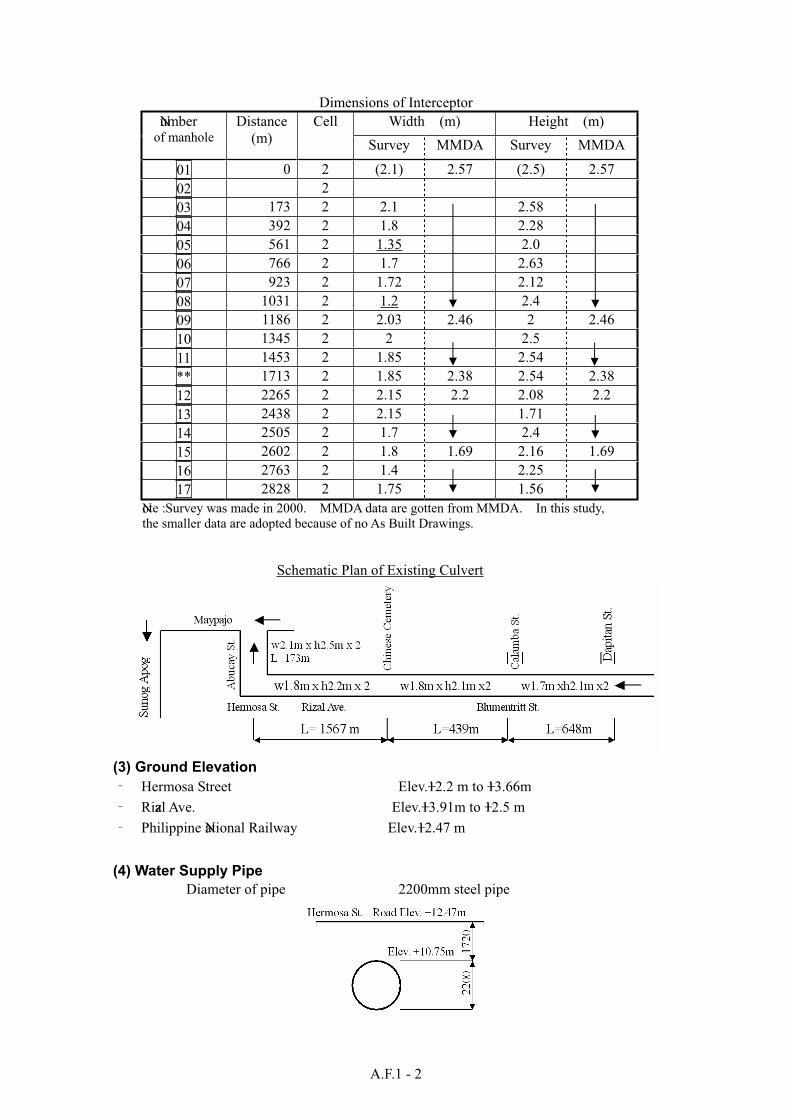
A.F.1 - 2
Dimensions of Interceptor
Width (m) Height (m) Number of manhole
Distance
(m)
Cell
Survey MMDA Survey MMDA
01 0 2 (2.1) 2.57 (2.5) 2.57
02 2
03 173 2 2.1 2.58
04 392 2 1.8 2.28
05 561 2 1.35 2.0
06 766 2 1.7 2.63
07 923 2 1.72 2.12
08 1031 2 1.2 2.4
09 1186 2 2.03 2.46 2 2.46
10 1345 2 2 2.5
11 1453 2 1.85 2.54
** 1713 2 1.85 2.38 2.54 2.38
12 2265 2 2.15 2.2 2.08 2.2
13 2438 2 2.15 1.71
14 2505 2 1.7 2.4
15 2602 2 1.8 1.69 2.16 1.69
16 2763 2 1.4 2.25
17 2828 2 1.75 1.56
Note : Survey was made in 2000. MMDA data are gotten from MMDA. In this study,
the smaller data are adopted because of no As Built Drawings.
Schematic Plan of Existing Culvert
(3) Ground Elevation
Hermosa Street Elev.+12.2 m to +13.66m
Rizal Ave. Elev.+13.91m to +12.5 m
Philippine National Railway Elev.+12.47 m
(4) Water Supply Pipe
Diameter of pipe 2200mm steel pipe
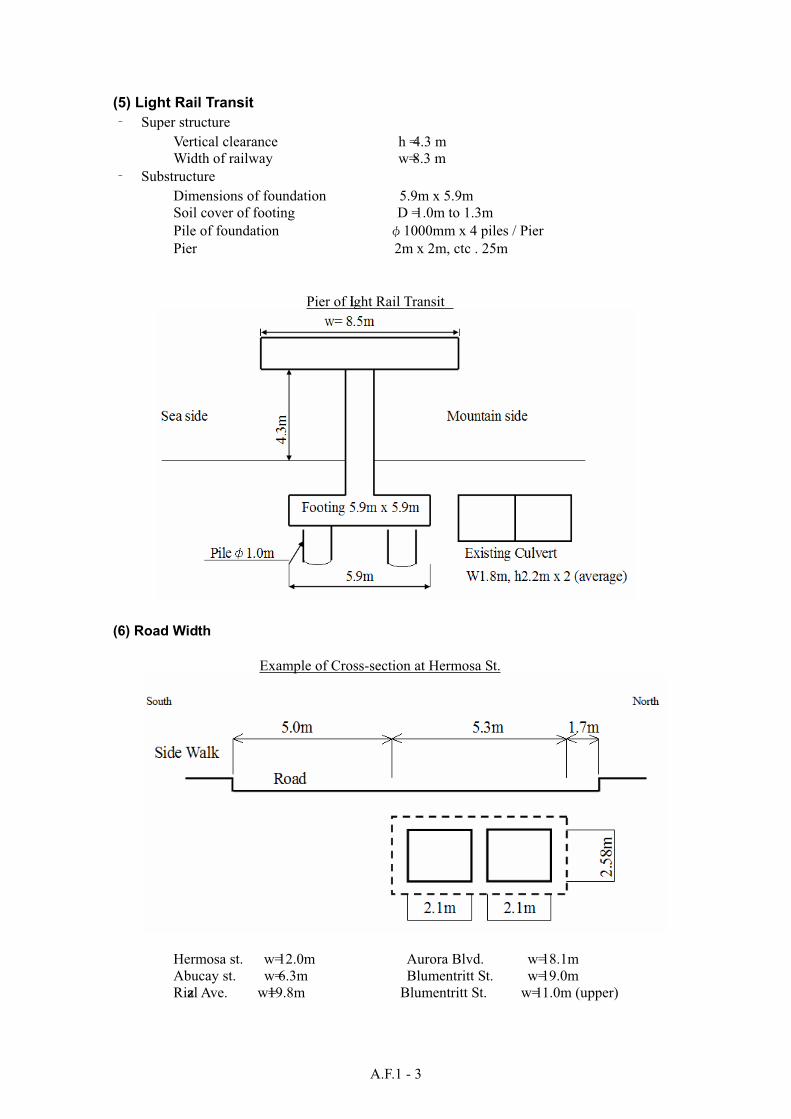
A.F.1 - 3
(5) Light Rail Transit
Super structure
Vertical clearance h = 4.3 m
Width of railway w= 8.3 m
Substructure
Dimensions of foundation 5.9m x 5.9m
Soil cover of footing D = 1.0m to 1.3m
Pile of foundation 1000mm x 4 piles / Pier
Pier 2m x 2m, ctc . 25m
Pier of Light Rail Transit
(6) Road Width
Example of Cross-section at Hermosa St.
Hermosa st. w= 12.0m Aurora Blvd. w= 18.1m
Abucay st. w= 6.3m Blumentritt St. w= 19.0m
Rizal Ave. w=19.8m Blumentritt St. w= 11.0m (upper)
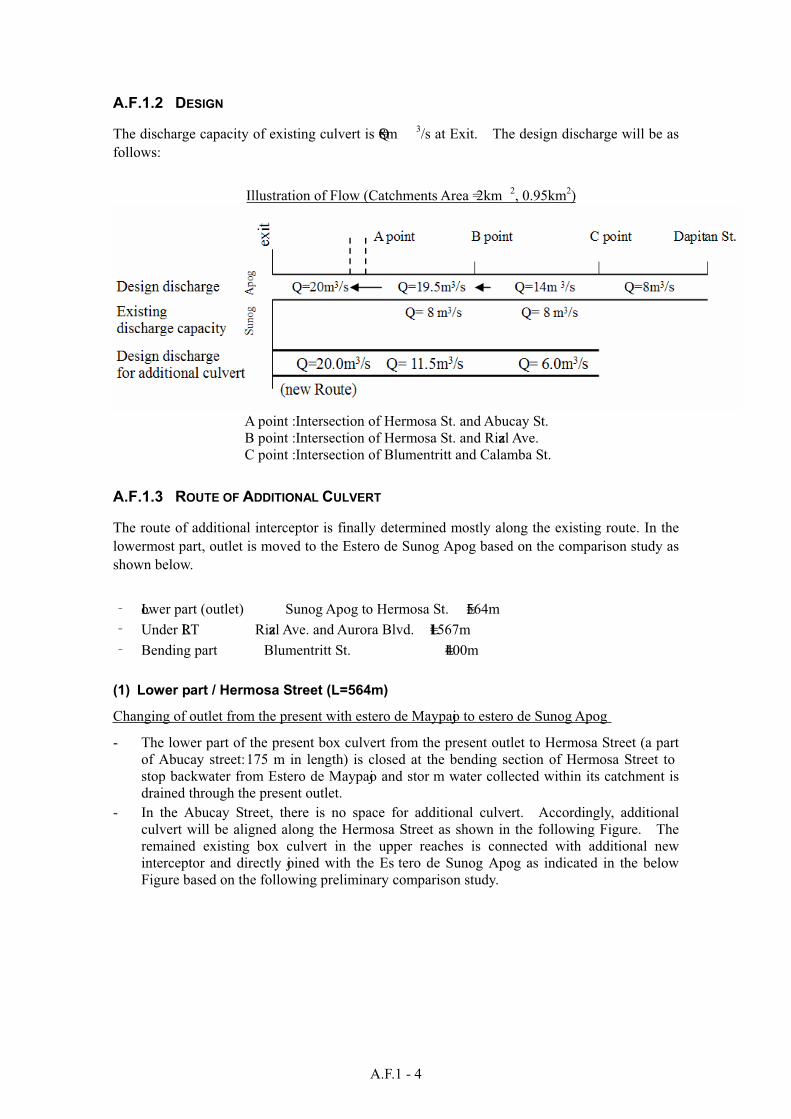
A.F.1 - 4
A.F.1.2 DESIGN
The discharge capacity of existing culvert is Q=8m 3/s at Exit. The design discharge will be as
follows:
Illustration of Flow (Catchments Area = 2km 2, 0.95km2)
A point : Intersection of Hermosa St. and Abucay St.
B point : Intersection of Hermosa St. and Rizal Ave.
C point : Intersection of Blumentritt and Calamba St.
A.F.1.3 ROUTE OF ADDITIONAL CULVERT
The route of additional interceptor is finally determined mostly along the existing route. In the
lowermost part, outlet is moved to the Estero de Sunog Apog based on the comparison study as
shown below.
Lower part (outlet) Sunog Apog to Hermosa St. L=564m
Under LRT Rizal Ave. and Aurora Blvd. L=1567m
Bending part Blumentritt St. L=400m
(1) Lower part / Hermosa Street (L=564m)
Changing of outlet from the present with estero de Maypajo to estero de Sunog Apog
- The lower part of the present box culvert from the present outlet to Hermosa Street (a part
of Abucay street: 175 m in length) is closed at the bending section of Hermosa Street to
stop backwater from Estero de Maypajo and stor m water collected within its catchment is
drained through the present outlet.
- In the Abucay Street, there is no space for additional culvert. Accordingly, additional
culvert will be aligned along the Hermosa Street as shown in the following Figure. The
remained existing box culvert in the upper reaches is connected with additional new
interceptor and directly joined with the Es tero de Sunog Apog as indicated in the below
Figure based on the following preliminary comparison study.
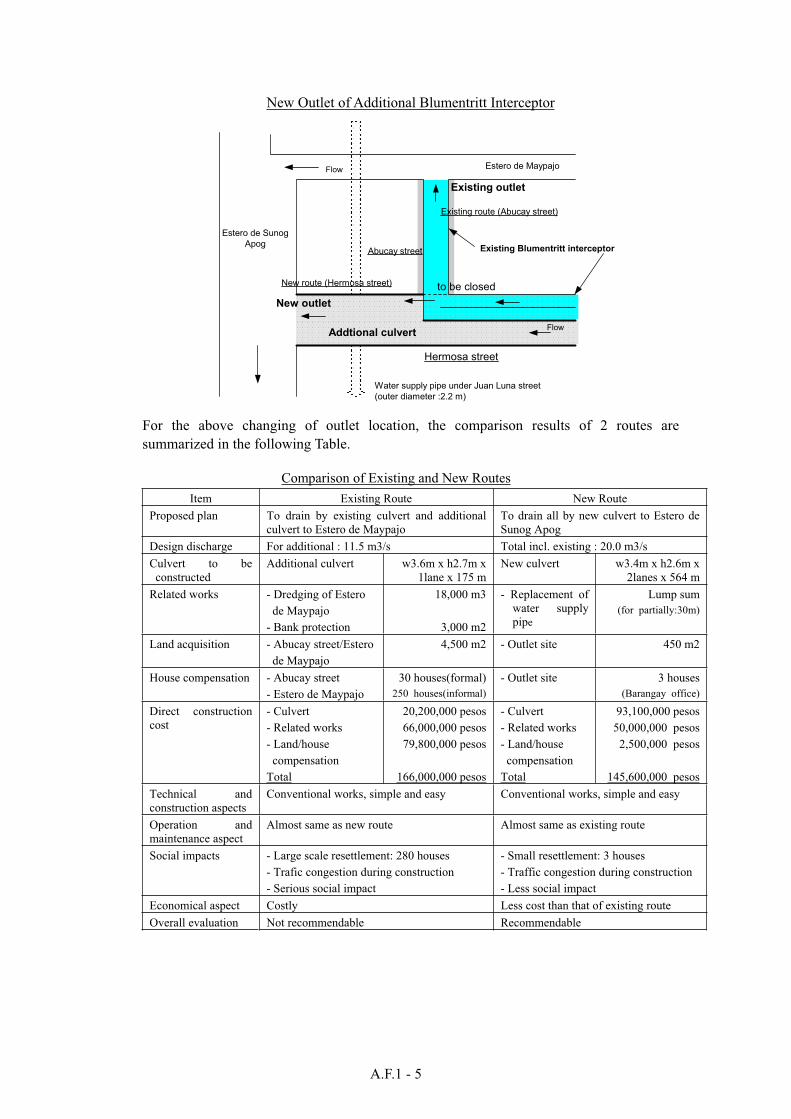
A.F.1 - 5
New Outlet of Additional Blumentritt Interceptor
Existing Blumentritt interceptor
Estero de Maypajo
Estero de Sunog
Apog
Addtional culvert
to be closed
Existing outlet
New outlet
Hermosa street
Flow
Flow
Water supply pipe under Juan Luna street
(outer diameter :2.2 m)
Abucay street
Existing route (Abucay street)
New route (Hermosa street)
For the above changing of outlet location, the comparison results of 2 routes are
summarized in the following Table.
Comparison of Existing and New Routes
Item Existing Route New Route
Proposed plan To drain by existing culvert and additional
culvert to Estero de Maypajo
To drain all by new culvert to Estero de
Sunog Apog
Design discharge For additional : 11.5 m3/s Total incl. existing : 20.0 m3/s
Culvert to be
constructed
Additional culvert w3.6m x h2.7m x
1lane x 175 m
New culvert w3.4m x h2.6m x
2lanes x 564 m
Related works - Dredging of Estero
de Maypajo
- Bank protection
18,000 m3
3,000 m2
- Replacement of
water supply
pipe
Lump sum
(for partially:30m)
Land acquisition - Abucay street/Estero
de Maypajo
4,500 m2 - Outlet site 450 m2
House compensation - Abucay street
- Estero de Maypajo
30 houses(formal)
250 houses(informal)
- Outlet site 3 houses
(Barangay office)
Direct construction
cost
- Culvert
- Related works
- Land/house
compensation
Total
20,200,000 pesos
66,000,000 pesos
79,800,000 pesos
166,000,000 pesos
- Culvert
- Related works
- Land/house
compensation
Total
93,100,000 pesos
50,000,000 pesos
2,500,000 pesos
145,600,000 pesos
Technical and
construction aspects
Conventional works, simple and easy Conventional works, simple and easy
Operation and
maintenance aspect
Almost same as new route Almost same as existing route
Social impacts - Large scale resettlement: 280 houses
- Trafic congestion during construction
- Serious social impact
- Small resettlement: 3 houses
- Traffic congestion during construction
- Less social impact
Economical aspect Costly Less cost than that of existing route
Overall evaluation Not recommendable Recommendable
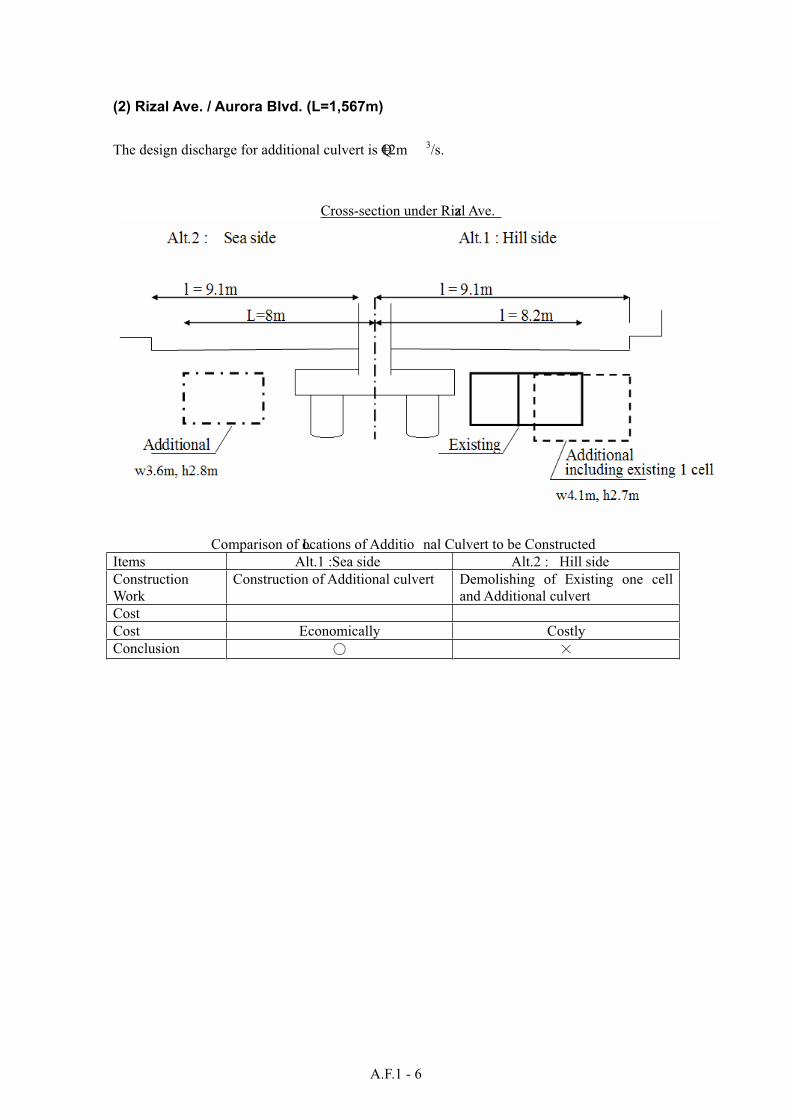
A.F.1 - 6
(2) Rizal Ave. / Aurora Blvd. (L=1,567m)
The design discharge for additional culvert is Q=12m 3/s.
Cross-section under Rizal Ave.
Comparison of Locations of Additio nal Culvert to be Constructed
Items Alt.1 : Sea side Alt.2 : Hill side
Construction
Work
Construction of Additional culvert Demolishing of Existing one cell
and Additional culvert
Cost
Cost Economically Costly
Conclusion
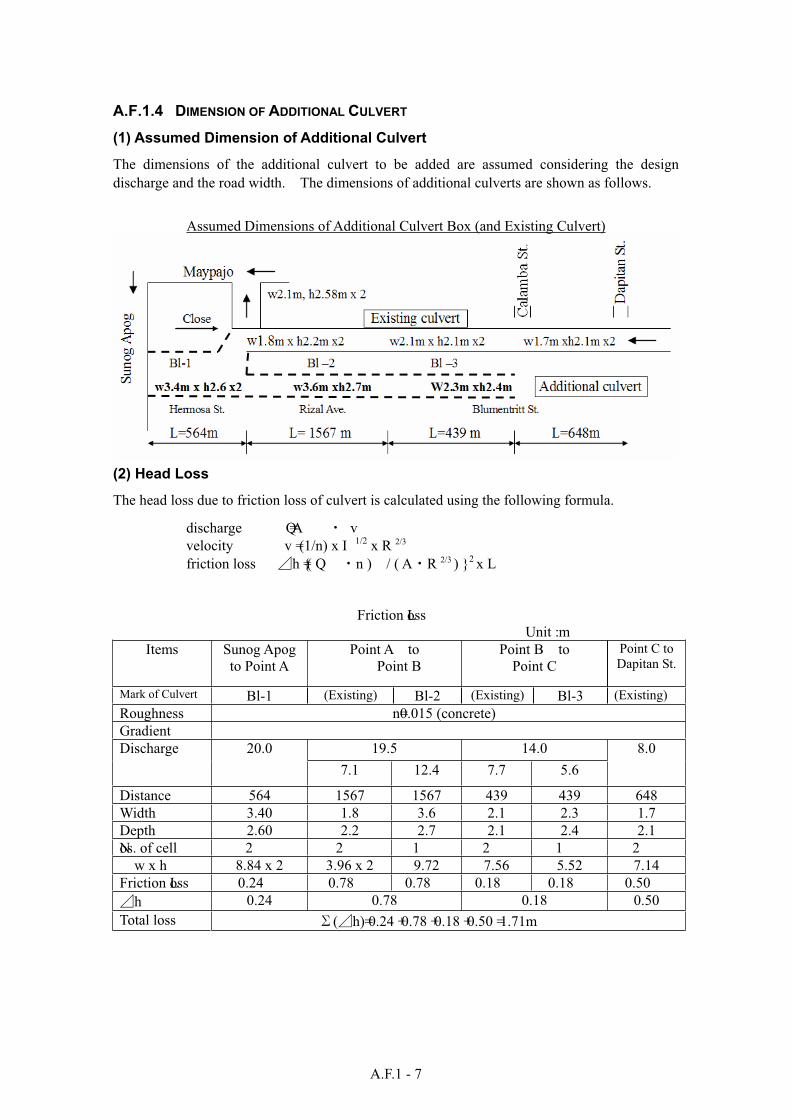
A.F.1 - 7
A.F.1.4 DIMENSION OF ADDITIONAL CULVERT
(1) Assumed Dimension of Additional Culvert
The dimensions of the additional culvert to be added are assumed considering the design
discharge and the road width. The dimensions of additional culverts are shown as follows.
Assumed Dimensions of Additional Culvert Box (and Existing Culvert)
(2) Head Loss
The head loss due to friction loss of culvert is calculated using the following formula.
discharge Q = A v
velocity v = (1/n) x I 1/2 x R 2/3
friction loss h ={ ( Q n ) / ( A R 2/3 ) }2 x L
Friction Loss
Unit : m
Items Sunog Apog
to Point A
Point A to
Point B
Point B to
Point C
Point C to
Dapitan St.
Mark of Culvert Bl-1 (Existing) Bl-2 (Existing) Bl-3 (Existing)
Roughness n=0.015 (concrete)
Gradient
19.5 14.0 Discharge 20.0
7.1 12.4 7.7 5.6
8.0
Distance 564 1567 1567 439 439 648
Width 3.40 1.8 3.6 2.1 2.3 1.7
Depth 2.60 2.2 2.7 2.1 2.4 2.1
Nos. of cell 2 2 1 2 1 2
w x h 8.84 x 2 3.96 x 2 9.72 7.56 5.52 7.14
Friction Loss 0.24 0.78 0.78 0.18 0.18 0.50
h 0.24 0.78 0.18 0.50
Total loss ( h)= 0.24 + 0.78 + 0.18 + 0.50 = 1.71m
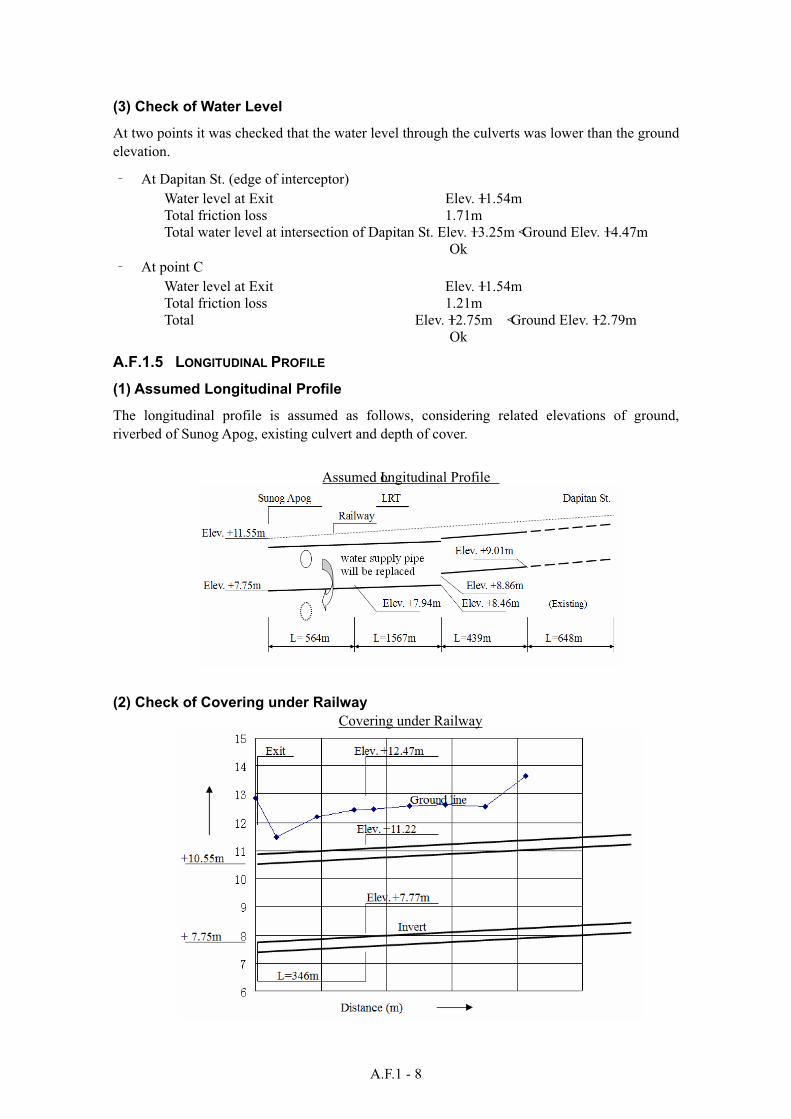
A.F.1 - 8
(3) Check of Water Level
At two points it was checked that the water level through the culverts was lower than the ground
elevation.
At Dapitan St. (edge of interceptor)
Water level at Exit Elev. +11.54m
Total friction loss 1.71m
Total water level at intersection of Dapitan St. Elev. +13.25m < Ground Elev. +14.47m
Ok
At point C
Water level at Exit Elev. +11.54m
Total friction loss 1.21m
Total Elev. +12.75m < Ground Elev. +12.79m
Ok
A.F.1.5 LONGITUDINAL PROFILE
(1) Assumed Longitudinal Profile
The longitudinal profile is assumed as follows, considering related elevations of ground,
riverbed of Sunog Apog, existing culvert and depth of cover.
Assumed Longitudinal Profile
(2) Check of Covering under Railway
Covering under Railway
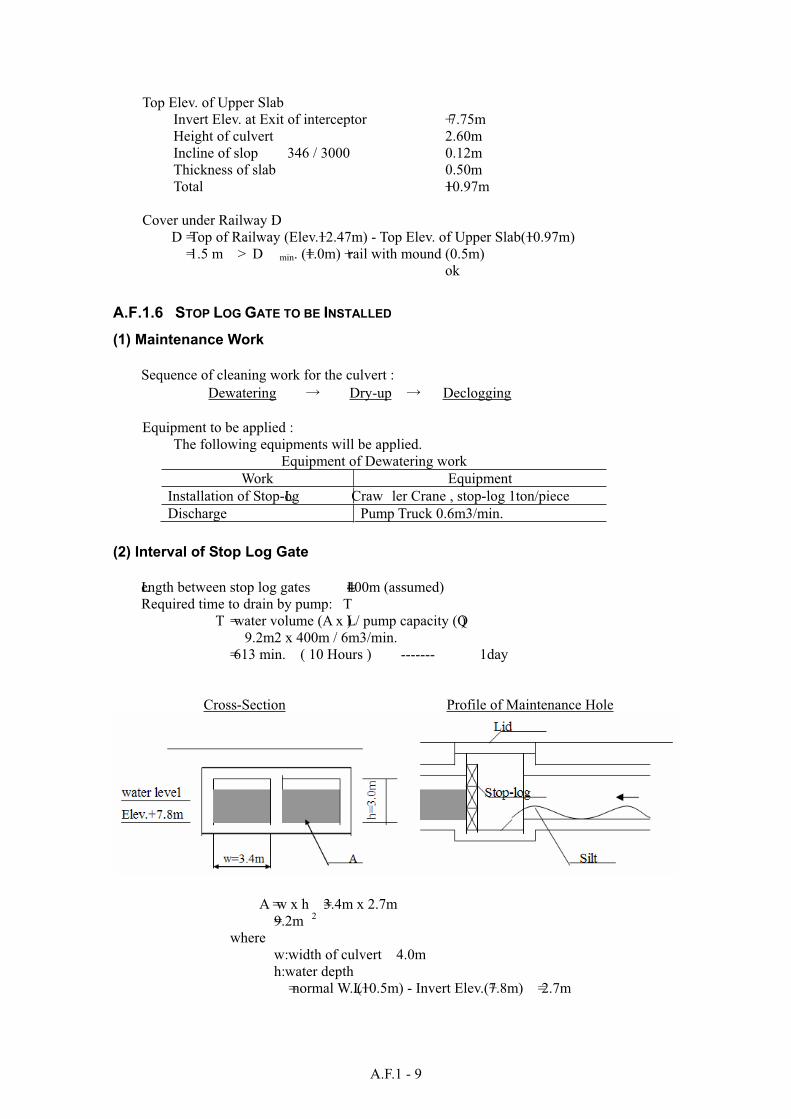
A.F.1 - 9
Top Elev. of Upper Slab
Invert Elev. at Exit of interceptor + 7.75m
Height of culvert 2.60m
Incline of slop 346 / 3000 0.12m
Thickness of slab 0.50m
Total +10.97m
Cover under Railway :D
D = Top of Railway (Elev.+12.47m) - Top Elev. of Upper Slab(+10.97m)
= 1.5 m > D min. (=1.0m) + rail with mound (0.5m)
ok
A.F.1.6 STOP LOG GATE TO BE INSTALLED
(1) Maintenance Work
Sequence of cleaning work for the culvert :
Dewatering Dry-up Declogging
Equipment to be applied :
The following equipments will be applied.
Equipment of Dewatering work
Work Equipment
Installation of Stop-Log Craw ler Crane , stop-log 1ton/piece
Discharge Pump Truck 0.6m3/min.
(2) Interval of Stop Log Gate
Length between stop log gates L=400m (assumed)
Required time to drain by pump: T
T = water volume (A x L) / pump capacity (Q )
9.2m2 x 400m / 6m3/min.
= 613 min. ( 10 Hours ) ------- 1day
Cross-Section Profile of Maintenance Hole
A = w x h =3.4m x 2.7m
=9.2m 2
where
w: width of culvert 4.0m
h: water depth
= normal W.L.(+10.5m) - Invert Elev.(+7.8m) = 2.7m
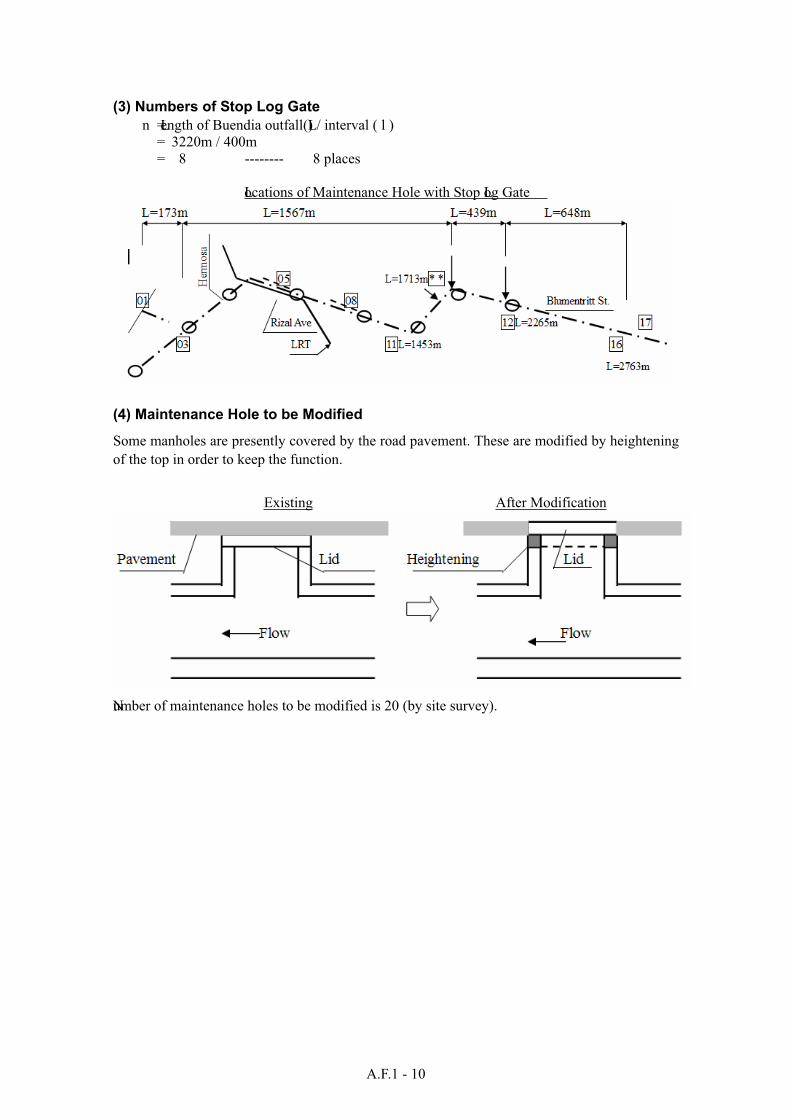
A.F.1 - 10
(3) Numbers of Stop Log Gate
n = Length of Buendia outfall(L) / interval ( l )
= 3220m / 400m
= 8 -------- 8 places
Locations of Maintenance Hole with Stop Log Gate
(4) Maintenance Hole to be Modified
Some manholes are presently covered by the road pavement. These are modified by heightening
of the top in order to keep the function.
Existing After Modification
Number of maintenance holes to be modified is 20 (by site survey).
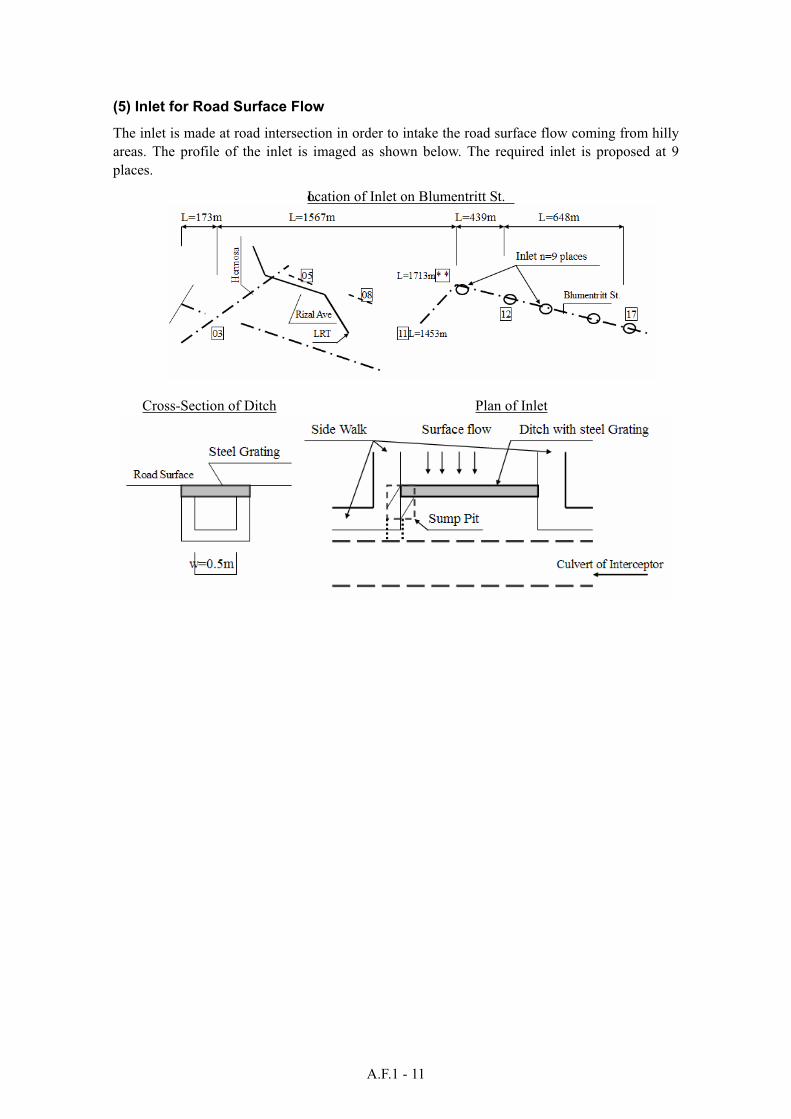
A.F.1 - 11
(5) Inlet for Road Surface Flow
The inlet is made at road intersection in order to intake the road surface flow coming from hilly
areas. The profile of the inlet is imaged as shown below. The required inlet is proposed at 9
places.
Location of Inlet on Blumentritt St.
Cross-Section of Ditch Plan of Inlet
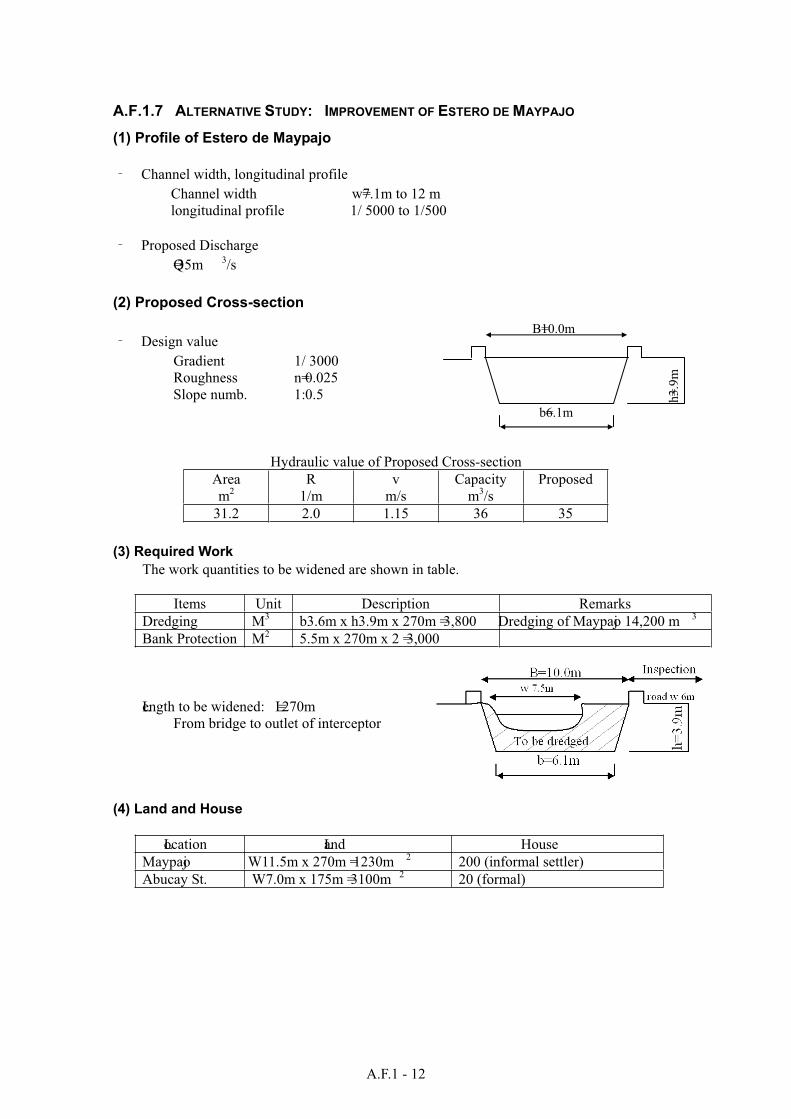
A.F.1 - 12
A.F.1.7 ALTERNATIVE STUDY: IMPROVEMENT OF ESTERO DE MAYPAJO
(1) Profile of Estero de Maypajo
Channel width, longitudinal profile
Channel width w=7.1m to 12 m
longitudinal profile 1/ 5000 to 1/500
Proposed Discharge
Q= 35m 3/s
(2) Proposed Cross-section
Design value
Gradient 1/ 3000
Roughness n= 0.025
Slope numb. 1: 0.5
Hydraulic value of Proposed Cross-section
Area
m2R
1/m
v
m/s
Capacity
m3/s
Proposed
31.2 2.0 1.15 36 35
(3) Required Work
The work quantities to be widened are shown in table.
Items Unit Description Remarks
Dredging M3 b3.6m x h3.9m x 270m = 3,800 Dredging of Maypajo 14,200 m 3
Bank Protection M2 5.5m x 270m x 2 = 3,000
Length to be widened: L = 270m
From bridge to outlet of interceptor
(4) Land and House
Location Land House
Maypajo W11.5m x 270m = 1230m 2 200 (informal settler)
Abucay St. W7.0m x 175m = 3100m 2 20 (formal)
h=3.9
m
b=6.1m
B=10.0m
ANNEX F.2
BUENDIA OUTFALL
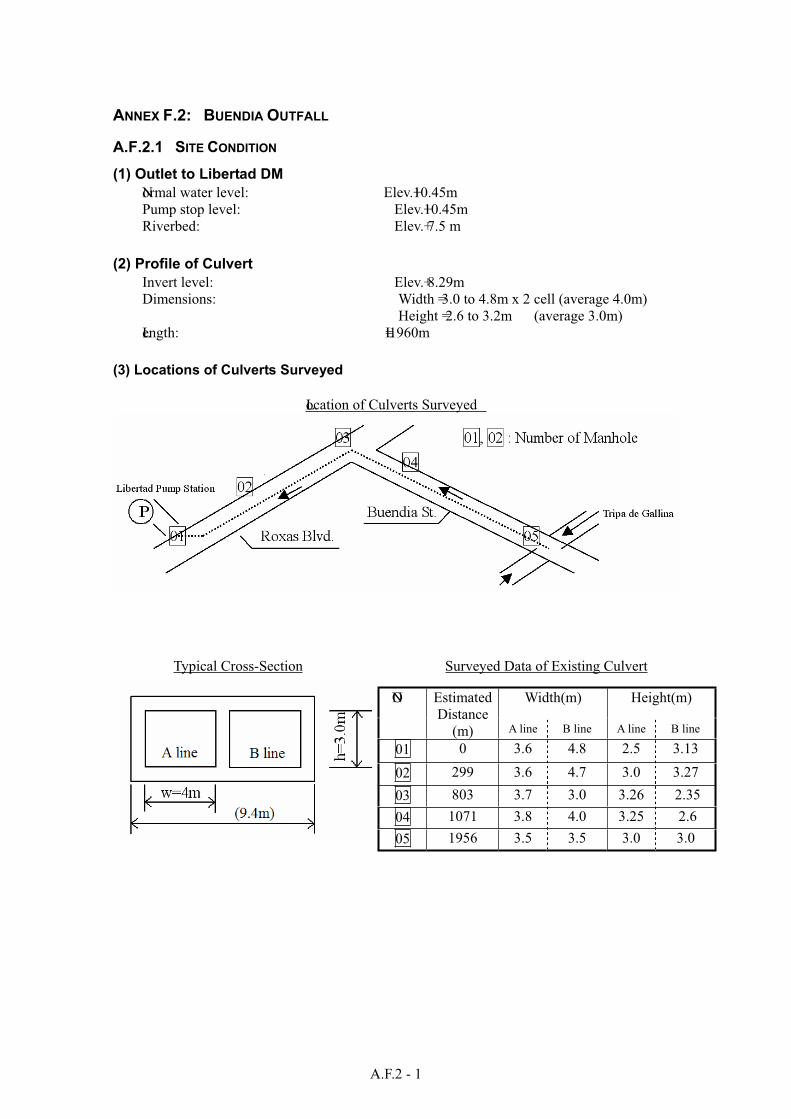
A.F.2 - 1
ANNEX F.2: BUENDIA OUTFALL
A.F.2.1 SITE CONDITION
(1) Outlet to Libertad DM
Normal water level: Elev.+10.45m
Pump stop level: Elev.+10.45m
Riverbed: Elev.+ 7.5 m
(2) Profile of Culvert
Invert level: Elev.+ 8.29m
Dimensions: Width = 3.0 to 4.8m x 2 cell (average 4.0m)
Height = 2.6 to 3.2m (average 3.0m)
Length: L= 1960m
(3) Locations of Culverts Surveyed
Location of Culverts Surveyed
Typical Cross-Section Surveyed Data of Existing Culvert
Width(m) Height(m) NO Estimated
Distance
(m) A line B line A line B line
01 0 3.6 4.8 2.5 3.13
02 299 3.6 4.7 3.0 3.27
03 803 3.7 3.0 3.26 2.35
04 1071 3.8 4.0 3.25 2.6
05 1956 3.5 3.5 3.0 3.0
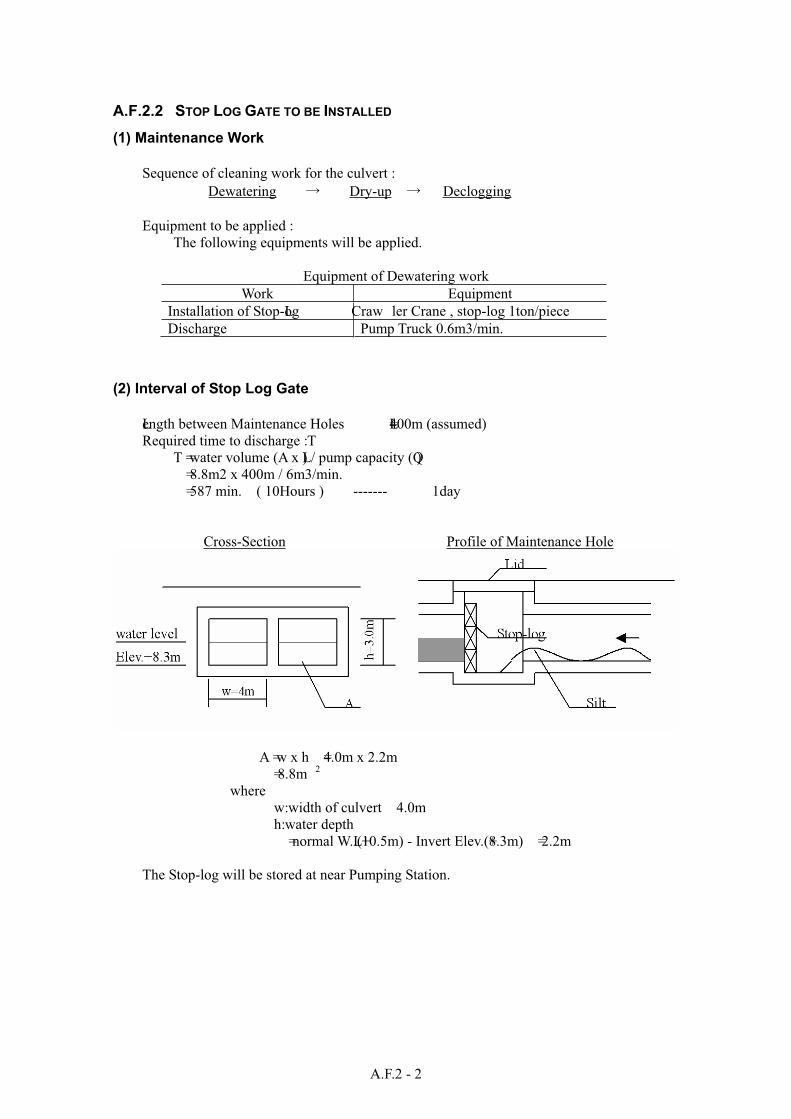
A.F.2 - 2
A.F.2.2 STOP LOG GATE TO BE INSTALLED
(1) Maintenance Work
Sequence of cleaning work for the culvert :
Dewatering Dry-up Declogging
Equipment to be applied :
The following equipments will be applied.
Equipment of Dewatering work
Work Equipment
Installation of Stop-Log Craw ler Crane , stop-log 1ton/piece
Discharge Pump Truck 0.6m3/min.
(2) Interval of Stop Log Gate
Length between Maintenance Holes L=400m (assumed)
Required time to discharge : T
T = water volume (A x L) / pump capacity (Q )
= 8.8m2 x 400m / 6m3/min.
= 587 min. ( 10Hours ) ------- 1day
Cross-Section Profile of Maintenance Hole
A = w x h =4.0m x 2.2m
= 8.8m 2
where
w: width of culvert 4.0m
h: water depth
= normal W.L.(+10.5m) - Invert Elev.(+8.3m) = 2.2m
The Stop-log will be stored at near Pumping Station.
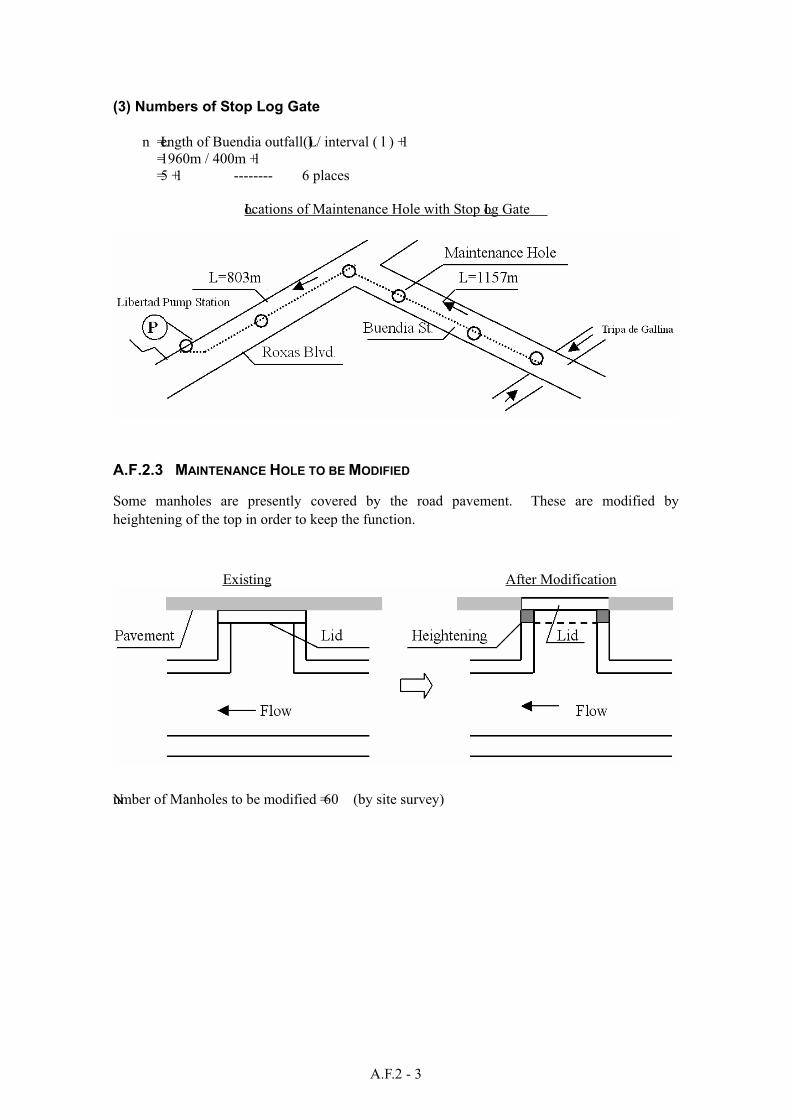
A.F.2 - 3
(3) Numbers of Stop Log Gate
n = Length of Buendia outfall(L) / interval ( l ) + 1
= 1960m / 400m + 1
= 5 + 1 -------- 6 places
Locations of Maintenance Hole with Stop Log Gate
A.F.2.3 MAINTENANCE HOLE TO BE MODIFIED
Some manholes are presently covered by the road pavement. These are modified by
heightening of the top in order to keep the function.
Existing After Modification
Number of Manholes to be modified = 60 (by site survey)

ANNEX F.3
ZOBEL ROXAS DRAINAGE MAIN
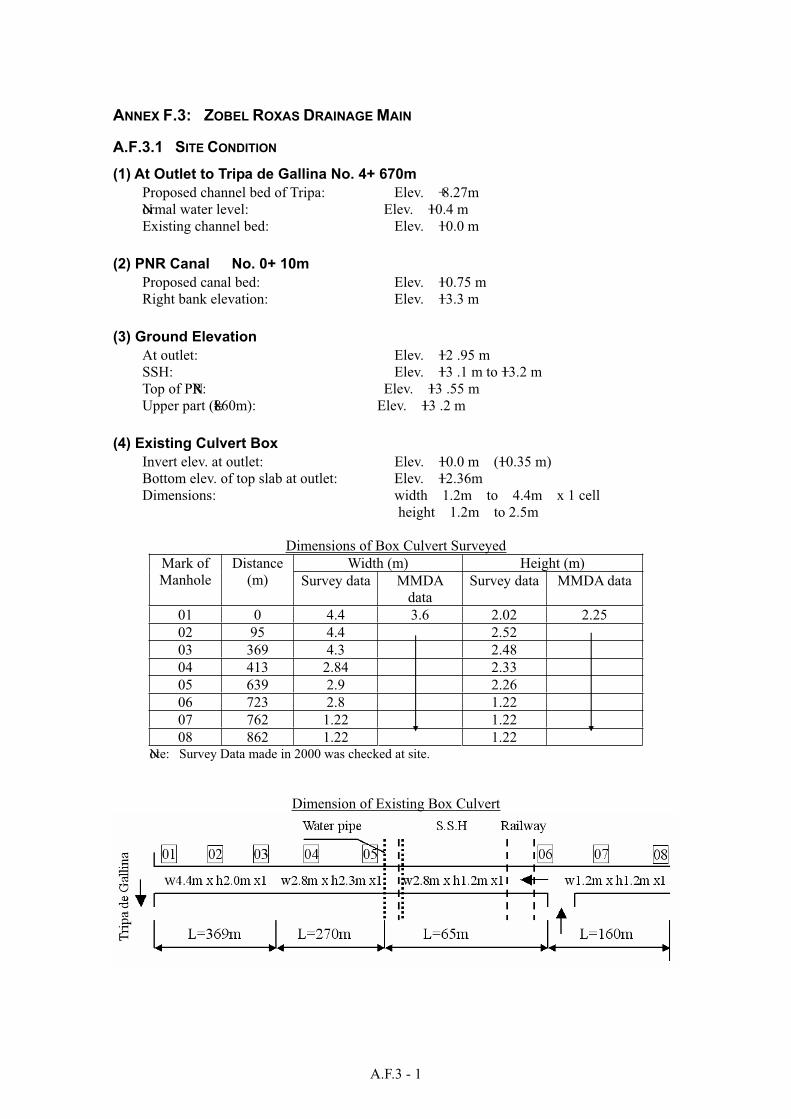
A.F.3 - 1
ANNEX F.3: ZOBEL ROXAS DRAINAGE MAIN
A.F.3.1 SITE CONDITION
(1) At Outlet to Tripa de Gallina No. 4+ 670m
Proposed channel bed of Tripa: Elev. + 8.27m
Normal water level: Elev. +10.4 m
Existing channel bed: Elev. +10.0 m
(2) PNR Canal No. 0+ 10m
Proposed canal bed: Elev. +10.75 m
Right bank elevation: Elev. +13.3 m
(3) Ground Elevation
At outlet: Elev. +12 .95 m
SSH: Elev. +13 .1 m to +13.2 m
Top of PNR: Elev. +13 .55 m
Upper part (L=860m): Elev. +13 .2 m
(4) Existing Culvert Box
Invert elev. at outlet: Elev. +10.0 m (+10.35 m)
Bottom elev. of top slab at outlet: Elev. +12.36m
Dimensions: width 1.2m to 4.4m x 1 cell
height 1.2m to 2.5m
Dimensions of Box Culvert Surveyed
Width (m) Height (m) Mark of
Manhole
Distance
(m) Survey data MMDA
data
Survey data MMDA data
01 0 4.4 3.6 2.02 2.25
02 95 4.4 2.52
03 369 4.3 2.48
04 413 2.84 2.33
05 639 2.9 2.26
06 723 2.8 1.22
07 762 1.22 1.22
08 862 1.22 1.22 Note: Survey Data made in 2000 was checked at site.
Dimension of Existing Box Culvert
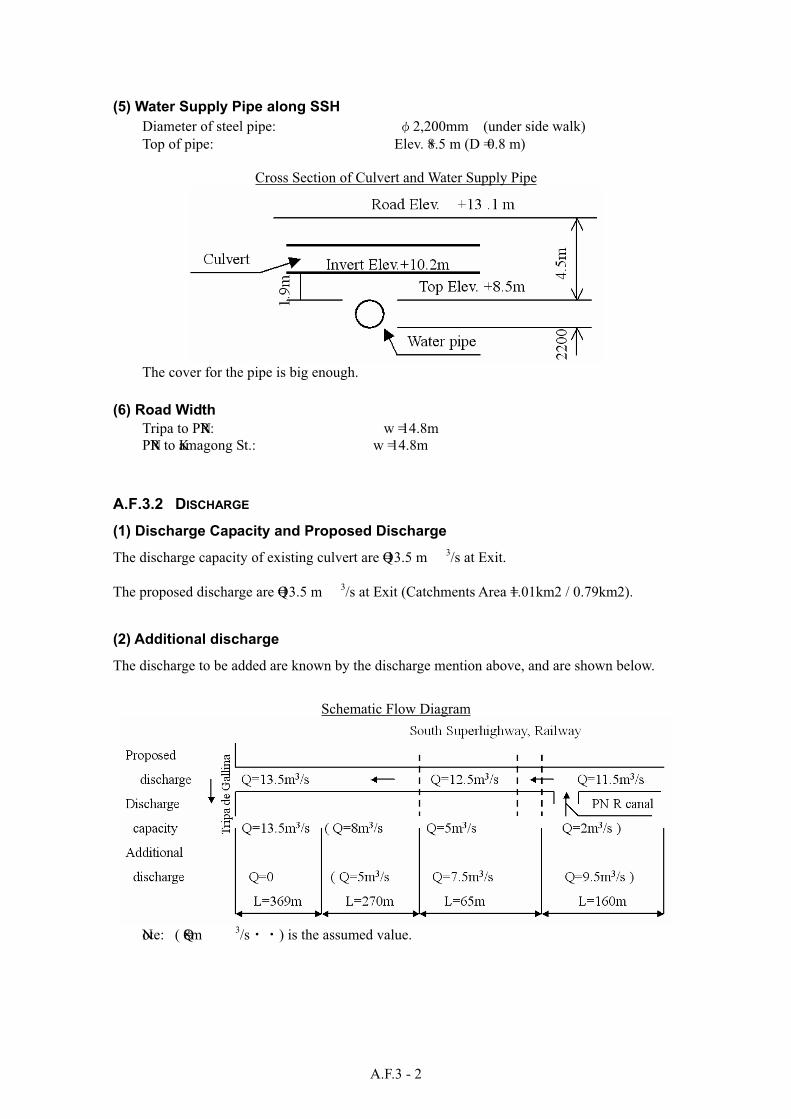
A.F.3 - 2
(5) Water Supply Pipe along SSH
Diameter of steel pipe: 2,200mm (under side walk)
Top of pipe: Elev. +8.5 m (D = 0.8 m)
Cross Section of Culvert and Water Supply Pipe
The cover for the pipe is big enough.
(6) Road Width
Tripa to PNR: w = 14.8m
PNR to Kamagong St.: w = 14.8m
A.F.3.2 DISCHARGE
(1) Discharge Capacity and Proposed Discharge
The discharge capacity of existing culvert are Q= 13.5 m 3/s at Exit.
The proposed discharge are Q= 13.5 m 3/s at Exit (Catchments Area =1.01km2 / 0.79km2).
(2) Additional discharge
The discharge to be added are known by the discharge mention above, and are shown below.
Schematic Flow Diagram
Note: ( Q=8m 3/s ) is the assumed value.
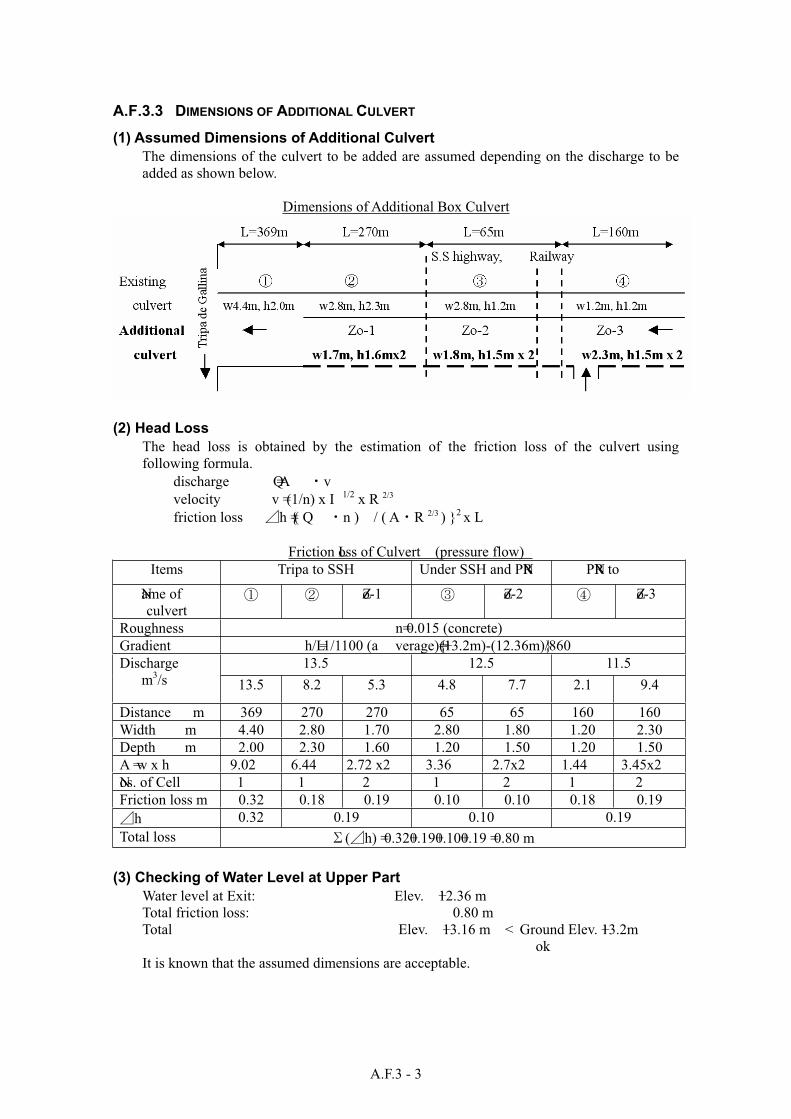
A.F.3 - 3
A.F.3.3 DIMENSIONS OF ADDITIONAL CULVERT
(1) Assumed Dimensions of Additional Culvert
The dimensions of the culvert to be added are assumed depending on the discharge to be
added as shown below.
Dimensions of Additional Box Culvert
(2) Head Loss
The head loss is obtained by the estimation of the friction loss of the culvert using
following formula.
discharge Q = A v
velocity v = (1/n) x I 1/2 x R 2/3
friction loss h ={ ( Q n ) / ( A R 2/3 ) }2 x L
Friction Loss of Culvert (pressure flow)
Items Tripa to SSH Under SSH and PNR PNR to
Name of
culvert
Zo-1 Zo-2 Zo-3
Roughness n= 0.015 (concrete)
Gradient h/L = 1/1100 (a verage)={(+13.2m)-(12.36m)}/860
13.5 12.5 11.5 Discharge
m3/s 13.5 8.2 5.3 4.8 7.7 2.1 9.4
Distance m 369 270 270 65 65 160 160
Width m 4.40 2.80 1.70 2.80 1.80 1.20 2.30
Depth m 2.00 2.30 1.60 1.20 1.50 1.20 1.50
A = w x h 9.02 6.44 2.72 x2 3.36 2.7x2 1.44 3.45x2
Nos. of Cell 1 1 2 1 2 1 2
Friction loss m 0.32 0.18 0.19 0.10 0.10 0.18 0.19
h 0.32 0.19 0.10 0.19
Total loss ( h) = 0.32+0.19+0.10+0.19 = 0.80 m
(3) Checking of Water Level at Upper Part
Water level at Exit: Elev. +12.36 m
Total friction loss: 0.80 m
Total Elev. +13.16 m < Ground Elev. +13.2m
ok
It is known that the assumed dimensions are acceptable.
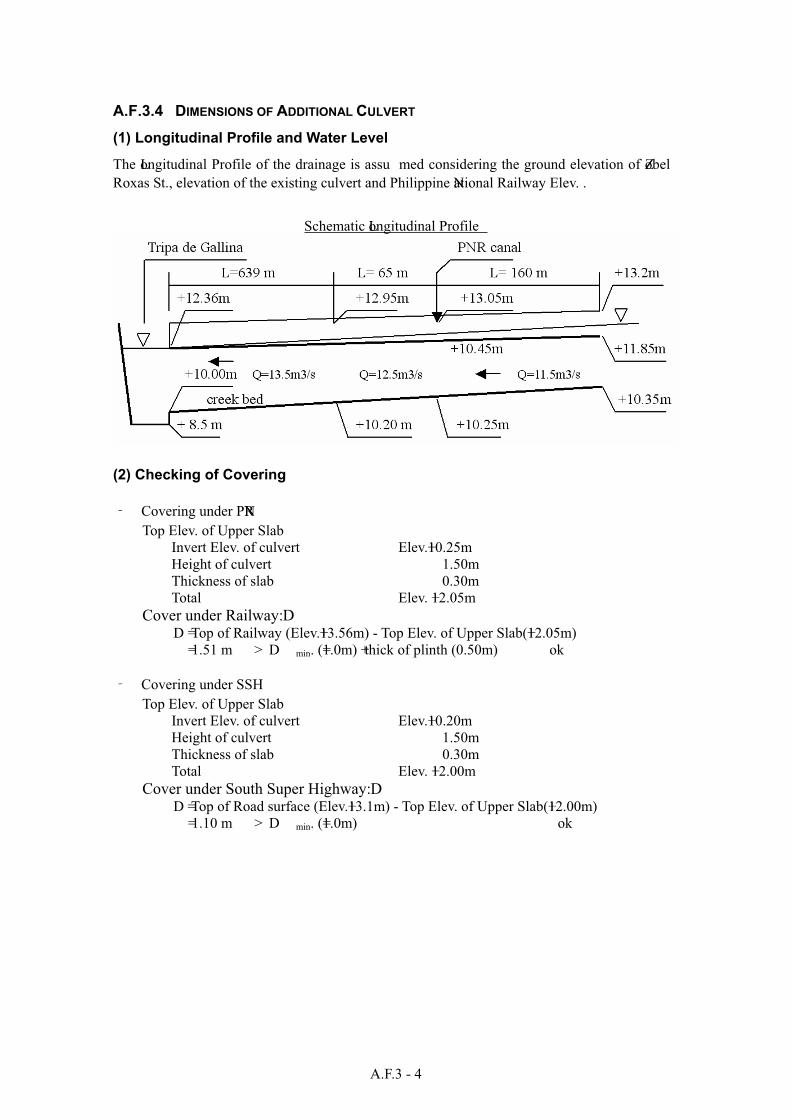
A.F.3 - 4
A.F.3.4 DIMENSIONS OF ADDITIONAL CULVERT
(1) Longitudinal Profile and Water Level
The Longitudinal Profile of the drainage is assu med considering the ground elevation of Zobel
Roxas St., elevation of the existing culvert and Philippine National Railway Elev. .
Schematic Longitudinal Profile
(2) Checking of Covering
Covering under PNR
Top Elev. of Upper Slab
Invert Elev. of culvert Elev.+10.25m
Height of culvert 1.50m
Thickness of slab 0.30m
Total Elev. +12.05m
Cover under Railway: D D = Top of Railway (Elev.+13.56m) - Top Elev. of Upper Slab(+12.05m)
= 1.51 m > D min. (=1.0m) + thick of plinth (0.50m) ok
Covering under SSH
Top Elev. of Upper Slab
Invert Elev. of culvert Elev.+10.20m
Height of culvert 1.50m
Thickness of slab 0.30m
Total Elev. +12.00m
Cover under South Super Highway: D D = Top of Road surface (Elev.+13.1m) - Top Elev. of Upper Slab(+12.00m)
= 1.10 m > D min. (=1.0m) ok
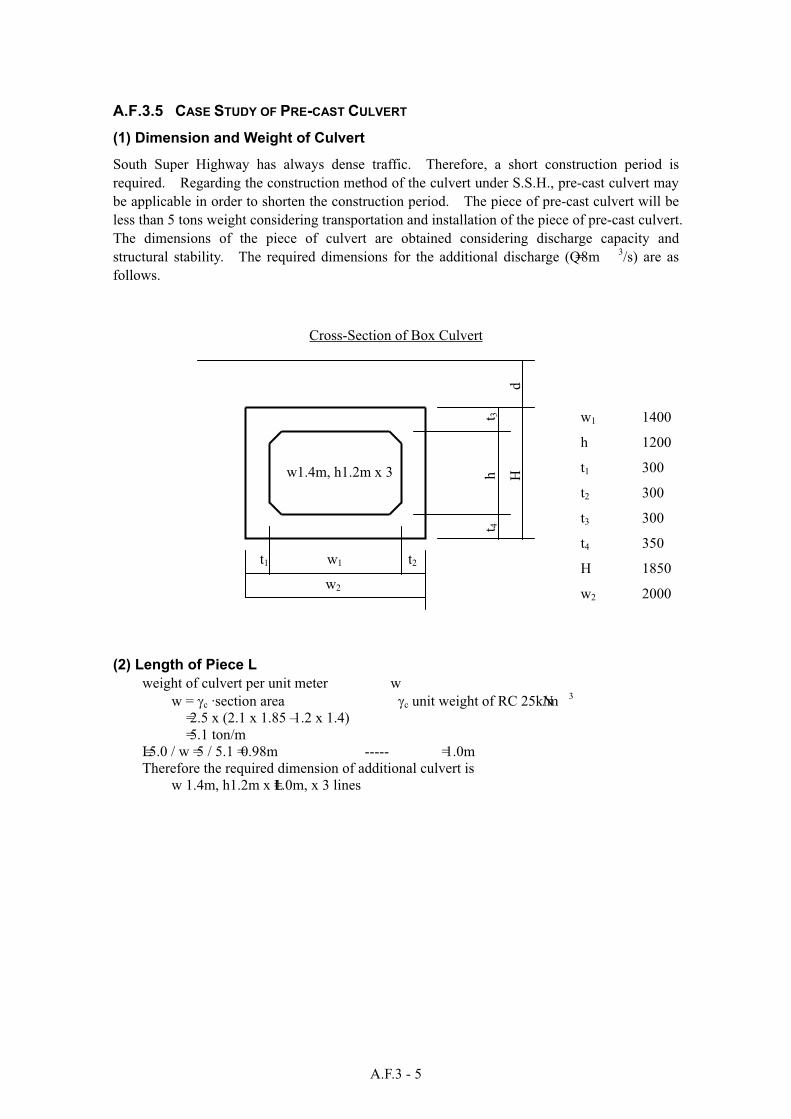
A.F.3 - 5
A.F.3.5 CASE STUDY OF PRE-CAST CULVERT
(1) Dimension and Weight of Culvert
South Super Highway has always dense traffic. Therefore, a short construction period is
required. Regarding the construction method of the culvert under S.S.H., pre-cast culvert may
be applicable in order to shorten the construction period. The piece of pre-cast culvert will be
less than 5 tons weight considering transportation and installation of the piece of pre-cast culvert.
The dimensions of the piece of culvert are obtained considering discharge capacity and
structural stability. The required dimensions for the additional discharge (Q = 8m 3/s) are as
follows.
Cross-Section of Box Culvert
(2) Length of Piece L
weight of culvert per unit meter w
w = c · section area c unit weight of RC 25kN/m 3
= 2.5 x (2.1 x 1.85 – 1.2 x 1.4)
= 5.1 ton/m
L = 5.0 / w = 5 / 5.1 = 0.98m ----- = 1.0m
Therefore the required dimension of additional culvert is
w 1.4m, h1.2m x L=1.0m, x 3 lines
w1 1400
h 1200
t1 300
t2 300
t3 300
t4 350
H 1850
w2 2000
t 4
h
t 3
H
d
t1 w1 t2
w2
w1.4m, h1.2m x 3

ANNEX F.4
FARADAY DRAINAGE MAIN
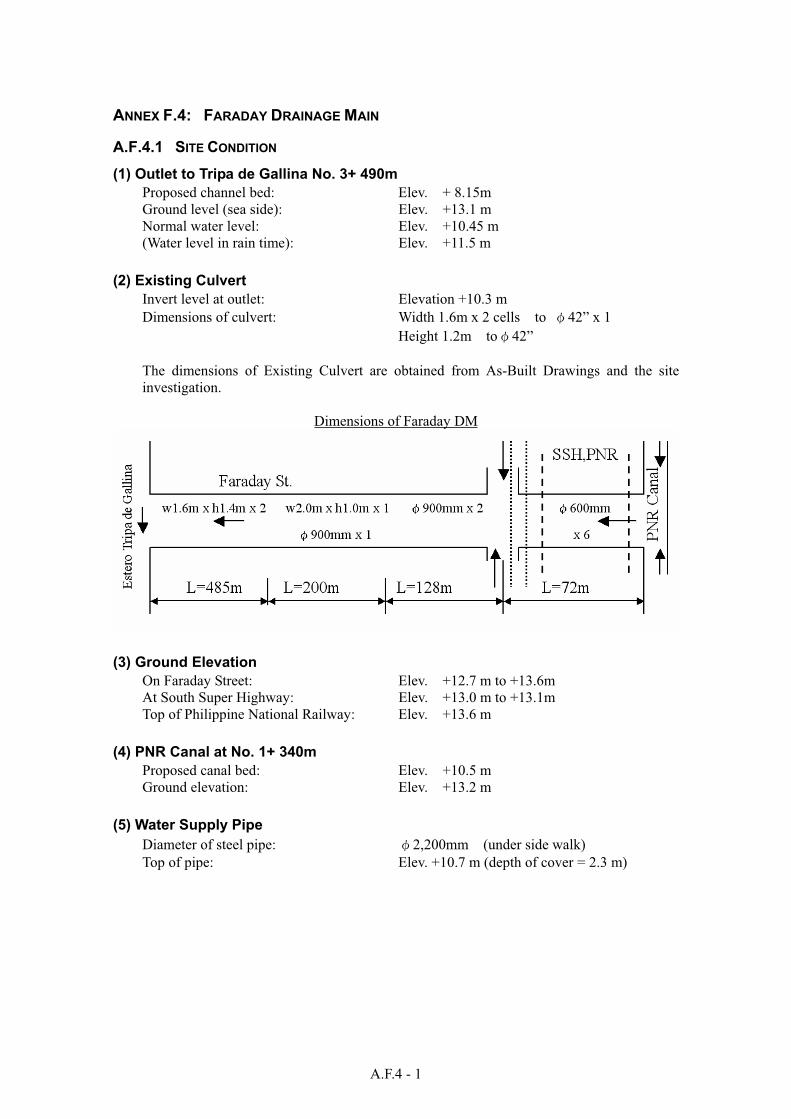
A.F.4 - 1
ANNEX F.4: FARADAY DRAINAGE MAIN
A.F.4.1 SITE CONDITION
(1) Outlet to Tripa de Gallina No. 3+ 490m
Proposed channel bed: Elev. + 8.15m
Ground level (sea side): Elev. +13.1 m
Normal water level: Elev. +10.45 m
(Water level in rain time): Elev. +11.5 m
(2) Existing Culvert
Invert level at outlet: Elevation +10.3 m
Dimensions of culvert: Width 1.6m x 2 cells to 42” x 1
Height 1.2m to 42”
The dimensions of Existing Culvert are obtained from As-Built Drawings and the site
investigation.
Dimensions of Faraday DM
(3) Ground Elevation
On Faraday Street: Elev. +12.7 m to +13.6m
At South Super Highway: Elev. +13.0 m to +13.1m
Top of Philippine National Railway: Elev. +13.6 m
(4) PNR Canal at No. 1+ 340m
Proposed canal bed: Elev. +10.5 m
Ground elevation: Elev. +13.2 m
(5) Water Supply Pipe
Diameter of steel pipe: 2,200mm (under side walk)
Top of pipe: Elev. +10.7 m (depth of cover = 2.3 m)
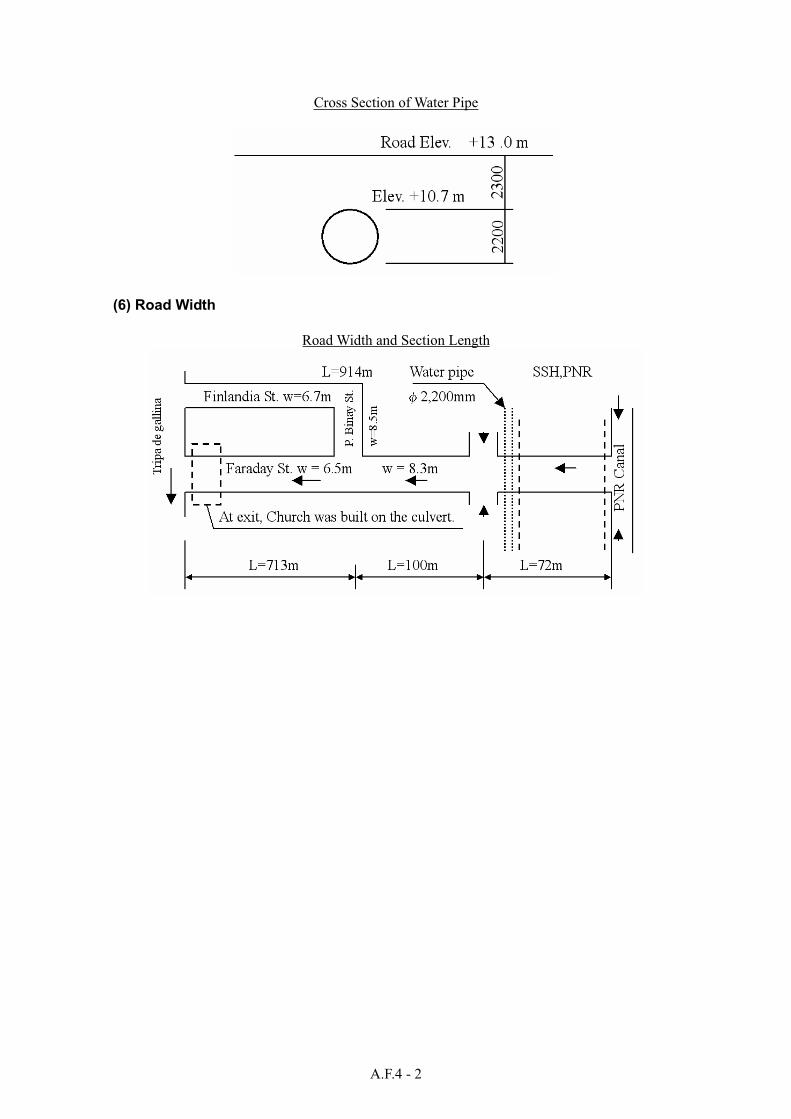
A.F.4 - 2
Cross Section of Water Pipe
(6) Road Width
Road Width and Section Length
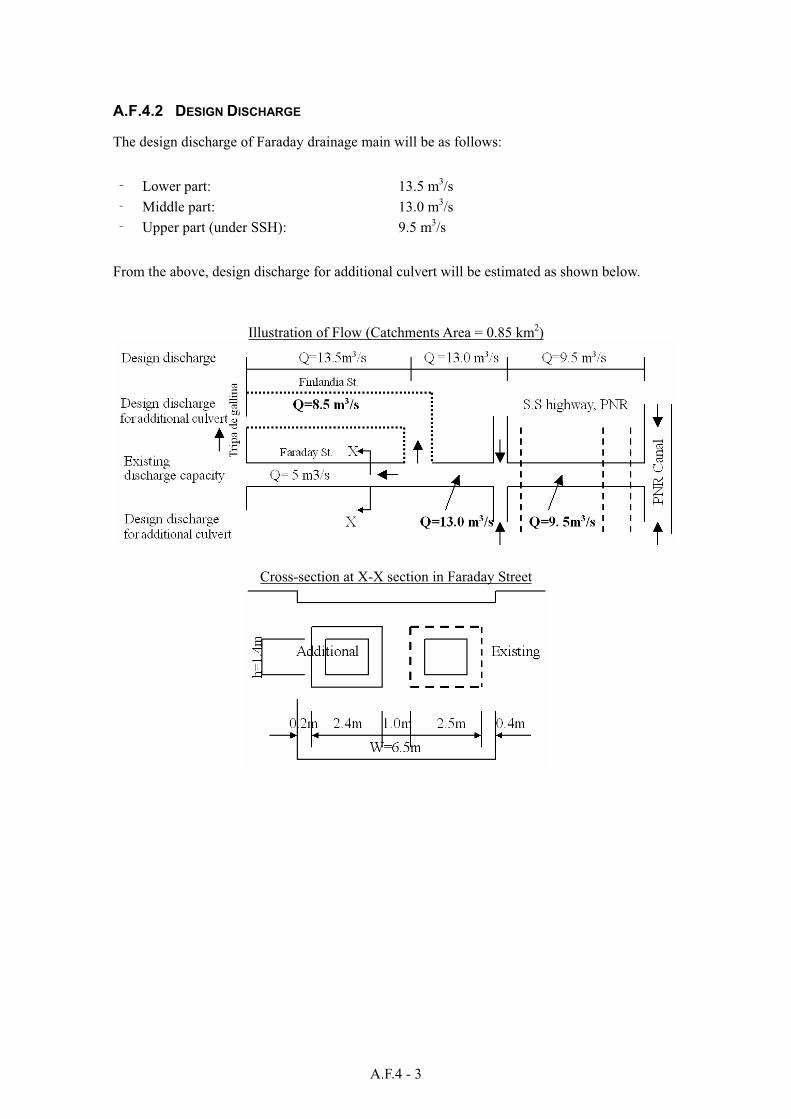
A.F.4 - 3
A.F.4.2 DESIGN DISCHARGE
The design discharge of Faraday drainage main will be as follows:
Lower part: 13.5 m3/s
Middle part: 13.0 m3/s
Upper part (under SSH): 9.5 m3/s
From the above, design discharge for additional culvert will be estimated as shown below.
Illustration of Flow (Catchments Area = 0.85 km2)
Cross-section at X-X section in Faraday Street
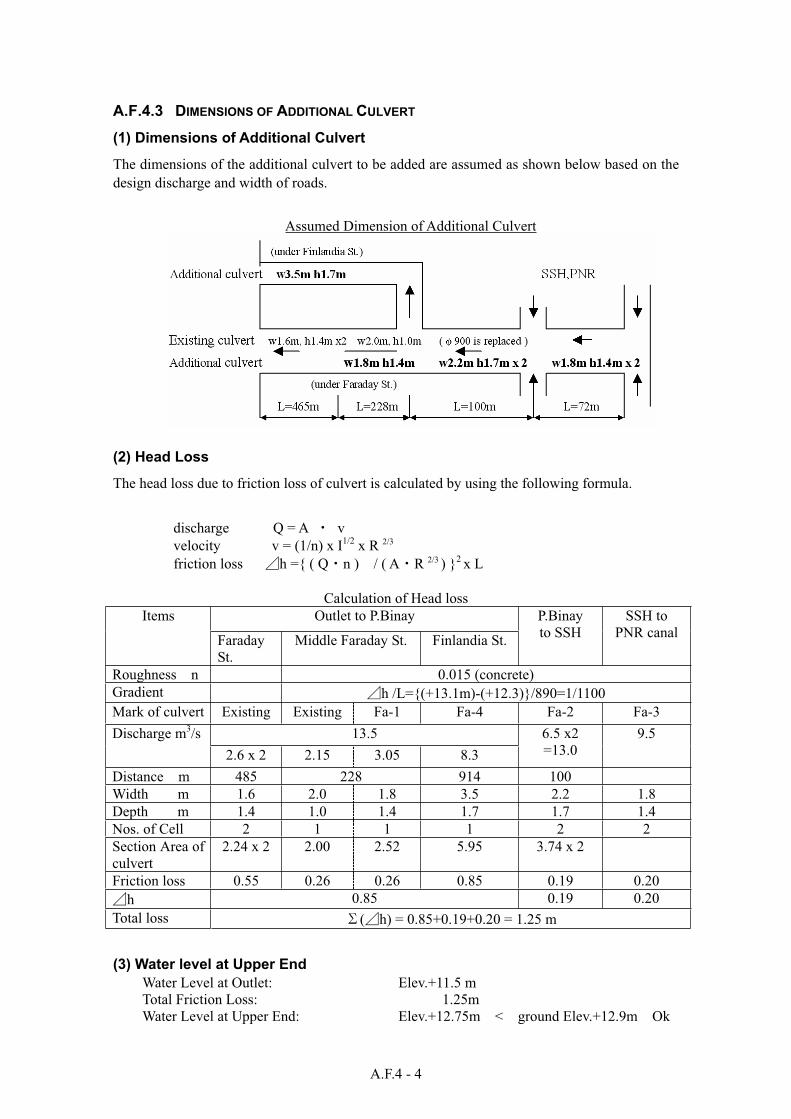
A.F.4 - 4
A.F.4.3 DIMENSIONS OF ADDITIONAL CULVERT
(1) Dimensions of Additional Culvert
The dimensions of the additional culvert to be added are assumed as shown below based on the
design discharge and width of roads.
Assumed Dimension of Additional Culvert
(2) Head Loss
The head loss due to friction loss of culvert is calculated by using the following formula.
discharge Q = A v
velocity v = (1/n) x I1/2 x R 2/3
friction loss h ={ ( Q n ) / ( A R 2/3 ) }2 x L
Calculation of Head loss
Outlet to P.Binay Items
Faraday
St.
Middle Faraday St. Finlandia St.
P.Binay
to SSH
SSH to
PNR canal
Roughness n 0.015 (concrete)
Gradient h /L={(+13.1m)-(+12.3)}/890=1/1100
Mark of culvert Existing Existing Fa-1 Fa-4 Fa-2 Fa-3
13.5Discharge m3/s
2.6 x 2 2.15 3.05 8.3
6.5 x2
=13.0
9.5
Distance m 485 228 914 100
Width m 1.6 2.0 1.8 3.5 2.2 1.8
Depth m 1.4 1.0 1.4 1.7 1.7 1.4
Nos. of Cell 2 1 1 1 2 2
Section Area of
culvert
2.24 x 2 2.00 2.52 5.95 3.74 x 2
Friction loss 0.55 0.26 0.26 0.85 0.19 0.20
h 0.85 0.19 0.20
Total loss ( h) = 0.85+0.19+0.20 = 1.25 m
(3) Water level at Upper End
Water Level at Outlet: Elev.+11.5 m
Total Friction Loss: 1.25m
Water Level at Upper End: Elev.+12.75m < ground Elev.+12.9m Ok
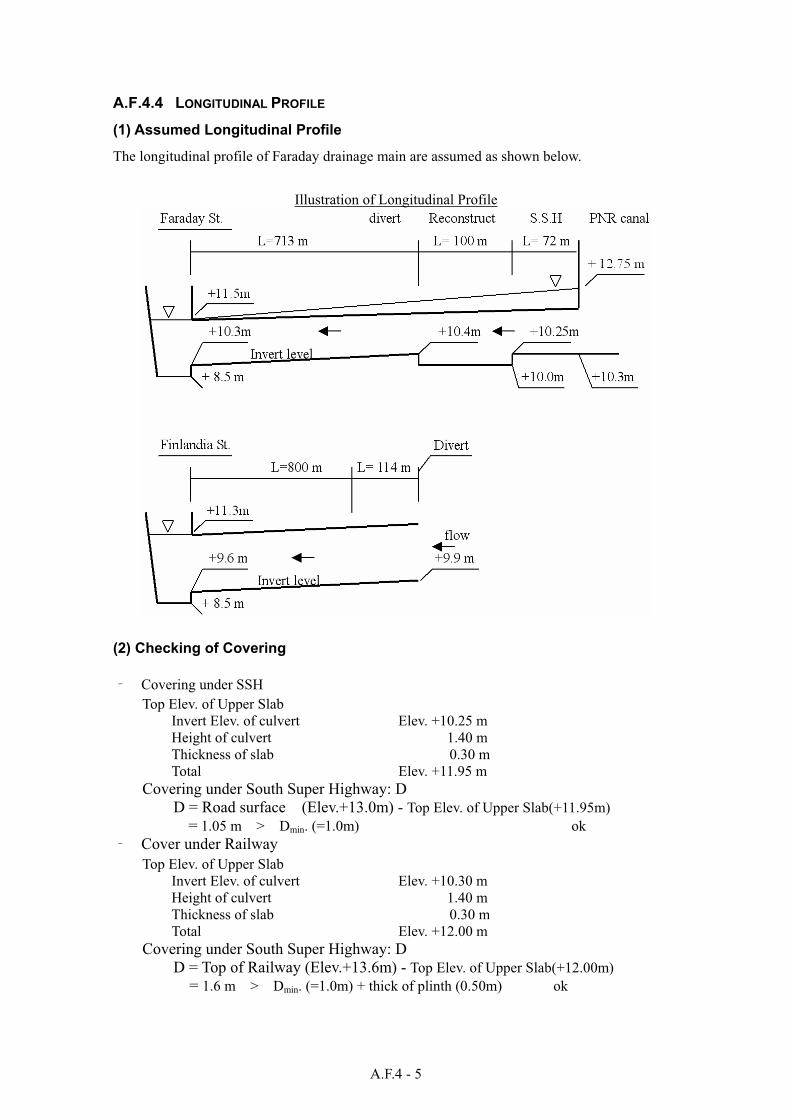
A.F.4 - 5
A.F.4.4 LONGITUDINAL PROFILE
(1) Assumed Longitudinal Profile
The longitudinal profile of Faraday drainage main are assumed as shown below.
Illustration of Longitudinal Profile
(2) Checking of Covering
Covering under SSH
Top Elev. of Upper Slab
Invert Elev. of culvert Elev. +10.25 m
Height of culvert 1.40 m
Thickness of slab 0.30 m
Total Elev. +11.95 m
Covering under South Super Highway: D
D = Road surface (Elev.+13.0m) - Top Elev. of Upper Slab(+11.95m)
= 1.05 m > Dmin. (=1.0m) ok
Cover under Railway
Top Elev. of Upper Slab
Invert Elev. of culvert Elev. +10.30 m
Height of culvert 1.40 m
Thickness of slab 0.30 m
Total Elev. +12.00 m
Covering under South Super Highway: D
D = Top of Railway (Elev.+13.6m) - Top Elev. of Upper Slab(+12.00m)
= 1.6 m > Dmin. (=1.0m) + thick of plinth (0.50m) ok
ANNEX F.5
STRUCTURAL STUDY
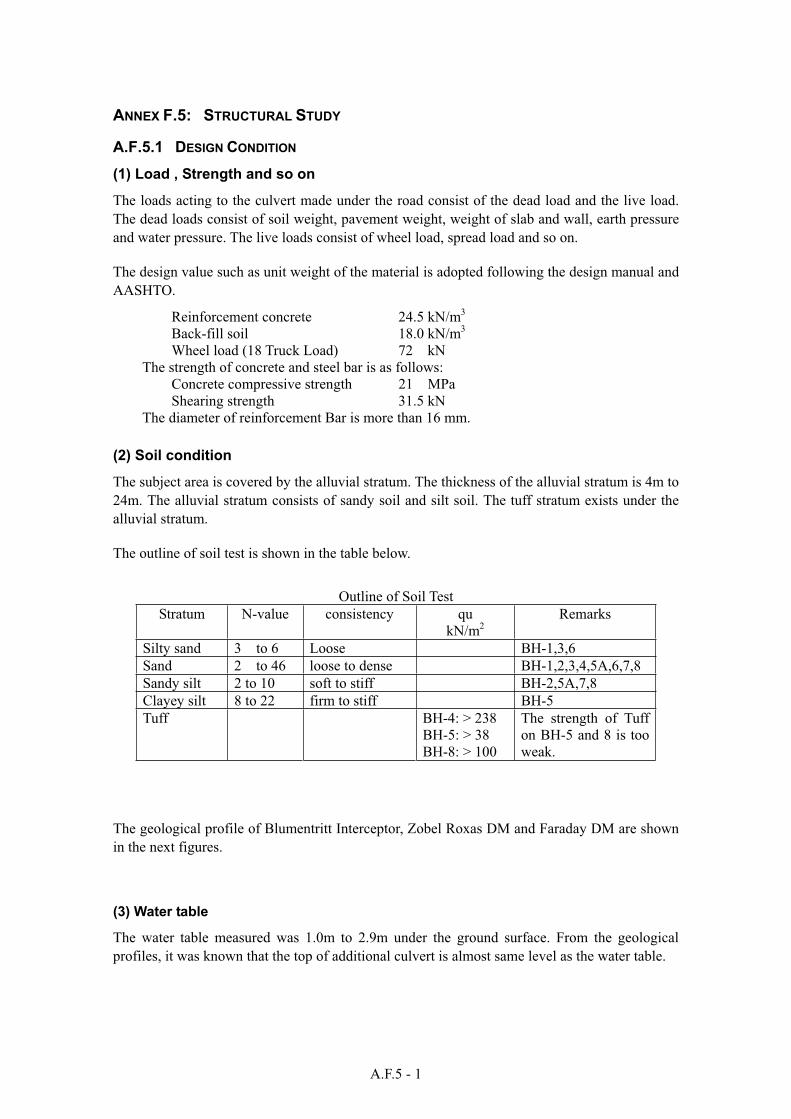
A.F.5 - 1
ANNEX F.5: STRUCTURAL STUDY
A.F.5.1 DESIGN CONDITION
(1) Load , Strength and so on
The loads acting to the culvert made under the road consist of the dead load and the live load.
The dead loads consist of soil weight, pavement weight, weight of slab and wall, earth pressure
and water pressure. The live loads consist of wheel load, spread load and so on.
The design value such as unit weight of the material is adopted following the design manual and
AASHTO.
Reinforcement concrete 24.5 kN/m3
Back-fill soil 18.0 kN/m3
Wheel load (18 Truck Load) 72 kN
The strength of concrete and steel bar is as follows:
Concrete compressive strength 21 MPa
Shearing strength 31.5 kN
The diameter of reinforcement Bar is more than 16 mm.
(2) Soil condition
The subject area is covered by the alluvial stratum. The thickness of the alluvial stratum is 4m to
24m. The alluvial stratum consists of sandy soil and silt soil. The tuff stratum exists under the
alluvial stratum.
The outline of soil test is shown in the table below.
Outline of Soil Test
Stratum N-value consistency qu
kN/m2Remarks
Silty sand 3 to 6 Loose BH-1,3,6
Sand 2 to 46 loose to dense BH-1,2,3,4,5A,6,7,8
Sandy silt 2 to 10 soft to stiff BH-2,5A,7,8
Clayey silt 8 to 22 firm to stiff BH-5
Tuff BH-4: > 238
BH-5: > 38
BH-8: > 100
The strength of Tuff
on BH-5 and 8 is too
weak.
The geological profile of Blumentritt Interceptor, Zobel Roxas DM and Faraday DM are shown
in the next figures.
(3) Water table
The water table measured was 1.0m to 2.9m under the ground surface. From the geological
profiles, it was known that the top of additional culvert is almost same level as the water table.
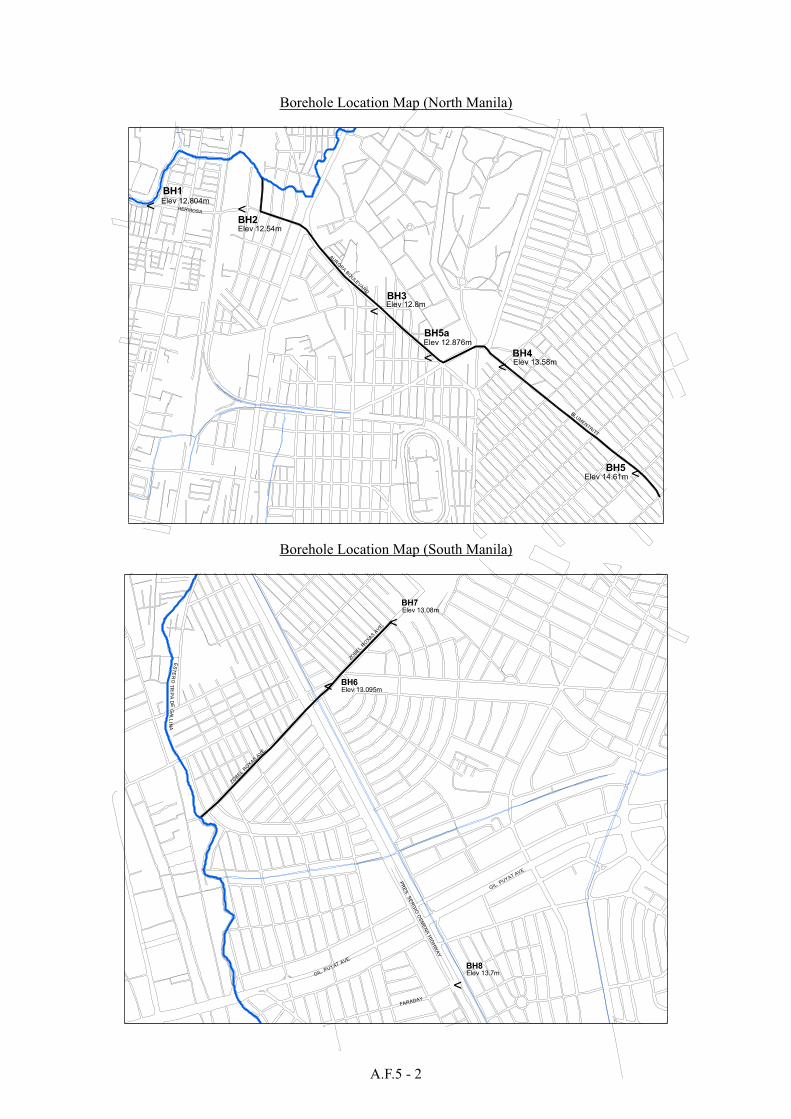
A.F.5 - 2
Borehole Location Map (North Manila)
< <
<
<<
<BH5
BH4
BH3
BH2
BH1
BH5a
Elev 12.8m
Elev 14.61m
Elev 13.58m
Elev 12.54m
Elev 12.876m
Elev 12.804m
AUR
ORA
BO
ULE
VARD
HERMOSA
BLUM
ENTR
ITT
Borehole Location Map (South Manila)
<
<
<Elev 13.7m
Elev 13.08m
Elev 13.095m
BH8
BH7
BH6
PR
ES
.S
ER
GIO
OS
ME
NA
HIG
HW
AY
GIL. PUYAT AVE.
ZOBEL
RO
XAS
AVE.
ZOBEL
RO
XAS
AVE.
GIL. PUYAT AVE.
FARADAY
ES
TE
RO
TR
IPA
DE
GA
LL
INA
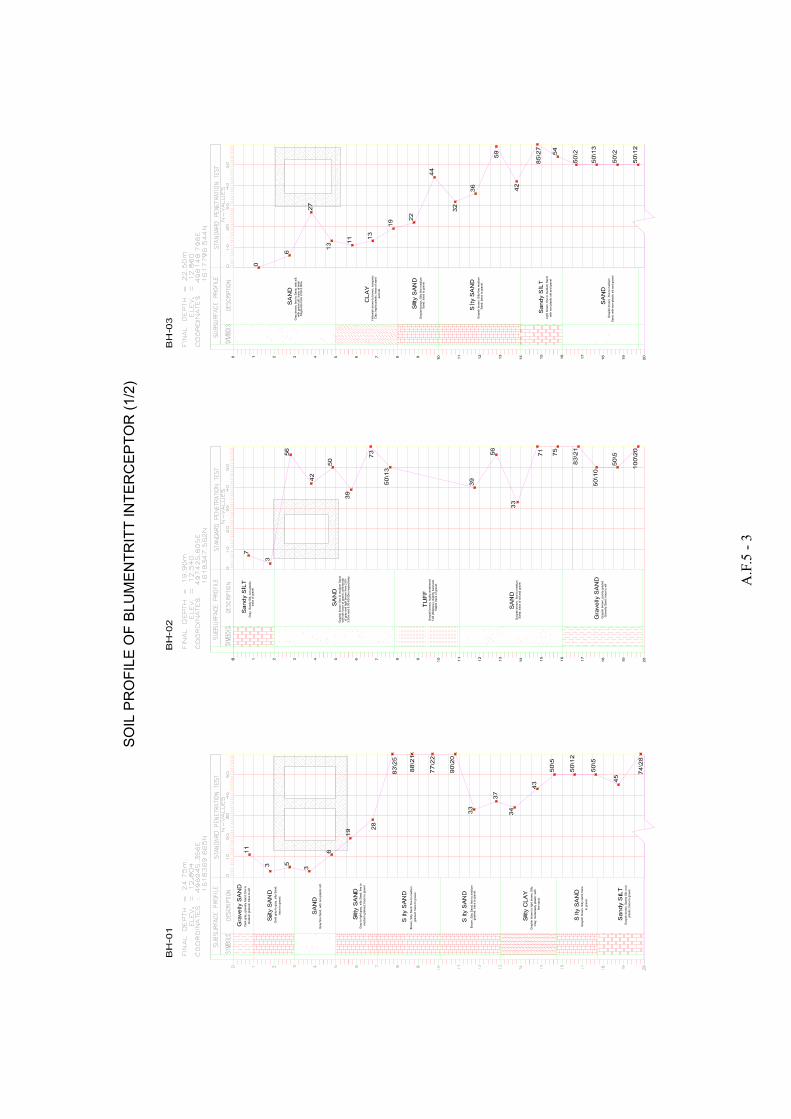
A.F
.5 -
3
Dark
gra
y,
gra
velly
Sa
nd
; fine
to
me
diu
m g
rain
ed
; tr
ace
to
silt
.
Dark
gra
y t
o g
ray,
silt
y S
an
d;
tra
ce
to
gra
ve
l.
Gra
y f
ine
Sa
nd
, w
ith n
on
-pla
stic s
ilt.
Gra
y t
o lig
ht
gra
y,
silt
y S
and
; fin
e t
o
me
du
im g
rain
ed;
tra
ce
to g
rave
l
Bro
wn
, S
ilty S
an
d;
fin
e t
o m
ediu
m
gra
ine
d;
tra
ce
to
gra
ve
l.
Bro
wn
, S
ilty S
an
d;
fin
e t
o m
ed
ium
g
rain
ed
; tr
ace t
o g
rave
l.
Gra
yis
h b
row
n t
o lig
ht
bro
wn
, S
ilty
Cla
y;
mo
dera
tely
pla
stic;
with
Gra
yis
h b
row
n,
Silt
y s
and
; tr
ace
Gra
yis
h b
row
n,
Sa
nd
y S
ilt;
no
n-
pla
stic;
tra
ce t
o g
ravel.
fin
e s
an
d.
to g
rave
l.
Gra
y,
Sa
nd
y S
ilt;
no
n-p
lastic;
tra
ce
of
gra
ve
l.
Gra
yis
h b
row
n,
fin
e t
o m
ediu
m S
and
;w
ith
silt
; tr
ace o
f g
rave
l; w
ith s
tre
ak
of
gra
y a
nd
lig
ht
bro
wn
fro
m 2
.00
-3
.00m
an
d 5
.00
-60
.00
m r
espe
ctive
ly.
Gra
yis
h b
row
n,
hig
hly
we
ath
ere
d
Tu
ff (
Silt
sto
ne
); s
ligh
tly h
ard
an
d
fria
ble
tra
ce
of
gra
ve
l.
Gra
yis
h b
row
n;
fin
e t
o m
ediu
m
Sa
nd
; tr
ace
of
silt
an
d g
rave
l
Gra
yis
h b
row
n,
po
orl
y-g
rad
ed
Gra
ve
lly S
and
; tr
ace t
o s
ilt
Gra
y b
row
n,
fin
e t
o S
an
d;
with
silt
;w
ith g
rave
l silt
; tr
ace
of
sh
ell
fra
gm
en
ts f
rom
2.0
0-3
.00m
.
Ye
llow
ish
bro
wn
to
bro
wn;
ino
rga
nic
C
lay;
hig
hly
pla
stic;
tra
ce
of
san
d
Gra
yis
h b
row
n,
Silt
y f
ine
me
diu
m
San
d;
tra
ce
to g
rave
l.
Gra
yis
h b
row
n,
Silt
y f
ine
me
diu
m
Sa
nd
; tr
ace
to
gra
vel.
Lig
ht
bro
wn
, fin
e t
o m
ed
ium
San
d;
with
no
n p
lastic s
ilt a
nd
gra
ve
l
Gra
yis
h b
row
n;
fin
e t
o m
ed
ium
Sa
nd
; w
ith n
on-p
lastic s
ilt a
nd
gra
ve
l
and
silt
.
SO
IL P
RO
FIL
E O
F B
LU
ME
NT
RIT
T IN
TE
RC
EP
TO
R (
1/2
)
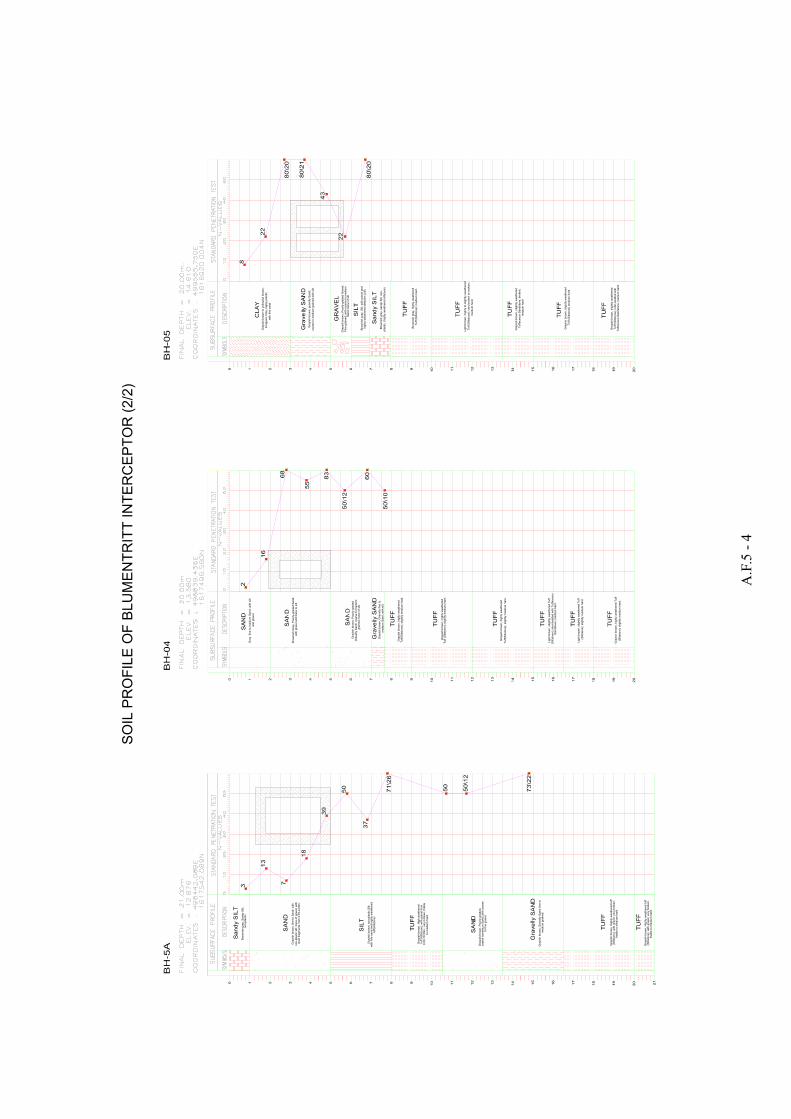
A.F
.5 -
4
Bro
wn
ish
Gra
y, P
oorl
y-g
rad
ed S
and
; w
ith
gra
ve
l an
d tra
ce
to s
ilt
Gra
y
fine
to
med
ium
Sa
nd
; w
ith s
ilta
nd
gra
vel
Gra
yis
h b
row
n;
Poo
rly-g
rad
ed
Gra
ve
lly S
and
; co
ars
e t
o m
edu
im
gra
ine
d;
trace
of
silt
.
Gra
yis
h b
row
n; G
rave
lly f
ine t
o
med
ium
Sa
nd
; w
ith s
ilt
Gra
yis
h b
row
n,
hig
hly
we
ath
ere
d
Tu
ff(S
iltsto
ne
); s
lightly m
ed
ium
ha
rd.
Gra
yis
h b
row
n,
hig
hly
wea
the
red
Tuff
(S
iltsto
ne);
slig
htly m
ediu
m h
ard
.
Gra
yis
h b
row
n,
hig
hly
we
ath
ere
d
Tuff
(Silt
sto
ne
); s
ligh
tly m
ed
ium
hard
.
Lig
ht b
row
n, slig
htly w
ea
there
d T
uff
(Silt
sto
ne);
in
ter-
bed
ded
with T
uff
ace
ou
s
Lig
ht
bro
wn,
slig
htly w
ea
the
red
Tuff
(Silt
sto
ne
); s
ligh
tly m
ed
ium
ha
rd.
San
dsto
ne;
me
diu
m h
ard
.
Gra
yis
h b
row
n, h
igh
ly w
ea
there
d T
uff
(Silt
sto
ne);
slig
htly m
ed
ium
hard
.
Gra
yis
h b
row
n t
o y
ello
wis
h b
row
n,
Ino
rgan
ic C
lay,
hig
hly
pla
stic;
with
fin
e s
and
.
Gra
yis
h b
row
n; g
rave
lly S
and
;
coa
rse t
o m
ediu
m g
rain
ed w
ith
silt
.
Gra
yis
h b
row
n;
Poo
rly-g
rad
ed
Gra
ve
l;
Fin
e g
rain
ed
; w
ith c
oars
e t
o m
ediu
m
Sa
nd
; tr
ace o
f silt
Bro
wn
ish g
ray,
Silt
; w
ith g
rave
l an
d
hig
hly
we
ath
ere
d s
iltsto
ne (
tuff).
Bro
wn
ish
gra
y,
sa
ndy S
ilt; n
on-
pla
stic;
(hig
hly
we
ath
ere
d s
iltsto
ne).
Bro
wn
ish g
ray,
hig
hly
we
ath
ere
d
Tu
ff (
Silt
sto
ne
); m
ed
ium
ha
rd.
Lig
ht b
row
n, h
igh
ly to
slig
htly w
ea
the
red
Tu
ff (
Silt
sto
ne
); v
ery
bro
ke
n t
o b
roken
;
me
diu
m h
ard
.
Gra
yis
h b
row
n, slig
htly w
ea
the
red
Tu
ffa
ce
ou
s S
and
sto
ne
; b
roke
n;
med
uim
ha
rd
Gra
yis
h b
row
n,
slig
htly w
ea
the
red
Tu
ff (
Silt
sto
ne
) m
ediu
m h
ard
Gra
yis
h b
row
n, slig
htly w
ea
the
red
Tu
ff (
Silt
sto
ne
); in
ter-
be
dde
d w
ith
Tuff
aceo
us S
and
sto
ne;
med
ium
hard
.
Bro
wn
ish g
ray,
Sa
nd
y S
ilt,
Gra
yis
h b
row
n,
fine
to S
and
; w
ith
non
-pla
stic s
ilt;
tra
ce
of
gra
vel; w
ith
sh
ell
frag
me
nts
fro
m 2
.55
-4.0
0m
.
Gra
yis
h b
row
n, n
on-p
lastic S
ilt;
with
fin
e s
an
d a
nd h
igh
ly w
ea
the
red
Gra
yis
h b
row
n,
Hig
h w
ea
there
d
tuff (
Silt
sto
ne
); w
ith
gra
vel fr
om
9
.00
-10
.50m
.; v
ery
bro
ken
; fr
iab
le
Gra
yis
h b
row
n,
Poo
rly-g
rade
d,
coa
rse
to
me
diu
m S
an
d;
with
co
ars
e
Gra
yis
h b
row
n, G
ravelly
Sa
nd;
fin
e t
om
ediu
m g
rain
ed.
Gra
yis
h b
row
n, H
igh
ly w
ea
there
d tu
ff(S
iltsto
ne);
with
gra
ve
l; v
ery
bro
ke
n;
fria
ble
to m
ed
ium
hard
.
Gra
yis
h b
row
n,
Hig
hly
we
ath
ere
d t
uff
(Silt
sto
ne);
with
gra
ve
l; v
ery
bro
ke
n;
fria
ble
to m
ed
ium
hard
.
no
n-p
lastic.
tuff
(silt
sto
ne)
to m
ediu
m h
ard
.
to fin
e g
rave
l.
SO
IL P
RO
FIL
E O
F B
LU
ME
NT
RIT
T IN
TE
RC
EP
TO
R (
2/2
)
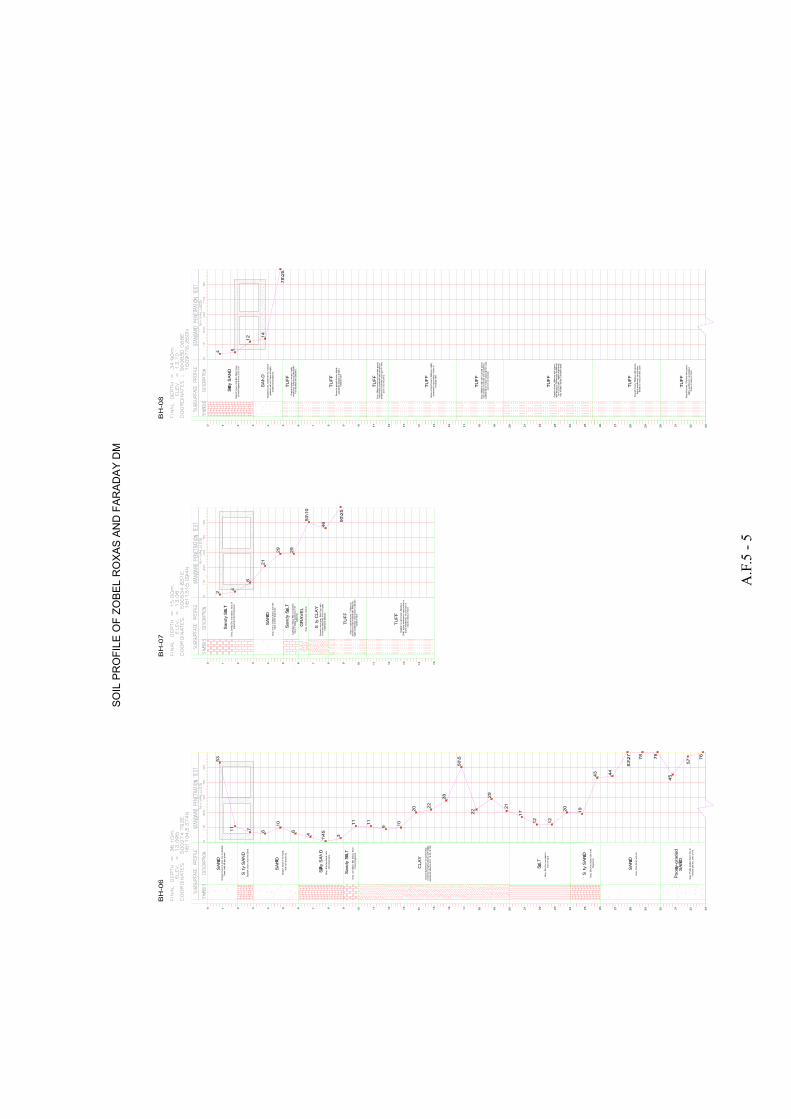
A.F
.5 -
5
Gra
yis
h b
row
n to
gra
y,
fine
to m
ediu
m
Sa
nd
, w
ith
silt
and
gra
vel
Gra
yis
h b
row
n,
Silt
y f
ine
Sa
nd
Gra
yis
h b
row
n, F
ine
San
d,
with
no
n-p
lastic s
ilt.
Gra
y,
no
n-p
lastic S
ilt;
Sa
nd
y;
tra
ce
Gra
y,
Silt
y f
ine S
and
; w
ith
of sh
ell
frag
men
ts
Gra
y to
lig
ht
bro
wn
, in
org
an
id C
lay;
mod
era
te t
o h
igh
ly p
lastic;
with
hig
hly
we
ath
ere
d s
iltsto
ne
fro
m 1
6.5
5-1
6.7
5m
.
Gra
y,
Silt
y f
ine
non
-pla
stic;
Gra
y,
Silt
y f
ine
San
d; w
ith s
he
ll fr
agm
en
ts.
Gra
y, F
ine
San
d; w
ith
silt
.
Gra
y,
Po
orly-g
rad
ed
Sa
nd
; fin
e t
o
me
diu
m g
rain
ed
; tr
ace
of silt
.
Gra
y,
Sa
nd
y S
ilt;
non
-pla
stic;
tra
ce
of
gra
ve
l a
nd
sh
ell
frag
men
ts
Gra
y,
fin
e t
o m
ed
ium
Sa
nd
; w
ith
silt
;tr
ace
of
sh
ell
frag
me
nts
.
Lig
ht g
ray,
Sa
nd
y S
ilt;
no
n-p
lastic;
trace
of h
igh
ly w
ea
there
d T
uff
Gra
y,
Gra
ve
l; t
race
of
san
d.
Bro
wn
to
da
rk g
ray,
Silt
y C
lay; w
ith
mo
de
rate
pla
sticity;
trace o
f hig
hly
w
eath
ere
d s
iltsto
ne
Gra
y t
o r
edd
ish
bro
wn
, T
uff
ace
ous
San
dsto
ne
inte
r-b
ed
de
d w
ith
Silt
sto
ne
; hig
hly
wea
there
d;
very
bro
ken
to b
roke
n
med
ium
ha
rd.
Red
dis
h t
o lig
ht
bro
wn,
Silt
sto
ne
(Tuff
), h
ighly
we
ath
ere
d; ve
ry b
roken
to
hig
hly
wea
the
red
; very
bro
ke
n t
o
bro
ke
n;
me
diu
m h
ard
.
Gra
y t
o b
row
n,
Silt
y f
ine S
and
; tr
ace
o
f sh
ell
frag
men
ts f
rom
2.5
5-3
.00
Gra
yis
h b
row
n, S
and
; fin
e to
med
ium
gria
ned
; w
ith s
ilt;
trace
to h
igh
ly
we
ath
ere
d S
and
sto
ne
.
Gra
yis
h b
row
n t
o b
row
n;
hig
hly
w
ea
the
red T
uff
ace
ou
s S
an
dsto
ne
inte
r-b
ed
ded
with S
iltsto
ne.
Bro
wn
to
gra
yis
h b
row
n;
hig
hly
we
ath
ere
d b
roken
to
bro
ken
;
Gra
y,
Silt
sto
ne w
ith s
ub-r
oun
ded
gra
vel;
very
wea
kly
cem
en
ted a
nd c
om
ple
tely
we
ath
ere
d s
ilt m
atr
ix r
esultin
g f
rom
ve
ryp
oor
or
no
re
co
very
Gra
y,
Silt
sto
ne w
ith
su
b-r
ou
nd
ed
gra
ve
l;ve
ry w
eakly
cem
en
ted a
nd
co
mp
lete
lyw
eath
ere
d s
ilt m
atr
ix r
esultin
g f
rom
ve
ryp
oo
r or
no r
ecove
ry
Bro
wn
to lig
ht b
row
n;
Silt
sto
ne
; h
ighly
w
eath
ere
d; ve
ry b
roke
n;
fria
ble
to
me
diu
m h
ard
Gra
yis
h b
row
n,
Silt
sto
ne
with g
ravel;
with
lenses o
f T
uff
ace
ou
s S
an
dsto
ne
fro
m 2
2.5
0-2
4m
.; h
ighly
we
ath
ere
d;
ve
ry b
roken
; fr
iable
to m
ediu
m h
ard
.
Gra
yis
h b
row
n,
Silt
sto
ne w
ith
gra
vel;
hig
hly
wea
there
d;
very
bro
ken
; fr
iab
le t
o m
ed
ium
ha
rd.
(SM
)
Gra
yis
h b
row
n,
Silt
sto
ne w
ith g
ravel;
hig
hly
we
ath
ere
d;
ve
ry b
roke
n;
fria
ble
to
med
ium
hard
.
she
ll fr
ag
men
ts.
tra
ce o
f san
d
(silt
sto
ne)
med
ium
hard
SO
IL P
RO
FIL
E O
F Z
OB
EL
RO
XA
S A
ND
FA
RA
DA
Y D
M
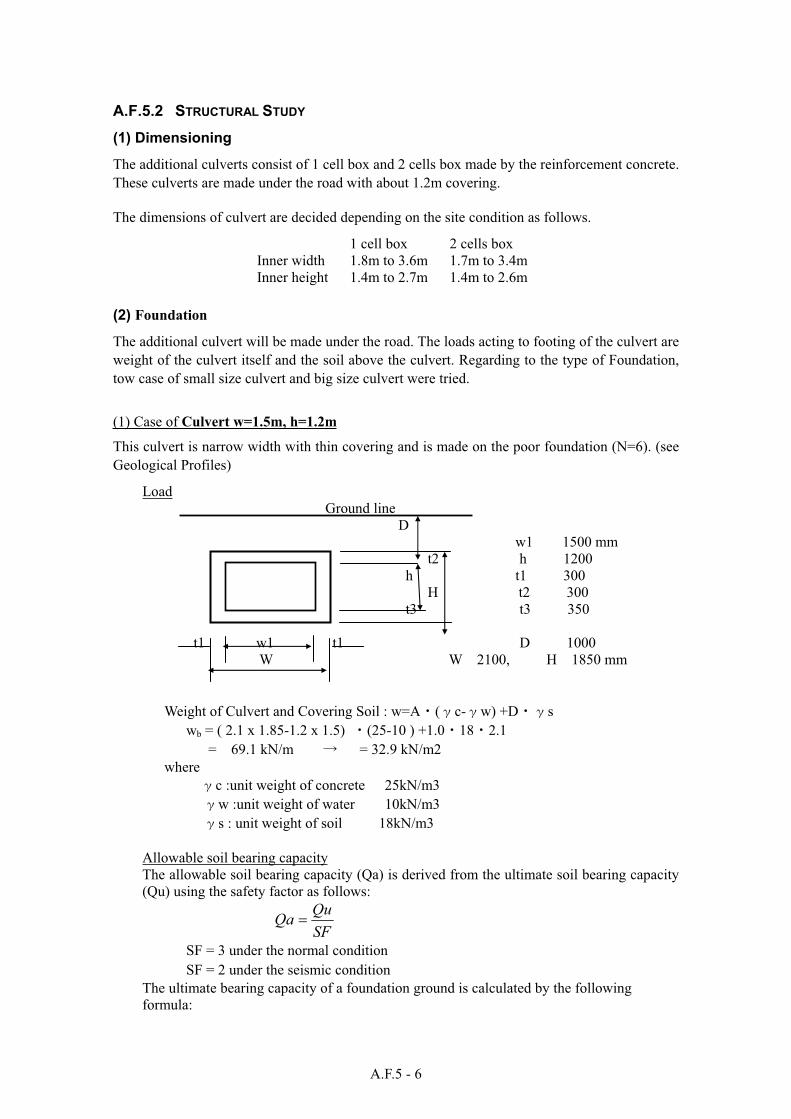
A.F.5 - 6
A.F.5.2 STRUCTURAL STUDY
(1) Dimensioning
The additional culverts consist of 1 cell box and 2 cells box made by the reinforcement concrete.
These culverts are made under the road with about 1.2m covering.
The dimensions of culvert are decided depending on the site condition as follows.
1 cell box 2 cells box
Inner width 1.8m to 3.6m 1.7m to 3.4m
Inner height 1.4m to 2.7m 1.4m to 2.6m
(2) Foundation
The additional culvert will be made under the road. The loads acting to footing of the culvert are
weight of the culvert itself and the soil above the culvert. Regarding to the type of Foundation,
tow case of small size culvert and big size culvert were tried.
(1) Case of Culvert w=1.5m, h=1.2m
This culvert is narrow width with thin covering and is made on the poor foundation (N=6). (see
Geological Profiles)
Load
Ground line
D
w1 1500 mm
t2 h 1200
h t1 300
H t2 300
t3 t3 350
t1 w1 t1 D 1000
W W 2100, H 1850 mm
Weight of Culvert and Covering Soil : w=A ( c- w) +D s
wb = ( 2.1 x 1.85-1.2 x 1.5) (25-10 ) +1.0 18 2.1
= 69.1 kN/m = 32.9 kN/m2
where
c :unit weight of concrete 25kN/m3
w :unit weight of water 10kN/m3
s : unit weight of soil 18kN/m3
Allowable soil bearing capacity
The allowable soil bearing capacity (Qa) is derived from the ultimate soil bearing capacity
(Qu) using the safety factor as follows:
SF
QuQa
SF = 3 under the normal condition
SF = 2 under the seismic condition
The ultimate bearing capacity of a foundation ground is calculated by the following
formula:
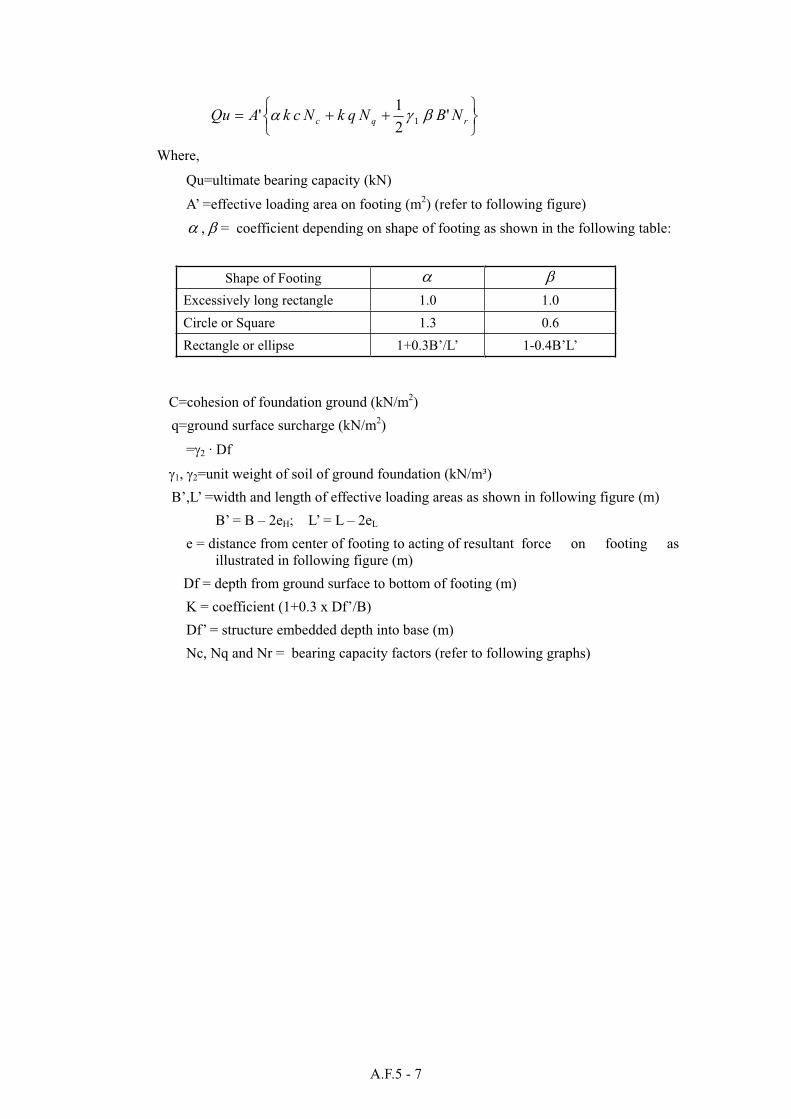
A.F.5 - 7
rqc NBNqkNckAQu '2
1' 1
Where,
Qu=ultimate bearing capacity (kN)
A’ =effective loading area on footing (m2) (refer to following figure)
, = coefficient depending on shape of footing as shown in the following table:
Shape of Footing
Excessively long rectangle 1.0 1.0
Circle or Square 1.3 0.6
Rectangle or ellipse 1+0.3B’/L’ 1-0.4B’L’
C=cohesion of foundation ground (kN/m2)
q=ground surface surcharge (kN/m2)
= 2 · Df
1, 2=unit weight of soil of ground foundation (kN/m³)
B’,L’ =width and length of effective loading areas as shown in following figure (m)
B’ = B – 2eH; L’ = L – 2eL
e = distance from center of footing to acting of resultant force on footing as
illustrated in following figure (m)
Df = depth from ground surface to bottom of footing (m)
K = coefficient (1+0.3 x Df’/B)
Df’ = structure embedded depth into base (m)
Nc, Nq and Nr = bearing capacity factors (refer to following graphs)
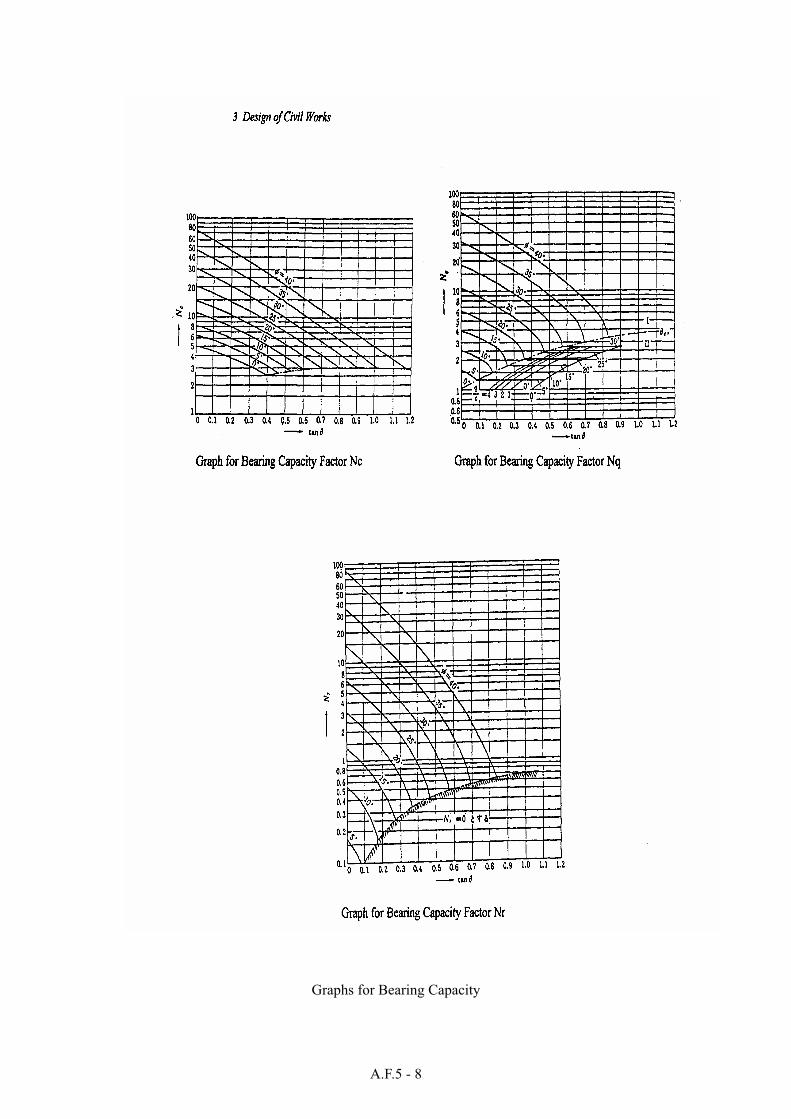
A.F.5 - 8
Graphs for Bearing Capacity
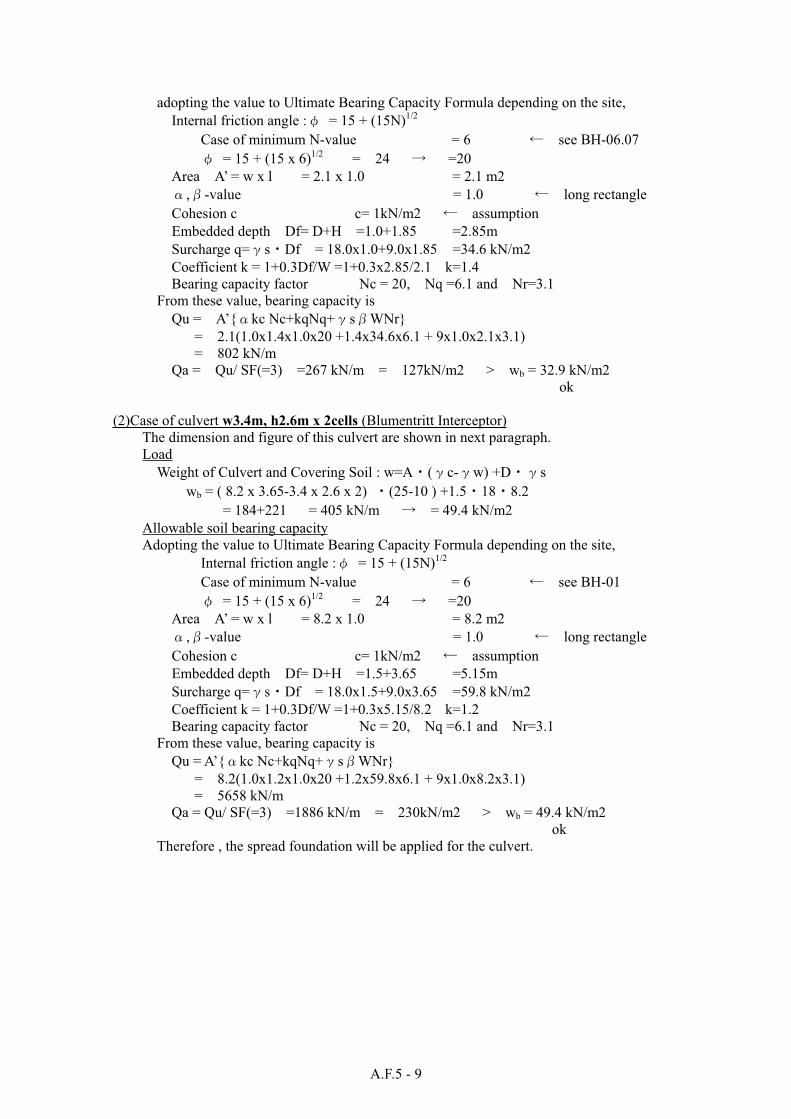
A.F.5 - 9
adopting the value to Ultimate Bearing Capacity Formula depending on the site,
Internal friction angle : = 15 + (15N)1/2
Case of minimum N-value = 6 see BH-06.07
= 15 + (15 x 6)1/2 = 24 =20
Area A’ = w x l = 2.1 x 1.0 = 2.1 m2
, -value = 1.0 long rectangle
Cohesion c c= 1kN/m2 assumption
Embedded depth Df= D+H =1.0+1.85 =2.85m
Surcharge q= s Df = 18.0x1.0+9.0x1.85 =34.6 kN/m2
Coefficient k = 1+0.3Df/W =1+0.3x2.85/2.1 k=1.4
Bearing capacity factor Nc = 20, Nq =6.1 and Nr=3.1
From these value, bearing capacity is
Qu = A’{ kc Nc+kqNq+ s WNr}
= 2.1(1.0x1.4x1.0x20 +1.4x34.6x6.1 + 9x1.0x2.1x3.1)
= 802 kN/m
Qa = Qu/ SF(=3) =267 kN/m = 127kN/m2 > wb = 32.9 kN/m2
ok
(2)Case of culvert w3.4m, h2.6m x 2cells (Blumentritt Interceptor)
The dimension and figure of this culvert are shown in next paragraph.
Load
Weight of Culvert and Covering Soil : w=A ( c- w) +D s
wb = ( 8.2 x 3.65-3.4 x 2.6 x 2) (25-10 ) +1.5 18 8.2
= 184+221 = 405 kN/m = 49.4 kN/m2
Allowable soil bearing capacity
Adopting the value to Ultimate Bearing Capacity Formula depending on the site,
Internal friction angle : = 15 + (15N)1/2
Case of minimum N-value = 6 see BH-01
= 15 + (15 x 6)1/2 = 24 =20
Area A’ = w x l = 8.2 x 1.0 = 8.2 m2
, -value = 1.0 long rectangle
Cohesion c c= 1kN/m2 assumption
Embedded depth Df= D+H =1.5+3.65 =5.15m
Surcharge q= s Df = 18.0x1.5+9.0x3.65 =59.8 kN/m2
Coefficient k = 1+0.3Df/W =1+0.3x5.15/8.2 k=1.2
Bearing capacity factor Nc = 20, Nq =6.1 and Nr=3.1
From these value, bearing capacity is
Qu = A’{ kc Nc+kqNq+ s WNr}
= 8.2(1.0x1.2x1.0x20 +1.2x59.8x6.1 + 9x1.0x8.2x3.1)
= 5658 kN/m
Qa = Qu/ SF(=3) =1886 kN/m = 230kN/m2 > wb = 49.4 kN/m2
ok
Therefore , the spread foundation will be applied for the culvert.
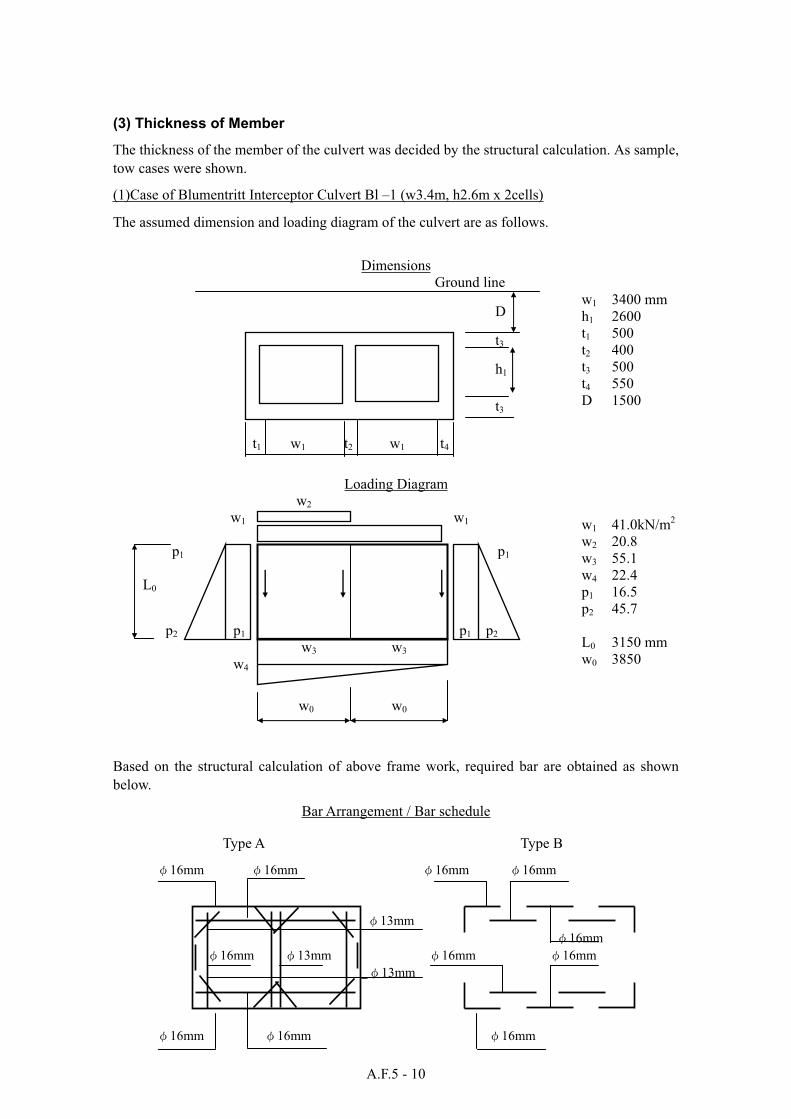
A.F.5 - 10
(3) Thickness of Member
The thickness of the member of the culvert was decided by the structural calculation. As sample,
tow cases were shown.
(1)Case of Blumentritt Interceptor Culvert Bl –1 (w3.4m, h2.6m x 2cells)
The assumed dimension and loading diagram of the culvert are as follows.
Dimensions
Ground line
Loading Diagram
Based on the structural calculation of above frame work, required bar are obtained as shown
below.
Bar Arrangement / Bar schedule
Type A Type B
D
t3
h1
t3
t1 w1 t2 w1 t4
w1 3400 mm
h1 2600
t1 500
t2 400
t3 500
t4 550
D 1500
w1 41.0kN/m2
w2 20.8
w3 55.1
w4 22.4
p1 16.5
p2 45.7
L0 3150 mm
w0 3850
w2
w1 w1
p1 p1
L0
p2 p1 p1 p2
w3 w3
w4
w0 w0
16mm 16mm 16mm 16mm
13mm
16mm
16mm 13mm 16mm 16mm
13mm
16mm 16mm 16mm
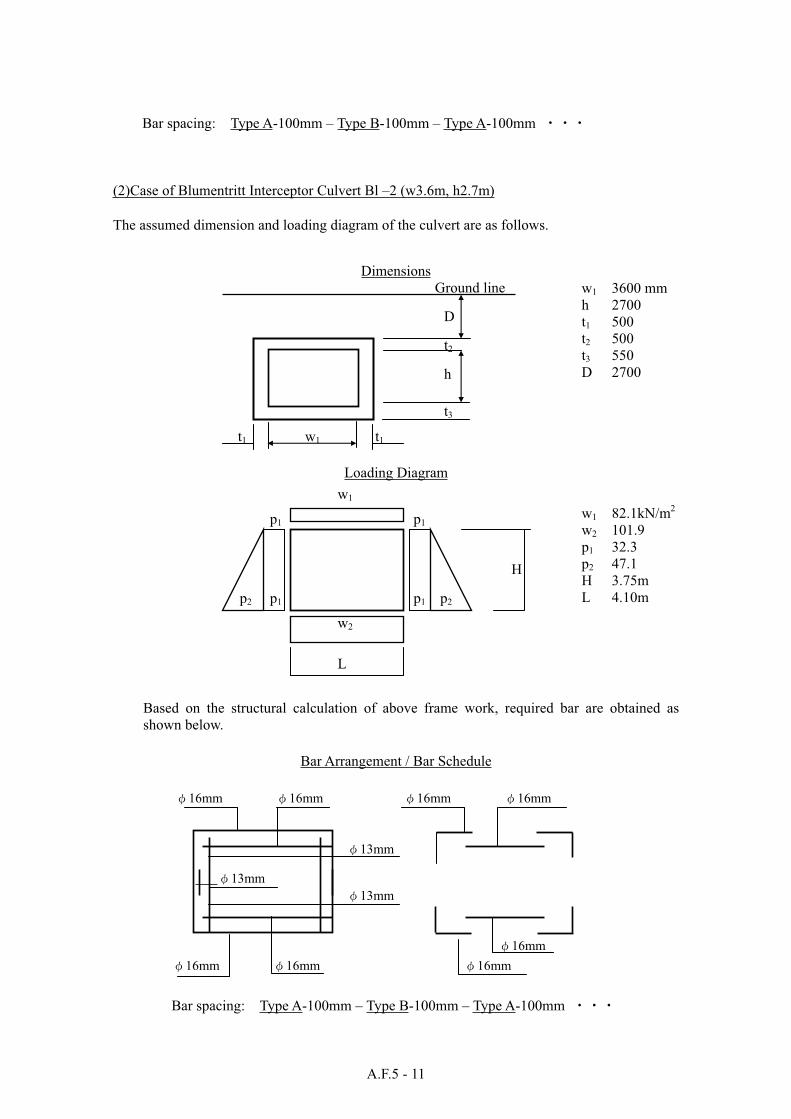
A.F.5 - 11
Bar spacing: Type A-100mm – Type B-100mm – Type A-100mm
(2)Case of Blumentritt Interceptor Culvert Bl –2 (w3.6m, h2.7m)
The assumed dimension and loading diagram of the culvert are as follows.
Dimensions
Ground line
Loading Diagram
Based on the structural calculation of above frame work, required bar are obtained as
shown below.
Bar Arrangement / Bar Schedule
Bar spacing: Type A-100mm – Type B-100mm – Type A-100mm
D
t2
h
t3
t1 w1 t1
w1 3600 mm
h 2700
t1 500
t2 500
t3 550
D 2700
w1 82.1kN/m2
w2 101.9
p1 32.3
p2 47.1
H 3.75m
L 4.10m
w1
p1 p1
H
p2 p1 p1 p2
w2
L
16mm 16mm 16mm 16mm
13mm
13mm
13mm
16mm
16mm 16mm 16mm
G - i
G. COST ESTIMATE
G - ii
TABLE OF CONTENTS
Page
G.1 GENERAL ................................................................................................................. G - 1
G.2 COST ESTIMATE FOR MASTER PLAN PROJECTS ...................................................... G - 1
G.2.1 Major Works and Phasing of Master Plan projects ................................................. G - 1
G.2.2 Cost Estimate for Master Plan Projects................................................................... G - 3
G.3 COST ESTIMATE FOR PRIORITY PROJECTS ............................................................ G - 15
G.3.1 Objective Works of Priority Projects .................................................................... G - 15
G.3.2 Packaging and Construction Schedule of Objective Works.................................. G - 16
G.3.3 Cost Estimate for Priority Projects........................................................................ G - 18
Annex G.1 COST ESTIMATE FOR WORKS PROPOSED IN MASTER PLAN
Annex G.2 UNIT PRICE FOR MAJOR WORKS OF PRIORITY PROJECTS
Annex G.3 COST ESTIMATE FOR RESPECTIVE REHABILITATION AND ADDITIONAL WORKS OF
PRIORITY PROJECTS
LIST OF TABLES
Page
Table G.2.1 Unit Price for Major Works............................................................................. G - 6
Table G.2.2 Direct Construction Cost by Phases ................................................................ G - 7
Table G.2.3 Land Acquisition Cost for Resettlement Site .................................................. G - 8
Table G.2.4 Unit Cost for Acquisition for Resettlement Site.............................................. G - 9
Table G.2.5 Resettlement Cost............................................................................................ G - 9
Table G.2.6 Compensation Cost for Additional Works (1st Phase)................................ G - 10
Table G.2.7 Cost for BEM and Team ESTERO Activities and IEC Campaign ............... G - 10
Table G.2.8 Cost for BEM and Team ESTERO Activities................................................. G - 11
Table G.2.9 Cost for Information, Education and Communication Campaign................. G - 12
Table G.2.10 Cost for Equipment and Facilities for Effective Operation
and Maintenance ........................................................................................... G - 13
Table G.2.11 Detailed Cost for Equipment and Facilities .................................................... G - 14
Table G.2.12 Project Cost for Master Plan Projects.............................................................. G - 15
Table G.3.1 Unit Price of Major Works............................................................................ G - 20
Table G.3.2 Civil Works Costs of Respective Works....................................................... G - 21
Table G.3.3 Compensation Cost for Additional Works .................................................... G - 22
Table G.3.4 Project Cost for Priority Projects................................................................... G - 24

G - iii
LIST OF FIGURES
Page
Figure G.2.1 Preliminary Construction Schedule of Master Plan ...................................... G - 4
Figure G.3.1 Construction Time Schedule ....................................................................... G - 18
Figure G.3.2 Location of Dumping Site ........................................................................... G - 19
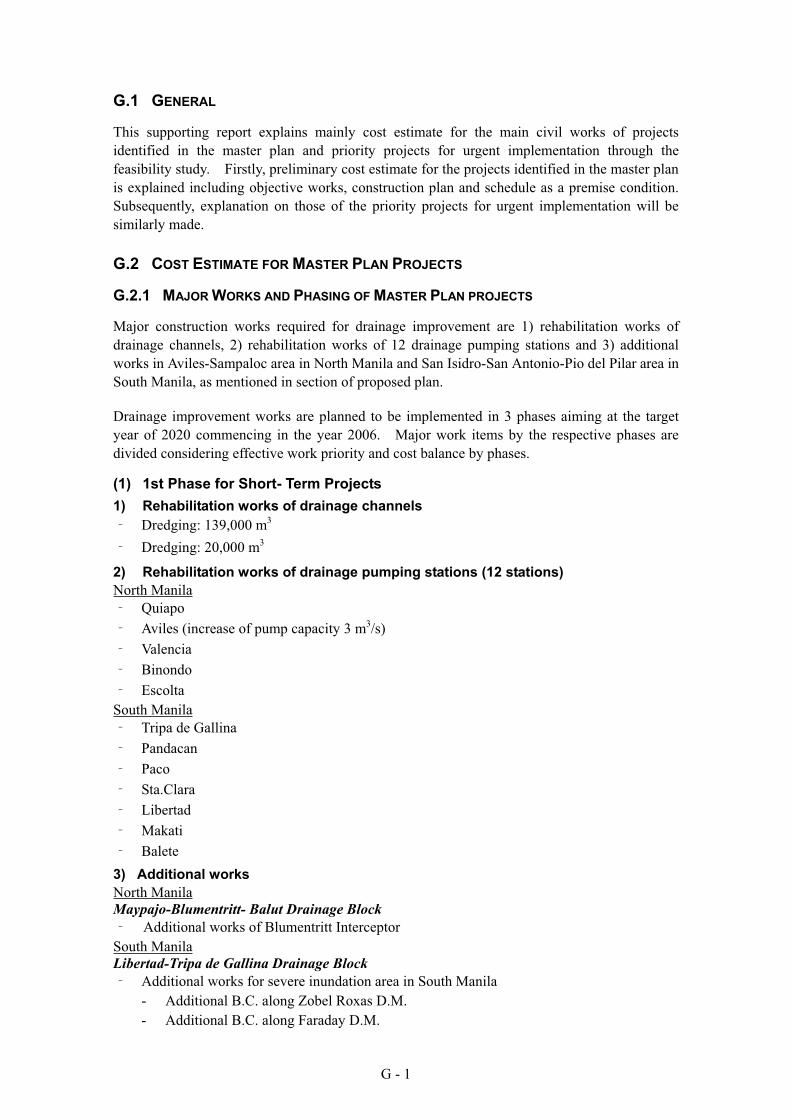
G - 1
G.1 GENERAL
This supporting report explains mainly cost estimate for the main civil works of projects
identified in the master plan and priority projects for urgent implementation through the
feasibility study. Firstly, preliminary cost estimate for the projects identified in the master plan
is explained including objective works, construction plan and schedule as a premise condition.
Subsequently, explanation on those of the priority projects for urgent implementation will be
similarly made.
G.2 COST ESTIMATE FOR MASTER PLAN PROJECTS
G.2.1 MAJOR WORKS AND PHASING OF MASTER PLAN PROJECTS
Major construction works required for drainage improvement are 1) rehabilitation works of
drainage channels, 2) rehabilitation works of 12 drainage pumping stations and 3) additional
works in Aviles-Sampaloc area in North Manila and San Isidro-San Antonio-Pio del Pilar area in
South Manila, as mentioned in section of proposed plan.
Drainage improvement works are planned to be implemented in 3 phases aiming at the target
year of 2020 commencing in the year 2006. Major work items by the respective phases are
divided considering effective work priority and cost balance by phases.
(1) 1st Phase for Short- Term Projects
1) Rehabilitation works of drainage channels
Dredging: 139,000 m3
Dredging: 20,000 m3
2) Rehabilitation works of drainage pumping stations (12 stations)
North Manila
Quiapo
Aviles (increase of pump capacity 3 m3/s)
Valencia
Binondo
Escolta
South Manila
Tripa de Gallina
Pandacan
Paco
Sta.Clara
Libertad
Makati
Balete
3) Additional works
North Manila
Maypajo-Blumentritt- Balut Drainage Block
Additional works of Blumentritt Interceptor
South Manila
Libertad-Tripa de Gallina Drainage Block
Additional works for severe inundation area in South Manila
- Additional B.C. along Zobel Roxas D.M.
- Additional B.C. along Faraday D.M.
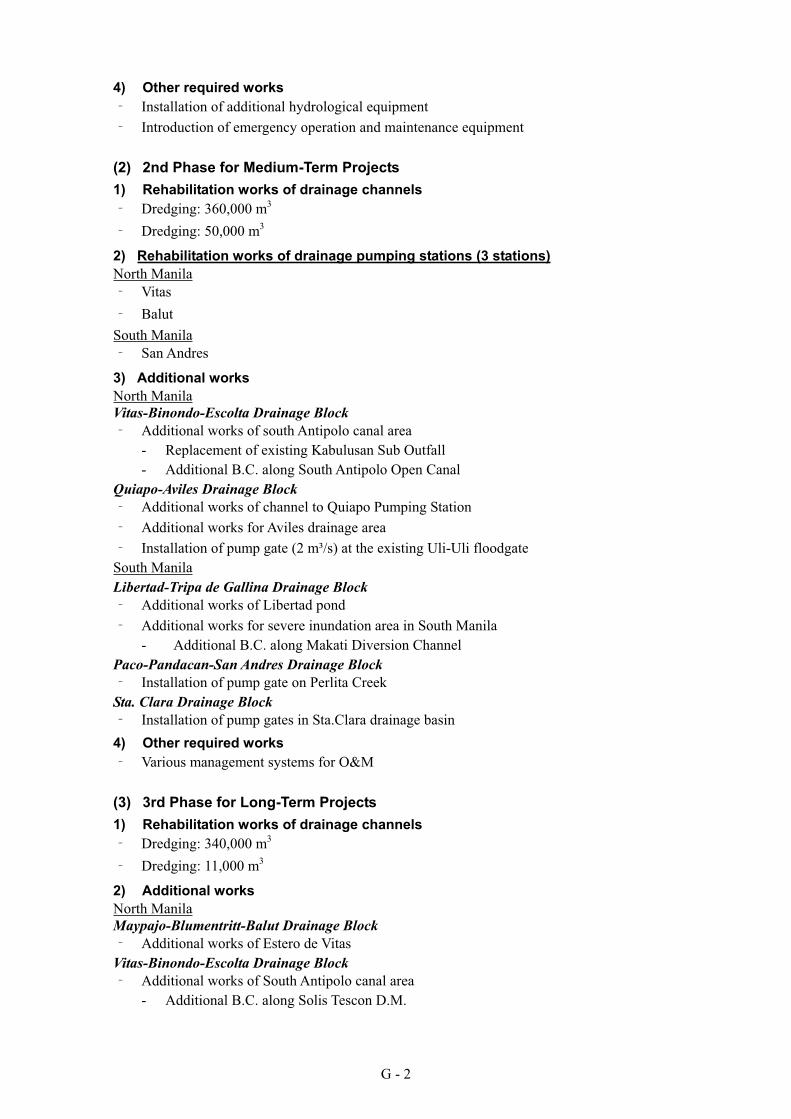
G - 2
4) Other required works
Installation of additional hydrological equipment
Introduction of emergency operation and maintenance equipment
(2) 2nd Phase for Medium-Term Projects
1) Rehabilitation works of drainage channels
Dredging: 360,000 m3
Dredging: 50,000 m3
2) Rehabilitation works of drainage pumping stations (3 stations)
North Manila
Vitas
Balut
South Manila
San Andres
3) Additional works
North Manila
Vitas-Binondo-Escolta Drainage Block
Additional works of south Antipolo canal area
- Replacement of existing Kabulusan Sub Outfall
- Additional B.C. along South Antipolo Open Canal
Quiapo-Aviles Drainage Block
Additional works of channel to Quiapo Pumping Station
Additional works for Aviles drainage area
Installation of pump gate (2 m³/s) at the existing Uli-Uli floodgate
South Manila
Libertad-Tripa de Gallina Drainage Block
Additional works of Libertad pond
Additional works for severe inundation area in South Manila
- Additional B.C. along Makati Diversion Channel
Paco-Pandacan-San Andres Drainage Block
Installation of pump gate on Perlita Creek
Sta. Clara Drainage Block
Installation of pump gates in Sta.Clara drainage basin
4) Other required works
Various management systems for O&M
(3) 3rd Phase for Long-Term Projects
1) Rehabilitation works of drainage channels
Dredging: 340,000 m3
Dredging: 11,000 m3
2) Additional works
North Manila
Maypajo-Blumentritt-Balut Drainage Block
Additional works of Estero de Vitas
Vitas-Binondo-Escolta Drainage Block
Additional works of South Antipolo canal area
- Additional B.C. along Solis Tescon D.M.
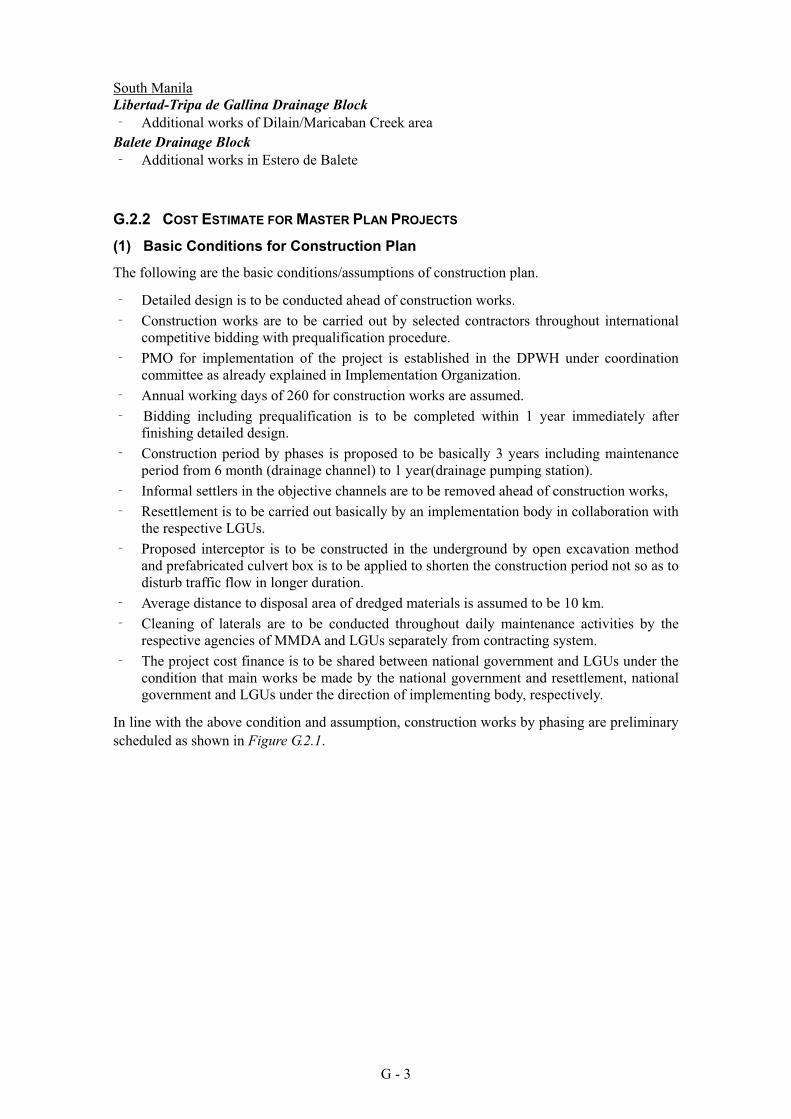
G - 3
South Manila
Libertad-Tripa de Gallina Drainage Block
Additional works of Dilain/Maricaban Creek area
Balete Drainage Block
Additional works in Estero de Balete
G.2.2 COST ESTIMATE FOR MASTER PLAN PROJECTS
(1) Basic Conditions for Construction Plan
The following are the basic conditions/assumptions of construction plan.
Detailed design is to be conducted ahead of construction works.
Construction works are to be carried out by selected contractors throughout international
competitive bidding with prequalification procedure.
PMO for implementation of the project is established in the DPWH under coordination
committee as already explained in Implementation Organization.
Annual working days of 260 for construction works are assumed.
Bidding including prequalification is to be completed within 1 year immediately after
finishing detailed design.
Construction period by phases is proposed to be basically 3 years including maintenance
period from 6 month (drainage channel) to 1 year(drainage pumping station).
Informal settlers in the objective channels are to be removed ahead of construction works,
Resettlement is to be carried out basically by an implementation body in collaboration with
the respective LGUs.
Proposed interceptor is to be constructed in the underground by open excavation method
and prefabricated culvert box is to be applied to shorten the construction period not so as to
disturb traffic flow in longer duration.
Average distance to disposal area of dredged materials is assumed to be 10 km.
Cleaning of laterals are to be conducted throughout daily maintenance activities by the
respective agencies of MMDA and LGUs separately from contracting system.
The project cost finance is to be shared between national government and LGUs under the
condition that main works be made by the national government and resettlement, national
government and LGUs under the direction of implementing body, respectively.
In line with the above condition and assumption, construction works by phasing are preliminary
scheduled as shown in Figure G.2.1.
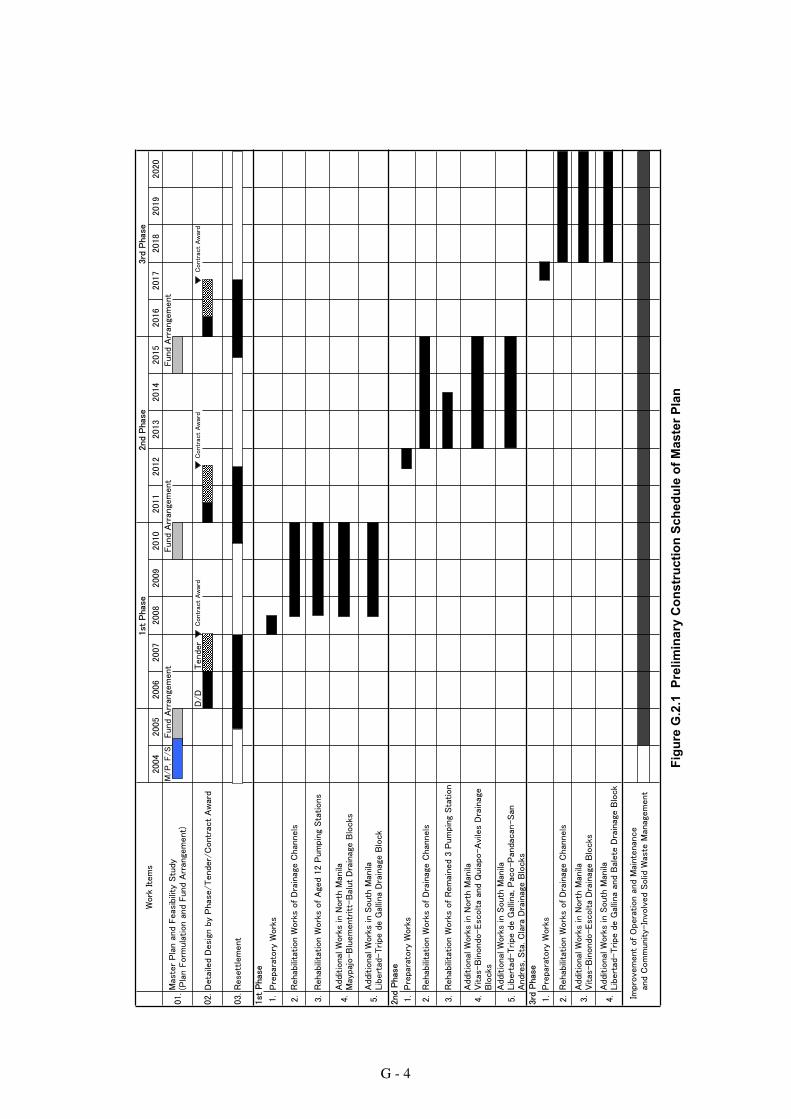
Fig
ure
G.2
.1 P
relim
inary
Co
nstr
ucti
on
Sch
ed
ule
of
Maste
r P
lan
G - 4
G - 5
(2) Basic Conditions for Cost Estimate
The project cost consists of costs of main works, compensation, engineering services,
administration by government staff, and contingency. The following are the basic conditions
of cost estimate.
Unit cost is estimated referring to the recent unit prices obtained from DPWH and similar
projects in Metropolitan Manila.
Price level is July 2004 with exchange rate of US1$=Pesos 55 = JY 110.
Classification of local and foreign currencies is assumed as follows.
Local currency portion (L/C)
Labor cost
Cost locally available materials
Inland transportation cost for materials to be imported
Value added tax
Government administration cost
Resettlement cost
Local portion of engineering services cost
Contingency for local portion
Foreign currency portion (F/C)
Cost of materials and facilities to be imported
Depreciation cost of construction equipment
Foreign portion of engineering services cost
Contingency for foreign portion
The following ratio of F/C and L/C are assumed considering actual ratios adopted in the
similar drainage projects in Metropolitan Manila.
Rehabilitation and additional works for drainage channels:
F/C (65 %) : L/C (35 %)
Rehabilitation and additional works of drainage pumping stations:
F/C (70 %) : L/C (30 %)
G - 6
(3) Applied Unit Cost
As already explained, the unit price for works is estimated referring to the recent unit prices
obtained from DPWH and similar ongoing projects in Metropolitan Manila. The major
applied unit prices are summarized in Table G.2.1.
Table G.2.1 Unit Price for Major Works
Work Item Unit Unit Price (peso)
Dredging of open channel m3 1,200
Declogging of closed channel(box
culvert)
m3 1,650
Excavation (exclude wall by steel sheet
piling)
m3 572
Backfill m3 514
Steel sheet piling for excavation works m2 3,200
Concrete m3 5,140
Reinforced bar ton 29,500
Repair/replace of pump equipment and
appurtenant facilities LS -
Improvement of bridge m2 60,000
Pump gate m3/s 80,000,000
(4) Direct Construction Cost
Table G.2.2 shows work quantity, unit price and direct construction cost of master plan projects
by phases. The detailed cost estimate is shown in Annex G.1. The total direct construction
cost is estimated at Php 8.2 billion and broken down into the following respective phases.
1st phase: Php 3,258.8 million
2nd phase: Php 2,839.5 million
3rd phase: Php 2,134.1 million
Total direct cost: Php 8,232.4 million
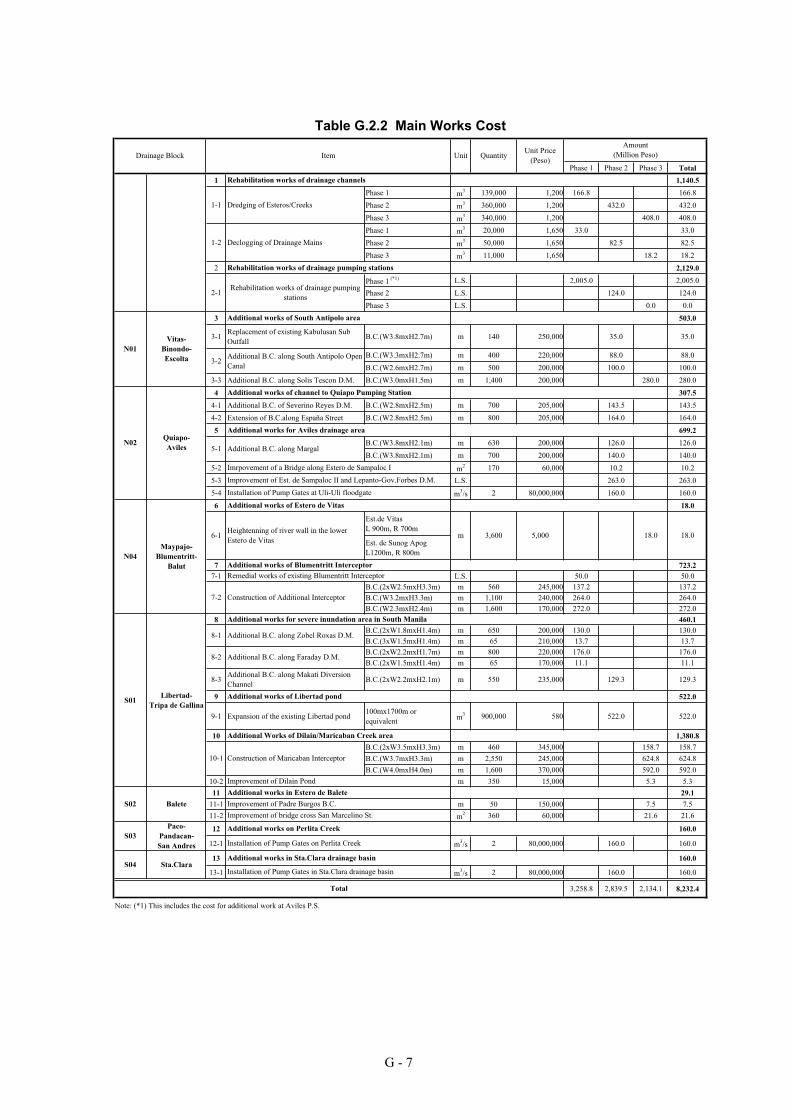
Phase 1 Phase 2 Phase 3 Total
1 1,140.5
Phase 1 m3 139,000 1,200 166.8 166.8
Phase 2 m3 360,000 1,200 432.0 432.0
Phase 3 m3 340,000 1,200 408.0 408.0
Phase 1 m3 20,000 1,650 33.0 33.0
Phase 2 m3 50,000 1,650 82.5 82.5
Phase 3 m3 11,000 1,650 18.2 18.2
2 2,129.0
Phase 1 (*1) L.S. 2,005.0 2,005.0
Phase 2 L.S. 124.0 124.0
Phase 3 L.S. 0.0 0.0
3 503.0
3-1Replacement of existing Kabulusan Sub
OutfallB.C.(W3.8mxH2.7m) m 140 250,000 35.0 35.0
B.C.(W3.3mxH2.7m) m 400 220,000 88.0 88.0
B.C.(W2.6mxH2.7m) m 500 200,000 100.0 100.0
3-3 Additional B.C. along Solis Tescon D.M. B.C.(W3.0mxH1.5m) m 1,400 200,000 280.0 280.0
4 307.5
4-1 Additional B.C. of Severino Reyes D.M. B.C.(W2.8mxH2.5m) m 700 205,000 143.5 143.5
4-2 Extension of B.C.along España Street B.C.(W2.8mxH2.5m) m 800 205,000 164.0 164.0
5 699.2
B.C.(W3.8mxH2.1m) m 630 200,000 126.0 126.0
B.C.(W3.8mxH2.1m) m 700 200,000 140.0 140.0
5-2 m2 170 60,000 10.2 10.2
5-3 L.S. 263.0 263.0
5-4 m3/s 2 80,000,000 160.0 160.0
6 18.0
Est.de Vitas
L 900m, R 700m
Est. de Sunog Apog
L1200m, R 800m
7 723.2
7-1 L.S. 50.0 50.0
B.C.(2xW2.5mxH3.3m) m 560 245,000 137.2 137.2
B.C.(W3.2mxH3.3m) m 1,100 240,000 264.0 264.0
B.C.(W2.3mxH2.4m) m 1,600 170,000 272.0 272.0
8 460.1
B.C.(2xW1.8mxH1.4m) m 650 200,000 130.0 130.0
B.C.(3xW1.5mxH1.4m) m 65 210,000 13.7 13.7
B.C.(2xW2.2mxH1.7m) m 800 220,000 176.0 176.0
B.C.(2xW1.5mxH1.4m) m 65 170,000 11.1 11.1
8-3Additional B.C. along Makati Diversion
ChannelB.C.(2xW2.2mxH2.1m) m 550 235,000 129.3 129.3
9 522.0
9-1 Expansion of the existing Libertad pond100mx1700m or
equivalentm
3 900,000 580 522.0 522.0
10 1,380.8
B.C.(2xW3.5mxH3.3m) m 460 345,000 158.7 158.7
B.C.(W3.7mxH3.3m) m 2,550 245,000 624.8 624.8
B.C.(W4.0mxH4.0m) m 1,600 370,000 592.0 592.0
10-2 m 350 15,000 5.3 5.3
11 29.1
11-1 m 50 150,000 7.5 7.5
11-2 m2 360 60,000 21.6 21.6
12 160.0
12-1 m3/s 2 80,000,000 160.0 160.0
13 160.0
13-1 m3/s 2 80,000,000 160.0 160.0
3,258.8 2,839.5 2,134.1 8,232.4
Note: (*1) This includes the cost for additional work at Aviles P.S.
18.0
Drainage Block
N04
Maypajo-
Blumentritt-
Balut
5-1
1-1
Amount
(Million Peso)UnitItemUnit Price
(Peso)
BaleteS02
S01Libertad-
Tripa de Gallina
Quantity
Additional works of Estero de Vitas
Heightenning of river wall in the lower
Estero de Vitas
Rehabilitation works of drainage pumping
stations
6-1
Table G.2.2 Main Works Cost
Vitas-
Binondo-
Escolta
N01
Declogging of Drainage Mains1-2
Additional B.C. along South Antipolo Open
Canal
Rehabilitation works of drainage channels
Dredging of Esteros/Creeks
Paco-
Pandacan-
San Andres
Rehabilitation works of drainage pumping stations
3-2
Additional works of South Antipolo area
Additional works of channel to Quiapo Pumping Station
Additional works for Aviles drainage area
Additional B.C. along Margal
Imrpovement of a Bridge along Estero de Sampaloc I
Improvement of Est. de Sampaloc II and Lepanto-Gov.Forbes D.M.
Installation of Pump Gates at Uli-Uli floodgate
18.0
Additional works of Blumentritt Interceptor
Construction of Additional Interceptor
Remedial works of existing Blumentritt Interceptor
3,600 5,000m
Additional works for severe inundation area in South Manila
Additional B.C. along Zobel Roxas D.M.
Additional B.C. along Faraday D.M.
8-1
8-2
2-1
Installation of Pump Gates in Sta.Clara drainage basin
Installation of Pump Gates on Perlita Creek
Improvement of Padre Burgos B.C.
Improvement of bridge cross San Marcelino St.
Improvement of Dilain Pond
Additional works in Estero de Balete
Additional works on Perlita Creek
Additional works in Sta.Clara drainage basin
7-2
Quiapo-
AvilesN02
Total
S03
Sta.ClaraS04
Additional works of Libertad pond
Additional Works of Dilain/Maricaban Creek area
Construction of Maricaban Interceptor10-1
G - 7
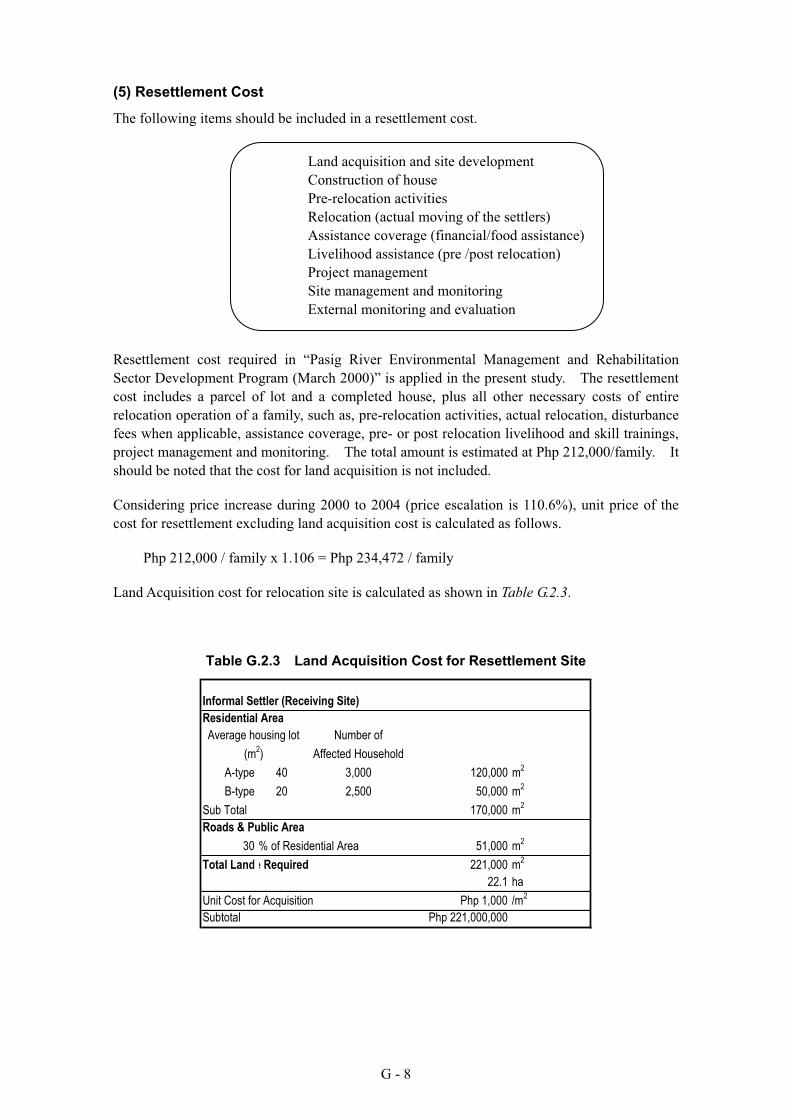
G - 8
(5) Resettlement Cost
The following items should be included in a resettlement cost.
Resettlement cost required in “Pasig River Environmental Management and Rehabilitation
Sector Development Program (March 2000)” is applied in the present study. The resettlement
cost includes a parcel of lot and a completed house, plus all other necessary costs of entire
relocation operation of a family, such as, pre-relocation activities, actual relocation, disturbance
fees when applicable, assistance coverage, pre- or post relocation livelihood and skill trainings,
project management and monitoring. The total amount is estimated at Php 212,000/family. It
should be noted that the cost for land acquisition is not included.
Considering price increase during 2000 to 2004 (price escalation is 110.6%), unit price of the
cost for resettlement excluding land acquisition cost is calculated as follows.
Php 212,000 / family x 1.106 = Php 234,472 / family
Land Acquisition cost for relocation site is calculated as shown in Table G.2.3.
Table G.2.3 Land Acquisition Cost for Resettlement Site
Informal Settler (Receiving Site)
Residential Area
Number of
Affected Household
A-type 40 3,000 120,000 m2
B-type 20 2,500 50,000 m2
Sub Total 170,000 m2
Roads & Public Area
30 % of Residential Area 51,000 m2
Total Lande Required 221,000 m2
22.1 ha
Unit Cost for Acquisition Php 1,000 /m2
Subtotal Php 221,000,000
Average housing lot
(m2)
Land acquisition and site development
Construction of house
Pre-relocation activities
Relocation (actual moving of the settlers)
Assistance coverage (financial/food assistance)
Livelihood assistance (pre /post relocation)
Project management
Site management and monitoring
External monitoring and evaluation
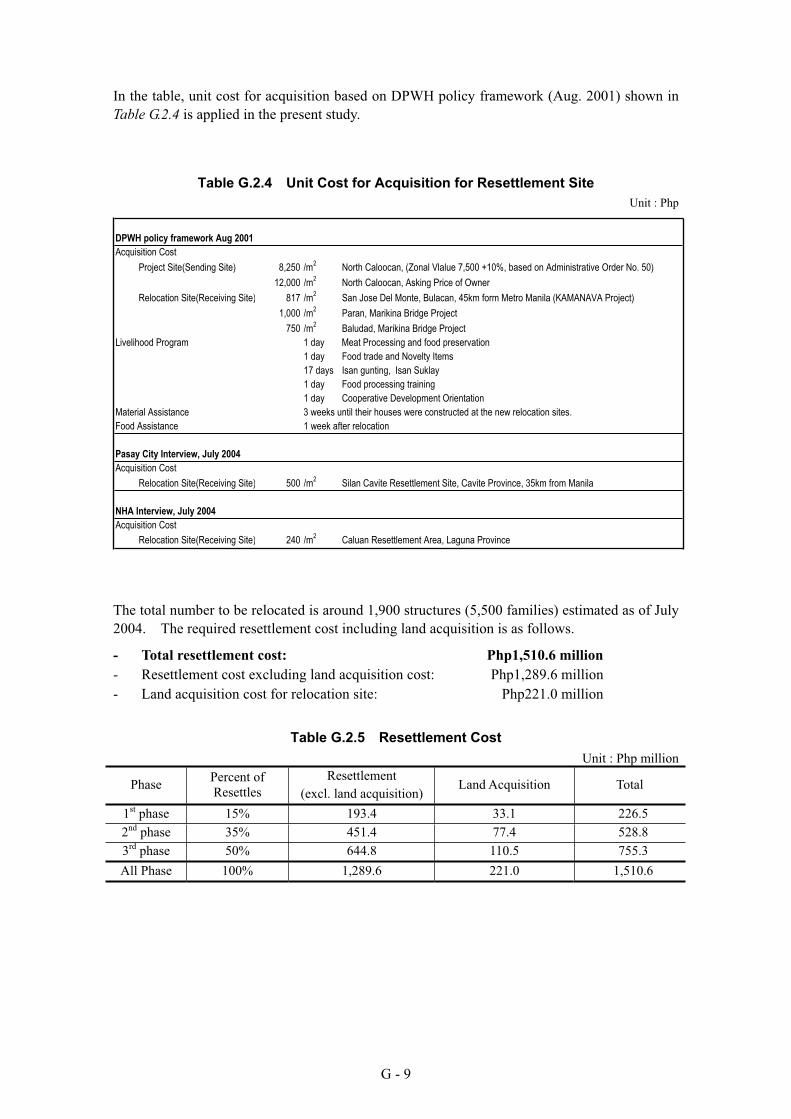
G - 9
In the table, unit cost for acquisition based on DPWH policy framework (Aug. 2001) shown in
Table G.2.4 is applied in the present study.
Table G.2.4 Unit Cost for Acquisition for Resettlement Site
Unit : Php
DPWH policy framework Aug 2001
Acquisition Cost
Project Site(Sending Site) 8,250 /m2
North Caloocan, (Zonal Vlalue 7,500 +10%, based on Administrative Order No. 50)
12,000 /m2
North Caloocan, Asking Price of Owner
Relocation Site(Receiving Site) 817 /m2
San Jose Del Monte, Bulacan, 45km form Metro Manila (KAMANAVA Project)
1,000 /m2
Paran, Marikina Bridge Project
750 /m2
Baludad, Marikina Bridge Project
Livelihood Program 1 day Meat Processing and food preservation
1 day Food trade and Novelty Items
17 days Isan gunting, Isan Suklay
1 day Food processing training
1 day Cooperative Development Orientation
Material Assistance 3 weeks until their houses were constructed at the new relocation sites.
Food Assistance 1 week after relocation
Pasay City Interview, July 2004
Acquisition Cost
Relocation Site(Receiving Site) 500 /m2
Silan Cavite Resettlement Site, Cavite Province, 35km from Manila
NHA Interview, July 2004
Acquisition Cost
Relocation Site(Receiving Site) 240 /m2
Caluan Resettlement Area, Laguna Province
The total number to be relocated is around 1,900 structures (5,500 families) estimated as of July
2004. The required resettlement cost including land acquisition is as follows.
- Total resettlement cost: Php1,510.6 million
- Resettlement cost excluding land acquisition cost: Php1,289.6 million
- Land acquisition cost for relocation site: Php221.0 million
Table G.2.5 Resettlement Cost
Unit : Php million
PhasePercent of
Resettles
Resettlement
(excl. land acquisition)Land Acquisition Total
1st phase 15% 193.4 33.1 226.5
2nd phase 35% 451.4 77.4 528.8
3rd phase 50% 644.8 110.5 755.3
All Phase 100% 1,289.6 221.0 1,510.6
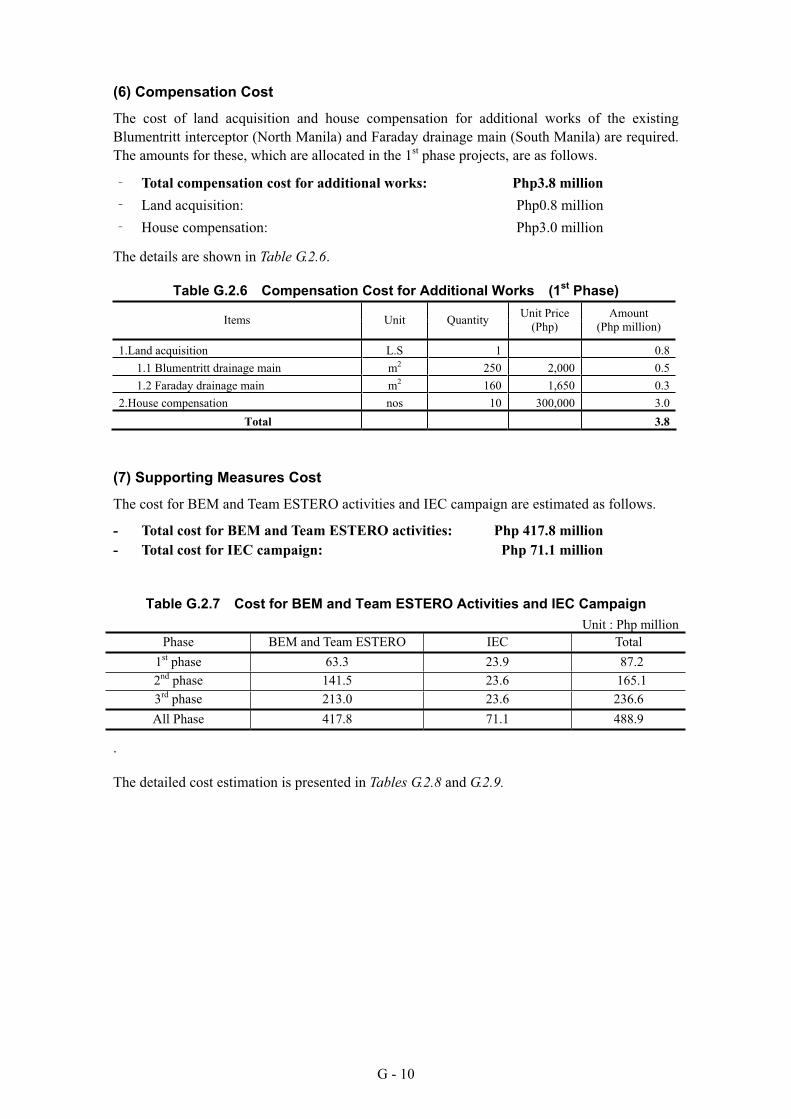
G - 10
(6) Compensation Cost
The cost of land acquisition and house compensation for additional works of the existing
Blumentritt interceptor (North Manila) and Faraday drainage main (South Manila) are required.
The amounts for these, which are allocated in the 1st phase projects, are as follows.
Total compensation cost for additional works: Php3.8 million
Land acquisition: Php0.8 million
House compensation: Php3.0 million
The details are shown in Table G.2.6.
Table G.2.6 Compensation Cost for Additional Works (1st
Phase)
Items Unit Quantity Unit Price
(Php)
Amount
(Php million)
1.Land acquisition L.S 1 0.8
1.1 Blumentritt drainage main m2 250 2,000 0.5
1.2 Faraday drainage main m2 160 1,650 0.3
2.House compensation nos 10 300,000 3.0
Total 3.8
(7) Supporting Measures Cost
The cost for BEM and Team ESTERO activities and IEC campaign are estimated as follows.
- Total cost for BEM and Team ESTERO activities: Php 417.8 million
- Total cost for IEC campaign: Php 71.1 million
Table G.2.7 Cost for BEM and Team ESTERO Activities and IEC Campaign
Unit : Php million
Phase BEM and Team ESTERO IEC Total
1st phase 63.3 23.9 87.2
2nd phase 141.5 23.6 165.1
3rd phase 213.0 23.6 236.6
All Phase 417.8 71.1 488.9
.
The detailed cost estimation is presented in Tables G.2.8 and G.2.9.
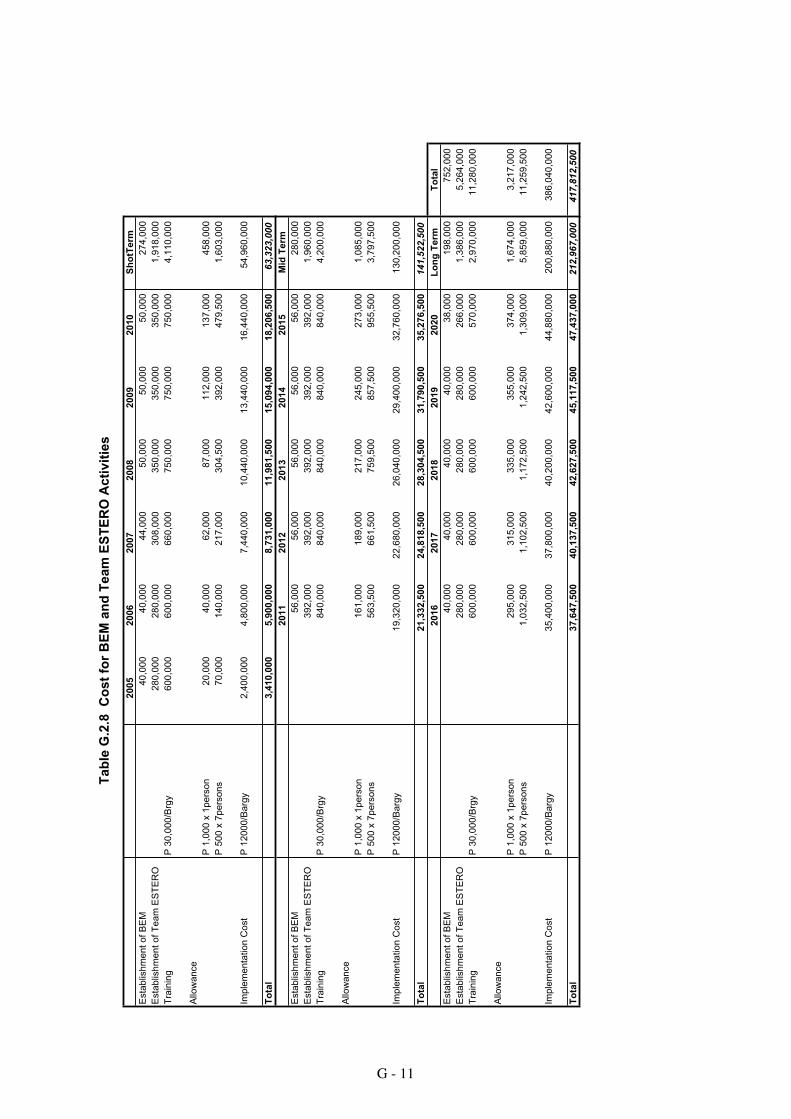
20
05
20
06
20
07
20
08
20
09
20
10
Sh
otT
erm
Esta
blis
hm
en
t o
f B
EM
40
,00
04
0,0
00
44
,00
05
0,0
00
50
,00
05
0,0
00
27
4,0
00
Esta
blis
hm
en
t o
f T
ea
m E
ST
ER
O2
80
,00
02
80
,00
03
08
,00
03
50
,00
03
50
,00
03
50
,00
01
,91
8,0
00
Tra
inin
gP
30
,00
0/B
rgy
60
0,0
00
60
0,0
00
66
0,0
00
75
0,0
00
75
0,0
00
75
0,0
00
4,1
10
,00
0
Allo
wa
nce
P 1
,00
0 x
1p
ers
on
20
,00
04
0,0
00
62
,00
08
7,0
00
11
2,0
00
13
7,0
00
45
8,0
00
P 5
00
x 7
pe
rso
ns
70
,00
01
40
,00
02
17
,00
03
04
,50
03
92
,00
04
79
,50
01
,60
3,0
00
Imp
lem
en
tatio
n C
ost
P 1
20
00
/Ba
rgy
2,4
00
,00
04
,80
0,0
00
7,4
40
,00
01
0,4
40
,00
01
3,4
40
,00
01
6,4
40
,00
05
4,9
60
,00
0
To
tal
3,4
10
,00
05
,90
0,0
00
8,7
31
,00
01
1,9
81
,50
01
5,0
94
,00
01
8,2
06
,50
06
3,3
23
,00
0
20
11
20
12
20
13
20
14
20
15
Mid
Te
rm
Esta
blis
hm
en
t o
f B
EM
56
,00
05
6,0
00
56
,00
05
6,0
00
56
,00
02
80
,00
0
Esta
blis
hm
en
t o
f T
ea
m E
ST
ER
O3
92
,00
03
92
,00
03
92
,00
03
92
,00
03
92
,00
01
,96
0,0
00
Tra
inin
gP
30
,00
0/B
rgy
84
0,0
00
84
0,0
00
84
0,0
00
84
0,0
00
84
0,0
00
4,2
00
,00
0
Allo
wa
nce
P 1
,00
0 x
1p
ers
on
16
1,0
00
18
9,0
00
21
7,0
00
24
5,0
00
27
3,0
00
1,0
85
,00
0
P 5
00
x 7
pe
rso
ns
56
3,5
00
66
1,5
00
75
9,5
00
85
7,5
00
95
5,5
00
3,7
97
,50
0
Imp
lem
en
tatio
n C
ost
P 1
20
00
/Ba
rgy
19
,32
0,0
00
22
,68
0,0
00
26
,04
0,0
00
29
,40
0,0
00
32
,76
0,0
00
13
0,2
00
,00
0
To
tal
21
,33
2,5
00
24
,81
8,5
00
28
,30
4,5
00
31
,79
0,5
00
35
,27
6,5
00
14
1,5
22
,50
0
20
16
20
17
20
18
20
19
20
20
Lo
ng
Te
rmT
ota
l
Esta
blis
hm
en
t o
f B
EM
40
,00
04
0,0
00
40
,00
04
0,0
00
38
,00
01
98
,00
07
52
,00
0
Esta
blis
hm
en
t o
f T
ea
m E
ST
ER
O2
80
,00
02
80
,00
02
80
,00
02
80
,00
02
66
,00
01
,38
6,0
00
5,2
64
,00
0
Tra
inin
gP
30
,00
0/B
rgy
60
0,0
00
60
0,0
00
60
0,0
00
60
0,0
00
57
0,0
00
2,9
70
,00
01
1,2
80
,00
0
Allo
wa
nce
P 1
,00
0 x
1p
ers
on
29
5,0
00
31
5,0
00
33
5,0
00
35
5,0
00
37
4,0
00
1,6
74
,00
03
,21
7,0
00
P 5
00
x 7
pe
rso
ns
1,0
32
,50
01
,10
2,5
00
1,1
72
,50
01
,24
2,5
00
1,3
09
,00
05
,85
9,0
00
11
,25
9,5
00
Imp
lem
en
tatio
n C
ost
P 1
20
00
/Ba
rgy
35
,40
0,0
00
37
,80
0,0
00
40
,20
0,0
00
42
,60
0,0
00
44
,88
0,0
00
20
0,8
80
,00
03
86
,04
0,0
00
To
tal
37
,64
7,5
00
40
,13
7,5
00
42
,62
7,5
00
45
,11
7,5
00
47
,43
7,0
00
21
2,9
67
,00
04
17
,81
2,5
00
Tab
le G
.2.8
C
ost
for
BE
M a
nd
Team
ES
TE
RO
Acti
vit
ies
G - 11
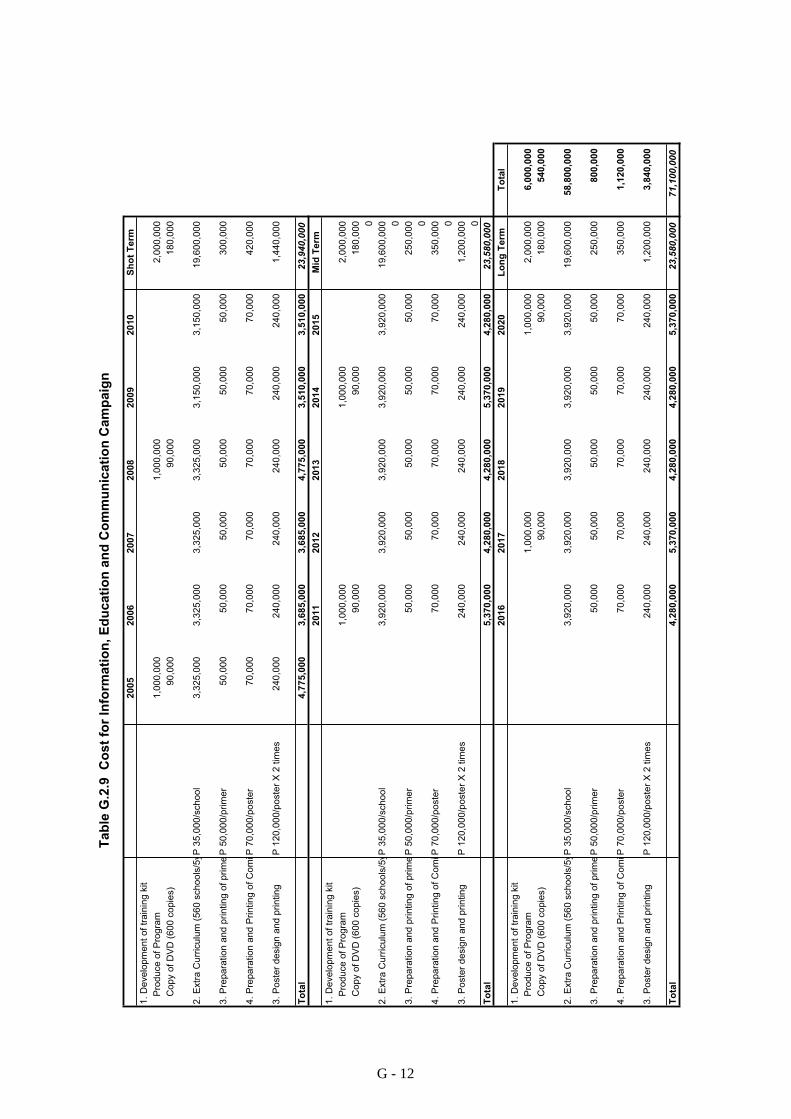
20
05
20
06
20
07
20
08
20
09
20
10
Sh
ot
Te
rm
1.
De
ve
lop
me
nt
of
tra
inin
g k
it
P
rod
uce
of
Pro
gra
m1
,00
0,0
00
1,0
00
,00
02
,00
0,0
00
C
op
y o
f D
VD
(6
00
co
pie
s)
90
,00
09
0,0
00
18
0,0
00
2.
Extr
a C
urr
icu
lum
(5
60
sch
oo
ls/5
yP
35
,00
0/s
ch
oo
l3
,32
5,0
00
3,3
25
,00
03
,32
5,0
00
3,3
25
,00
03
,15
0,0
00
3,1
50
,00
01
9,6
00
,00
0
3.
Pre
pa
ratio
n a
nd
prin
tin
g o
f p
rim
eP
50
,00
0/p
rim
er
50
,00
05
0,0
00
50
,00
05
0,0
00
50
,00
05
0,0
00
30
0,0
00
4.
Pre
pa
ratio
n a
nd
Prin
tin
g o
f C
om
iP 7
0,0
00
/po
ste
r7
0,0
00
70
,00
07
0,0
00
70
,00
07
0,0
00
70
,00
04
20
,00
0
3.
Po
ste
r d
esig
n a
nd
prin
tin
gP
12
0,0
00
/po
ste
r X
2 t
ime
s2
40
,00
02
40
,00
02
40
,00
02
40
,00
02
40
,00
02
40
,00
01
,44
0,0
00
To
tal
4,7
75
,00
03
,68
5,0
00
3,6
85
,00
04
,77
5,0
00
3,5
10
,00
03
,51
0,0
00
23
,94
0,0
00
20
11
20
12
20
13
20
14
20
15
Mid
Te
rm
1.
De
ve
lop
me
nt
of
tra
inin
g k
it
P
rod
uce
of
Pro
gra
m1
,00
0,0
00
1,0
00
,00
02
,00
0,0
00
C
op
y o
f D
VD
(6
00
co
pie
s)
90
,00
09
0,0
00
18
0,0
00 0
2.
Extr
a C
urr
icu
lum
(5
60
sch
oo
ls/5
yP
35
,00
0/s
ch
oo
l3
,92
0,0
00
3,9
20
,00
03
,92
0,0
00
3,9
20
,00
03
,92
0,0
00
19
,60
0,0
00 0
3.
Pre
pa
ratio
n a
nd
prin
tin
g o
f p
rim
eP
50
,00
0/p
rim
er
50
,00
05
0,0
00
50
,00
05
0,0
00
50
,00
02
50
,00
0 0
4.
Pre
pa
ratio
n a
nd
Prin
tin
g o
f C
om
iP 7
0,0
00
/po
ste
r7
0,0
00
70
,00
07
0,0
00
70
,00
07
0,0
00
35
0,0
00 0
3.
Po
ste
r d
esig
n a
nd
prin
tin
gP
12
0,0
00
/po
ste
r X
2 t
ime
s2
40
,00
02
40
,00
02
40
,00
02
40
,00
02
40
,00
01
,20
0,0
00 0
To
tal
5,3
70
,00
04
,28
0,0
00
4,2
80
,00
05
,37
0,0
00
4,2
80
,00
02
3,5
80
,00
0
20
16
20
17
20
18
20
19
20
20
Lo
ng
Te
rmT
ota
l
1.
De
ve
lop
me
nt
of
tra
inin
g k
it
P
rod
uce
of
Pro
gra
m1
,00
0,0
00
1,0
00
,00
02
,00
0,0
00
6,0
00
,00
0
C
op
y o
f D
VD
(6
00
co
pie
s)
90
,00
09
0,0
00
18
0,0
00
54
0,0
00
2.
Extr
a C
urr
icu
lum
(5
60
sch
oo
ls/5
yP
35
,00
0/s
ch
oo
l3
,92
0,0
00
3,9
20
,00
03
,92
0,0
00
3,9
20
,00
03
,92
0,0
00
19
,60
0,0
00
58
,80
0,0
00
3.
Pre
pa
ratio
n a
nd
prin
tin
g o
f p
rim
eP
50
,00
0/p
rim
er
50
,00
05
0,0
00
50
,00
05
0,0
00
50
,00
02
50
,00
08
00
,00
0
4.
Pre
pa
ratio
n a
nd
Prin
tin
g o
f C
om
iP 7
0,0
00
/po
ste
r7
0,0
00
70
,00
07
0,0
00
70
,00
07
0,0
00
35
0,0
00
1,1
20
,00
0
3.
Po
ste
r d
esig
n a
nd
prin
tin
gP
12
0,0
00
/po
ste
r X
2 t
ime
s2
40
,00
02
40
,00
02
40
,00
02
40
,00
02
40
,00
01
,20
0,0
00
3,8
40
,00
0
To
tal
4,2
80
,00
05
,37
0,0
00
4,2
80
,00
04
,28
0,0
00
5,3
70
,00
02
3,5
80
,00
07
1,1
00
,00
0
Tab
le G
.2.9
C
ost
for
Info
rmati
on
, E
du
cati
on
an
d C
om
mu
nic
ati
on
Cam
paig
n
G - 12
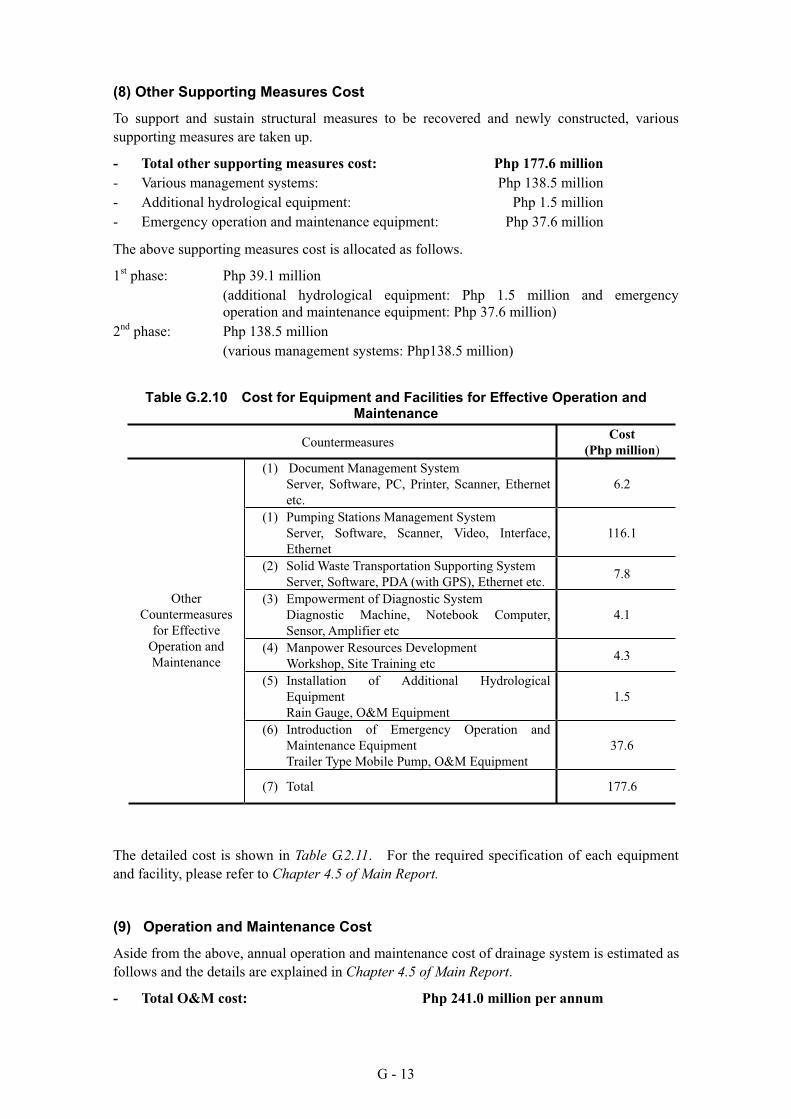
G - 13
(8) Other Supporting Measures Cost
To support and sustain structural measures to be recovered and newly constructed, various
supporting measures are taken up.
- Total other supporting measures cost: Php 177.6 million
- Various management systems: Php 138.5 million
- Additional hydrological equipment: Php 1.5 million
- Emergency operation and maintenance equipment: Php 37.6 million
The above supporting measures cost is allocated as follows.
1st phase: Php 39.1 million
(additional hydrological equipment: Php 1.5 million and emergency
operation and maintenance equipment: Php 37.6 million)
2nd phase: Php 138.5 million
(various management systems: Php138.5 million)
Table G.2.10 Cost for Equipment and Facilities for Effective Operation and Maintenance
CountermeasuresCost
(Php million)
(1) Document Management System
Server, Software, PC, Printer, Scanner, Ethernet
etc.
6.2
(1) Pumping Stations Management System
Server, Software, Scanner, Video, Interface,
Ethernet
116.1
(2) Solid Waste Transportation Supporting System
Server, Software, PDA (with GPS), Ethernet etc.7.8
(3) Empowerment of Diagnostic System
Diagnostic Machine, Notebook Computer,
Sensor, Amplifier etc
4.1
(4) Manpower Resources Development
Workshop, Site Training etc 4.3
(5) Installation of Additional Hydrological
Equipment
Rain Gauge, O&M Equipment
1.5
(6) Introduction of Emergency Operation and
Maintenance Equipment
Trailer Type Mobile Pump, O&M Equipment
37.6
Other
Countermeasures
for Effective
Operation and
Maintenance
(7) Total 177.6
The detailed cost is shown in Table G.2.11. For the required specification of each equipment
and facility, please refer to Chapter 4.5 of Main Report.
(9) Operation and Maintenance Cost
Aside from the above, annual operation and maintenance cost of drainage system is estimated as
follows and the details are explained in Chapter 4.5 of Main Report.
- Total O&M cost: Php 241.0 million per annum
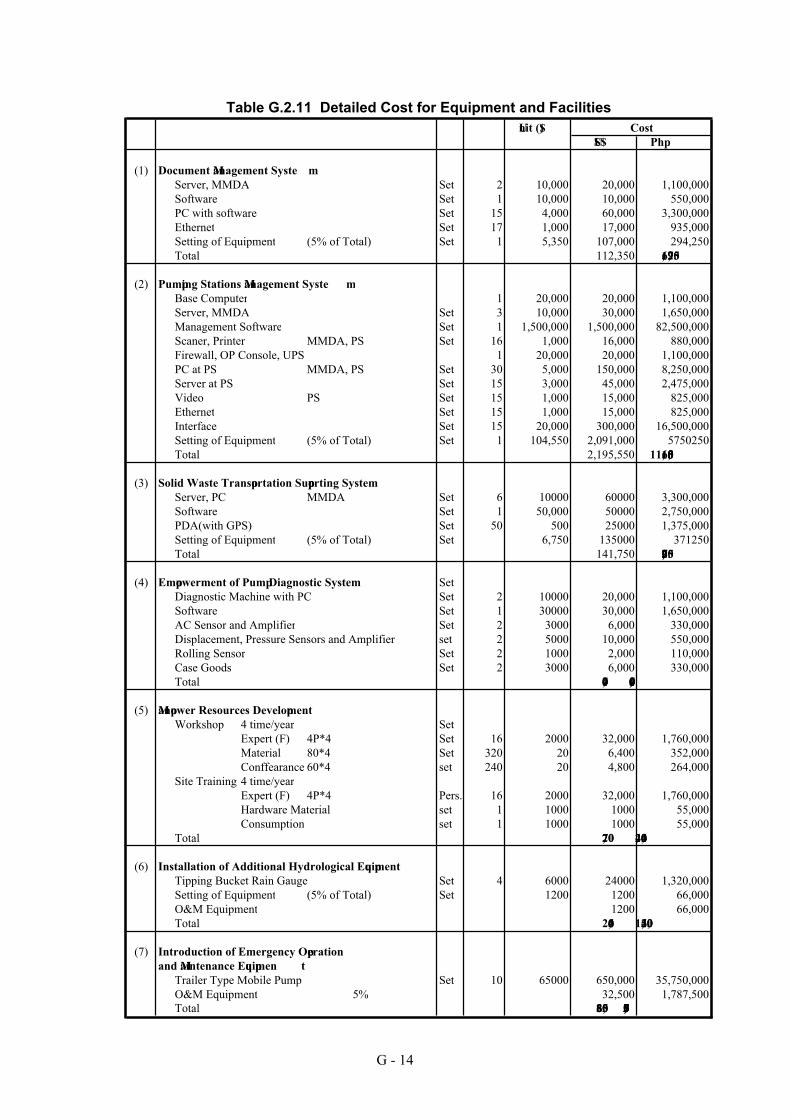
Unit ($)
US$ Php
(1) Document Management Syste m
Server, MMDA Set 2 10,000 20,000 1,100,000
Software Set 1 10,000 10,000 550,000
PC with software Set 15 4,000 60,000 3,300,000
Ethernet Set 17 1,000 17,000 935,000
Setting of Equipment (5% of Total) Set 1 5,350 107,000 294,250
Total 112,350 6,179,250
(2) Pumping Stations Management Syste m
Base Computer 1 20,000 20,000 1,100,000
Server, MMDA Set 3 10,000 30,000 1,650,000
Management Software Set 1 1,500,000 1,500,000 82,500,000
Scaner, Printer MMDA, PS Set 16 1,000 16,000 880,000
Firewall, OP Console, UPS 1 20,000 20,000 1,100,000
PC at PS MMDA, PS Set 30 5,000 150,000 8,250,000
Server at PS Set 15 3,000 45,000 2,475,000
Video PS Set 15 1,000 15,000 825,000
Ethernet Set 15 1,000 15,000 825,000
Interface Set 15 20,000 300,000 16,500,000
Setting of Equipment (5% of Total) Set 1 104,550 2,091,000 5750250
Total 2,195,550 116,105,000
(3) Solid Waste Transportation Supporting System
Server, PC MMDA Set 6 10000 60000 3,300,000
Software Set 1 50,000 50000 2,750,000
PDA(with GPS) Set 50 500 25000 1,375,000
Setting of Equipment (5% of Total) Set 6,750 135000 371250
Total 141,750 7,796,250
(4) Empowerment of Pump Diagnostic System Set
Diagnostic Machine with PC Set 2 10000 20,000 1,100,000
Software Set 1 30000 30,000 1,650,000
AC Sensor and Amplifier Set 2 3000 6,000 330,000
Displacement, Pressure Sensors and Amplifier set 2 5000 10,000 550,000
Rolling Sensor Set 2 1000 2,000 110,000
Case Goods Set 2 3000 6,000 330,000
Total 74,000 4,070,000
(5) Manpower Resources Development
Workshop 4 time/year Set
Expert (F) 4P*4 Set 16 2000 32,000 1,760,000
Material 80*4 Set 320 20 6,400 352,000
Conffearance 60*4 set 240 20 4,800 264,000
Site Training 4 time/year
Expert (F) 4P*4 Pers. 16 2000 32,000 1,760,000
Hardware Material set 1 1000 1000 55,000
Consumption set 1 1000 1000 55,000
Total 77,200 4,246,000
(6) Installation of Additional Hydrological Equipment
Tipping Bucket Rain Gauge Set 4 6000 24000 1,320,000
Setting of Equipment (5% of Total) Set 1200 1200 66,000
O&M Equipment 1200 66,000
Total 26,400 1,452,000
(7) Introduction of Emergency Operation
and Maintenance Equipmen t
Trailer Type Mobile Pump Set 10 65000 650,000 35,750,000
O&M Equipment 5% 32,500 1,787,500
Total 682,500 37,537,500
Cost
Table G.2.11 Detailed Cost for Equipment and Facilities
G - 14
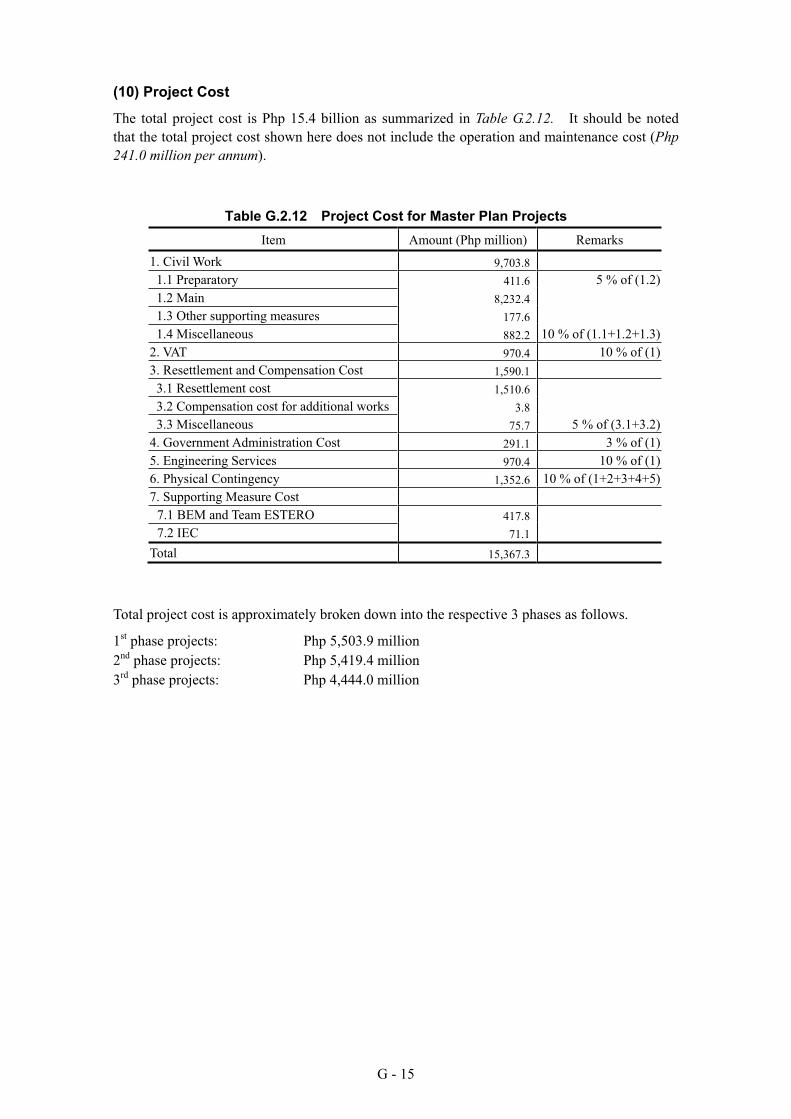
G - 15
(10) Project Cost
The total project cost is Php 15.4 billion as summarized in Table G.2.12. It should be noted
that the total project cost shown here does not include the operation and maintenance cost (Php
241.0 million per annum).
Table G.2.12 Project Cost for Master Plan Projects
Item Amount (Php million) Remarks
1. Civil Work 9,703.8
1.1 Preparatory 411.6 5 % of (1.2)
1.2 Main 8,232.4
1.3 Other supporting measures 177.6
1.4 Miscellaneous 882.2 10 % of (1.1+1.2+1.3)
2. VAT 970.4 10 % of (1)
3. Resettlement and Compensation Cost 1,590.1
3.1 Resettlement cost 1,510.6
3.2 Compensation cost for additional works 3.8
3.3 Miscellaneous 75.7 5 % of (3.1+3.2)
4. Government Administration Cost 291.1 3 % of (1)
5. Engineering Services 970.4 10 % of (1)
6. Physical Contingency 1,352.6 10 % of (1+2+3+4+5)
7. Supporting Measure Cost
7.1 BEM and Team ESTERO 417.8
7.2 IEC 71.1
Total 15,367.3
Total project cost is approximately broken down into the respective 3 phases as follows.
1st phase projects: Php 5,503.9 million
2nd phase projects: Php 5,419.4 million
3rd phase projects: Php 4,444.0 million
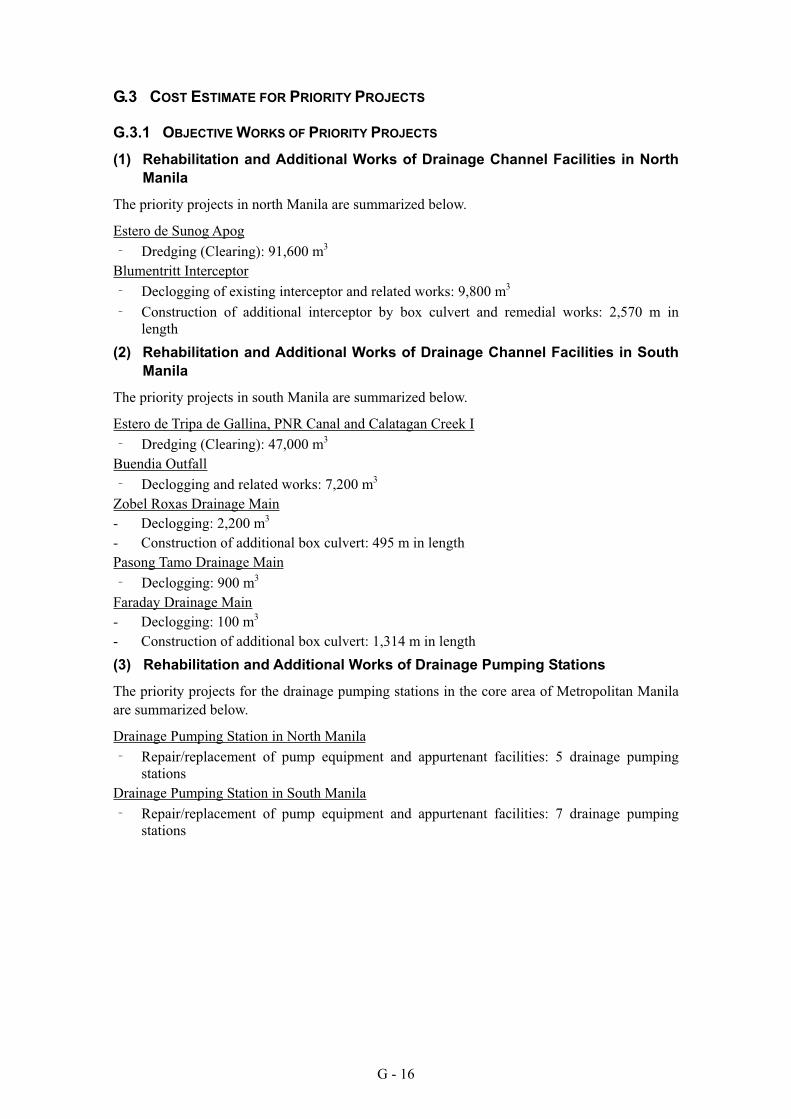
G - 16
G.3 COST ESTIMATE FOR PRIORITY PROJECTS
G.3.1 OBJECTIVE WORKS OF PRIORITY PROJECTS
(1) Rehabilitation and Additional Works of Drainage Channel Facilities in North
Manila
The priority projects in north Manila are summarized below.
Estero de Sunog Apog
Dredging (Clearing): 91,600 m3
Blumentritt Interceptor
Declogging of existing interceptor and related works: 9,800 m3
Construction of additional interceptor by box culvert and remedial works: 2,570 m in
length
(2) Rehabilitation and Additional Works of Drainage Channel Facilities in South
Manila
The priority projects in south Manila are summarized below.
Estero de Tripa de Gallina, PNR Canal and Calatagan Creek I
Dredging (Clearing): 47,000 m3
Buendia Outfall
Declogging and related works: 7,200 m3
Zobel Roxas Drainage Main
- Declogging: 2,200 m3
- Construction of additional box culvert: 495 m in length
Pasong Tamo Drainage Main
Declogging: 900 m3
Faraday Drainage Main
- Declogging: 100 m3
- Construction of additional box culvert: 1,314 m in length
(3) Rehabilitation and Additional Works of Drainage Pumping Stations
The priority projects for the drainage pumping stations in the core area of Metropolitan Manila
are summarized below.
Drainage Pumping Station in North Manila
Repair/replacement of pump equipment and appurtenant facilities: 5 drainage pumping
stations
Drainage Pumping Station in South Manila
Repair/replacement of pump equipment and appurtenant facilities: 7 drainage pumping
stations
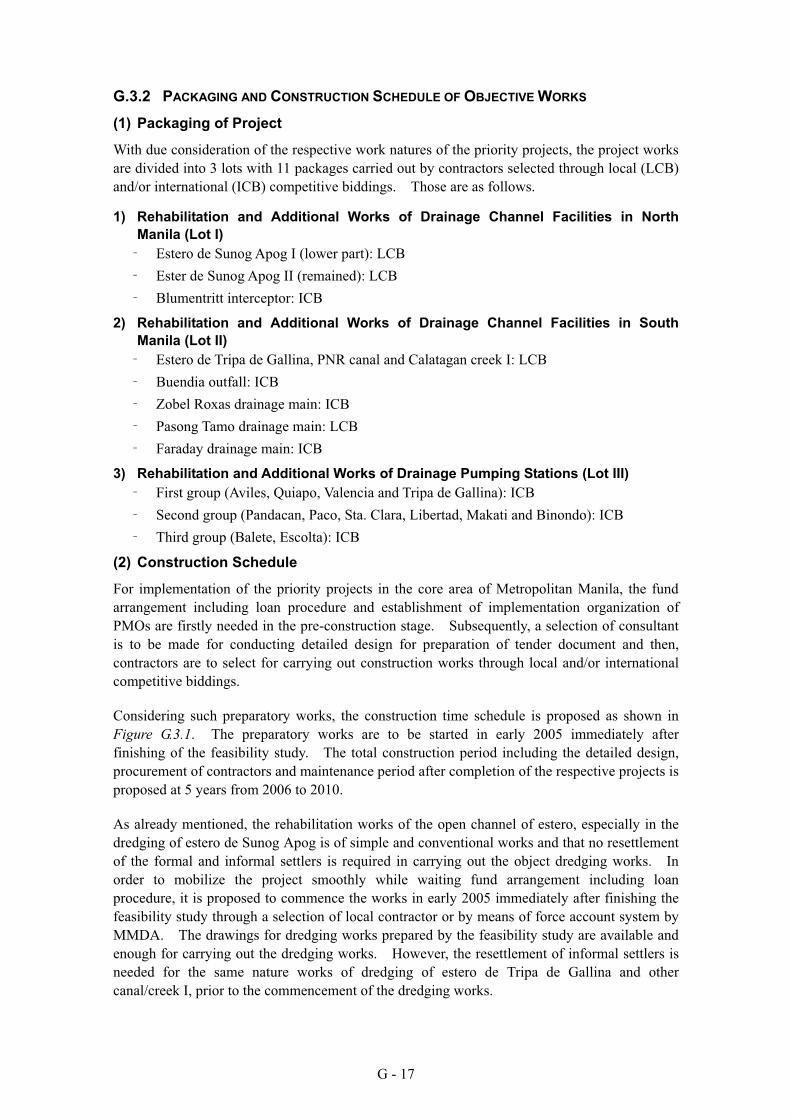
G - 17
G.3.2 PACKAGING AND CONSTRUCTION SCHEDULE OF OBJECTIVE WORKS
(1) Packaging of Project
With due consideration of the respective work natures of the priority projects, the project works
are divided into 3 lots with 11 packages carried out by contractors selected through local (LCB)
and/or international (ICB) competitive biddings. Those are as follows.
1) Rehabilitation and Additional Works of Drainage Channel Facilities in North
Manila (Lot I)
Estero de Sunog Apog I (lower part): LCB
Ester de Sunog Apog II (remained): LCB
Blumentritt interceptor: ICB
2) Rehabilitation and Additional Works of Drainage Channel Facilities in South
Manila (Lot II)
Estero de Tripa de Gallina, PNR canal and Calatagan creek I: LCB
Buendia outfall: ICB
Zobel Roxas drainage main: ICB
Pasong Tamo drainage main: LCB
Faraday drainage main: ICB
3) Rehabilitation and Additional Works of Drainage Pumping Stations (Lot III)
First group (Aviles, Quiapo, Valencia and Tripa de Gallina): ICB
Second group (Pandacan, Paco, Sta. Clara, Libertad, Makati and Binondo): ICB
Third group (Balete, Escolta): ICB
(2) Construction Schedule
For implementation of the priority projects in the core area of Metropolitan Manila, the fund
arrangement including loan procedure and establishment of implementation organization of
PMOs are firstly needed in the pre-construction stage. Subsequently, a selection of consultant
is to be made for conducting detailed design for preparation of tender document and then,
contractors are to select for carrying out construction works through local and/or international
competitive biddings.
Considering such preparatory works, the construction time schedule is proposed as shown in
Figure G.3.1. The preparatory works are to be started in early 2005 immediately after
finishing of the feasibility study. The total construction period including the detailed design,
procurement of contractors and maintenance period after completion of the respective projects is
proposed at 5 years from 2006 to 2010.
As already mentioned, the rehabilitation works of the open channel of estero, especially in the
dredging of estero de Sunog Apog is of simple and conventional works and that no resettlement
of the formal and informal settlers is required in carrying out the object dredging works. In
order to mobilize the project smoothly while waiting fund arrangement including loan
procedure, it is proposed to commence the works in early 2005 immediately after finishing the
feasibility study through a selection of local contractor or by means of force account system by
MMDA. The drawings for dredging works prepared by the feasibility study are available and
enough for carrying out the dredging works. However, the resettlement of informal settlers is
needed for the same nature works of dredging of estero de Tripa de Gallina and other
canal/creek I, prior to the commencement of the dredging works.
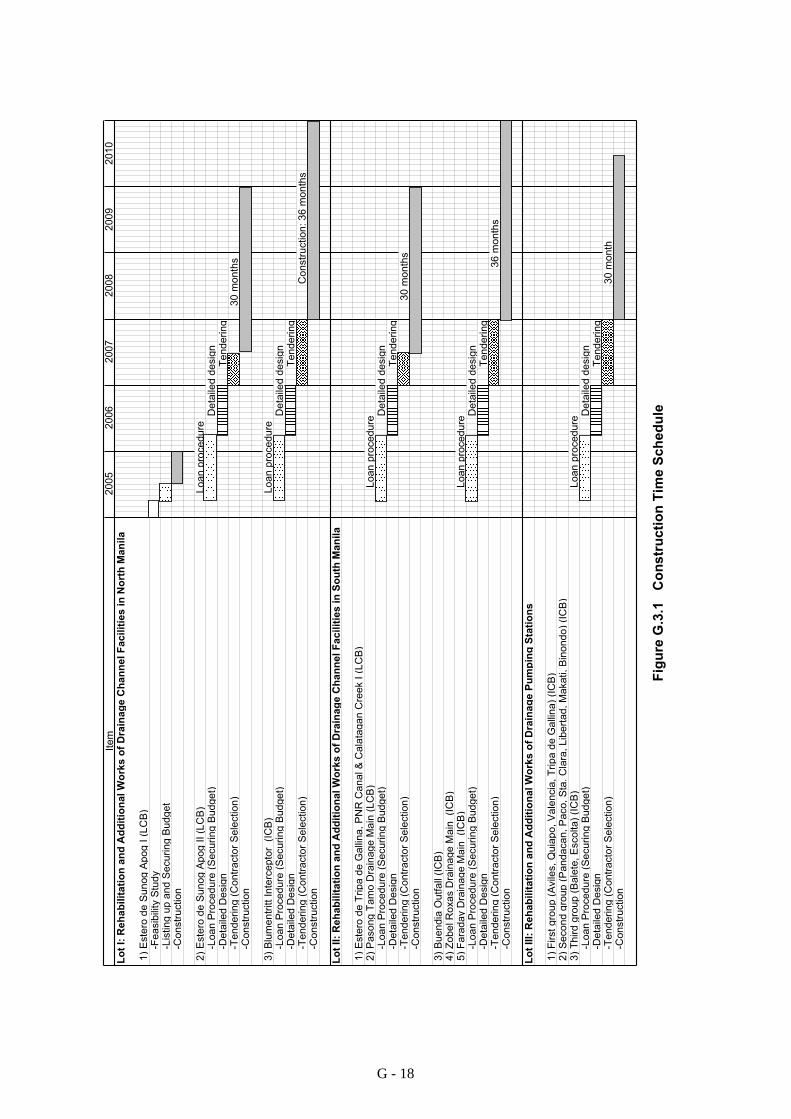
Ite
mL
ot
I: R
eh
ab
ilit
ati
on
an
d A
dd
itio
na
l W
ork
s o
f D
rain
ag
e C
ha
nn
el
Fa
cil
itie
s i
n N
ort
h M
an
ila
1)
Este
ro d
e S
un
og
Ap
og
I (
LC
B)
-F
ea
sib
ility
Stu
dy
-L
isting
up
an
d S
ecu
rin
g B
ud
ge
t
-
Co
nstr
uctio
n
2)
Este
ro d
e S
un
og
Ap
og
II (L
CB
)L
oa
np
roce
du
re
-
Lo
an
Pro
ce
du
re (
Se
cu
rin
g B
ud
ge
t)D
eta
iled
de
sig
n
-
De
taile
d D
esig
nT
en
de
rin
g
-
Te
nd
ering
(Co
ntr
acto
r S
ele
ctio
n)
30
mo
nth
s
-
Co
nstr
uctio
n
3)
Blu
me
ntr
itt
Inte
rce
pto
r(I
CB
)L
oa
np
roce
du
re
-
Lo
an
Pro
ce
du
re (
Se
cu
rin
g B
ud
ge
t)D
eta
iled
de
sig
n
-
De
taile
d D
esig
nT
en
de
rin
g
-
Te
nd
ering
(Co
ntr
acto
r S
ele
ctio
n)
Co
nstr
uctio
n:
36
mo
nth
s
-
Co
nstr
uctio
n
Lo
t II
: R
eh
ab
ilit
ati
on
an
d A
dd
itio
na
l W
ork
s o
f D
rain
ag
e C
ha
nn
el
Fa
cil
itie
s i
n S
ou
th M
an
ila
1)
Este
ro d
e T
rip
a d
e G
alli
na
, P
NR
Ca
na
l &
Ca
lata
ga
n C
ree
k I
(L
CB
) 2
) P
aso
ng
Ta
mo
Dra
ina
ge
Ma
in (
LC
B)
Lo
an
pro
ce
du
re
-
Lo
an
Pro
ce
du
re (
Se
cu
rin
g B
ud
ge
t)D
eta
iled
de
sig
n
-
De
taile
d D
esig
nT
en
de
rin
g
-
Te
nd
ering
(Co
ntr
acto
r S
ele
ctio
n)
30
mo
nth
s
-
Co
nstr
uctio
n
3)
Bu
en
dia
Ou
tfa
ll (I
CB
) 4
) Z
ob
el R
oxa
s D
rain
ag
e M
ain
(IC
B)
5)
Fa
rad
ay D
rain
ag
e M
ain
(IC
B)
Lo
an
pro
ce
du
re
-
Lo
an
Pro
ce
du
re (
Se
cu
rin
g B
ud
ge
t)D
eta
iled
de
sig
n
-
De
taile
d D
esig
nT
en
de
rin
g
-
Te
nd
ering
(Co
ntr
acto
r S
ele
ctio
n)
36
mo
nth
s
-
Co
nstr
uctio
n
Lo
t II
I: R
eh
ab
ilit
ati
on
an
d A
dd
itio
na
l W
ork
s o
f D
rain
ag
e P
um
pin
g S
tati
on
s
1)
First g
rou
p(A
vile
s, Q
uia
po
, V
ale
ncia
, T
rip
a d
e G
alli
na
)(I
CB
) 2
) S
eco
nd
gro
up
(Pa
nd
aca
n, P
aco
, S
ta.
Cla
ra, L
ibe
rta
d, M
aka
ti, B
ino
nd
o)
(IC
B)
3)
Th
ird
gro
up
(Ba
lete
, E
sco
lta
)(I
CB
)L
oa
np
roce
du
re
-
Lo
an
Pro
ce
du
re (
Se
cu
rin
g B
ud
ge
t)D
eta
iled
de
sig
n
-
De
taile
d D
esig
nT
en
de
rin
g
-
Te
nd
ering
(Co
ntr
acto
r S
ele
ctio
n)
30
mo
nth
-C
on
str
uctio
n
Fig
ure
G.3
.1 C
on
str
ucti
on
Tim
e S
ch
ed
ule
20
10
20
08
20
09
20
05
20
06
20
07
G - 18
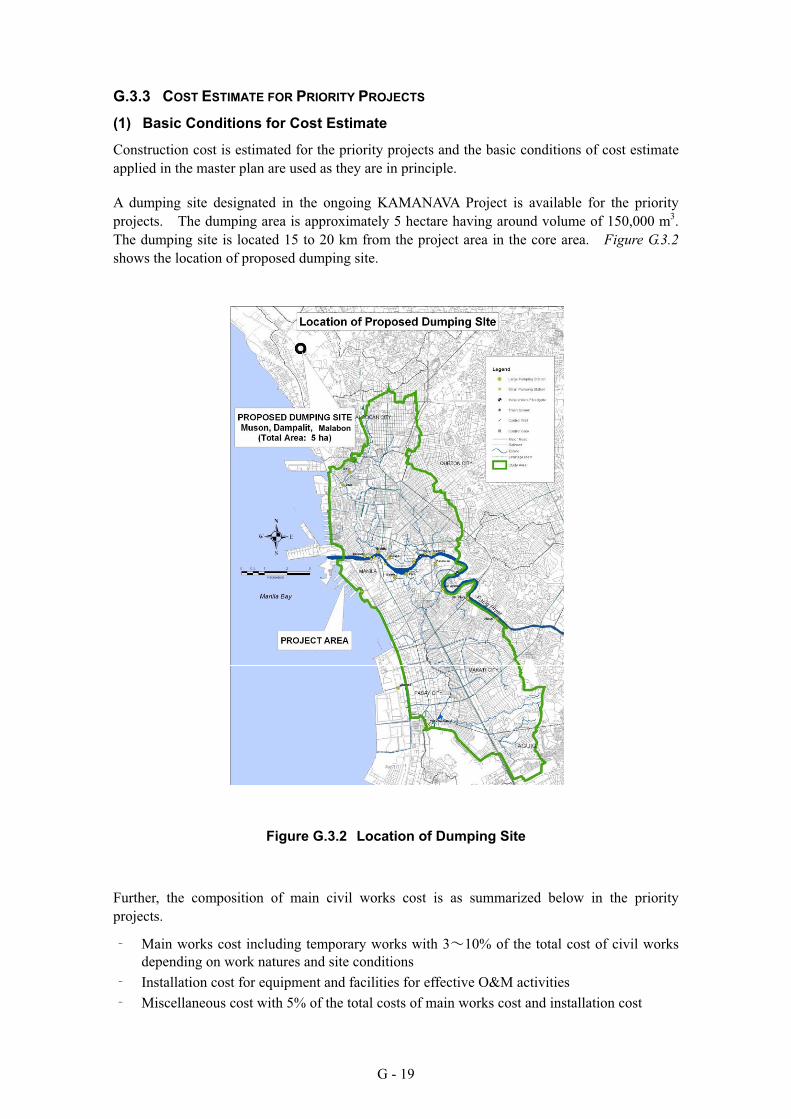
G - 19
G.3.3 COST ESTIMATE FOR PRIORITY PROJECTS
(1) Basic Conditions for Cost Estimate
Construction cost is estimated for the priority projects and the basic conditions of cost estimate
applied in the master plan are used as they are in principle.
A dumping site designated in the ongoing KAMANAVA Project is available for the priority
projects. The dumping area is approximately 5 hectare having around volume of 150,000 m3.
The dumping site is located 15 to 20 km from the project area in the core area. Figure G.3.2
shows the location of proposed dumping site.
Figure G.3.2 Location of Dumping Site
Further, the composition of main civil works cost is as summarized below in the priority
projects.
Main works cost including temporary works with 3 10% of the total cost of civil works
depending on work natures and site conditions
Installation cost for equipment and facilities for effective O&M activities
Miscellaneous cost with 5% of the total costs of main works cost and installation cost
Malabon
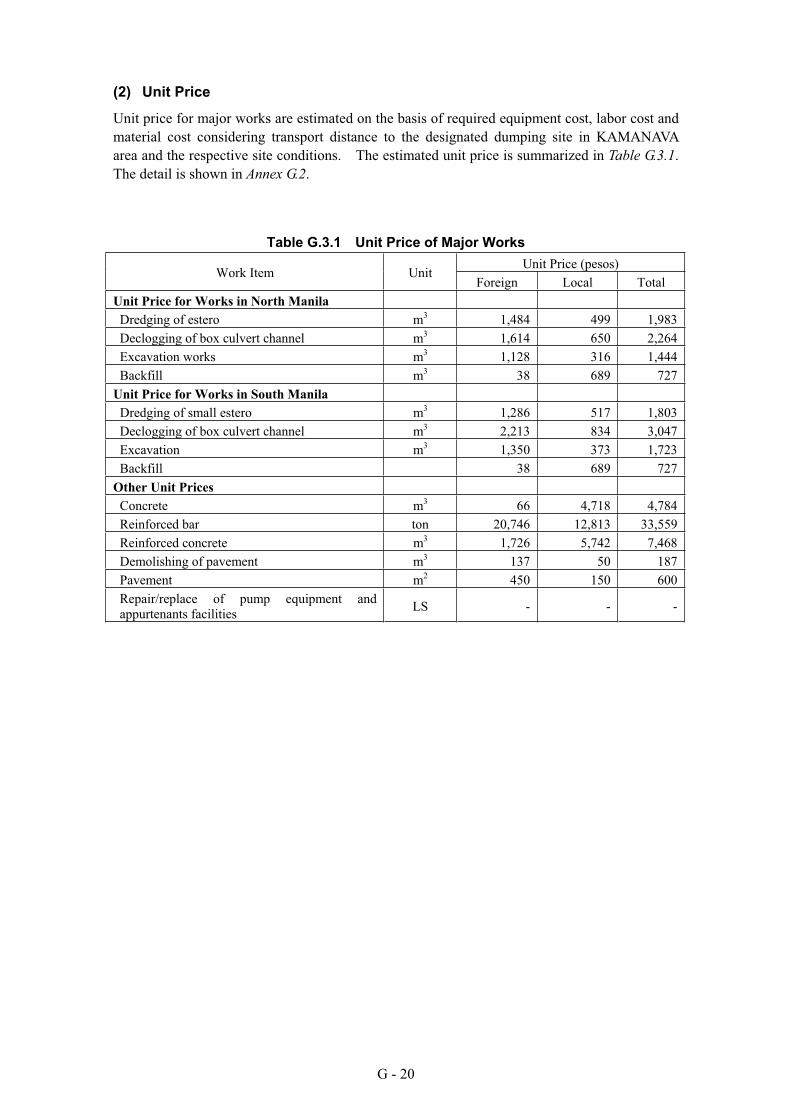
G - 20
(2) Unit Price
Unit price for major works are estimated on the basis of required equipment cost, labor cost and
material cost considering transport distance to the designated dumping site in KAMANAVA
area and the respective site conditions. The estimated unit price is summarized in Table G.3.1.
The detail is shown in Annex G.2.
Table G.3.1 Unit Price of Major Works
Unit Price (pesos) Work Item Unit
Foreign Local Total
Unit Price for Works in North Manila
Dredging of estero m3 1,484 499 1,983
Declogging of box culvert channel m3 1,614 650 2,264
Excavation works m3 1,128 316 1,444
Backfill m3 38 689 727
Unit Price for Works in South Manila
Dredging of small estero m3 1,286 517 1,803
Declogging of box culvert channel m3 2,213 834 3,047
Excavation m3 1,350 373 1,723
Backfill 38 689 727
Other Unit Prices
Concrete m3 66 4,718 4,784
Reinforced bar ton 20,746 12,813 33,559
Reinforced concrete m3 1,726 5,742 7,468
Demolishing of pavement m3 137 50 187
Pavement m2 450 150 600
Repair/replace of pump equipment and
appurtenants facilities LS - - -
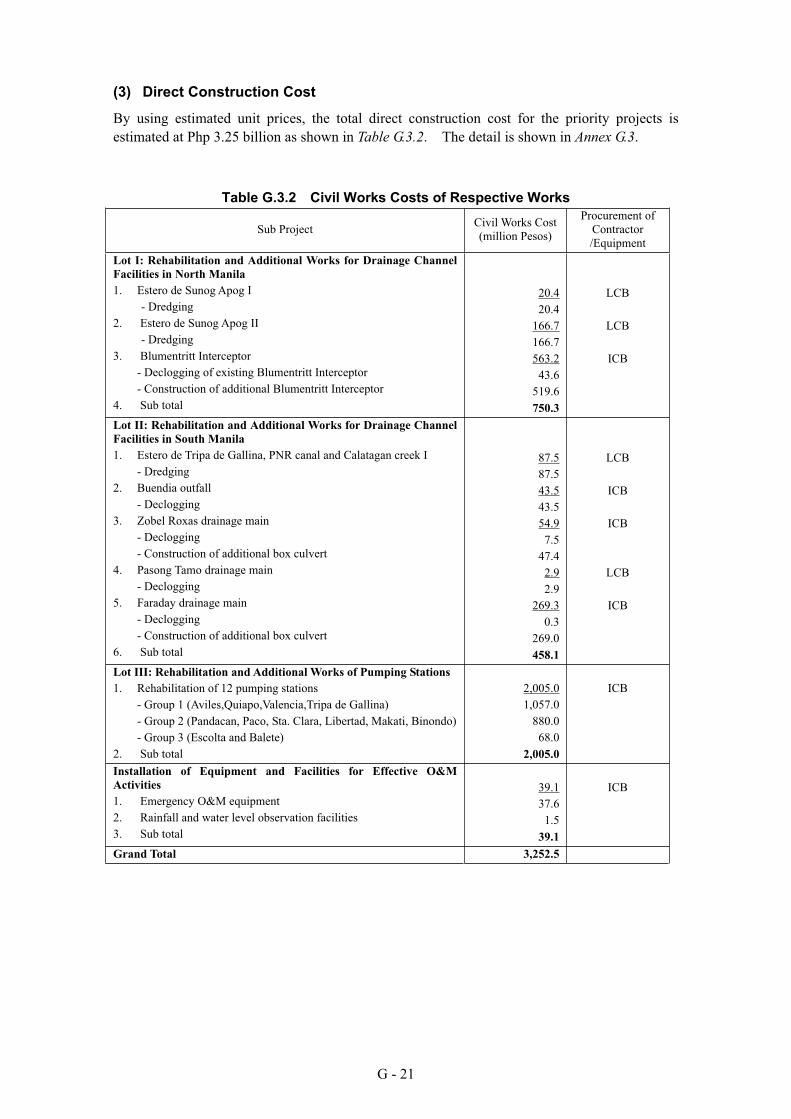
G - 21
(3) Direct Construction Cost
By using estimated unit prices, the total direct construction cost for the priority projects is
estimated at Php 3.25 billion as shown in Table G.3.2. The detail is shown in Annex G.3.
Table G.3.2 Civil Works Costs of Respective Works
Sub Project Civil Works Cost
(million Pesos)
Procurement of
Contractor
/Equipment
Lot I: Rehabilitation and Additional Works for Drainage Channel
Facilities in North Manila
1. Estero de Sunog Apog I
- Dredging
2. Estero de Sunog Apog II
- Dredging
3. Blumentritt Interceptor
- Declogging of existing Blumentritt Interceptor
- Construction of additional Blumentritt Interceptor
4. Sub total
20.4
20.4
166.7
166.7
563.2
43.6
519.6
750.3
LCB
LCB
ICB
Lot II: Rehabilitation and Additional Works for Drainage Channel
Facilities in South Manila
1. Estero de Tripa de Gallina, PNR canal and Calatagan creek I
- Dredging
2. Buendia outfall
- Declogging
3. Zobel Roxas drainage main
- Declogging
- Construction of additional box culvert
4. Pasong Tamo drainage main
- Declogging
5. Faraday drainage main
- Declogging
- Construction of additional box culvert
6. Sub total
87.5
87.5
43.5
43.5
54.9
7.5
47.4
2.9
2.9
269.3
0.3
269.0
458.1
LCB
ICB
ICB
LCB
ICB
Lot III: Rehabilitation and Additional Works of Pumping Stations
1. Rehabilitation of 12 pumping stations
- Group 1 (Aviles,Quiapo,Valencia,Tripa de Gallina)
- Group 2 (Pandacan, Paco, Sta. Clara, Libertad, Makati, Binondo)
- Group 3 (Escolta and Balete)
2. Sub total
2,005.0
1,057.0
880.0
68.0
2,005.0
ICB
Installation of Equipment and Facilities for Effective O&M
Activities
1. Emergency O&M equipment
2. Rainfall and water level observation facilities
3. Sub total
39.1
37.6
1.5
39.1
ICB
Grand Total 3,252.5
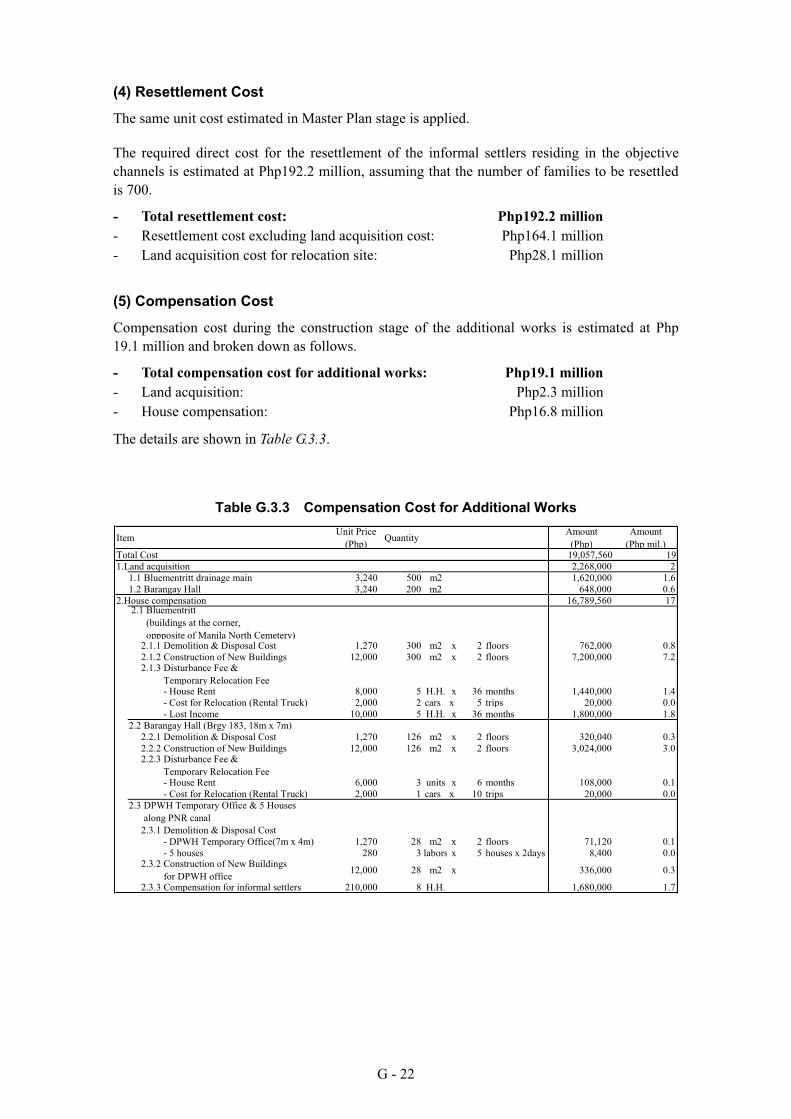
G - 22
(4) Resettlement Cost
The same unit cost estimated in Master Plan stage is applied.
The required direct cost for the resettlement of the informal settlers residing in the objective
channels is estimated at Php192.2 million, assuming that the number of families to be resettled
is 700.
- Total resettlement cost: Php192.2 million
- Resettlement cost excluding land acquisition cost: Php164.1 million
- Land acquisition cost for relocation site: Php28.1 million
(5) Compensation Cost
Compensation cost during the construction stage of the additional works is estimated at Php
19.1 million and broken down as follows.
- Total compensation cost for additional works: Php19.1 million
- Land acquisition: Php2.3 million
- House compensation: Php16.8 million
The details are shown in Table G.3.3.
Table G.3.3 Compensation Cost for Additional Works
ItemUnit Price
(Php)Quantity
Amount
(Php)
Amount
(Php mil.)Total Cost 19,057,560 19
1.Land acquisition 2,268,000 2
1.1 Bluementritt drainage main 3,240 500 m2 1,620,000 1.6
1.2 Barangay Hall 3,240 200 m2 648,000 0.6
2.House compensation 16,789,560 17
2.1.1 Demolition & Disposal Cost 1,270 300 m2 x 2 floors 762,000 0.8
2.1.2 Construction of New Buildings 12,000 300 m2 x 2 floors 7,200,000 7.22.1.3 Disturbance Fee &
Temporary Relocation Fee - House Rent 8,000 5 H.H. x 36 months 1,440,000 1.4
- Cost for Relocation (Rental Truck) 2,000 2 cars x 5 trips 20,000 0.0
- Lost Income 10,000 5 H.H. x 36 months 1,800,000 1.8
2.2 Barangay Hall (Brgy 183, 18m x 7m)
2.2.1 Demolition & Disposal Cost 1,270 126 m2 x 2 floors 320,040 0.3
2.2.2 Construction of New Buildings 12,000 126 m2 x 2 floors 3,024,000 3.02.2.3 Disturbance Fee &
Temporary Relocation Fee - House Rent 6,000 3 units x 6 months 108,000 0.1
- Cost for Relocation (Rental Truck) 2,000 1 cars x 10 trips 20,000 0.0
2.3.1 Demolition & Disposal Cost
- DPWH Temporary Office(7m x 4m) 1,270 28 m2 x 2 floors 71,120 0.1
- 5 houses 280 3 labors x 5 houses x 2days 8,400 0.02.3.2 Construction of New Buildings
for DPWH office12,000 28 m2 x 336,000 0.3
2.3.3 Compensation for informal settlers 210,000 8 H.H. 1,680,000 1.7
2.1 Bluementritt
(buildings at the corner,
oppposite of Manila North Cemetery)
2.3 DPWH Temporary Office & 5 Houses
along PNR canal
G - 23
(6) Cost for Community-Involved Solid Waste Management
For the sustainability of the drainage system in view of daily operation and maintenance
activities, community-involved solid waste management including IEC has been proposed in the
Priority Projects. The cost estimated in Master Plan stage is applied. The required cost for
this item is Php 87.4 million and broken down as follows.
Total cost for community-involved SWM: Php87.2 million
Cost for BEM and Team ESTERO activities: Php63.3 million
Cost for IEC: Php23.9 million
(7) Cost for Installation of Equipment and Facilities for Effective O&M Activities
The break down of this item is given below.
Total cost for installation of equipment and facilities: Php39.1 million
Cost for emergency O&M equipment: Php37.6 million
Cost for additional hydrological equipment: Php1.5 million
(8) Annual O&M Cost
The same annual cost for O&M estimated in Master Plan stage is applied.
- Annual cost for operation and maintenance activities: Php241.0 million
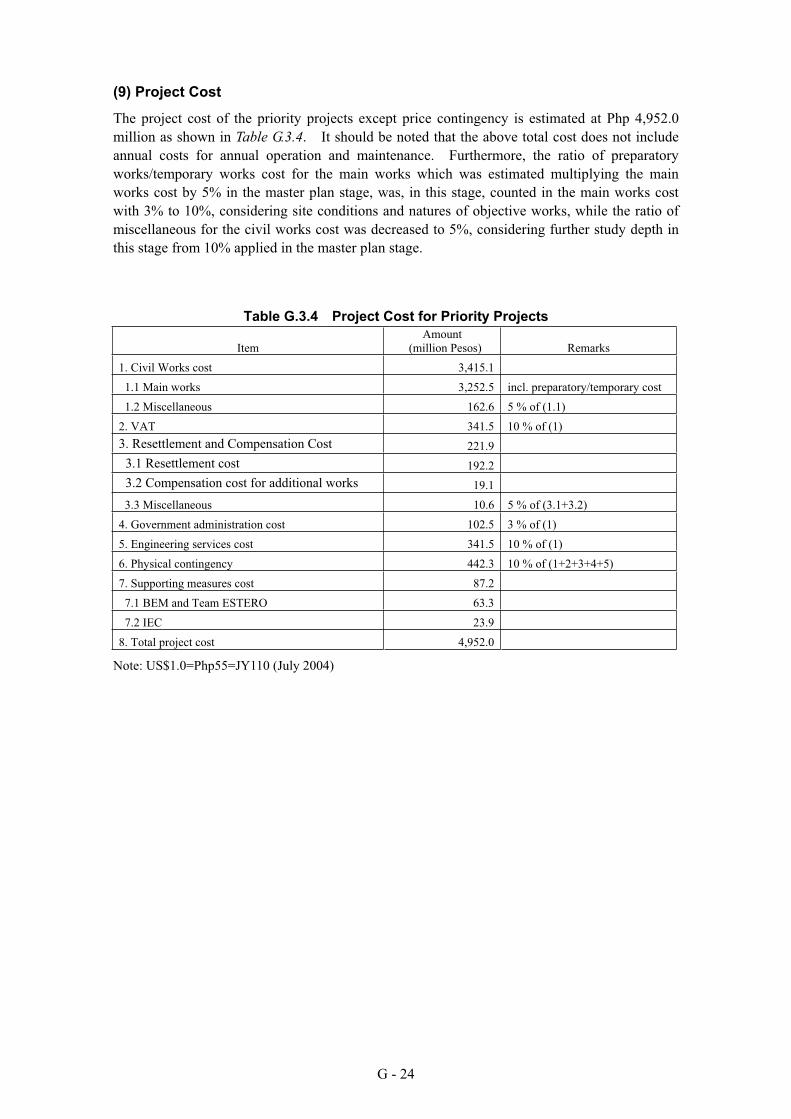
G - 24
(9) Project Cost
The project cost of the priority projects except price contingency is estimated at Php 4,952.0
million as shown in Table G.3.4. It should be noted that the above total cost does not include
annual costs for annual operation and maintenance. Furthermore, the ratio of preparatory
works/temporary works cost for the main works which was estimated multiplying the main
works cost by 5% in the master plan stage, was, in this stage, counted in the main works cost
with 3% to 10%, considering site conditions and natures of objective works, while the ratio of
miscellaneous for the civil works cost was decreased to 5%, considering further study depth in
this stage from 10% applied in the master plan stage.
Table G.3.4 Project Cost for Priority Projects
Item
Amount
(million Pesos) Remarks
1. Civil Works cost 3,415.1
1.1 Main works 3,252.5 incl. preparatory/temporary cost
1.2 Miscellaneous 162.6 5 % of (1.1)
2. VAT 341.5 10 % of (1)
3. Resettlement and Compensation Cost 221.9
3.1 Resettlement cost 192.2
3.2 Compensation cost for additional works 19.1
3.3 Miscellaneous 10.6 5 % of (3.1+3.2)
4. Government administration cost 102.5 3 % of (1)
5. Engineering services cost 341.5 10 % of (1)
6. Physical contingency 442.3 10 % of (1+2+3+4+5)
7. Supporting measures cost 87.2
7.1 BEM and Team ESTERO 63.3
7.2 IEC 23.9
8. Total project cost 4,952.0
Note: US$1.0=Php55=JY110 (July 2004)
ANNEX G.1
COST ESTIMATE FOR WORKS PROPOSED IN MASTER PLAN
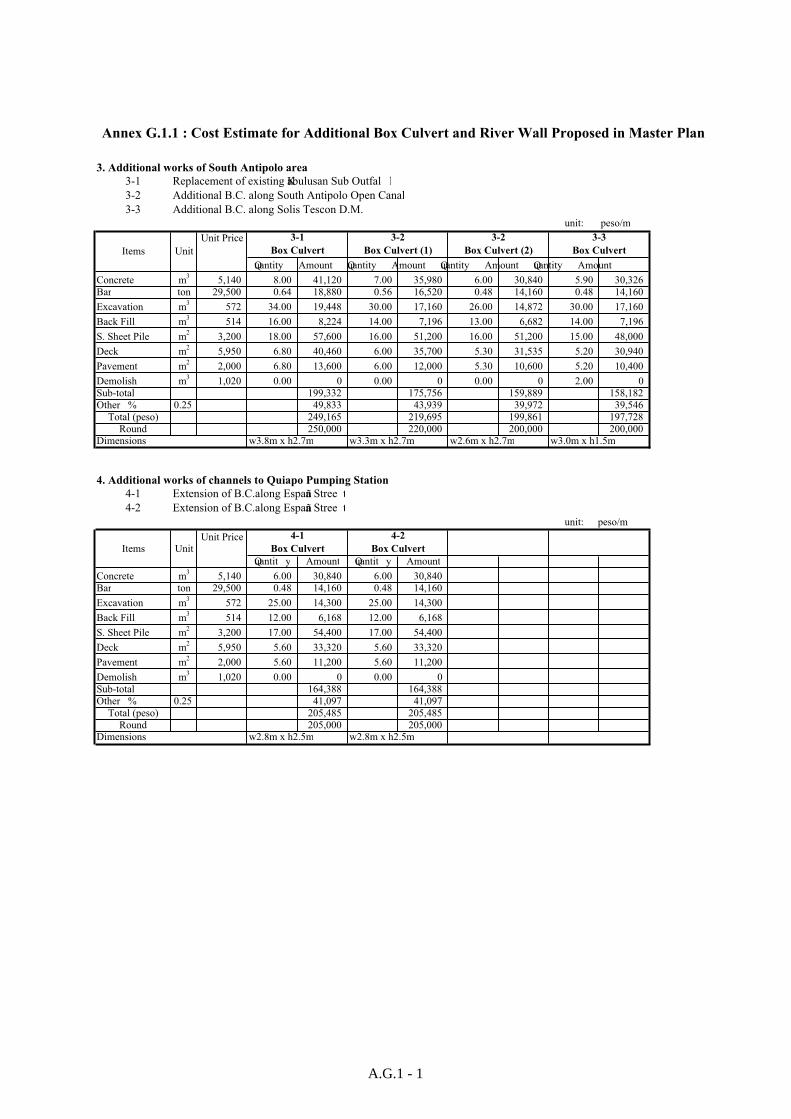
3. Additional works of South Antipolo area
3-1 Replacement of existing Kabulusan Sub Outfal l
3-2 Additional B.C. along South Antipolo Open Canal
3-3 Additional B.C. along Solis Tescon D.M.
unit: peso/m
Quantity Amount Quantity Amount Quantity Amount Quantity Amount
Concrete m3
5,140 8.00 41,120 7.00 35,980 6.00 30,840 5.90 30,326
Bar ton 29,500 0.64 18,880 0.56 16,520 0.48 14,160 0.48 14,160
Excavation m3
572 34.00 19,448 30.00 17,160 26.00 14,872 30.00 17,160
Back Fill m3
514 16.00 8,224 14.00 7,196 13.00 6,682 14.00 7,196
S. Sheet Pile m2
3,200 18.00 57,600 16.00 51,200 16.00 51,200 15.00 48,000
Deck m2
5,950 6.80 40,460 6.00 35,700 5.30 31,535 5.20 30,940
Pavement m2
2,000 6.80 13,600 6.00 12,000 5.30 10,600 5.20 10,400
Demolish m3
1,020 0.00 0 0.00 0 0.00 0 2.00 0
Sub-total 199,332 175,756 159,889 158,182
Other % 0.25 49,833 43,939 39,972 39,546
Total (peso) 249,165 219,695 199,861 197,728
Round 250,000 220,000 200,000 200,000Dimensions w3.8m x h2.7m w3.3m x h2.7m w2.6m x h2.7m w3.0m x h1.5m
4. Additional works of channels to Quiapo Pumping Station
4-1 Extension of B.C.along España Stree t
4-2 Extension of B.C.along España Stree t
unit: peso/m
Quantit y Amount Quantit y Amount
Concrete m3
5,140 6.00 30,840 6.00 30,840
Bar ton 29,500 0.48 14,160 0.48 14,160
Excavation m3
572 25.00 14,300 25.00 14,300
Back Fill m3
514 12.00 6,168 12.00 6,168
S. Sheet Pile m2
3,200 17.00 54,400 17.00 54,400
Deck m2
5,950 5.60 33,320 5.60 33,320
Pavement m2
2,000 5.60 11,200 5.60 11,200
Demolish m3
1,020 0.00 0 0.00 0
Sub-total 164,388 164,388
Other % 0.25 41,097 41,097
Total (peso) 205,485 205,485
Round 205,000 205,000 Dimensions w2.8m x h2.5m w2.8m x h2.5m
Items Unit
Unit Price
Items
3-2
Box Culvert (2)
4-2
Box Culvert
4-1
Box Culvert
3-1
Box Culvert
3-2
Box Culvert (1)
3-3
Box Culvert
Annex G.1.1 : Cost Estimate for Additional Box Culvert and River Wall Proposed in Master Plan
UnitUnit Price
A.G.1 - 1
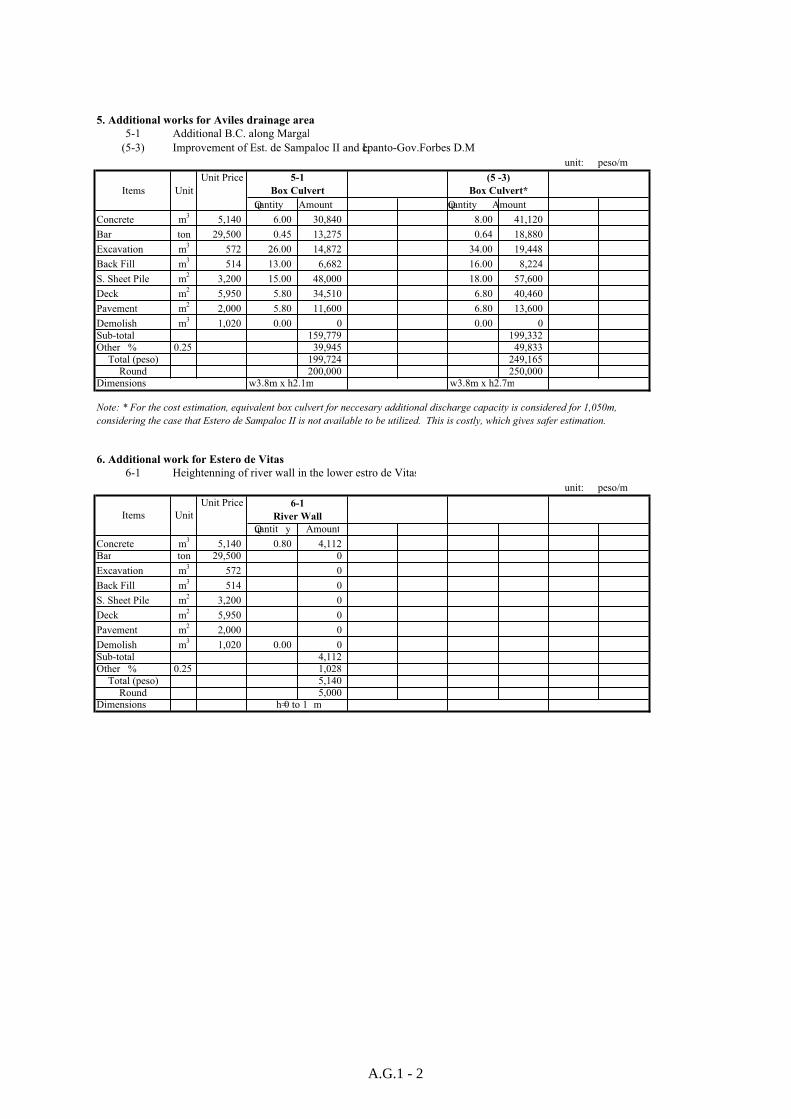
5. Additional works for Aviles drainage area
5-1 Additional B.C. along Margal
(5-3) Improvement of Est. de Sampaloc II and Lepanto-Gov.Forbes D.M
unit: peso/m
Quantity Amount Quantity Amount
Concrete m3
5,140 6.00 30,840 8.00 41,120
Bar ton 29,500 0.45 13,275 0.64 18,880
Excavation m3
572 26.00 14,872 34.00 19,448
Back Fill m3
514 13.00 6,682 16.00 8,224
S. Sheet Pile m2
3,200 15.00 48,000 18.00 57,600
Deck m2
5,950 5.80 34,510 6.80 40,460
Pavement m2
2,000 5.80 11,600 6.80 13,600
Demolish m3
1,020 0.00 0 0.00 0
Sub-total 159,779 199,332
Other % 0.25 39,945 49,833
Total (peso) 199,724 249,165
Round 200,000 250,000 Dimensions w3.8m x h2.1m w3.8m x h2.7m
6. Additional work for Estero de Vitas
6-1 Heightenning of river wall in the lower estro de Vitas
unit: peso/m
Quantit y Amount
Concrete m3
5,140 0.80 4,112
Bar ton 29,500 0
Excavation m3
572 0
Back Fill m3
514 0
S. Sheet Pile m2
3,200 0
Deck m2
5,950 0
Pavement m2
2,000 0
Demolish m3
1,020 0.00 0
Sub-total 4,112
Other % 0.25 1,028
Total (peso) 5,140
Round 5,000 Dimensions
5-1
Box Culvert
Note: * For the cost estimation, equivalent box culvert for neccesary additional discharge capacity is considered for 1,050m,
considering the case that Estero de Sampaloc II is not available to be utilized. This is costly, which gives safer estimation.
UnitItems
h= 0 to 1 m
Unit Price
(5 -3)
Box Culvert*
6-1
River Wall
Items Unit
Unit Price
A.G.1 - 2
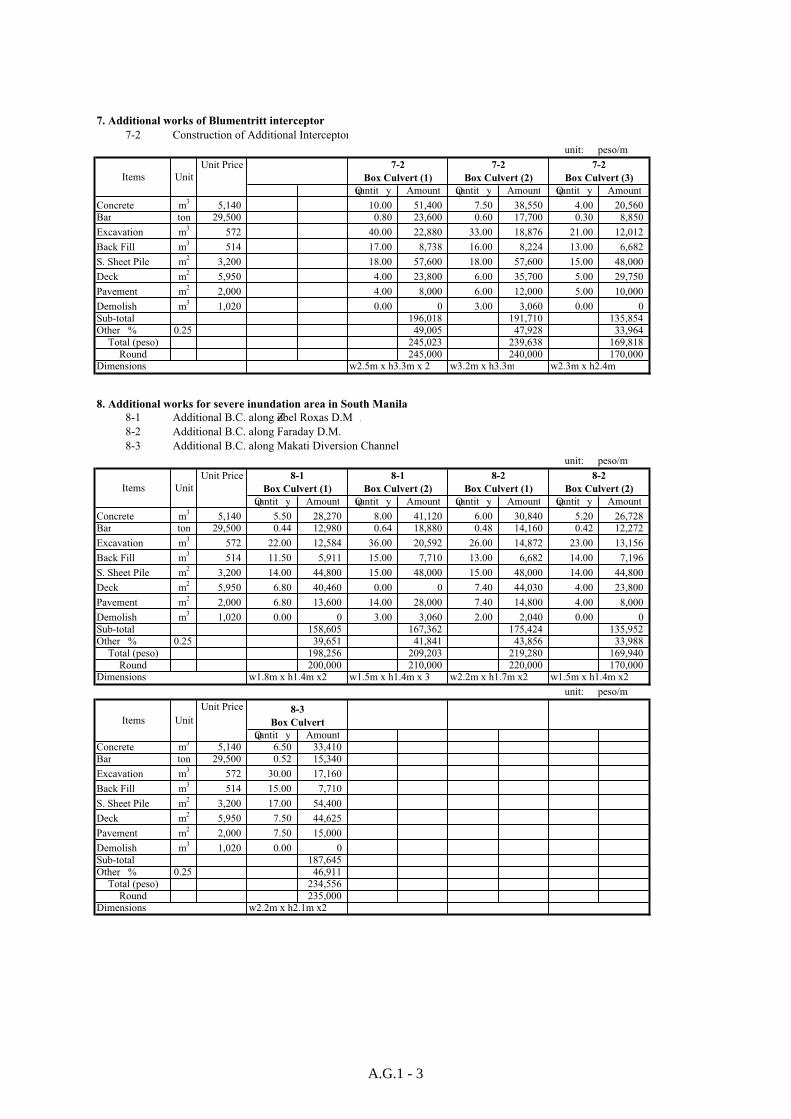
7. Additional works of Blumentritt interceptor
7-2 Construction of Additional Interceptor
unit: peso/m
Quantit y Amount Quantit y Amount Quantit y Amount
Concrete m3
5,140 10.00 51,400 7.50 38,550 4.00 20,560
Bar ton 29,500 0.80 23,600 0.60 17,700 0.30 8,850
Excavation m3
572 40.00 22,880 33.00 18,876 21.00 12,012
Back Fill m3
514 17.00 8,738 16.00 8,224 13.00 6,682
S. Sheet Pile m2
3,200 18.00 57,600 18.00 57,600 15.00 48,000
Deck m2
5,950 4.00 23,800 6.00 35,700 5.00 29,750
Pavement m2
2,000 4.00 8,000 6.00 12,000 5.00 10,000
Demolish m3
1,020 0.00 0 3.00 3,060 0.00 0
Sub-total 196,018 191,710 135,854
Other % 0.25 49,005 47,928 33,964
Total (peso) 245,023 239,638 169,818
Round 245,000 240,000 170,000Dimensions w2.5m x h3.3m x 2 w3.2m x h3.3m w2.3m x h2.4m
8. Additional works for severe inundation area in South Manila
8-1 Additional B.C. along Zobel Roxas D.M .
8-2 Additional B.C. along Faraday D.M.
8-3 Additional B.C. along Makati Diversion Channel
unit: peso/m
Quantit y Amount Quantit y Amount Quantit y Amount Quantit y Amount
Concrete m3
5,140 5.50 28,270 8.00 41,120 6.00 30,840 5.20 26,728
Bar ton 29,500 0.44 12,980 0.64 18,880 0.48 14,160 0.42 12,272
Excavation m3
572 22.00 12,584 36.00 20,592 26.00 14,872 23.00 13,156
Back Fill m3
514 11.50 5,911 15.00 7,710 13.00 6,682 14.00 7,196
S. Sheet Pile m2
3,200 14.00 44,800 15.00 48,000 15.00 48,000 14.00 44,800
Deck m2
5,950 6.80 40,460 0.00 0 7.40 44,030 4.00 23,800
Pavement m2
2,000 6.80 13,600 14.00 28,000 7.40 14,800 4.00 8,000
Demolish m3
1,020 0.00 0 3.00 3,060 2.00 2,040 0.00 0
Sub-total 158,605 167,362 175,424 135,952
Other % 0.25 39,651 41,841 43,856 33,988
Total (peso) 198,256 209,203 219,280 169,940
Round 200,000 210,000 220,000 170,000Dimensions w1.8m x h1.4m x2 w1.5m x h1.4m x 3 w2.2m x h1.7m x2 w1.5m x h1.4m x2
unit: peso/m
Quantit y Amount
Concrete m3
5,140 6.50 33,410
Bar ton 29,500 0.52 15,340
Excavation m3
572 30.00 17,160
Back Fill m3
514 15.00 7,710
S. Sheet Pile m2
3,200 17.00 54,400
Deck m2
5,950 7.50 44,625
Pavement m2
2,000 7.50 15,000
Demolish m3
1,020 0.00 0
Sub-total 187,645
Other % 0.25 46,911
Total (peso) 234,556
Round 235,000 Dimensions w2.2m x h2.1m x2
Items Unit
Unit Price 8-3
Box Culvert
7-2
Box Culvert (3)
Items Unit
Unit Price
Unit Price
UnitItems
8-1
Box Culvert (1)
8-1
Box Culvert (2)
8-2
Box Culvert (1)
8-2
Box Culvert (2)
7-2
Box Culvert (1)
7-2
Box Culvert (2)
A.G.1 - 3
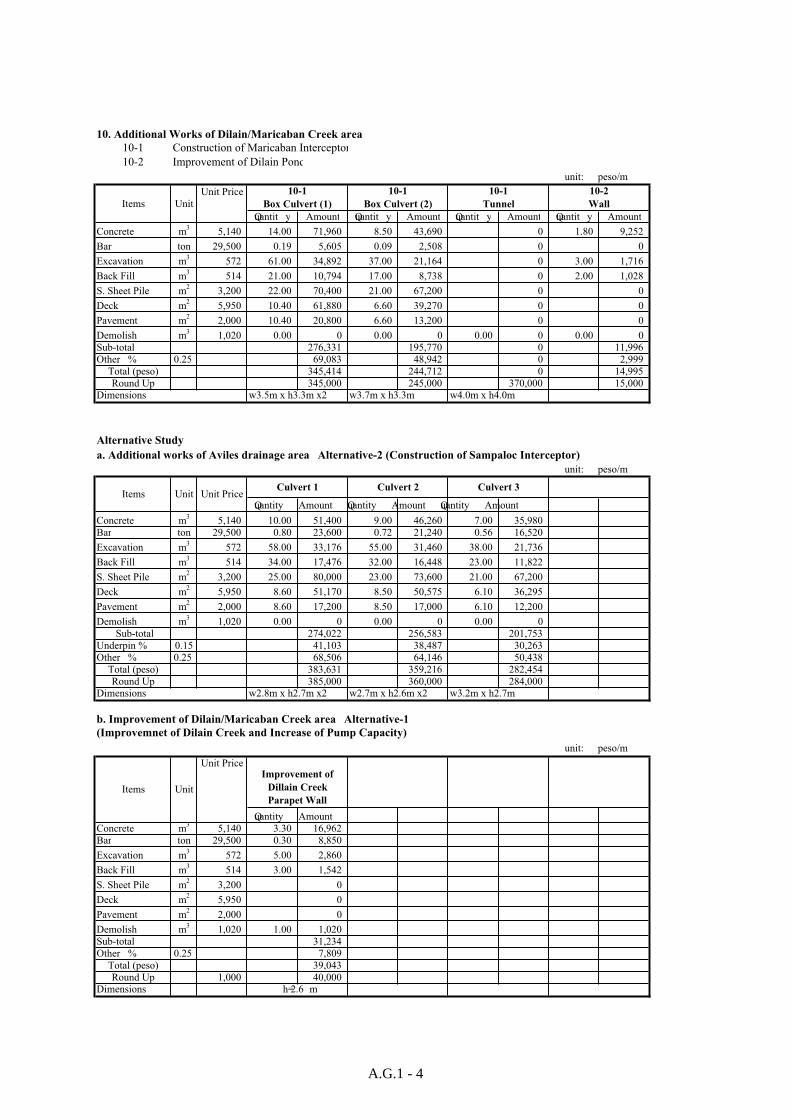
10. Additional Works of Dilain/Maricaban Creek area
10-1 Construction of Maricaban Interceptor
10-2 Improvement of Dilain Pond
unit: peso/m
Quantit y Amount Quantit y Amount Quantit y Amount Quantit y Amount
Concrete m3
5,140 14.00 71,960 8.50 43,690 0 1.80 9,252
Bar ton 29,500 0.19 5,605 0.09 2,508 0 0
Excavation m3
572 61.00 34,892 37.00 21,164 0 3.00 1,716
Back Fill m3
514 21.00 10,794 17.00 8,738 0 2.00 1,028
S. Sheet Pile m2
3,200 22.00 70,400 21.00 67,200 0 0
Deck m2
5,950 10.40 61,880 6.60 39,270 0 0
Pavement m2
2,000 10.40 20,800 6.60 13,200 0 0
Demolish m3
1,020 0.00 0 0.00 0 0.00 0 0.00 0
Sub-total 276,331 195,770 0 11,996
Other % 0.25 69,083 48,942 0 2,999
Total (peso) 345,414 244,712 0 14,995
Round Up 345,000 245,000 370,000 15,000Dimensions w3.5m x h3.3m x2 w3.7m x h3.3m w4.0m x h4.0m
Alternative Study
a. Additional works of Aviles drainage area Alternative-2 (Construction of Sampaloc Interceptor)
unit: peso/m
Quantity Amount Quantity Amount Quantity Amount
Concrete m3
5,140 10.00 51,400 9.00 46,260 7.00 35,980
Bar ton 29,500 0.80 23,600 0.72 21,240 0.56 16,520
Excavation m3
572 58.00 33,176 55.00 31,460 38.00 21,736
Back Fill m3
514 34.00 17,476 32.00 16,448 23.00 11,822
S. Sheet Pile m2
3,200 25.00 80,000 23.00 73,600 21.00 67,200
Deck m2
5,950 8.60 51,170 8.50 50,575 6.10 36,295
Pavement m2
2,000 8.60 17,200 8.50 17,000 6.10 12,200
Demolish m3
1,020 0.00 0 0.00 0 0.00 0
Sub-total 274,022 256,583 201,753
Underpin % 0.15 41,103 38,487 30,263
Other % 0.25 68,506 64,146 50,438
Total (peso) 383,631 359,216 282,454
Round Up 385,000 360,000 284,000Dimensions w2.8m x h2.7m x2 w2.7m x h2.6m x2 w3.2m x h2.7m
b. Improvement of Dilain/Maricaban Creek area Alternative-1
(Improvemnet of Dilain Creek and Increase of Pump Capacity)
unit: peso/m
Quantity Amount
Concrete m3
5,140 3.30 16,962
Bar ton 29,500 0.30 8,850
Excavation m3
572 5.00 2,860
Back Fill m3
514 3.00 1,542
S. Sheet Pile m2
3,200 0
Deck m2
5,950 0
Pavement m2
2,000 0
Demolish m3
1,020 1.00 1,020
Sub-total 31,234
Other % 0.25 7,809
Total (peso) 39,043
Round Up 1,000 40,000 Dimensions
Culvert 1 Culvert 2 Culvert 3
10-1
Box Culvert (2)
10-1
Tunnel
10-2
WallUnit
Unit Price
h= 2.6 m
10-1
Box Culvert (1)
Items Unit
Unit PriceImprovement of
Dillain Creek
Parapet Wall
Items
Items
Unit Unit Price
A.G.1 - 4
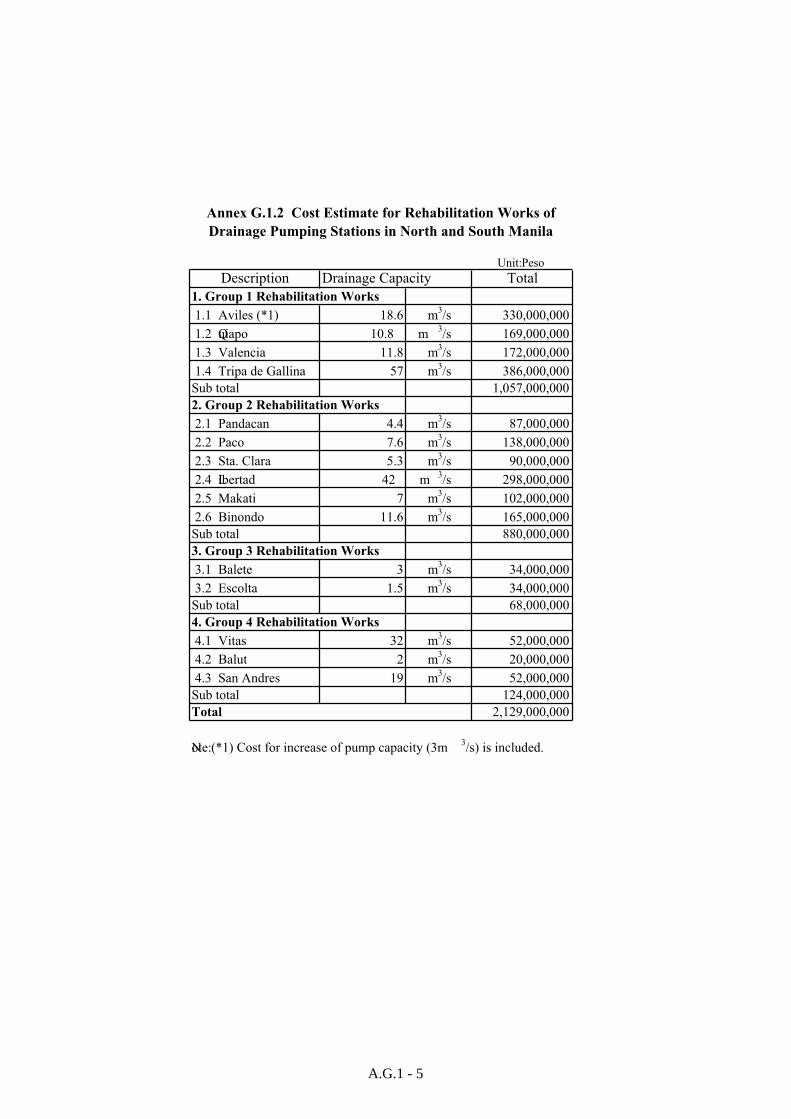
Unit: Peso
Description Drainage Capacity Total
1. Group 1 Rehabilitation Works
1.1 Aviles (*1) 18.6 m3/s 330,000,000
1.2 Quiapo 10.8 m3/s 169,000,000
1.3 Valencia 11.8 m3/s 172,000,000
1.4 Tripa de Gallina 57 m3/s 386,000,000
Sub total 1,057,000,000
2. Group 2 Rehabilitation Works
2.1 Pandacan 4.4 m3/s 87,000,000
2.2 Paco 7.6 m3/s 138,000,000
2.3 Sta. Clara 5.3 m3/s 90,000,000
2.4 Libertad 42 m3/s 298,000,000
2.5 Makati 7 m3/s 102,000,000
2.6 Binondo 11.6 m3/s 165,000,000
Sub total 880,000,000
3. Group 3 Rehabilitation Works
3.1 Balete 3 m3/s 34,000,000
3.2 Escolta 1.5 m3/s 34,000,000
Sub total 68,000,000
4. Group 4 Rehabilitation Works
4.1 Vitas 32 m3/s 52,000,000
4.2 Balut 2 m3/s 20,000,000
4.3 San Andres 19 m3/s 52,000,000
Sub total 124,000,000
2,129,000,000
Note: (*1) Cost for increase of pump capacity (3m3/s) is included.
Total
Annex G.1.2 Cost Estimate for Rehabilitation Works of
Drainage Pumping Stations in North and South Manila
A.G.1 - 5
ANNEX G.2
UNIT PRICE FOR MAJOR WORKS OF PRIORITY PROJECTS
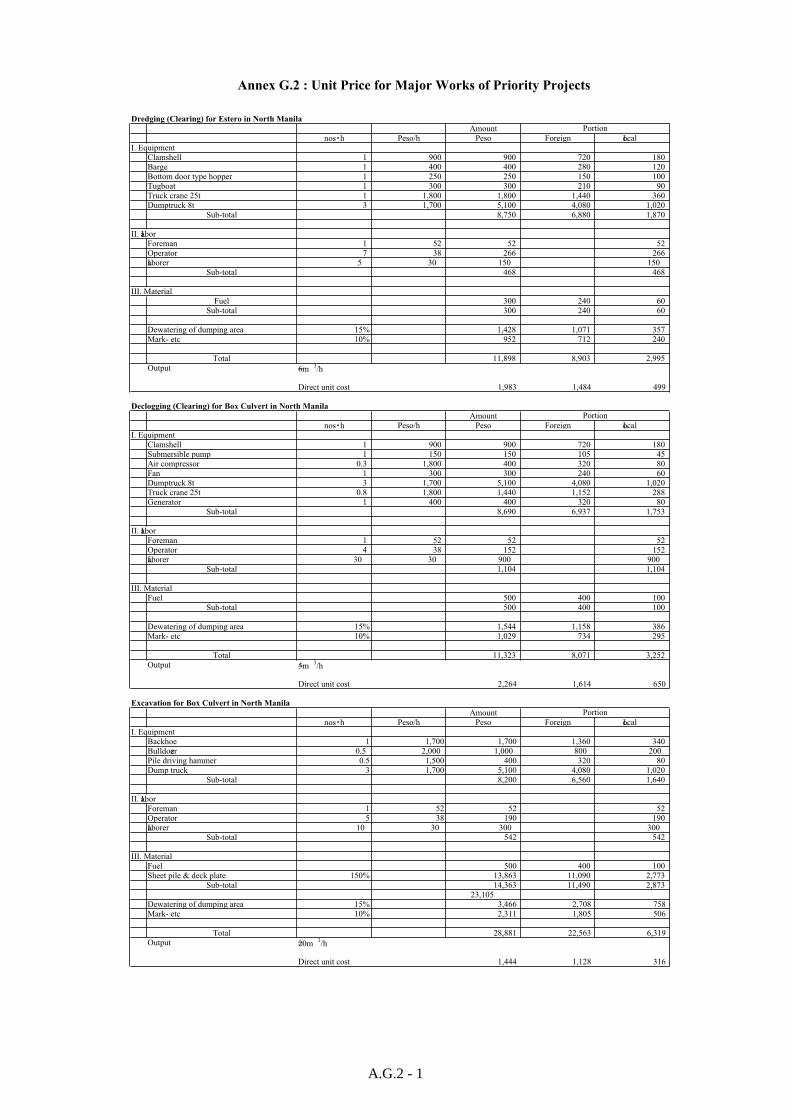
Annex G.2 : Unit Price for Major Works of Priority Projects
Amount
nos h Peso/h Peso Foreign Local
I. Equipment
Clamshell 1 900 900 720 180
Barge 1 400 400 280 120
Bottom door type hopper 1 250 250 150 100
Tugboat 1 300 300 210 90
Truck crane 25t 1 1,800 1,800 1,440 360
Dumptruck 8t 3 1,700 5,100 4,080 1,020
Sub-total 8,750 6,880 1,870
II. Labor
Foreman 1 52 52 52
Operator 7 38 266 266
Laborer 5 30 150 150
Sub-total 468 468
III. Material
Fuel 300 240 60
Sub-total 300 240 60
Dewatering of dumping area 15% 1,428 1,071 357
Mark- etc 10% 952 712 240
Total 11,898 8,903 2,995
Output =6m3/h
Direct unit cost 1,983 1,484 499
Amount
nos h Peso/h Peso Foreign Local
I. Equipment
Clamshell 1 900 900 720 180
Submersible pump 1 150 150 105 45
Air compressor 0.3 1,800 400 320 80
Fan 1 300 300 240 60
Dumptruck 8t 3 1,700 5,100 4,080 1,020
Truck crane 25t 0.8 1,800 1,440 1,152 288
Generator 1 400 400 320 80
Sub-total 8,690 6,937 1,753
II. Labor
Foreman 1 52 52 52
Operator 4 38 152 152
Laborer 30 30 900 900
Sub-total 1,104 1,104
III. Material
Fuel 500 400 100
Sub-total 500 400 100
Dewatering of dumping area 15% 1,544 1,158 386
Mark- etc 10% 1,029 734 295
Total 11,323 8,071 3,252
Output =5m3/h
Direct unit cost 2,264 1,614 650
Amount
nos h Peso/h Peso Foreign Local
I. Equipment
Backhoe 1 1,700 1,700 1,360 340
Bulldozer 0.5 2,000 1,000 800 200
Pile driving hammer 0.5 1,500 400 320 80
Dump truck 3 1,700 5,100 4,080 1,020
Sub-total 8,200 6,560 1,640
II. Labor
Foreman 1 52 52 52
Operator 5 38 190 190
Laborer 10 30 300 300
Sub-total 542 542
III. Material
Fuel 500 400 100
Sheet pile & deck plate 150% 13,863 11,090 2,773
Sub-total 14,363 11,490 2,873
23,105
Dewatering of dumping area 15% 3,466 2,708 758
Mark- etc 10% 2,311 1,805 506
Total 28,881 22,563 6,319
Output =20m3/h
Direct unit cost 1,444 1,128 316
PortionDredging (Clearing) for Estero in North Manila
PortionDeclogging (Clearing) for Box Culvert in North Manila
PortionExcavation for Box Culvert in North Manila
A.G.2 - 1
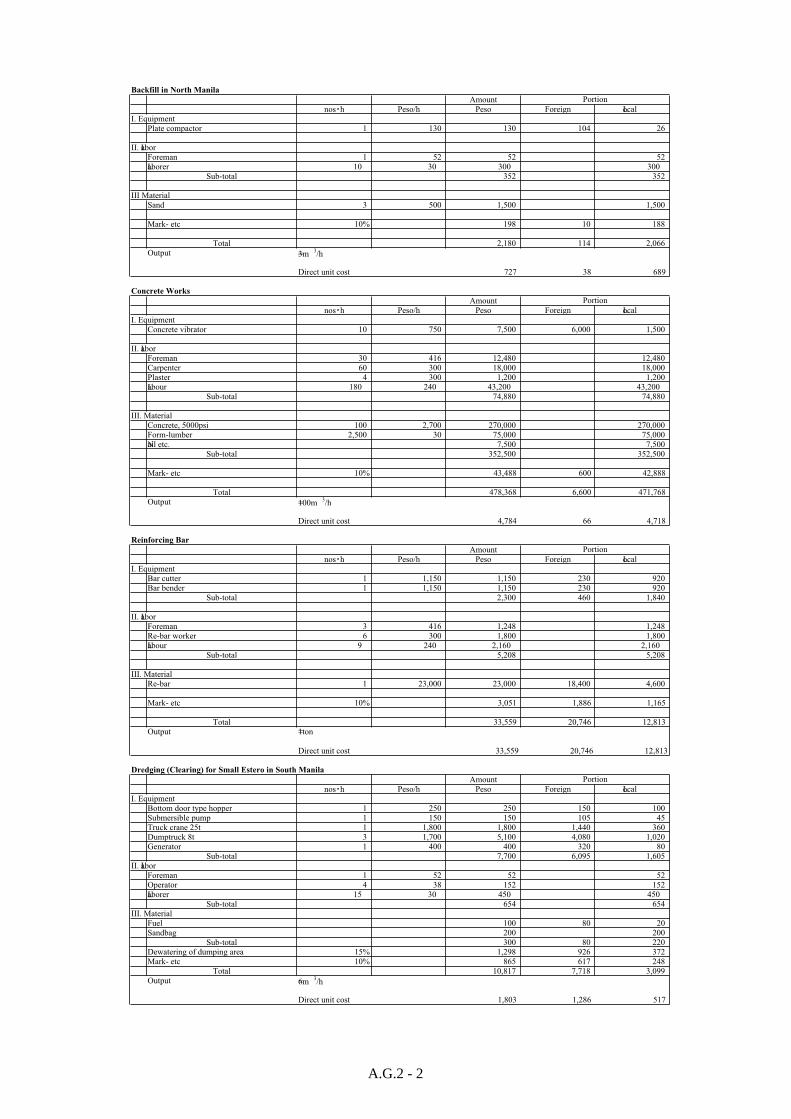
Amount
nos h Peso/h Peso Foreign Local
I. Equipment
Plate compactor 1 130 130 104 26
II. Labor
Foreman 1 52 52 52
Laborer 10 30 300 300
Sub-total 352 352
III Material
Sand 3 500 1,500 1,500
Mark- etc 10% 198 10 188
Total 2,180 114 2,066
Output =3m3/h
Direct unit cost 727 38 689
Amount
nos h Peso/h Peso Foreign Local
I. Equipment
Concrete vibrator 10 750 7,500 6,000 1,500
II. Labor
Foreman 30 416 12,480 12,480
Carpenter 60 300 18,000 18,000
Plaster 4 300 1,200 1,200
Labour 180 240 43,200 43,200
Sub-total 74,880 74,880
III. Material
Concrete, 5000psi 100 2,700 270,000 270,000
Form-lumber 2,500 30 75,000 75,000
Nail etc. 7,500 7,500
Sub-total 352,500 352,500
Mark- etc 10% 43,488 600 42,888
Total 478,368 6,600 471,768
Output =100m3/h
Direct unit cost 4,784 66 4,718
Amount
nos h Peso/h Peso Foreign Local
I. Equipment
Bar cutter 1 1,150 1,150 230 920
Bar bender 1 1,150 1,150 230 920
Sub-total 2,300 460 1,840
II. Labor
Foreman 3 416 1,248 1,248
Re-bar worker 6 300 1,800 1,800
Labour 9 240 2,160 2,160
Sub-total 5,208 5,208
III. Material
Re-bar 1 23,000 23,000 18,400 4,600
Mark- etc 10% 3,051 1,886 1,165
Total 33,559 20,746 12,813
Output =1ton
Direct unit cost 33,559 20,746 12,813
Amount
nos h Peso/h Peso Foreign Local
I. Equipment
Bottom door type hopper 1 250 250 150 100
Submersible pump 1 150 150 105 45
Truck crane 25t 1 1,800 1,800 1,440 360
Dumptruck 8t 3 1,700 5,100 4,080 1,020
Generator 1 400 400 320 80
Sub-total 7,700 6,095 1,605
II. Labor
Foreman 1 52 52 52
Operator 4 38 152 152
Laborer 15 30 450 450
Sub-total 654 654
III. Material
Fuel 100 80 20
Sandbag 200 200
Sub-total 300 80 220
Dewatering of dumping area 15% 1,298 926 372
Mark- etc 10% 865 617 248
Total 10,817 7,718 3,099
Output =6m3/h
Direct unit cost 1,803 1,286 517
PortionBackfill in North Manila
PortionConcrete Works
PortionReinforcing Bar
Dredging (Clearing) for Small Estero in South Manila
Portion
A.G.2 - 2
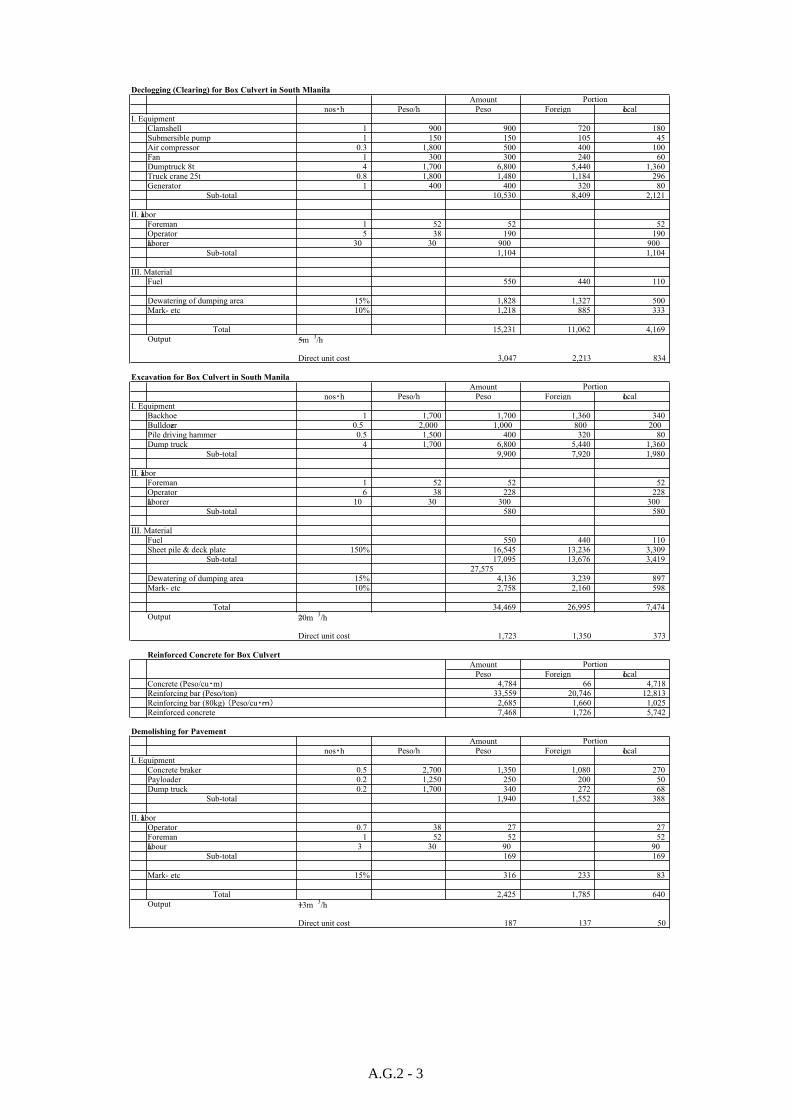
Amount
nos h Peso/h Peso Foreign Local
I. Equipment
Clamshell 1 900 900 720 180
Submersible pump 1 150 150 105 45
Air compressor 0.3 1,800 500 400 100
Fan 1 300 300 240 60
Dumptruck 8t 4 1,700 6,800 5,440 1,360
Truck crane 25t 0.8 1,800 1,480 1,184 296
Generator 1 400 400 320 80
Sub-total 10,530 8,409 2,121
II. Labor
Foreman 1 52 52 52
Operator 5 38 190 190
Laborer 30 30 900 900
Sub-total 1,104 1,104
III. Material
Fuel 550 440 110
Dewatering of dumping area 15% 1,828 1,327 500
Mark- etc 10% 1,218 885 333
Total 15,231 11,062 4,169
Output =5m3/h
Direct unit cost 3,047 2,213 834
Amount
nos h Peso/h Peso Foreign Local
I. Equipment
Backhoe 1 1,700 1,700 1,360 340
Bulldozer 0.5 2,000 1,000 800 200
Pile driving hammer 0.5 1,500 400 320 80
Dump truck 4 1,700 6,800 5,440 1,360
Sub-total 9,900 7,920 1,980
II. Labor
Foreman 1 52 52 52
Operator 6 38 228 228
Laborer 10 30 300 300
Sub-total 580 580
III. Material
Fuel 550 440 110
Sheet pile & deck plate 150% 16,545 13,236 3,309
Sub-total 17,095 13,676 3,419
27,575
Dewatering of dumping area 15% 4,136 3,239 897
Mark- etc 10% 2,758 2,160 598
Total 34,469 26,995 7,474
Output =20m3/h
Direct unit cost 1,723 1,350 373
Amount
Peso Foreign Local
Concrete (Peso/cu m) 4,784 66 4,718
Reinforcing bar (Peso/ton) 33,559 20,746 12,813
Reinforcing bar (80kg) Peso/cu 2,685 1,660 1,025
Reinforced concrete 7,468 1,726 5,742
Amount
nos h Peso/h Peso Foreign Local
I. Equipment
Concrete braker 0.5 2,700 1,350 1,080 270
Payloader 0.2 1,250 250 200 50
Dump truck 0.2 1,700 340 272 68
Sub-total 1,940 1,552 388
II. Labor
Operator 0.7 38 27 27
Foreman 1 52 52 52
Labour 3 30 90 90
Sub-total 169 169
Mark- etc 15% 316 233 83
Total 2,425 1,785 640
Output =13m3/h
Direct unit cost 187 137 50
PortionDeclogging (Clearing) for Box Culvert in South Mlanila
PortionExcavation for Box Culvert in South Manila
PortionDemolishing for Pavement
PortionReinforced Concrete for Box Culvert
A.G.2 - 3
ANNEX G.3
COST ESTIMATE FOR RESPECTIVE REHABILITATION AND
ADDITIONAL WORKS OF PRIORITY PROJECTS
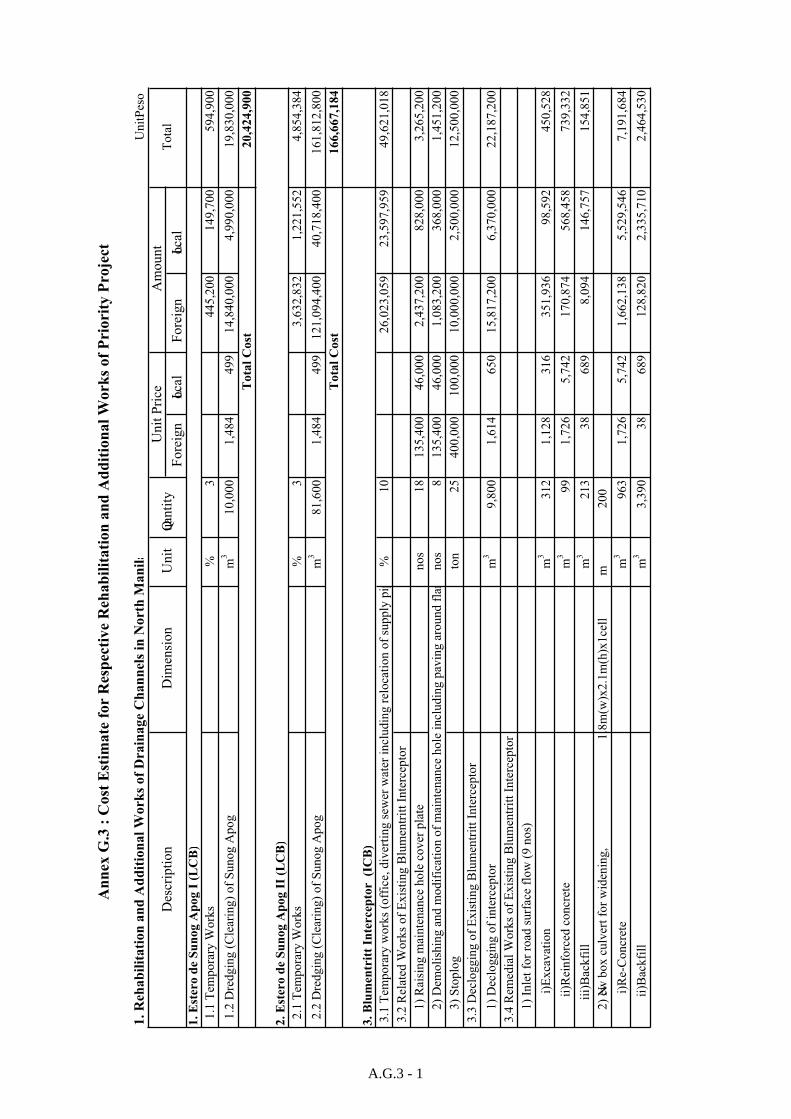
A
nn
ex G
.3 :
Cost
Est
ima
te f
or R
esp
ecti
ve R
eh
ab
ilit
ati
on
an
d A
dd
itio
na
l W
ork
s o
f P
rio
rit
y P
ro
ject
1. R
eh
ab
ilit
ati
on
an
d A
dd
itio
nal
Work
s of
Drain
age C
han
nels
in
North
Man
ila
Unit
:Pes
o
Fore
ign
Loca
lF
ore
ign
Loca
l
1
.1 T
emp
ora
ry W
ork
s%
3445,2
00
149,7
00
594,9
00
1
.2 D
red
gin
g (
Cle
arin
g)
of
Su
no
g A
po
gm
31
0,0
00
1,4
84
499
14,8
40,0
00
4,9
90,0
00
19,8
30,0
00
20,4
24,9
00
2
.1 T
emp
ora
ry W
ork
s%
33,6
32,8
32
1,2
21,5
52
4,8
54,3
84
2
.2 D
red
gin
g (
Cle
arin
g)
of
Su
no
g A
po
gm
38
1,6
00
1,4
84
499
121,0
94,4
00
40,7
18,4
00
161,8
12,8
00
166,6
67,1
84
3.1
Tem
po
rary
wo
rks
(off
ice,
div
erti
ng
sew
er w
ater
in
clu
din
g r
elo
cati
on
of
sup
ply
pip
%1
026,0
23,0
59
23,5
97,9
59
49,6
21,0
18
3.2
Rel
ated
Wo
rks
of
Ex
isti
ng
Blu
men
trit
t In
terc
epto
r
1)
Rai
sin
g m
ain
ten
ance
ho
le c
ov
er p
late
no
s1
81
35
,400
46,0
00
2,4
37,2
00
828,0
00
3,2
65,2
00
2)
Dem
oli
shin
g a
nd
mo
dif
icat
ion
of
mai
nte
nan
ce h
ole
in
clu
din
g p
avin
g a
rou
nd
fla
mn
os
81
35
,400
46,0
00
1,0
83,2
00
368,0
00
1,4
51,2
00
3)
Sto
plo
gto
n2
54
00
,000
100,0
00
10,0
00,0
00
2,5
00,0
00
12,5
00,0
00
3.3
Dec
log
gin
g o
f E
xis
tin
g B
lum
entr
itt
Inte
rcep
tor
1)
Dec
log
gin
g o
f in
terc
epto
rm
39
,80
01
,614
650
15,8
17,2
00
6,3
70,0
00
22,1
87,2
00
3.4
Rem
edia
l W
ork
s o
f E
xis
tin
g B
lum
entr
itt
Inte
rcep
tor
1)
Inle
t fo
r ro
ad s
urf
ace
flo
w (
9 n
os)
i)
Ex
cav
atio
nm
33
12
1,1
28
316
351,9
36
98,5
92
450,5
28
ii)
Rei
nfo
rced
co
ncr
ete
m3
99
1,7
26
5,7
42
170,8
74
568,4
58
739,3
32
iii)
Bac
kfi
llm
32
13
38
689
8,0
94
146,7
57
154,8
51
2)
New b
ox
cu
lver
t fo
r w
iden
ing
, 1
.8m
(w)x
2.1
m(h
)x1
cell
m2
00
i)
Re-
Co
ncr
ete
m3
96
31
,726
5,7
42
1,6
62,1
38
5,5
29,5
46
7,1
91,6
84
ii)
Bac
kfi
llm
33
,39
038
689
128,8
20
2,3
35,7
10
2,4
64,5
30
Tota
l C
ost
Tota
l C
ost
Des
crip
tion
Dim
ensi
on
Unit
Quan
tity
3.
Blu
men
trit
t In
tercep
tor
(IC
B)
Tota
lU
nit
Pri
ceA
mo
un
t
1.
Est
ero
de S
un
og
Ap
og
I (
LC
B)
2.
Est
ero
de S
un
og
Ap
og
II
(LC
B)
A.G.3 - 1
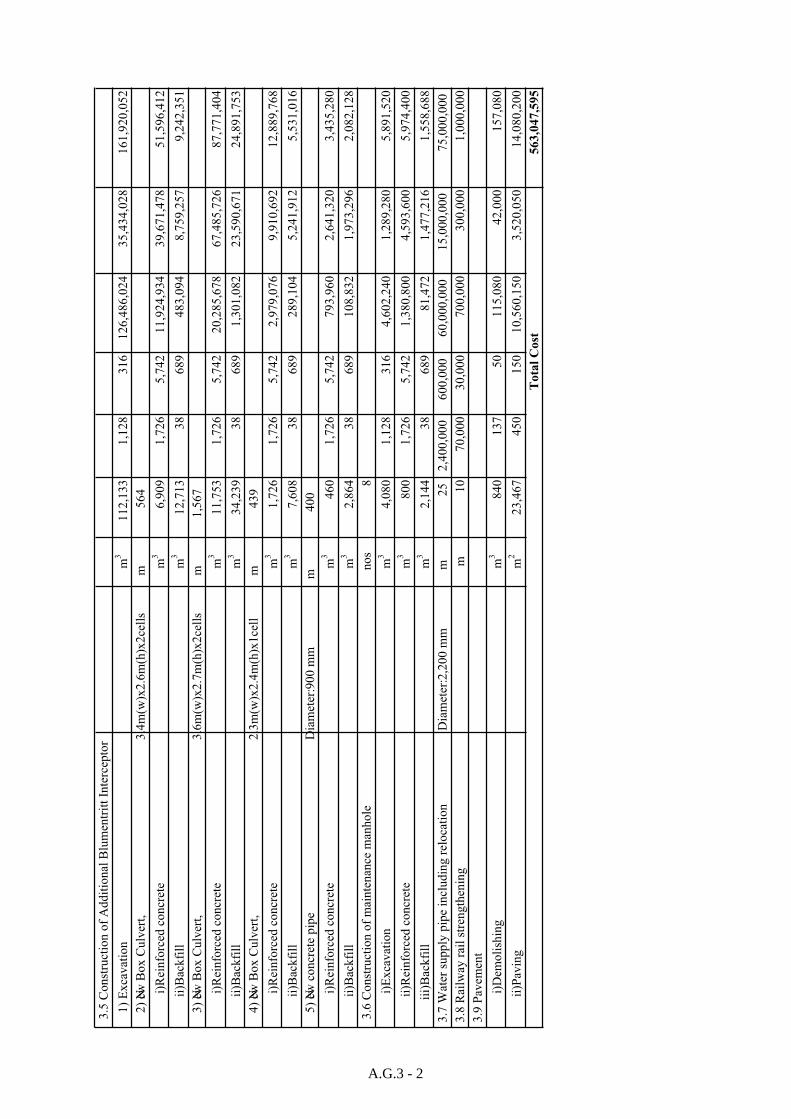
3
.5 C
on
stru
ctio
n o
f A
dd
itio
nal
Blu
men
trit
t In
terc
epto
r
1)
Ex
cav
atio
n
m3
11
2,1
33
1,1
28
316
126,4
86,0
24
35,4
34,0
28
161,9
20,0
52
2)
New B
ox
Cu
lver
t,
3.4
m(w
)x2
.6m
(h)x
2ce
lls
m5
64
i)
Rei
nfo
rced
co
ncr
ete
m3
6,9
09
1,7
26
5,7
42
11,9
24,9
34
39,6
71,4
78
51,5
96,4
12
ii)
Bac
kfi
llm
31
2,7
13
38
689
483,0
94
8,7
59,2
57
9,2
42,3
51
3)
New B
ox
Cu
lver
t,
3.6
m(w
)x2
.7m
(h)x
2ce
lls
m1
,56
7
i)
Rei
nfo
rced
co
ncr
ete
m3
11
,75
31
,726
5,7
42
20,2
85,6
78
67,4
85,7
26
87,7
71,4
04
ii)
Bac
kfi
llm
33
4,2
39
38
689
1,3
01,0
82
23,5
90,6
71
24,8
91,7
53
4)
New B
ox
Cu
lver
t,
2.3
m(w
)x2
.4m
(h)x
1ce
llm
43
9
i)
Rei
nfo
rced
co
ncr
ete
m3
1,7
26
1,7
26
5,7
42
2,9
79,0
76
9,9
10,6
92
12,8
89,7
68
ii)
Bac
kfi
llm
37
,60
838
689
289,1
04
5,2
41,9
12
5,5
31,0
16
5)
New c
on
cret
e p
ipe
Dia
met
er: 9
00
mm
m4
00
i)
Rei
nfo
rced
co
ncr
ete
m3
46
01
,726
5,7
42
793,9
60
2,6
41,3
20
3,4
35,2
80
ii)
Bac
kfi
llm
32
,86
438
689
108,8
32
1,9
73,2
96
2,0
82,1
28
3
.6 C
on
stru
ctio
n o
f m
ain
ten
ance
man
ho
len
os
8
i)
Ex
cav
atio
nm
34
,08
01
,128
316
4,6
02,2
40
1,2
89,2
80
5,8
91,5
20
ii)
Rei
nfo
rced
co
ncr
ete
m3
80
01
,726
5,7
42
1,3
80,8
00
4,5
93,6
00
5,9
74,4
00
iii)
Bac
kfi
llm
32
,14
438
689
81,4
72
1,4
77,2
16
1,5
58,6
88
3.7
Wat
er s
up
ply
pip
e in
clu
din
g r
elo
cati
on
D
iam
eter
: 2,2
00
mm
m2
52
,40
0,0
00
600,0
00
60,0
00,0
00
15,0
00,0
00
75,0
00,0
00
3.8
Rai
lway
rai
l st
ren
gth
enin
gm
10
70
,000
30,0
00
700,0
00
300,0
00
1,0
00,0
00
3.9
Pav
emen
t
i)
Dem
oli
shin
gm
38
40
137
50
115,0
80
42,0
00
157,0
80
ii)
Pav
ing
m2
23
,46
7450
150
10,5
60,1
50
3,5
20,0
50
14,0
80,2
00
563,0
47,5
95
Tota
l C
ost
A.G.3 - 2
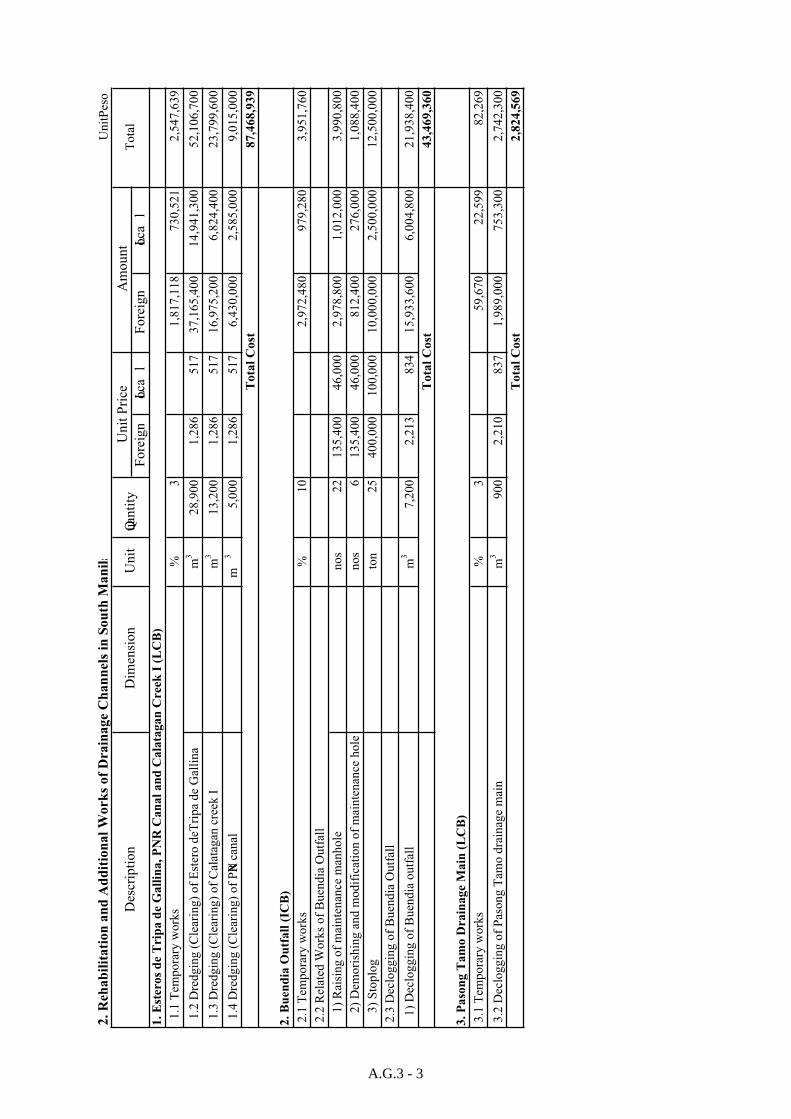
2. R
eh
ab
ilit
ati
on
an
d A
dd
itio
nal
Work
s of
Drain
age C
han
nels
in
Sou
th M
an
ila
Unit
:Pes
o
Fore
ign
Loca
lF
ore
ign
Loca
l
1
.1 T
emp
ora
ry w
ork
s%
31,8
17,1
18
730,5
21
2,5
47,6
39
1
.2 D
red
gin
g (
Cle
arin
g)
of
Est
ero
deT
rip
a d
e G
alli
na
m3
28
,90
01
,286
517
37,1
65,4
00
14,9
41,3
00
52,1
06,7
00
1
.3 D
red
gin
g (
Cle
arin
g)
of
Cal
atag
an c
reek
Im
31
3,2
00
1,2
86
517
16,9
75,2
00
6,8
24,4
00
23,7
99,6
00
1
.4 D
red
gin
g (
Cle
arin
g)
of
PNR
can
alm
35
,00
01
,286
517
6,4
30,0
00
2,5
85,0
00
9,0
15,0
00
87,4
68,9
39
2.1
Tem
po
rary
wo
rks
%1
02,9
72,4
80
979,2
80
3,9
51,7
60
2.2
Rel
ated
Wo
rks
of
Bu
end
ia O
utf
all
1)
Rai
sin
g o
f m
ain
ten
ance
man
ho
len
os
22
13
5,4
00
46,0
00
2,9
78,8
00
1,0
12,0
00
3,9
90,8
00
2)
Dem
ori
shin
g a
nd
mo
dif
icat
ion
of
mai
nte
nan
ce h
ole
no
s6
13
5,4
00
46,0
00
812,4
00
276,0
00
1,0
88,4
00
3)
Sto
plo
gto
n2
54
00
,000
100,0
00
10,0
00,0
00
2,5
00,0
00
12,5
00,0
00
2.3
Dec
log
gin
g o
f B
uen
dia
Ou
tfal
l
1
) D
eclo
gg
ing
of
Bu
end
ia o
utf
all
m3
7,2
00
2,2
13
834
15,9
33,6
00
6,0
04,8
00
21,9
38,4
00
43,4
69,3
60
3.
Pa
son
g T
am
o D
ra
ina
ge M
ain
(L
CB
)
3.1
Tem
po
rary
wo
rks
%3
59,6
70
22,5
99
82,2
69
3.2
Dec
log
gin
g o
f P
aso
ng
Tam
o d
rain
age
mai
nm
39
00
2,2
10
837
1,9
89,0
00
753,3
00
2,7
42,3
00
2,8
24,5
69
Tota
l C
ost
Tota
l C
ost
Tota
l C
ost
2.
Bu
en
dia
Ou
tfa
ll (
ICB
)
1.
Est
ero
s d
e T
rip
a d
e G
all
ina
, P
NR
Ca
na
l a
nd
Ca
lata
ga
n C
reek
I (
LC
B)
Un
it P
rice
Am
ou
nt
Tota
lD
escr
ipti
on
Dim
ensi
on
Unit
Quan
tity
A.G.3 - 3
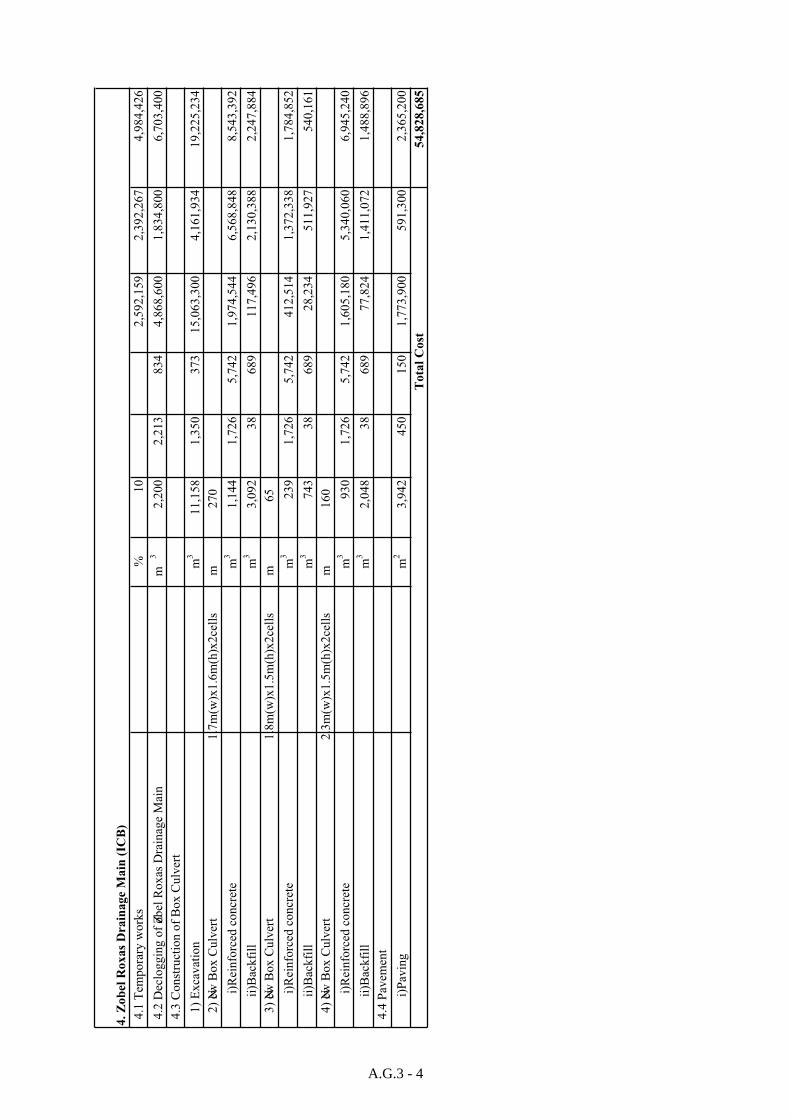
4.
Zo
bel
Ro
xa
s D
ra
ina
ge M
ain
(IC
B)
4
.1 T
emp
ora
ry w
ork
s%
10
2,5
92,1
59
2,3
92,2
67
4,9
84,4
26
4
.2 D
eclo
gg
ing
of
Zob
el R
ox
as D
rain
age
Mai
nm
32
,20
02
,213
834
4,8
68,6
00
1,8
34,8
00
6,7
03,4
00
4
.3 C
on
stru
ctio
n o
f B
ox
Cu
lver
t
1)
Ex
cav
atio
nm
31
1,1
58
1,3
50
373
15,0
63,3
00
4,1
61,9
34
19,2
25,2
34
2)
New B
ox
Cu
lver
t1
.7m
(w)x
1.6
m(h
)x2
cell
sm
27
0
i)
Rei
nfo
rced
co
ncr
ete
m3
1,1
44
1,7
26
5,7
42
1,9
74,5
44
6,5
68,8
48
8,5
43,3
92
ii)
Bac
kfi
llm
33
,09
238
689
117,4
96
2,1
30,3
88
2,2
47,8
84
3)
New B
ox
Cu
lver
t1
.8m
(w)x
1.5
m(h
)x2
cell
sm
65
i)
Rei
nfo
rced
co
ncr
ete
m3
23
91
,726
5,7
42
412,5
14
1,3
72,3
38
1,7
84,8
52
ii)
Bac
kfi
llm
37
43
38
689
28,2
34
511,9
27
540,1
61
4)
New B
ox
Cu
lver
t2
.3m
(w)x
1.5
m(h
)x2
cell
sm
16
0
i)
Rei
nfo
rced
co
ncr
ete
m3
93
01
,726
5,7
42
1,6
05,1
80
5,3
40,0
60
6,9
45,2
40
ii)
Bac
kfi
llm
32
,04
838
689
77,8
24
1,4
11,0
72
1,4
88,8
96
4
.4 P
avem
ent
i)P
avin
gm
23
,94
2450
150
1,7
73,9
00
591,3
00
2,3
65,2
00
54,8
28,6
85
Tota
l C
ost
A.G.3 - 4
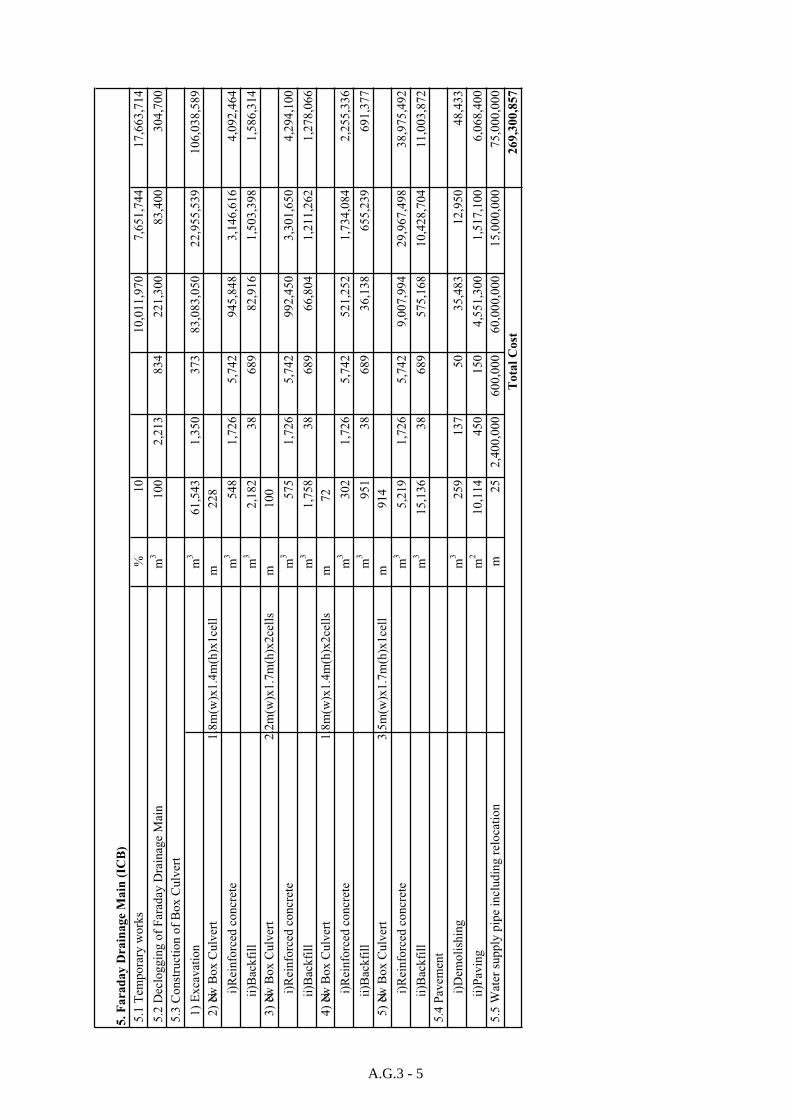
5.1
Tem
po
rary
wo
rks
%1
010,0
11,9
70
7,6
51,7
44
17,6
63,7
14
5.2
Dec
log
gin
g o
f F
arad
ay D
rain
age
Mai
nm
31
00
2,2
13
834
221,3
00
83,4
00
304,7
00
5.3
Co
nst
ruct
ion
of
Bo
x C
ulv
ert
1
) E
xca
vat
ion
m3
61
,54
31
,350
373
83,0
83,0
50
22,9
55,5
39
106,0
38,5
89
2
) New
Bo
x C
ulv
ert
1.8
m(w
)x1
.4m
(h)x
1ce
llm
22
8
i)
Rei
nfo
rced
co
ncr
ete
m3
54
81
,726
5,7
42
945,8
48
3,1
46,6
16
4,0
92,4
64
ii)
Bac
kfi
llm
32
,18
238
689
82,9
16
1,5
03,3
98
1,5
86,3
14
3
) New
Bo
x C
ulv
ert
2.2
m(w
)x1
.7m
(h)x
2ce
lls
m1
00
i)
Rei
nfo
rced
co
ncr
ete
m3
57
51
,726
5,7
42
992,4
50
3,3
01,6
50
4,2
94,1
00
ii)
Bac
kfi
llm
31
,75
838
689
66,8
04
1,2
11,2
62
1,2
78,0
66
4
) New
Bo
x C
ulv
ert
1.8
m(w
)x1
.4m
(h)x
2ce
lls
m7
2
i)
Rei
nfo
rced
co
ncr
ete
m3
30
21
,726
5,7
42
521,2
52
1,7
34,0
84
2,2
55,3
36
ii)
Bac
kfi
llm
39
51
38
689
36,1
38
655,2
39
691,3
77
5
) New
Bo
x C
ulv
ert
3.5
m(w
)x1
.7m
(h)x
1ce
llm
91
4
i)
Rei
nfo
rced
co
ncr
ete
m3
5,2
19
1,7
26
5,7
42
9,0
07,9
94
29,9
67,4
98
38,9
75,4
92
ii)
Bac
kfi
llm
31
5,1
36
38
689
575,1
68
10,4
28,7
04
11,0
03,8
72
5.4
Pav
emen
t
i)
Dem
oli
shin
gm
32
59
137
50
35,4
83
12,9
50
48,4
33
ii)
Pav
ing
m2
10
,11
4450
150
4,5
51,3
00
1,5
17,1
00
6,0
68,4
00
5.5
Wat
er s
up
ply
pip
e in
clu
din
g r
elo
cati
on
m2
52
,40
0,0
00
600,0
00
60,0
00,0
00
15,0
00,0
00
75,0
00,0
00
269,3
00,8
57
Tota
l C
ost
5.
Fa
ra
da
y D
ra
ina
ge M
ain
(IC
B)
A.G.3 - 5
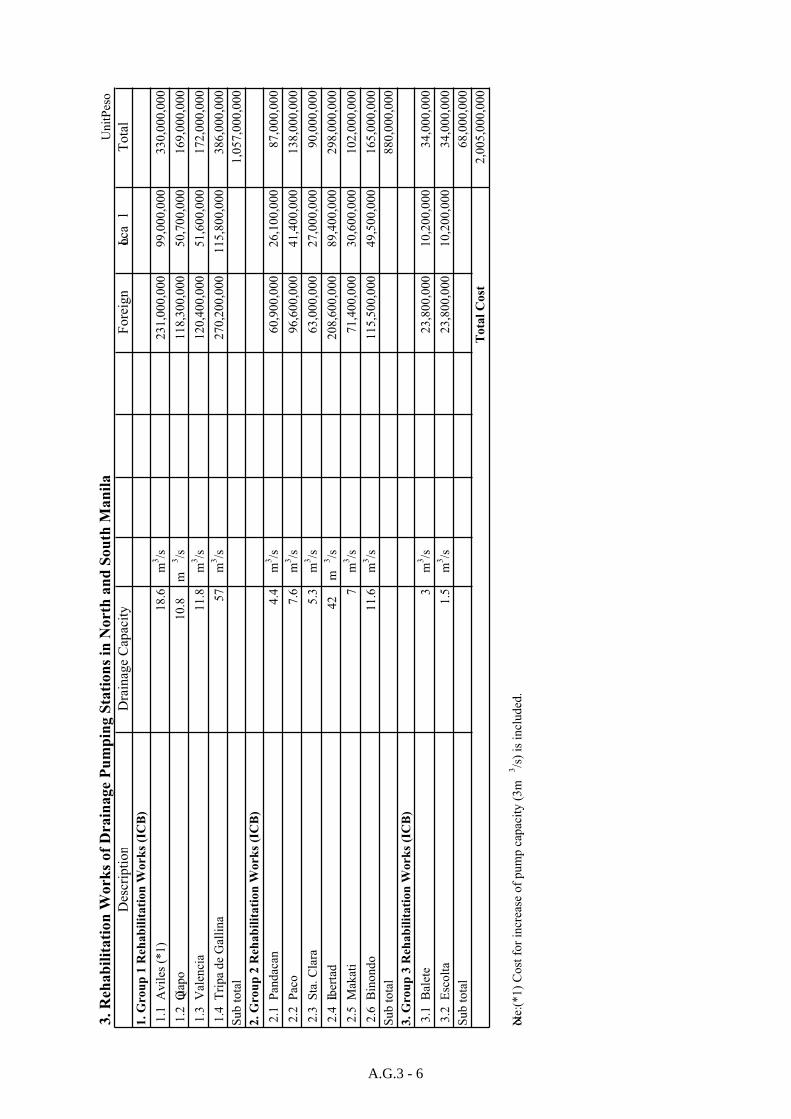
3. R
eh
ab
ilit
ati
on
Work
s of
Drain
age P
um
pin
g S
tati
on
s in
No
rth
an
d S
ou
th M
an
ila
Unit
:Pes
o
Des
crip
tion
Dra
inag
e C
apac
ity
Fo
reig
nLo
cal
To
tal
1.
Gro
up
1 R
eh
ab
ilit
ati
on
Wo
rk
s (I
CB
)
1.1
A
vil
es (
*1
)1
8.6
m3/s
231,0
00,0
00
99,0
00,0
00
330,0
00,0
00
1.2
Qu
iap
o1
0.8
m3/s
118,3
00,0
00
50,7
00,0
00
169,0
00,0
00
1.3
V
alen
cia
11
.8m
3/s
120,4
00,0
00
51,6
00,0
00
172,0
00,0
00
1.4
T
rip
a d
e G
alli
na
57
m3/s
270,2
00,0
00
115,8
00,0
00
386,0
00,0
00
Su
b t
ota
l1,0
57,0
00,0
00
2.
Gro
up
2 R
eh
ab
ilit
ati
on
Wo
rk
s (I
CB
)
2.1
P
and
acan
4.4
m3/s
60,9
00,0
00
26,1
00,0
00
87,0
00,0
00
2.2
P
aco
7.6
m3/s
96,6
00,0
00
41,4
00,0
00
138,0
00,0
00
2.3
S
ta.
Cla
ra5
.3m
3/s
63,0
00,0
00
27,0
00,0
00
90,0
00,0
00
2.4
Lib
erta
d4
2m
3/s
208,6
00,0
00
89,4
00,0
00
298,0
00,0
00
2.5
M
akat
i7
m3/s
71,4
00,0
00
30,6
00,0
00
102,0
00,0
00
2.6
B
ino
nd
o1
1.6
m3/s
115,5
00,0
00
49,5
00,0
00
165,0
00,0
00
Su
b t
ota
l880,0
00,0
00
3.
Gro
up
3 R
eh
ab
ilit
ati
on
Wo
rk
s (I
CB
)
3.1
B
alet
e3
m3/s
23,8
00,0
00
10,2
00,0
00
34,0
00,0
00
3.2
E
sco
lta
1.5
m3/s
23,8
00,0
00
10,2
00,0
00
34,0
00,0
00
Su
b t
ota
l68,0
00,0
00
2,0
05,0
00,0
00
Note
: (*
1)
Co
st f
or
incr
ease
of
pu
mp
cap
acit
y (
3m
3/s
) is
in
clu
ded
.
Tota
l C
ost
A.G.3 - 6
H - i
H. ECONOMIC EVALUATION
H - ii
TABLE OF CONTENTS
Page
H.1 Economic Evaluation for Master Plan..................................................................... H - 1
H.1.1 Background of Economic Evaluation...................................................................... H - 1
H.1.2 Benefit of the Project............................................................................................... H - 3
H.1.3 Cost of the Project ................................................................................................. H - 32
H.1.4 Economic Evaluation ............................................................................................ H - 35
H.1.4 ............................................................................................................................... H - 42
H.2 Economic Evaluation for Feasibility Study........................................................... H - 48
H.2.1 Background of Economic Evaluation.................................................................... H - 48
H.2.2 Benefit of the Priority Projects.............................................................................. H - 48
H.2.3 Cost of the Priority Projects .................................................................................. H - 52
H.2.4 Economic Evaluation ............................................................................................ H - 57
H.2.5 Priority Projects..................................................................................................... H - 71
LIST OF TABLES
Page
Table H.1.1 Classification of Flood Damage ...................................................................... H - 5
Table H.1.2 Samples of Methods and Elements included as Flood Control Benefit
in the Past Reports and Guidelines.................................................................. H - 6
Table H.1.3 Unit Construction Cost and Unit Value of House ........................................... H - 8
Table H.1.4 Share of Number of Buildings by Type of Building, by City/Municipality,
by Use.............................................................................................................. H - 9
Table H.1.5 Construction Year of Buildings in the 5 Cities /Municipality
of the Study Area .......................................................................................... H - 10
Table H.1.6 Depreciation Table by Type of Building....................................................... H - 11
Table H.1.7 Value of Assets per Establishment................................................................ H - 11
Table H.1.8 Price Indices in NCR (1991 – 2003) ............................................................... H - 12
Table H.1.9 Damage Rate of Inundation by Depth (Example 1) ...................................... H - 12
Table H.1.10 Damage Rate of Inundation by Depth (Example 2) ...................................... H - 13
Table H.1.11 Damage Rate of Inundation Applied in the Analysis...................................... H - 13
Table H.1.12 Vehicle Operating Cost in Metropolitan Manila ........................................... H - 18
Table H.1.13 Result of Vehicle Operating Cost (VOC) in Metropolitan Manila ............... H - 19
Table H.1.14 Flood Damage by Return Period (Without Project) ...................................... H - 20
Table H.1.15 ....................................................................................................................... H - 20
Table H.1.16 ....................................................................................................................... H - 21
Table H.1.17 Flood Damage by Return Period (With Master Plan) ................................... H - 21
Table H.1.18 Flood Damage by Return Period (With Master Plan, South Manila)............ H - 22
Table H.1.19 Flood Damage by Return Period (With Master Plan, All Study Area) ......... H - 22
Table H.1.20 ....................................................................................................................... H - 23
Table H.1.21 Breakdown of Annual Average Benefit
(With Master Plan, in Present Condition) ..................................................... H - 24
Table H.1.22
With Master Plan, ........................................................................................ H - 24
H - iii
Table H.1.23
With Master Plan, ........................................................................................ H - 25
Table H.1.24 Economic Growth Rate Framework.............................................................. H - 26
Table H.1.25 Population Framework .................................................................................. H - 26
Table H.1.26 Future Framework for Economic Analysis ................................................... H - 27
Table H.1.27 Major Damage by Typhoon and Flood attacked Metropolitan Manila ......... H - 29
Table H.1.28 Project Cost (Master Plan) ............................................................................ H - 33
Table H.1.29 Disbursement Schedule for Economic Analysis
(Master Plan Project, Financial Price)........................................................... H - 34
Table H.1.30 Disbursement Schedule for Economic Analysis
(Master Plan Project, Economic Price) ......................................................... H - 34
Table H.1.31 Results of Economic Analysis (Future Condition)........................................ H - 36
Table H.1.32 ....................................................................................................................... H - 37
Table H.1.33 Results of the Sensitivity Analysis 1
(NPV, Future Condition)............................................................................... H - 38
Table H.1.34 Results of the Sensitivity Analysis 2
(B/C, Future Condition) ................................................................................ H - 38
Table H.1.35 Results of the Sensitivity Analysis 3
(EIRR, Future Condition).............................................................................. H - 38
Table H.1.36 Results of the Sensitivity Analysis 4
(NPV, Present Condition) ............................................................................. H - 39
Table H.1.37 Results of the Sensitivity Analysis 5
(B/C, Present Condition) ............................................................................... H - 39
Table H.1.38 Results of the Sensitivity Analysis 6
(EIRR, Present Condition, M/P Projects)...................................................... H - 40
Table H.1.39 Annual Cash Flow of Master Plan 2 (Present Condition) ............................. H - 40
Table H.1.40 ....................................................................................................................... H - 42
Table H.1.41 ....................................................................................................................... H - 43
Table H.1.42 ....................................................................................................................... H - 45
Table H.1.43 ..................................................................................................................... H - 45
Table H.1.44 ....................................................................................................................... H - 46
Table H.2.1 Flood Damage by Return Period (With Priority Projects : North Manila).... H - 48
Table H.2.2 Flood Damage by Return Period (With Priority Projects : South Manila).... H - 49
Table H.2.3 Flood Damage by Return Period (With Priority Projects : All Study Area) . H - 49
Table H.2.4 Breakdown of Annual Average Benefit
(Present Condition, Priority Projects, North Manila).................................... H - 50
Table H.2.5 Breakdown of Annual Average Benefit
(Present Condition, Priority Projects, South Manila).................................... H - 50
Table H.2.6 Breakdown of Annual Average Benefit
(Present Condition, Priority Projects, All Study Area) ................................. H - 51
Table H.2.7 Project Cost (Priority Projects)...................................................................... H - 53
Table H.2.8 Project Cost (Priority Projects, South Manila) .............................................. H - 53
Table H.2.9 Priority Projects............................................................................................. H - 53
Table H.2.10 Disbursement Schedule for Economic Analysis
(Priority Projects, Financial Price) ................................................................ H - 54
Table H.2.11 Disbursement Schedule for Economic Analysis
(Priority Projects, Economic Price)............................................................... H - 55
Table H.2.12 Results of Economic Analysis (Future Condition, Priority Projects)............ H - 58
Table H.2.13 Priority Projects 1, North Manila .................................................................. H - 59
Table H.2.14 Priority Projects 2, South Manila .................................................................. H - 60
H - iv
Table H.2.15 Priority Projects 3
, All Study Area............................................................................................. H - 61
Table H.2.16 Results of the Sensitivity Analysis 1
(NPV, Future Condition, Priority Projects, North Manila) ........................... H - 62
Table H.2.17 Results of the Sensitivity Analysis 2
(B/C, Future Condition, Priority Projects, North Manila)............................. H - 63
Table H.2.18 Results of the Sensitivity Analysis 3
(EIRR, Future Condition, Priority Projects, North Manila) .......................... H - 63
Table H.2.19 Results of the Sensitivity Analysis 4
(NPV, Future Condition, Priority Projects, South Manila) ........................... H - 63
Table H.2.20 Results of the Sensitivity Analysis 5
(B/C, Future Condition, Priority Projects, South Manila)............................. H - 63
Table H.2.21 Results of the Sensitivity Analysis 6
(EIRR, Future Condition, Priority Projects, South Manila) .......................... H - 63
Table H.2.22 Results of the Sensitivity Analysis 7
(NPV, Future Condition, Priority Projects, All Study Area)......................... H - 64
Table H.2.23 Results of the Sensitivity Analysis 8
(B/C, Future Condition, Priority Projects, All Study Area) .......................... H - 64
Table H.2.24 Results of the Sensitivity Analysis 9
(EIRR, Future Condition, Priority Projects, All Study Area)........................ H - 64
Table H.2.25 Results of the Sensitivity Analysis 10
(Delay of Project Commencement, Future Condition,
Priority Projects, All Study Area) ................................................................. H - 65
Table H.2.26 Priority Projects 4
Present, North Manila ................................................................................... H - 66
Table H.2.27 Priority Projects 5
Present, South Manila ................................................................................... H - 67
Table H.2.28 Priority Projects 6
Present, All Study Area................................................................................. H - 68
Table H.2.29 Results of the Sensitivity Analysis 4
(NPV, Present Condition, Priority Projects) ................................................. H - 69
Table H.2.30 Results of the Sensitivity Analysis 5
(B/C, Present Condition, Priority Projects) ................................................... H - 69
Table H.2.31 Results of the Sensitivity Analysis 6
(EIRR, Present Condition, Priority Projects) ................................................ H - 69
Table H.2.32
Priority Projects............................................................................................. H - 69
Table H.2.33
Priority Projects............................................................................................. H - 69
Table H.2.34 4
Priority Projects............................................................................................. H - 70
Table H.2.35 5
Priority Projects............................................................................................. H - 70
Table H.2.36
Priority Projects............................................................................................. H - 70
Table H.2.37
Priority Projects............................................................................................. H - 70
Table H.2.38 ...................................................................................................................... H - 71
H - v
LIST OF FIGURES
Page
Figure H.1.1 Flow of Analysis of Economic Evaluation.................................................... H - 2
Figure H.1.2 Project Benefit............................................................................................... H - 3
Figure H.1.3 Work Flow of Annual Average Benefit ........................................................ H - 4
Figure H.1.4 Number of Buildings by Type of Building, by Use ...................................... H - 9
Figure H.1.5 Method and Formula (Damage of Buildings & Assets) .............................. H - 14
Figure H.1.6 Method and Formula (Damage of Infrastructure) ....................................... H - 15
Figure H.1.7 Method and Formula (Indirect Damage : Trade Loss) ................................ H - 16
Figure H.1.8 Unit Cost of Trade Loss & Alternative Activities....................................... H - 16
Figure H.1.9 Major Vehicle Operating Cost of Vehicle in Metropolitan Manila............. H - 18
Figure H.1.10 Conceptual Diagram of Traffic Simulation Model ..................................... H - 19
Figure H.1.11 Elements of Annual Average Benefit.......................................................... H - 24
Figure H.1.12 Annual Average Benefit and Timing of Accruing Benefits
(With Master Plan, in Future Condition)..................................................... H - 28
Figure H.1.13 Diarrhea Cases, Nov 13-Dec.13, 1989 & 1990........................................... H - 31
Figure H.1.14 Results of Sensitivity Analysis
(EIRR, Future Condition)............................................................................ H - 39
Figure H.2.1 Elements of Annual Average Benefit (Priority Projects, All Study Area) .. H - 51
Figure H.2.2 Annual Average Benefit & Timing of Accruing Benefits
(Future Condition, Priority Projects, All Study Area)................................. H - 51
Figure H.2.3 Results of Sensitivity Analysis
(EIRR, Future Condition, Priority Projects, All Study Area)...................... H - 64
H - 1
H.1 ECONOMIC EVALUATION FOR MASTER PLAN
H.1.1 BACKGROUND OF ECONOMIC EVALUATION
The economic analysis focused on the study areas serviced by the proposed programs/projects
in the master plan.
Estimation of the benefit derived from the proposed programs/projects is worked out by the
equation,
Net Benefit of the Programs/ Projects = Benefit – Cost
or follows the flow as shown in Figure H.1.1.
Explanations of “benefit” and “cost” are found in Chapter H.1.2 and H.1.3, respectively and
then, economic viability derived from “net benefit” is analyzed in Chapter H.1.4. In Chapter
H.1.5, financial investment plans are considered.
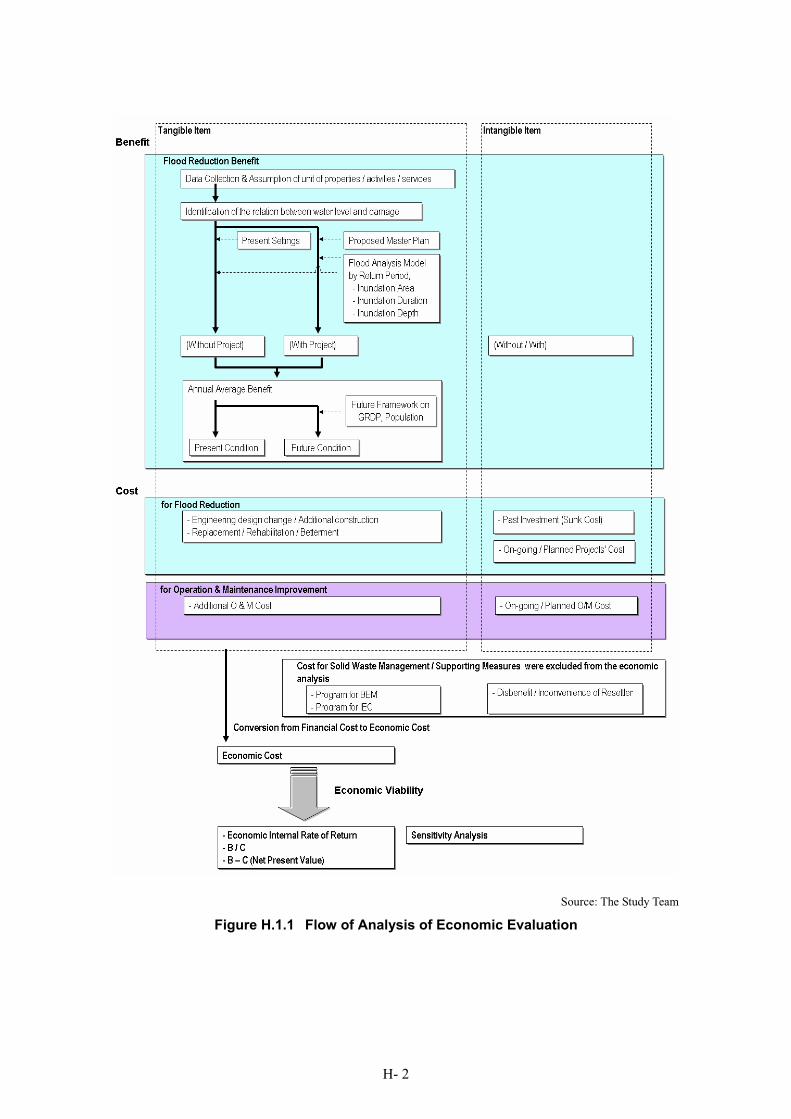
H- 2
Source: The Study Team
Figure H.1.1 Flow of Analysis of Economic Evaluation
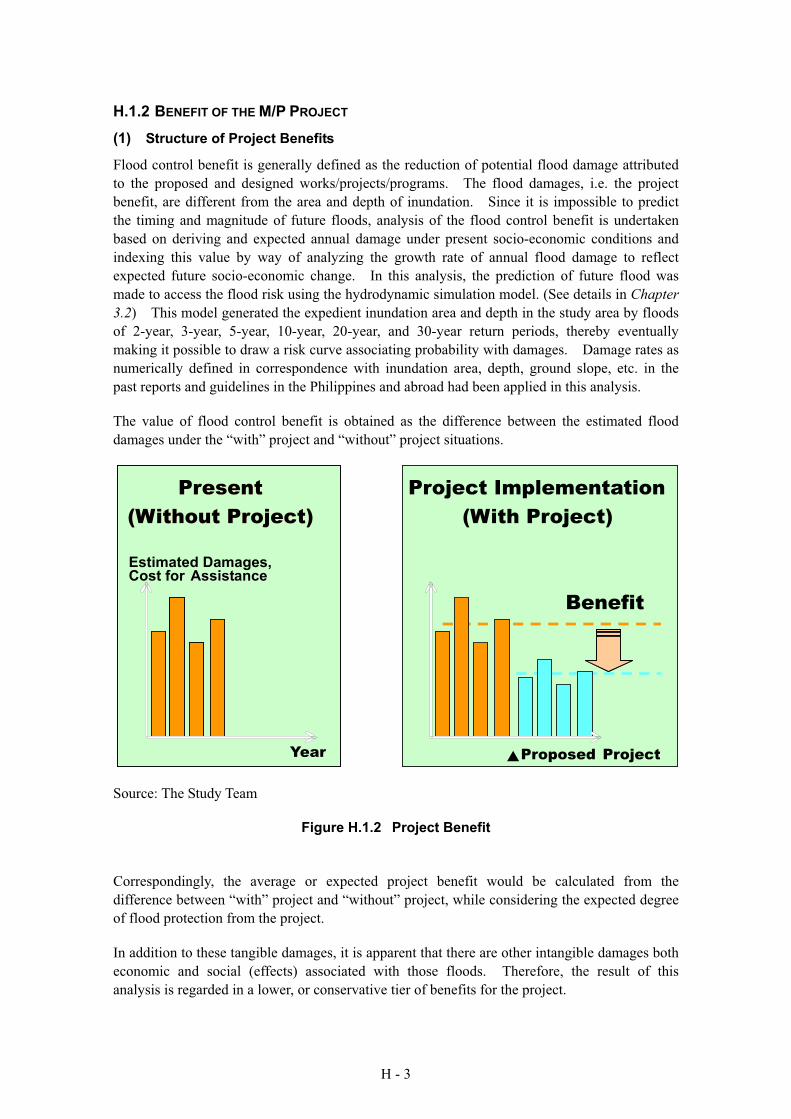
H - 3
H.1.2 BENEFIT OF THE M/P PROJECT
(1) Structure of Project Benefits
Flood control benefit is generally defined as the reduction of potential flood damage attributed
to the proposed and designed works/projects/programs. The flood damages, i.e. the project
benefit, are different from the area and depth of inundation. Since it is impossible to predict
the timing and magnitude of future floods, analysis of the flood control benefit is undertaken
based on deriving and expected annual damage under present socio-economic conditions and
indexing this value by way of analyzing the growth rate of annual flood damage to reflect
expected future socio-economic change. In this analysis, the prediction of future flood was
made to access the flood risk using the hydrodynamic simulation model. (See details in Chapter
3.2) This model generated the expedient inundation area and depth in the study area by floods
of 2-year, 3-year, 5-year, 10-year, 20-year, and 30-year return periods, thereby eventually
making it possible to draw a risk curve associating probability with damages. Damage rates as
numerically defined in correspondence with inundation area, depth, ground slope, etc. in the
past reports and guidelines in the Philippines and abroad had been applied in this analysis.
The value of flood control benefit is obtained as the difference between the estimated flood
damages under the “with” project and “without” project situations.
Source: The Study Team
Figure H.1.2 Project Benefit
Correspondingly, the average or expected project benefit would be calculated from the
difference between “with” project and “without” project, while considering the expected degree
of flood protection from the project.
In addition to these tangible damages, it is apparent that there are other intangible damages both
economic and social (effects) associated with those floods. Therefore, the result of this
analysis is regarded in a lower, or conservative tier of benefits for the project.
Present
(Without Project)
Project Implementation
Assistance
Proposed ProjectYear
Benefit
Present
(Without Project)
Project Implementation
(With Project)
Estimated Damages, Cost for Assistance
Proposed ProjectYear
Benefit
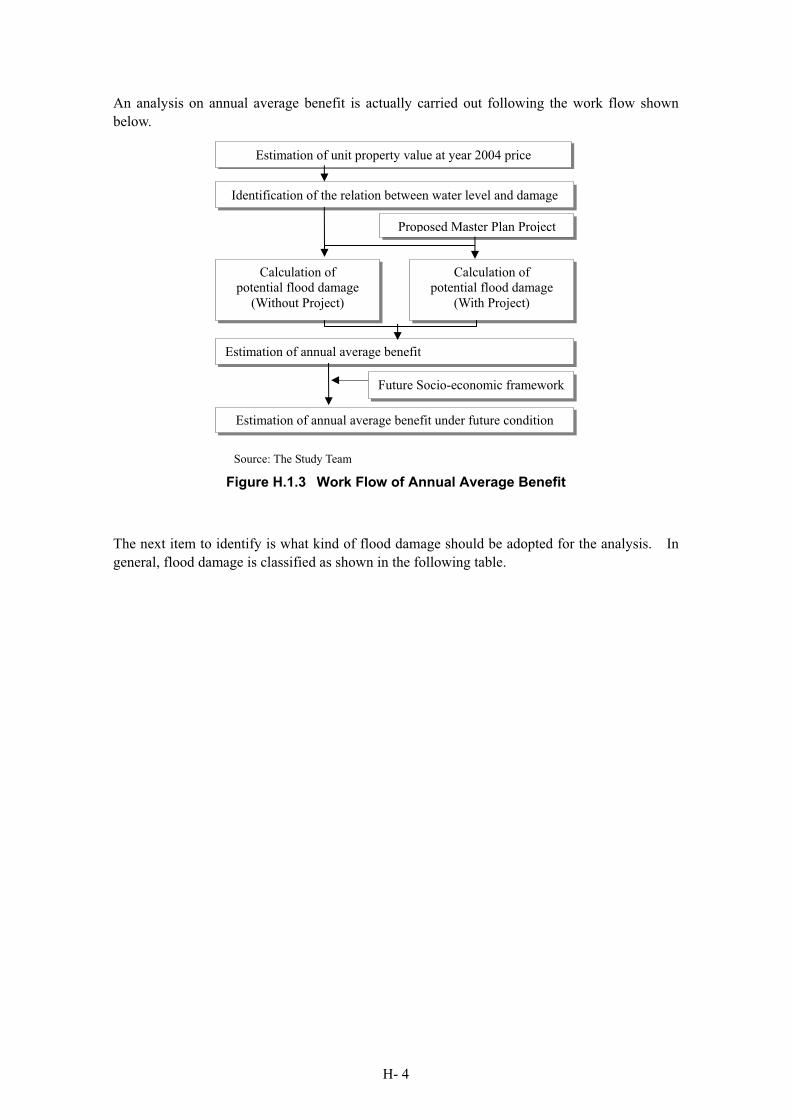
H- 4
An analysis on annual average benefit is actually carried out following the work flow shown
below.
Source: The Study Team
Figure H.1.3 Work Flow of Annual Average Benefit
The next item to identify is what kind of flood damage should be adopted for the analysis. In
general, flood damage is classified as shown in the following table.
Estimation of unit property value at year 2004 price
Identification of the relation between water level and damage
Calculation of
potential flood damage
(Without Project)
Proposed Master Plan Project
Calculation of
potential flood damage
(With Project)
Estimation of annual average benefit
Estimation of annual average benefit under future condition
Future Socio-economic framework
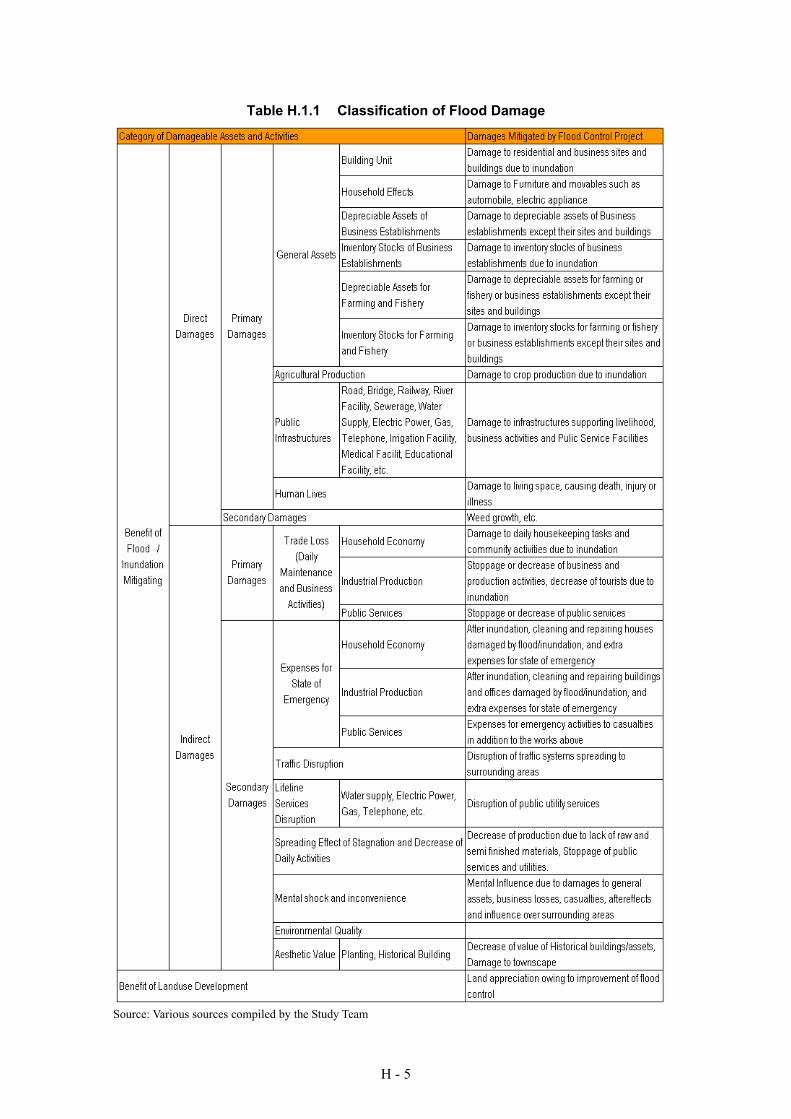
H - 5
Table H.1.1 Classification of Flood Damage
Source: Various sources compiled by the Study Team
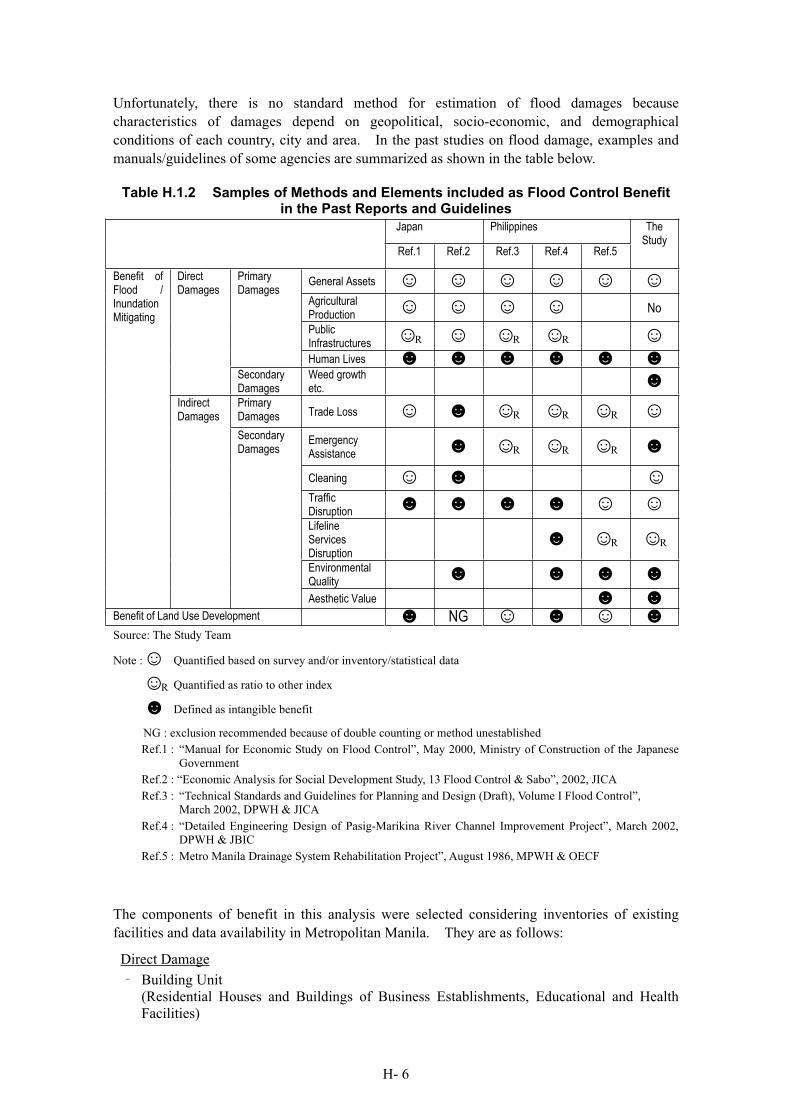
H- 6
Unfortunately, there is no standard method for estimation of flood damages because
characteristics of damages depend on geopolitical, socio-economic, and demographical
conditions of each country, city and area. In the past studies on flood damage, examples and
manuals/guidelines of some agencies are summarized as shown in the table below.
Table H.1.2 Samples of Methods and Elements included as Flood Control Benefit in the Past Reports and Guidelines
Japan Philippines
Ref.1 Ref.2 Ref.3 Ref.4 Ref.5
TheStudy
General Assets
Agricultural Production
No
Public Infrastructures R R R
PrimaryDamages
Human Lives
DirectDamages
Secondary Damages
Weed growth etc.
PrimaryDamages Trade Loss R R R
Emergency Assistance R R R
Cleaning TrafficDisruption
Lifeline ServicesDisruption
R R
Environmental Quality
Benefit of Flood / Inundation Mitigating
Indirect Damages
Secondary Damages
Aesthetic Value Benefit of Land Use Development NGSource: The Study Team
Note : Quantified based on survey and/or inventory/statistical data
R Quantified as ratio to other index
Defined as intangible benefit
NG : exclusion recommended because of double counting or method unestablished
Ref.1 : “Manual for Economic Study on Flood Control”, May 2000, Ministry of Construction of the Japanese
Government
Ref.2 : “Economic Analysis for Social Development Study, 13 Flood Control & Sabo”, 2002, JICA
Ref.3 : “Technical Standards and Guidelines for Planning and Design (Draft), Volume I Flood Control”,
March 2002, DPWH & JICA
Ref.4 : “Detailed Engineering Design of Pasig-Marikina River Channel Improvement Project”, March 2002,
DPWH & JBIC
Ref.5 : Metro Manila Drainage System Rehabilitation Project”, August 1986, MPWH & OECF
The components of benefit in this analysis were selected considering inventories of existing
facilities and data availability in Metropolitan Manila. They are as follows:
Direct Damage
Building Unit
(Residential Houses and Buildings of Business Establishments, Educational and Health
Facilities)
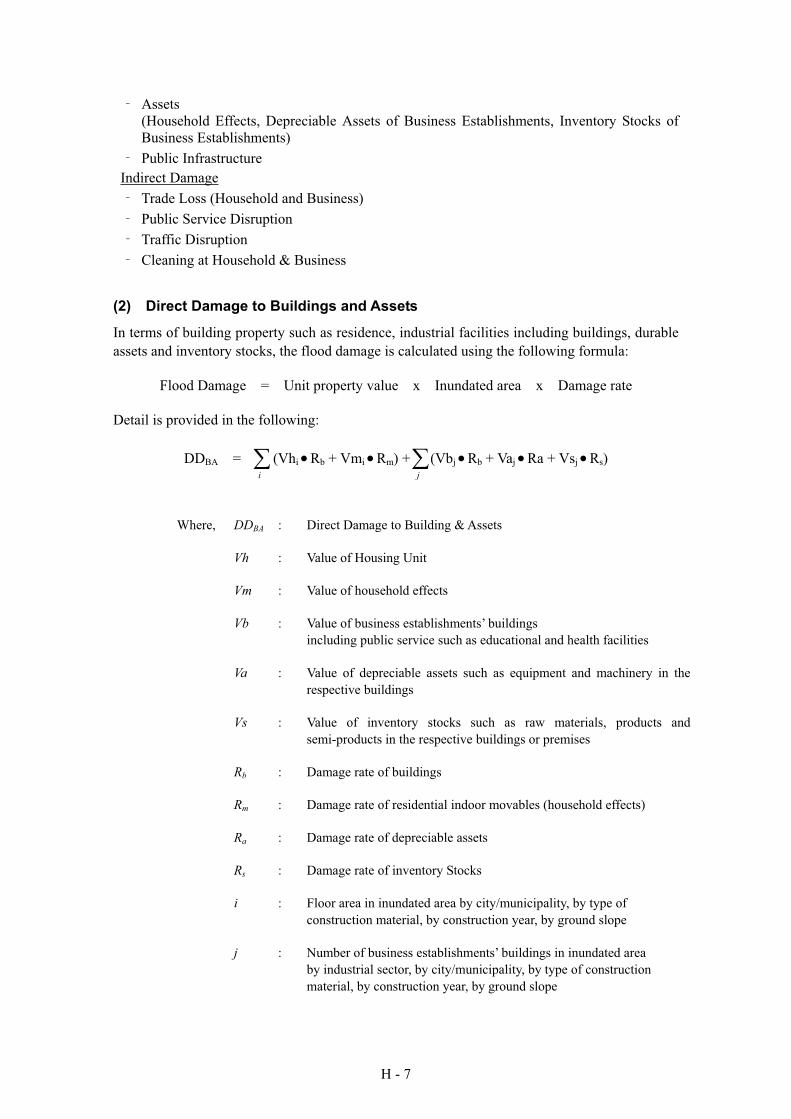
H - 7
Assets
(Household Effects, Depreciable Assets of Business Establishments, Inventory Stocks of
Business Establishments)
Public Infrastructure
Indirect Damage
Trade Loss (Household and Business)
Public Service Disruption
Traffic Disruption
Cleaning at Household & Business
(2) Direct Damage to Buildings and Assets
In terms of building property such as residence, industrial facilities including buildings, durable
assets and inventory stocks, the flood damage is calculated using the following formula:
Flood Damage = Unit property value x Inundated area x Damage rate
Detail is provided in the following:
DDBA =i
(Vhi Rb + Vmi Rm) +j
(Vbj Rb + Vaj Ra + Vsj Rs)
Where, DDBA : Direct Damage to Building & Assets
Vh : Value of Housing Unit
Vm : Value of household effects
Vb : Value of business establishments’ buildings
including public service such as educational and health facilities
Va : Value of depreciable assets such as equipment and machinery in the
respective buildings
Vs : Value of inventory stocks such as raw materials, products and
semi-products in the respective buildings or premises
Rb : Damage rate of buildings
Rm : Damage rate of residential indoor movables (household effects)
Ra : Damage rate of depreciable assets
Rs : Damage rate of inventory Stocks
i : Floor area in inundated area by city/municipality, by type of
construction material, by construction year, by ground slope
j : Number of business establishments’ buildings in inundated area
by industrial sector, by city/municipality, by type of construction
material, by construction year, by ground slope
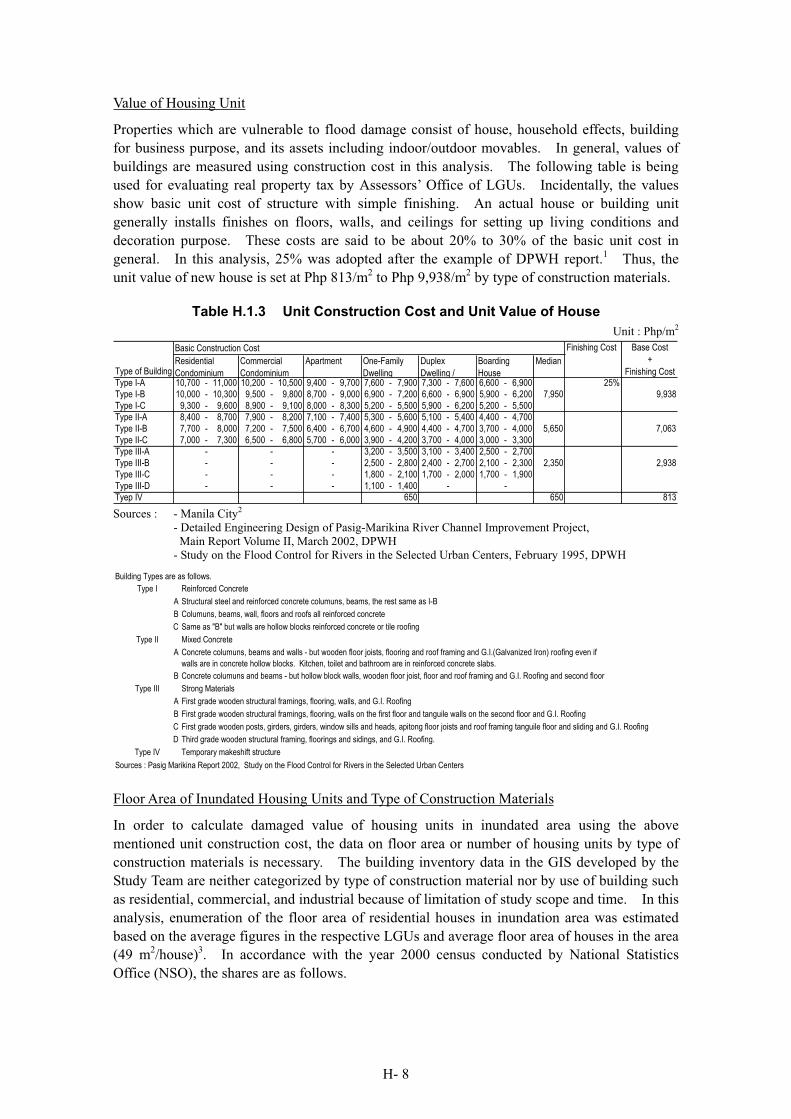
H- 8
Value of Housing Unit
Properties which are vulnerable to flood damage consist of house, household effects, building
for business purpose, and its assets including indoor/outdoor movables. In general, values of
buildings are measured using construction cost in this analysis. The following table is being
used for evaluating real property tax by Assessors’ Office of LGUs. Incidentally, the values
show basic unit cost of structure with simple finishing. An actual house or building unit
generally installs finishes on floors, walls, and ceilings for setting up living conditions and
decoration purpose. These costs are said to be about 20% to 30% of the basic unit cost in
general. In this analysis, 25% was adopted after the example of DPWH report.1 Thus, the
unit value of new house is set at Php 813/m2 to Php 9,938/m2 by type of construction materials.
Table H.1.3 Unit Construction Cost and Unit Value of House
Unit : Php/m2
Basic Construction Cost Finishing Cost
Type of BuildingMedian
Type I-A 10,700 - 11,000 10,200 - 10,500 9,400 - 9,700 7,600 - 7,900 7,300 - 7,600 6,600 - 6,900 25%
Type I-B 10,000 - 10,300 9,500 - 9,800 8,700 - 9,000 6,900 - 7,200 6,600 - 6,900 5,900 - 6,200 7,950 9,938
Type I-C 9,300 - 9,600 8,900 - 9,100 8,000 - 8,300 5,200 - 5,500 5,900 - 6,200 5,200 - 5,500
Type II-A 8,400 - 8,700 7,900 - 8,200 7,100 - 7,400 5,300 - 5,600 5,100 - 5,400 4,400 - 4,700
Type II-B 7,700 - 8,000 7,200 - 7,500 6,400 - 6,700 4,600 - 4,900 4,400 - 4,700 3,700 - 4,000 5,650 7,063
Type II-C 7,000 - 7,300 6,500 - 6,800 5,700 - 6,000 3,900 - 4,200 3,700 - 4,000 3,000 - 3,300
Type III-A - - - 3,200 - 3,500 3,100 - 3,400 2,500 - 2,700
Type III-B - - - 2,500 - 2,800 2,400 - 2,700 2,100 - 2,300 2,350 2,938
Type III-C - - - 1,800 - 2,100 1,700 - 2,000 1,700 - 1,900
Type III-D - - - 1,100 - 1,400 - -
Tyep IV 650 650 813
Duplex
Dwelling /
Boarding
House
Residential
Condominium
Commercial
Condominium
Apartment One-Family
Dwelling
Base Cost
+
Finishing Cost
Sources : - Manila City2
- Detailed Engineering Design of Pasig-Marikina River Channel Improvement Project,
Main Report Volume II, March 2002, DPWH
- Study on the Flood Control for Rivers in the Selected Urban Centers, February 1995, DPWH
Building Types are as follows.
Type I Reinforced Concrete
A Structural steel and reinforced concrete columuns, beams, the rest same as I-B
B Columuns, beams, wall, floors and roofs all reinforced concrete
C Same as "B" but walls are hollow blocks reinforced concrete or tile roofing
Type II Mixed Concrete
A
B
Type III Strong Materials
A First grade wooden structural framings, flooring, walls, and G.I. Roofing
B First grade wooden structural framings, flooring, walls on the first floor and tanguile walls on the second floor and G.I. Roofing
C First grade wooden posts, girders, girders, window sills and heads, apitong floor joists and roof framing tanguile floor and sliding and G.I. Roofing
D Third grade wooden structural framing, floorings and sidings, and G.I. Roofing.
Type IV Temporary makeshift structure
Sources : Pasig Marikina Report 2002, Study on the Flood Control for Rivers in the Selected Urban Centers
Concrete columuns and beams - but hollow block walls, wooden floor joist, floor and roof framing and G.I. Roofing and second floor
Concrete columuns, beams and walls - but wooden floor joists, flooring and roof framing and G.I.(Galvanized Iron) roofing even if
walls are in concrete hollow blocks. Kitchen, toilet and bathroom are in reinforced concrete slabs.
Floor Area of Inundated Housing Units and Type of Construction Materials
In order to calculate damaged value of housing units in inundated area using the above
mentioned unit construction cost, the data on floor area or number of housing units by type of
construction materials is necessary. The building inventory data in the GIS developed by the
Study Team are neither categorized by type of construction material nor by use of building such
as residential, commercial, and industrial because of limitation of study scope and time. In this
analysis, enumeration of the floor area of residential houses in inundation area was estimated
based on the average figures in the respective LGUs and average floor area of houses in the area
(49 m2/house)3. In accordance with the year 2000 census conducted by National Statistics
Office (NSO), the shares are as follows.
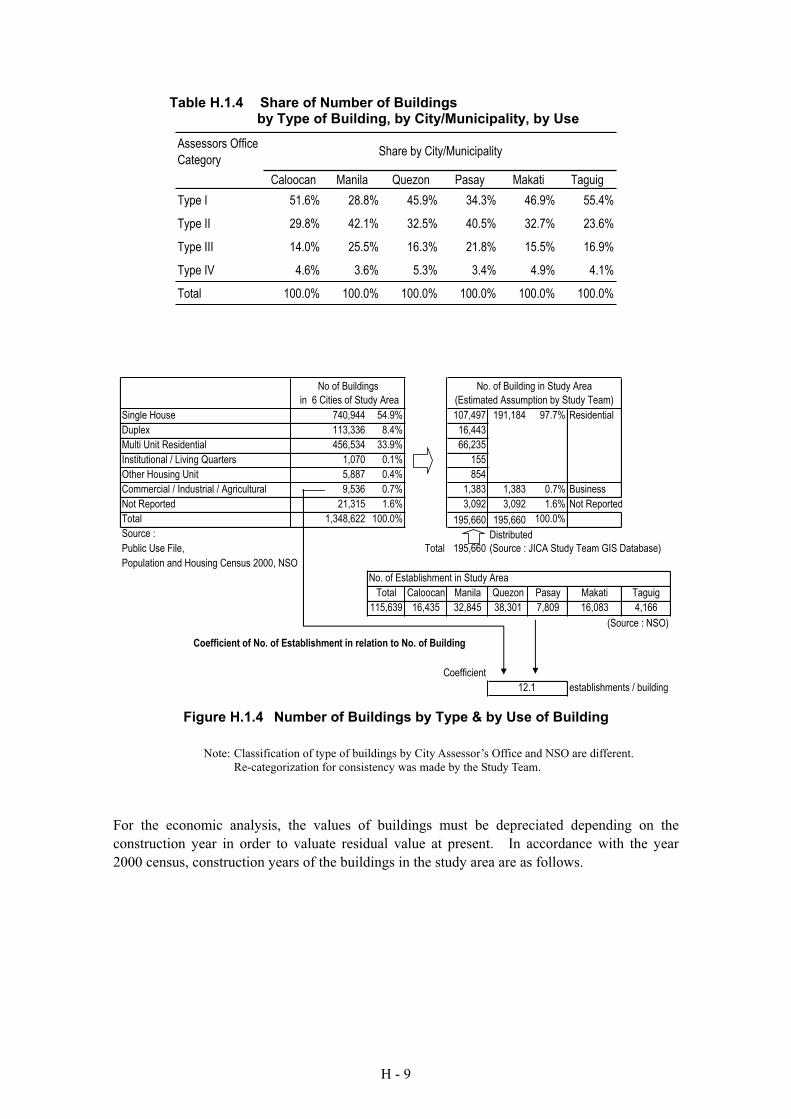
H - 9
Table H.1.4 Share of Number of Buildings by Type of Building, by City/Municipality, by Use
Assessors Office
Category
Caloocan Manila Quezon Pasay Makati Taguig
Type I 51.6% 28.8% 45.9% 34.3% 46.9% 55.4%
Type II 29.8% 42.1% 32.5% 40.5% 32.7% 23.6%
Type III 14.0% 25.5% 16.3% 21.8% 15.5% 16.9%
Type IV 4.6% 3.6% 5.3% 3.4% 4.9% 4.1%
Total 100.0% 100.0% 100.0% 100.0% 100.0% 100.0%
Share by City/Municipality
Single House 740,944 54.9% 107,497 191,184 97.7% Residential
Duplex 113,336 8.4% 16,443
Multi Unit Residential 456,534 33.9% 66,235
Institutional / Living Quarters 1,070 0.1% 155
Other Housing Unit 5,887 0.4% 854
Commercial / Industrial / Agricultural 9,536 0.7% 1,383 1,383 0.7% Business
Not Reported 21,315 1.6% 3,092 3,092 1.6% Not Reported
Total 1,348,622 100.0% 195,660 195,660 100.0%
Source : Distributed
Public Use File, Total 195,660 (Source : JICA Study Team GIS Database)
Population and Housing Census 2000, NSO
No. of Establishment in Study Area
Total Caloocan Manila Quezon Pasay Makati Taguig
115,639 16,435 32,845 38,301 7,809 16,083 4,166
(Source : NSO)
Coefficient of No. of Establishment in relation to No. of Building
Coefficient
establishments / building
No of Buildings
in 6 Cities of Study Area
No. of Building in Study Area
(Estimated Assumption by Study Team)
12.1
Figure H.1.4 Number of Buildings by Type & by Use of Building
Note: Classification of type of buildings by City Assessor’s Office and NSO are different.
Re-categorization for consistency was made by the Study Team.
For the economic analysis, the values of buildings must be depreciated depending on the
construction year in order to valuate residual value at present. In accordance with the year
2000 census, construction years of the buildings in the study area are as follows.
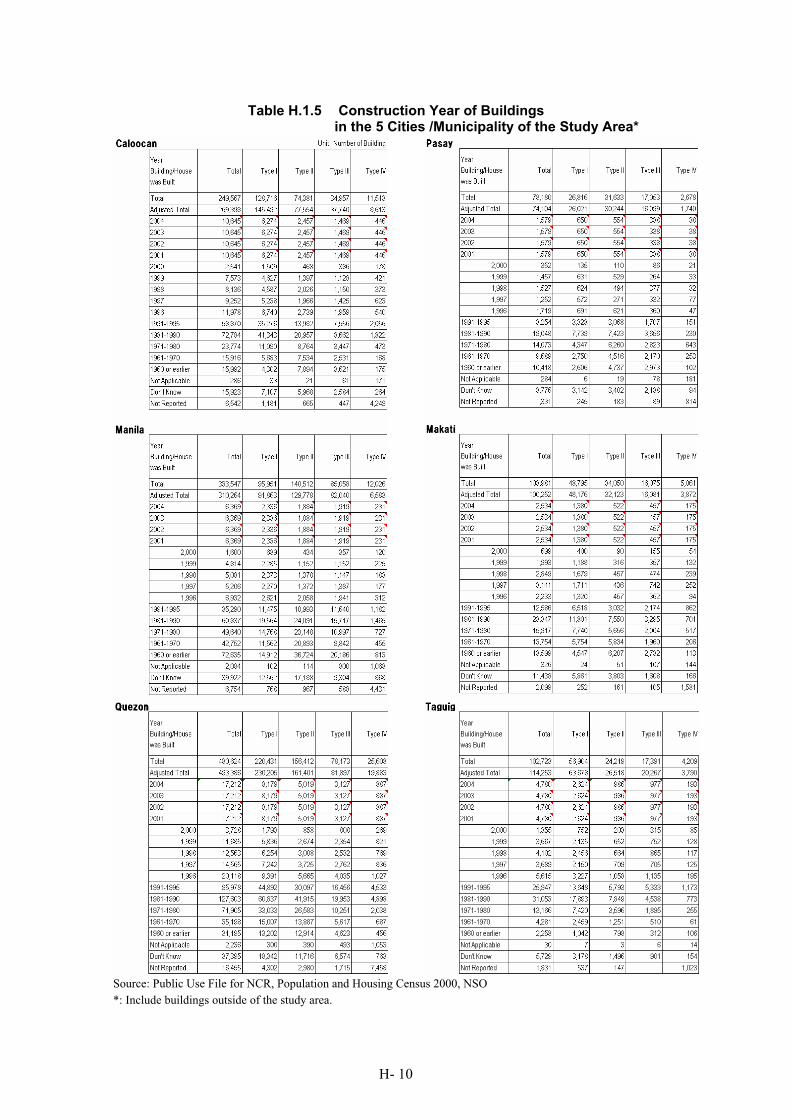
H- 10
Table H.1.5 Construction Year of Buildings in the 5 Cities /Municipality of the Study Area*
Source: Public Use File for NCR, Population and Housing Census 2000, NSO
*: Include buildings outside of the study area.
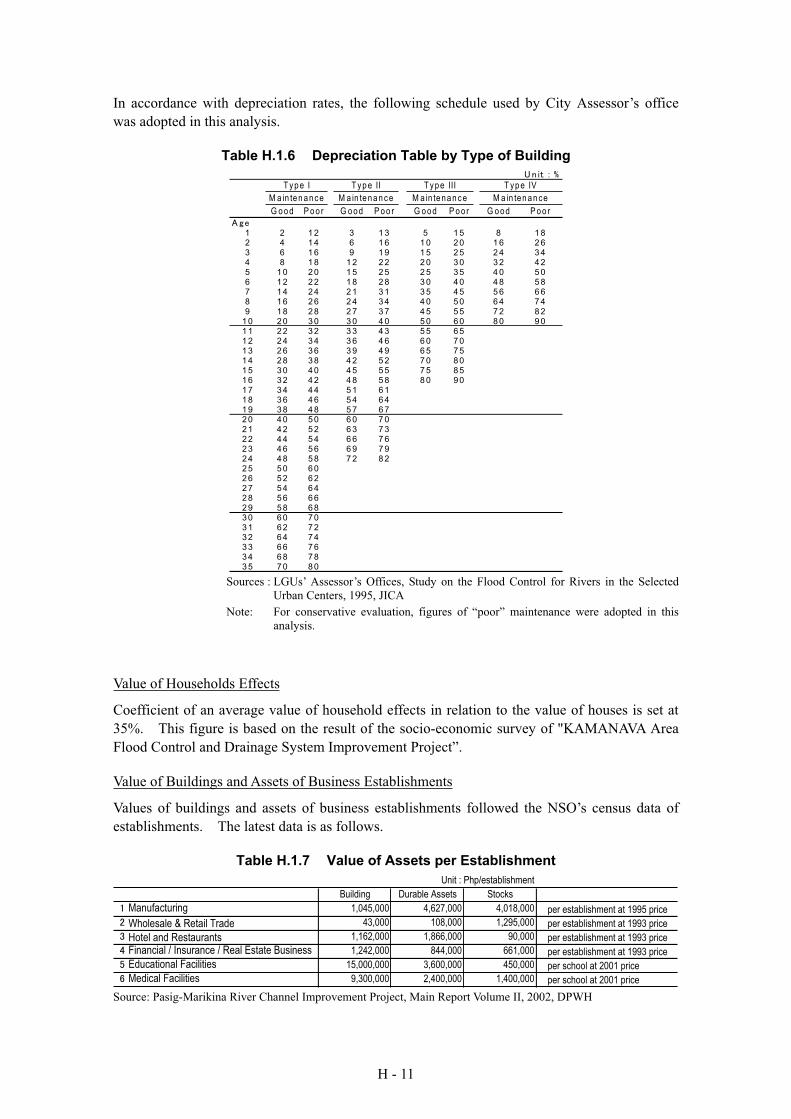
H - 11
In accordance with depreciation rates, the following schedule used by City Assessor’s office
was adopted in this analysis.
Table H.1.6 Depreciation Table by Type of Building
G o o d P o o r G o od P o o r G o od P o o r G o od P o o r
1 2 1 2 3 1 3 5 1 5 8 1 82 4 1 4 6 1 6 1 0 2 0 1 6 2 63 6 1 6 9 1 9 1 5 2 5 2 4 3 44 8 1 8 1 2 2 2 2 0 3 0 3 2 4 25 1 0 2 0 1 5 2 5 2 5 3 5 4 0 5 06 1 2 2 2 1 8 2 8 3 0 4 0 4 8 5 87 1 4 2 4 2 1 3 1 3 5 4 5 5 6 6 68 1 6 2 6 2 4 3 4 4 0 5 0 6 4 7 49 1 8 2 8 2 7 3 7 4 5 5 5 7 2 8 2
1 0 2 0 3 0 3 0 4 0 5 0 6 0 8 0 9 01 1 2 2 3 2 3 3 4 3 5 5 6 51 2 2 4 3 4 3 6 4 6 6 0 7 01 3 2 6 3 6 3 9 4 9 6 5 7 51 4 2 8 3 8 4 2 5 2 7 0 8 01 5 3 0 4 0 4 5 5 5 7 5 8 51 6 3 2 4 2 4 8 5 8 8 0 9 01 7 3 4 4 4 5 1 6 11 8 3 6 4 6 5 4 6 41 9 3 8 4 8 5 7 6 72 0 4 0 5 0 6 0 7 02 1 4 2 5 2 6 3 7 32 2 4 4 5 4 6 6 7 62 3 4 6 5 6 6 9 7 92 4 4 8 5 8 7 2 8 22 5 5 0 6 02 6 5 2 6 22 7 5 4 6 42 8 5 6 6 62 9 5 8 6 83 0 6 0 7 03 1 6 2 7 23 2 6 4 7 43 3 6 6 7 63 4 6 8 7 83 5 7 0 8 0
T y p e I T y p e II T y pe III T yp e IV
M a in te n a nc e M a in te na n c e M a in te na n c e M a in ten a n ce
Sources : LGUs’ Assessor’s Offices, Study on the Flood Control for Rivers in the Selected
Urban Centers, 1995, JICA
Note: For conservative evaluation, figures of “poor” maintenance were adopted in this
analysis.
Value of Households Effects
Coefficient of an average value of household effects in relation to the value of houses is set at
35%. This figure is based on the result of the socio-economic survey of "KAMANAVA Area
Flood Control and Drainage System Improvement Project”.
Value of Buildings and Assets of Business Establishments
Values of buildings and assets of business establishments followed the NSO’s census data of
establishments. The latest data is as follows.
Table H.1.7 Value of Assets per Establishment
Unit : Php/establishment
Building Durable Assets Stocks
Manufacturing 1,045,000 4,627,000 4,018,000 per establishment at 1995 price
Wholesale & Retail Trade 43,000 108,000 1,295,000 per establishment at 1993 price
Hotel and Restaurants 1,162,000 1,866,000 90,000 per establishment at 1993 price
Financial / Insurance / Real Estate Business 1,242,000 844,000 661,000 per establishment at 1993 price
Educational Facilities 15,000,000 3,600,000 450,000 per school at 2001 price
Medical Facilities 9,300,000 2,400,000 1,400,000 per school at 2001 price
Source: Pasig-Marikina River Channel Improvement Project, Main Report Volume II, 2002, DPWH
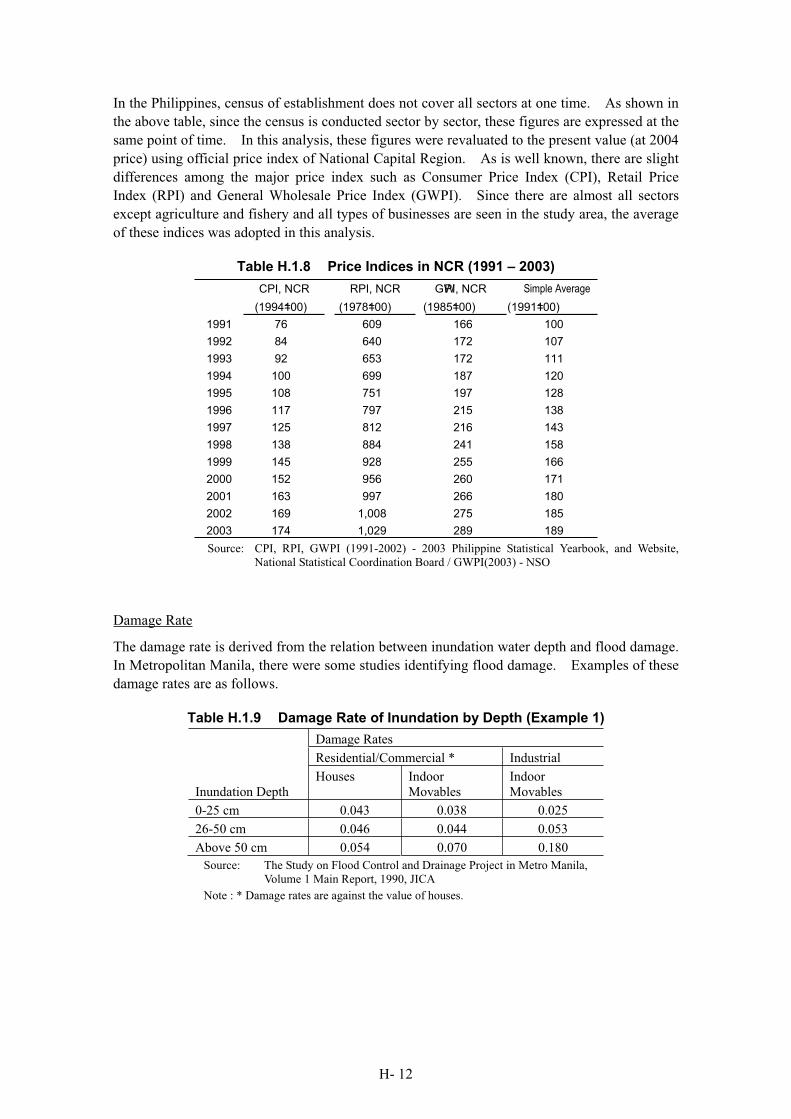
H- 12
In the Philippines, census of establishment does not cover all sectors at one time. As shown in
the above table, since the census is conducted sector by sector, these figures are expressed at the
same point of time. In this analysis, these figures were revaluated to the present value (at 2004
price) using official price index of National Capital Region. As is well known, there are slight
differences among the major price index such as Consumer Price Index (CPI), Retail Price
Index (RPI) and General Wholesale Price Index (GWPI). Since there are almost all sectors
except agriculture and fishery and all types of businesses are seen in the study area, the average
of these indices was adopted in this analysis.
Table H.1.8 Price Indices in NCR (1991 – 2003)
CPI, NCR RPI, NCR GWPI, NCR Simple Average
(1994=100) (1978=100) (1985=100) (1991=100)
1991 76 609 166 100
1992 84 640 172 107
1993 92 653 172 111
1994 100 699 187 120
1995 108 751 197 128
1996 117 797 215 138
1997 125 812 216 143
1998 138 884 241 158
1999 145 928 255 166
2000 152 956 260 171
2001 163 997 266 180
2002 169 1,008 275 185
2003 174 1,029 289 189
Source: CPI, RPI, GWPI (1991-2002) - 2003 Philippine Statistical Yearbook, and Website,
National Statistical Coordination Board / GWPI(2003) - NSO
Damage Rate
The damage rate is derived from the relation between inundation water depth and flood damage.
In Metropolitan Manila, there were some studies identifying flood damage. Examples of these
damage rates are as follows.
Table H.1.9 Damage Rate of Inundation by Depth (Example 1)
Damage Rates
Residential/Commercial * Industrial
Inundation Depth
Houses Indoor
Movables
Indoor
Movables
0-25 cm 0.043 0.038 0.025
26-50 cm 0.046 0.044 0.053
Above 50 cm 0.054 0.070 0.180
Source: The Study on Flood Control and Drainage Project in Metro Manila,
Volume 1 Main Report, 1990, JICA
Note : * Damage rates are against the value of houses.
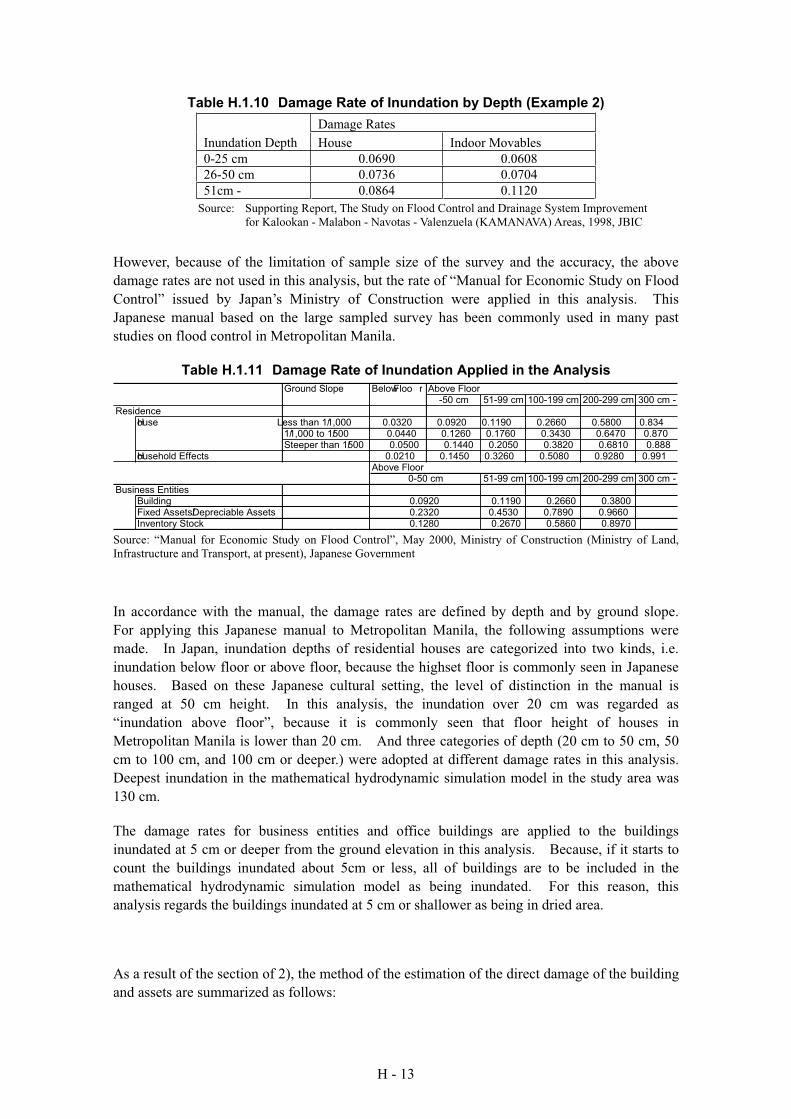
H - 13
Table H.1.10 Damage Rate of Inundation by Depth (Example 2)
Damage Rates
Inundation Depth House Indoor Movables
0-25 cm 0.0690 0.0608
26-50 cm 0.0736 0.0704
51cm - 0.0864 0.1120
Source: Supporting Report, The Study on Flood Control and Drainage System Improvement
for Kalookan - Malabon - Navotas - Valenzuela (KAMANAVA) Areas, 1998, JBIC
However, because of the limitation of sample size of the survey and the accuracy, the above
damage rates are not used in this analysis, but the rate of “Manual for Economic Study on Flood
Control” issued by Japan’s Ministry of Construction were applied in this analysis. This
Japanese manual based on the large sampled survey has been commonly used in many past
studies on flood control in Metropolitan Manila.
Table H.1.11 Damage Rate of Inundation Applied in the Analysis
Ground Slope Below Floo r Above Floor-50 cm 51-99 cm 100-199 cm 200-299 cm 300 cm -
ResidenceHouse Less than 1/1,000 0.0320 0.0920 0.1190 0.2660 0.5800 0.834
1/1,000 to 1/500 0.0440 0.1260 0.1760 0.3430 0.6470 0.870Steeper than 1/500 0.0500 0.1440 0.2050 0.3820 0.6810 0.888
Household Effects 0.0210 0.1450 0.3260 0.5080 0.9280 0.991Above Floor
51-99 cm 100-199 cm 200-299 cm 300 cm -Business Entities
Building 0.1190 0.2660 0.3800Fixed Assets/Depreciable Assets 0.4530 0.7890 0.9660Inventory Stock 0.2670 0.5860 0.8970
0-50 cm
0.09200.23200.1280
Source: “Manual for Economic Study on Flood Control”, May 2000, Ministry of Construction (Ministry of Land,
Infrastructure and Transport, at present), Japanese Government
In accordance with the manual, the damage rates are defined by depth and by ground slope.
For applying this Japanese manual to Metropolitan Manila, the following assumptions were
made. In Japan, inundation depths of residential houses are categorized into two kinds, i.e.
inundation below floor or above floor, because the highset floor is commonly seen in Japanese
houses. Based on these Japanese cultural setting, the level of distinction in the manual is
ranged at 50 cm height. In this analysis, the inundation over 20 cm was regarded as
“inundation above floor”, because it is commonly seen that floor height of houses in
Metropolitan Manila is lower than 20 cm. And three categories of depth (20 cm to 50 cm, 50
cm to 100 cm, and 100 cm or deeper.) were adopted at different damage rates in this analysis.
Deepest inundation in the mathematical hydrodynamic simulation model in the study area was
130 cm.
The damage rates for business entities and office buildings are applied to the buildings
inundated at 5 cm or deeper from the ground elevation in this analysis. Because, if it starts to
count the buildings inundated about 5cm or less, all of buildings are to be included in the
mathematical hydrodynamic simulation model as being inundated. For this reason, this
analysis regards the buildings inundated at 5 cm or shallower as being in dried area.
As a result of the section of 2), the method of the estimation of the direct damage of the building
and assets are summarized as follows:
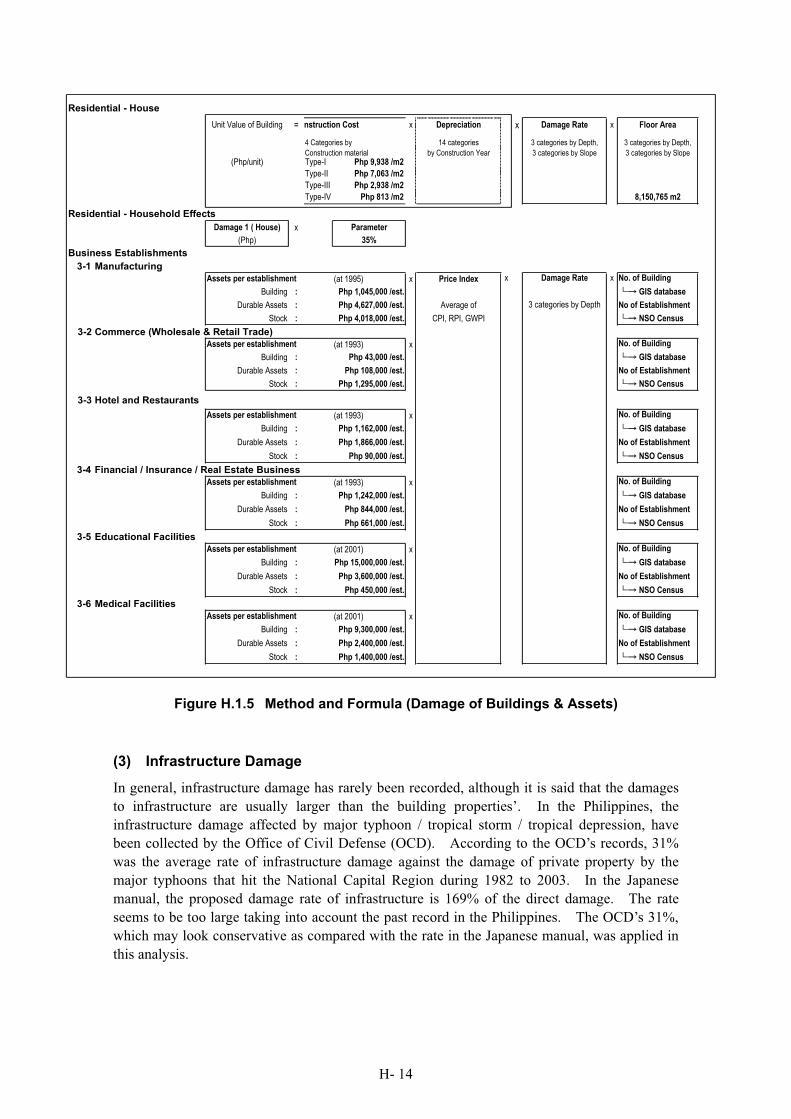
H- 14
Residential - House
Unit Value of Building = nstruction Cost x Depreciation x Damage Rate x
14 categories
by Construction Year
3 categories by Depth,
3 categories by Slope(Php/unit) Type-I Php 9,938 /m2
Type-II Php 7,063 /m2
Type-III Php 2,938 /m2
Type-IV Php 813 /m2
Residential - Household Effects
Damage 1 ( House) x Parameter
(Php) 35%
Business Establishments
3-1 Manufacturing
(at 1995) x Price Index x Damage Rate x No. of Building
Building : Php 1,045,000 /est. GIS database
Durable Assets : Php 4,627,000 /est. Average of 3 categories by Depth No of Establishment
Stock : Php 4,018,000 /est. CPI, RPI, GWPI NSO Census
3-2 Commerce (Wholesale & Retail Trade)
(at 1993) x No. of Building
Building : Php 43,000 /est. GIS database
Durable Assets : Php 108,000 /est. No of Establishment
Stock : Php 1,295,000 /est. NSO Census
3-3 Hotel and Restaurants
(at 1993) x No. of Building
Building : Php 1,162,000 /est. GIS database
Durable Assets : Php 1,866,000 /est. No of Establishment
Stock : Php 90,000 /est. NSO Census
3-4 Financial / Insurance / Real Estate Business
(at 1993) x No. of Building
Building : Php 1,242,000 /est. GIS database
Durable Assets : Php 844,000 /est. No of Establishment
Stock : Php 661,000 /est. NSO Census
3-5 Educational Facilities
(at 2001) x No. of Building
Building : Php 15,000,000 /est. GIS database
Durable Assets : Php 3,600,000 /est. No of Establishment
Stock : Php 450,000 /est. NSO Census
3-6 Medical Facilities
(at 2001) x No. of Building
Building : Php 9,300,000 /est. GIS database
Durable Assets : Php 2,400,000 /est. No of Establishment
Stock : Php 1,400,000 /est. NSO Census
8,150,765 m2
Floor Area
Assets per establishment
Assets per establishment
Assets per establishment
Assets per establishment
Assets per establishment
Assets per establishment
3 categories by Depth,
3 categories by Slope
4 Categories by
Construction material
Figure H.1.5 Method and Formula (Damage of Buildings & Assets)
(3) Infrastructure Damage
In general, infrastructure damage has rarely been recorded, although it is said that the damages
to infrastructure are usually larger than the building properties’. In the Philippines, the
infrastructure damage affected by major typhoon / tropical storm / tropical depression, have
been collected by the Office of Civil Defense (OCD). According to the OCD’s records, 31%
was the average rate of infrastructure damage against the damage of private property by the
major typhoons that hit the National Capital Region during 1982 to 2003. In the Japanese
manual, the proposed damage rate of infrastructure is 169% of the direct damage. The rate
seems to be too large taking into account the past record in the Philippines. The OCD’s 31%,
which may look conservative as compared with the rate in the Japanese manual, was applied in
this analysis.
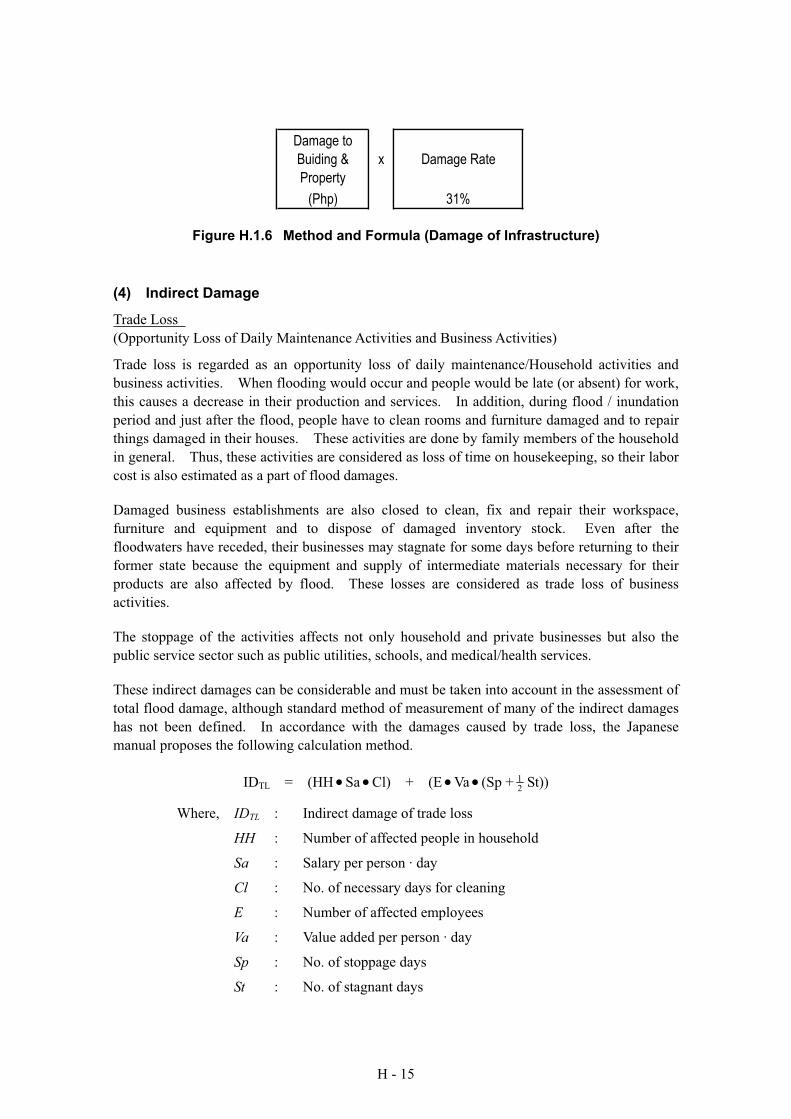
H - 15
Damage to
Buiding &
Property
x Damage Rate
(Php) 31%
Figure H.1.6 Method and Formula (Damage of Infrastructure)
(4) Indirect Damage
Trade Loss
(Opportunity Loss of Daily Maintenance Activities and Business Activities)
Trade loss is regarded as an opportunity loss of daily maintenance/Household activities and
business activities. When flooding would occur and people would be late (or absent) for work,
this causes a decrease in their production and services. In addition, during flood / inundation
period and just after the flood, people have to clean rooms and furniture damaged and to repair
things damaged in their houses. These activities are done by family members of the household
in general. Thus, these activities are considered as loss of time on housekeeping, so their labor
cost is also estimated as a part of flood damages.
Damaged business establishments are also closed to clean, fix and repair their workspace,
furniture and equipment and to dispose of damaged inventory stock. Even after the
floodwaters have receded, their businesses may stagnate for some days before returning to their
former state because the equipment and supply of intermediate materials necessary for their
products are also affected by flood. These losses are considered as trade loss of business
activities.
The stoppage of the activities affects not only household and private businesses but also the
public service sector such as public utilities, schools, and medical/health services.
These indirect damages can be considerable and must be taken into account in the assessment of
total flood damage, although standard method of measurement of many of the indirect damages
has not been defined. In accordance with the damages caused by trade loss, the Japanese
manual proposes the following calculation method.
IDTL = (HH Sa Cl) + (E Va (Sp +21 St))
Where, IDTL : Indirect damage of trade loss
HH : Number of affected people in household
Sa : Salary per person · day
Cl : No. of necessary days for cleaning
E : Number of affected employees
Va : Value added per person · day
Sp : No. of stoppage days
St : No. of stagnant days
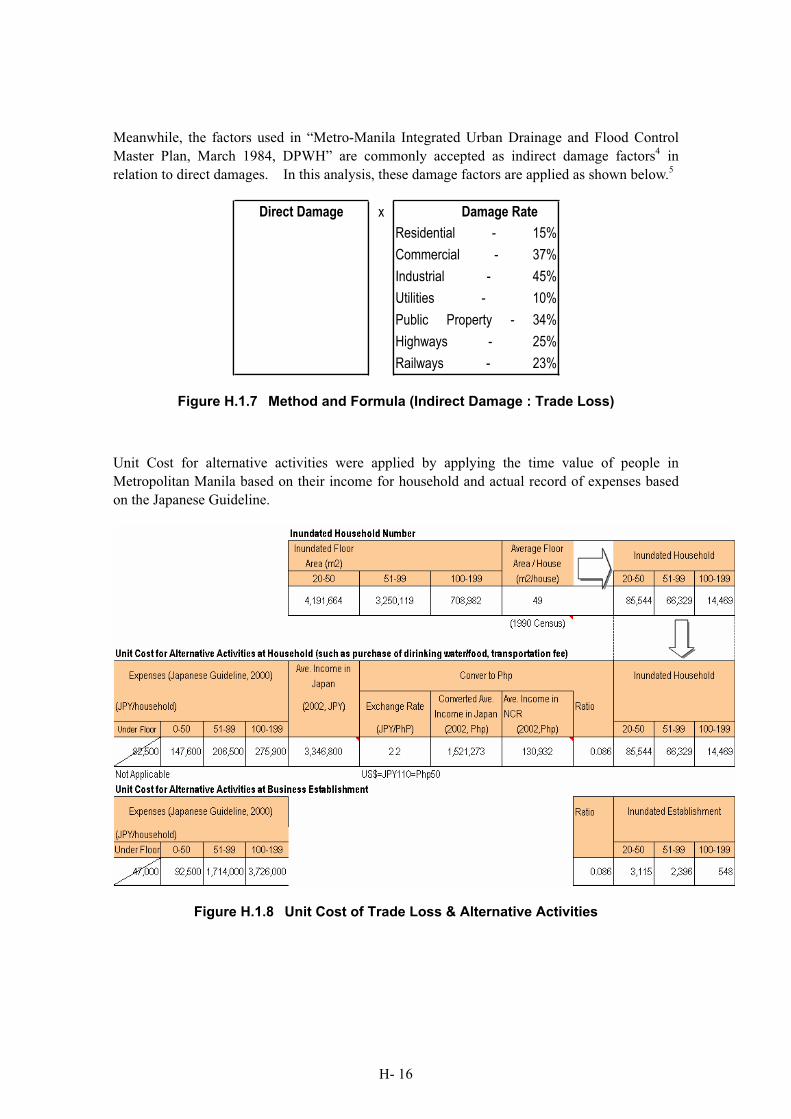
H- 16
Meanwhile, the factors used in “Metro-Manila Integrated Urban Drainage and Flood Control
Master Plan, March 1984, DPWH” are commonly accepted as indirect damage factors4 in
relation to direct damages. In this analysis, these damage factors are applied as shown below.5
Direct Damage x Damage Rate
Residential - 15%
Commercial - 37%
Industrial - 45%
Utilities - 10%
Public Property - 34%
Highways - 25%
Railways - 23%
Figure H.1.7 Method and Formula (Indirect Damage : Trade Loss)
Unit Cost for alternative activities were applied by applying the time value of people in
Metropolitan Manila based on their income for household and actual record of expenses based
on the Japanese Guideline.
Figure H.1.8 Unit Cost of Trade Loss & Alternative Activities
H - 17
Disruption of Traffic
Disruption to transportation system including delay time and increased fuel costs can also be
counted as flood damage. One of the most adverse effects of the flood perceived by the
society is the disruption to urban transportation. Consequences, however, have not been
properly studied in the past. Considering that the impact on traffic in Metropolitan Manila is
significant and of major concern to the citizens, the Study tried estimating the level of the
benefit based on the best combined information derived from vehicular traffic data and the
strength of new hydrodynamic simulation model and geographic information system developed
by the Study Team.
Flood will disrupt the traffic in the following manner depending upon the depth and duration of
inundation:
Decrease in travel speed of vehicle
Detour or cancellation of vehicle operation
Inconvenience in or obstruction to the access to transport routes
Inducement of mechanical trouble
Traffic accident
Of the above, it is considered that the first item is the most significant one, which is quantifiable
with certain accuracy. The subsequent benefit can be estimated in terms of “reduction of
vehicle operating cost” and “savings in travel time”. This is shown more specifically in the
following formula:
[Reduction of VOC] BVOC = (VOCwithout VOCwith) Q
where,
BVOC : Benefit due to reduction in vehicle operation cost
VOCwithout : Vehicle operating cost at an average travel speed for “without” project
situation
VOCwith : Vehicle operating cost at an average travel speed for “with” project
situation
Q : Traffic volume in Metropolitan Manila expressed in terms of vehicle-km
[Savings in Travel Time] BTS = (PHwithout PHwith) TV
where,
BTS : Benefit due to savings in travel time
PHwithout : Passenger – hours in Metropolitan Manila for “without” project situation
PHwith : Passenger – hours in Metropolitan Manila for “with” project situation
TV : Time value of passengers
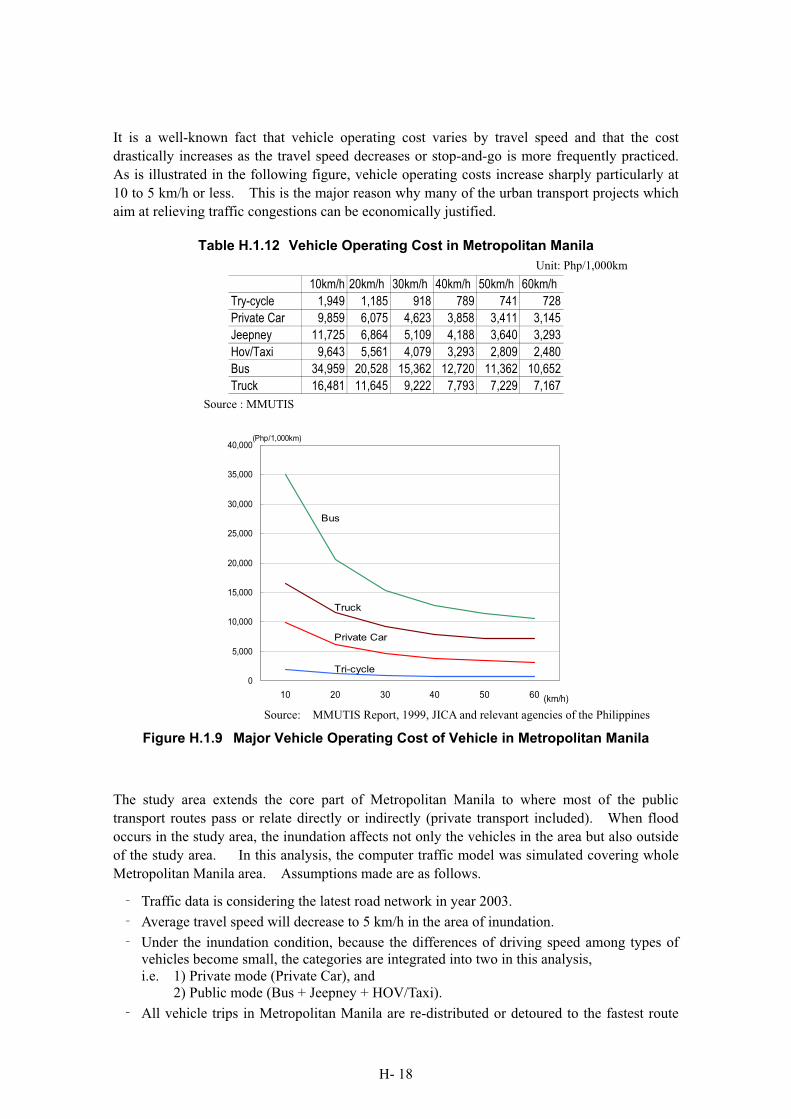
H- 18
It is a well-known fact that vehicle operating cost varies by travel speed and that the cost
drastically increases as the travel speed decreases or stop-and-go is more frequently practiced.
As is illustrated in the following figure, vehicle operating costs increase sharply particularly at
10 to 5 km/h or less. This is the major reason why many of the urban transport projects which
aim at relieving traffic congestions can be economically justified.
Table H.1.12 Vehicle Operating Cost in Metropolitan Manila
Unit: Php/1,000km
10km/h 20km/h 30km/h 40km/h 50km/h 60km/h
Try-cycle 1,949 1,185 918 789 741 728
Private Car 9,859 6,075 4,623 3,858 3,411 3,145
Jeepney 11,725 6,864 5,109 4,188 3,640 3,293
Hov/Taxi 9,643 5,561 4,079 3,293 2,809 2,480
Bus 34,959 20,528 15,362 12,720 11,362 10,652
Truck 16,481 11,645 9,222 7,793 7,229 7,167
Source : MMUTIS
0
5,000
10,000
15,000
20,000
25,000
30,000
35,000
40,000
10 20 30 40 50 60
Bus
Truck
Private Car
Tri-cycle
(km/h)
(Php/1,000km)
Source: MMUTIS Report, 1999, JICA and relevant agencies of the Philippines
Figure H.1.9 Major Vehicle Operating Cost of Vehicle in Metropolitan Manila
The study area extends the core part of Metropolitan Manila to where most of the public
transport routes pass or relate directly or indirectly (private transport included). When flood
occurs in the study area, the inundation affects not only the vehicles in the area but also outside
of the study area. In this analysis, the computer traffic model was simulated covering whole
Metropolitan Manila area. Assumptions made are as follows.
Traffic data is considering the latest road network in year 2003.
Average travel speed will decrease to 5 km/h in the area of inundation.
Under the inundation condition, because the differences of driving speed among types of
vehicles become small, the categories are integrated into two in this analysis,
i.e. 1) Private mode (Private Car), and
2) Public mode (Bus + Jeepney + HOV/Taxi).
All vehicle trips in Metropolitan Manila are re-distributed or detoured to the fastest route
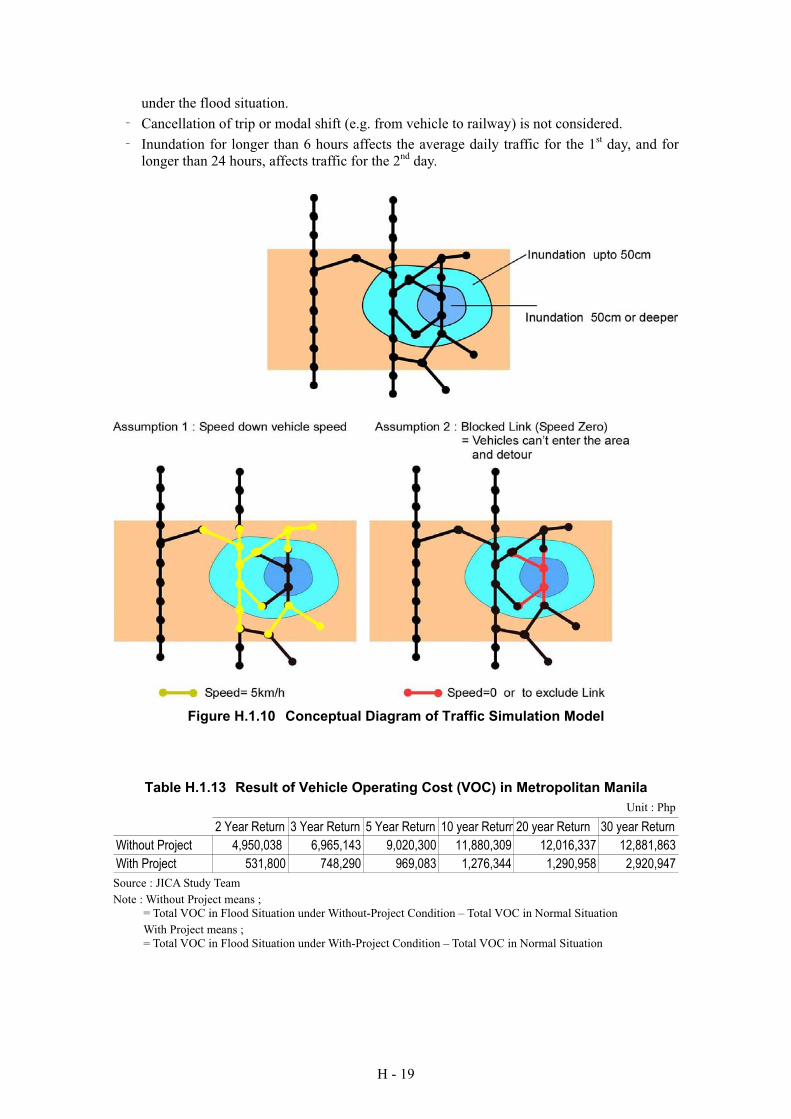
H - 19
under the flood situation.
Cancellation of trip or modal shift (e.g. from vehicle to railway) is not considered.
Inundation for longer than 6 hours affects the average daily traffic for the 1st day, and for
longer than 24 hours, affects traffic for the 2nd day.
Figure H.1.10 Conceptual Diagram of Traffic Simulation Model
Table H.1.13 Result of Vehicle Operating Cost (VOC) in Metropolitan Manila
Unit : Php
2 Year Return 3 Year Return 5 Year Return 10 year Return20 year Return 30 year Return
Without Project 4,950,038 6,965,143 9,020,300 11,880,309 12,016,337 12,881,863
With Project 531,800 748,290 969,083 1,276,344 1,290,958 2,920,947
Source : JICA Study Team
Note : Without Project means ;
= Total VOC in Flood Situation under Without-Project Condition – Total VOC in Normal Situation
With Project means ;
= Total VOC in Flood Situation under With-Project Condition – Total VOC in Normal Situation
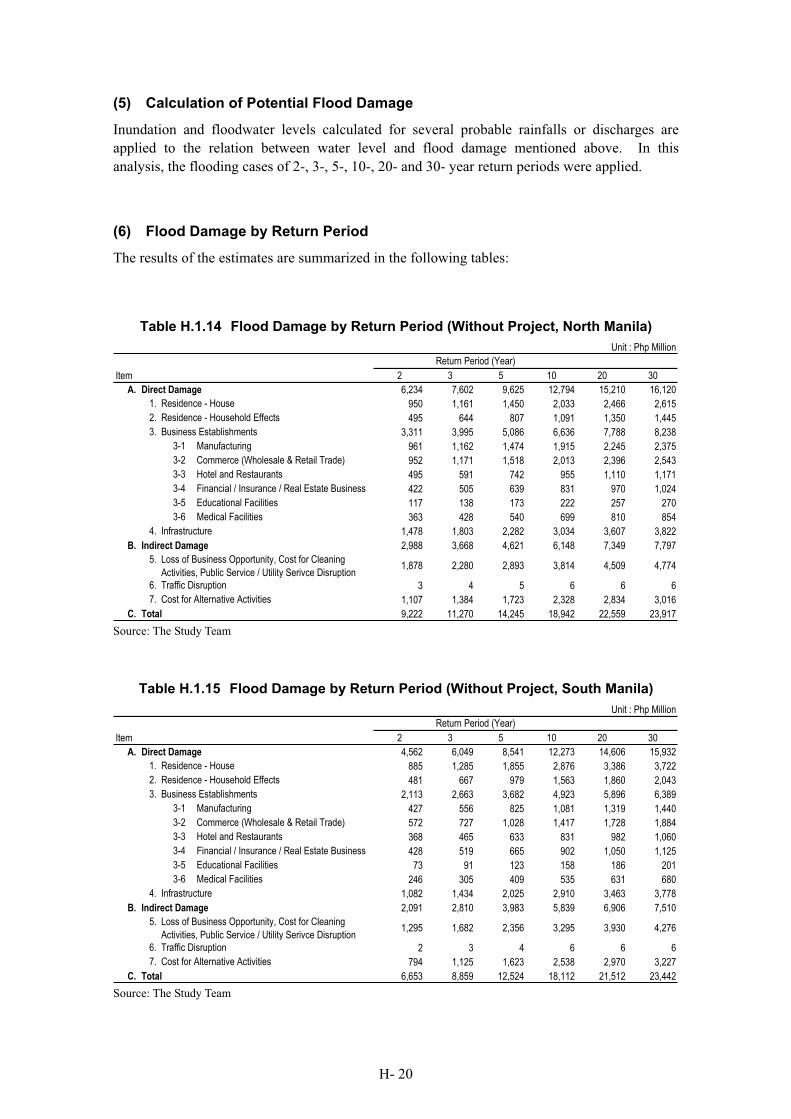
H- 20
(5) Calculation of Potential Flood Damage
Inundation and floodwater levels calculated for several probable rainfalls or discharges are
applied to the relation between water level and flood damage mentioned above. In this
analysis, the flooding cases of 2-, 3-, 5-, 10-, 20- and 30- year return periods were applied.
(6) Flood Damage by Return Period
The results of the estimates are summarized in the following tables:
Table H.1.14 Flood Damage by Return Period (Without Project, North Manila)
Unit : Php Million
Item 2 3 5 10 20 30
A. Direct Damage 6,234 7,602 9,625 12,794 15,210 16,120
1. Residence - House 950 1,161 1,450 2,033 2,466 2,615
2. Residence - Household Effects 495 644 807 1,091 1,350 1,445
3. Business Establishments 3,311 3,995 5,086 6,636 7,788 8,238
3-1 Manufacturing 961 1,162 1,474 1,915 2,245 2,375
3-2 Commerce (Wholesale & Retail Trade) 952 1,171 1,518 2,013 2,396 2,543
3-3 Hotel and Restaurants 495 591 742 955 1,110 1,171
3-4 Financial / Insurance / Real Estate Business 422 505 639 831 970 1,024
3-5 Educational Facilities 117 138 173 222 257 270
3-6 Medical Facilities 363 428 540 699 810 854
4. Infrastructure 1,478 1,803 2,282 3,034 3,607 3,822
B. Indirect Damage 2,988 3,668 4,621 6,148 7,349 7,797
5.1,878 2,280 2,893 3,814 4,509 4,774
6. Traffic Disruption 3 4 5 6 6 6
7. Cost for Alternative Activities 1,107 1,384 1,723 2,328 2,834 3,016
C. Total 9,222 11,270 14,245 18,942 22,559 23,917
Loss of Business Opportunity, Cost for Cleaning
Activities, Public Service / Utility Serivce Disruption
Return Period (Year)
Source: The Study Team
Table H.1.15 Flood Damage by Return Period (Without Project, South Manila)
Unit : Php Million
Item 2 3 5 10 20 30
A. Direct Damage 4,562 6,049 8,541 12,273 14,606 15,932
1. Residence - House 885 1,285 1,855 2,876 3,386 3,722
2. Residence - Household Effects 481 667 979 1,563 1,860 2,043
3. Business Establishments 2,113 2,663 3,682 4,923 5,896 6,389
3-1 Manufacturing 427 556 825 1,081 1,319 1,440
3-2 Commerce (Wholesale & Retail Trade) 572 727 1,028 1,417 1,728 1,884
3-3 Hotel and Restaurants 368 465 633 831 982 1,060
3-4 Financial / Insurance / Real Estate Business 428 519 665 902 1,050 1,125
3-5 Educational Facilities 73 91 123 158 186 201
3-6 Medical Facilities 246 305 409 535 631 680
4. Infrastructure 1,082 1,434 2,025 2,910 3,463 3,778
B. Indirect Damage 2,091 2,810 3,983 5,839 6,906 7,510
5.1,295 1,682 2,356 3,295 3,930 4,276
6. Traffic Disruption 2 3 4 6 6 6
7. Cost for Alternative Activities 794 1,125 1,623 2,538 2,970 3,227
C. Total 6,653 8,859 12,524 18,112 21,512 23,442
Loss of Business Opportunity, Cost for Cleaning
Activities, Public Service / Utility Serivce Disruption
Return Period (Year)
Source: The Study Team
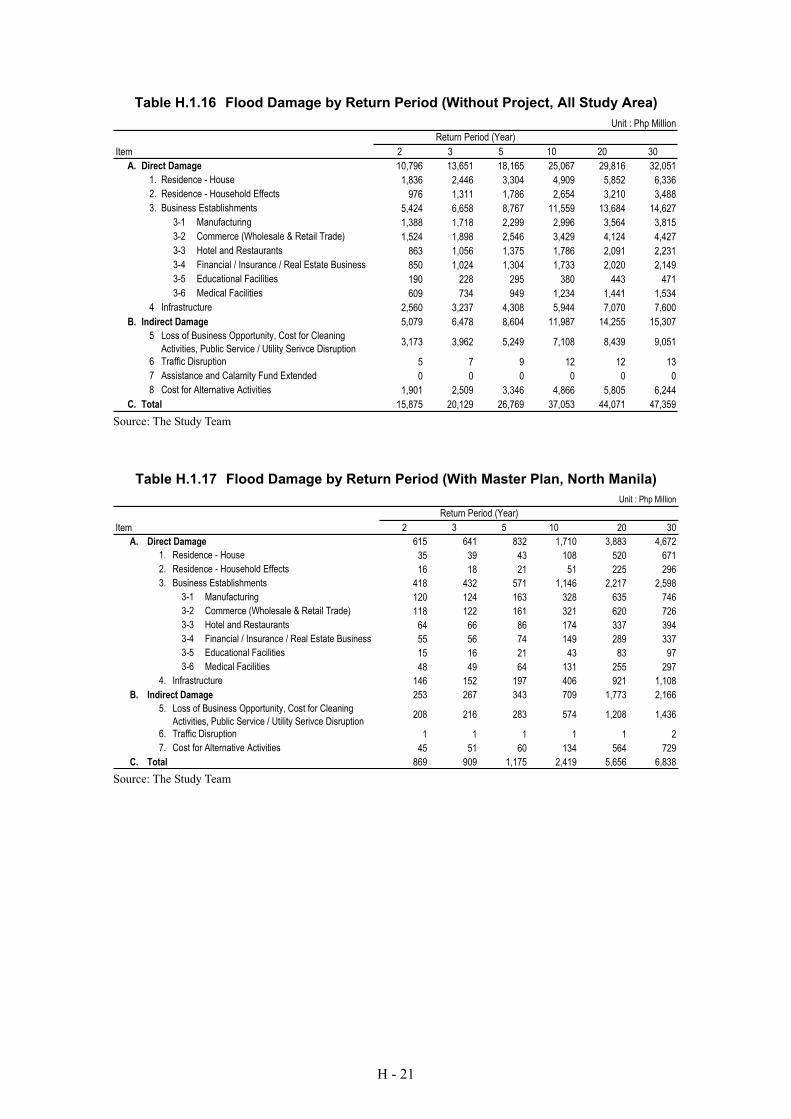
H - 21
Table H.1.16 Flood Damage by Return Period (Without Project, All Study Area)
Unit : Php Million
Item 2 3 5 10 20 30
A. Direct Damage 10,796 13,651 18,165 25,067 29,816 32,051
1. Residence - House 1,836 2,446 3,304 4,909 5,852 6,336
2. Residence - Household Effects 976 1,311 1,786 2,654 3,210 3,488
3. Business Establishments 5,424 6,658 8,767 11,559 13,684 14,627
3-1 Manufacturing 1,388 1,718 2,299 2,996 3,564 3,815
3-2 Commerce (Wholesale & Retail Trade) 1,524 1,898 2,546 3,429 4,124 4,427
3-3 Hotel and Restaurants 863 1,056 1,375 1,786 2,091 2,231
3-4 Financial / Insurance / Real Estate Business 850 1,024 1,304 1,733 2,020 2,149
3-5 Educational Facilities 190 228 295 380 443 471
3-6 Medical Facilities 609 734 949 1,234 1,441 1,534
4 Infrastructure 2,560 3,237 4,308 5,944 7,070 7,600
B. Indirect Damage 5,079 6,478 8,604 11,987 14,255 15,307
53,173 3,962 5,249 7,108 8,439 9,051
6 Traffic Disruption 5 7 9 12 12 13
7 Assistance and Calamity Fund Extended 0 0 0 0 0 0
8 Cost for Alternative Activities 1,901 2,509 3,346 4,866 5,805 6,244
C. Total 15,875 20,129 26,769 37,053 44,071 47,359
Return Period (Year)
Loss of Business Opportunity, Cost for Cleaning
Activities, Public Service / Utility Serivce Disruption
Source: The Study Team
Table H.1.17 Flood Damage by Return Period (With Master Plan, North Manila)
Unit : Php Million
Item 2 3 5 10 20 30
A. Direct Damage 615 641 832 1,710 3,883 4,672
1. Residence - House 35 39 43 108 520 671
2. Residence - Household Effects 16 18 21 51 225 296
3. Business Establishments 418 432 571 1,146 2,217 2,598
3-1 Manufacturing 120 124 163 328 635 746
3-2 Commerce (Wholesale & Retail Trade) 118 122 161 321 620 726
3-3 Hotel and Restaurants 64 66 86 174 337 394
3-4 Financial / Insurance / Real Estate Business 55 56 74 149 289 337
3-5 Educational Facilities 15 16 21 43 83 97
3-6 Medical Facilities 48 49 64 131 255 297
4. Infrastructure 146 152 197 406 921 1,108
B. Indirect Damage 253 267 343 709 1,773 2,166
5.208 216 283 574 1,208 1,436
6. Traffic Disruption 1 1 1 1 1 2
7. Cost for Alternative Activities 45 51 60 134 564 729
C. Total 869 909 1,175 2,419 5,656 6,838
Return Period (Year)
Loss of Business Opportunity, Cost for Cleaning
Activities, Public Service / Utility Serivce Disruption
Source: The Study Team
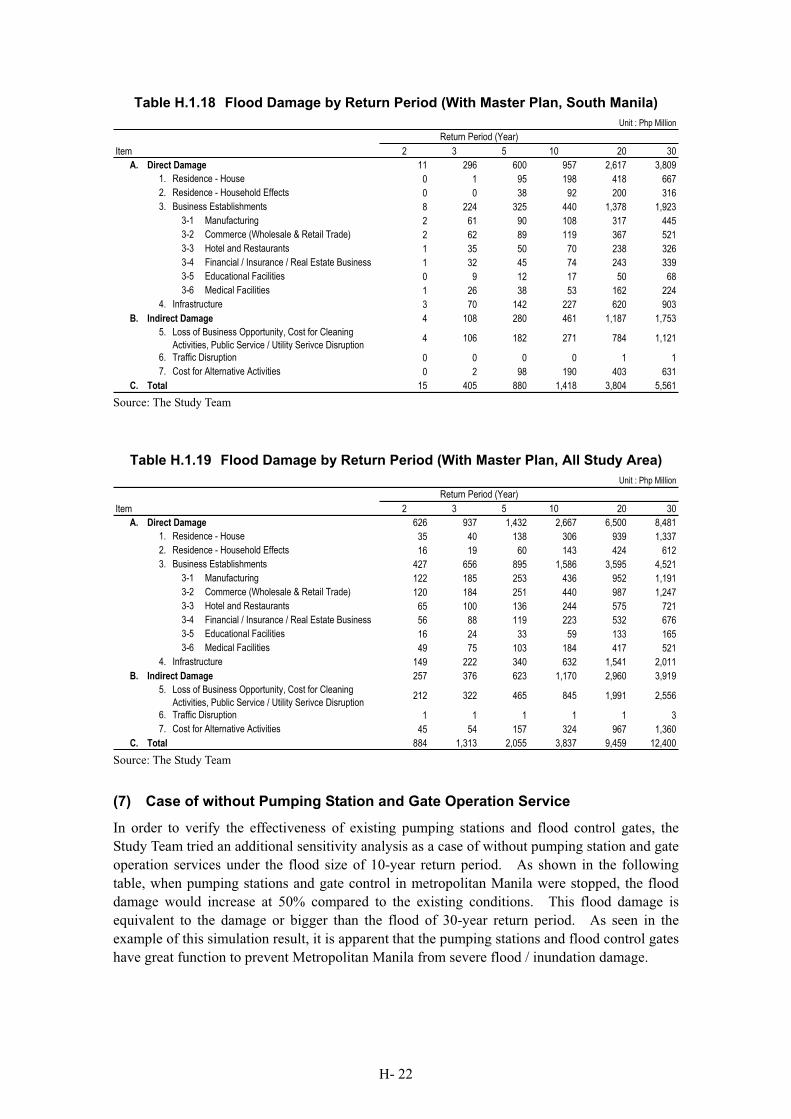
H- 22
Table H.1.18 Flood Damage by Return Period (With Master Plan, South Manila)
Unit : Php Million
Item 2 3 5 10 20 30
A. Direct Damage 11 296 600 957 2,617 3,809
1. Residence - House 0 1 95 198 418 667
2. Residence - Household Effects 0 0 38 92 200 316
3. Business Establishments 8 224 325 440 1,378 1,923
3-1 Manufacturing 2 61 90 108 317 445
3-2 Commerce (Wholesale & Retail Trade) 2 62 89 119 367 521
3-3 Hotel and Restaurants 1 35 50 70 238 326
3-4 Financial / Insurance / Real Estate Business 1 32 45 74 243 339
3-5 Educational Facilities 0 9 12 17 50 68
3-6 Medical Facilities 1 26 38 53 162 224
4. Infrastructure 3 70 142 227 620 903
B. Indirect Damage 4 108 280 461 1,187 1,753
5.4 106 182 271 784 1,121
6. Traffic Disruption 0 0 0 0 1 1
7. Cost for Alternative Activities 0 2 98 190 403 631
C. Total 15 405 880 1,418 3,804 5,561
Loss of Business Opportunity, Cost for Cleaning
Activities, Public Service / Utility Serivce Disruption
Return Period (Year)
Source: The Study Team
Table H.1.19 Flood Damage by Return Period (With Master Plan, All Study Area)
Unit : Php Million
Item 2 3 5 10 20 30
A. Direct Damage 626 937 1,432 2,667 6,500 8,481
1. Residence - House 35 40 138 306 939 1,337
2. Residence - Household Effects 16 19 60 143 424 612
3. Business Establishments 427 656 895 1,586 3,595 4,521
3-1 Manufacturing 122 185 253 436 952 1,191
3-2 Commerce (Wholesale & Retail Trade) 120 184 251 440 987 1,247
3-3 Hotel and Restaurants 65 100 136 244 575 721
3-4 Financial / Insurance / Real Estate Business 56 88 119 223 532 676
3-5 Educational Facilities 16 24 33 59 133 165
3-6 Medical Facilities 49 75 103 184 417 521
4. Infrastructure 149 222 340 632 1,541 2,011
B. Indirect Damage 257 376 623 1,170 2,960 3,919
5.212 322 465 845 1,991 2,556
6. Traffic Disruption 1 1 1 1 1 3
7. Cost for Alternative Activities 45 54 157 324 967 1,360
C. Total 884 1,313 2,055 3,837 9,459 12,400
Return Period (Year)
Loss of Business Opportunity, Cost for Cleaning
Activities, Public Service / Utility Serivce Disruption
Source: The Study Team
(7) Case of without Pumping Station and Gate Operation Service
In order to verify the effectiveness of existing pumping stations and flood control gates, the
Study Team tried an additional sensitivity analysis as a case of without pumping station and gate
operation services under the flood size of 10-year return period. As shown in the following
table, when pumping stations and gate control in metropolitan Manila were stopped, the flood
damage would increase at 50% compared to the existing conditions. This flood damage is
equivalent to the damage or bigger than the flood of 30-year return period. As seen in the
example of this simulation result, it is apparent that the pumping stations and flood control gates
have great function to prevent Metropolitan Manila from severe flood / inundation damage.
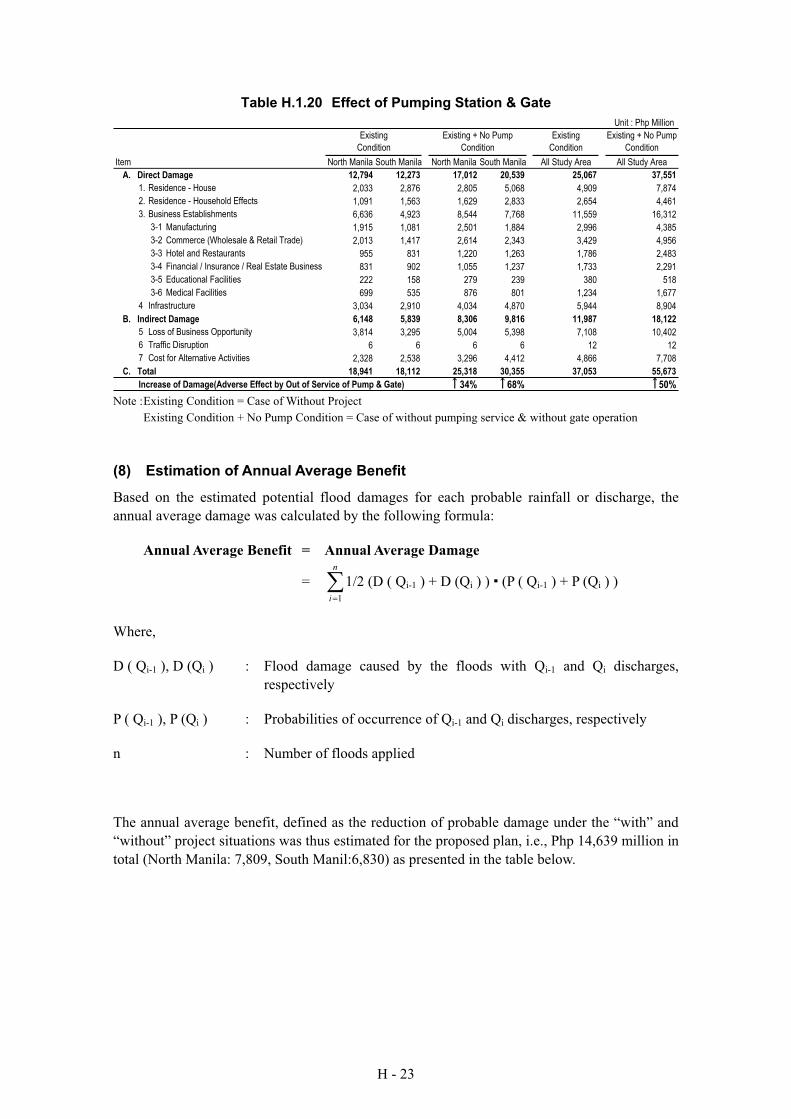
H - 23
Table H.1.20 Effect of Pumping Station & Gate
Unit : Php Million
Existing
Condition
Existing + No Pump
Condition
Item North Manila South Manila North Manila South Manila All Study Area All Study Area
A. Direct Damage 12,794 12,273 17,012 20,539 25,067 37,551
1. Residence - House 2,033 2,876 2,805 5,068 4,909 7,874
2. Residence - Household Effects 1,091 1,563 1,629 2,833 2,654 4,461
3. Business Establishments 6,636 4,923 8,544 7,768 11,559 16,312
3-1 Manufacturing 1,915 1,081 2,501 1,884 2,996 4,385
3-2 Commerce (Wholesale & Retail Trade) 2,013 1,417 2,614 2,343 3,429 4,956
3-3 Hotel and Restaurants 955 831 1,220 1,263 1,786 2,483
3-4 Financial / Insurance / Real Estate Business 831 902 1,055 1,237 1,733 2,291
3-5 Educational Facilities 222 158 279 239 380 518
3-6 Medical Facilities 699 535 876 801 1,234 1,677
4 Infrastructure 3,034 2,910 4,034 4,870 5,944 8,904
B. Indirect Damage 6,148 5,839 8,306 9,816 11,987 18,122
5 Loss of Business Opportunity 3,814 3,295 5,004 5,398 7,108 10,402
6 Traffic Disruption 6 6 6 6 12 12
7 Cost for Alternative Activities 2,328 2,538 3,296 4,412 4,866 7,708
C. Total 18,941 18,112 25,318 30,355 37,053 55,673
Increase of Damage(Adverse Effect by Out of Service of Pump & Gate) 34% 68% 50%
Existing
Condition
Existing + No Pump
Condition
Note : Existing Condition = Case of Without Project
Existing Condition + No Pump Condition = Case of without pumping service & without gate operation
(8) Estimation of Annual Average Benefit
Based on the estimated potential flood damages for each probable rainfall or discharge, the
annual average damage was calculated by the following formula:
Annual Average Benefit = Annual Average Damage
= n
i 1
1/2 (D ( Qi-1 ) + D (Qi ) ) · (P ( Qi-1 ) + P (Qi ) )
Where,
D ( Qi-1 ), D (Qi ) : Flood damage caused by the floods with Qi-1 and Qi discharges,
respectively
P ( Qi-1 ), P (Qi ) : Probabilities of occurrence of Qi-1 and Qi discharges, respectively
n : Number of floods applied
The annual average benefit, defined as the reduction of probable damage under the “with” and
“without” project situations was thus estimated for the proposed plan, i.e., Php 14,639 million in
total (North Manila: 7,809, South Manil:6,830) as presented in the table below.
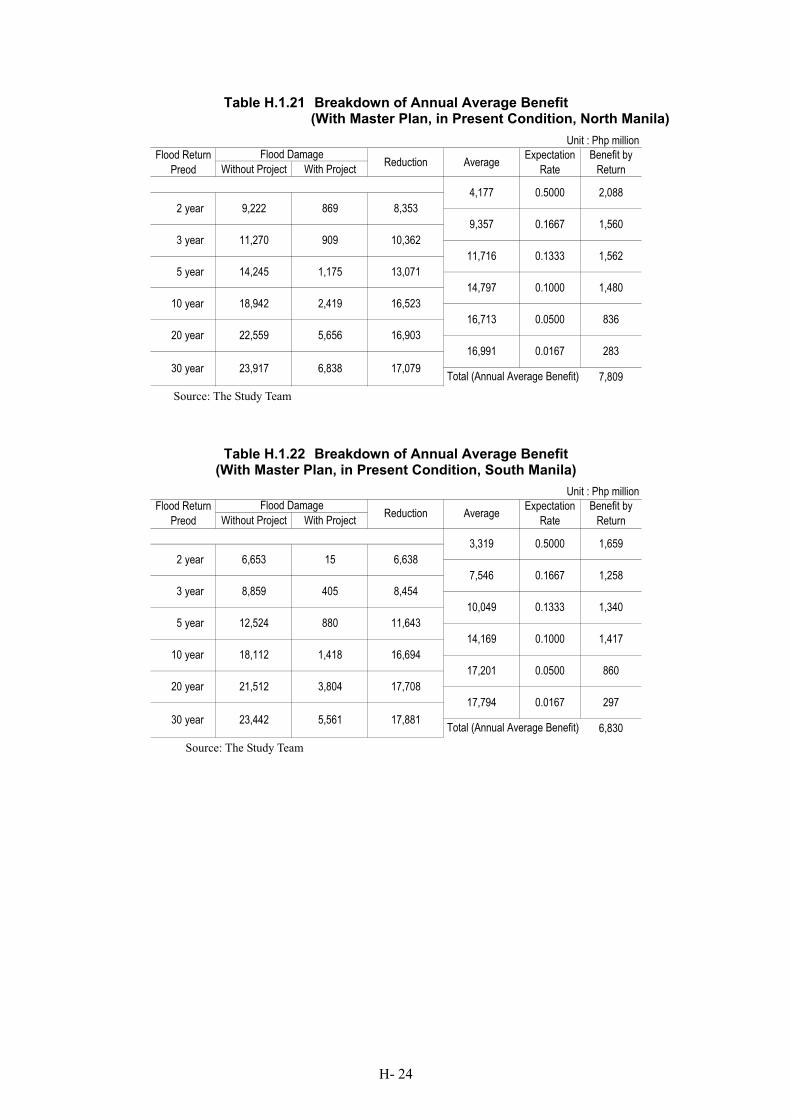
H- 24
Table H.1.21 Breakdown of Annual Average Benefit (With Master Plan, in Present Condition, North Manila)
Unit : Php million
Without Project With Project
7,809
Flood Return
Preod
Flood DamageReduction Average
Expectation
Rate
Benefit by
Return
4,177 0.5000 2,088
2 year 9,222 869 8,353
9,357 0.1667 1,560
10,362
11,716 0.1333 1,562
13,071
14,797
3 year 11,270 909
5 year 14,245 1,175
0.1000 1,480
10 year 18,942 2,419 16,523
16,713 0.0500 836
20 year 22,559 5,656 16,903
16,991 0.0167 283
17,079Total (Annual Average Benefit)
30 year 23,917 6,838
Source: The Study Team
Table H.1.22 Breakdown of Annual Average Benefit (With Master Plan, in Present Condition, South Manila)
Unit : Php million
Without Project With Project
6,83030 year 23,442 5,561
17,708
17,794 0.0167 297
17,881Total (Annual Average Benefit)
20 year 21,512 3,804
0.1000 1,417
10 year 18,112 1,418 16,694
17,201 0.0500 860
5 year 12,524 880
3 year 8,859 405
6,638
7,546 0.1667 1,258
8,454
10,049 0.1333 1,340
11,643
14,169
2 year 6,653 15
Expectation
Rate
Benefit by
Return
3,319 0.5000 1,659
Flood Return
Preod
Flood DamageReduction Average
Source: The Study Team
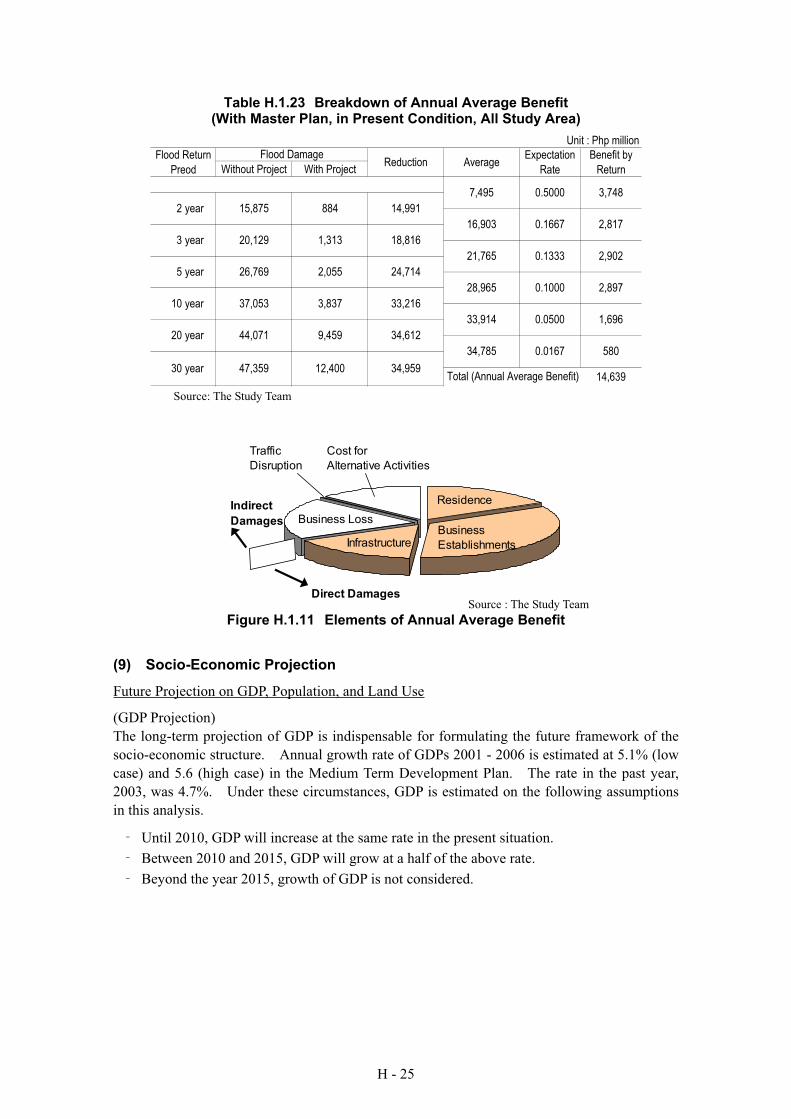
H - 25
Table H.1.23 Breakdown of Annual Average Benefit (With Master Plan, in Present Condition, All Study Area)
Unit : Php million
Without Project With Project
14,639
Flood Return
Preod
Flood DamageReduction Average
Expectation
Rate
Benefit by
Return
7,495 0.5000 3,748
2 year 15,875 884 14,991
16,903 0.1667 2,817
18,816
21,765 0.1333 2,902
24,714
28,965
3 year 20,129 1,313
5 year 26,769 2,055
0.1000 2,897
10 year 37,053 3,837 33,216
33,914 0.0500 1,696
20 year 44,071 9,459 34,612
34,785 0.0167 580
34,959Total (Annual Average Benefit)
30 year 47,359 12,400
Source: The Study Team
Residence
Business
EstablishmentsInfrastructure
Business Loss
Cost for
Alternative Activities
Traffic
Disruption
Direct Damages
Indirect
Damages
Figure H.1.11 Elements of Annual Average Benefit
(9) Socio-Economic Projection
Future Projection on GDP, Population, and Land Use
(GDP Projection)
The long-term projection of GDP is indispensable for formulating the future framework of the
socio-economic structure. Annual growth rate of GDPs 2001 - 2006 is estimated at 5.1% (low
case) and 5.6 (high case) in the Medium Term Development Plan. The rate in the past year,
2003, was 4.7%. Under these circumstances, GDP is estimated on the following assumptions
in this analysis.
Until 2010, GDP will increase at the same rate in the present situation.
Between 2010 and 2015, GDP will grow at a half of the above rate.
Beyond the year 2015, growth of GDP is not considered.
Source : The Study Team
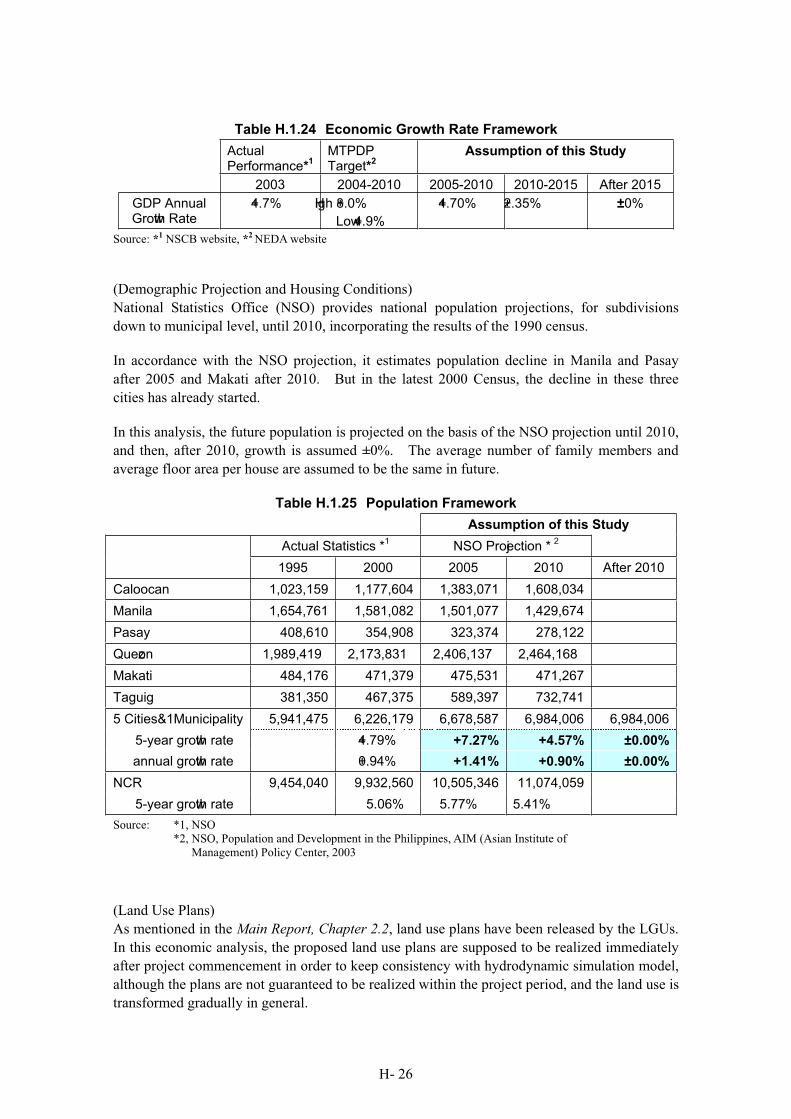
H- 26
Table H.1.24 Economic Growth Rate Framework
Actual Performance*
1MTPDPTarget*
2Assumption of this Study
2003 2004-2010 2005-2010 2010-2015 After 2015
GDP Annual Growth Rate
+4.7% High +8.0%
Low +4.9%
+4.70% +2.35% ±0%
Source: *1 NSCB website, *2 NEDA website
(Demographic Projection and Housing Conditions)
National Statistics Office (NSO) provides national population projections, for subdivisions
down to municipal level, until 2010, incorporating the results of the 1990 census.
In accordance with the NSO projection, it estimates population decline in Manila and Pasay
after 2005 and Makati after 2010. But in the latest 2000 Census, the decline in these three
cities has already started.
In this analysis, the future population is projected on the basis of the NSO projection until 2010,
and then, after 2010, growth is assumed ±0%. The average number of family members and
average floor area per house are assumed to be the same in future.
Table H.1.25 Population Framework
Assumption of this Study
Actual Statistics *1 NSO Projection *
2
1995 2000 2005 2010 After 2010
Caloocan 1,023,159 1,177,604 1,383,071 1,608,034
Manila 1,654,761 1,581,082 1,501,077 1,429,674
Pasay 408,610 354,908 323,374 278,122
Quezon 1,989,419 2,173,831 2,406,137 2,464,168
Makati 484,176 471,379 475,531 471,267
Taguig 381,350 467,375 589,397 732,741
5 Cities&1Municipality 5,941,475 6,226,179 6,678,587 6,984,006 6,984,006
5-year growth rate +4.79% +7.27% +4.57% ±0.00%
annual growth rate +0.94% +1.41% +0.90% ±0.00%
NCR 9,454,040 9,932,560 10,505,346 11,074,059
5-year growth rate 5.06% 5.77% 5.41%
Source: *1, NSO
*2, NSO, Population and Development in the Philippines, AIM (Asian Institute of
Management) Policy Center, 2003
(Land Use Plans)
As mentioned in the Main Report, Chapter 2.2, land use plans have been released by the LGUs.
In this economic analysis, the proposed land use plans are supposed to be realized immediately
after project commencement in order to keep consistency with hydrodynamic simulation model,
although the plans are not guaranteed to be realized within the project period, and the land use is
transformed gradually in general.
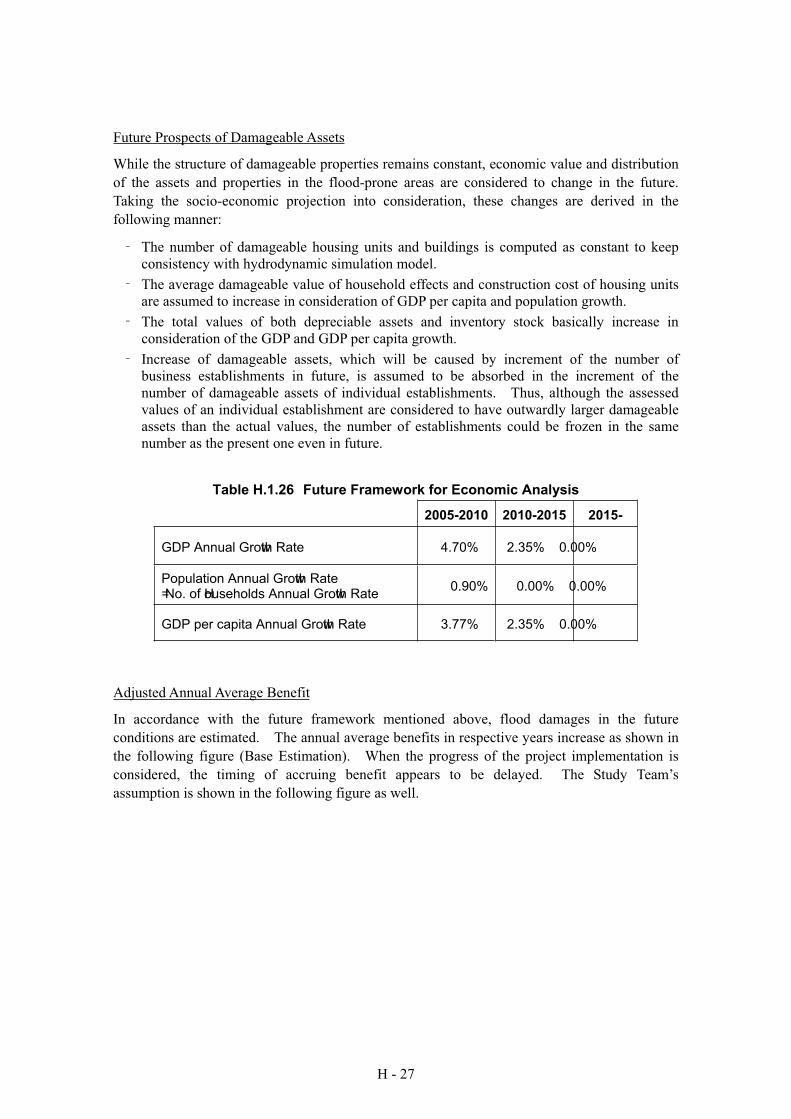
H - 27
Future Prospects of Damageable Assets
While the structure of damageable properties remains constant, economic value and distribution
of the assets and properties in the flood-prone areas are considered to change in the future.
Taking the socio-economic projection into consideration, these changes are derived in the
following manner:
The number of damageable housing units and buildings is computed as constant to keep
consistency with hydrodynamic simulation model.
The average damageable value of household effects and construction cost of housing units
are assumed to increase in consideration of GDP per capita and population growth.
The total values of both depreciable assets and inventory stock basically increase in
consideration of the GDP and GDP per capita growth.
Increase of damageable assets, which will be caused by increment of the number of
business establishments in future, is assumed to be absorbed in the increment of the
number of damageable assets of individual establishments. Thus, although the assessed
values of an individual establishment are considered to have outwardly larger damageable
assets than the actual values, the number of establishments could be frozen in the same
number as the present one even in future.
Table H.1.26 Future Framework for Economic Analysis
2005-2010 2010-2015 2015-
GDP Annual Growth Rate 4.70% 2.35% 0.00%
Population Annual Growth Rate = No. of Households Annual Growth Rate
0.90% 0.00% 0.00%
GDP per capita Annual Growth Rate 3.77% 2.35% 0.00%
Adjusted Annual Average Benefit
In accordance with the future framework mentioned above, flood damages in the future
conditions are estimated. The annual average benefits in respective years increase as shown in
the following figure (Base Estimation). When the progress of the project implementation is
considered, the timing of accruing benefit appears to be delayed. The Study Team’s
assumption is shown in the following figure as well.
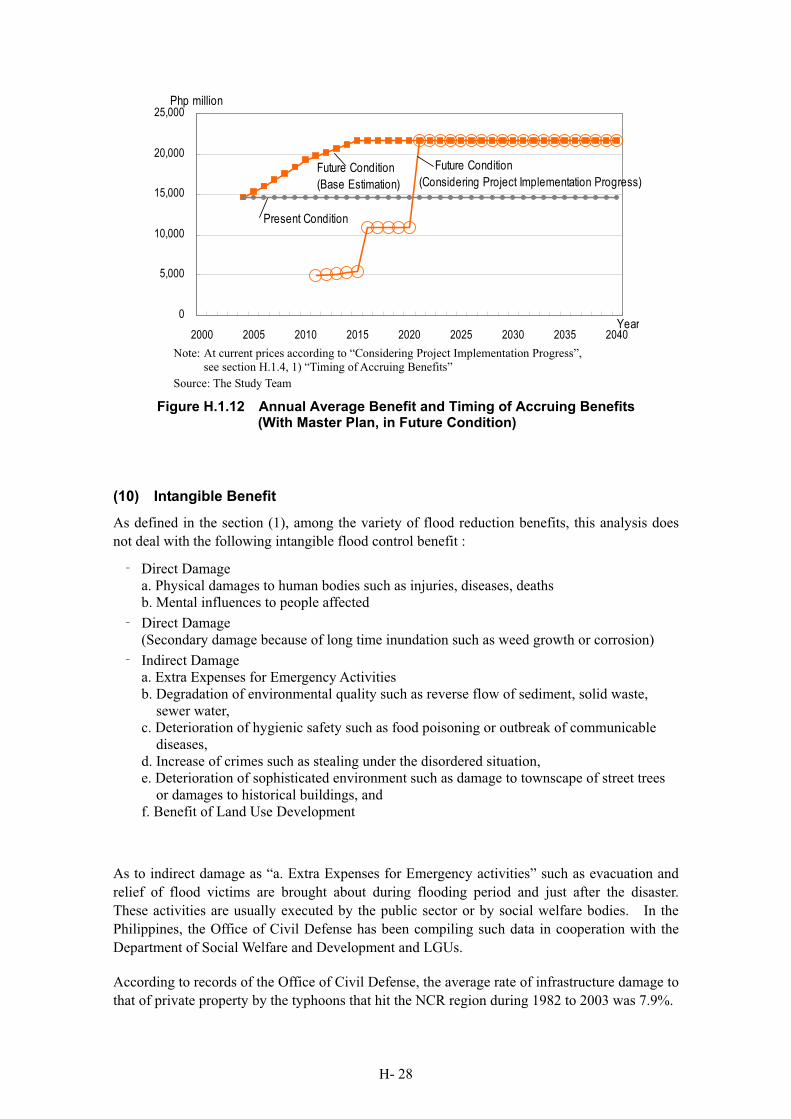
H- 28
0
5,000
10,000
15,000
20,000
25,000
2000 2005 2010 2015 2020 2025 2030 2035 2040
Php million
Year
Future Condition
(Base Estimation)
Future Condition
(Considering Project Implementation Progress)
Present Condition
Note: At current prices according to “Considering Project Implementation Progress”,
see section H.1.4, 1) “Timing of Accruing Benefits”
Source: The Study Team
Figure H.1.12 Annual Average Benefit and Timing of Accruing Benefits (With Master Plan, in Future Condition)
(10) Intangible Benefit
As defined in the section (1), among the variety of flood reduction benefits, this analysis does
not deal with the following intangible flood control benefit :
Direct Damage
a. Physical damages to human bodies such as injuries, diseases, deaths
b. Mental influences to people affected
Direct Damage
(Secondary damage because of long time inundation such as weed growth or corrosion)
Indirect Damage
a. Extra Expenses for Emergency Activities
b. Degradation of environmental quality such as reverse flow of sediment, solid waste,
sewer water,
c. Deterioration of hygienic safety such as food poisoning or outbreak of communicable
diseases,
d. Increase of crimes such as stealing under the disordered situation,
e. Deterioration of sophisticated environment such as damage to townscape of street trees
or damages to historical buildings, and
f. Benefit of Land Use Development
As to indirect damage as “a. Extra Expenses for Emergency activities” such as evacuation and
relief of flood victims are brought about during flooding period and just after the disaster.
These activities are usually executed by the public sector or by social welfare bodies. In the
Philippines, the Office of Civil Defense has been compiling such data in cooperation with the
Department of Social Welfare and Development and LGUs.
According to records of the Office of Civil Defense, the average rate of infrastructure damage to
that of private property by the typhoons that hit the NCR region during 1982 to 2003 was 7.9%.
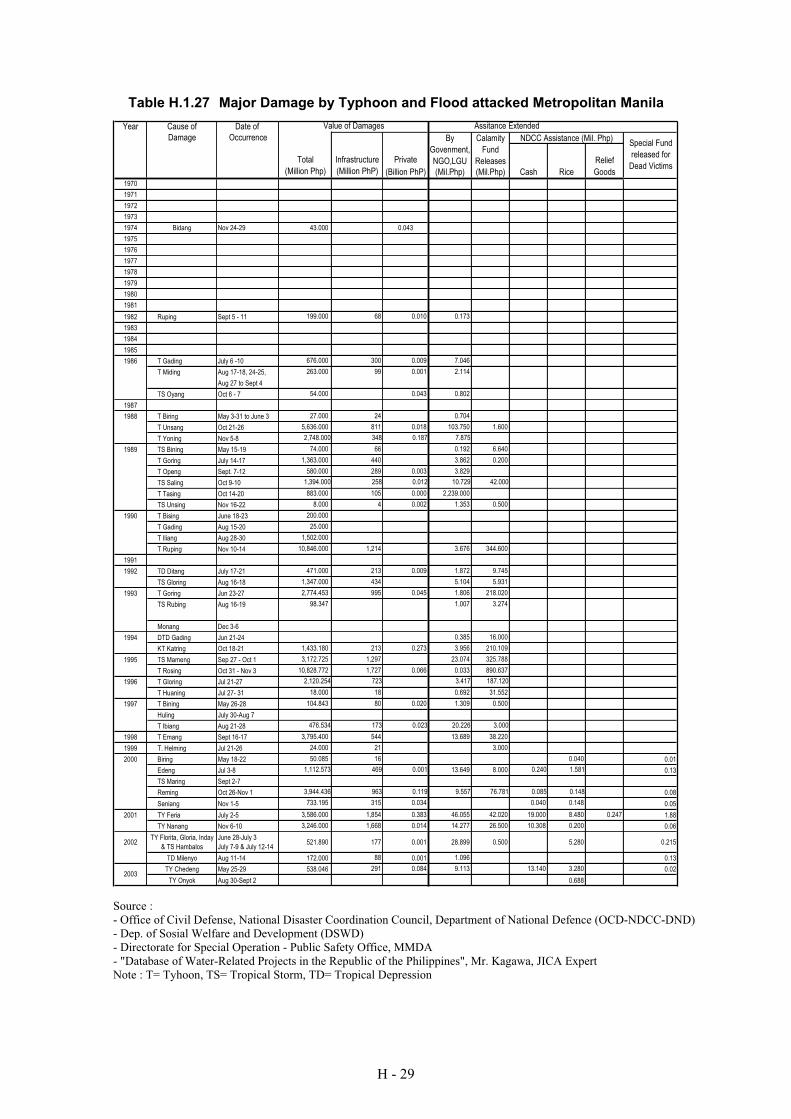
H - 29
Table H.1.27 Major Damage by Typhoon and Flood attacked Metropolitan Manila
Year Cause of Date of
Damage Occurrence
Relief
(Billion PhP) (Mil.Php) (Mil.Php) Cash Rice Goods
1970
1971
1972
1973
1974 Bidang Nov 24-29 43.000 0.043
1975
1976
1977
1978
1979
1980
1981
1982 Ruping Sept 5 - 11 199.000 68 0.010 0.173
1983
1984
1985
1986 T Gading July 6 -10 676.000 300 0.009 7.046
T Miding Aug 17-18, 24-25, 263.000 99 0.001 2.114
Aug 27 to Sept 4
TS Oyang Oct 6 - 7 54.000 0.043 0.802
1987
1988 T Biring May 3-31 to June 3 27.000 24 0.704
T Unsang Oct 21-26 5,636.000 811 0.018 103.750 1.600
T Yoning Nov 5-8 2,748.000 348 0.187 7.875
1989 TS Bining May 15-19 74.000 66 0.192 6.640
T Goring July 14-17 1,363.000 440 3.862 0.200
T Openg Sept. 7-12 580.000 289 0.003 3.829
TS Saling Oct 9-10 1,394.000 258 0.012 10.729 42.000
T Tasing Oct 14-20 883.000 105 0.000 2,239.000
TS Unsing Nov 16-22 8.000 4 0.002 1.353 0.500
1990 T Bising June 18-23 200.000
T Gading Aug 15-20 25.000
T Iliang Aug 28-30 1,502.000
T Ruping Nov 10-14 10,846.000 1,214 3.676 344.600
1991
1992 TD Ditang July 17-21 471.000 213 0.009 1.872 9.745
TS Gloring Aug 16-18 1,347.000 434 5.104 5.931
1993 T Goring Jun 23-27 2,774.453 995 0.045 1.806 218.020
TS Rubing Aug 16-19 98.347 1.007 3.274
Monang Dec 3-6
1994 DTD Gading Jun 21-24 0.385 16.000
KT Katring Oct 18-21 1,433.180 213 0.273 3.956 210.109
1995 TS Mameng Sep 27 - Oct 1 3,172.725 1,297 23.074 325.788
T Rosing Oct 31 - Nov 3 10,828.772 1,727 0.066 0.033 890.637
1996 T Gloring Jul 21-27 2,120.254 723 3.417 187.120
T Huaning Jul 27- 31 18.000 18 0.692 31.552
1997 T Bining May 26-28 104.843 80 0.020 1.309 0.500
Huling July 30-Aug 7
T Ibiang Aug 21-28 476.534 173 0.023 20.226 3.000
1998 T Emang Sept 16-17 3,795.400 544 13.689 38.220
1999 T. Helming Jul 21-26 24.000 21 3.000
2000 Biring May 18-22 50.085 16 0.040 0.01
Edeng Jul 3-8 1,112.573 469 0.001 13.649 8.000 0.240 1.581 0.13
TS Maring Sept 2-7
Reming Oct 26-Nov 1 3,944.436 963 0.119 9.557 76.781 0.085 0.148 0.08
Seniang Nov 1-5 733.195 315 0.034 0.040 0.148 0.05
2001 TY Feria July 2-5 3,586.000 1,854 0.383 46.055 42.020 19.000 8.480 0.247 1.88
TY Nanang Nov 6-10 3,246.000 1,668 0.014 14.277 26.500 10.308 0.200 0.06
2002TY Florita, Gloria, Inday
& TS Hambalos
June 28-July 3
July 7-9 & July 12-14521.890 177 0.001 28.899 0.500 5.280 0.215
TD Milenyo Aug 11-14 172.000 88 0.001 1.096 0.13
TY Chedeng May 25-29 538.046 291 0.084 9.113 13.140 3.280 0.02
TY Onyok Aug 30-Sept 2 0.688
Special Fund
released for
Dead Victims
Calamity
Fund
Releases(Million PhP)
Infrastructure Private
By
Govenment,
NGO,LGU
Assitance ExtendedValue of Damages
NDCC Assistance (Mil. Php)
2003
(Million Php)
Total
Source :
- Office of Civil Defense, National Disaster Coordination Council, Department of National Defence (OCD-NDCC-DND)
- Dep. of Sosial Welfare and Development (DSWD)
- Directorate for Special Operation - Public Safety Office, MMDA
- "Database of Water-Related Projects in the Republic of the Philippines", Mr. Kagawa, JICA Expert
Note : T= Tyhoon, TS= Tropical Storm, TD= Tropical Depression
H- 30
These intangible benefits of flood reduction mentioned above represent the adverse social
effects of flood and inundation. Although their substantiality, quantification of these intangible
benefits are difficult in the absence of detailed surveys which should be carried out over a long
period, as such it would be more likely intuitive in so doing. With this in view, and coupled
with the preceding analyses undertaken by other international development assistance agencies,
no attempt was made to include these items as tangible benefit (or should not be included) to
avoid double counting same benefit as separate elements.
Physical damages to human bodies
Regarding physical damages to human bodies, there are some research papers report
water-borne diseases caused by mal-maintained drainage system and revealing relationships
between water-borne diseases and typhoon and flood in Philippines.
(Example 1)
“TYPHOID FEVER IN MAHARLIKA VILLAGE, TAGUIG, METRO MANILA : A
WATERBORNE DISEASE OUTBREAK”, Internal Report, Revelyn U. Rayray and et al.,
March 1990 reports the outbreak of typhoid fever in Maharlika village Taguig, Metropolitan
Manila caused by contaminated water supply. The epidemic was caused by a clogged sewer
overflowing to a water main as the cause of contamination. Based on the survey, 93 suspected
cases were identified with onset of illness from November to first week of December 1988.
There was one mortality.
The village is supplied by a village water system. Water was pumped from two deep wells,
stored in two elevated tanks and supplied to the different households twice a day. By review of
the water and the sewer systems in the village, a broken sewer was found. The sewer
overflowed with sewage material into a nearby water main contaminating the water supply at
that point. Geographically, those blocks around the clogged sewer which were most likely
served by the contaminated water main. In laboratory test, Salmonella typhi was isolated in 14
rectal swab samples of 63 cases.
The sudden and sustained increase in the number of typhoid cases points to a common source
disease outbreak. Common source type of vehicle transmission is usually caused by ingestion
of either contaminated food or drink. The explosive increase favors a waterborne outbreak.
Interview with some of the cases in the village revealed no common source of food. The only
identifiable common exposure was the water supply from November to December 1988 in
Maharlika Village. Epidemiologic, environmental and laboratory data also pointed to a
waterborne transmission. The isolation of Salmonella typhi from 17 % of the cases confirmed
the diagnosis in this outbreak.
(Example 2)
“MANAGEMENT OF DIARRHEA BY THE CONTROL OF DIARREHEAL DISEASE
PROGRAM DURING A CHOLERA OUTBREAK”, Journal of the Philippine Medical
Association, Ilya P. Abellanosa and et al., October 1992 reports the rapid increase of diseases
immediately after the typhoon Ruping of November 1990.
The Typhoon Ruping hit the Philippines on November 13, 1990. According to the data of
H - 31
Southern Islands Medical Center (SIMC), 740 persons met the case definition in 1990 compared
to 322 in 1989. The majority of patients were below 5 years old and the cases were in a more
advanced stage of dehydration in 1990. Stool cultures were done in 331 cases in 1990, 96
cases (29%) of which grew Vibrio Cholera. In 1989, stool cultures were done on only two
suspected cholera cases, and both were negative for V. Cholera. Unless quickly treated,
Cholera can result in severe and rapidly progressive dehydration and death in a matter of hours.
0
50
100
150
200
250
Nov.13-17 Nov.18-24 Nov.25-Dec.1 Dec.2-8 Dec.9-13
1989(N=322)
1990(N=740)
Typhoon Ruping
attacked
Source: SIMC(Southern Islands Medical Center),
Management of Diarrhea by the Control of Diarreheal Disease Program during a Cholera
Outbreak”, Journal of the Philippine Medical Association, Ilya P. Abellanosa and et al.
October 1992
Figure H.1.13 Diarrhea Cases, Nov 13-Dec.13, 1989 & 1990
Benefit of Land Use Development
In accordance with benefit of land use development, this benefit is characterized as the value
added opportunity cost of scarce resources, or change of productivity of the land derived from
the flood-free environment. Metropolitan Manila plays an important role in the economy of
the Philippines, and land shortage is one of the major constraints of development. It is
considered that converting the flood/inundation-prone area into a flood-free area will accelerate
utilization of the land. The benefit of land enhancement (including change of land use) is
measured in terms of the increase of the land value. HDM (hednic method) approach is one of
the methods of quantification of land enhancement benefit based on the land capitalization
hypothesis. This theory states that all benefits of investment resolve itself into the land, and
growth of land value is regarded as benefit of the investment.6
To determine the impact of the project onto the land value requires a detailed survey on the area
and structure of the economic environment surrounding the project. In accordance with a past
spot survey in Metropolitan Manila conducted by a consultant team with the assistance of a
realtor, the impact onto flood prone area resulted in a 20 to 30% decrease in price than higher
ground on the same street.7
Meanwhile, for low and sunken areas, city assessor’s offices in core area of Metropolitan
Manila define a reduction within 30% from the base value of land assessment for taxation of
real property tax.8 Taking these conditions into account, it is considered reasonable that about
20 to 30% of land value is regarded as land enhancement benefit from being flood-free.
However, as mentioned above, this land enhancement benefit is excluded from the total annual
average benefit for this economic analysis.
H- 32
H.1.3 COST OF THE M/P PROJECT
(1) Basic Conditions for Economic Analysis
Economic cost differs from financial cost in the sense of value judgment since the former is
nominal figures that duly reflect the true economic value of goods and services involved (or also
called “opportunity cost”) and the latter is resource value at market prices. All the costs
involved in every project have to be measured as economic costs, although this economic cost is
used only for the economic evaluation of the project which requires the evaluation from the
viewpoint of the national (in some cases, regional) economy. The measurement of economic
cost of a commodity depends on how likely it is to be procured – whether by increasing import,
decreasing export, expanding domestic production or diverting.
Prior to economic evaluation of the projects, all (financial) costs need to be expressed in terms
of economic cost by using conceivable adjustment, i.e.,
Financial Cost x Conversion Factors = Economic Cost
(Actual cost in market value)
“Sunk Costs” are defined as all those cost incurred on the projects prior to the preparation of the
economic analysis. Since these expenses have already been incurred, they are no longer
subject to investment decision making. As such, sunk cost should not be included in the
analysis.9
(2) Conversion Factor and Elements for Real Economic Value
The elements of the adjustment are as follows.
Conversion Factor 1 : Transfer Payments
Transfer items such as taxes and duties imposed on construction materials and equipment,
including government subsidy and contractor’s profit, are to be excluded from the elements of
financial cost. Because tax payment is just the change of money in ownership, the change
does not produce any added value to national economy. These taxes are transferred to the
government which acts on behalf of the society as a whole and are not treated as costs.
Conversely, a government subsidy is an expenditure of resources that the economy incurs to
operate the project. The parameter of DPWH Guideline is adopted in this analysis:10
Economic Cost = 86% of Financial cost
Where the cost for land acquisition is also converted at same rate, in this analysis, it is assumed
that the necessary lands for right-of-way and resettlement site would be acquired from private
sector.
Conversion Factor 2 : Foreign Exchange Shadow Price Rate
(or Shadow Exchange Rate, SER)
Since the central bank foreign exchange guiding rate is not reflective of the actual exchange rate
due to balance of payments disequilibrium and the projection structure, in this analysis, 1.2
times of the official rate is adopted for Foreign Currency Portion. This rate is based on NEDA
guideline.11
Economic Cost = 120% of Financial cost
H - 33
Based on these assumptions and conversion factors, financial costs for civil works were
converted to economic costs. Land acquisition cost, social cost such as resettlement cost,
supporting cost, and non-structural measures’ cost are converted only by factor 1 of transfer
payments because major items of these costs are domestic costs.
(3) Operations and Maintenance (O/M) Costs
Being subject to the guidance from and discussions with the engineering experts of agencies
concerned and the Study Team, annual operation cost is assumed to be 110% of current
expenditure of MMDA for 2005 – 2020 to hold the status quo. After project period (year
2020), these cost are excluded from this economic analysis, because these costs are necessary
under both “with” and “without” project situation. After 2020, only the maintenance cost for
additional civil works proposed in the Master Plan is considered for 2005 - 2040 in economic
analysis.
And also, the project costs for supporting measures are excluded from this economic analysis.
Though the costs were identified in the previous chapter, it was excluded from economic
analysis because there was not enough information to quantify the effect and benefit derived
from the supporting measures.
As a result of adjustment, economic cost for Master Plan is calculated as follows.
Table H.1.28 Project Cost (Master Plan)
Unit : Php million
Item Financial Cost Economic Cost
1. Civil Work 9,703.8 9,430.2
2. VAT 970.4 0.0
3. Resettlement and Compensation Cost 1,590.1 1,367.5
4. Government Administration Cost 291.1 250.3
5. Engineering Services 970.4 942.9
6. Physical Contingency 1,352.6 1,282.6
7. Supporting Measure Cost 488.9 0.0
8. Operation Cost (2005-2020) 0.0 3,316.2
9. Maintenance Cost (2005-2040) 0.0 1,269.4
Total 15,367.3 17,859.1
Source: The Study Team
Note : Costs for Supporting Measures are excluded. Details may not add up to totals due to rounding.
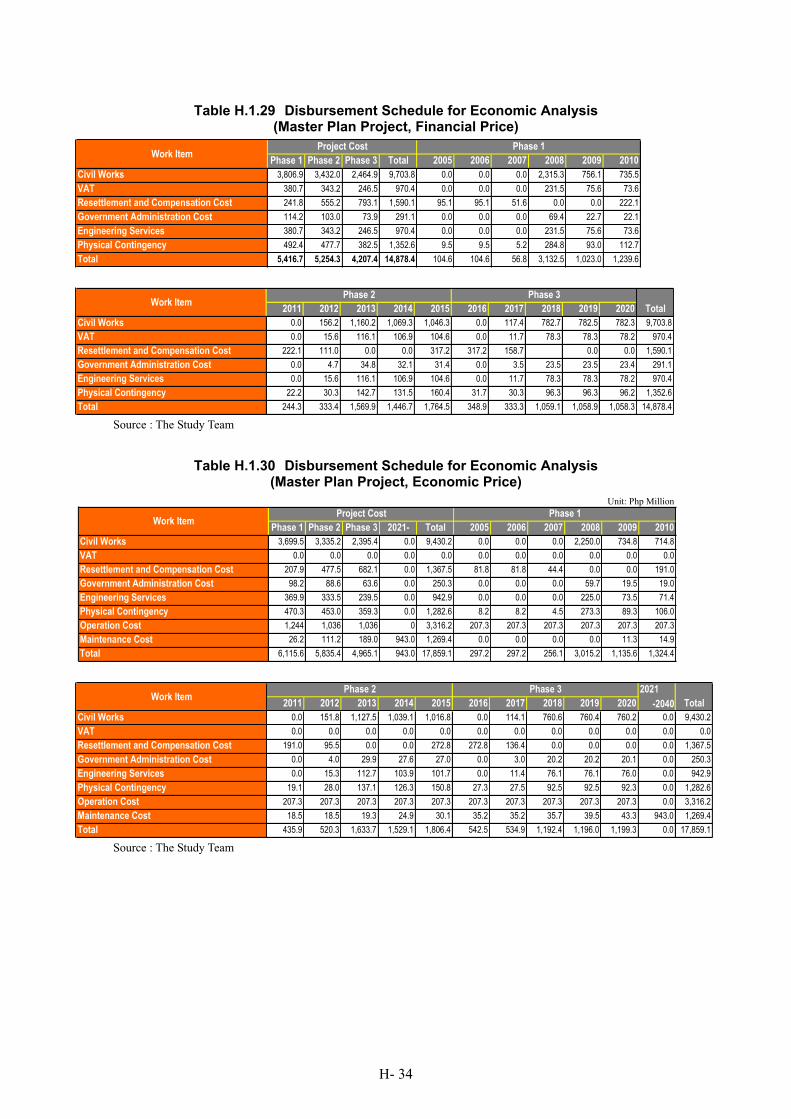
H- 34
Table H.1.29 Disbursement Schedule for Economic Analysis (Master Plan Project, Financial Price)
Phase 1 Phase 2 Phase 3 Total 2005 2006 2007 2008 2009 2010
Civil Works 3,806.9 3,432.0 2,464.9 9,703.8 0.0 0.0 0.0 2,315.3 756.1 735.5
VAT 380.7 343.2 246.5 970.4 0.0 0.0 0.0 231.5 75.6 73.6
Resettlement and Compensation Cost 241.8 555.2 793.1 1,590.1 95.1 95.1 51.6 0.0 0.0 222.1
Government Administration Cost 114.2 103.0 73.9 291.1 0.0 0.0 0.0 69.4 22.7 22.1
Engineering Services 380.7 343.2 246.5 970.4 0.0 0.0 0.0 231.5 75.6 73.6
Physical Contingency 492.4 477.7 382.5 1,352.6 9.5 9.5 5.2 284.8 93.0 112.7
Total 5,416.7 5,254.3 4,207.4 14,878.4 104.6 104.6 56.8 3,132.5 1,023.0 1,239.6
Project CostWork Item
Phase 1
2011 2012 2013 2014 2015 2016 2017 2018 2019 2020
Civil Works 0.0 156.2 1,160.2 1,069.3 1,046.3 0.0 117.4 782.7 782.5 782.3 9,703.8
VAT 0.0 15.6 116.1 106.9 104.6 0.0 11.7 78.3 78.3 78.2 970.4
Resettlement and Compensation Cost 222.1 111.0 0.0 0.0 317.2 317.2 158.7 0.0 0.0 1,590.1
Government Administration Cost 0.0 4.7 34.8 32.1 31.4 0.0 3.5 23.5 23.5 23.4 291.1
Engineering Services 0.0 15.6 116.1 106.9 104.6 0.0 11.7 78.3 78.3 78.2 970.4
Physical Contingency 22.2 30.3 142.7 131.5 160.4 31.7 30.3 96.3 96.3 96.2 1,352.6
Total 244.3 333.4 1,569.9 1,446.7 1,764.5 348.9 333.3 1,059.1 1,058.9 1,058.3 14,878.4
TotalWork Item
Phase 2 Phase 3
Source : The Study Team
Table H.1.30 Disbursement Schedule for Economic Analysis (Master Plan Project, Economic Price)
Unit: Php Million
Phase 1 Phase 2 Phase 3 2021- Total 2005 2006 2007 2008 2009 2010
Civil Works 3,699.5 3,335.2 2,395.4 0.0 9,430.2 0.0 0.0 0.0 2,250.0 734.8 714.8
VAT 0.0 0.0 0.0 0.0 0.0 0.0 0.0 0.0 0.0 0.0 0.0
Resettlement and Compensation Cost 207.9 477.5 682.1 0.0 1,367.5 81.8 81.8 44.4 0.0 0.0 191.0
Government Administration Cost 98.2 88.6 63.6 0.0 250.3 0.0 0.0 0.0 59.7 19.5 19.0
Engineering Services 369.9 333.5 239.5 0.0 942.9 0.0 0.0 0.0 225.0 73.5 71.4
Physical Contingency 470.3 453.0 359.3 0.0 1,282.6 8.2 8.2 4.5 273.3 89.3 106.0
Operation Cost 1,244 1,036 1,036 0 3,316.2 207.3 207.3 207.3 207.3 207.3 207.3
Maintenance Cost 26.2 111.2 189.0 943.0 1,269.4 0.0 0.0 0.0 0.0 11.3 14.9
Total 6,115.6 5,835.4 4,965.1 943.0 17,859.1 297.2 297.2 256.1 3,015.2 1,135.6 1,324.4
Phase 1Work Item
Project Cost
2021
2011 2012 2013 2014 2015 2016 2017 2018 2019 2020 -2040
Civil Works 0.0 151.8 1,127.5 1,039.1 1,016.8 0.0 114.1 760.6 760.4 760.2 0.0 9,430.2
VAT 0.0 0.0 0.0 0.0 0.0 0.0 0.0 0.0 0.0 0.0 0.0 0.0
Resettlement and Compensation Cost 191.0 95.5 0.0 0.0 272.8 272.8 136.4 0.0 0.0 0.0 0.0 1,367.5
Government Administration Cost 0.0 4.0 29.9 27.6 27.0 0.0 3.0 20.2 20.2 20.1 0.0 250.3
Engineering Services 0.0 15.3 112.7 103.9 101.7 0.0 11.4 76.1 76.1 76.0 0.0 942.9
Physical Contingency 19.1 28.0 137.1 126.3 150.8 27.3 27.5 92.5 92.5 92.3 0.0 1,282.6
Operation Cost 207.3 207.3 207.3 207.3 207.3 207.3 207.3 207.3 207.3 207.3 0.0 3,316.2
Maintenance Cost 18.5 18.5 19.3 24.9 30.1 35.2 35.2 35.7 39.5 43.3 943.0 1,269.4
Total 435.9 520.3 1,633.7 1,529.1 1,806.4 542.5 534.9 1,192.4 1,196.0 1,199.3 0.0 17,859.1
Phase 2 Phase 3
TotalWork Item
Source : The Study Team
H - 35
H.1.4 ECONOMIC EVALUATION
(1) Economic Viability
The master plan was evaluated from the economic viewpoint by figuring out the economic
viability, comparing the economic benefit and the economic cost in terms of economic internal
rate of return (EIRR), benefit and cost ratio (B/C), and net present value (NPV = B – C, or
Benefit minus Cost).
All the monetary calculations were based on the following parameters either predetermined or
using assumptions.
Project Duration
Project Start-up : 2005
Project Life Span (Economic Life) :
30 years12 after completion of the work in Short-Term
Project Phase : The first phase starts in 2005 and continues to 2010.
The second phase works are facilitated from 2011 to 2015.
The third phase works are facilitated from 2016 to 2020.
Then, beyond 2020, operation and maintenance works continue to
2040
Timing of Accruing Benefits
25% of annual average benefit will appear after the first phase,
50% of annual average benefit will appear after the second phase,
The matured annual average benefit will appear after the third phase, i.e., completion of all
phases of civil works.
Price Level
The valuation of project costs and benefit should be in constant price at the current year’s
level. Though, cost of civil works was identified as the price at July 2004 (see Chapter G
of Supporting Report), the basic price level in the economic analysis is set at the beginning
of 2004 in order to keep consistency among all cost items.
Social Discount Rate (SDR)
Based on the guideline of NEDA13 for basic infrastructure projects, SDR is applied at 15%
in this analysis.14
Prevailing Exchange Rate
Php 55 per US$ and JPY 110 per US$ at the official rate in market
Depreciation, Financial Charges, Interest and Amortization
In general, financing of the project is not relevant to the economic evaluation. These
financial items are independent of the economic value of the project. To ensure that only
feasible projects are financed, investments should be subjected to cost-benefit analysis
removed from financing considerations. Only after a project is determined feasible
should terms of financing be incorporated to evaluate possible benefits derived from
relative, favorable (e.g., concessional) loan terms. 15 From these points of view,
depreciation (residual value) of waterways and pumping stations, and financial cost or
charges are not estimated in this analysis.
The calculations of NPV, B/C(Benefit and Cost Ratio), and EIRR were based on the annual cash
flow that was prepared from the above-mentioned economic cost and the annual average benefit
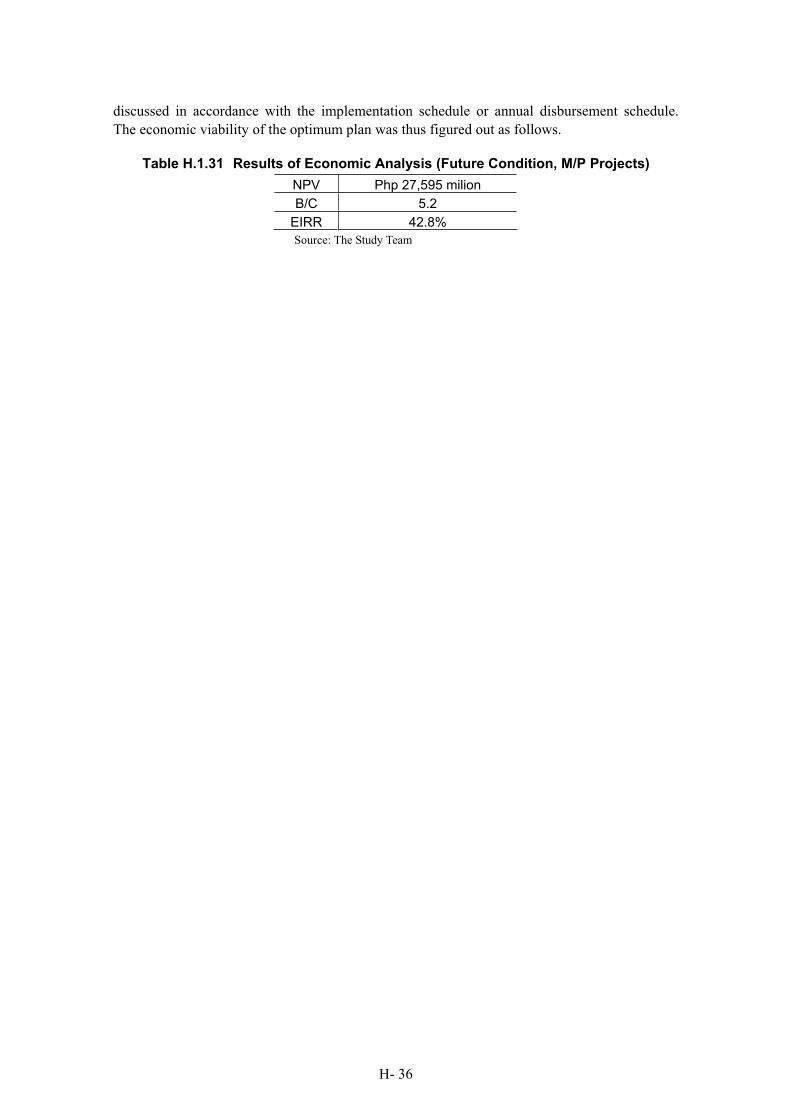
H- 36
discussed in accordance with the implementation schedule or annual disbursement schedule.
The economic viability of the optimum plan was thus figured out as follows.
Table H.1.31 Results of Economic Analysis (Future Condition, M/P Projects)
NPV Php 27,595 milion
B/C 5.2
EIRR 42.8%
Source: The Study Team
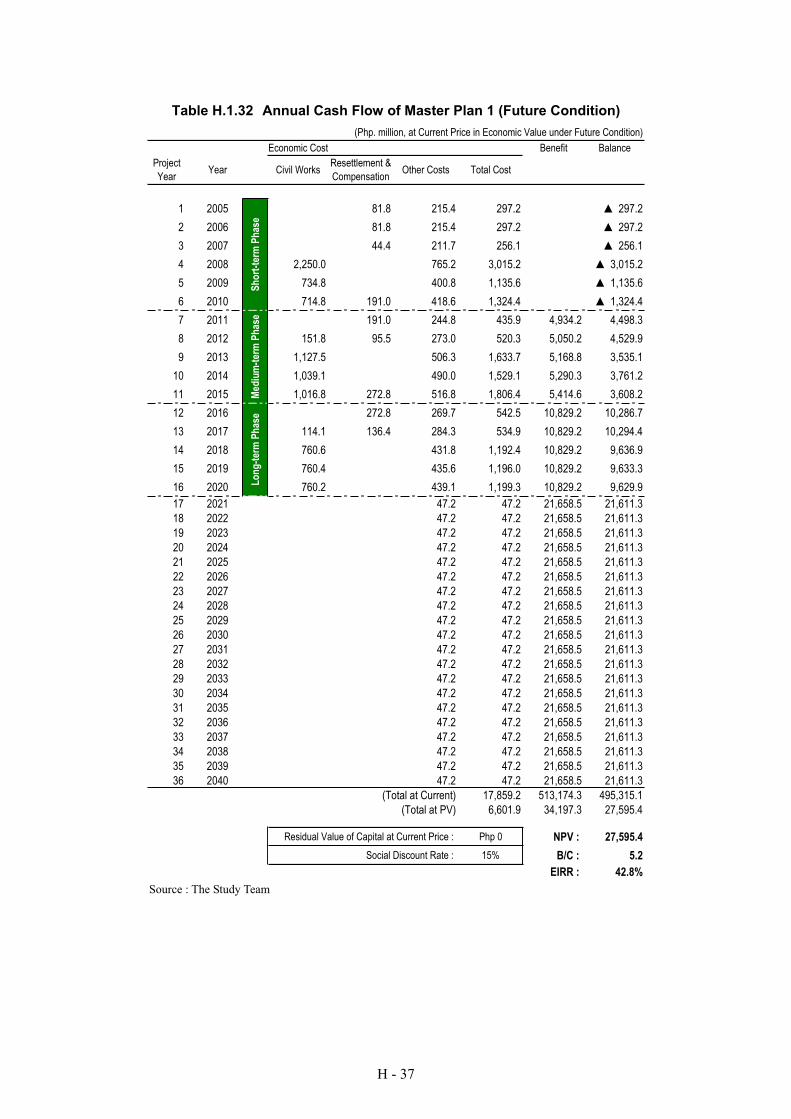
H - 37
Table H.1.32 Annual Cash Flow of Master Plan 1 (Future Condition)
(Php. million, at Current Price in Economic Value under Future Condition)
Economic Cost Benefit Balance
Project
YearYear Civil Works
Resettlement &
CompensationOther Costs Total Cost
1 2005 81.8 215.4 297.2 297.2
2 2006 81.8 215.4 297.2 297.2
3 2007 44.4 211.7 256.1 256.1
4 2008 2,250.0 765.2 3,015.2 3,015.2
5 2009 734.8 400.8 1,135.6 1,135.6
6 2010 714.8 191.0 418.6 1,324.4 1,324.4
7 2011 191.0 244.8 435.9 4,934.2 4,498.3
8 2012 151.8 95.5 273.0 520.3 5,050.2 4,529.9
9 2013 1,127.5 506.3 1,633.7 5,168.8 3,535.1
10 2014 1,039.1 490.0 1,529.1 5,290.3 3,761.2
11 2015 1,016.8 272.8 516.8 1,806.4 5,414.6 3,608.2
12 2016 272.8 269.7 542.5 10,829.2 10,286.7
13 2017 114.1 136.4 284.3 534.9 10,829.2 10,294.4
14 2018 760.6 431.8 1,192.4 10,829.2 9,636.9
15 2019 760.4 435.6 1,196.0 10,829.2 9,633.3
16 2020 760.2 439.1 1,199.3 10,829.2 9,629.9
17 2021 47.2 47.2 21,658.5 21,611.3
18 2022 47.2 47.2 21,658.5 21,611.3
19 2023 47.2 47.2 21,658.5 21,611.3
20 2024 47.2 47.2 21,658.5 21,611.3
21 2025 47.2 47.2 21,658.5 21,611.3
22 2026 47.2 47.2 21,658.5 21,611.3
23 2027 47.2 47.2 21,658.5 21,611.3
24 2028 47.2 47.2 21,658.5 21,611.3
25 2029 47.2 47.2 21,658.5 21,611.3
26 2030 47.2 47.2 21,658.5 21,611.3
27 2031 47.2 47.2 21,658.5 21,611.3
28 2032 47.2 47.2 21,658.5 21,611.3
29 2033 47.2 47.2 21,658.5 21,611.3
30 2034 47.2 47.2 21,658.5 21,611.3
31 2035 47.2 47.2 21,658.5 21,611.3
32 2036 47.2 47.2 21,658.5 21,611.3
33 2037 47.2 47.2 21,658.5 21,611.3
34 2038 47.2 47.2 21,658.5 21,611.3
35 2039 47.2 47.2 21,658.5 21,611.3
36 2040 47.2 47.2 21,658.5 21,611.3
(Total at Current) 17,859.2 513,174.3 495,315.1
(Total at PV) 6,601.9 34,197.3 27,595.4
Residual Value of Capital at Current Price : Php 0 NPV : 27,595.4
Social Discount Rate : 15% B/C : 5.2
EIRR : 42.8%
Sh
ort
-ter
m P
has
eM
ediu
m-t
erm
Ph
ase
Lo
ng
-ter
m P
has
e
Source : The Study Team
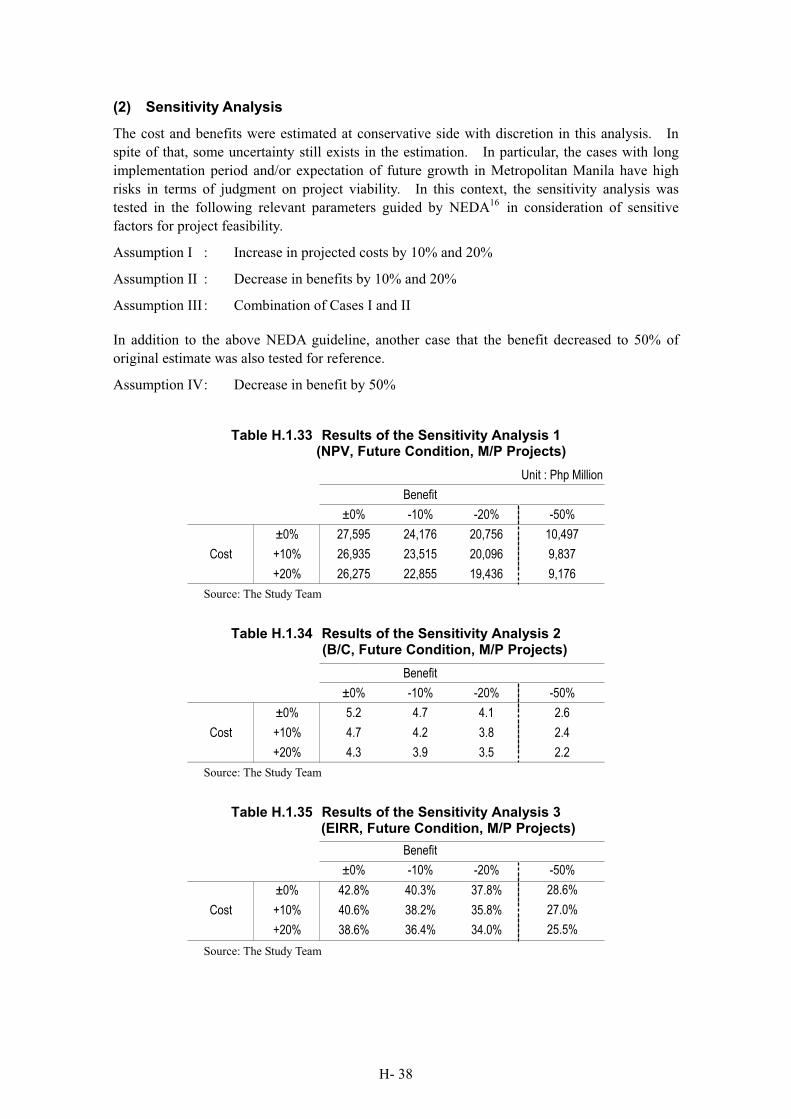
H- 38
(2) Sensitivity Analysis
The cost and benefits were estimated at conservative side with discretion in this analysis. In
spite of that, some uncertainty still exists in the estimation. In particular, the cases with long
implementation period and/or expectation of future growth in Metropolitan Manila have high
risks in terms of judgment on project viability. In this context, the sensitivity analysis was
tested in the following relevant parameters guided by NEDA16 in consideration of sensitive
factors for project feasibility.
Assumption I : Increase in projected costs by 10% and 20%
Assumption II : Decrease in benefits by 10% and 20%
Assumption III : Combination of Cases I and II
In addition to the above NEDA guideline, another case that the benefit decreased to 50% of
original estimate was also tested for reference.
Assumption IV : Decrease in benefit by 50%
Table H.1.33 Results of the Sensitivity Analysis 1 (NPV, Future Condition, M/P Projects)
Unit : Php Million
Benefit
±0% -10% -20% -50%
±0% 27,595 24,176 20,756 10,497
Cost +10% 26,935 23,515 20,096 9,837
+20% 26,275 22,855 19,436 9,176
Source: The Study Team
Table H.1.34 Results of the Sensitivity Analysis 2 (B/C, Future Condition, M/P Projects)
Benefit
±0% -10% -20% -50%
±0% 5.2 4.7 4.1 2.6
Cost +10% 4.7 4.2 3.8 2.4
+20% 4.3 3.9 3.5 2.2
Source: The Study Team
Table H.1.35 Results of the Sensitivity Analysis 3 (EIRR, Future Condition, M/P Projects)
Benefit
±0% -10% -20% -50%
±0% 42.8% 40.3% 37.8% 28.6%
Cost +10% 40.6% 38.2% 35.8% 27.0%
+20% 38.6% 36.4% 34.0% 25.5%
Source: The Study Team
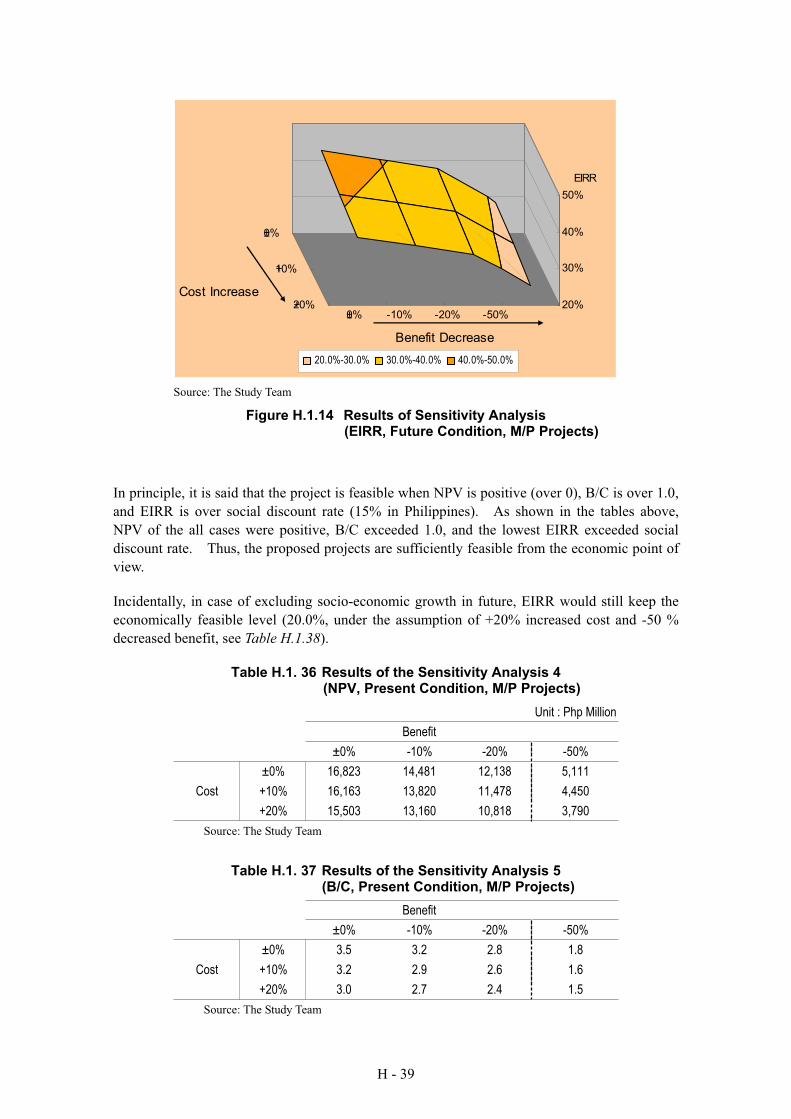
H - 39
20%
30%
40%
50%
EIRR
±0% -10% -20% -50%
±0%
+10%
+20%
Benefit Decrease
Cost Increase
20.0%-30.0% 30.0%-40.0% 40.0%-50.0%
Source: The Study Team
Figure H.1.14 Results of Sensitivity Analysis (EIRR, Future Condition, M/P Projects)
In principle, it is said that the project is feasible when NPV is positive (over 0), B/C is over 1.0,
and EIRR is over social discount rate (15% in Philippines). As shown in the tables above,
NPV of the all cases were positive, B/C exceeded 1.0, and the lowest EIRR exceeded social
discount rate. Thus, the proposed projects are sufficiently feasible from the economic point of
view.
Incidentally, in case of excluding socio-economic growth in future, EIRR would still keep the
economically feasible level (20.0%, under the assumption of +20% increased cost and -50 %
decreased benefit, see Table H.1.38).
Table H.1. 36 Results of the Sensitivity Analysis 4 (NPV, Present Condition, M/P Projects)
Unit : Php Million
Benefit
±0% -10% -20% -50%
±0% 16,823 14,481 12,138 5,111
Cost +10% 16,163 13,820 11,478 4,450
+20% 15,503 13,160 10,818 3,790
Source: The Study Team
Table H.1. 37 Results of the Sensitivity Analysis 5 (B/C, Present Condition, M/P Projects)
Benefit
±0% -10% -20% -50%
±0% 3.5 3.2 2.8 1.8
Cost +10% 3.2 2.9 2.6 1.6
+20% 3.0 2.7 2.4 1.5
Source: The Study Team
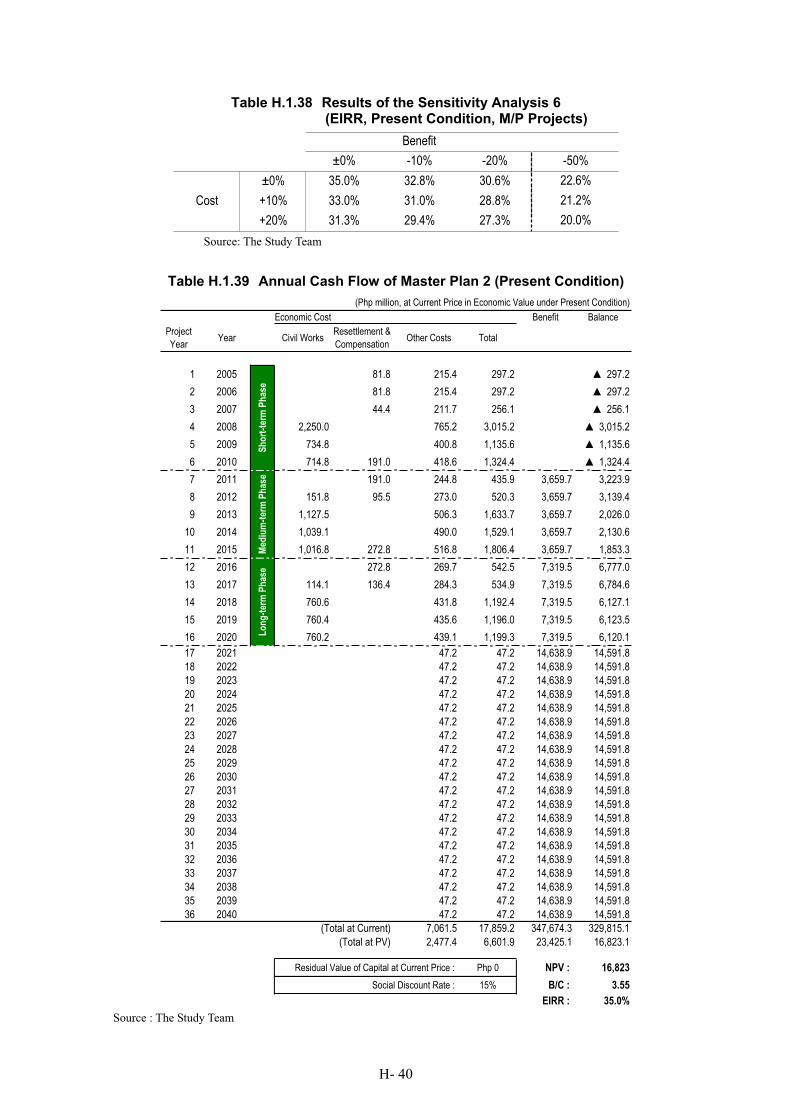
H- 40
Table H.1.38 Results of the Sensitivity Analysis 6 (EIRR, Present Condition, M/P Projects)
Benefit
±0% -10% -20% -50%
±0% 35.0% 32.8% 30.6% 22.6%
Cost +10% 33.0% 31.0% 28.8% 21.2%
+20% 31.3% 29.4% 27.3% 20.0%
Source: The Study Team
Table H.1.39 Annual Cash Flow of Master Plan 2 (Present Condition)
(Php million, at Current Price in Economic Value under Present Condition)
Economic Cost Benefit Balance
Project
YearYear Civil Works
Resettlement &
CompensationOther Costs Total
1 2005 81.8 215.4 297.2 297.2
2 2006 81.8 215.4 297.2 297.2
3 2007 44.4 211.7 256.1 256.1
4 2008 2,250.0 765.2 3,015.2 3,015.2
5 2009 734.8 400.8 1,135.6 1,135.6
6 2010 714.8 191.0 418.6 1,324.4 1,324.4
7 2011 191.0 244.8 435.9 3,659.7 3,223.9
8 2012 151.8 95.5 273.0 520.3 3,659.7 3,139.4
9 2013 1,127.5 506.3 1,633.7 3,659.7 2,026.0
10 2014 1,039.1 490.0 1,529.1 3,659.7 2,130.6
11 2015 1,016.8 272.8 516.8 1,806.4 3,659.7 1,853.3
12 2016 272.8 269.7 542.5 7,319.5 6,777.0
13 2017 114.1 136.4 284.3 534.9 7,319.5 6,784.6
14 2018 760.6 431.8 1,192.4 7,319.5 6,127.1
15 2019 760.4 435.6 1,196.0 7,319.5 6,123.5
16 2020 760.2 439.1 1,199.3 7,319.5 6,120.1
17 2021 47.2 47.2 14,638.9 14,591.8
18 2022 47.2 47.2 14,638.9 14,591.8
19 2023 47.2 47.2 14,638.9 14,591.8
20 2024 47.2 47.2 14,638.9 14,591.8
21 2025 47.2 47.2 14,638.9 14,591.8
22 2026 47.2 47.2 14,638.9 14,591.8
23 2027 47.2 47.2 14,638.9 14,591.8
24 2028 47.2 47.2 14,638.9 14,591.8
25 2029 47.2 47.2 14,638.9 14,591.8
26 2030 47.2 47.2 14,638.9 14,591.8
27 2031 47.2 47.2 14,638.9 14,591.8
28 2032 47.2 47.2 14,638.9 14,591.8
29 2033 47.2 47.2 14,638.9 14,591.8
30 2034 47.2 47.2 14,638.9 14,591.8
31 2035 47.2 47.2 14,638.9 14,591.8
32 2036 47.2 47.2 14,638.9 14,591.8
33 2037 47.2 47.2 14,638.9 14,591.8
34 2038 47.2 47.2 14,638.9 14,591.8
35 2039 47.2 47.2 14,638.9 14,591.8
36 2040 47.2 47.2 14,638.9 14,591.8
(Total at Current) 7,061.5 17,859.2 347,674.3 329,815.1
(Total at PV) 2,477.4 6,601.9 23,425.1 16,823.1
Residual Value of Capital at Current Price : Php 0 NPV : 16,823
Social Discount Rate : 15% B/C : 3.55
EIRR : 35.0%
Sh
ort
-ter
m P
has
eM
ediu
m-t
erm
Ph
ase
Lo
ng
-ter
m P
has
e
Source : The Study Team
H - 41
(3) Project Justification
Though social infrastructure projects such as flood control and drainage improvement works are
in general put into implementation even at the lower EIRR, compared with other productive
projects, the master plan shows a very high viability of 42.8% in EIRR (Future Condition),
likewise resulting in high values of B/C and NPV for the conceivable reason that
socio-economic needs for flood prevention in the study area where the central function of the
political and economic activity locates will augment to a maximum degree.
The reason of high viability is easy to see. As mentioned already in the beginning of this
report, there are totally 74 km esteros/creeks in length, 35 km drainage mains, and other small
drainage network in Metropolitan Manila. In addition, there are high quality pumping stations
started in service in 1970s and have been maintained functionally. However, the construction
cost of these tremendous investments are not considered in this economic analysis, because
these costs shall be excluded as “sunk cost” in conventional economic analysis on public
infrastructure project. In other words, taking advantage of these infrastructure heritages, it is
possible to output the most effective result with minimum additional investment for these kinds
of infrastructure.
In this context, the Master Plan can be justified from the economic viewpoint to take a next step
in accordance with the proposed schedule.
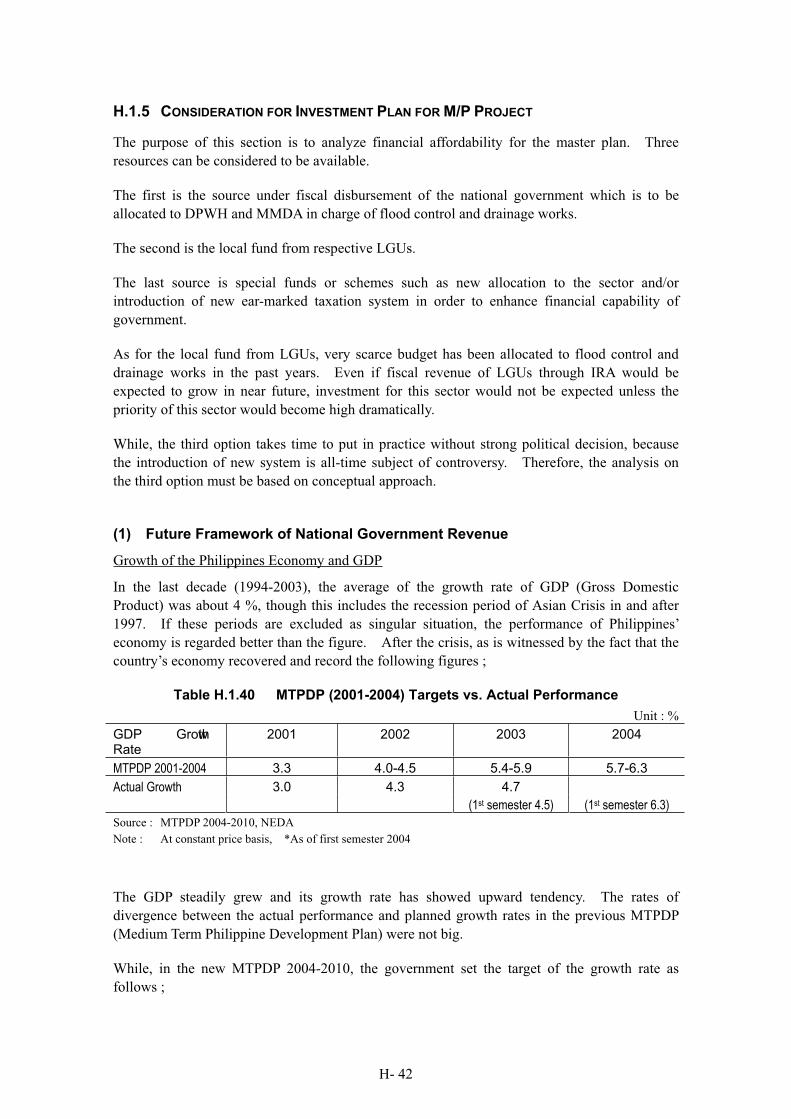
H- 42
H.1.5 CONSIDERATION FOR INVESTMENT PLAN FOR M/P PROJECT
The purpose of this section is to analyze financial affordability for the master plan. Three
resources can be considered to be available.
The first is the source under fiscal disbursement of the national government which is to be
allocated to DPWH and MMDA in charge of flood control and drainage works.
The second is the local fund from respective LGUs.
The last source is special funds or schemes such as new allocation to the sector and/or
introduction of new ear-marked taxation system in order to enhance financial capability of
government.
As for the local fund from LGUs, very scarce budget has been allocated to flood control and
drainage works in the past years. Even if fiscal revenue of LGUs through IRA would be
expected to grow in near future, investment for this sector would not be expected unless the
priority of this sector would become high dramatically.
While, the third option takes time to put in practice without strong political decision, because
the introduction of new system is all-time subject of controversy. Therefore, the analysis on
the third option must be based on conceptual approach.
(1) Future Framework of National Government Revenue
Growth of the Philippines Economy and GDP
In the last decade (1994-2003), the average of the growth rate of GDP (Gross Domestic
Product) was about 4 %, though this includes the recession period of Asian Crisis in and after
1997. If these periods are excluded as singular situation, the performance of Philippines’
economy is regarded better than the figure. After the crisis, as is witnessed by the fact that the
country’s economy recovered and record the following figures ;
Table H.1.40 MTPDP (2001-2004) Targets vs. Actual Performance
Unit : %
GDP Growth Rate
2001 2002 2003 2004
MTPDP 2001-2004 3.3 4.0-4.5 5.4-5.9 5.7-6.3
Actual Growth 3.0 4.3 4.7
(1st semester 4.5) (1st semester 6.3)
Source : MTPDP 2004-2010, NEDA
Note : At constant price basis, *As of first semester 2004
The GDP steadily grew and its growth rate has showed upward tendency. The rates of
divergence between the actual performance and planned growth rates in the previous MTPDP
(Medium Term Philippine Development Plan) were not big.
While, in the new MTPDP 2004-2010, the government set the target of the growth rate as
follows ;
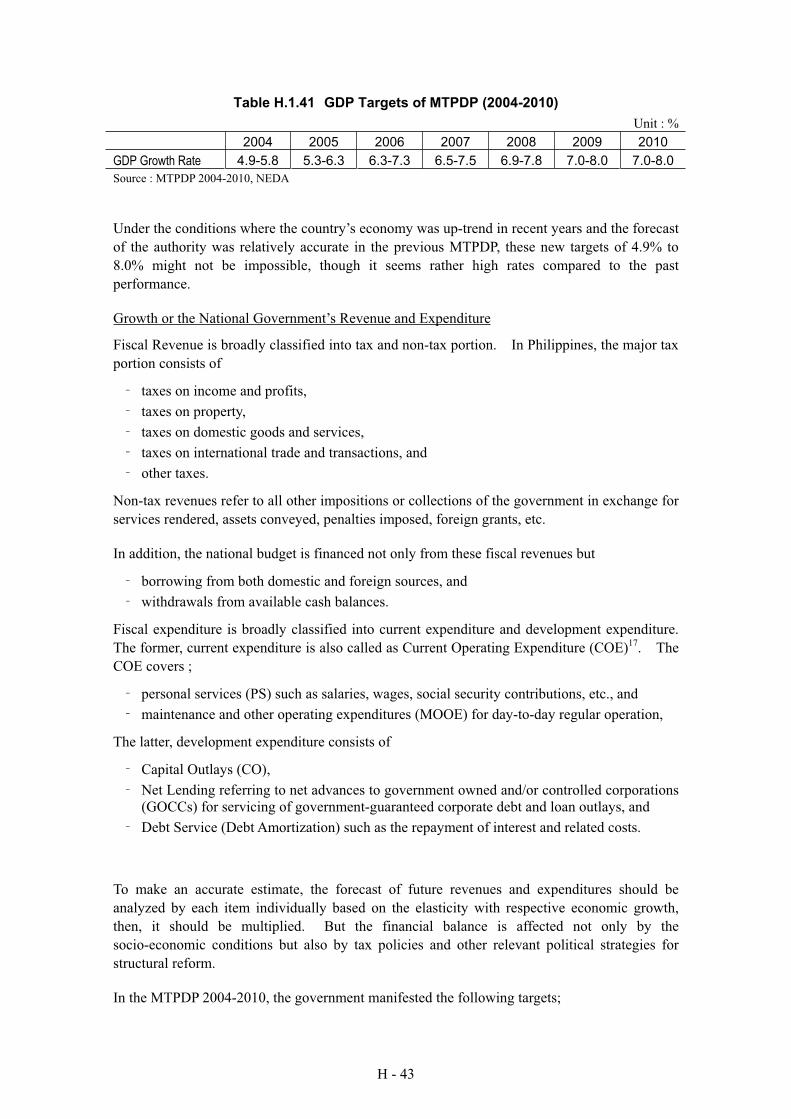
H - 43
Table H.1.41 GDP Targets of MTPDP (2004-2010)
Unit : %
2004 2005 2006 2007 2008 2009 2010
GDP Growth Rate 4.9-5.8 5.3-6.3 6.3-7.3 6.5-7.5 6.9-7.8 7.0-8.0 7.0-8.0
Source : MTPDP 2004-2010, NEDA
Under the conditions where the country’s economy was up-trend in recent years and the forecast
of the authority was relatively accurate in the previous MTPDP, these new targets of 4.9% to
8.0% might not be impossible, though it seems rather high rates compared to the past
performance.
Growth or the National Government’s Revenue and Expenditure
Fiscal Revenue is broadly classified into tax and non-tax portion. In Philippines, the major tax
portion consists of
taxes on income and profits,
taxes on property,
taxes on domestic goods and services,
taxes on international trade and transactions, and
other taxes.
Non-tax revenues refer to all other impositions or collections of the government in exchange for
services rendered, assets conveyed, penalties imposed, foreign grants, etc.
In addition, the national budget is financed not only from these fiscal revenues but
borrowing from both domestic and foreign sources, and
withdrawals from available cash balances.
Fiscal expenditure is broadly classified into current expenditure and development expenditure.
The former, current expenditure is also called as Current Operating Expenditure (COE)17. The
COE covers ;
personal services (PS) such as salaries, wages, social security contributions, etc., and
maintenance and other operating expenditures (MOOE) for day-to-day regular operation,
The latter, development expenditure consists of
Capital Outlays (CO),
Net Lending referring to net advances to government owned and/or controlled corporations
(GOCCs) for servicing of government-guaranteed corporate debt and loan outlays, and
Debt Service (Debt Amortization) such as the repayment of interest and related costs.
To make an accurate estimate, the forecast of future revenues and expenditures should be
analyzed by each item individually based on the elasticity with respective economic growth,
then, it should be multiplied. But the financial balance is affected not only by the
socio-economic conditions but also by tax policies and other relevant political strategies for
structural reform.
In the MTPDP 2004-2010, the government manifested the following targets;
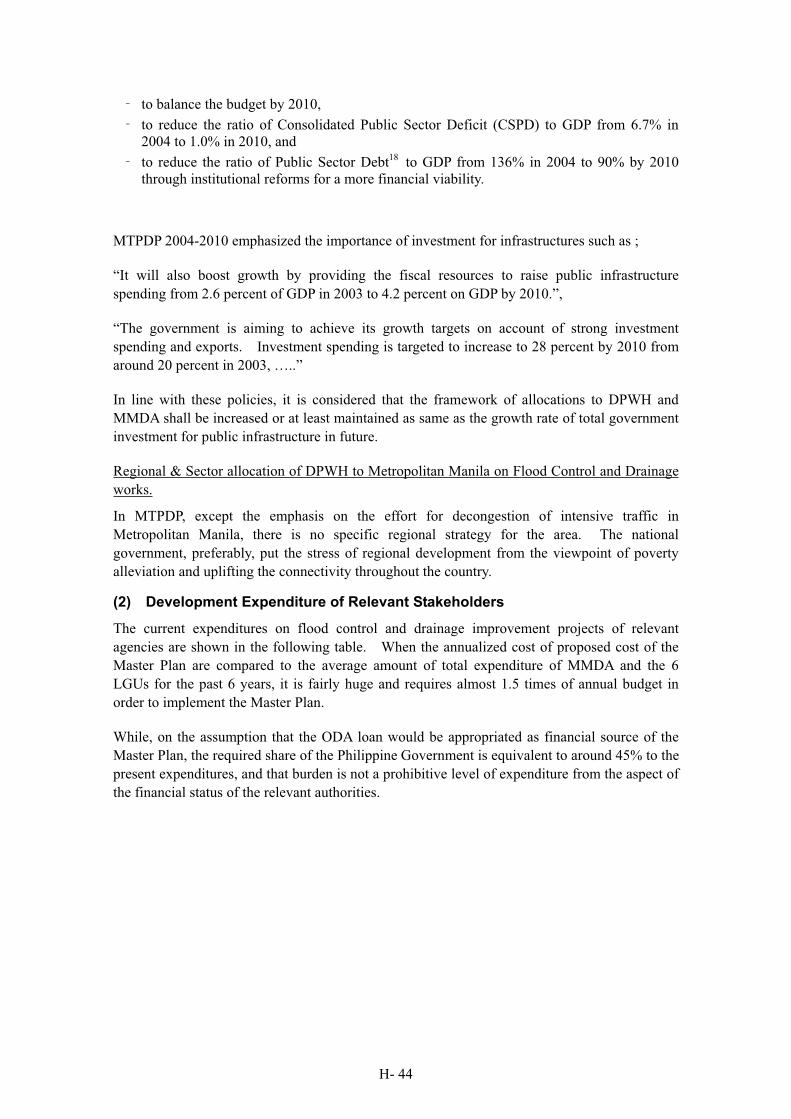
H- 44
to balance the budget by 2010,
to reduce the ratio of Consolidated Public Sector Deficit (CSPD) to GDP from 6.7% in
2004 to 1.0% in 2010, and
to reduce the ratio of Public Sector Debt18 to GDP from 136% in 2004 to 90% by 2010
through institutional reforms for a more financial viability.
MTPDP 2004-2010 emphasized the importance of investment for infrastructures such as ;
“It will also boost growth by providing the fiscal resources to raise public infrastructure
spending from 2.6 percent of GDP in 2003 to 4.2 percent on GDP by 2010.”,
“The government is aiming to achieve its growth targets on account of strong investment
spending and exports. Investment spending is targeted to increase to 28 percent by 2010 from
around 20 percent in 2003, …..”
In line with these policies, it is considered that the framework of allocations to DPWH and
MMDA shall be increased or at least maintained as same as the growth rate of total government
investment for public infrastructure in future.
Regional & Sector allocation of DPWH to Metropolitan Manila on Flood Control and Drainage
works.
In MTPDP, except the emphasis on the effort for decongestion of intensive traffic in
Metropolitan Manila, there is no specific regional strategy for the area. The national
government, preferably, put the stress of regional development from the viewpoint of poverty
alleviation and uplifting the connectivity throughout the country.
(2) Development Expenditure of Relevant Stakeholders
The current expenditures on flood control and drainage improvement projects of relevant
agencies are shown in the following table. When the annualized cost of proposed cost of the
Master Plan are compared to the average amount of total expenditure of MMDA and the 6
LGUs for the past 6 years, it is fairly huge and requires almost 1.5 times of annual budget in
order to implement the Master Plan.
While, on the assumption that the ODA loan would be appropriated as financial source of the
Master Plan, the required share of the Philippine Government is equivalent to around 45% to the
present expenditures, and that burden is not a prohibitive level of expenditure from the aspect of
the financial status of the relevant authorities.
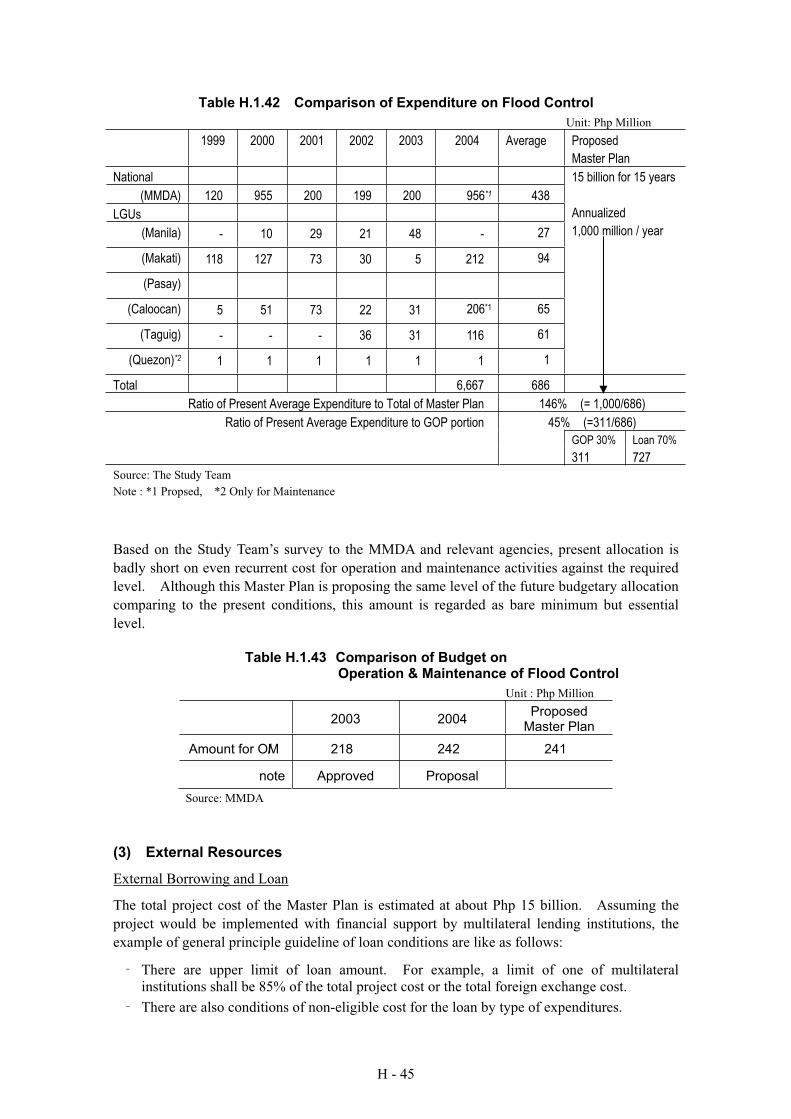
H - 45
Table H.1.42 Comparison of Expenditure on Flood Control
Unit: Php Million
1999 2000 2001 2002 2003 2004 Average Proposed
Master Plan
National
(MMDA) 120 955 200 199 200 956*1 438
LGUs
(Manila) - 10 29 21 48 - 27
(Makati) 118 127 73 30 5 212 94
(Pasay)
(Caloocan) 5 51 73 22 31 206*1 65
(Taguig) - - - 36 31 116 61
(Quezon)*2 1 1 1 1 1 1 1
15 billion for 15 years
Annualized
1,000 million / year
Total 6,667 686
Ratio of Present Average Expenditure to Total of Master Plan 146% (= 1,000/686)
Ratio of Present Average Expenditure to GOP portion 45% (=311/686)
GOP 30% Loan 70%
311 727
Source: The Study Team
Note : *1 Propsed, *2 Only for Maintenance
Based on the Study Team’s survey to the MMDA and relevant agencies, present allocation is
badly short on even recurrent cost for operation and maintenance activities against the required
level. Although this Master Plan is proposing the same level of the future budgetary allocation
comparing to the present conditions, this amount is regarded as bare minimum but essential
level.
Table H.1.43 Comparison of Budget on Operation & Maintenance of Flood Control
Unit : Php Million
2003 2004 Proposed
Master Plan
Amount for O/M 218 242 241
note Approved Proposal
Source: MMDA
(3) External Resources
External Borrowing and Loan
The total project cost of the Master Plan is estimated at about Php 15 billion. Assuming the
project would be implemented with financial support by multilateral lending institutions, the
example of general principle guideline of loan conditions are like as follows:
There are upper limit of loan amount. For example, a limit of one of multilateral
institutions shall be 85% of the total project cost or the total foreign exchange cost.
There are also conditions of non-eligible cost for the loan by type of expenditures.
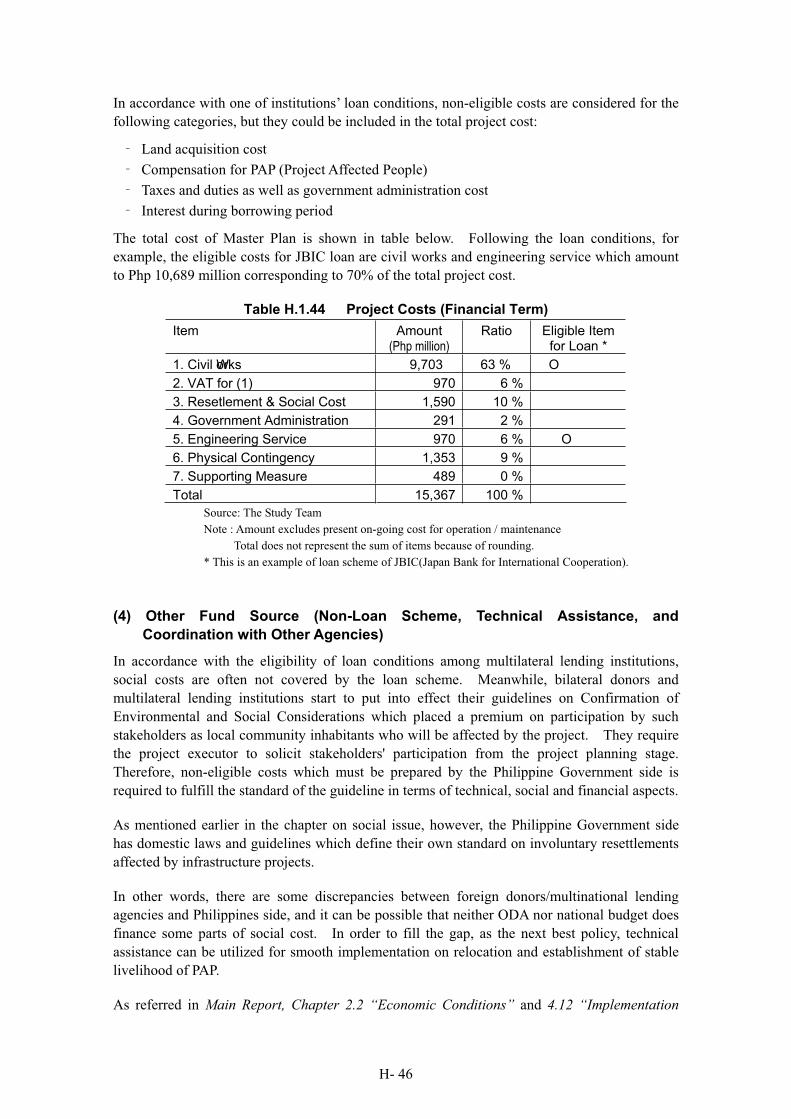
H- 46
In accordance with one of institutions’ loan conditions, non-eligible costs are considered for the
following categories, but they could be included in the total project cost:
Land acquisition cost
Compensation for PAP (Project Affected People)
Taxes and duties as well as government administration cost
Interest during borrowing period
The total cost of Master Plan is shown in table below. Following the loan conditions, for
example, the eligible costs for JBIC loan are civil works and engineering service which amount
to Php 10,689 million corresponding to 70% of the total project cost.
Table H.1.44 Project Costs (Financial Term)
Item Amount (Php million)
Ratio Eligible Item for Loan *
1. Civil Works 9,703 63 % O
2. VAT for (1) 970 6 %
3. Resetlement & Social Cost 1,590 10 %
4. Government Administration 291 2 %
5. Engineering Service 970 6 % O
6. Physical Contingency 1,353 9 %
7. Supporting Measure 489 0 %
Total 15,367 100 %
Source: The Study Team
Note : Amount excludes present on-going cost for operation / maintenance
Total does not represent the sum of items because of rounding.
* This is an example of loan scheme of JBIC(Japan Bank for International Cooperation).
(4) Other Fund Source (Non-Loan Scheme, Technical Assistance, and
Coordination with Other Agencies)
In accordance with the eligibility of loan conditions among multilateral lending institutions,
social costs are often not covered by the loan scheme. Meanwhile, bilateral donors and
multilateral lending institutions start to put into effect their guidelines on Confirmation of
Environmental and Social Considerations which placed a premium on participation by such
stakeholders as local community inhabitants who will be affected by the project. They require
the project executor to solicit stakeholders' participation from the project planning stage.
Therefore, non-eligible costs which must be prepared by the Philippine Government side is
required to fulfill the standard of the guideline in terms of technical, social and financial aspects.
As mentioned earlier in the chapter on social issue, however, the Philippine Government side
has domestic laws and guidelines which define their own standard on involuntary resettlements
affected by infrastructure projects.
In other words, there are some discrepancies between foreign donors/multinational lending
agencies and Philippines side, and it can be possible that neither ODA nor national budget does
finance some parts of social cost. In order to fill the gap, as the next best policy, technical
assistance can be utilized for smooth implementation on relocation and establishment of stable
livelihood of PAP.
As referred in Main Report, Chapter 2.2 “Economic Conditions” and 4.12 “Implementation
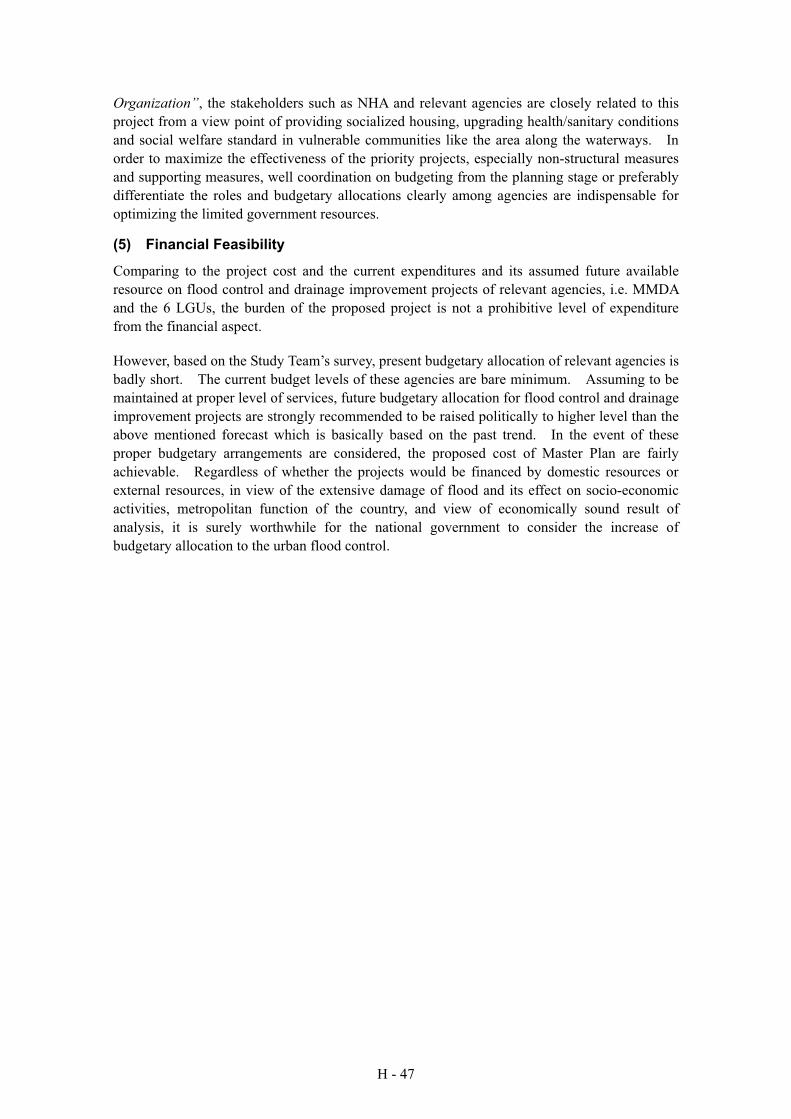
H - 47
Organization”, the stakeholders such as NHA and relevant agencies are closely related to this
project from a view point of providing socialized housing, upgrading health/sanitary conditions
and social welfare standard in vulnerable communities like the area along the waterways. In
order to maximize the effectiveness of the priority projects, especially non-structural measures
and supporting measures, well coordination on budgeting from the planning stage or preferably
differentiate the roles and budgetary allocations clearly among agencies are indispensable for
optimizing the limited government resources.
(5) Financial Feasibility
Comparing to the project cost and the current expenditures and its assumed future available
resource on flood control and drainage improvement projects of relevant agencies, i.e. MMDA
and the 6 LGUs, the burden of the proposed project is not a prohibitive level of expenditure
from the financial aspect.
However, based on the Study Team’s survey, present budgetary allocation of relevant agencies is
badly short. The current budget levels of these agencies are bare minimum. Assuming to be
maintained at proper level of services, future budgetary allocation for flood control and drainage
improvement projects are strongly recommended to be raised politically to higher level than the
above mentioned forecast which is basically based on the past trend. In the event of these
proper budgetary arrangements are considered, the proposed cost of Master Plan are fairly
achievable. Regardless of whether the projects would be financed by domestic resources or
external resources, in view of the extensive damage of flood and its effect on socio-economic
activities, metropolitan function of the country, and view of economically sound result of
analysis, it is surely worthwhile for the national government to consider the increase of
budgetary allocation to the urban flood control.
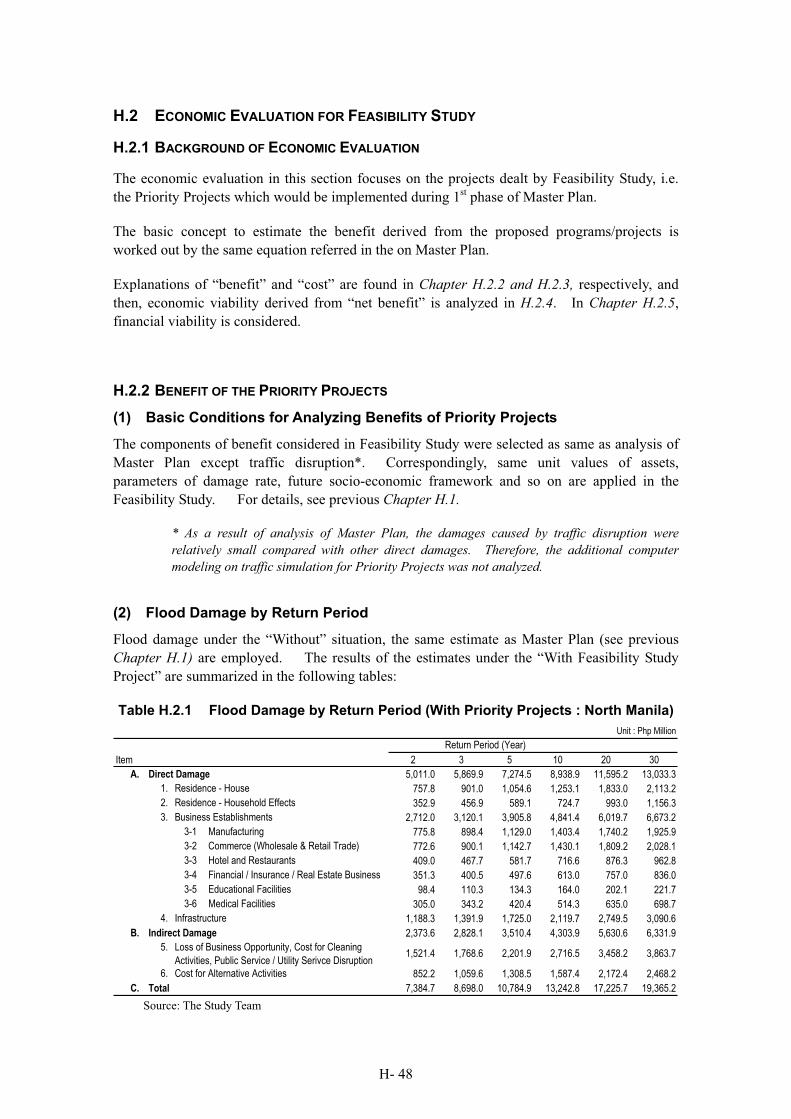
H- 48
H.2 ECONOMIC EVALUATION FOR FEASIBILITY STUDY
H.2.1 BACKGROUND OF ECONOMIC EVALUATION
The economic evaluation in this section focuses on the projects dealt by Feasibility Study, i.e.
the Priority Projects which would be implemented during 1st phase of Master Plan.
The basic concept to estimate the benefit derived from the proposed programs/projects is
worked out by the same equation referred in the on Master Plan.
Explanations of “benefit” and “cost” are found in Chapter H.2.2 and H.2.3, respectively, and
then, economic viability derived from “net benefit” is analyzed in H.2.4. In Chapter H.2.5,
financial viability is considered.
H.2.2 BENEFIT OF THE PRIORITY PROJECTS
(1) Basic Conditions for Analyzing Benefits of Priority Projects
The components of benefit considered in Feasibility Study were selected as same as analysis of
Master Plan except traffic disruption*. Correspondingly, same unit values of assets,
parameters of damage rate, future socio-economic framework and so on are applied in the
Feasibility Study. For details, see previous Chapter H.1.
* As a result of analysis of Master Plan, the damages caused by traffic disruption were
relatively small compared with other direct damages. Therefore, the additional computer
modeling on traffic simulation for Priority Projects was not analyzed.
(2) Flood Damage by Return Period
Flood damage under the “Without” situation, the same estimate as Master Plan (see previous
Chapter H.1) are employed. The results of the estimates under the “With Feasibility Study
Project” are summarized in the following tables:
Table H.2.1 Flood Damage by Return Period (With Priority Projects : North Manila)
Unit : Php Million
Item 2 3 5 10 20 30
A. Direct Damage 5,011.0 5,869.9 7,274.5 8,938.9 11,595.2 13,033.3
1. Residence - House 757.8 901.0 1,054.6 1,253.1 1,833.0 2,113.2
2. Residence - Household Effects 352.9 456.9 589.1 724.7 993.0 1,156.3
3. Business Establishments 2,712.0 3,120.1 3,905.8 4,841.4 6,019.7 6,673.2
3-1 Manufacturing 775.8 898.4 1,129.0 1,403.4 1,740.2 1,925.9
3-2 Commerce (Wholesale & Retail Trade) 772.6 900.1 1,142.7 1,430.1 1,809.2 2,028.1
3-3 Hotel and Restaurants 409.0 467.7 581.7 716.6 876.3 962.8
3-4 Financial / Insurance / Real Estate Business 351.3 400.5 497.6 613.0 757.0 836.0
3-5 Educational Facilities 98.4 110.3 134.3 164.0 202.1 221.7
3-6 Medical Facilities 305.0 343.2 420.4 514.3 635.0 698.7
4. Infrastructure 1,188.3 1,391.9 1,725.0 2,119.7 2,749.5 3,090.6
B. Indirect Damage 2,373.6 2,828.1 3,510.4 4,303.9 5,630.6 6,331.9
5.1,521.4 1,768.6 2,201.9 2,716.5 3,458.2 3,863.7
6. Cost for Alternative Activities 852.2 1,059.6 1,308.5 1,587.4 2,172.4 2,468.2
C. Total 7,384.7 8,698.0 10,784.9 13,242.8 17,225.7 19,365.2
Return Period (Year)
Loss of Business Opportunity, Cost for Cleaning
Activities, Public Service / Utility Serivce Disruption
Source: The Study Team
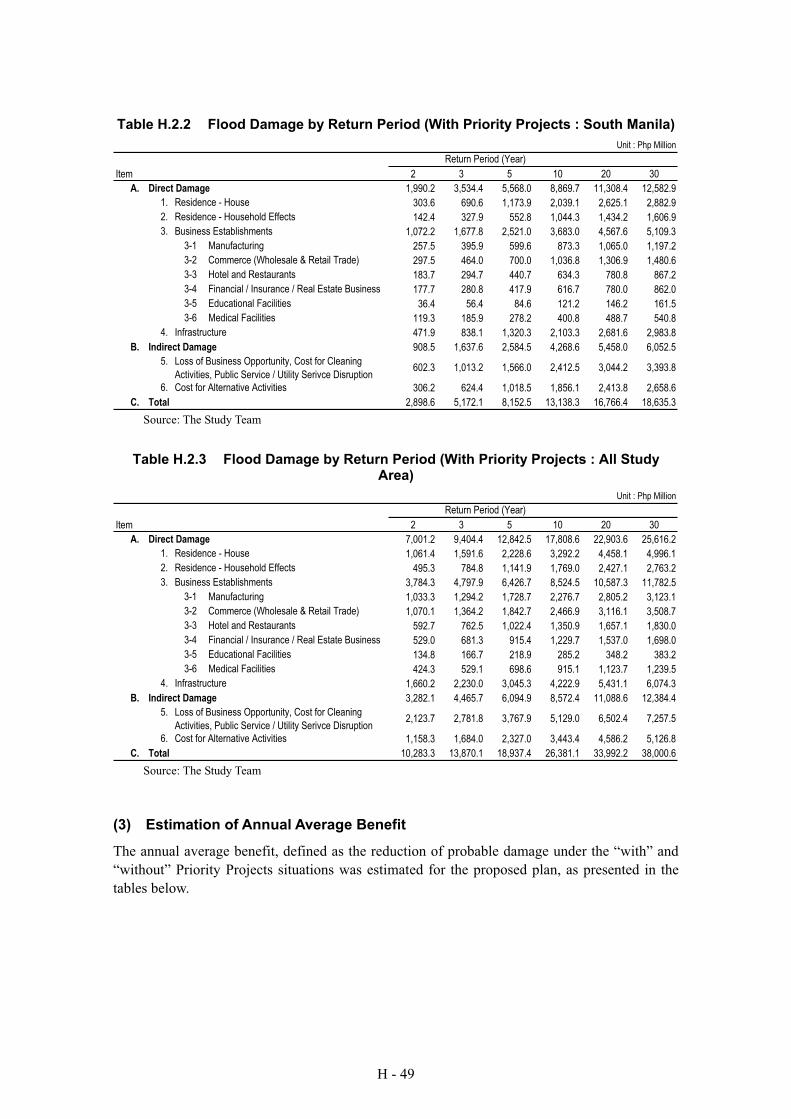
H - 49
Table H.2.2 Flood Damage by Return Period (With Priority Projects : South Manila)
Unit : Php Million
Item 2 3 5 10 20 30
A. Direct Damage 1,990.2 3,534.4 5,568.0 8,869.7 11,308.4 12,582.9
1. Residence - House 303.6 690.6 1,173.9 2,039.1 2,625.1 2,882.9
2. Residence - Household Effects 142.4 327.9 552.8 1,044.3 1,434.2 1,606.9
3. Business Establishments 1,072.2 1,677.8 2,521.0 3,683.0 4,567.6 5,109.3
3-1 Manufacturing 257.5 395.9 599.6 873.3 1,065.0 1,197.2
3-2 Commerce (Wholesale & Retail Trade) 297.5 464.0 700.0 1,036.8 1,306.9 1,480.6
3-3 Hotel and Restaurants 183.7 294.7 440.7 634.3 780.8 867.2
3-4 Financial / Insurance / Real Estate Business 177.7 280.8 417.9 616.7 780.0 862.0
3-5 Educational Facilities 36.4 56.4 84.6 121.2 146.2 161.5
3-6 Medical Facilities 119.3 185.9 278.2 400.8 488.7 540.8
4. Infrastructure 471.9 838.1 1,320.3 2,103.3 2,681.6 2,983.8
B. Indirect Damage 908.5 1,637.6 2,584.5 4,268.6 5,458.0 6,052.5
5.602.3 1,013.2 1,566.0 2,412.5 3,044.2 3,393.8
6. Cost for Alternative Activities 306.2 624.4 1,018.5 1,856.1 2,413.8 2,658.6
C. Total 2,898.6 5,172.1 8,152.5 13,138.3 16,766.4 18,635.3
Return Period (Year)
Loss of Business Opportunity, Cost for Cleaning
Activities, Public Service / Utility Serivce Disruption
Source: The Study Team
Table H.2.3 Flood Damage by Return Period (With Priority Projects : All Study Area)
Unit : Php Million
Item 2 3 5 10 20 30
A. Direct Damage 7,001.2 9,404.4 12,842.5 17,808.6 22,903.6 25,616.2
1. Residence - House 1,061.4 1,591.6 2,228.6 3,292.2 4,458.1 4,996.1
2. Residence - Household Effects 495.3 784.8 1,141.9 1,769.0 2,427.1 2,763.2
3. Business Establishments 3,784.3 4,797.9 6,426.7 8,524.5 10,587.3 11,782.5
3-1 Manufacturing 1,033.3 1,294.2 1,728.7 2,276.7 2,805.2 3,123.1
3-2 Commerce (Wholesale & Retail Trade) 1,070.1 1,364.2 1,842.7 2,466.9 3,116.1 3,508.7
3-3 Hotel and Restaurants 592.7 762.5 1,022.4 1,350.9 1,657.1 1,830.0
3-4 Financial / Insurance / Real Estate Business 529.0 681.3 915.4 1,229.7 1,537.0 1,698.0
3-5 Educational Facilities 134.8 166.7 218.9 285.2 348.2 383.2
3-6 Medical Facilities 424.3 529.1 698.6 915.1 1,123.7 1,239.5
4. Infrastructure 1,660.2 2,230.0 3,045.3 4,222.9 5,431.1 6,074.3
B. Indirect Damage 3,282.1 4,465.7 6,094.9 8,572.4 11,088.6 12,384.4
5.2,123.7 2,781.8 3,767.9 5,129.0 6,502.4 7,257.5
6. Cost for Alternative Activities 1,158.3 1,684.0 2,327.0 3,443.4 4,586.2 5,126.8
C. Total 10,283.3 13,870.1 18,937.4 26,381.1 33,992.2 38,000.6
Return Period (Year)
Loss of Business Opportunity, Cost for Cleaning
Activities, Public Service / Utility Serivce Disruption
Source: The Study Team
(3) Estimation of Annual Average Benefit
The annual average benefit, defined as the reduction of probable damage under the “with” and
“without” Priority Projects situations was estimated for the proposed plan, as presented in the
tables below.
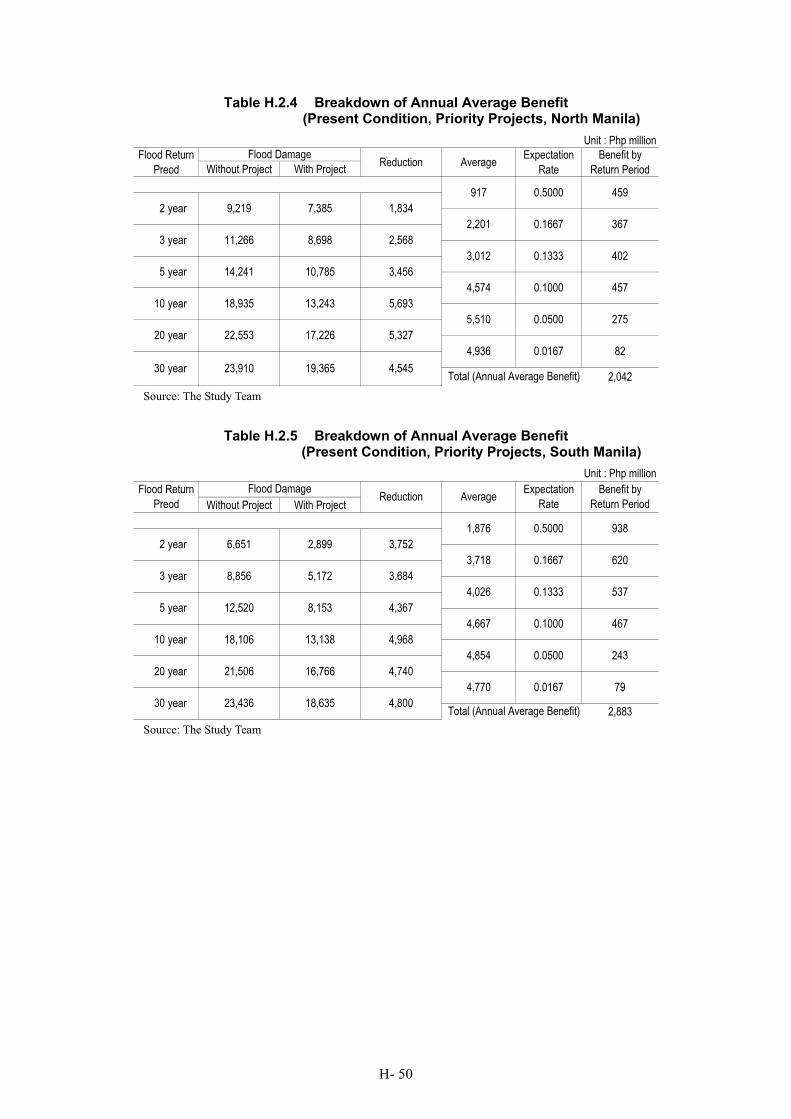
H- 50
Table H.2.4 Breakdown of Annual Average Benefit (Present Condition, Priority Projects, North Manila)
Unit : Php million
Without Project With Project
2,042Total (Annual Average Benefit)30 year 23,910
Flood Return
Preod
Flood DamageReduction Average
Expectation
Rate
Benefit by
Return Period
917 0.5000 459
2 year 9,219 7,385 1,834
2,201 0.1667 367
2,568
3,012 0.1333 402
3,456
4,574
3 year 11,266 8,698
5 year 14,241 10,785
0.1000 457
10 year 18,935 13,243 5,693
5,510 0.0500 275
82
4,545
20 year 22,553 17,226
19,365
5,327
4,936 0.0167
Source: The Study Team
Table H.2.5 Breakdown of Annual Average Benefit (Present Condition, Priority Projects, South Manila)
Unit : Php million
Without Project With Project
2,883Total (Annual Average Benefit)30 year 23,436 18,635
4,740
4,770 0.0167 79
4,800
20 year 21,506 16,766
0.1000 467
10 year 18,106 13,138 4,968
4,854 0.0500 243
5 year 12,520 8,153
3 year 8,856 5,172
3,752
3,718 0.1667 620
3,684
4,026 0.1333 537
4,367
4,667
2 year 6,651 2,899
Expectation
Rate
Benefit by
Return Period
1,876 0.5000 938
Flood Return
Preod
Flood DamageReduction Average
Source: The Study Team
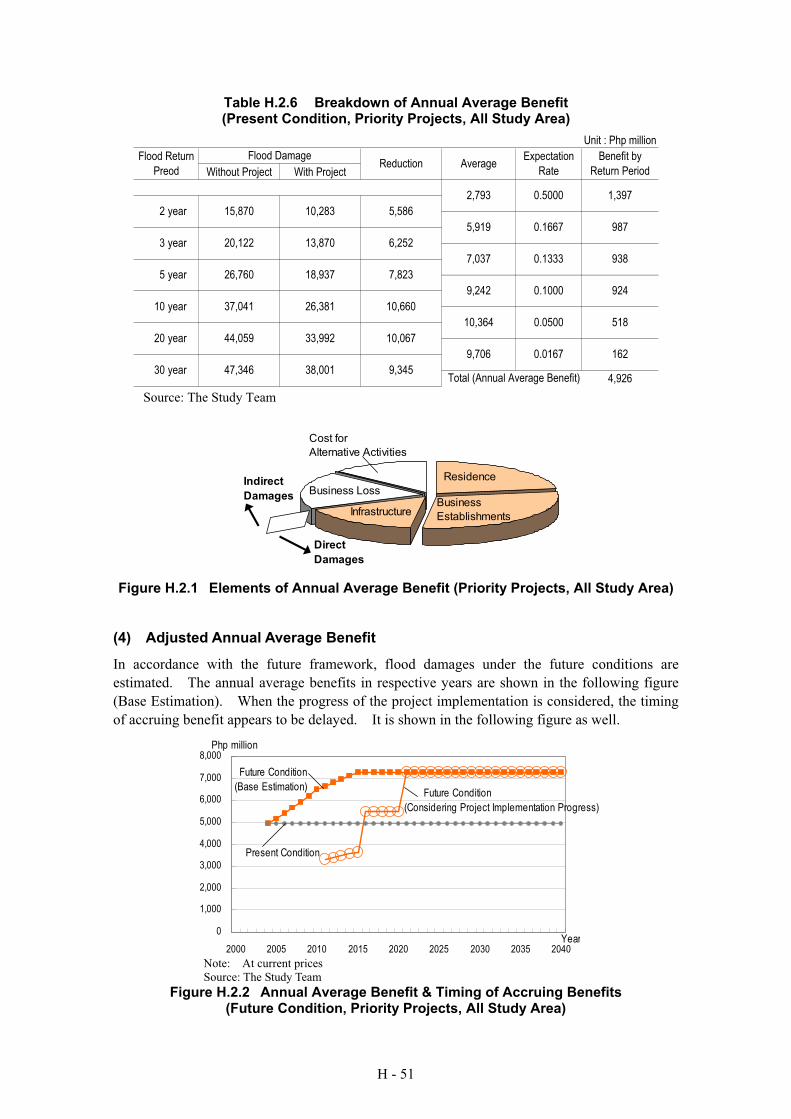
H - 51
Table H.2.6 Breakdown of Annual Average Benefit (Present Condition, Priority Projects, All Study Area)
Unit : Php million
Without Project With Project
4,926Total (Annual Average Benefit)30 year 47,346 38,001
10,067
9,706 0.0167 162
9,345
20 year 44,059 33,992
0.1000 924
10 year 37,041 26,381 10,660
10,364 0.0500 518
5 year 26,760 18,937
3 year 20,122 13,870
5,586
5,919 0.1667 987
6,252
7,037 0.1333 938
7,823
9,242
2 year 15,870 10,283
Expectation
Rate
Benefit by
Return Period
2,793 0.5000 1,397
Flood Return
Preod
Flood DamageReduction Average
Source: The Study Team
Residence
Business
EstablishmentsInfrastructure
Business Loss
Cost for
Alternative Activities
Direct
Damages
Indirect
Damages
Figure H.2.1 Elements of Annual Average Benefit (Priority Projects, All Study Area)
(4) Adjusted Annual Average Benefit
In accordance with the future framework, flood damages under the future conditions are
estimated. The annual average benefits in respective years are shown in the following figure
(Base Estimation). When the progress of the project implementation is considered, the timing
of accruing benefit appears to be delayed. It is shown in the following figure as well.
0
1,000
2,000
3,000
4,000
5,000
6,000
7,000
8,000
2000 2005 2010 2015 2020 2025 2030 2035 2040
Php million
Year
Future Condition
(Base Estimation) Future Condition
(Considering Project Implementation Progress)
Present Condition
Note: At current prices
Source: The Study Team
Figure H.2.2 Annual Average Benefit & Timing of Accruing Benefits (Future Condition, Priority Projects, All Study Area)
H- 52
H.2.3 COST OF THE PRIORITY PROJECTS
(1) Basic Conditions for Analyzing Cost of Priority Projects
All financial costs are converted into economic cost by categorizing foreign currency portion
and local currency portion. In the analysis of Master Plan, only general two types of share
rates of foreign currency portion and local currency portion are used, but in this feasibility study
analysis, every project items were identified each distribution of foreign and local currency
individually.
Regarding to the conversion factor from financial cost to economic cost, in the analysis of
Master Plan, two conversion factors (Transfer payments and Foreign exchange shadow price
rate) were applied, but in this feasibility study analysis, Shadow Wage Rate (SWR) is also
considered in addition to Transfer payments and Foreign exchange shadow price rate because of
the high precision of cost estimates of Priority Projects compared to M/P.
Since most of the labors engaged in a project are from the unskilled urban labor pool, labor cost
is adjusted to reflect the estimated opportunity cost of labor. In this analysis, the adjustment is
applied based on the NEDA guideline as follows.
SWR of Unskilled Labor : 0.6 times of market wage rate
This adjustment is to be applied only to the unskilled labor component. It is regarded that
there is a competitive market of skilled labor, and their wage rate is decided reflecting the
balance of demand and supply. Therefore, the SWR of skilled labor is negligible or defined as
follows.
SWR of Skilled Labor : 1.0 times of market wage rate.
(2) Operations and Maintenance (O/M) Costs
Cost for operation and maintenance are assumed as same condition as Master Plan Analysis (see
Chapter H.1). Operation Cost is included for 2005 – 2010. After project implementation
period (2011-) are excluded from economic analysis except for the additional maintenance cost
to maintain the engineering capacity of the drainage system increased by the additional works
proposed in Priority Projects. Maintenance Cost is considered for 2005 – 2040.
And also, the project costs for supporting measures were excluded from this economic analysis
because of same reason of M/P analysis.
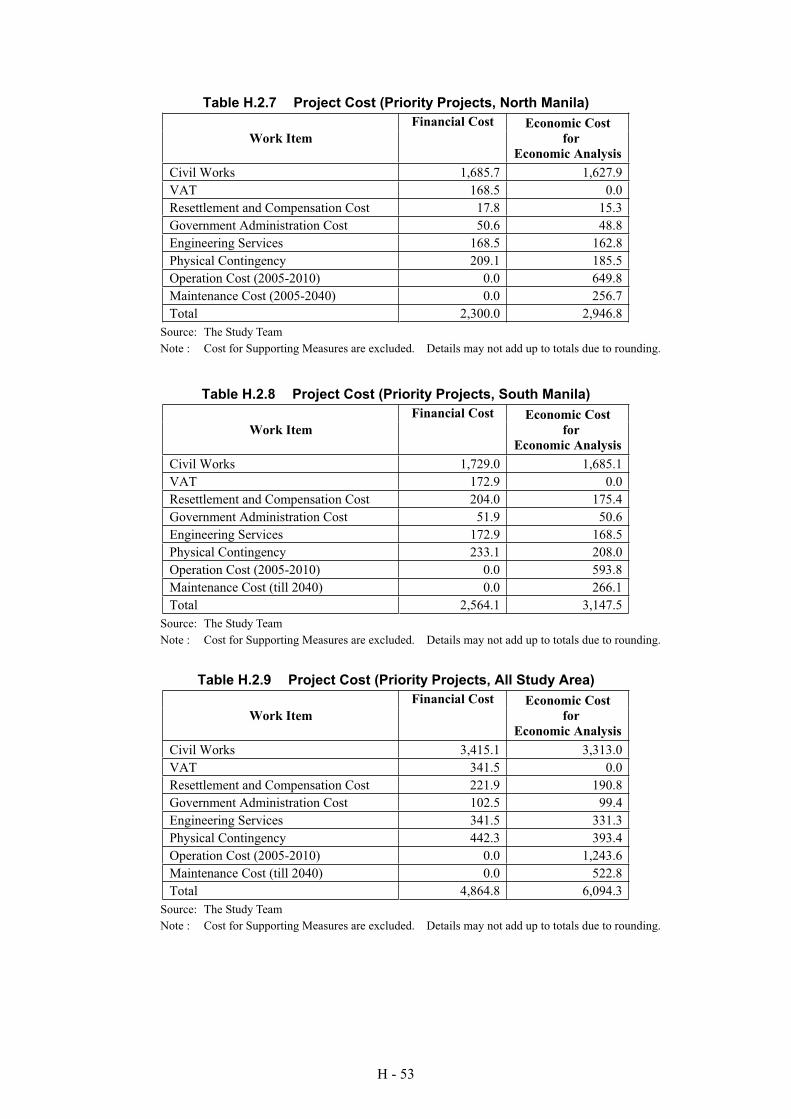
H - 53
Table H.2.7 Project Cost (Priority Projects, North Manila)
Work Item
Financial Cost Economic Cost
for
Economic Analysis
Civil Works 1,685.7 1,627.9
VAT 168.5 0.0
Resettlement and Compensation Cost 17.8 15.3
Government Administration Cost 50.6 48.8
Engineering Services 168.5 162.8
Physical Contingency 209.1 185.5
Operation Cost (2005-2010) 0.0 649.8
Maintenance Cost (2005-2040) 0.0 256.7
Total 2,300.0 2,946.8
Source: The Study Team
Note : Cost for Supporting Measures are excluded. Details may not add up to totals due to rounding.
Table H.2.8 Project Cost (Priority Projects, South Manila)
Work Item
Financial Cost Economic Cost
for
Economic Analysis
Civil Works 1,729.0 1,685.1
VAT 172.9 0.0
Resettlement and Compensation Cost 204.0 175.4
Government Administration Cost 51.9 50.6
Engineering Services 172.9 168.5
Physical Contingency 233.1 208.0
Operation Cost (2005-2010) 0.0 593.8
Maintenance Cost (till 2040) 0.0 266.1
Total 2,564.1 3,147.5
Source: The Study Team
Note : Cost for Supporting Measures are excluded. Details may not add up to totals due to rounding.
Table H.2.9 Project Cost (Priority Projects, All Study Area)
Work Item
Financial Cost Economic Cost
for
Economic Analysis
Civil Works 3,415.1 3,313.0
VAT 341.5 0.0
Resettlement and Compensation Cost 221.9 190.8
Government Administration Cost 102.5 99.4
Engineering Services 341.5 331.3
Physical Contingency 442.3 393.4
Operation Cost (2005-2010) 0.0 1,243.6
Maintenance Cost (till 2040) 0.0 522.8
Total 4,864.8 6,094.3
Source: The Study Team
Note : Cost for Supporting Measures are excluded. Details may not add up to totals due to rounding.
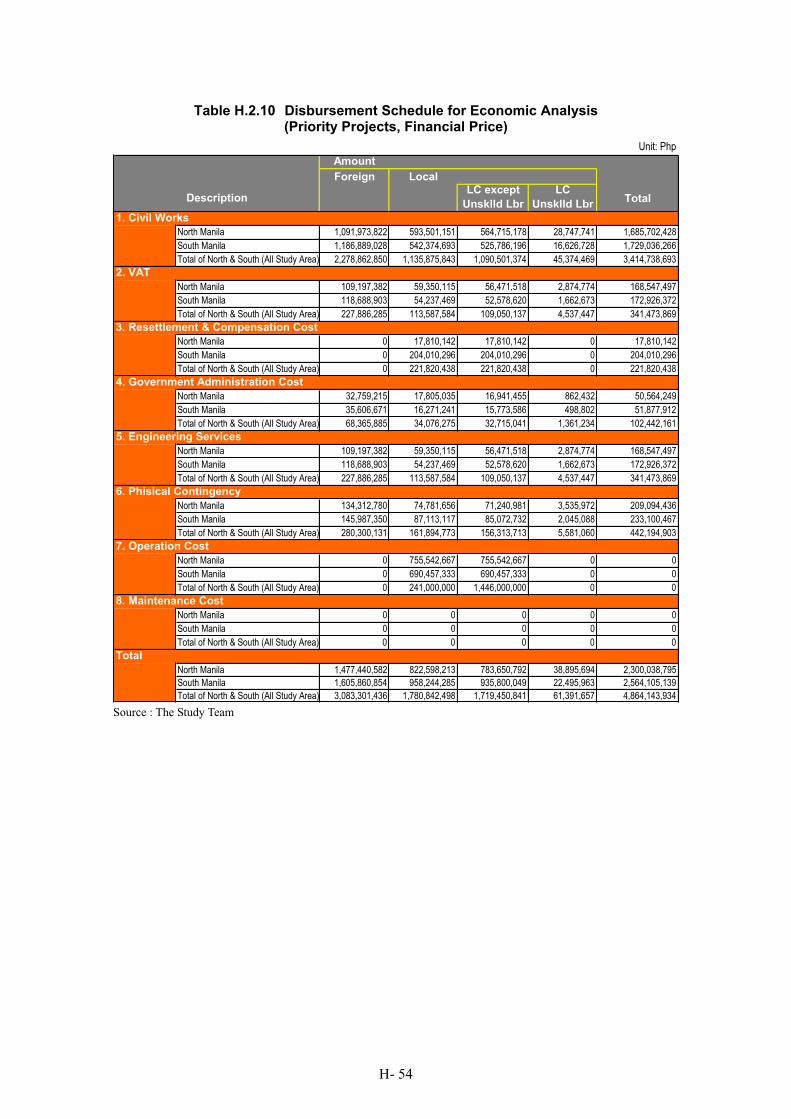
H- 54
Table H.2.10 Disbursement Schedule for Economic Analysis (Priority Projects, Financial Price)
Unit: Php
Amount
Foreign Local
LC except
Unsklld Lbr
LC
Unsklld LbrTotal
1. Civil Works
North Manila 1,091,973,822 593,501,151 564,715,178 28,747,741 1,685,702,428
South Manila 1,186,889,028 542,374,693 525,786,196 16,626,728 1,729,036,266
Total of North & South (All Study Area) 2,278,862,850 1,135,875,843 1,090,501,374 45,374,469 3,414,738,693
2. VAT
North Manila 109,197,382 59,350,115 56,471,518 2,874,774 168,547,497
South Manila 118,688,903 54,237,469 52,578,620 1,662,673 172,926,372
Total of North & South (All Study Area) 227,886,285 113,587,584 109,050,137 4,537,447 341,473,869
3. Resettlement & Compensation Cost
North Manila 0 17,810,142 17,810,142 0 17,810,142
South Manila 0 204,010,296 204,010,296 0 204,010,296
Total of North & South (All Study Area) 0 221,820,438 221,820,438 0 221,820,438
4. Government Administration Cost
North Manila 32,759,215 17,805,035 16,941,455 862,432 50,564,249
South Manila 35,606,671 16,271,241 15,773,586 498,802 51,877,912
Total of North & South (All Study Area) 68,365,885 34,076,275 32,715,041 1,361,234 102,442,161
5. Engineering Services
North Manila 109,197,382 59,350,115 56,471,518 2,874,774 168,547,497
South Manila 118,688,903 54,237,469 52,578,620 1,662,673 172,926,372
Total of North & South (All Study Area) 227,886,285 113,587,584 109,050,137 4,537,447 341,473,869
6. Phisical Contingency
North Manila 134,312,780 74,781,656 71,240,981 3,535,972 209,094,436
South Manila 145,987,350 87,113,117 85,072,732 2,045,088 233,100,467
Total of North & South (All Study Area) 280,300,131 161,894,773 156,313,713 5,581,060 442,194,903
7. Operation Cost
North Manila 0 755,542,667 755,542,667 0 0
South Manila 0 690,457,333 690,457,333 0 0
Total of North & South (All Study Area) 0 241,000,000 1,446,000,000 0 0
8. Maintenance Cost
North Manila 0 0 0 0 0
South Manila 0 0 0 0 0
Total of North & South (All Study Area) 0 0 0 0 0
Total
North Manila 1,477,440,582 822,598,213 783,650,792 38,895,694 2,300,038,795
South Manila 1,605,860,854 958,244,285 935,800,049 22,495,963 2,564,105,139
Total of North & South (All Study Area) 3,083,301,436 1,780,842,498 1,719,450,841 61,391,657 4,864,143,934
Description
Source : The Study Team
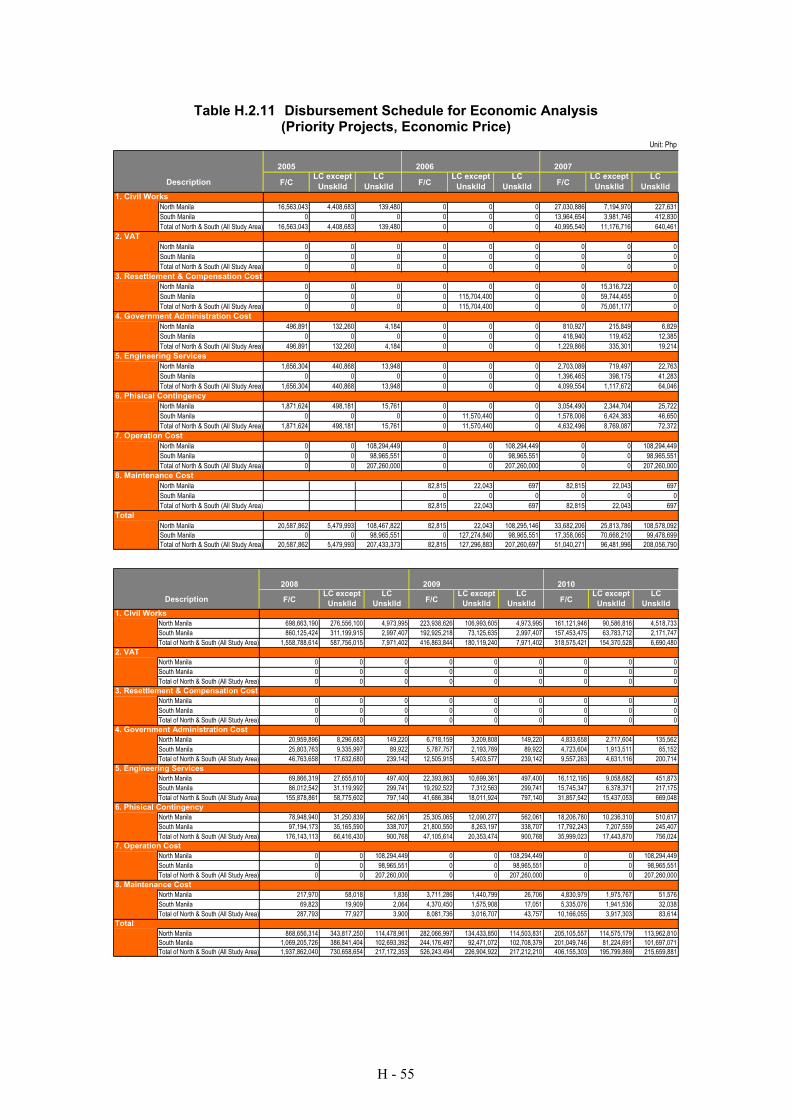
H - 55
Table H.2.11 Disbursement Schedule for Economic Analysis (Priority Projects, Economic Price)
Unit: Php
2005 2006 2007
F/CLC except
Unsklld
LC
UnsklldF/C
LC except
Unsklld
LC
UnsklldF/C
LC except
Unsklld
LC
Unsklld
1. Civil Works
North Manila 16,563,043 4,408,683 139,480 0 0 0 27,030,886 7,194,970 227,631
South Manila 0 0 0 0 0 0 13,964,654 3,981,746 412,830
Total of North & South (All Study Area) 16,563,043 4,408,683 139,480 0 0 0 40,995,540 11,176,716 640,461
2. VAT
North Manila 0 0 0 0 0 0 0 0 0
South Manila 0 0 0 0 0 0 0 0 0
Total of North & South (All Study Area) 0 0 0 0 0 0 0 0 0
3. Resettlement & Compensation Cost
North Manila 0 0 0 0 0 0 0 15,316,722 0
South Manila 0 0 0 0 115,704,400 0 0 59,744,455 0
Total of North & South (All Study Area) 0 0 0 0 115,704,400 0 0 75,061,177 0
4. Government Administration Cost
North Manila 496,891 132,260 4,184 0 0 0 810,927 215,849 6,829
South Manila 0 0 0 0 0 0 418,940 119,452 12,385
Total of North & South (All Study Area) 496,891 132,260 4,184 0 0 0 1,229,866 335,301 19,214
5. Engineering Services
North Manila 1,656,304 440,868 13,948 0 0 0 2,703,089 719,497 22,763
South Manila 0 0 0 0 0 0 1,396,465 398,175 41,283
Total of North & South (All Study Area) 1,656,304 440,868 13,948 0 0 0 4,099,554 1,117,672 64,046
6. Phisical Contingency
North Manila 1,871,624 498,181 15,761 0 0 0 3,054,490 2,344,704 25,722
South Manila 0 0 0 0 11,570,440 0 1,578,006 6,424,383 46,650
Total of North & South (All Study Area) 1,871,624 498,181 15,761 0 11,570,440 0 4,632,496 8,769,087 72,372
7. Operation Cost
North Manila 0 0 108,294,449 0 0 108,294,449 0 0 108,294,449
South Manila 0 0 98,965,551 0 0 98,965,551 0 0 98,965,551
Total of North & South (All Study Area) 0 0 207,260,000 0 0 207,260,000 0 0 207,260,000
8. Maintenance Cost
North Manila 82,815 22,043 697 82,815 22,043 697
South Manila 0 0 0 0 0 0
Total of North & South (All Study Area) 82,815 22,043 697 82,815 22,043 697
Total
North Manila 20,587,862 5,479,993 108,467,822 82,815 22,043 108,295,146 33,682,206 25,813,786 108,578,092
South Manila 0 0 98,965,551 0 127,274,840 98,965,551 17,358,065 70,668,210 99,478,699
Total of North & South (All Study Area) 20,587,862 5,479,993 207,433,373 82,815 127,296,883 207,260,697 51,040,271 96,481,996 208,056,790
Description
2008 2009 2010
F/CLC except
Unsklld
LC
UnsklldF/C
LC except
Unsklld
LC
UnsklldF/C
LC except
Unsklld
LC
Unsklld
1. Civil Works
North Manila 698,663,190 276,556,100 4,973,995 223,938,626 106,993,605 4,973,995 161,121,946 90,586,816 4,518,733
South Manila 860,125,424 311,199,915 2,997,407 192,925,218 73,125,635 2,997,407 157,453,475 63,783,712 2,171,747
Total of North & South (All Study Area) 1,558,788,614 587,756,015 7,971,402 416,863,844 180,119,240 7,971,402 318,575,421 154,370,528 6,690,480
2. VAT
North Manila 0 0 0 0 0 0 0 0 0
South Manila 0 0 0 0 0 0 0 0 0
Total of North & South (All Study Area) 0 0 0 0 0 0 0 0 0
3. Resettlement & Compensation Cost
North Manila 0 0 0 0 0 0 0 0 0
South Manila 0 0 0 0 0 0 0 0 0
Total of North & South (All Study Area) 0 0 0 0 0 0 0 0 0
4. Government Administration Cost
North Manila 20,959,896 8,296,683 149,220 6,718,159 3,209,808 149,220 4,833,658 2,717,604 135,562
South Manila 25,803,763 9,335,997 89,922 5,787,757 2,193,769 89,922 4,723,604 1,913,511 65,152
Total of North & South (All Study Area) 46,763,658 17,632,680 239,142 12,505,915 5,403,577 239,142 9,557,263 4,631,116 200,714
5. Engineering Services
North Manila 69,866,319 27,655,610 497,400 22,393,863 10,699,361 497,400 16,112,195 9,058,682 451,873
South Manila 86,012,542 31,119,992 299,741 19,292,522 7,312,563 299,741 15,745,347 6,378,371 217,175
Total of North & South (All Study Area) 155,878,861 58,775,602 797,140 41,686,384 18,011,924 797,140 31,857,542 15,437,053 669,048
6. Phisical Contingency
North Manila 78,948,940 31,250,839 562,061 25,305,065 12,090,277 562,061 18,206,780 10,236,310 510,617
South Manila 97,194,173 35,165,590 338,707 21,800,550 8,263,197 338,707 17,792,243 7,207,559 245,407
Total of North & South (All Study Area) 176,143,113 66,416,430 900,768 47,105,614 20,353,474 900,768 35,999,023 17,443,870 756,024
7. Operation Cost
North Manila 0 0 108,294,449 0 0 108,294,449 0 0 108,294,449
South Manila 0 0 98,965,551 0 0 98,965,551 0 0 98,965,551
Total of North & South (All Study Area) 0 0 207,260,000 0 0 207,260,000 0 0 207,260,000
8. Maintenance Cost
North Manila 217,970 58,018 1,836 3,711,286 1,440,799 26,706 4,830,979 1,975,767 51,576
South Manila 69,823 19,909 2,064 4,370,450 1,575,908 17,051 5,335,076 1,941,536 32,038
Total of North & South (All Study Area) 287,793 77,927 3,900 8,081,736 3,016,707 43,757 10,166,055 3,917,303 83,614
Total
North Manila 868,656,314 343,817,250 114,478,961 282,066,997 134,433,850 114,503,831 205,105,557 114,575,179 113,962,810
South Manila 1,069,205,726 386,841,404 102,693,392 244,176,497 92,471,072 102,708,379 201,049,746 81,224,691 101,697,071
Total of North & South (All Study Area) 1,937,862,040 730,658,654 217,172,353 526,243,494 226,904,922 217,212,210 406,155,303 195,799,869 215,659,881
Description
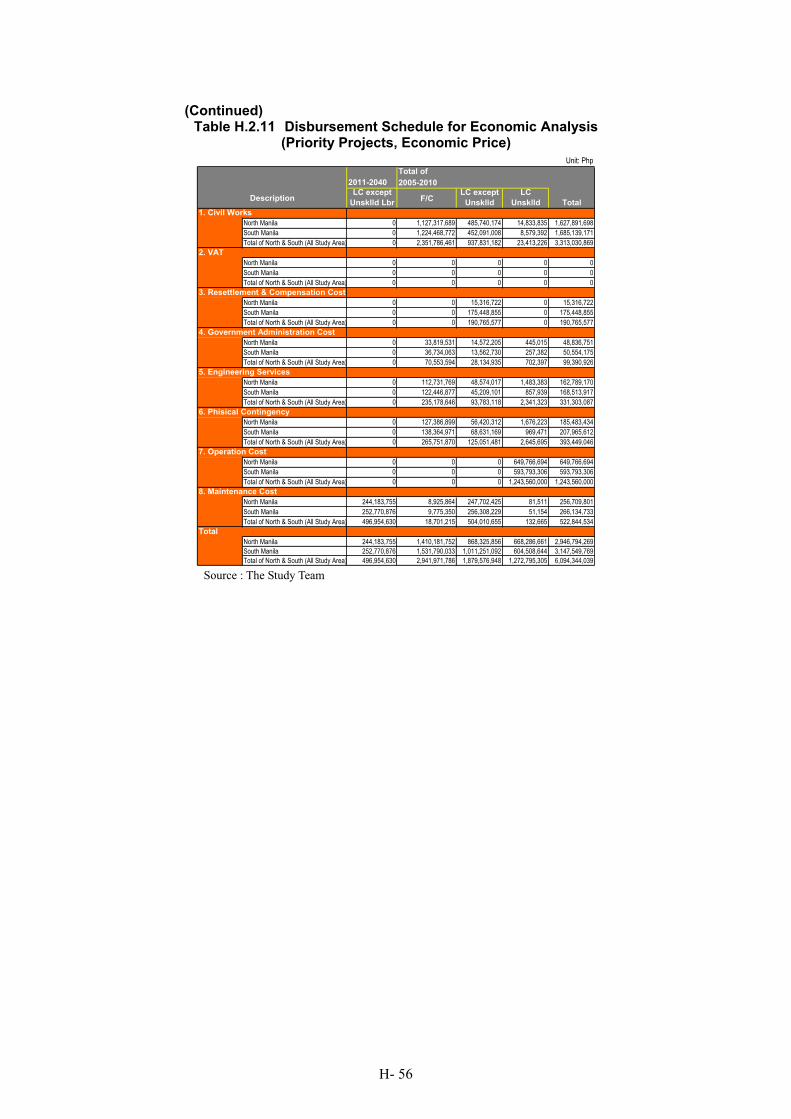
H- 56
(Continued) Table H.2.11 Disbursement Schedule for Economic Analysis
(Priority Projects, Economic Price) Unit: Php
Total of
2011-2040 2005-2010
LC except
Unsklld LbrF/C
LC except
Unsklld
LC
Unsklld Total
1. Civil Works
North Manila 0 1,127,317,689 485,740,174 14,833,835 1,627,891,698
South Manila 0 1,224,468,772 452,091,008 8,579,392 1,685,139,171
Total of North & South (All Study Area) 0 2,351,786,461 937,831,182 23,413,226 3,313,030,869
2. VAT
North Manila 0 0 0 0 0
South Manila 0 0 0 0 0
Total of North & South (All Study Area) 0 0 0 0 0
3. Resettlement & Compensation Cost
North Manila 0 0 15,316,722 0 15,316,722
South Manila 0 0 175,448,855 0 175,448,855
Total of North & South (All Study Area) 0 0 190,765,577 0 190,765,577
4. Government Administration Cost
North Manila 0 33,819,531 14,572,205 445,015 48,836,751
South Manila 0 36,734,063 13,562,730 257,382 50,554,175
Total of North & South (All Study Area) 0 70,553,594 28,134,935 702,397 99,390,926
5. Engineering Services
North Manila 0 112,731,769 48,574,017 1,483,383 162,789,170
South Manila 0 122,446,877 45,209,101 857,939 168,513,917
Total of North & South (All Study Area) 0 235,178,646 93,783,118 2,341,323 331,303,087
6. Phisical Contingency
North Manila 0 127,386,899 56,420,312 1,676,223 185,483,434
South Manila 0 138,364,971 68,631,169 969,471 207,965,612
Total of North & South (All Study Area) 0 265,751,870 125,051,481 2,645,695 393,449,046
7. Operation Cost
North Manila 0 0 0 649,766,694 649,766,694
South Manila 0 0 0 593,793,306 593,793,306
Total of North & South (All Study Area) 0 0 0 1,243,560,000 1,243,560,000
8. Maintenance Cost
North Manila 244,183,755 8,925,864 247,702,425 81,511 256,709,801
South Manila 252,770,876 9,775,350 256,308,229 51,154 266,134,733
Total of North & South (All Study Area) 496,954,630 18,701,215 504,010,655 132,665 522,844,534
Total
North Manila 244,183,755 1,410,181,752 868,325,856 668,286,661 2,946,794,269
South Manila 252,770,876 1,531,790,033 1,011,251,092 604,508,644 3,147,549,769
Total of North & South (All Study Area) 496,954,630 2,941,971,786 1,879,576,948 1,272,795,305 6,094,344,039
Description
Source : The Study Team
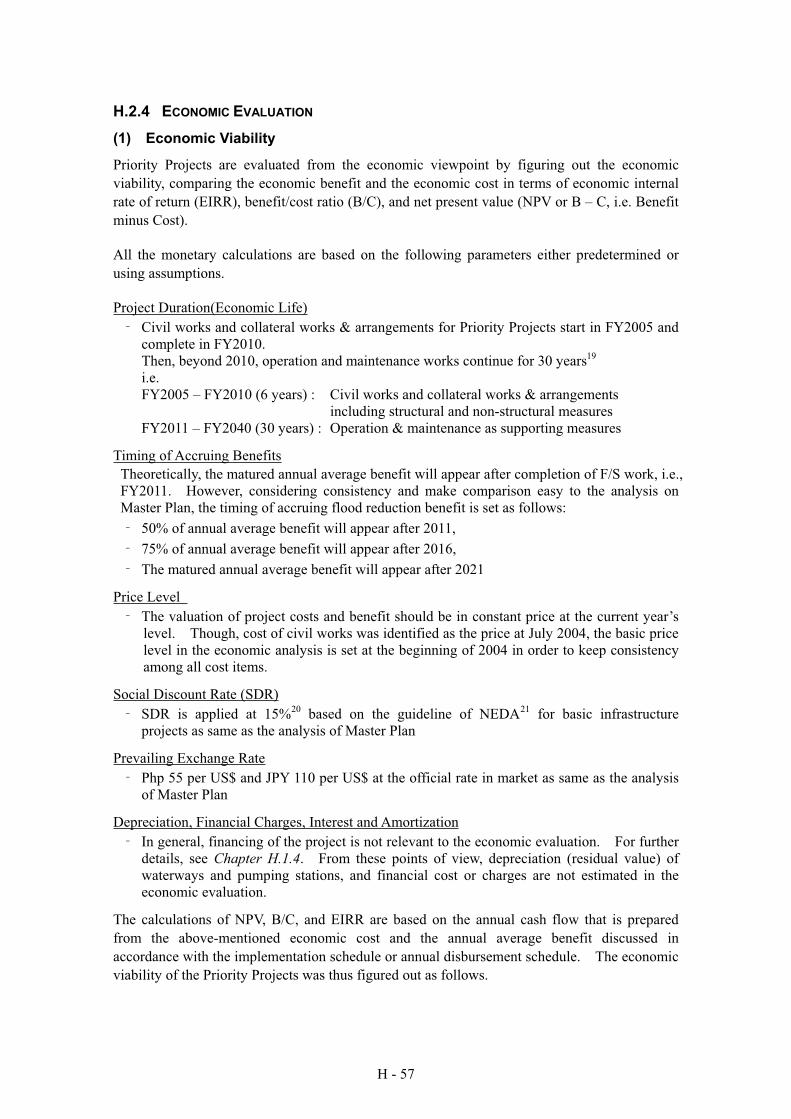
H - 57
H.2.4 ECONOMIC EVALUATION
(1) Economic Viability
Priority Projects are evaluated from the economic viewpoint by figuring out the economic
viability, comparing the economic benefit and the economic cost in terms of economic internal
rate of return (EIRR), benefit/cost ratio (B/C), and net present value (NPV or B – C, i.e. Benefit
minus Cost).
All the monetary calculations are based on the following parameters either predetermined or
using assumptions.
Project Duration(Economic Life)
Civil works and collateral works & arrangements for Priority Projects start in FY2005 and
complete in FY2010.
Then, beyond 2010, operation and maintenance works continue for 30 years19
i.e.
FY2005 – FY2010 (6 years) : Civil works and collateral works & arrangements
including structural and non-structural measures
FY2011 – FY2040 (30 years) : Operation & maintenance as supporting measures
Timing of Accruing Benefits
Theoretically, the matured annual average benefit will appear after completion of F/S work, i.e.,
FY2011. However, considering consistency and make comparison easy to the analysis on
Master Plan, the timing of accruing flood reduction benefit is set as follows:
50% of annual average benefit will appear after 2011,
75% of annual average benefit will appear after 2016,
The matured annual average benefit will appear after 2021
Price Level
The valuation of project costs and benefit should be in constant price at the current year’s
level. Though, cost of civil works was identified as the price at July 2004, the basic price
level in the economic analysis is set at the beginning of 2004 in order to keep consistency
among all cost items.
Social Discount Rate (SDR)
SDR is applied at 15%20 based on the guideline of NEDA21 for basic infrastructure
projects as same as the analysis of Master Plan
Prevailing Exchange Rate
Php 55 per US$ and JPY 110 per US$ at the official rate in market as same as the analysis
of Master Plan
Depreciation, Financial Charges, Interest and Amortization
In general, financing of the project is not relevant to the economic evaluation. For further
details, see Chapter H.1.4. From these points of view, depreciation (residual value) of
waterways and pumping stations, and financial cost or charges are not estimated in the
economic evaluation.
The calculations of NPV, B/C, and EIRR are based on the annual cash flow that is prepared
from the above-mentioned economic cost and the annual average benefit discussed in
accordance with the implementation schedule or annual disbursement schedule. The economic
viability of the Priority Projects was thus figured out as follows.
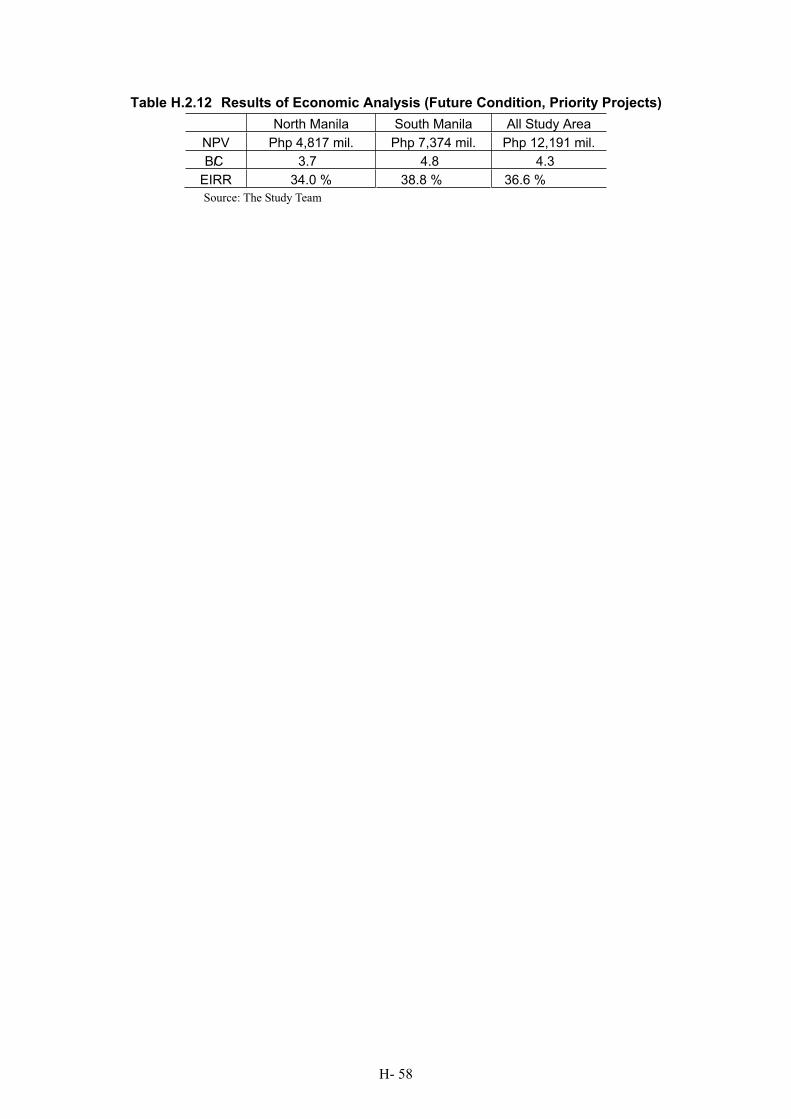
H- 58
Table H.2.12 Results of Economic Analysis (Future Condition, Priority Projects)
North Manila South Manila All Study Area
NPV Php 4,817 mil. Php 7,374 mil. Php 12,191 mil.
B/C 3.7 4.8 4.3
EIRR 34.0 % 38.8 % 36.6 %
Source: The Study Team
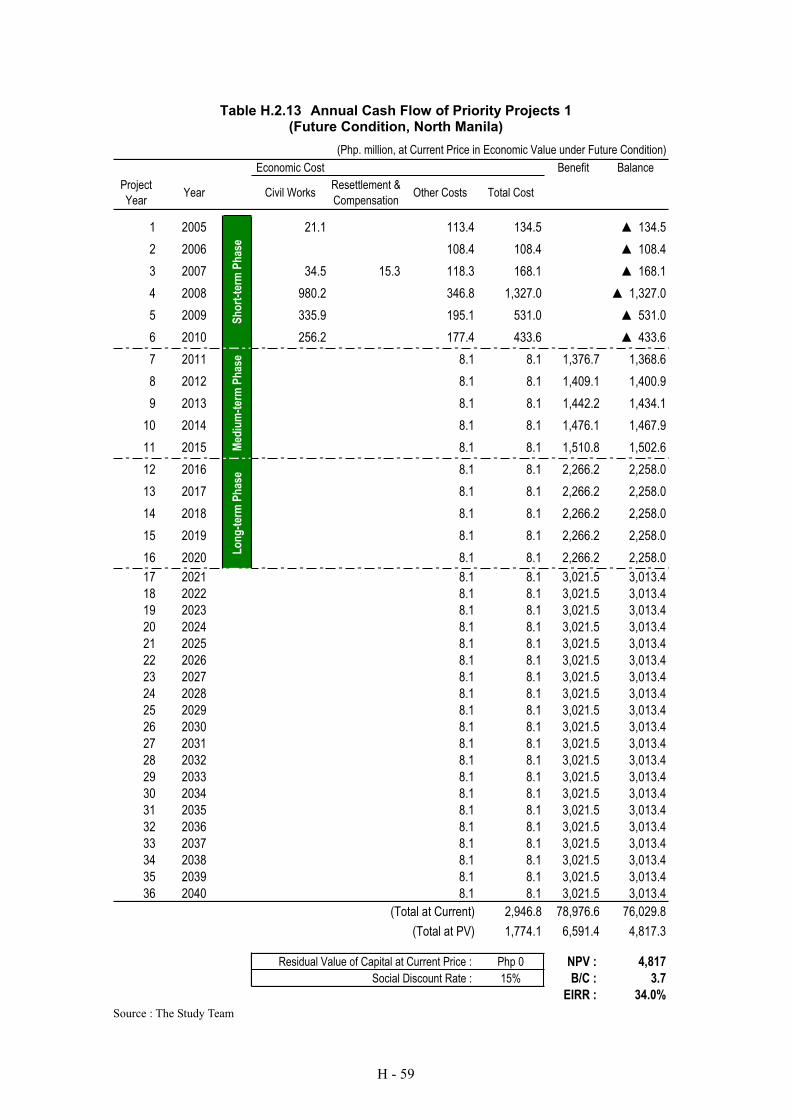
H - 59
Table H.2.13 Annual Cash Flow of Priority Projects 1 (Future Condition, North Manila)
(Php. million, at Current Price in Economic Value under Future Condition)
Economic Cost Benefit Balance
Project
YearYear Civil Works
Resettlement &
CompensationOther Costs Total Cost
1 2005 21.1 113.4 134.5 134.5
2 2006 108.4 108.4 108.4
3 2007 34.5 15.3 118.3 168.1 168.1
4 2008 980.2 346.8 1,327.0 1,327.0
5 2009 335.9 195.1 531.0 531.0
6 2010 256.2 177.4 433.6 433.6
7 2011 8.1 8.1 1,376.7 1,368.6
8 2012 8.1 8.1 1,409.1 1,400.9
9 2013 8.1 8.1 1,442.2 1,434.1
10 2014 8.1 8.1 1,476.1 1,467.9
11 2015 8.1 8.1 1,510.8 1,502.6
12 2016 8.1 8.1 2,266.2 2,258.0
13 2017 8.1 8.1 2,266.2 2,258.0
14 2018 8.1 8.1 2,266.2 2,258.0
15 2019 8.1 8.1 2,266.2 2,258.0
16 2020 8.1 8.1 2,266.2 2,258.0
17 2021 8.1 8.1 3,021.5 3,013.4
18 2022 8.1 8.1 3,021.5 3,013.4
19 2023 8.1 8.1 3,021.5 3,013.4
20 2024 8.1 8.1 3,021.5 3,013.4
21 2025 8.1 8.1 3,021.5 3,013.4
22 2026 8.1 8.1 3,021.5 3,013.4
23 2027 8.1 8.1 3,021.5 3,013.4
24 2028 8.1 8.1 3,021.5 3,013.4
25 2029 8.1 8.1 3,021.5 3,013.4
26 2030 8.1 8.1 3,021.5 3,013.4
27 2031 8.1 8.1 3,021.5 3,013.4
28 2032 8.1 8.1 3,021.5 3,013.4
29 2033 8.1 8.1 3,021.5 3,013.4
30 2034 8.1 8.1 3,021.5 3,013.4
31 2035 8.1 8.1 3,021.5 3,013.4
32 2036 8.1 8.1 3,021.5 3,013.4
33 2037 8.1 8.1 3,021.5 3,013.4
34 2038 8.1 8.1 3,021.5 3,013.4
35 2039 8.1 8.1 3,021.5 3,013.4
36 2040 8.1 8.1 3,021.5 3,013.4
(Total at Current) 2,946.8 78,976.6 76,029.8
(Total at PV) 1,774.1 6,591.4 4,817.3
Residual Value of Capital at Current Price : Php 0 NPV : 4,817
Social Discount Rate : 15% B/C : 3.7
EIRR : 34.0%
Sh
ort
-ter
m P
has
eM
ediu
m-t
erm
Ph
ase
Lo
ng
-ter
m P
has
e
Source : The Study Team
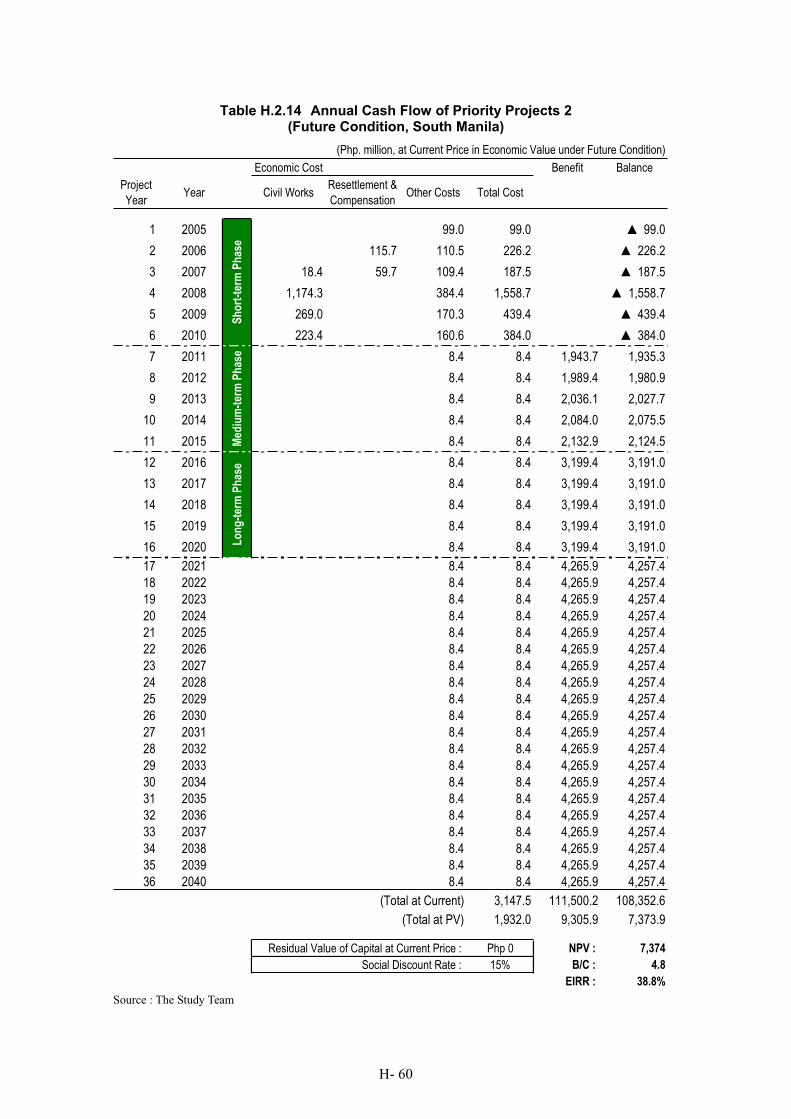
H- 60
Table H.2.14 Annual Cash Flow of Priority Projects 2 (Future Condition, South Manila)
(Php. million, at Current Price in Economic Value under Future Condition)
Economic Cost Benefit Balance
Project
YearYear Civil Works
Resettlement &
CompensationOther Costs Total Cost
1 2005 99.0 99.0 99.0
2 2006 115.7 110.5 226.2 226.2
3 2007 18.4 59.7 109.4 187.5 187.5
4 2008 1,174.3 384.4 1,558.7 1,558.7
5 2009 269.0 170.3 439.4 439.4
6 2010 223.4 160.6 384.0 384.0
7 2011 8.4 8.4 1,943.7 1,935.3
8 2012 8.4 8.4 1,989.4 1,980.9
9 2013 8.4 8.4 2,036.1 2,027.7
10 2014 8.4 8.4 2,084.0 2,075.5
11 2015 8.4 8.4 2,132.9 2,124.5
12 2016 8.4 8.4 3,199.4 3,191.0
13 2017 8.4 8.4 3,199.4 3,191.0
14 2018 8.4 8.4 3,199.4 3,191.0
15 2019 8.4 8.4 3,199.4 3,191.0
16 2020 8.4 8.4 3,199.4 3,191.0
17 2021 8.4 8.4 4,265.9 4,257.4
18 2022 8.4 8.4 4,265.9 4,257.4
19 2023 8.4 8.4 4,265.9 4,257.4
20 2024 8.4 8.4 4,265.9 4,257.4
21 2025 8.4 8.4 4,265.9 4,257.4
22 2026 8.4 8.4 4,265.9 4,257.4
23 2027 8.4 8.4 4,265.9 4,257.4
24 2028 8.4 8.4 4,265.9 4,257.4
25 2029 8.4 8.4 4,265.9 4,257.4
26 2030 8.4 8.4 4,265.9 4,257.4
27 2031 8.4 8.4 4,265.9 4,257.4
28 2032 8.4 8.4 4,265.9 4,257.4
29 2033 8.4 8.4 4,265.9 4,257.4
30 2034 8.4 8.4 4,265.9 4,257.4
31 2035 8.4 8.4 4,265.9 4,257.4
32 2036 8.4 8.4 4,265.9 4,257.4
33 2037 8.4 8.4 4,265.9 4,257.4
34 2038 8.4 8.4 4,265.9 4,257.4
35 2039 8.4 8.4 4,265.9 4,257.4
36 2040 8.4 8.4 4,265.9 4,257.4
(Total at Current) 3,147.5 111,500.2 108,352.6
(Total at PV) 1,932.0 9,305.9 7,373.9
Residual Value of Capital at Current Price : Php 0 NPV : 7,374
Social Discount Rate : 15% B/C : 4.8
EIRR : 38.8%
Sh
ort
-ter
m P
has
eM
ediu
m-t
erm
Ph
ase
Lo
ng
-ter
m P
has
e
Source : The Study Team
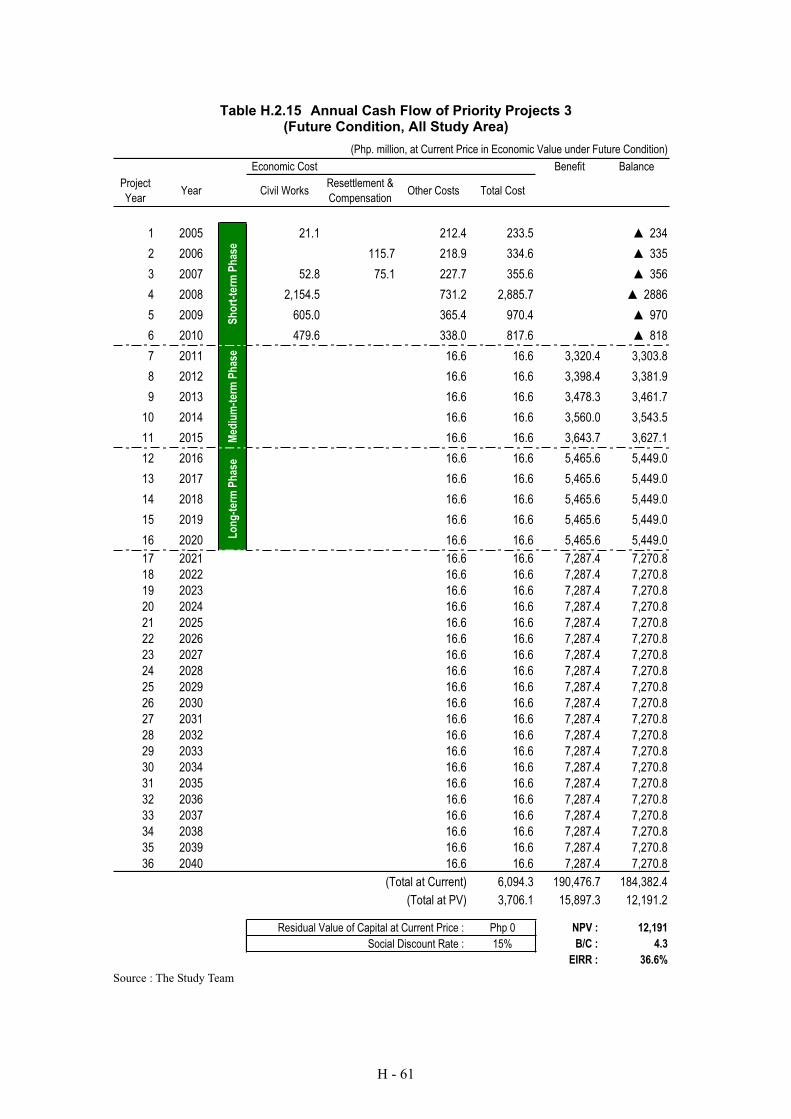
H - 61
Table H.2.15 Annual Cash Flow of Priority Projects 3 (Future Condition, All Study Area)
(Php. million, at Current Price in Economic Value under Future Condition)
Economic Cost Benefit Balance
Project
YearYear Civil Works
Resettlement &
CompensationOther Costs Total Cost
1 2005 21.1 212.4 233.5 234
2 2006 115.7 218.9 334.6 335
3 2007 52.8 75.1 227.7 355.6 356
4 2008 2,154.5 731.2 2,885.7 2886
5 2009 605.0 365.4 970.4 970
6 2010 479.6 338.0 817.6 818
7 2011 16.6 16.6 3,320.4 3,303.8
8 2012 16.6 16.6 3,398.4 3,381.9
9 2013 16.6 16.6 3,478.3 3,461.7
10 2014 16.6 16.6 3,560.0 3,543.5
11 2015 16.6 16.6 3,643.7 3,627.1
12 2016 16.6 16.6 5,465.6 5,449.0
13 2017 16.6 16.6 5,465.6 5,449.0
14 2018 16.6 16.6 5,465.6 5,449.0
15 2019 16.6 16.6 5,465.6 5,449.0
16 2020 16.6 16.6 5,465.6 5,449.0
17 2021 16.6 16.6 7,287.4 7,270.8
18 2022 16.6 16.6 7,287.4 7,270.8
19 2023 16.6 16.6 7,287.4 7,270.8
20 2024 16.6 16.6 7,287.4 7,270.8
21 2025 16.6 16.6 7,287.4 7,270.8
22 2026 16.6 16.6 7,287.4 7,270.8
23 2027 16.6 16.6 7,287.4 7,270.8
24 2028 16.6 16.6 7,287.4 7,270.8
25 2029 16.6 16.6 7,287.4 7,270.8
26 2030 16.6 16.6 7,287.4 7,270.8
27 2031 16.6 16.6 7,287.4 7,270.8
28 2032 16.6 16.6 7,287.4 7,270.8
29 2033 16.6 16.6 7,287.4 7,270.8
30 2034 16.6 16.6 7,287.4 7,270.8
31 2035 16.6 16.6 7,287.4 7,270.8
32 2036 16.6 16.6 7,287.4 7,270.8
33 2037 16.6 16.6 7,287.4 7,270.8
34 2038 16.6 16.6 7,287.4 7,270.8
35 2039 16.6 16.6 7,287.4 7,270.8
36 2040 16.6 16.6 7,287.4 7,270.8
(Total at Current) 6,094.3 190,476.7 184,382.4
(Total at PV) 3,706.1 15,897.3 12,191.2
Residual Value of Capital at Current Price : Php 0 NPV : 12,191
Social Discount Rate : 15% B/C : 4.3
EIRR : 36.6%
Sh
ort
-ter
m P
has
eM
ediu
m-t
erm
Ph
ase
Lo
ng
-ter
m P
has
e
Source : The Study Team
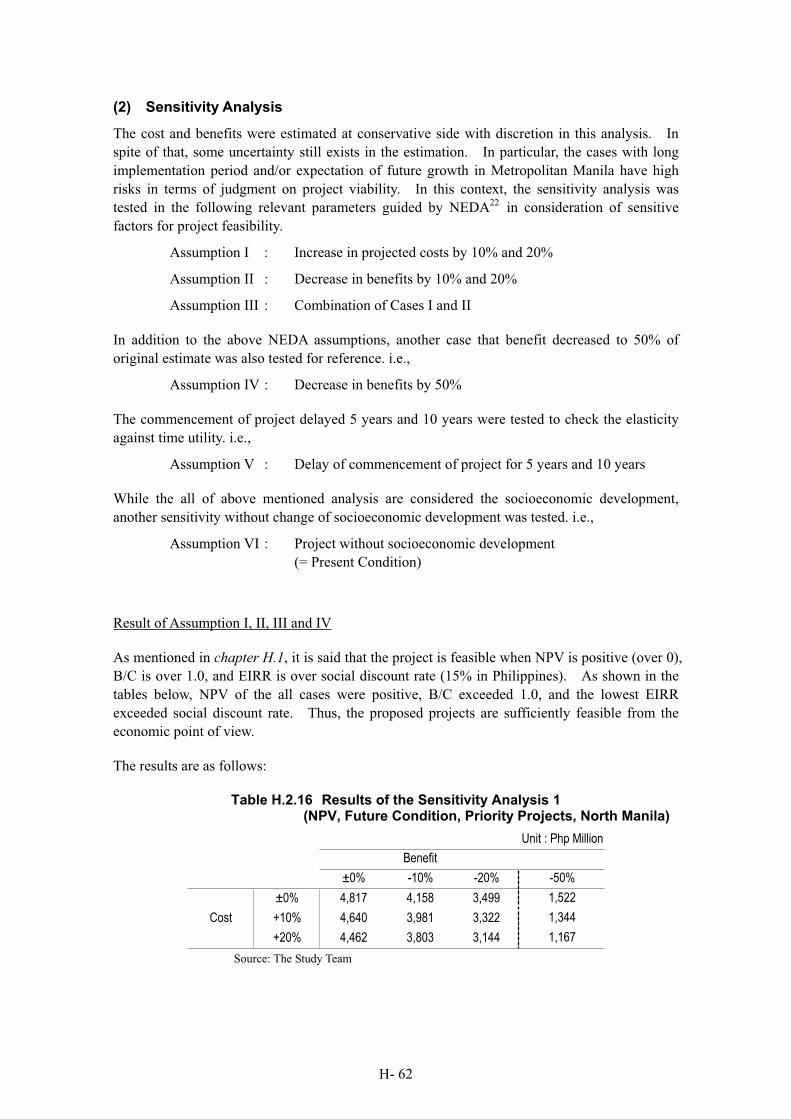
H- 62
(2) Sensitivity Analysis
The cost and benefits were estimated at conservative side with discretion in this analysis. In
spite of that, some uncertainty still exists in the estimation. In particular, the cases with long
implementation period and/or expectation of future growth in Metropolitan Manila have high
risks in terms of judgment on project viability. In this context, the sensitivity analysis was
tested in the following relevant parameters guided by NEDA22 in consideration of sensitive
factors for project feasibility.
Assumption I : Increase in projected costs by 10% and 20%
Assumption II : Decrease in benefits by 10% and 20%
Assumption III : Combination of Cases I and II
In addition to the above NEDA assumptions, another case that benefit decreased to 50% of
original estimate was also tested for reference. i.e.,
Assumption IV : Decrease in benefits by 50%
The commencement of project delayed 5 years and 10 years were tested to check the elasticity
against time utility. i.e.,
Assumption V : Delay of commencement of project for 5 years and 10 years
While the all of above mentioned analysis are considered the socioeconomic development,
another sensitivity without change of socioeconomic development was tested. i.e.,
Assumption VI : Project without socioeconomic development
(= Present Condition)
Result of Assumption I, II, III and IV
As mentioned in chapter H.1, it is said that the project is feasible when NPV is positive (over 0),
B/C is over 1.0, and EIRR is over social discount rate (15% in Philippines). As shown in the
tables below, NPV of the all cases were positive, B/C exceeded 1.0, and the lowest EIRR
exceeded social discount rate. Thus, the proposed projects are sufficiently feasible from the
economic point of view.
The results are as follows:
Table H.2.16 Results of the Sensitivity Analysis 1 (NPV, Future Condition, Priority Projects, North Manila)
Unit : Php Million
Benefit
±0% -10% -20% -50%
±0% 4,817 4,158 3,499 1,522
Cost +10% 4,640 3,981 3,322 1,344
+20% 4,462 3,803 3,144 1,167
Source: The Study Team
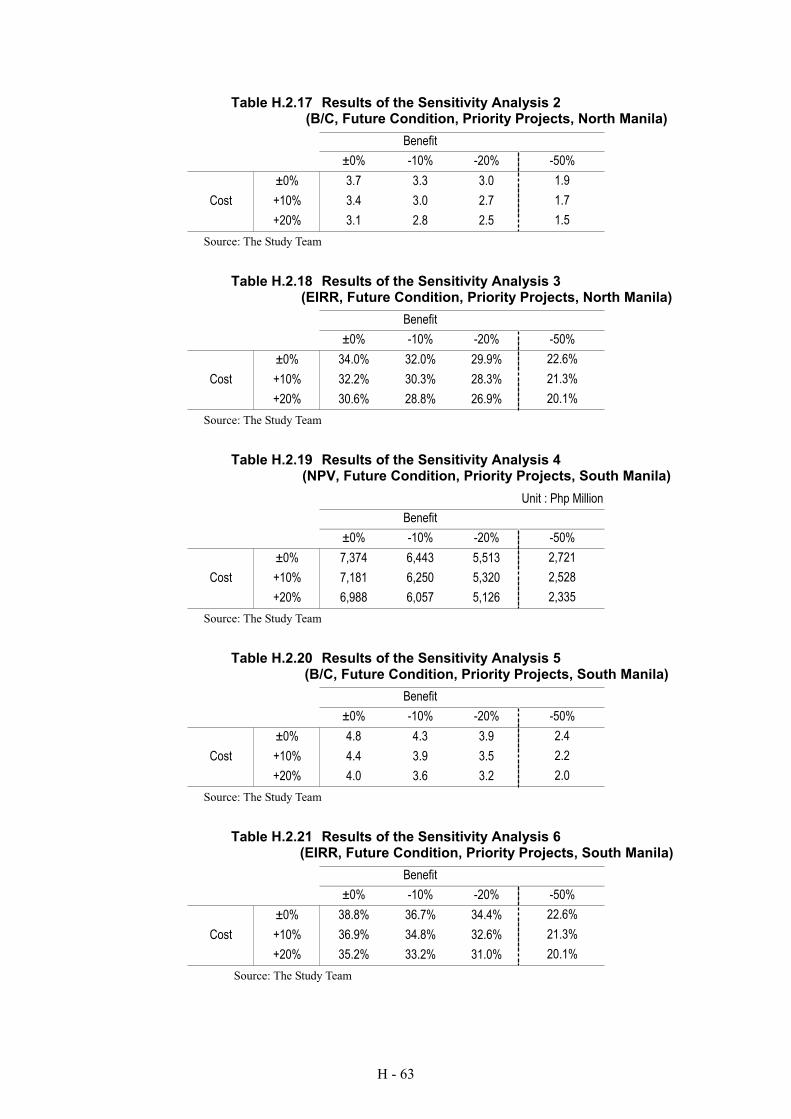
H - 63
Table H.2.17 Results of the Sensitivity Analysis 2 (B/C, Future Condition, Priority Projects, North Manila)
Benefit
±0% -10% -20% -50%
±0% 3.7 3.3 3.0 1.9
Cost +10% 3.4 3.0 2.7 1.7
+20% 3.1 2.8 2.5 1.5
Source: The Study Team
Table H.2.18 Results of the Sensitivity Analysis 3 (EIRR, Future Condition, Priority Projects, North Manila)
Benefit
±0% -10% -20% -50%
±0% 34.0% 32.0% 29.9% 22.6%
Cost +10% 32.2% 30.3% 28.3% 21.3%
+20% 30.6% 28.8% 26.9% 20.1%
Source: The Study Team
Table H.2.19 Results of the Sensitivity Analysis 4 (NPV, Future Condition, Priority Projects, South Manila)
Unit : Php Million
Benefit
±0% -10% -20% -50%
±0% 7,374 6,443 5,513 2,721
Cost +10% 7,181 6,250 5,320 2,528
+20% 6,988 6,057 5,126 2,335
Source: The Study Team
Table H.2.20 Results of the Sensitivity Analysis 5 (B/C, Future Condition, Priority Projects, South Manila)
Benefit
±0% -10% -20% -50%
±0% 4.8 4.3 3.9 2.4
Cost +10% 4.4 3.9 3.5 2.2
+20% 4.0 3.6 3.2 2.0
Source: The Study Team
Table H.2.21 Results of the Sensitivity Analysis 6 (EIRR, Future Condition, Priority Projects, South Manila)
Benefit
±0% -10% -20% -50%
±0% 38.8% 36.7% 34.4% 22.6%
Cost +10% 36.9% 34.8% 32.6% 21.3%
+20% 35.2% 33.2% 31.0% 20.1%
Source: The Study Team
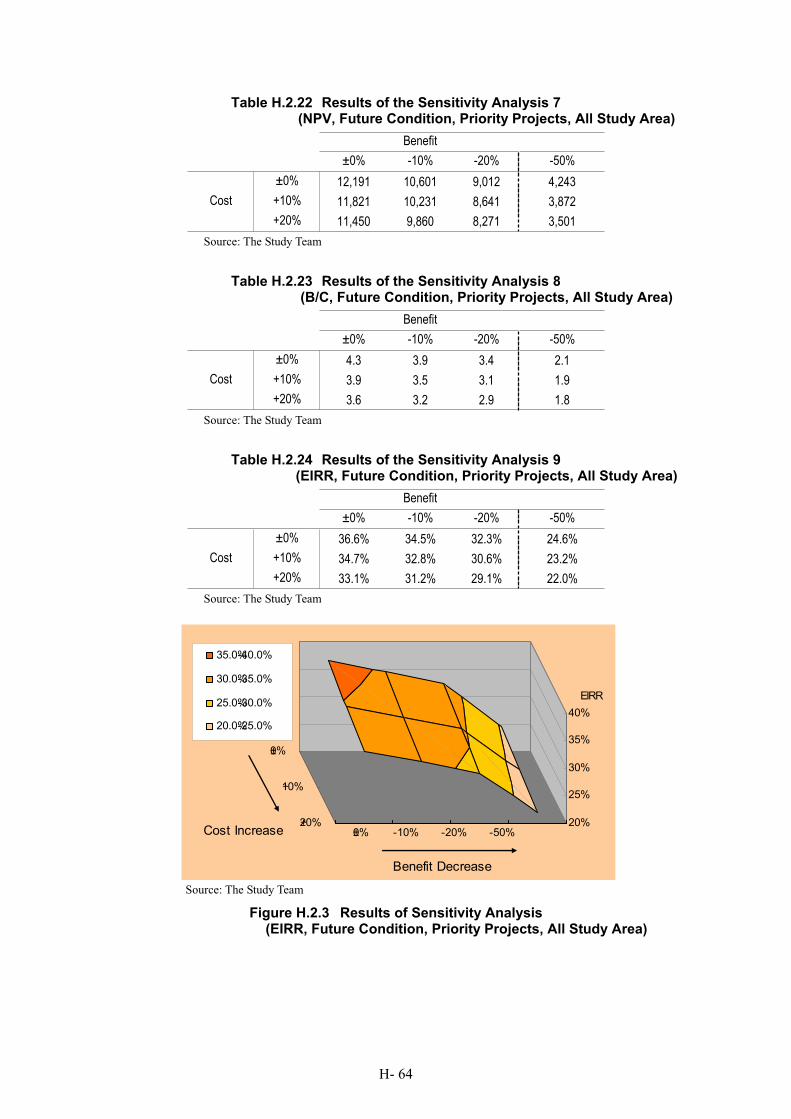
H- 64
Table H.2.22 Results of the Sensitivity Analysis 7 (NPV, Future Condition, Priority Projects, All Study Area)
Benefit
±0% -10% -20% -50%
±0% 12,191 10,601 9,012 4,243
Cost +10% 11,821 10,231 8,641 3,872
+20% 11,450 9,860 8,271 3,501
Source: The Study Team
Table H.2.23 Results of the Sensitivity Analysis 8 (B/C, Future Condition, Priority Projects, All Study Area)
Benefit
±0% -10% -20% -50%
±0% 4.3 3.9 3.4 2.1
Cost +10% 3.9 3.5 3.1 1.9
+20% 3.6 3.2 2.9 1.8
Source: The Study Team
Table H.2.24 Results of the Sensitivity Analysis 9 (EIRR, Future Condition, Priority Projects, All Study Area)
Benefit
±0% -10% -20% -50%
±0% 36.6% 34.5% 32.3% 24.6%
Cost +10% 34.7% 32.8% 30.6% 23.2%
+20% 33.1% 31.2% 29.1% 22.0%
Source: The Study Team
20%
25%
30%
35%
40%
EIRR
±0% -10% -20% -50%
±0%
+10%
+20%
Benefit Decrease
Cost Increase
35.0%-40.0%
30.0%-35.0%
25.0%-30.0%
20.0%-25.0%
Source: The Study Team
Figure H.2.3 Results of Sensitivity Analysis (EIRR, Future Condition, Priority Projects, All Study Area)
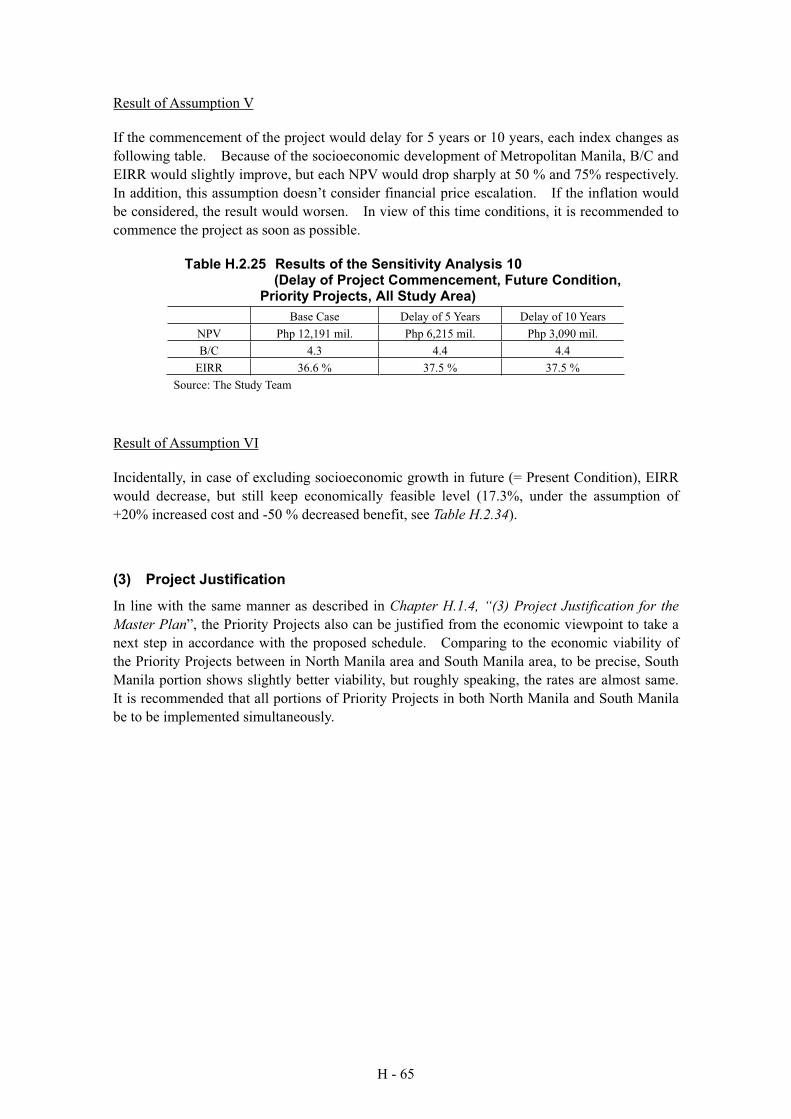
H - 65
Result of Assumption V
If the commencement of the project would delay for 5 years or 10 years, each index changes as
following table. Because of the socioeconomic development of Metropolitan Manila, B/C and
EIRR would slightly improve, but each NPV would drop sharply at 50 % and 75% respectively.
In addition, this assumption doesn’t consider financial price escalation. If the inflation would
be considered, the result would worsen. In view of this time conditions, it is recommended to
commence the project as soon as possible.
Table H.2.25 Results of the Sensitivity Analysis 10 (Delay of Project Commencement, Future Condition,
Priority Projects, All Study Area)
Base Case Delay of 5 Years Delay of 10 Years
NPV Php 12,191 mil. Php 6,215 mil. Php 3,090 mil.
B/C 4.3 4.4 4.4
EIRR 36.6 % 37.5 % 37.5 %
Source: The Study Team
Result of Assumption VI
Incidentally, in case of excluding socioeconomic growth in future (= Present Condition), EIRR
would decrease, but still keep economically feasible level (17.3%, under the assumption of
+20% increased cost and -50 % decreased benefit, see Table H.2.34).
(3) Project Justification
In line with the same manner as described in Chapter H.1.4, “(3) Project Justification for the
Master Plan”, the Priority Projects also can be justified from the economic viewpoint to take a
next step in accordance with the proposed schedule. Comparing to the economic viability of
the Priority Projects between in North Manila area and South Manila area, to be precise, South
Manila portion shows slightly better viability, but roughly speaking, the rates are almost same.
It is recommended that all portions of Priority Projects in both North Manila and South Manila
be to be implemented simultaneously.
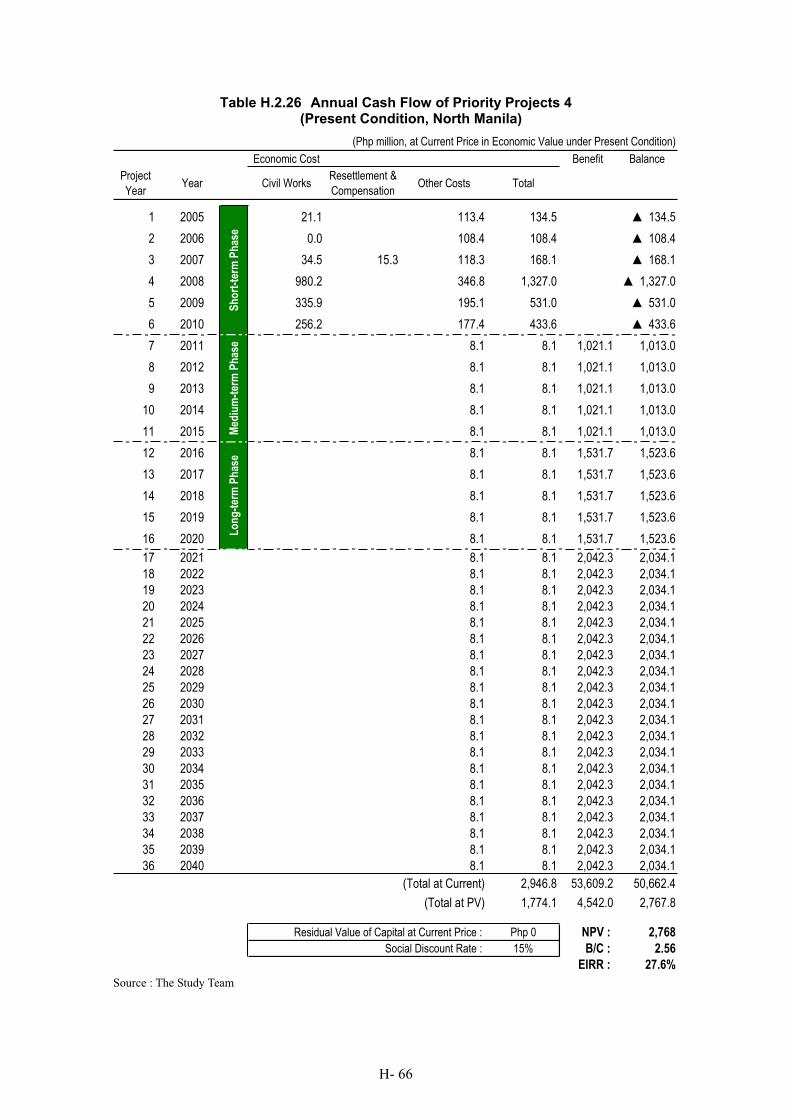
H- 66
Table H.2.26 Annual Cash Flow of Priority Projects 4 (Present Condition, North Manila)
(Php million, at Current Price in Economic Value under Present Condition)
Economic Cost Benefit Balance
Project
YearYear Civil Works
Resettlement &
CompensationOther Costs Total
1 2005 21.1 113.4 134.5 134.5
2 2006 0.0 108.4 108.4 108.4
3 2007 34.5 15.3 118.3 168.1 168.1
4 2008 980.2 346.8 1,327.0 1,327.0
5 2009 335.9 195.1 531.0 531.0
6 2010 256.2 177.4 433.6 433.6
7 2011 8.1 8.1 1,021.1 1,013.0
8 2012 8.1 8.1 1,021.1 1,013.0
9 2013 8.1 8.1 1,021.1 1,013.0
10 2014 8.1 8.1 1,021.1 1,013.0
11 2015 8.1 8.1 1,021.1 1,013.0
12 2016 8.1 8.1 1,531.7 1,523.6
13 2017 8.1 8.1 1,531.7 1,523.6
14 2018 8.1 8.1 1,531.7 1,523.6
15 2019 8.1 8.1 1,531.7 1,523.6
16 2020 8.1 8.1 1,531.7 1,523.6
17 2021 8.1 8.1 2,042.3 2,034.1
18 2022 8.1 8.1 2,042.3 2,034.1
19 2023 8.1 8.1 2,042.3 2,034.1
20 2024 8.1 8.1 2,042.3 2,034.1
21 2025 8.1 8.1 2,042.3 2,034.1
22 2026 8.1 8.1 2,042.3 2,034.1
23 2027 8.1 8.1 2,042.3 2,034.1
24 2028 8.1 8.1 2,042.3 2,034.1
25 2029 8.1 8.1 2,042.3 2,034.1
26 2030 8.1 8.1 2,042.3 2,034.1
27 2031 8.1 8.1 2,042.3 2,034.1
28 2032 8.1 8.1 2,042.3 2,034.1
29 2033 8.1 8.1 2,042.3 2,034.1
30 2034 8.1 8.1 2,042.3 2,034.1
31 2035 8.1 8.1 2,042.3 2,034.1
32 2036 8.1 8.1 2,042.3 2,034.1
33 2037 8.1 8.1 2,042.3 2,034.1
34 2038 8.1 8.1 2,042.3 2,034.1
35 2039 8.1 8.1 2,042.3 2,034.1
36 2040 8.1 8.1 2,042.3 2,034.1
(Total at Current) 2,946.8 53,609.2 50,662.4
(Total at PV) 1,774.1 4,542.0 2,767.8
Residual Value of Capital at Current Price : Php 0 NPV : 2,768
Social Discount Rate : 15% B/C : 2.56
EIRR : 27.6%
Sh
ort
-ter
m P
has
eM
ediu
m-t
erm
Ph
ase
Lo
ng
-ter
m P
has
e
Source : The Study Team
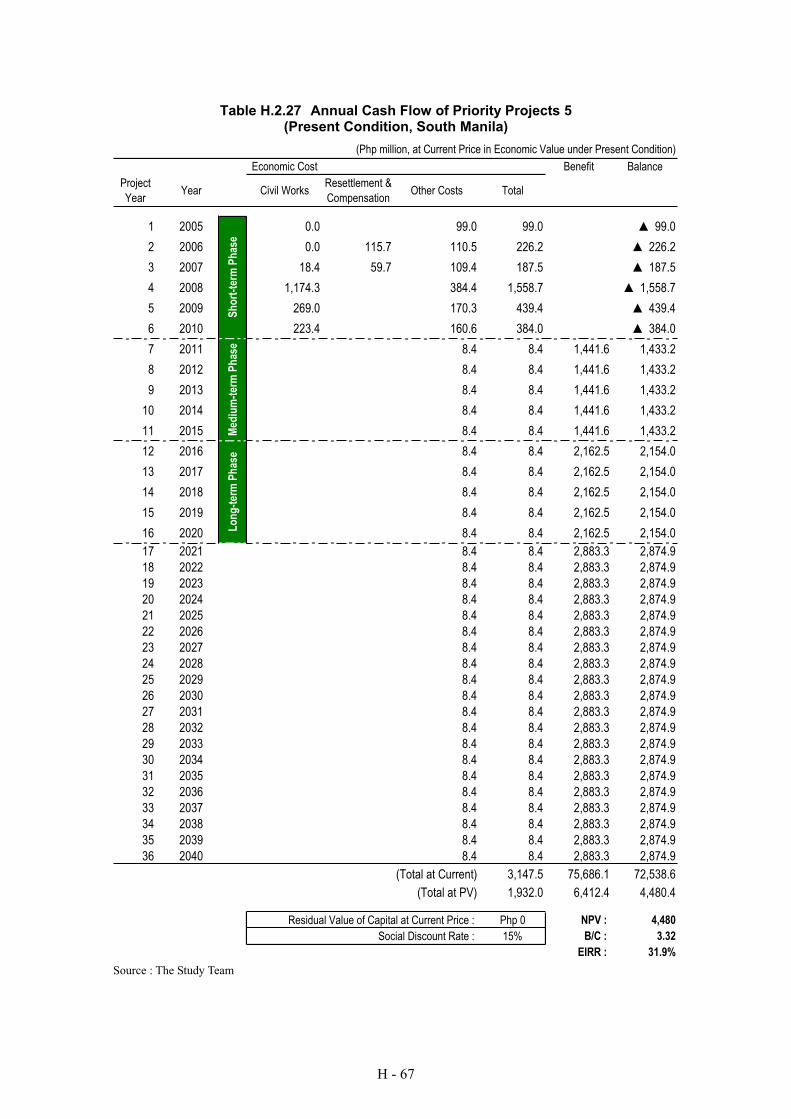
H - 67
Table H.2.27 Annual Cash Flow of Priority Projects 5 (Present Condition, South Manila)
(Php million, at Current Price in Economic Value under Present Condition)
Economic Cost Benefit Balance
Project
YearYear Civil Works
Resettlement &
CompensationOther Costs Total
1 2005 0.0 99.0 99.0 99.0
2 2006 0.0 115.7 110.5 226.2 226.2
3 2007 18.4 59.7 109.4 187.5 187.5
4 2008 1,174.3 384.4 1,558.7 1,558.7
5 2009 269.0 170.3 439.4 439.4
6 2010 223.4 160.6 384.0 384.0
7 2011 8.4 8.4 1,441.6 1,433.2
8 2012 8.4 8.4 1,441.6 1,433.2
9 2013 8.4 8.4 1,441.6 1,433.2
10 2014 8.4 8.4 1,441.6 1,433.2
11 2015 8.4 8.4 1,441.6 1,433.2
12 2016 8.4 8.4 2,162.5 2,154.0
13 2017 8.4 8.4 2,162.5 2,154.0
14 2018 8.4 8.4 2,162.5 2,154.0
15 2019 8.4 8.4 2,162.5 2,154.0
16 2020 8.4 8.4 2,162.5 2,154.0
17 2021 8.4 8.4 2,883.3 2,874.9
18 2022 8.4 8.4 2,883.3 2,874.9
19 2023 8.4 8.4 2,883.3 2,874.9
20 2024 8.4 8.4 2,883.3 2,874.9
21 2025 8.4 8.4 2,883.3 2,874.9
22 2026 8.4 8.4 2,883.3 2,874.9
23 2027 8.4 8.4 2,883.3 2,874.9
24 2028 8.4 8.4 2,883.3 2,874.9
25 2029 8.4 8.4 2,883.3 2,874.9
26 2030 8.4 8.4 2,883.3 2,874.9
27 2031 8.4 8.4 2,883.3 2,874.9
28 2032 8.4 8.4 2,883.3 2,874.9
29 2033 8.4 8.4 2,883.3 2,874.9
30 2034 8.4 8.4 2,883.3 2,874.9
31 2035 8.4 8.4 2,883.3 2,874.9
32 2036 8.4 8.4 2,883.3 2,874.9
33 2037 8.4 8.4 2,883.3 2,874.9
34 2038 8.4 8.4 2,883.3 2,874.9
35 2039 8.4 8.4 2,883.3 2,874.9
36 2040 8.4 8.4 2,883.3 2,874.9
(Total at Current) 3,147.5 75,686.1 72,538.6
(Total at PV) 1,932.0 6,412.4 4,480.4
Residual Value of Capital at Current Price : Php 0 NPV : 4,480
Social Discount Rate : 15% B/C : 3.32
EIRR : 31.9%
Sh
ort
-ter
m P
has
eM
ediu
m-t
erm
Ph
ase
Lo
ng
-ter
m P
has
e
Source : The Study Team
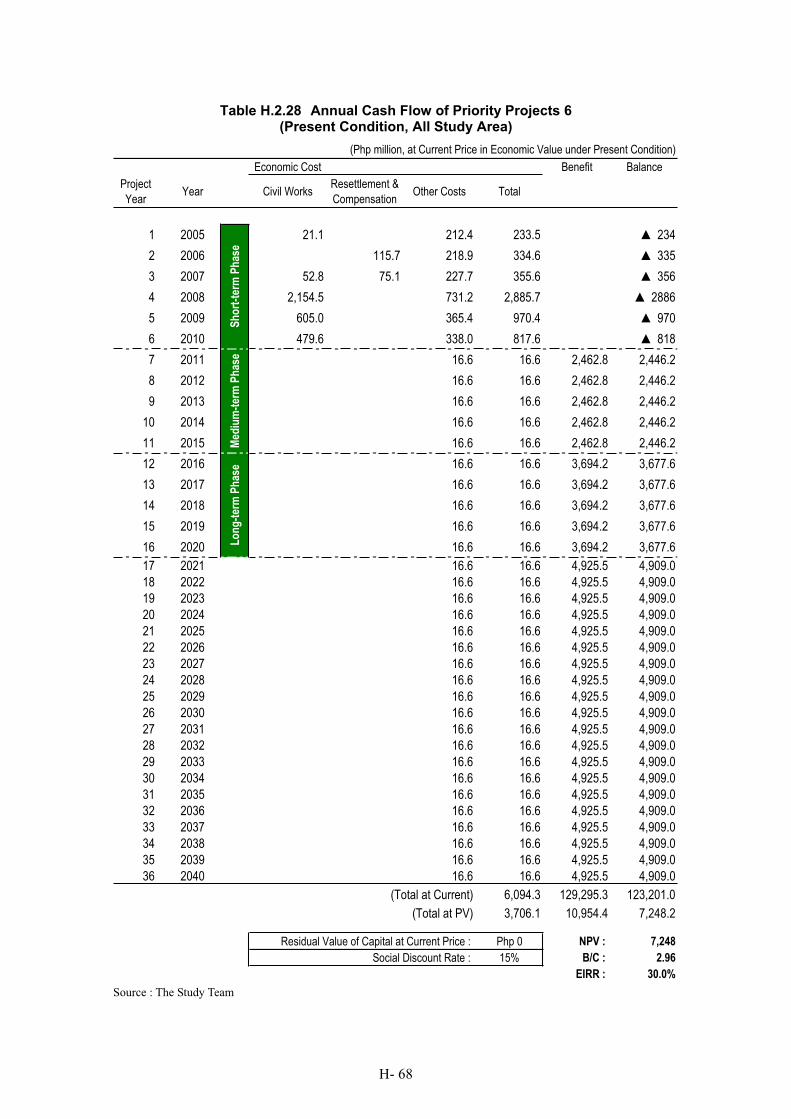
H- 68
Table H.2.28 Annual Cash Flow of Priority Projects 6 (Present Condition, All Study Area)
(Php million, at Current Price in Economic Value under Present Condition)
Economic Cost Benefit Balance
Project
YearYear Civil Works
Resettlement &
CompensationOther Costs Total
1 2005 21.1 212.4 233.5 234
2 2006 115.7 218.9 334.6 335
3 2007 52.8 75.1 227.7 355.6 356
4 2008 2,154.5 731.2 2,885.7 2886
5 2009 605.0 365.4 970.4 970
6 2010 479.6 338.0 817.6 818
7 2011 16.6 16.6 2,462.8 2,446.2
8 2012 16.6 16.6 2,462.8 2,446.2
9 2013 16.6 16.6 2,462.8 2,446.2
10 2014 16.6 16.6 2,462.8 2,446.2
11 2015 16.6 16.6 2,462.8 2,446.2
12 2016 16.6 16.6 3,694.2 3,677.6
13 2017 16.6 16.6 3,694.2 3,677.6
14 2018 16.6 16.6 3,694.2 3,677.6
15 2019 16.6 16.6 3,694.2 3,677.6
16 2020 16.6 16.6 3,694.2 3,677.6
17 2021 16.6 16.6 4,925.5 4,909.0
18 2022 16.6 16.6 4,925.5 4,909.0
19 2023 16.6 16.6 4,925.5 4,909.0
20 2024 16.6 16.6 4,925.5 4,909.0
21 2025 16.6 16.6 4,925.5 4,909.0
22 2026 16.6 16.6 4,925.5 4,909.0
23 2027 16.6 16.6 4,925.5 4,909.0
24 2028 16.6 16.6 4,925.5 4,909.0
25 2029 16.6 16.6 4,925.5 4,909.0
26 2030 16.6 16.6 4,925.5 4,909.0
27 2031 16.6 16.6 4,925.5 4,909.0
28 2032 16.6 16.6 4,925.5 4,909.0
29 2033 16.6 16.6 4,925.5 4,909.0
30 2034 16.6 16.6 4,925.5 4,909.0
31 2035 16.6 16.6 4,925.5 4,909.0
32 2036 16.6 16.6 4,925.5 4,909.0
33 2037 16.6 16.6 4,925.5 4,909.0
34 2038 16.6 16.6 4,925.5 4,909.0
35 2039 16.6 16.6 4,925.5 4,909.0
36 2040 16.6 16.6 4,925.5 4,909.0
(Total at Current) 6,094.3 129,295.3 123,201.0
(Total at PV) 3,706.1 10,954.4 7,248.2
Residual Value of Capital at Current Price : Php 0 NPV : 7,248
Social Discount Rate : 15% B/C : 2.96
EIRR : 30.0%
Sh
ort
-ter
m P
has
eM
ediu
m-t
erm
Ph
ase
Lo
ng
-ter
m P
has
e
Source : The Study Team
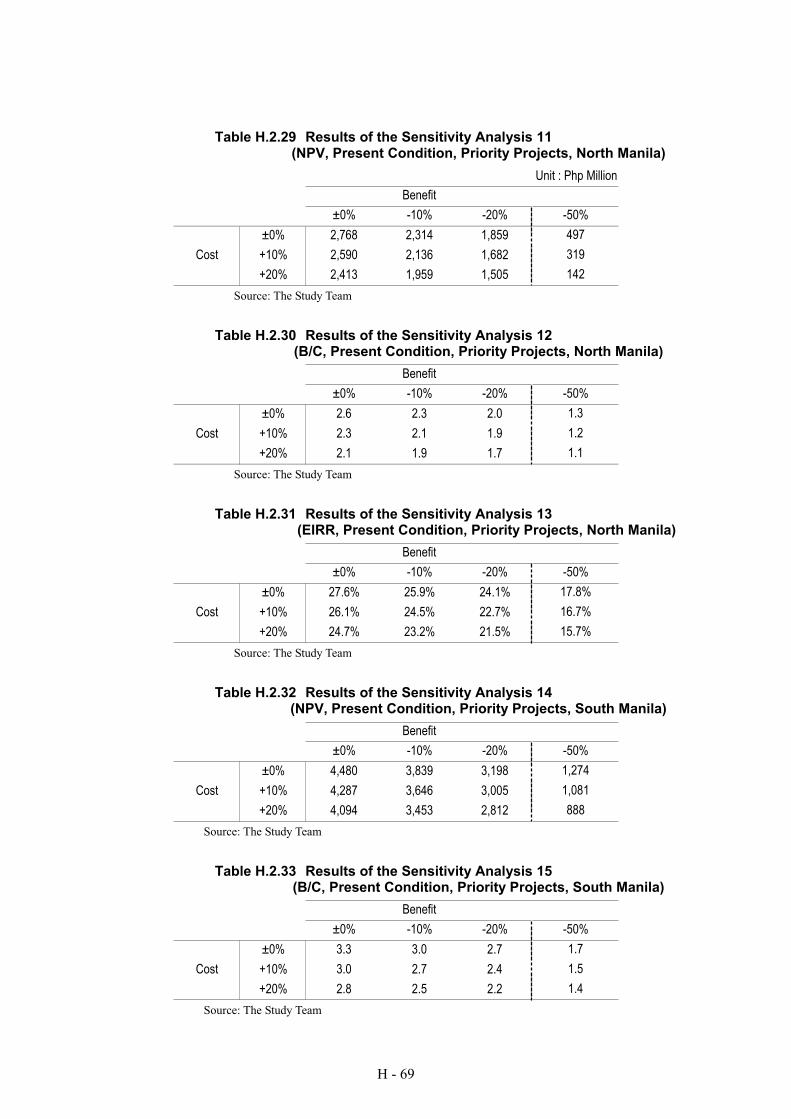
H - 69
Table H.2.29 Results of the Sensitivity Analysis 11 (NPV, Present Condition, Priority Projects, North Manila)
Unit : Php Million
Benefit
±0% -10% -20% -50%
±0% 2,768 2,314 1,859 497
Cost +10% 2,590 2,136 1,682 319
+20% 2,413 1,959 1,505 142
Source: The Study Team
Table H.2.30 Results of the Sensitivity Analysis 12 (B/C, Present Condition, Priority Projects, North Manila)
Benefit
±0% -10% -20% -50%
±0% 2.6 2.3 2.0 1.3
Cost +10% 2.3 2.1 1.9 1.2
+20% 2.1 1.9 1.7 1.1
Source: The Study Team
Table H.2.31 Results of the Sensitivity Analysis 13 (EIRR, Present Condition, Priority Projects, North Manila)
Benefit
±0% -10% -20% -50%
±0% 27.6% 25.9% 24.1% 17.8%
Cost +10% 26.1% 24.5% 22.7% 16.7%
+20% 24.7% 23.2% 21.5% 15.7%
Source: The Study Team
Table H.2.32 Results of the Sensitivity Analysis 14 (NPV, Present Condition, Priority Projects, South Manila)
Benefit
±0% -10% -20% -50%
±0% 4,480 3,839 3,198 1,274
Cost +10% 4,287 3,646 3,005 1,081
+20% 4,094 3,453 2,812 888
Source: The Study Team
Table H.2.33 Results of the Sensitivity Analysis 15 (B/C, Present Condition, Priority Projects, South Manila)
Benefit
±0% -10% -20% -50%
±0% 3.3 3.0 2.7 1.7
Cost +10% 3.0 2.7 2.4 1.5
+20% 2.8 2.5 2.2 1.4
Source: The Study Team
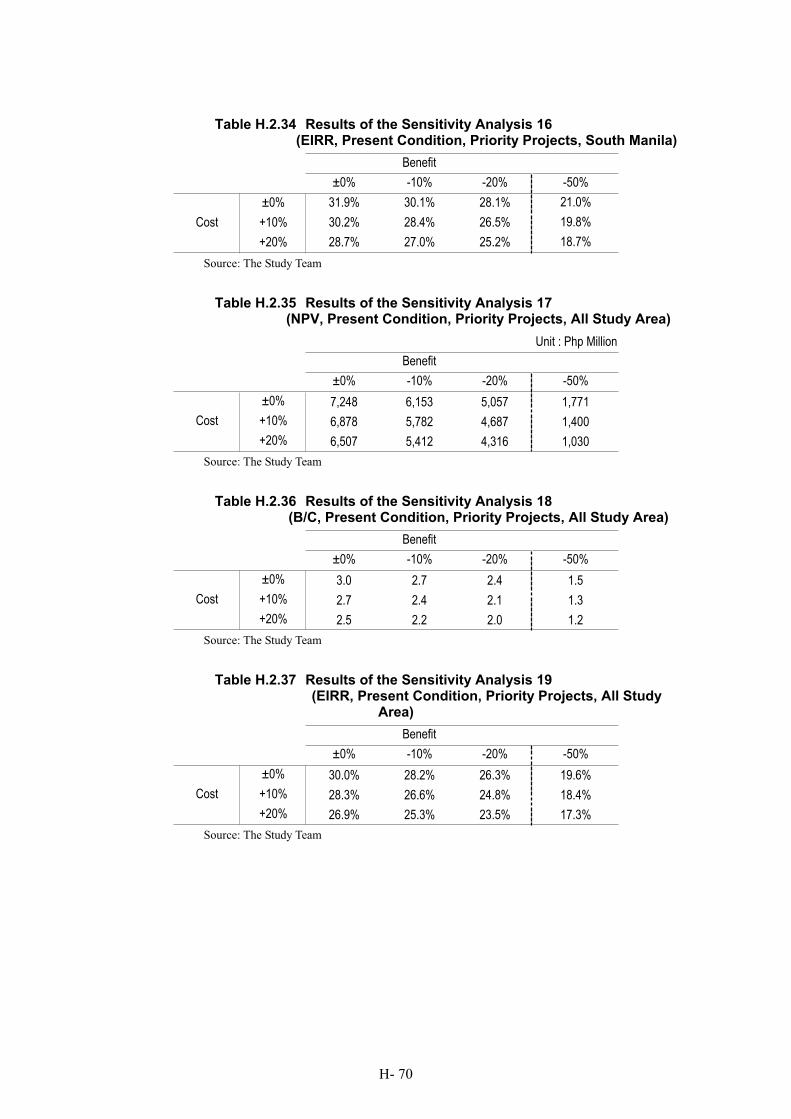
H- 70
Table H.2.34 Results of the Sensitivity Analysis 16 (EIRR, Present Condition, Priority Projects, South Manila)
Benefit
±0% -10% -20% -50%
±0% 31.9% 30.1% 28.1% 21.0%
Cost +10% 30.2% 28.4% 26.5% 19.8%
+20% 28.7% 27.0% 25.2% 18.7%
Source: The Study Team
Table H.2.35 Results of the Sensitivity Analysis 17 (NPV, Present Condition, Priority Projects, All Study Area)
Unit : Php Million
Benefit
±0% -10% -20% -50%
±0% 7,248 6,153 5,057 1,771
Cost +10% 6,878 5,782 4,687 1,400
+20% 6,507 5,412 4,316 1,030
Source: The Study Team
Table H.2.36 Results of the Sensitivity Analysis 18 (B/C, Present Condition, Priority Projects, All Study Area)
Benefit
±0% -10% -20% -50%
±0% 3.0 2.7 2.4 1.5
Cost +10% 2.7 2.4 2.1 1.3
+20% 2.5 2.2 2.0 1.2
Source: The Study Team
Table H.2.37 Results of the Sensitivity Analysis 19 (EIRR, Present Condition, Priority Projects, All Study
Area)
Benefit
±0% -10% -20% -50%
±0% 30.0% 28.2% 26.3% 19.6%
Cost +10% 28.3% 26.6% 24.8% 18.4%
+20% 26.9% 25.3% 23.5% 17.3%
Source: The Study Team
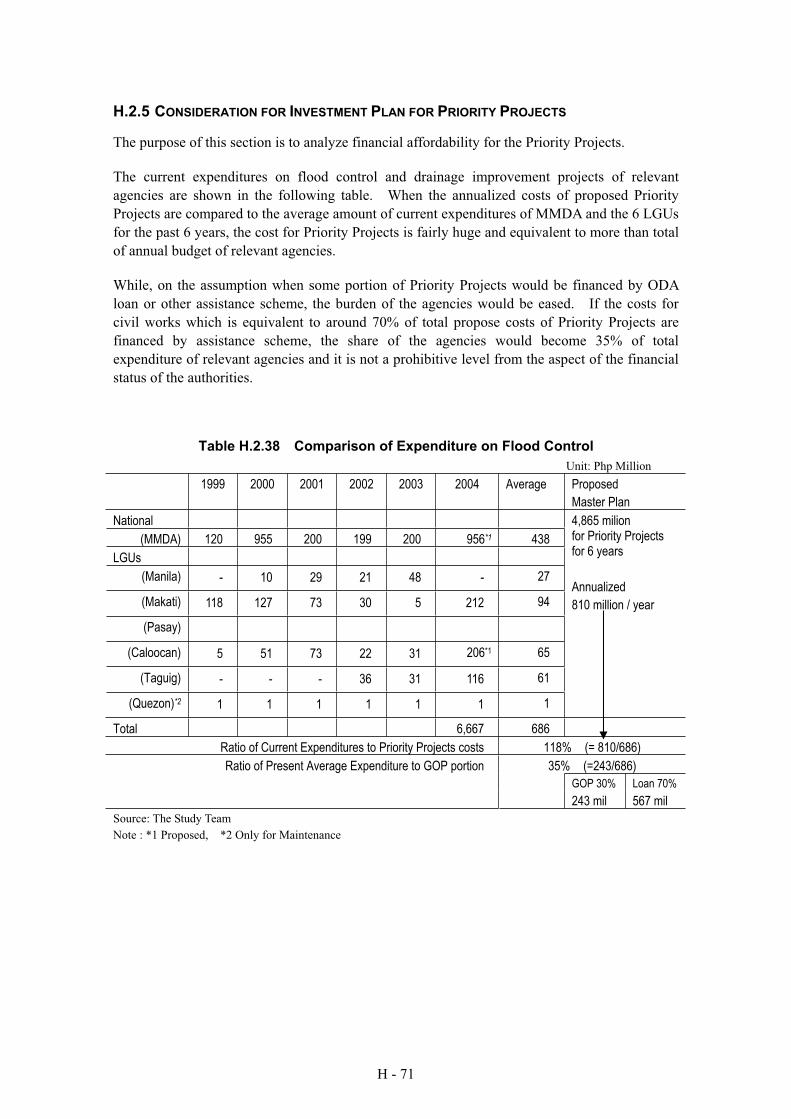
H - 71
H.2.5 CONSIDERATION FOR INVESTMENT PLAN FOR PRIORITY PROJECTS
The purpose of this section is to analyze financial affordability for the Priority Projects.
The current expenditures on flood control and drainage improvement projects of relevant
agencies are shown in the following table. When the annualized costs of proposed Priority
Projects are compared to the average amount of current expenditures of MMDA and the 6 LGUs
for the past 6 years, the cost for Priority Projects is fairly huge and equivalent to more than total
of annual budget of relevant agencies.
While, on the assumption when some portion of Priority Projects would be financed by ODA
loan or other assistance scheme, the burden of the agencies would be eased. If the costs for
civil works which is equivalent to around 70% of total propose costs of Priority Projects are
financed by assistance scheme, the share of the agencies would become 35% of total
expenditure of relevant agencies and it is not a prohibitive level from the aspect of the financial
status of the authorities.
Table H.2.38 Comparison of Expenditure on Flood Control
Unit: Php Million
1999 2000 2001 2002 2003 2004 Average Proposed
Master Plan
National
(MMDA) 120 955 200 199 200 956*1 438
LGUs
(Manila) - 10 29 21 48 - 27
(Makati) 118 127 73 30 5 212 94
(Pasay)
(Caloocan) 5 51 73 22 31 206*1 65
(Taguig) - - - 36 31 116 61
(Quezon)*2 1 1 1 1 1 1 1
4,865 milion for Priority Projects for 6 years
Annualized
810 million / year
Total 6,667 686
Ratio of Current Expenditures to Priority Projects costs 118% (= 810/686)
Ratio of Present Average Expenditure to GOP portion 35% (=243/686)
GOP 30% Loan 70%
243 mil 567 mil
Source: The Study Team
Note : *1 Proposed, *2 Only for Maintenance
H- 72
Reference 1 Detailed Engineering Design of Pasig-Marikina River Channel Improvement Project, Main
Report Volume II, March 2002, DPWH 2 The above schedule was obtained from the assessors’ office of the City of Manila. Since this
schedule was prepared under the coordination with surrounding LGUs based on Presidential
Decree No.921 and Republic Act 7160 known as the Local Government Code of 1991, these
unit costs are subject to same conditions as other LGUs in the study area. 3 Population and Housing Census, NSO, and Detailed Engineering Design of Pasig-Marikina
River Channel Improvement Project, Main Report Volume II, March 2002, DPWH 4 For example, these factors are applied in the following studies.
Final Alternative Master Plan Strategy Report for the Metro-Manila Integrated Urban Drainage
and Flood Control Master Plan, March 1984, DPWH, or
Flood Control Manual, 1993, Canadian International Development Agency (CIDA), or
Economic model for urban watersheds, J. Hyd. Div. Am. Soc. Civ. Engrs., 106, (HY4), April,
475, 1980, T. N. Debo and G. N. Day 5 The factor of agriculture (10%) was not used because there is no agricultural land use in the
study area. The Factor of Highway (25%) was not used because Railroads (23 %) was applied
as a representing factor of Infrastructure from the aspect of conservative evaluation. 6 Contrarily, there is an adverse opinion on including the land enhancement benefit into flood
control benefit. Market price of land does not represent its economic value provided that has
been set in terms of demand and supply in the market, as such no consumption of scarce
resources accrued to the specific project in sight. Further, land prices in urban area tend to be
distorted by speculation in future escalation expected and by social prestige psychologically
attached to the specific land lot; therefore, the land value does not increase in proportion to the
project benefit. The determination of the impact of the project among the land value requires a
detailed survey on the location and structure of the economic environment surrounding the
project.7 Metro Manila Drainage System Rehabilitation Project, Final Report, Drainage Improvement
Plans of Estero de Vitas and other Catchment Areas, March 1986, Ministry of Public Works and
Highways 8 Based on the schedule of market value of land and the city ordinances of each city 9 ICC Project Evaluation procedures and Guidelines, NEDA 10 Technical Standards and Guidelines for Planning and Design, Draft, Volume I : Flood Control,
March 2002, DPWH - JICA 11 ICC Project Evaluation procedures and Guidelines, NEDA 12 Regarding project life span, 30 years is recommended in the guideline “Economic Analysis
for Social Development Study, 13 Flood Control & Sabo”, 2002, JICA 13 ICC Project Evaluation procedures and Guidelines, NEDA 14 In Japan’s guideline and several study reports, it is suggested to add a risk premium onto the
discount rate as another way to reflect uncertainty in long-term and wide-sector analysis of the
project like flood control which reduces the risk by itself. A variation of this is to add a
premium to the discount rate for the benefits, and subtract a premium for the costs.
Introducing these premiums into the calculations of economic evaluation has the effect of giving
less weight to increasingly uncertain costs and benefits in the future. This method, however,
must determine an arbitrary risk premium to add to the discount rate. 15 ICC Project Evaluation procedures and Guidelines, NEDA 16 ditto 17 The acronyms with parentheses hereinafter referred are definition by Department of Budget
and Management. For details, the following publication is convenient for understanding of the
words and basic concept of budgetary system of Philippines, “Frequently Asked Questions –
National Government Budget”, A joint undertaking of the Budget Advocacy Project, Philippine
Governance Forum and the Department of Budget and Management, PH FF 3496 2002 NWB 18 Among outstanding liabilities of the national government of Philippines in the present
H - 73
situations, the most big issue is adjustment of NPC (National Power Corporation)’s financial
loss and its absorption by the government. The burden depends on the appraisal value of the
debt and affects the amortization plan of the government in no small way. 19 Regarding project life span, 30 years is recommended in the guideline “Economic Analysis
for Social Development Study, 13 Flood Control & Sabo”, 2002, JICA 20 In Japan’s guideline and several study reports, it is suggested to add a risk premium onto the
discount rate as another way to reflect uncertainty in long-term and wide-sector analysis of the
project like flood control which reduces the risk by itself. A variation of this is to add a
premium to the discount rate for the benefits, and subtract a premium for the costs.
Introducing these premiums into the calculations of economic evaluation has the effect of giving
less weight to increasingly uncertain costs and benefits in the future. This method, however,
must determine an arbitrary risk premium to add to the discount rate. 21 ICC Project Evaluation procedures and Guidelines, NEDA 22 Ditto