Embed Size (px)
Citation preview

Fardan AlFardanSajeda Salah Shaima AlAnsariZainab Monfaredi
CFA GLOBAL INVESTMENT RESEARCH CHALLENGE
Company :Zain Bahrain Ticker symbol: ZAINBHPrimary Exchange Bahrain Bourse (BHB)
Basic information
12/4/2
014
12/7/2
014
12/10/2
014
12/13/2
014
12/16/2
014
12/19/2
014
12/22/2
014
12/25/2
014
12/28/2
014
12/31/2
014
1/3/2
015
1/6/2
015
1/9/2
015
1/12/2
015
1/15/2
015
1/18/2
0150.198
0.199
0.2
0.201
0.202
0.203
0.204
0.205
PriceC.P
Zain started operations in Bahrain
as MTC2003
Launch EDGE & 3G network
2003
The first nation-wide WIMAX network in
the world2007
Launch the 4G LTE network2013
Business Description
Industry Overview Valuation Financial
AnalysisRisk
Analysis Conclusion
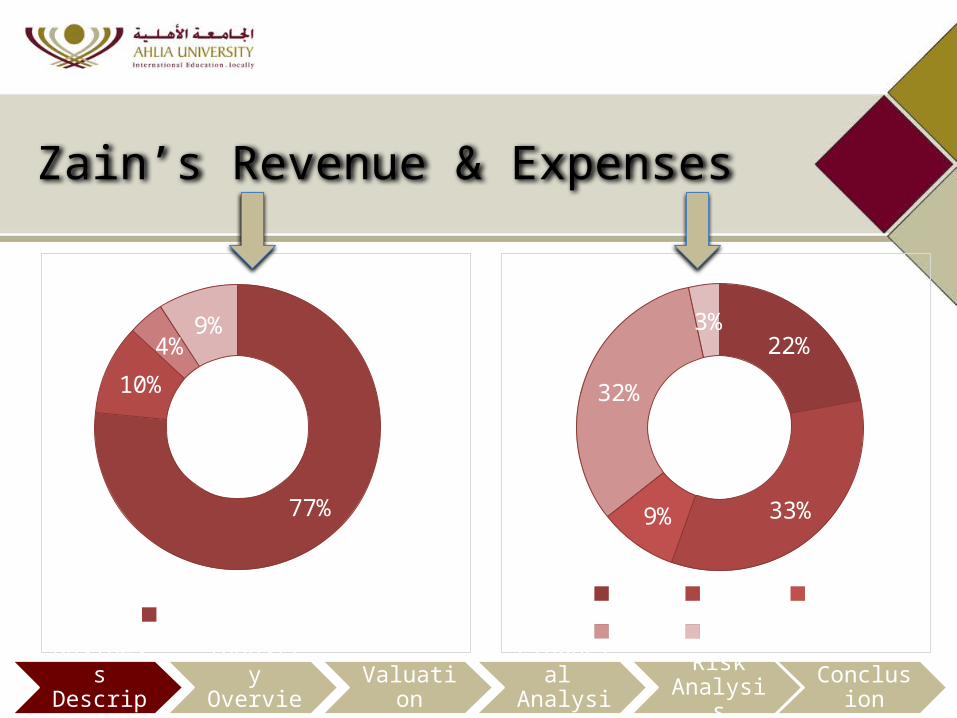
Zain’s Revenue & Expenses
22%
33%9%
32%
3%
COGS DM&O GAD&A other
77%
10%
4%9%
Mobile Fixed Wireless InterconnectionOthers
Business Description
Industry Overview Valuation Financial
AnalysisRisk
Analysis Conclusion
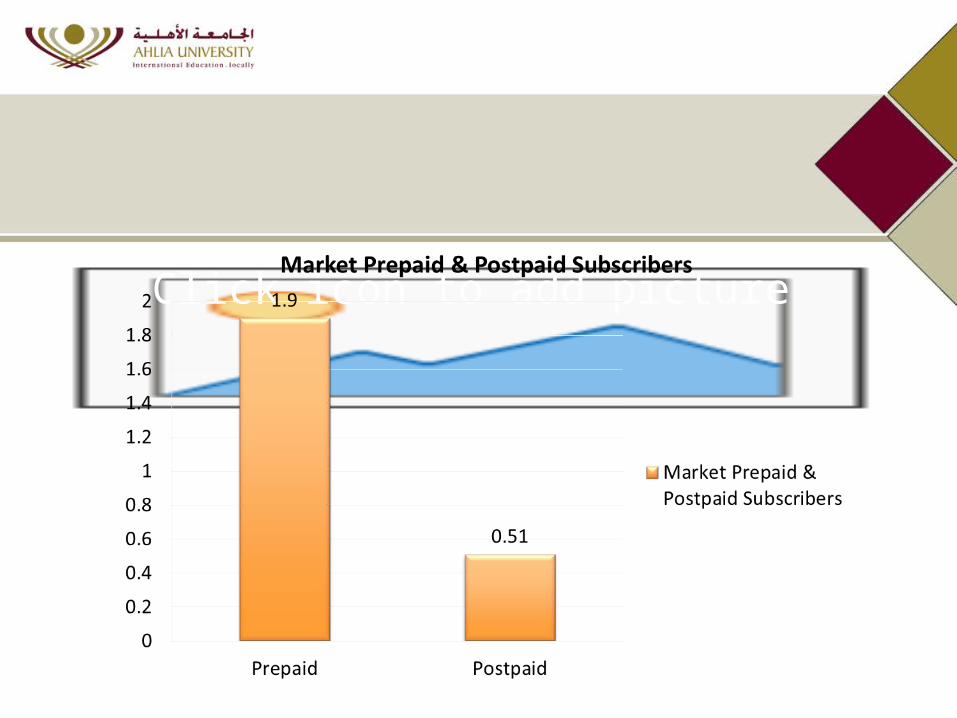
Click icon to add picture
Business Description
Industry Overview Valuation Financial
AnalysisRisk
Analysis Conclusion
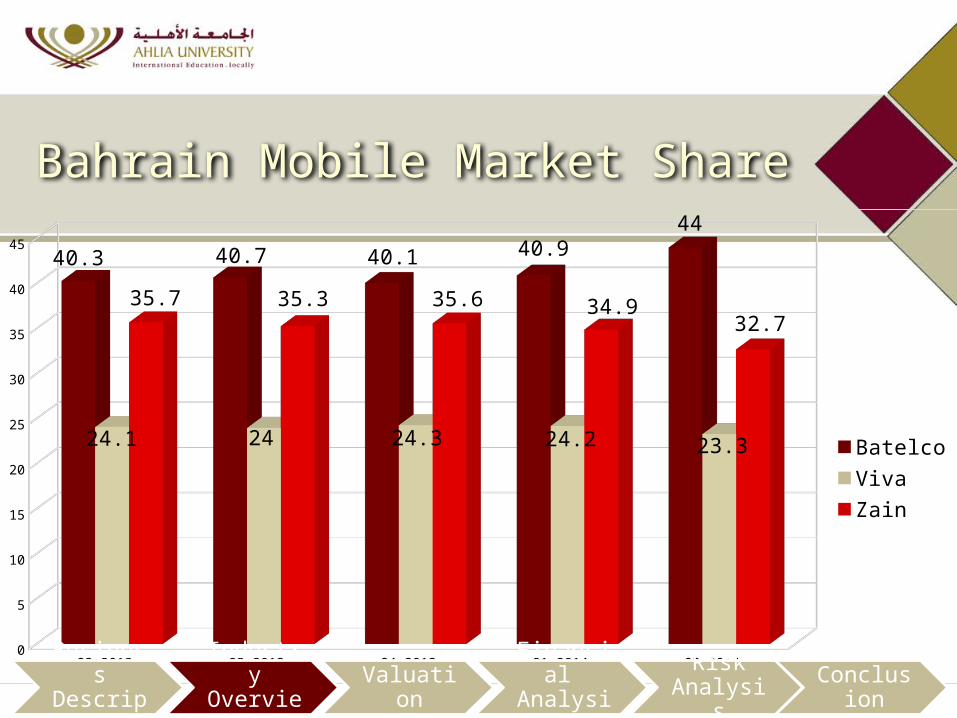
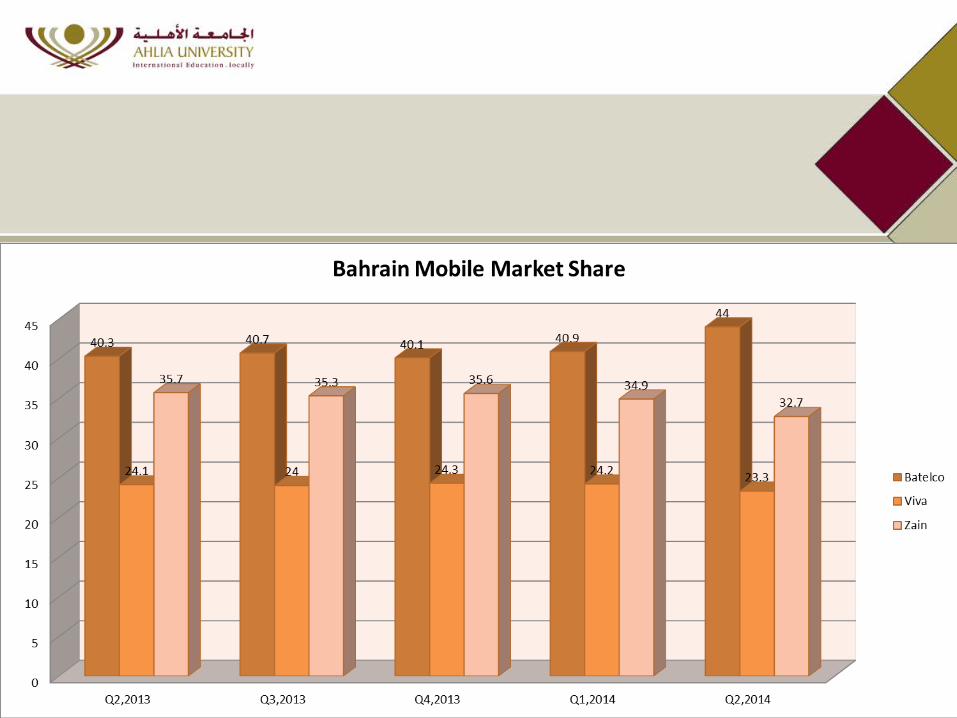
Q2,2013 Q3,2013 Q4,2013 Q1,2014 Q2,20140
5
10
15
20
25
30
35
40
4540.3 40.7 40.1 40.9
44
24.1 24 24.3 24.2 23.3
35.7 35.3 35.6 34.932.7
Batelco Viva
Zain
Bahrain Mobile Market Share
Business Description
Industry Overview Valuation Financial
AnalysisRisk
Analysis Conclusion
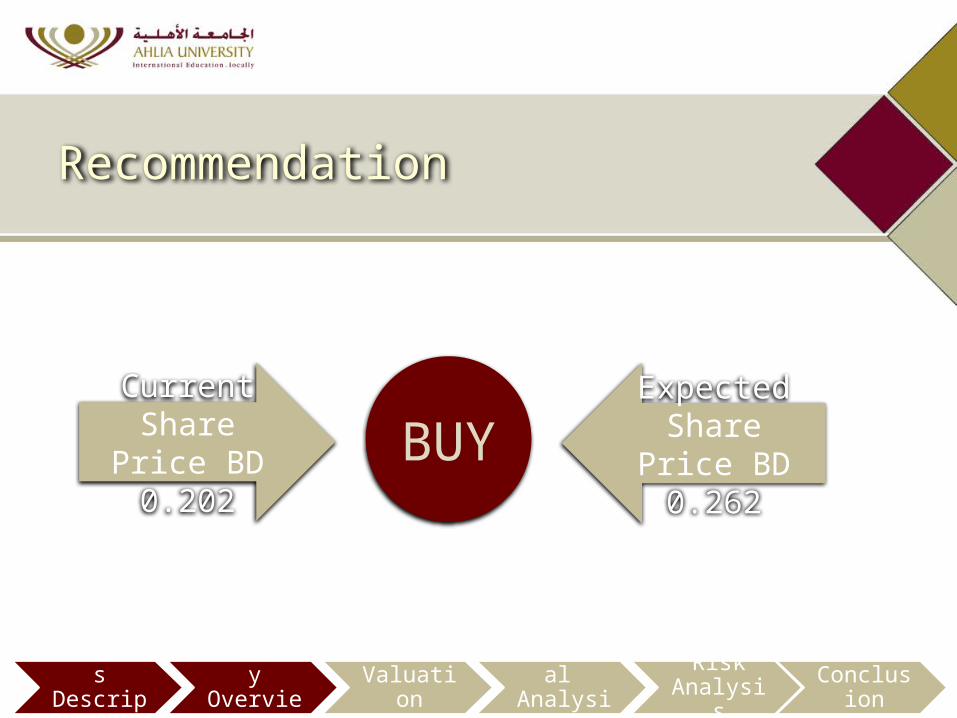
Recommendation
BUYCurrent Share Price BD 0.202
Expected Share Price BD 0.262
Business Description
Industry Overview Valuation Financial
AnalysisRisk
Analysis Conclusion
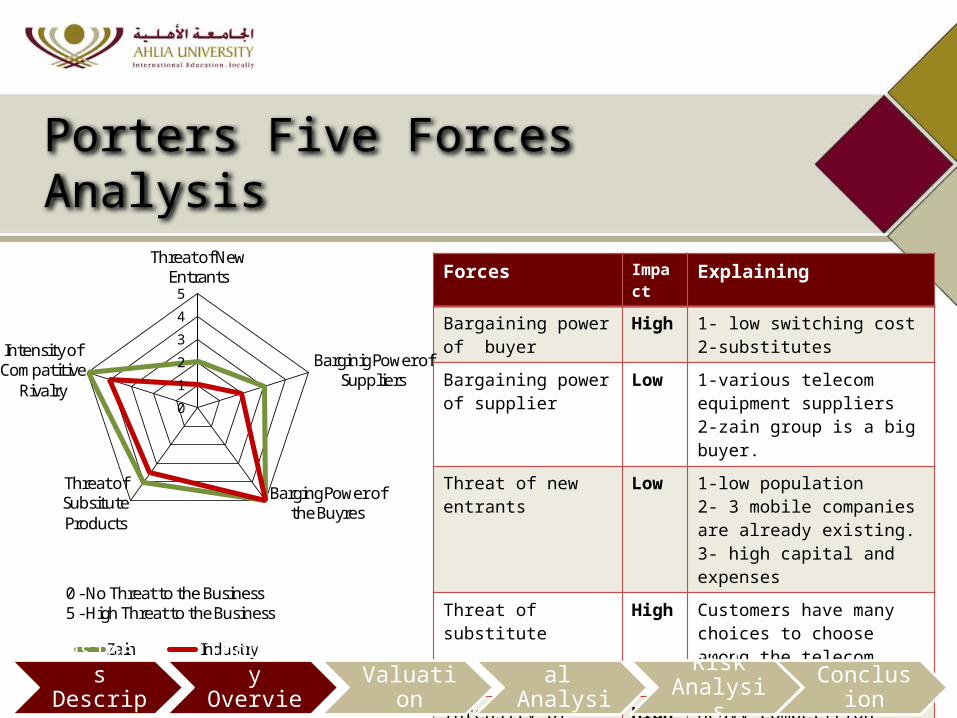
Porters Five Forces Analysis
Forces Impact Explaining
Bargaining power of buyer
High 1- low switching cost 2-substitutes
Bargaining power of supplier
Low 1-various telecom equipment suppliers 2-zain group is a big buyer.
Threat of new entrants Low 1-low population 2- 3 mobile companies are already existing.3- high capital and expenses
Threat of substitute High Customers have many choices to choose among the telecom companies
Intensity of competitive rivalry
High Heavy competition between 3 mobile & non-mobile tele. operators ..
0
1
2
3
4
5
Threat of New Entrants
Barginig Power of Suppliers
Barging Power of the Buyres
Threat of Subsitute Products
Intensity of Compatitive
Rivalry
Zain Industry
0 - No Threat to the Business5 - High Threat to the Business
Business Description
Industry Overview Valuation Financial
AnalysisRisk
Analysis Conclusion
Business Description
Industry Overview Valuation Financial
AnalysisRisk
Analysis Conclusion
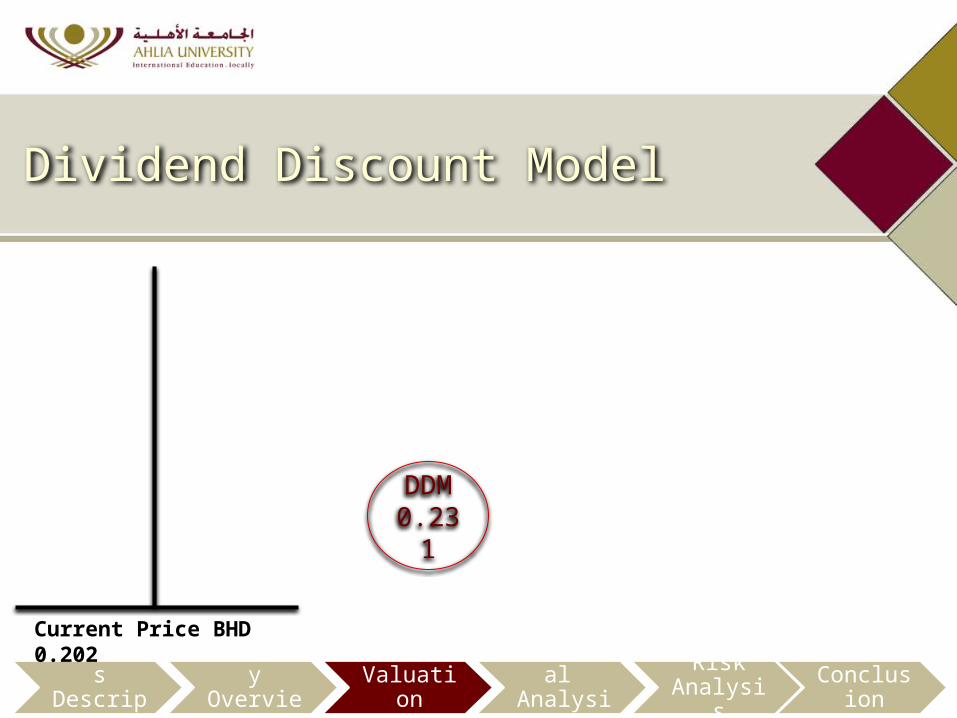
Dividend Discount Model
DDM0.231
Current Price BHD 0.202

Current Price BHD 0.202
Discounted Cash Flow
Business Description
Industry Overview Valuation Financial
AnalysisRisk
Analysis Conclusion
DCF0.295

Price Multiples
Current Price BHD 0.202
PM0.263
Business Description
Industry Overview Valuation Financial
AnalysisRisk
Analysis Conclusion
Business Description
Industry Overview Valuation Financial
AnalysisRisk
Analysis Conclusion
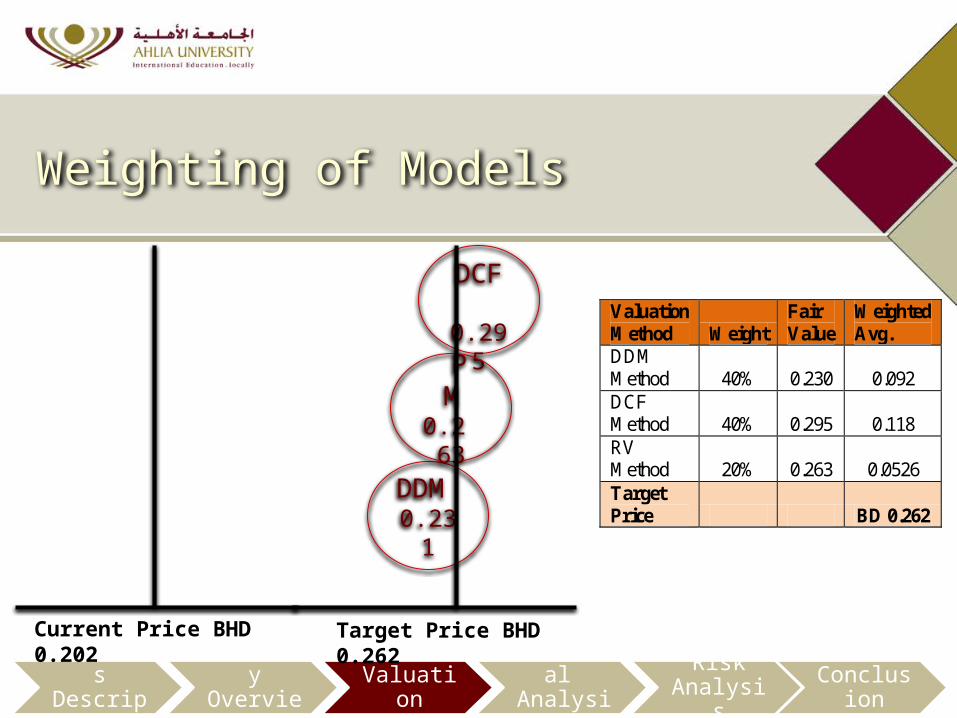
Weighting of Models
Current Price BHD 0.202
Valuation Method Weight
Fair Value
Weighted Avg.
DDM Method 40% 0.230 0.092 DCF Method 40% 0.295 0.118 RV Method 20% 0.263 0.0526 Target Price BD 0.262
DDM 0.231
DCF 0.295
P M0.2 63
Target Price BHD 0.262
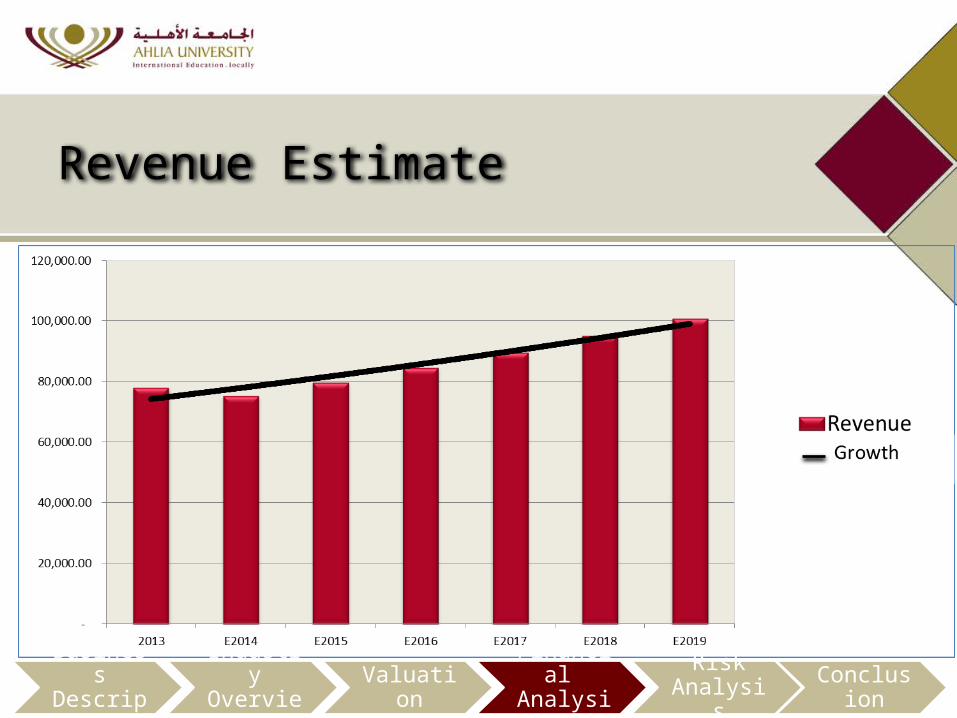
Revenue Estimate
Business Description
Industry Overview Valuation Financial
AnalysisRisk
Analysis Conclusion
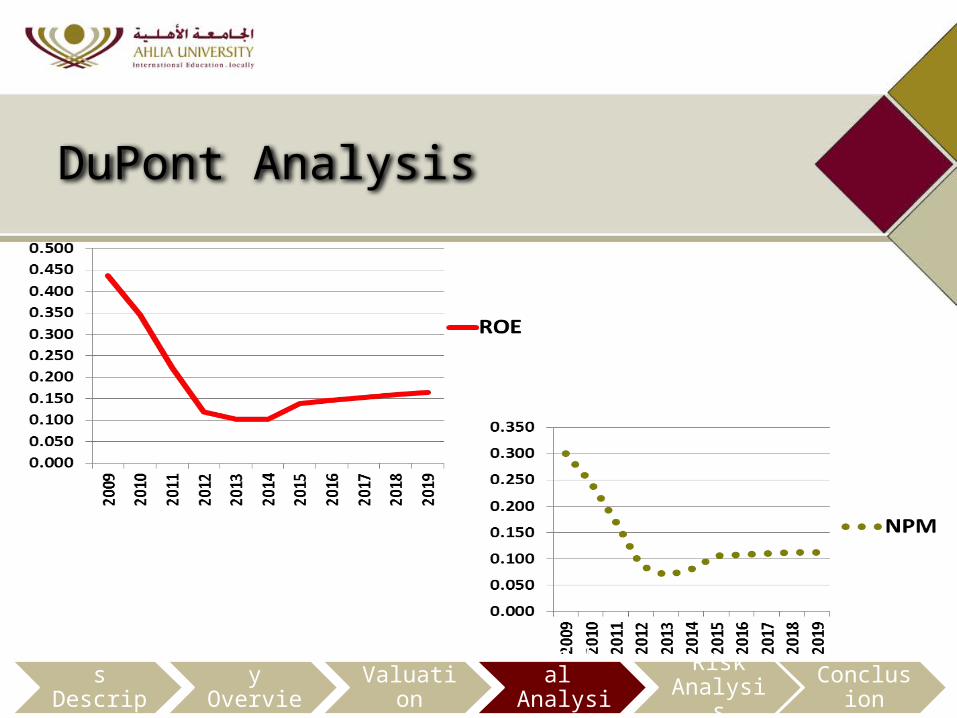
DuPont Analysis
Business Description
Industry Overview Valuation Financial
AnalysisRisk
Analysis Conclusion
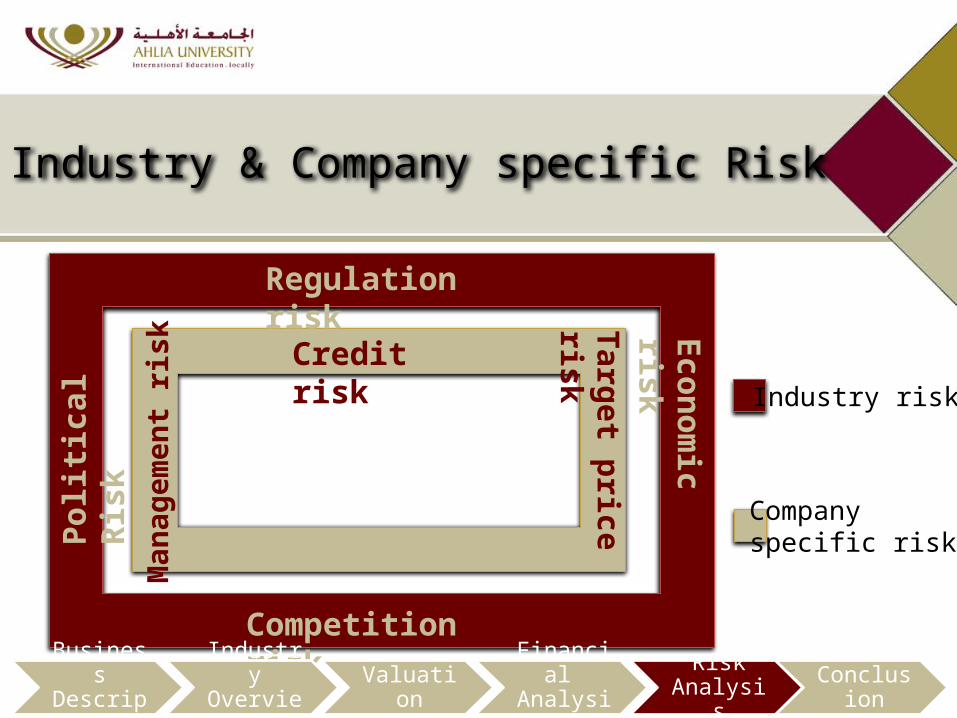
Industry & Company specific Risk
Po
liti
cal
Ris
k
Regulation riskE
con
om
ic risk
Competition risk
Credit risk
Man
agem
ent
risk
Targ
et p
rice
risk
Company specific risk
Industry risk
Business Description
Industry Overview Valuation Financial
AnalysisRisk
Analysis Conclusion
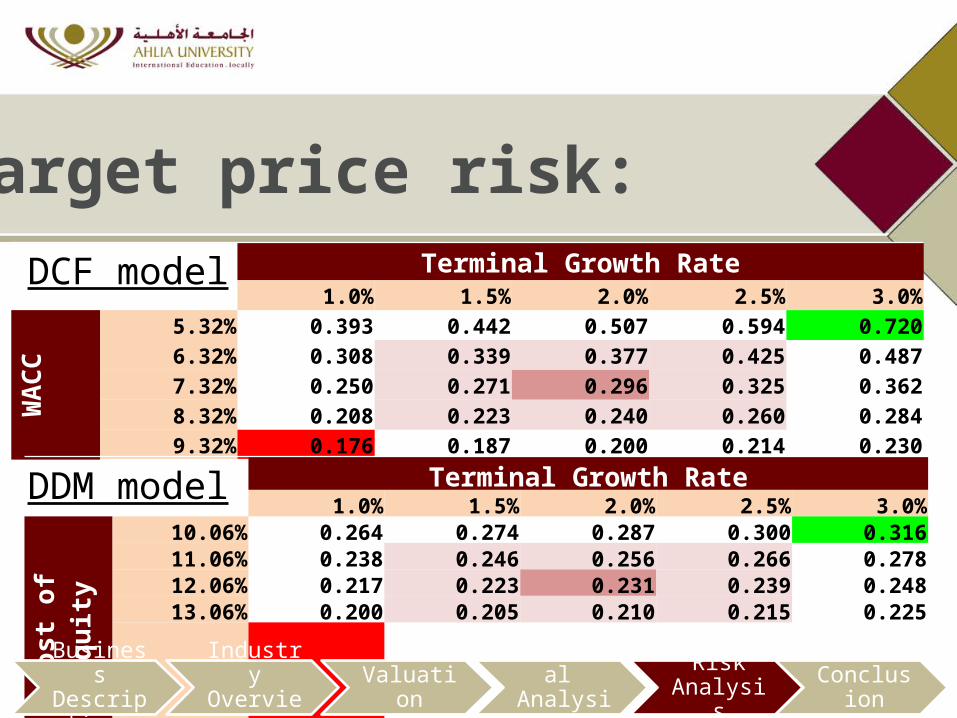
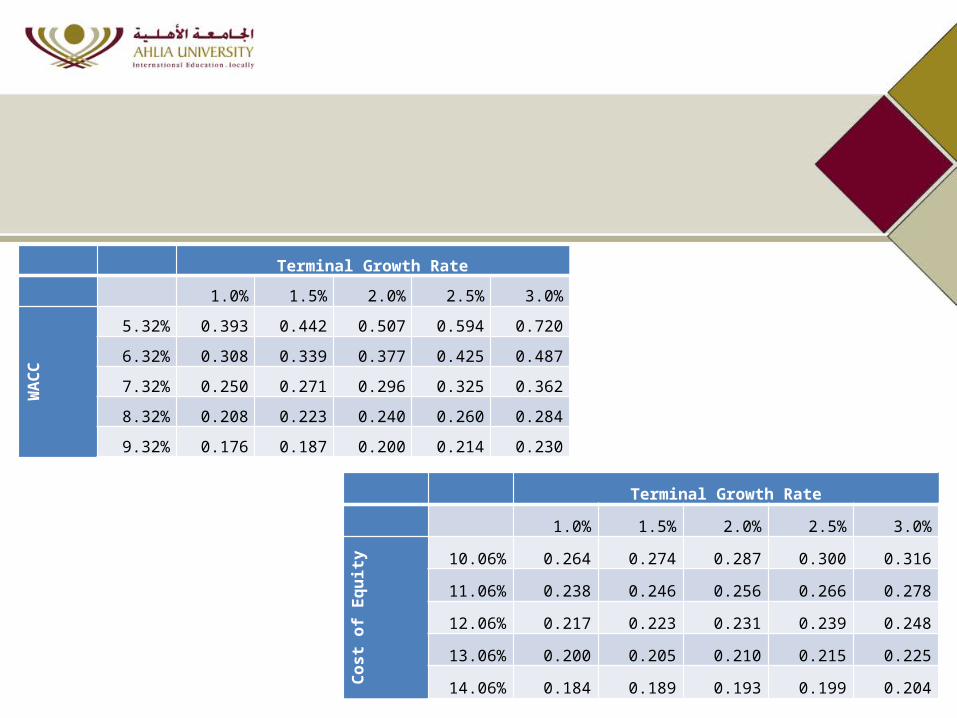
Terminal Growth Rate1.0% 1.5% 2.0% 2.5% 3.0%
WACC
5.32% 0.393 0.442 0.507 0.594 0.7206.32% 0.308 0.339 0.377 0.425 0.4877.32% 0.250 0.271 0.296 0.325 0.3628.32% 0.208 0.223 0.240 0.260 0.2849.32% 0.176 0.187 0.200 0.214 0.230
Target price risk:
DCF model
Terminal Growth Rate1.0% 1.5% 2.0% 2.5% 3.0%
Cost of Equity
10.06% 0.264 0.274 0.287 0.300 0.31611.06% 0.238 0.246 0.256 0.266 0.27812.06% 0.217 0.223 0.231 0.239 0.24813.06% 0.200 0.205 0.210 0.215 0.22514.06% 0.184 0.189 0.193 0.199 0.204
DDM model
Business Description
Industry Overview Valuation Financial
AnalysisRisk
Analysis Conclusion
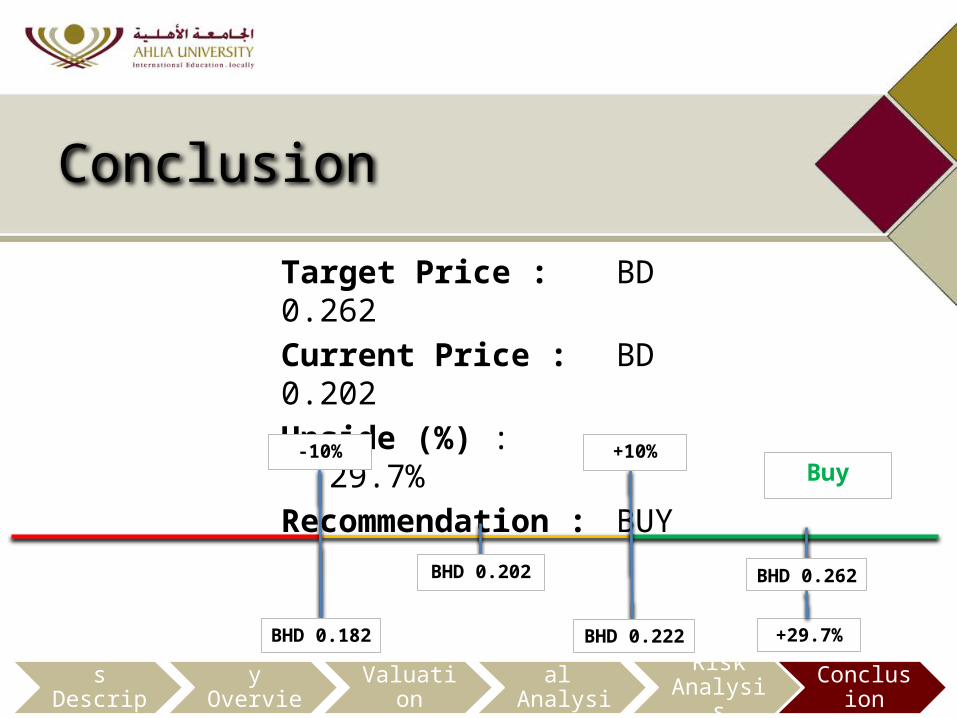
Conclusion
Business Description
Industry Overview Valuation Financial
AnalysisRisk
Analysis Conclusion
Target Price : BD 0.262 Current Price : BD 0.202 Upside (%) : 29.7% Recommendation : BUY
BHD 0.202
+10%-10%
BHD 0.222BHD 0.182
Buy
BHD 0.262
+29.7%
APPENDIX
Income Statement
Balance Sheet
Cash Flow
Div. Cash Flow
Financial Ratios
Tele. of Bahrain
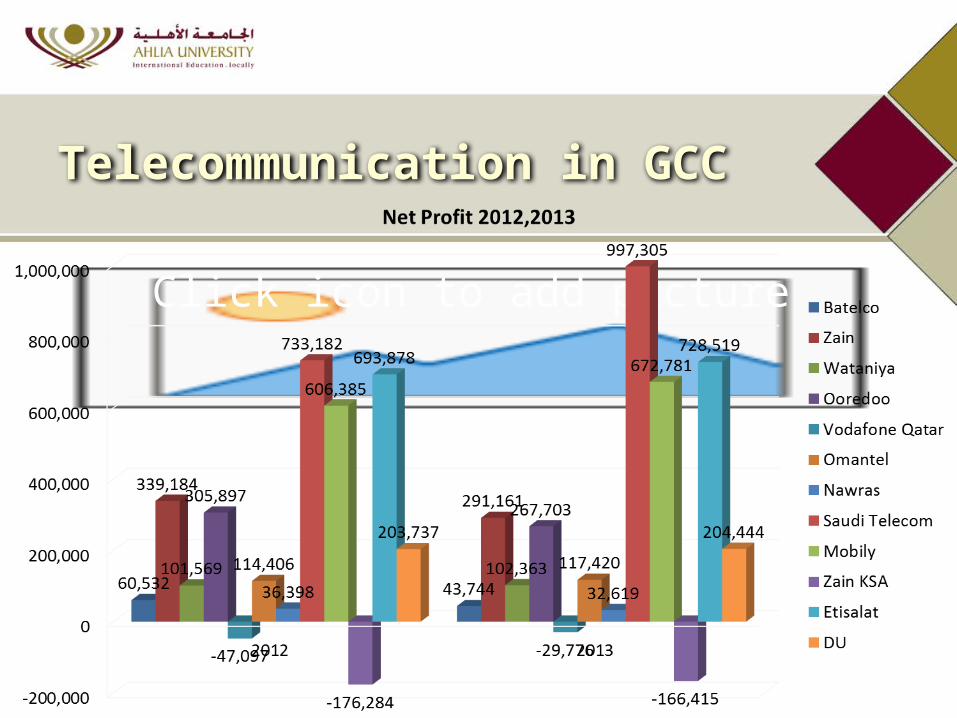
Tele. in GCC
Valuation Tables
Regression
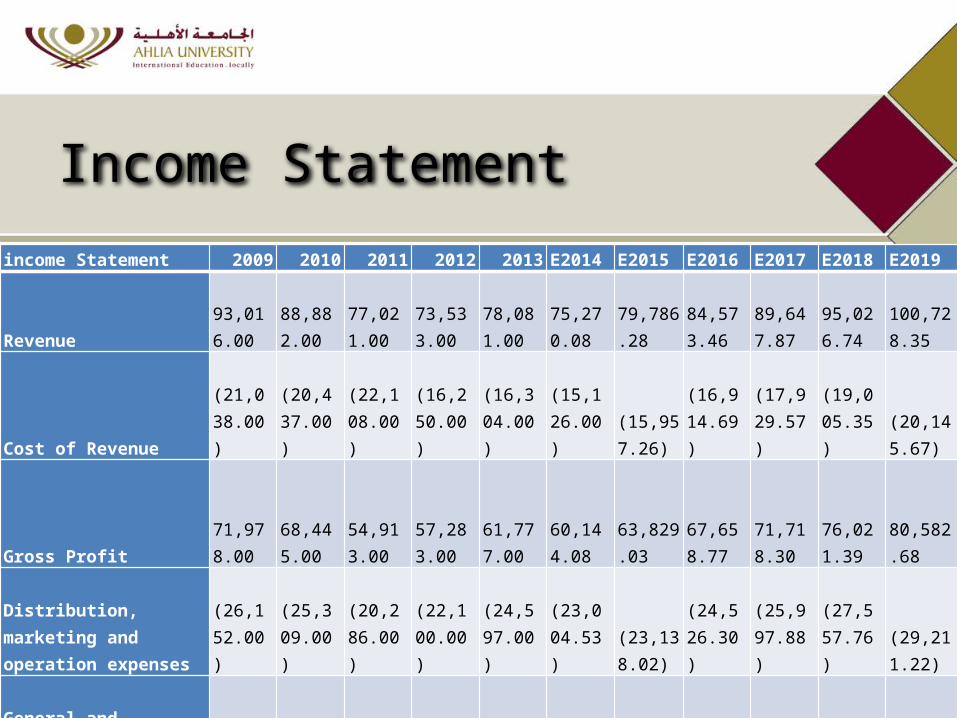
income Statement 2009 2010 2011 2012 2013 E2014 E2015 E2016 E2017 E2018 E2019
Revenue
93,016.00
88,882.00
77,021.00
73,533.00
78,081.00
75,270.08
79,786.28
84,573.46
89,647.87
95,026.74
100,728.35
Cost of Revenue
(21,038.00)
(20,437.00)
(22,108.00)
(16,250.00)
(16,304.00)
(15,126.00)
(15,957.26)
(16,914.69)
(17,929.57)
(19,005.35)
(20,145.67)
Gross Profit
71,978.00
68,445.00
54,913.00
57,283.00
61,777.00
60,144.08
63,829.03
67,658.77
71,718.30
76,021.39
80,582.68
Distribution, marketing and operation expenses
(26,152.00)
(25,309.00)
(20,286.00)
(22,100.00)
(24,597.00)
(23,004.53)
(23,138.02)
(24,526.30)
(25,997.88)
(27,557.76)
(29,211.22)
General and administrative expenses
(7,312.00)
(7,255.00)
(4,601.00)
(6,492.00)
(6,225.00)
(6,083.38)
(6,382.90)
(6,765.88)
(7,171.83)
(7,602.14)
(8,058.27)
Depreciation and amortization
(10,450.00)
(14,175.00)
(15,770.00)
(20,877.00)
(24,320.00)
(22,144.97)
(23,935.89)
(25,372.04)
(26,894.36)
(28,508.02)
(30,218.50)
Income Statement

Provisions for doubtful debts
(388.00)
(295.00)
(2,013.00)
(1,336.00)
(1,513.00)
(1,389.13)
(1,595.73)
(1,691.47)
(1,792.96)
(1,900.53)
(2,014.57)
Provision for inventories (24.00)
(24.00)
(72.00)
(72.00)
(120.00)
(211.00)
(87.76)
(93.03)
(98.61)
(104.53)
(110.80)
Operation Profit
27,652.00
21,387.00
12,171.00
6,406.00
5,002.00
7,311.07
8,688.73
9,210.05
9,762.65
10,348.41
10,969.32
Interest income 343.00
287.00
144.00
27.00
8.00
40.00
42.40
44.94
47.64
50.50
53.53
Other income 297.00
31.00
489.00
8.00
610.00
163.00
167.55
177.60
188.26
199.56
211.53
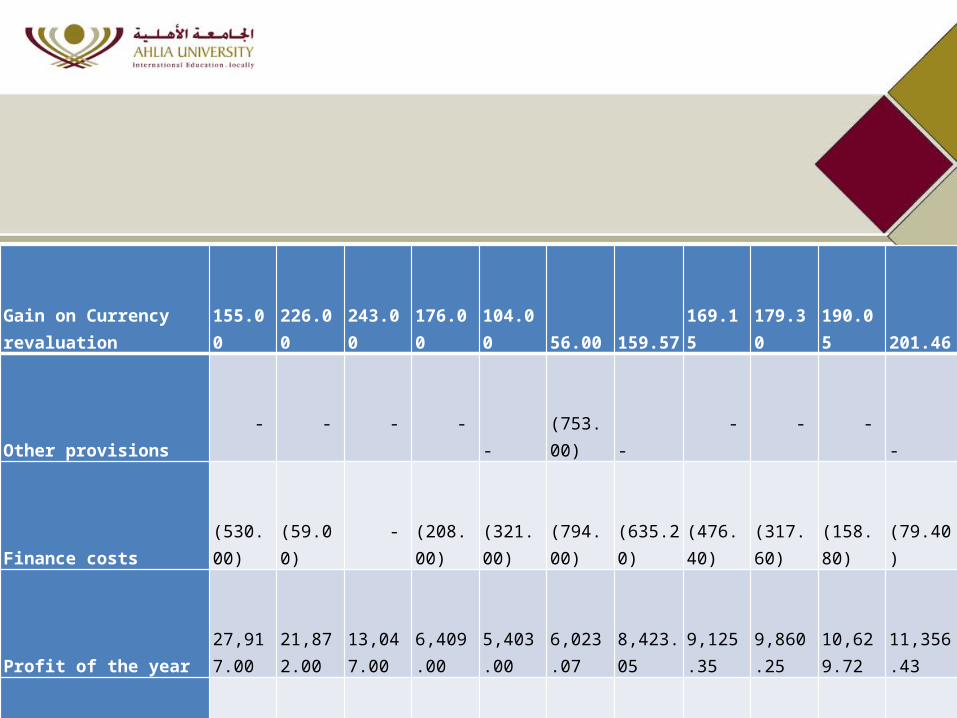
Gain on Currency revaluation
155.00
226.00
243.00
176.00
104.00
56.00
159.57
169.15
179.30
190.05
201.46
Other provisions -
-
-
-
-
(753.00)
-
-
-
-
-
Finance costs (530.00)
(59.00)
-
(208.00)
(321.00)
(794.00)
(635.20)
(476.40)
(317.60)
(158.80)
(79.40)
Profit of the year
27,917.00
21,872.00
13,047.00
6,409.00
5,403.00
6,023.07
8,423.05
9,125.35
9,860.25
10,629.72
11,356.43
Total Comprehensive income of the year
27,917.00
21,872.00
13,047.00
6,409.00
5,403.00
6,023.07
8,423.05
9,125.35
9,860.25
10,629.72
11,356.43
0.0872
0.0684
0.0408
0.0200
0.0169
0.0164
0.0229
0.0248
0.0268
0.0289
0.0309
Basic earnings per share (In Fils)
872.00
684.00
408.00
200.00
169.00
75.29
105.29
114.07
123.25
132.87
141.96
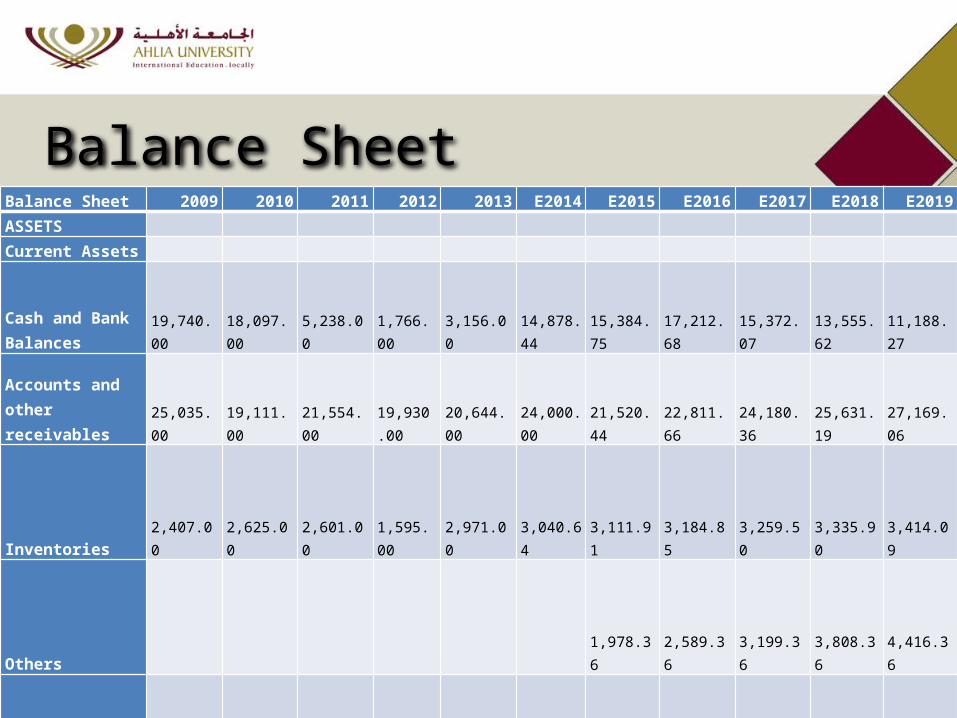
Balance Sheet 2009 2010 2011 2012 2013 E2014 E2015 E2016 E2017 E2018 E2019ASSETS
Current Assets
Cash and Bank Balances
19,740.00
18,097.00
5,238.00
1,766.00
3,156.00
14,878.44
15,384.75
17,212.68
15,372.07
13,555.62
11,188.27
Accounts and other receivables
25,035.00
19,111.00
21,554.00
19,930.00
20,644.00
24,000.00
21,520.44
22,811.66
24,180.36
25,631.19
27,169.06
Inventories 2,407.00
2,625.00
2,601.00
1,595.00
2,971.00
3,040.64
3,111.91
3,184.85
3,259.50
3,335.90
3,414.09
Others 1,978.36
2,589.36
3,199.36
3,808.36
4,416.36
Total Current Assets 47,182.00
39,833.00
29,393.00
23,291.00
26,771.00
41,919.08
41,995.45
45,798.56
46,011.29
46,331.07
46,187.78
Non-Current Assets
Property Plant and Equipment
41,139.00
46,309.00
49,848.00
53,310.00
61,367.00
60,181.77
57,241.42
52,688.44
49,951.41
44,991.18
37,967.38
Intangible assets 7,754.00
8,096.00
10,155.00
15,412.00
19,166.00
20,372.26
22,542.03
26,374.68
32,174.09
40,290.60
51,127.85
Total Non-Current Assets
48,893.00
54,405.00
60,003.00
68,722.00
80,533.00
80,554.03
79,783.45
79,063.12
82,125.50
85,281.78
89,095.23
Total Assets 96,075.00
94,238.00
89,396.00
92,013.00
107,304.00
122,473.11
121,778.90
124,861.67
128,136.79
131,612.85
135,283.01
Balance Sheet
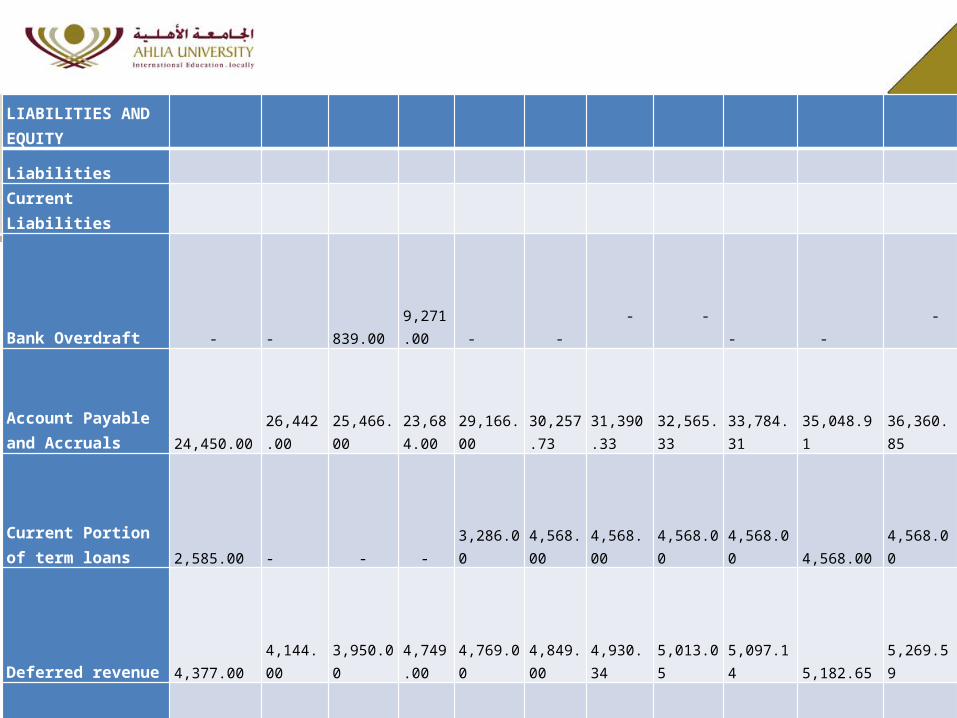
LIABILITIES AND EQUITY
Liabilities
Current Liabilities
Bank Overdraft -
-
839.00
9,271.00
-
-
-
-
-
-
-
Account Payable and Accruals
24,450.00
26,442.00
25,466.00
23,684.00
29,166.00
30,257.73
31,390.33
32,565.33
33,784.31
35,048.91
36,360.85
Current Portion of term loans
2,585.00
-
-
-
3,286.00
4,568.00
4,568.00
4,568.00
4,568.00
4,568.00
4,568.00
Deferred revenue 4,377.00
4,144.00
3,950.00
4,749.00
4,769.00
4,849.00
4,930.34
5,013.05
5,097.14
5,182.65
5,269.59
Finance Lease Obligations
127.00
-
-
-
-
-
-
-
-
-
-
Total Current Liabilities
31,539.00
30,586.00
30,255.00
37,704.00
37,221.00
39,674.73
40,888.68
42,146.38
43,449.45
44,799.56
46,198.44
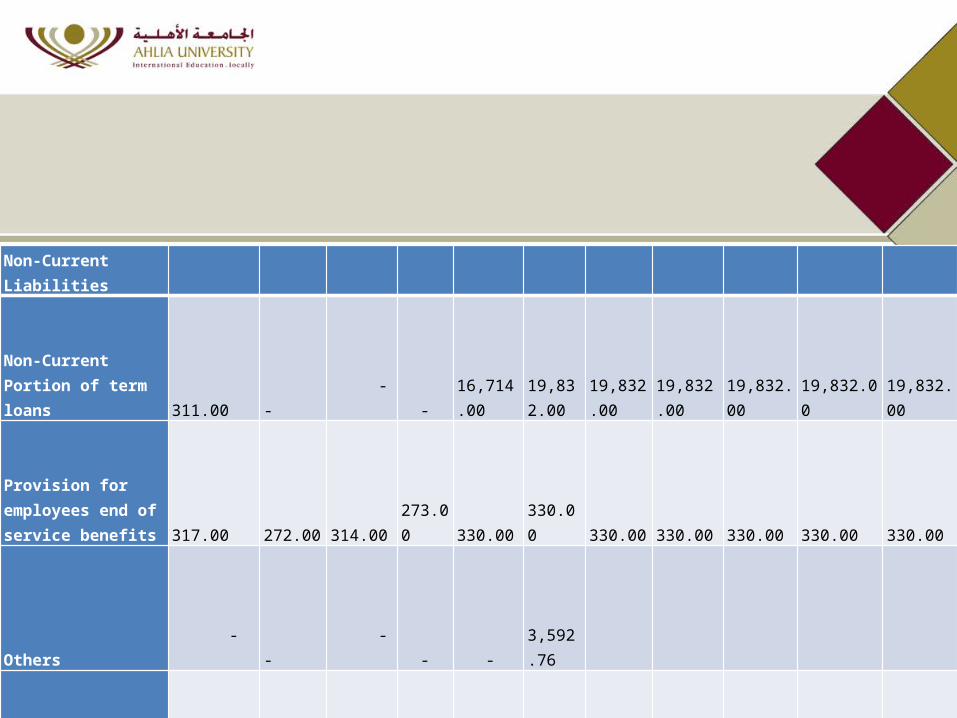
Non-Current Liabilities
Non-Current Portion of term loans
311.00
-
-
-
16,714.00
19,832.00
19,832.00
19,832.00
19,832.00
19,832.00
19,832.00
Provision for employees end of service benefits
317.00
272.00
314.00
273.00
330.00
330.00
330.00
330.00
330.00
330.00
330.00
Others -
-
-
-
-
3,592.76
Total Non-Current Liabilities
628.00
272.00
314.00
273.00
17,044.00
23,754.76
20,162.00
20,162.00
20,162.00
20,162.00
20,162.00
Total Liabilities 32,167.00
30,858.00
30,569.00
37,977.00
54,265.00
63,429.49
61,050.68
62,308.38
63,611.45
64,961.56
66,360.44
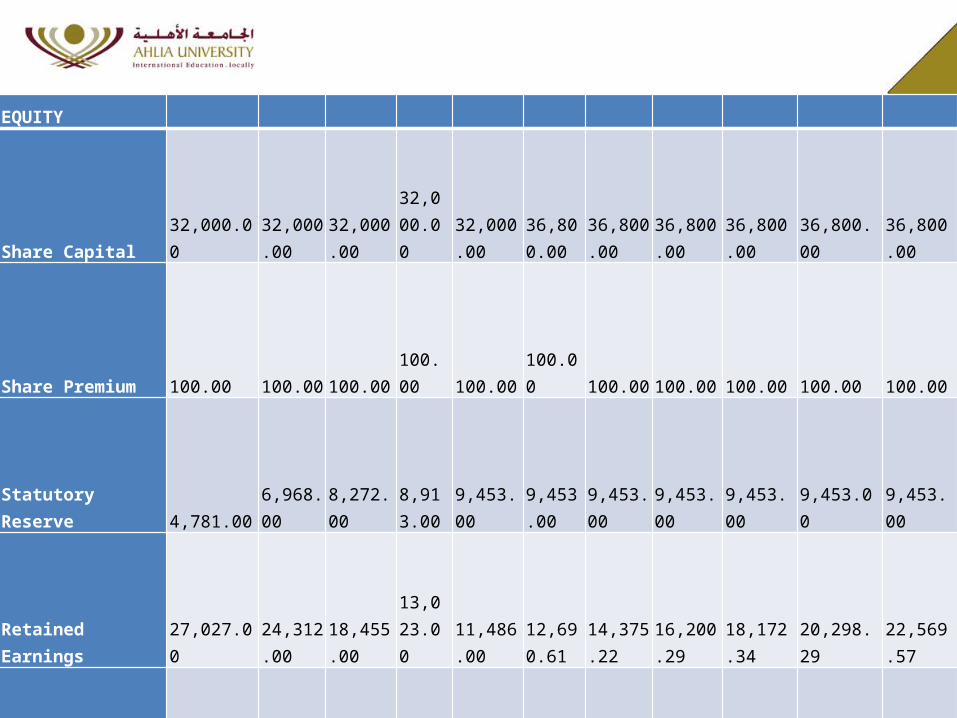
EQUITY
Share Capital 32,000.00
32,000.00
32,000.00
32,000.00
32,000.00
36,800.00
36,800.00
36,800.00
36,800.00
36,800.00
36,800.00
Share Premium 100.00
100.00
100.00
100.00
100.00
100.00
100.00
100.00
100.00
100.00
100.00
Statutory Reserve 4,781.00
6,968.00
8,272.00
8,913.00
9,453.00
9,453.00
9,453.00
9,453.00
9,453.00
9,453.00
9,453.00
Retained Earnings 27,027.00
24,312.00
18,455.00
13,023.00
11,486.00
12,690.61
14,375.22
16,200.29
18,172.34
20,298.29
22,569.57
Total Equity 63,908.00
63,380.00
58,827.00
54,036.00
53,039.00
59,043.61
60,728.22
62,553.29
64,525.34
66,651.29
68,922.57
Total Liabilities and Equity
96,075.00
94,238.00
89,396.00
92,013.00
107,304.00
122,473.11
121,778.90
124,861.67
128,136.79
131,612.85
135,283.01
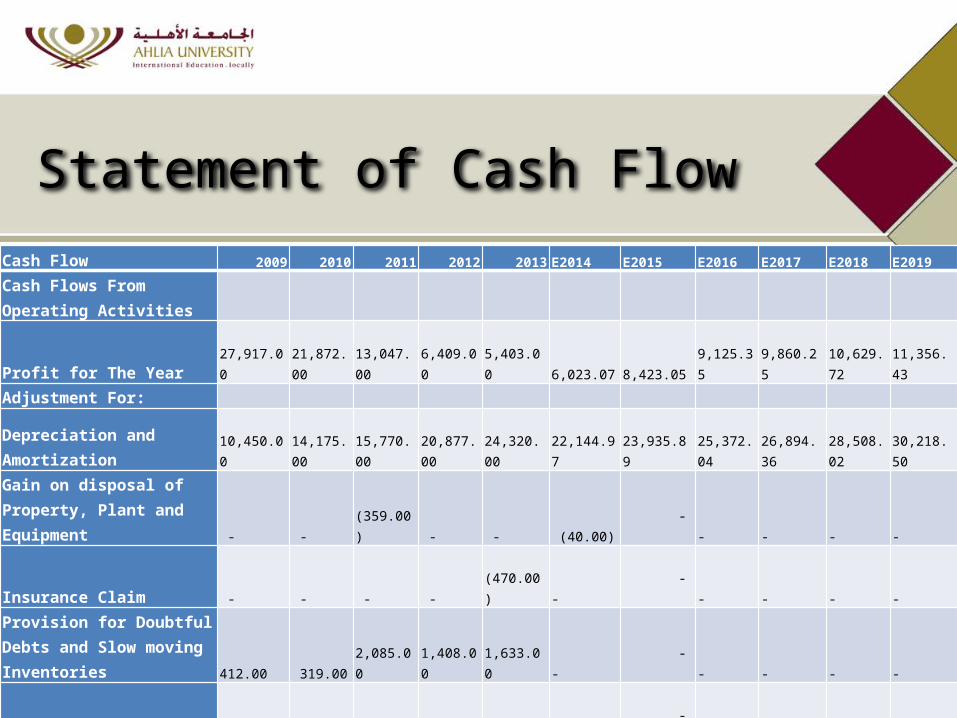
Cash Flow 2009 2010 2011 2012 2013 E2014 E2015 E2016 E2017 E2018 E2019
Cash Flows From Operating Activities
Profit for The Year 27,917.00 21,872.00
13,047.00
6,409.00
5,403.00 6,023.07 8,423.05
9,125.35
9,860.25
10,629.72
11,356.43
Adjustment For:
Depreciation and Amortization 10,450.00 14,175.00
15,770.00
20,877.00
24,320.00 22,144.97 23,935.89
25,372.04
26,894.36
28,508.02
30,218.50
Gain on disposal of Property, Plant and Equipment - -
(359.00) - -
(40.00) - - - - -
Insurance Claim - - - - (470.00) - - - - - -
Provision for Doubtful Debts and Slow moving Inventories 412.00
319.00
2,085.00
1,408.00
1,633.00 - - - - - -
Finance Costs 530.00 59.00 -
208.00
321.00 - - - - - -
Interest income (343.00)
(287.00)
(144.00)
(27.00)
(8.00) - - - - - -
Provision for employees end of service benefits 89.00
150.00
81.00
78.00
62.00 - - - - - -
Loss on Property, Plant and Equipment written off - - - -
65.00 - - - - - -
Statement of Cash Flow
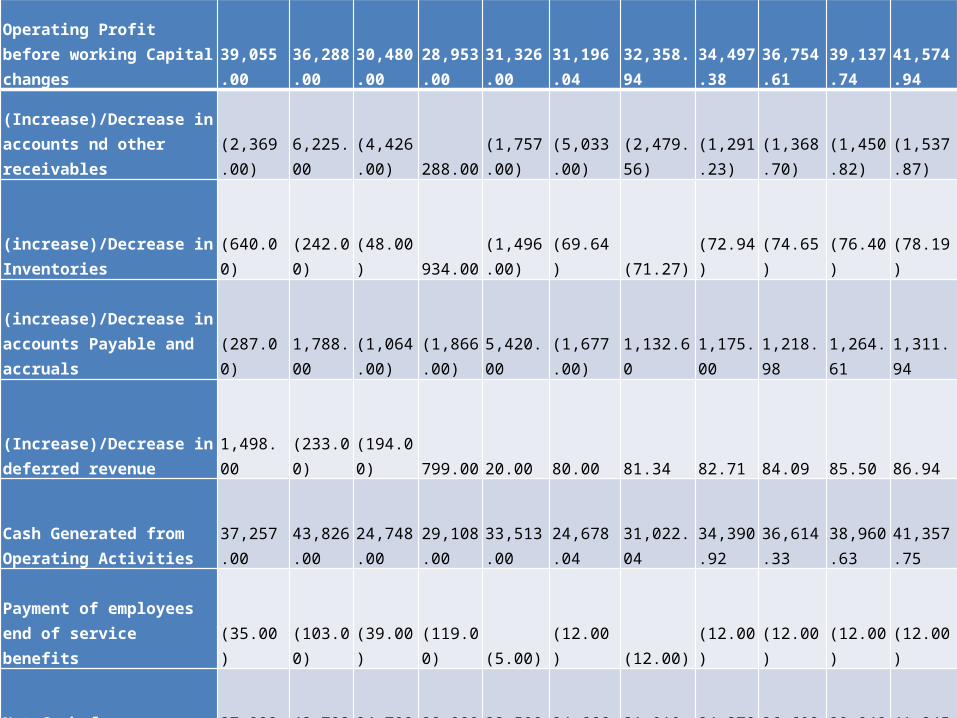
Operating Profit before working Capital changes
39,055.00
36,288.00
30,480.00
28,953.00
31,326.00
31,196.04
32,358.94
34,497.38
36,754.61
39,137.74
41,574.94
(Increase)/Decrease in accounts nd other receivables
(2,369.00)
6,225.00
(4,426.00)
288.00
(1,757.00)
(5,033.00)
(2,479.56)
(1,291.23)
(1,368.70)
(1,450.82)
(1,537.87)
(increase)/Decrease in Inventories
(640.00)
(242.00)
(48.00)
934.00
(1,496.00)
(69.64)
(71.27)
(72.94)
(74.65)
(76.40)
(78.19)
(increase)/Decrease in accounts Payable and accruals
(287.00)
1,788.00
(1,064.00)
(1,866.00)
5,420.00
(1,677.00)
1,132.60
1,175.00
1,218.98
1,264.61
1,311.94
(Increase)/Decrease in deferred revenue
1,498.00
(233.00)
(194.00)
799.00
20.00
80.00
81.34
82.71
84.09
85.50
86.94
Cash Generated from Operating Activities
37,257.00
43,826.00
24,748.00
29,108.00
33,513.00
24,678.04
31,022.04
34,390.92
36,614.33
38,960.63
41,357.75
Payment of employees end of service benefits
(35.00)
(103.00)
(39.00)
(119.00)
(5.00)
(12.00)
(12.00)
(12.00)
(12.00)
(12.00)
(12.00)
Net Cash from Operating Activities
37,222.00
43,723.00
24,709.00
28,989.00
33,508.00
24,666.04
31,010.04
34,378.92
36,602.33
38,948.63
41,345.75

Cash Flow From Investing Activities
Purchase of Property, Plant and Equipment
(9,522.00)
(15,182.00)
(13,824.00)
(13,230.00)
(18,875.00)
(11,628.00)
(11,046.60)
(10,715.20)
(13,929.76)
(13,233.27)
(12,836.28)
Proceeds from disposal of Property, plant and equipment
3.00
-
-
-
-
-
Interest Received 328.00
273.00
144.00
27.00
8.00
9.00
10.00
11.00
12.00
13.00
14.00
Increase in Intengible Assets
(4,190.00)
(5,087.00)
(7,215.00)
(16,366.00)
(17,321.00)
(10,538.00)
(12,118.70)
(13,936.51)
(16,026.98)
(18,431.03)
(21,195.68)
Net Cash Used in Investing Activities
(13,384.00)
(19,996.00)
(20,895.00)
(29,569.00)
(36,188.00)
(22,154.00)
(23,155.30)
(24,640.71)
(29,944.74)
(31,651.30)
(34,017.96)
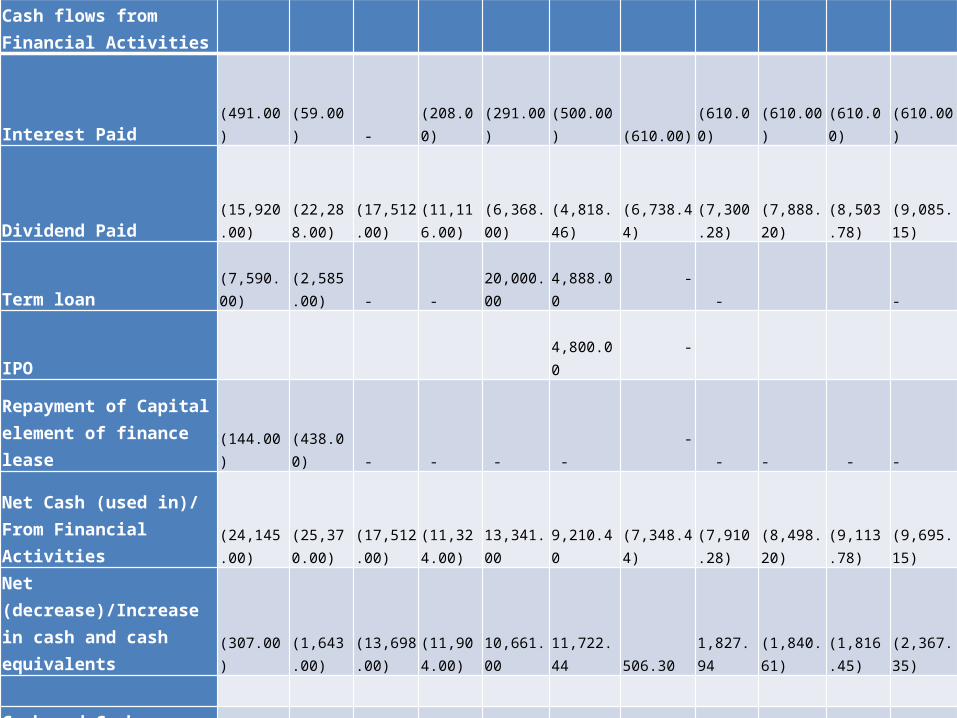
Cash flows from Financial Activities
Interest Paid (491.00)
(59.00) -
(208.00)
(291.00)
(500.00)
(610.00)
(610.00)
(610.00)
(610.00)
(610.00)
Dividend Paid
(15,920.00)
(22,288.00)
(17,512.00)
(11,116.00)
(6,368.00)
(4,818.46)
(6,738.44)
(7,300.28)
(7,888.20)
(8,503.78)
(9,085.15)
Term loan (7,590.00)
(2,585.00) - -
20,000.00
4,888.00 -
-
-
IPO 4,800.00 -
Repayment of Capital element of finance lease
(144.00)
(438.00) - - -
- -
-
-
-
-
Net Cash (used in)/ From Financial Activities
(24,145.00)
(25,370.00)
(17,512.00)
(11,324.00)
13,341.00
9,210.40
(7,348.44)
(7,910.28)
(8,498.20)
(9,113.78)
(9,695.15)
Net (decrease)/Increase in cash and cash equivalents
(307.00)
(1,643.00)
(13,698.00)
(11,904.00)
10,661.00
11,722.44
506.30
1,827.94
(1,840.61)
(1,816.45)
(2,367.35)
Cash and Cash Equivalents at beginning of the Year
20,047.00
19,740.00
18,097.00
4,399.00
(7,505.00)
3,156.00
14,878.44
15,384.75
17,212.68
15,372.07
13,555.62
Cash and Cash equivalents at end of the Year
19,740.00
18,097.00
4,399.00
(7,505.00)
3,156.00
14,878.44
15,384.75
17,212.68
15,372.07
13,555.62
11,188.27
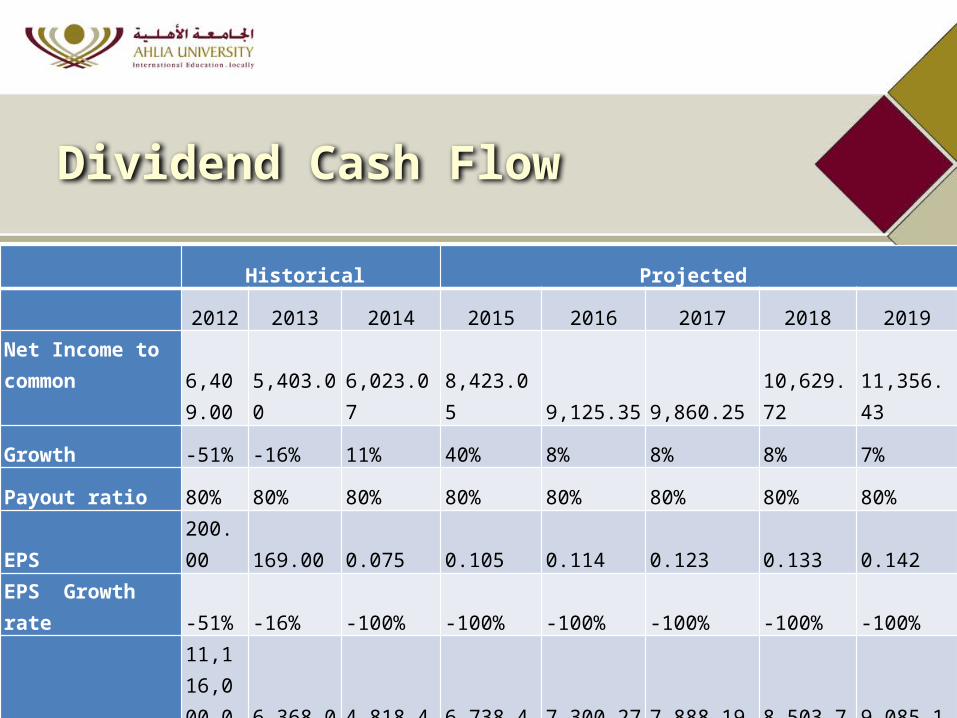
Historical Projected
2012 2013 2014 2015 2016 2017 2018 2019
Net Income to common
6,409.00 5,403.00 6,023.07 8,423.05 9,125.35 9,860.25 10,629.72 11,356.43
Growth -51% -16% 11% 40% 8% 8% 8% 7%
Payout ratio 80% 80% 80% 80% 80% 80% 80% 80%
EPS 200.00 169.00 0.075 0.105 0.114 0.123 0.133 0.142
EPS Growth rate -51% -16% -100% -100% -100% -100% -100% -100%
Dividends
11,116,000.00
6,368,000.00
4,818,458.87
6,738,440.15
7,300,276.15 7,888,199.92
8,503,776.72
9,085,145.72
Per share 0.3474 0.1990 0.0602 0.0842 0.0913 0.0986 0.1063 0.1136
Dividend Cash Flow
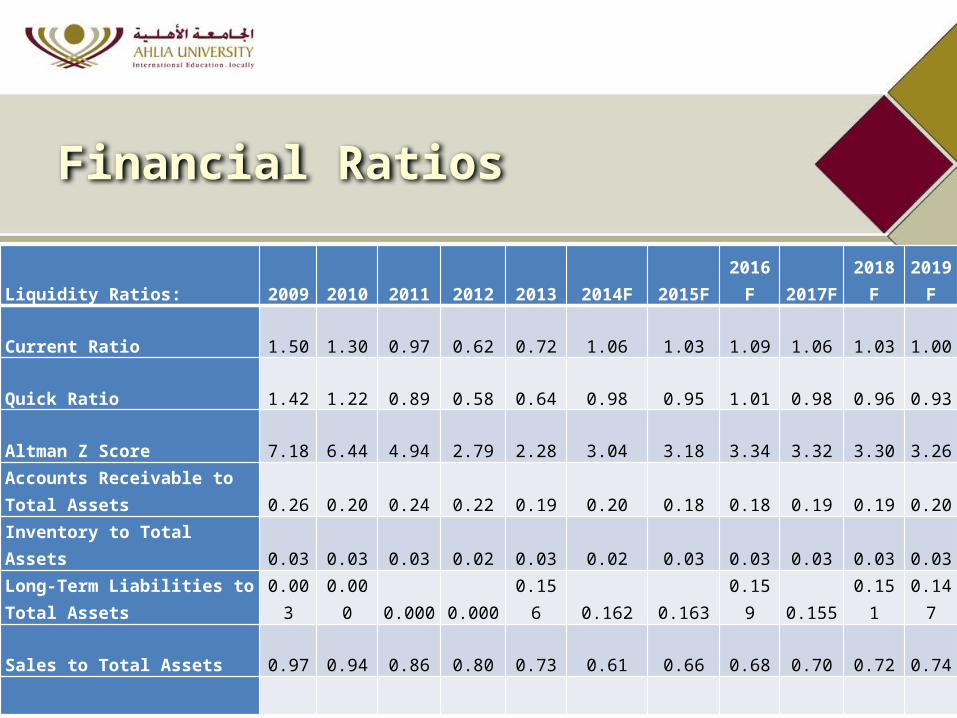
Financial Ratios
Liquidity Ratios: 2009 2010 2011 2012 2013 2014F 2015F 2016F 2017F 2018F2019
F
Current Ratio 1.50 1.30 0.97 0.62 0.72 1.06 1.03 1.09 1.06 1.03 1.00
Quick Ratio 1.42 1.22 0.89 0.58 0.64 0.98 0.95 1.01 0.98 0.96 0.93
Altman Z Score 7.18 6.44 4.94 2.79 2.28 3.04 3.18 3.34 3.32 3.30 3.26
Accounts Receivable to Total Assets 0.26 0.20 0.24 0.22 0.19 0.20 0.18 0.18 0.19 0.19 0.20
Inventory to Total Assets 0.03 0.03 0.03 0.02 0.03 0.02 0.03 0.03 0.03 0.03 0.03
Long-Term Liabilities to Total Assets 0.003 0.000 0.000 0.000 0.156 0.162 0.163 0.159 0.155 0.151 0.147
Sales to Total Assets 0.97 0.94 0.86 0.80 0.73 0.61 0.66 0.68 0.70 0.72 0.74
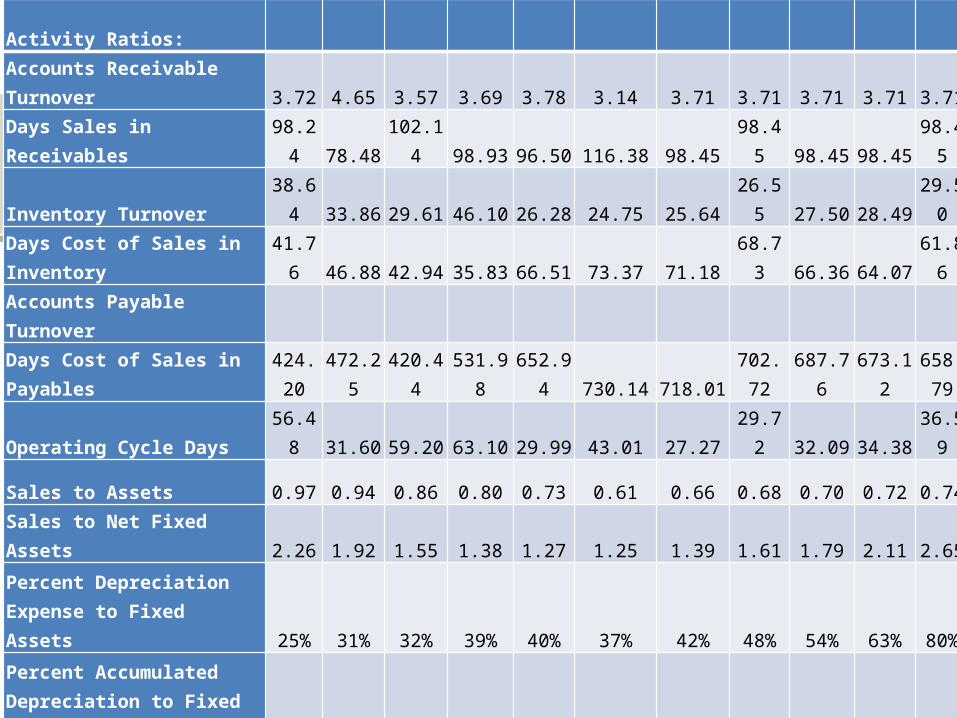
Activity Ratios:
Accounts Receivable Turnover 3.72 4.65 3.57 3.69 3.78 3.14 3.71 3.71 3.71 3.71 3.71
Days Sales in Receivables 98.24 78.48 102.14 98.93 96.50 116.38 98.45 98.45 98.45 98.45 98.45
Inventory Turnover 38.64 33.86 29.61 46.10 26.28 24.75 25.64 26.55 27.50 28.49 29.50
Days Cost of Sales in Inventory 41.76 46.88 42.94 35.83 66.51 73.37 71.18 68.73 66.36 64.07 61.86
Accounts Payable Turnover
Days Cost of Sales in Payables 424.20 472.25 420.44 531.98 652.94 730.14 718.01 702.72 687.76 673.12658.7
9
Operating Cycle Days 56.48 31.60 59.20 63.10 29.99 43.01 27.27 29.72 32.09 34.38 36.59
Sales to Assets 0.97 0.94 0.86 0.80 0.73 0.61 0.66 0.68 0.70 0.72 0.74
Sales to Net Fixed Assets 2.26 1.92 1.55 1.38 1.27 1.25 1.39 1.61 1.79 2.11 2.65
Percent Depreciation Expense to Fixed Assets 25% 31% 32% 39% 40% 37% 42% 48% 54% 63% 80%
Percent Accumulated Depreciation to Fixed Assets
Net Fixed Assets to Equity 0.64 0.73 0.85 0.99 1.16 1.02 0.94 0.84 0.77 0.68 0.55
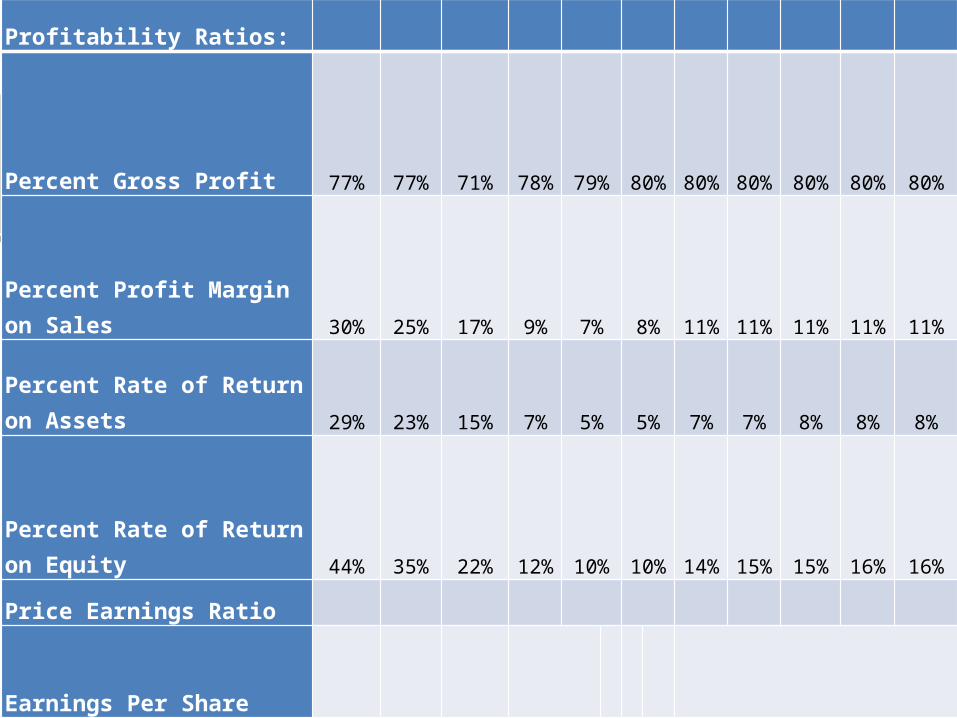
Profitability Ratios:
Percent Gross Profit 77% 77% 71% 78% 79% 80% 80% 80% 80% 80% 80%
Percent Profit Margin on Sales 30% 25% 17% 9% 7% 8% 11% 11% 11% 11% 11%
Percent Rate of Return on Assets 29% 23% 15% 7% 5% 5% 7% 7% 8% 8% 8%
Percent Rate of Return on Equity 44% 35% 22% 12% 10% 10% 14% 15% 15% 16% 16%
Price Earnings Ratio
Earnings Per Share
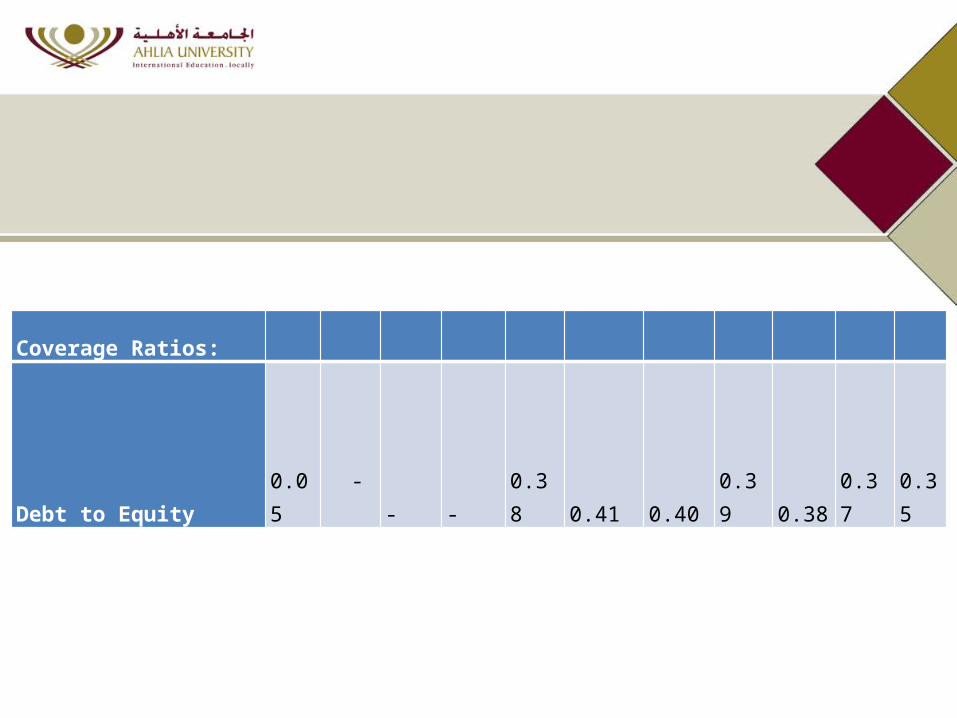
Coverage Ratios:
Debt to Equity 0.05
-
-
-
0.38
0.41
0.40
0.39
0.38
0.37
0.35
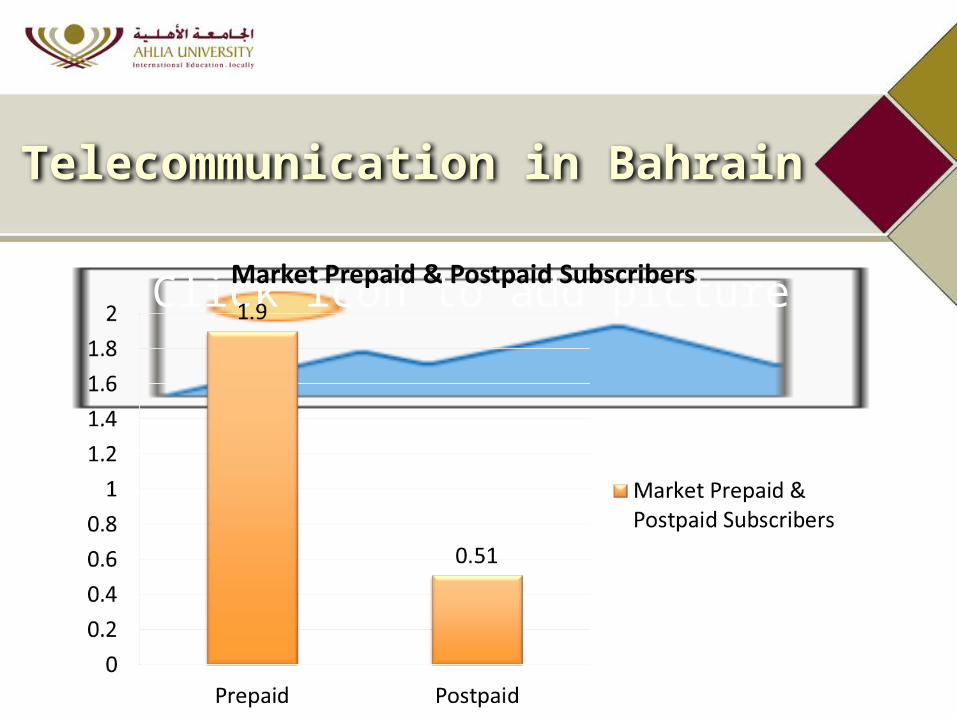
Click icon to add picture
Telecommunication in Bahrain
Click icon to add picture
Click icon to add picture
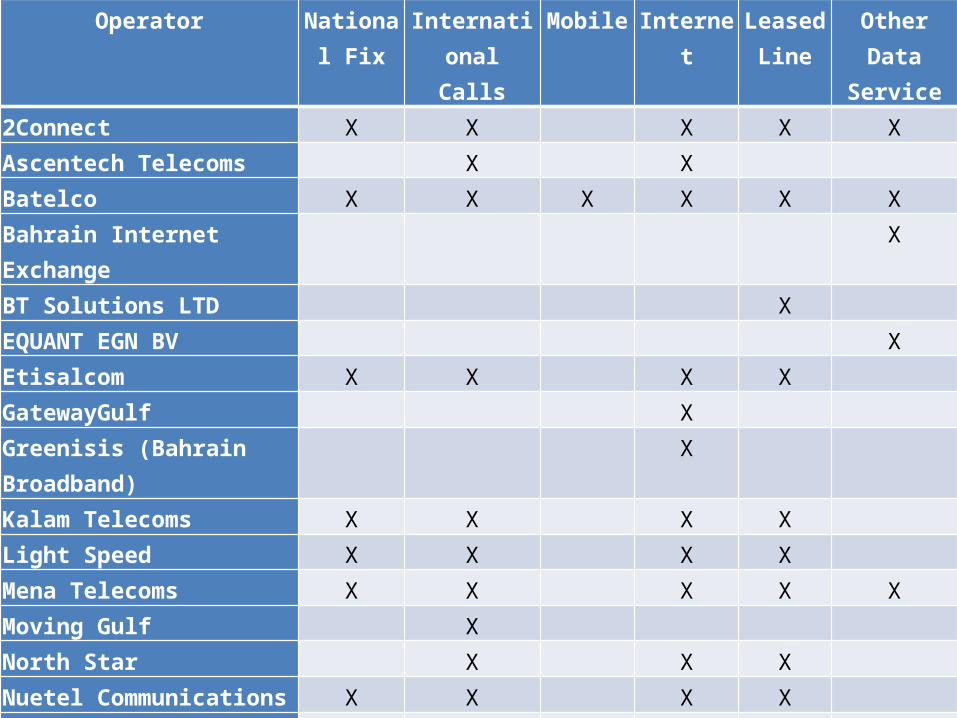
Operator National Fix
International Calls
Mobile Internet Leased Line
Other Data Service
2Connect X X X X XAscentech Telecoms X X Batelco X X X X X XBahrain Internet Exchange XBT Solutions LTD X EQUANT EGN BV XEtisalcom X X X X GatewayGulf X Greenisis (Bahrain Broadband) X Kalam Telecoms X X X X Light Speed X X X X Mena Telecoms X X X X XMoving Gulf X North Star X X X Nuetel Communications X X X X Rapid Telecoms X X X X Gulf Electronic Tawasul Co. XViacloud X Viva Bahrain X X X X Zain Bahrain X X X X X
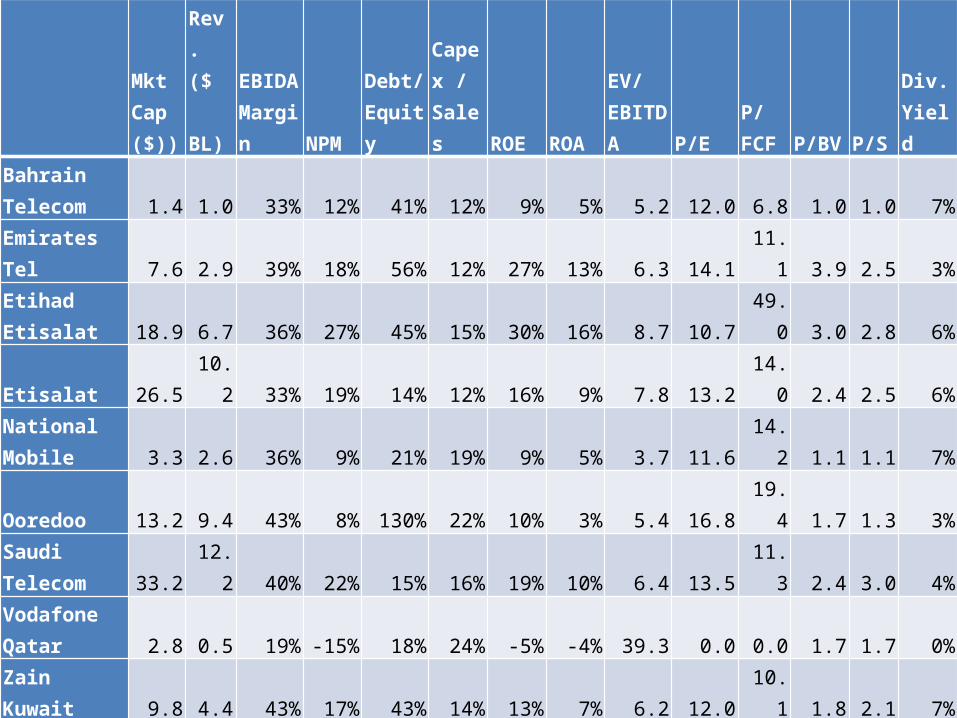
Mkt Cap ($))
Rev. ($ BL)
EBIDA Margin NPM
Debt/ Equity
Capex / Sales ROE ROA
EV/ EBITDA P/E
P/ FCF P/BV P/S
Div. Yield
Bahrain Telecom 1.4 1.0 33% 12% 41% 12% 9% 5% 5.2 12.0 6.8 1.0 1.0 7%
Emirates Tel 7.6 2.9 39% 18% 56% 12% 27% 13% 6.3 14.1 11.1 3.9 2.5 3%
Etihad Etisalat 18.9 6.7 36% 27% 45% 15% 30% 16% 8.7 10.7 49.0 3.0 2.8 6%
Etisalat 26.5 10.2 33% 19% 14% 12% 16% 9% 7.8 13.2 14.0 2.4 2.5 6%
National Mobile 3.3 2.6 36% 9% 21% 19% 9% 5% 3.7 11.6 14.2 1.1 1.1 7%
Ooredoo 13.2 9.4 43% 8% 130% 22% 10% 3% 5.4 16.8 19.4 1.7 1.3 3%
Saudi Telecom 33.2 12.2 40% 22% 15% 16% 19% 10% 6.4 13.5 11.3 2.4 3.0 4%
Vodafone Qatar 2.8 0.5 19% -15% 18% 24% -5% -4% 39.3 0.0 0.0 1.7 1.7 0%
Zain Kuwait 9.8 4.4 43% 17% 43% 14% 13% 7% 6.2 12.0 10.1 1.8 2.1 7%
MEAN 13.0 5.5 36% 13% 43% 16% 14% 7% 9.9 11.5 15.1 2.1 2.0 5%
MEDIAN 9.8 4.4 36% 17% 41% 15% 13% 7% 6.3 12.0 11.3 1.8 2.1 6%
Zain Bahrain 0.19 0.21 40% 7% 43% 24% 10% 5% 4.29 12.30 8.74 1.26 0.99 8%
Click icon to add picture
Telecommunication in GCC
Click icon to add picture
Saudi Arabia UAE Oman Kuwait Qatar Bahrain
Below 15 0.31 0.18 0.24 0.26 0.14 0.2
Below 25 0.51 0.59 0.67 0.33 0.35 0.44
65+ 0.03 0.01 0.02 0.03 0.01 0.02
5%
15%
25%
35%
45%
55%
65%
75%
GCC Age Demographic
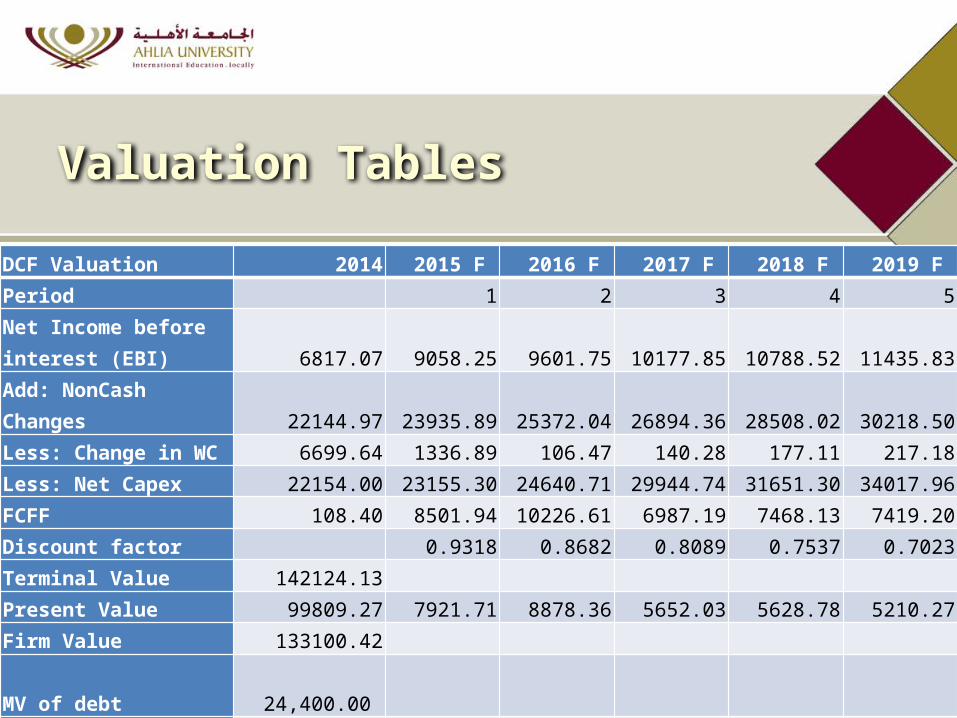
DCF Valuation 2014 2015 F 2016 F 2017 F 2018 F 2019 F Period 1 2 3 4 5
Net Income before interest (EBI) 6817.07 9058.25 9601.75 10177.85 10788.52 11435.83Add: NonCash Changes 22144.97 23935.89 25372.04 26894.36 28508.02 30218.50Less: Change in WC 6699.64 1336.89 106.47 140.28 177.11 217.18Less: Net Capex 22154.00 23155.30 24640.71 29944.74 31651.30 34017.96FCFF 108.40 8501.94 10226.61 6987.19 7468.13 7419.20Discount factor 0.9318 0.8682 0.8089 0.7537 0.7023Terminal Value 142124.13Present Value 99809.27 7921.71 8878.36 5652.03 5628.78 5210.27Firm Value 133100.42MV of debt 24,400.00
Equity Value = Firm Value - MV of Debt 108,700.42# of Shares 368,000 Fair Value 0.295
Valuation Tables
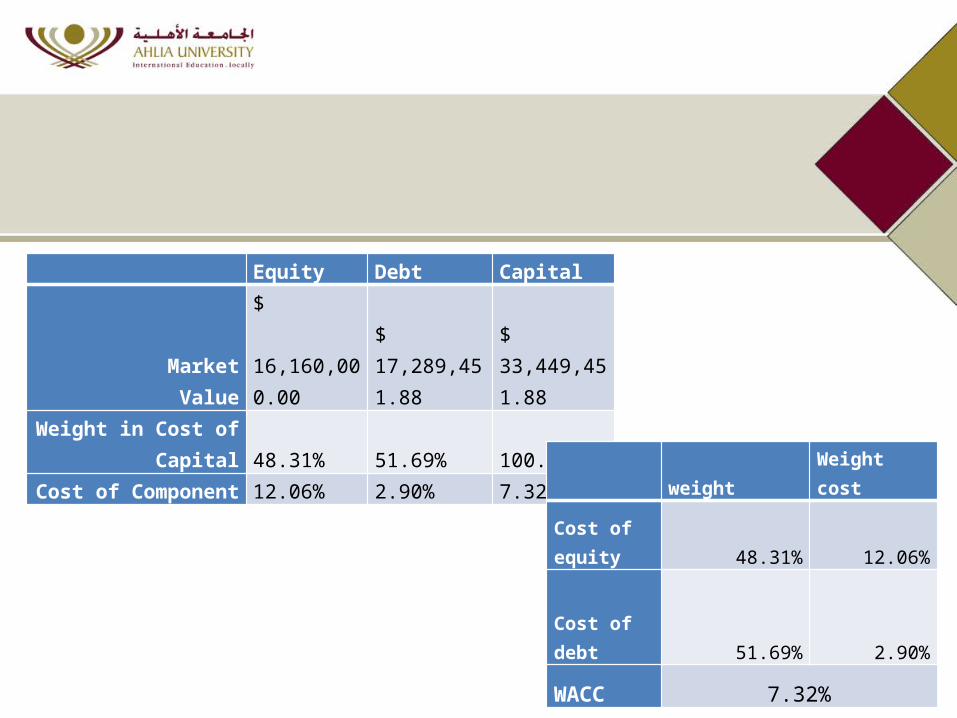
Equity Debt Capital
Market Value
$ 16,160,000.00
$ 17,289,451.88
$ 33,449,451.88
Weight in Cost of Capital 48.31% 51.69% 100.00%Cost of Component 12.06% 2.90% 7.32%
weight Weight cost
Cost of equity 48.31% 12.06%
Cost of debt 51.69% 2.90%
WACC 7.32%
Terminal Growth Rate
1.0% 1.5% 2.0% 2.5% 3.0%
WACC
5.32% 0.393 0.442 0.507 0.594 0.720
6.32% 0.308 0.339 0.377 0.425 0.487
7.32% 0.250 0.271 0.296 0.325 0.362
8.32% 0.208 0.223 0.240 0.260 0.284
9.32% 0.176 0.187 0.200 0.214 0.230
Terminal Growth Rate
1.0% 1.5% 2.0% 2.5% 3.0%
Cost of Equity
10.06% 0.264 0.274 0.287 0.300 0.316
11.06% 0.238 0.246 0.256 0.266 0.278
12.06% 0.217 0.223 0.231 0.239 0.248
13.06% 0.200 0.205 0.210 0.215 0.225
14.06% 0.184 0.189 0.193 0.199 0.204
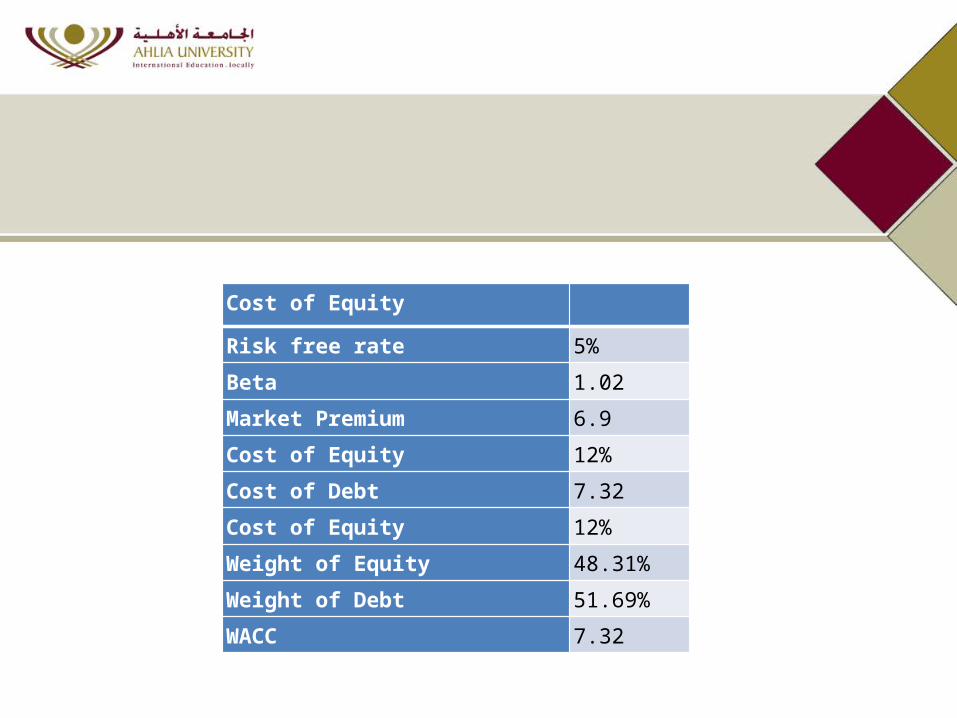
Cost of Equity
Risk free rate 5%
Beta 1.02
Market Premium 6.9
Cost of Equity 12%
Cost of Debt 7.32
Cost of Equity 12%
Weight of Equity 48.31%
Weight of Debt 51.69%
WACC 7.32
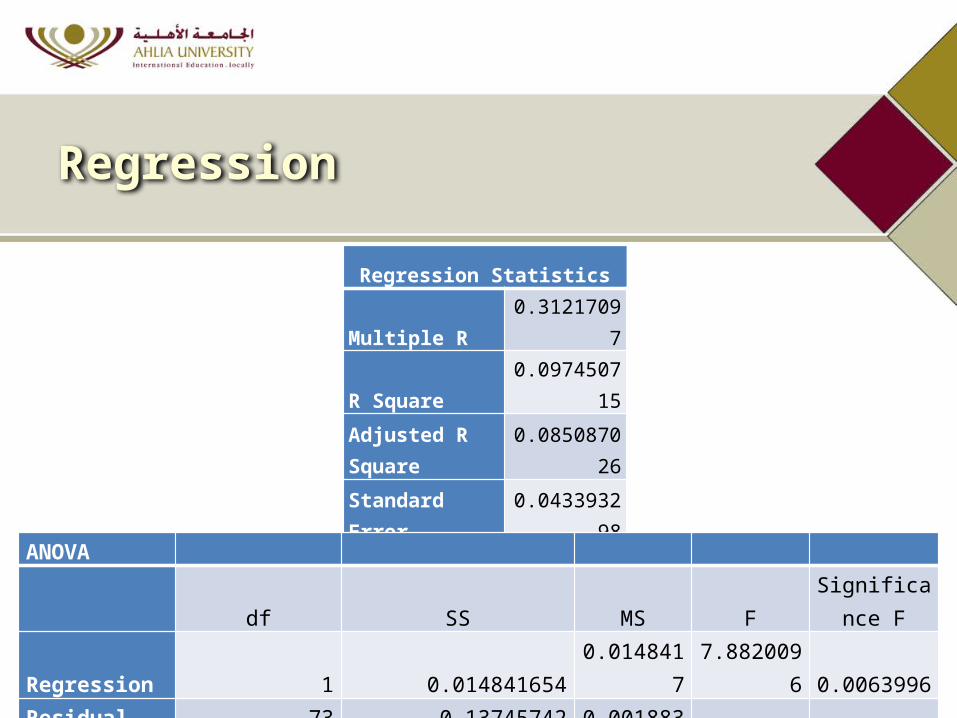
Regression Statistics
Multiple R 0.31217097
R Square 0.097450715
Adjusted R Square 0.085087026
Standard Error 0.043393298
Observations 75
Regression
ANOVA
df SS MS FSignificance
FRegression 1 0.014841654 0.0148417 7.8820096 0.0063996Residual 73 0.13745742 0.001883Total 74 0.152299073
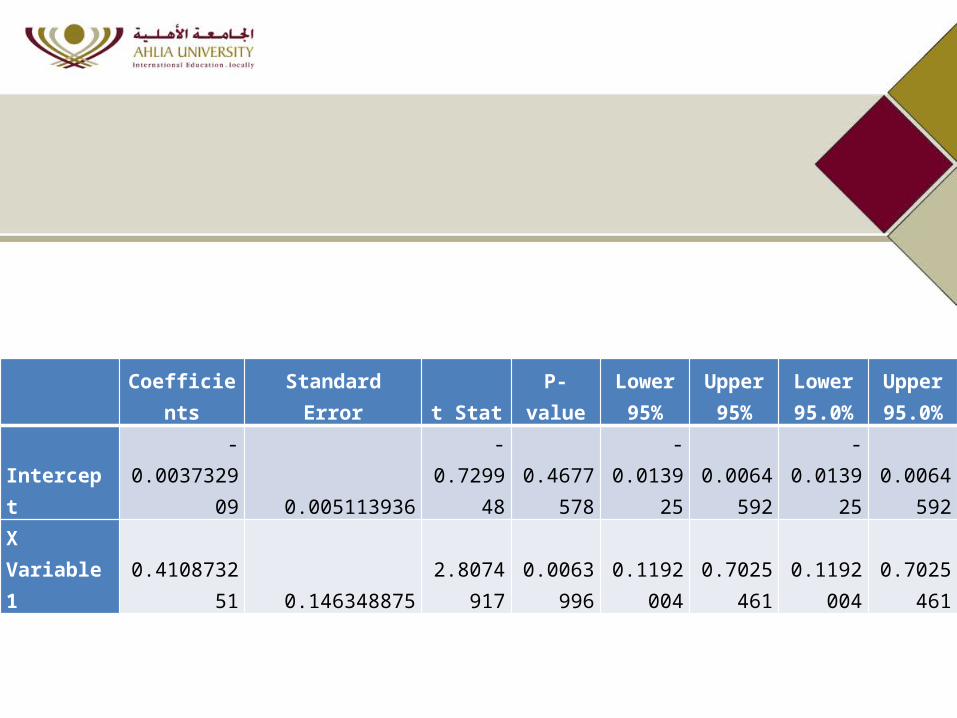
Coefficients Standard Error t Stat P-valueLower 95%
Upper 95%
Lower 95.0%
Upper 95.0%
Intercept -0.003732909 0.005113936-
0.7299480.467757
8-
0.0139250.006459
2-
0.0139250.006459
2
X Variable 1 0.410873251 0.1463488752.807491
70.006399
60.119200
40.702546
10.119200
40.702546
1