Embed Size (px)
Citation preview
8/16/2019 FCS FS 3 PHLabWorksheet
http://slidepdf.com/reader/full/fcs-fs-3-phlabworksheet 1/3
Name(s): ____________________________________________________________
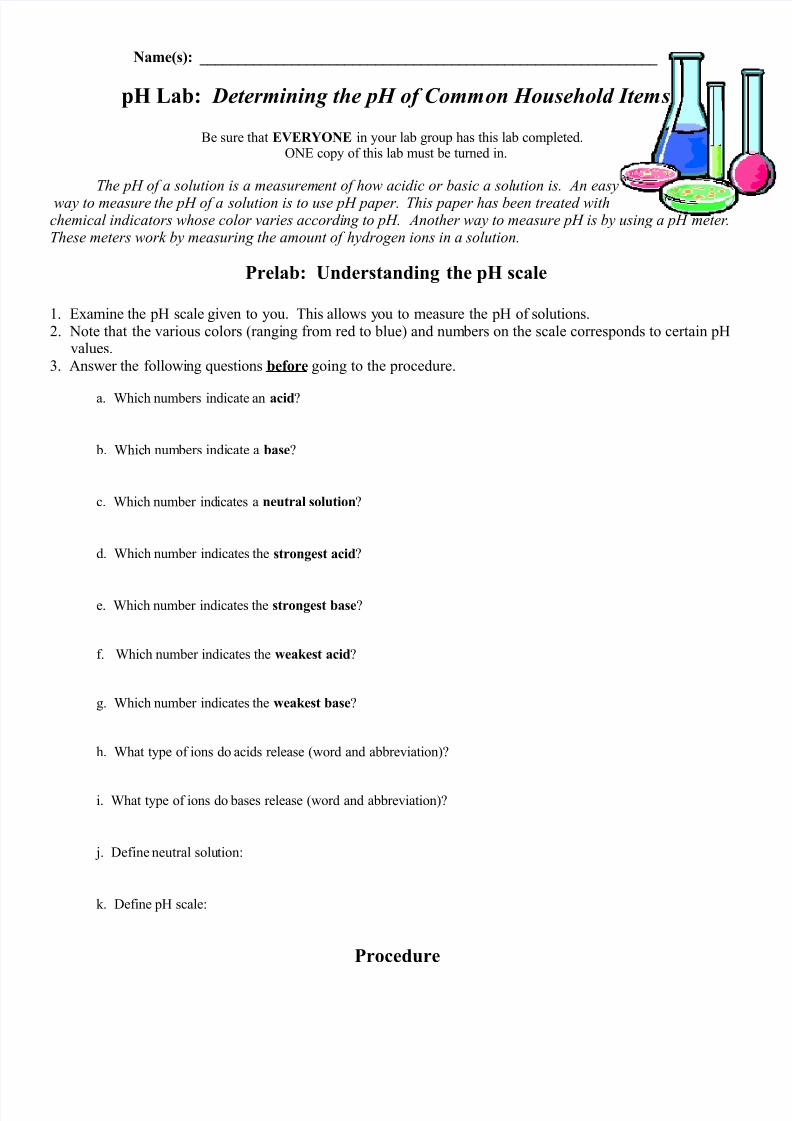
pH Lab: Determining the pH of Common Household Items
Be sure that EVERYONE in your lab group has this lab completed.ONE copy of this lab must be turned in.
The pH of a solution is a measurement of how acidic or basic a solution is. An easy way to measure the pH of a solution is to use pH paper. This paper has been treated withchemical indicators whose color varies according to pH. Another way to measure pH is by using a pH meter.These meters work by measuring the amount of hydrogen ions in a solution.
Prelab: Understanding the pH scale
1. Examine the pH scale given to you. This allows you to measure the pH of solutions.. Note that the various colors !ranging from red to blue" and numbers on the scale corresponds to certain pH
values.#. $nswer the following %uestions befre going to the procedure.
a. &hich numbers indicate an acid'
b. &hich numbers indicate a base'
c. &hich number indicates a ne!tral sl!tin'
d. &hich number indicates the strngest acid'
e. &hich number indicates the strngest base'
f. &hich number indicates the "ea#est acid'
g. &hich number indicates the "ea#est base'
h. &hat type of ions do acids release !word and abbreviation"'
i. &hat type of ions do bases release !word and abbreviation"'
(. )efine neutral solution*
+. )efine pH scale*
Prced!re

8/16/2019 FCS FS 3 PHLabWorksheet
http://slidepdf.com/reader/full/fcs-fs-3-phlabworksheet 2/3
,ou -/T wear goggles at all times000 Take your time on this lab… you have all class period!
1. Have one group member write down each of the samples in the below data table. -a+e group predictions ofwhether each sample will be acidic basic or neutral. 2ecord these predictions in the data table.
. 3et a well plate and have one person from your group collect 4# drops of each sample solution. Be sure to put each numbered sample into the spot with the same number as the sample. Only place ONE sample in
each spot. NE5E2 -67 THE 8HE-68$9/0
#. 2eceive your pHydrion paper !1 small strips". )O NOT touch with your fingers.
:. sing twee;ers dip one of the small strips of pH paper into the first well. <ull the strip out immediatel$.
=. 8ount to = and then compare the color of the paper to the color chart.!E%ceptin: 2ead ammonia and the un+nown immediately do nt wait the = seconds."
>. 2ecord your data in the data table below.
?. 2epeat for the rest of the solutions. /pot @1 is for the un+nown substance.
/olution Name <rediction!$cidABaseANeutral
"
pH based on paper reading !141:"
pH based on meter reading !141:"
&as your prediction correct'
1
#
:
=
>
?
C
1D
11
1
. 2inse out your well plate with plent$ of water and dispose of all paper fragments in a trash can NOT downthe sin+00000 2eturn wells twee;ers and color charts to the front of the room.
C. &hile cleaning have one person collect =ml of each numbered sample in the numbered test tubes. Be sure to put each numbered sample into the test tube with the same number as the sample. 2ead at the meniscus00
1D. se a <asco pH meter to ta+e the pH of each sample and record the results into your data table. BE /2ETO 26N/E THE pH -ETE2 6N T$< &$TE2 BET&EEN E$8H TE/T.
11. 8omplete the table. )etermine if each solution is acidic or basic and if the results matched your predictions.
8/16/2019 FCS FS 3 PHLabWorksheet
http://slidepdf.com/reader/full/fcs-fs-3-phlabworksheet 3/3
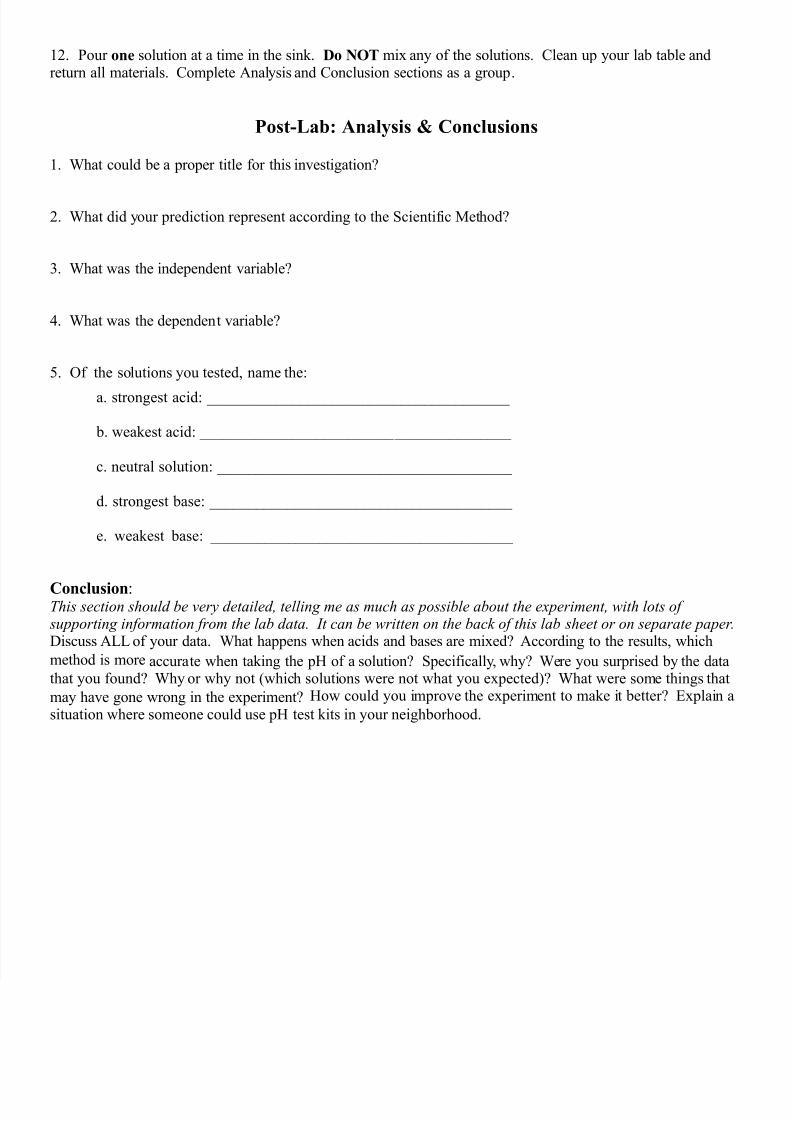
1. <our ne solution at a time in the sin+. ' NO mix any of the solutions. 8lean up your lab table andreturn all materials. 8omplete $nalysis and 8onclusion sections as a group.
PstLab: *nal$sis + ,ncl!sins
1. &hat could be a proper title for this investigation'
. &hat did your prediction represent according to the /cientific -ethod'
#. &hat was the independent variable'
:. &hat was the dependent variable'
=. Of the solutions you tested name the*
a. strongest acid* FFFFFFFFFFFFFFFFFFFFFFFFFFFFFFFFFFFFFFF
b. wea+est acid* FFFFFFFFFFFFFFFFFFFFFFFFFFFFFFFFFFFFFFFF
c. neutral solution* FFFFFFFFFFFFFFFFFFFFFFFFFFFFFFFFFFFFFF
d. strongest base* FFFFFFFFFFFFFFFFFFFFFFFFFFFFFFFFFFFFFFF
e. wea+est base* FFFFFFFFFFFFFFFFFFFFFFFFFFFFFFFFFFFFFFF
,ncl!sin*This section should be very detailed, telling me as much as possible about the experiment, with lots of supporting information from the lab data. t can be written on the back of this lab sheet or on separate paper.)iscuss $99 of your data. &hat happens when acids and bases are mixed' $ccording to the results which
method is more accurate when ta+ing the pH of a solution' /pecifically why' &ere you surprised by the datathat you found' &hy or why not !which solutions were not what you expected"' &hat were some things that
may have gone wrong in the experiment' How could you improve the experiment to ma+e it better' Explain a
situation where someone could use pH test +its in your neighborhood.