Embed Size (px)
Citation preview

Fermi Observation of
Clusters of Galaxies立命館大学理工学部物理科学科 森 正樹
大阪大学大学院理学研究科宇宙地球科学専攻 宇宙進化グループセミナー2010年2月10日
Perseus cluster

超高エネルギー宇宙線源としての銀河団
Hillas, 1984Two possible sites:
• Mergers
• Cluster accretion shocks
2
μGkpc2eV1018
max BR
Z
E
Hadronic emission: p+p0 (+) + X
Völk & Atoyan, ApJ 541,88 (2000)Model 1.
3

IC emission from high-energy electron
interactions with the CMB
Gabici & Blasi, Astropart. Phys. 20, 579 (2004)
From top to bottom:
(1) a merger between two
clusters with masses 1015M
and 1013M
;
(2) an accreting cluster with
mass 1015M
with a magnetic
field at the shock in the
upstream region 0.1 G;
(3) an accreting cluster with
mass 1015M
with a magnetic
field at the shock in the
upstream region 0.01 G.
Model 2.
IACT (extended)
IACT (point)
4
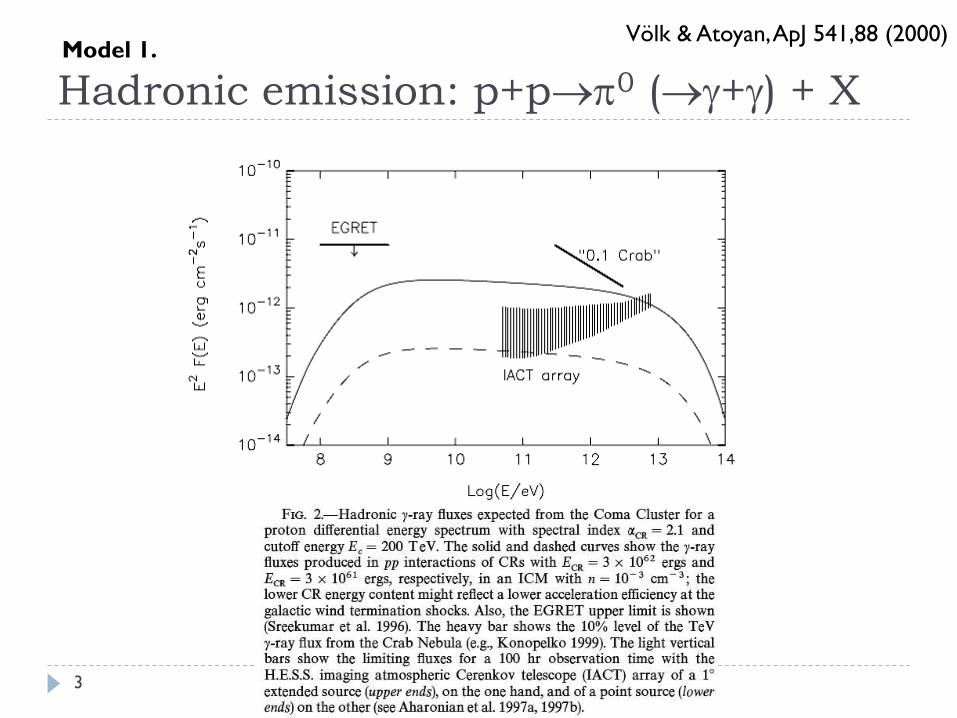
Synchrotron and IC emission from
secondary electron/ positron pairs produced
in p- interactions with the CMB
Inoue, Aharonian & Sugiyama, ApJ 628, L9 (2005)Model 3.
5
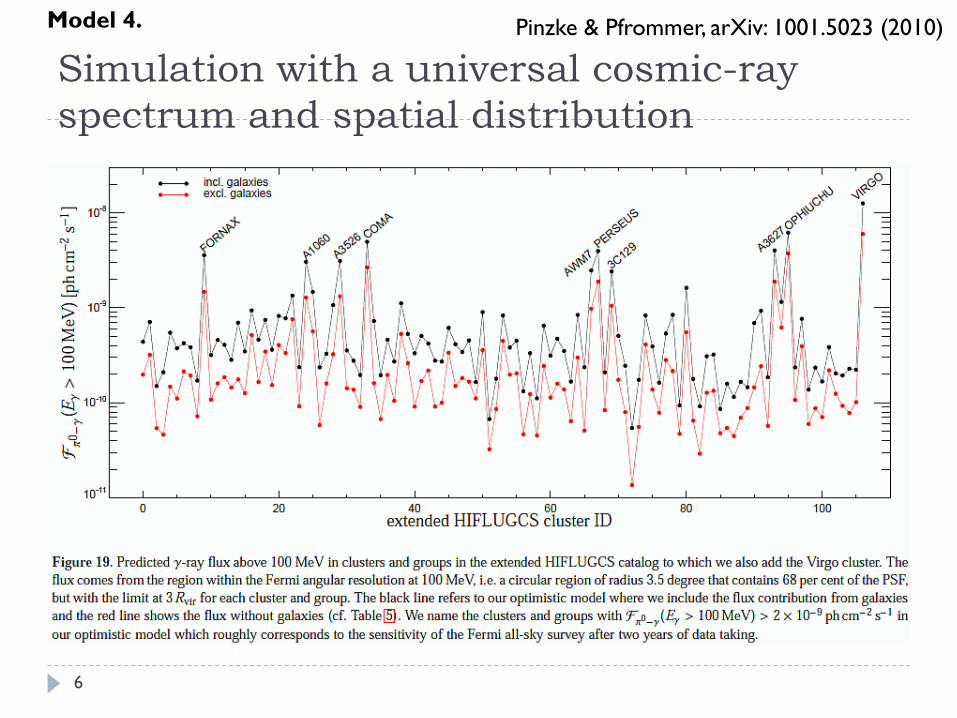
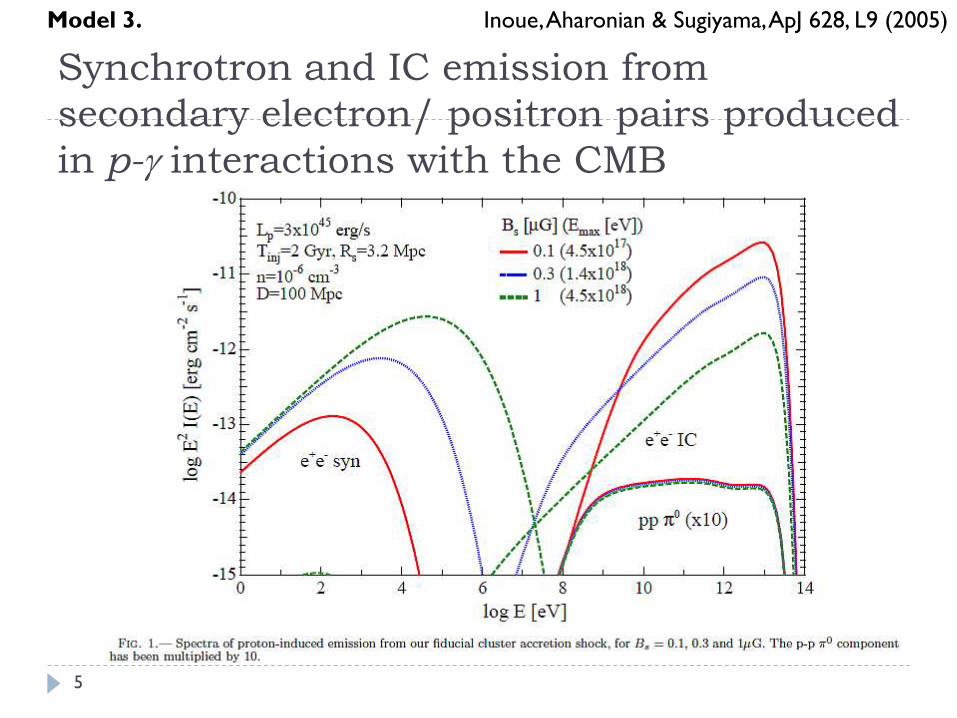
Simulation with a universal cosmic-ray
spectrum and spatial distribution
6
Model 4. Pinzke & Pfrommer, arXiv: 1001.5023 (2010)
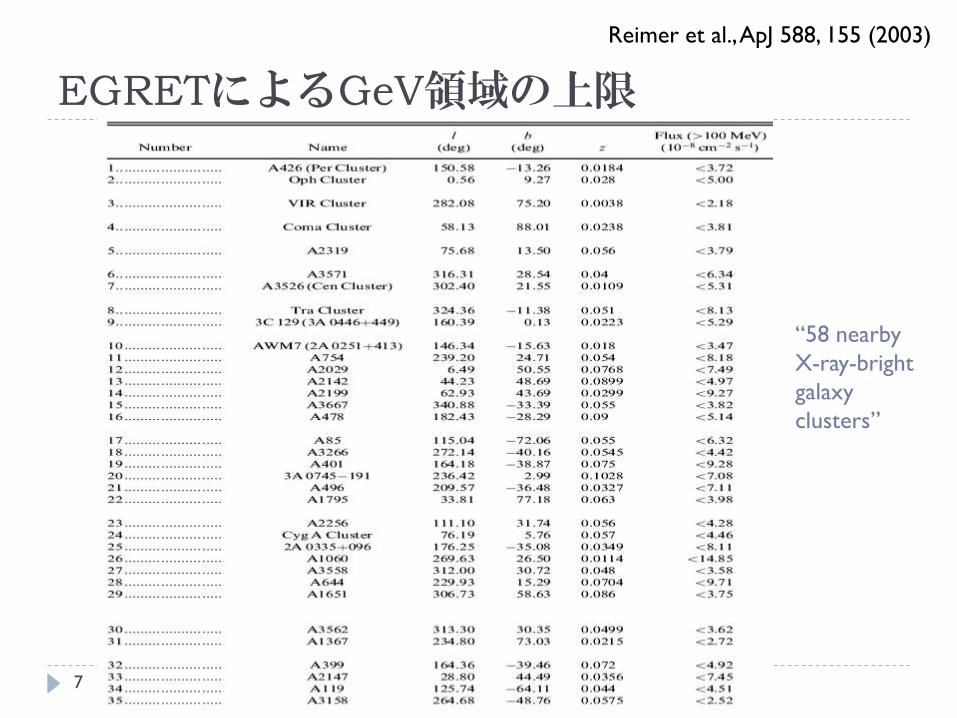
EGRETによるGeV領域の上限
Reimer et al., ApJ 588, 155 (2003)
“58 nearby
X-ray-bright
galaxy
clusters”
7
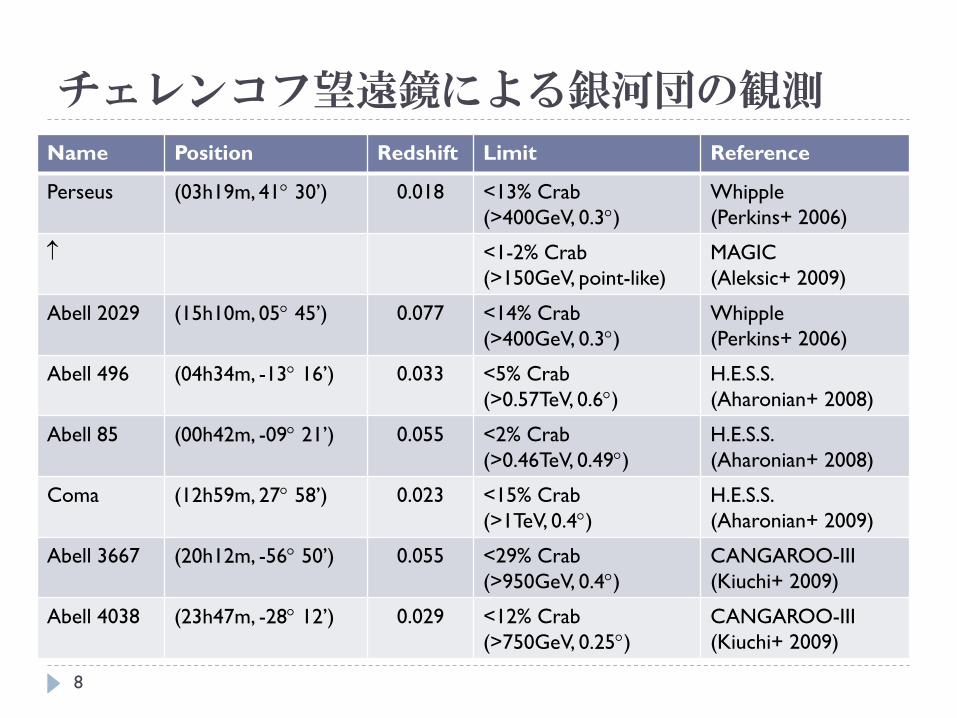
チェレンコフ望遠鏡による銀河団の観測
Name Position Redshift Limit Reference
Perseus (03h19m, 41 30’) 0.018 <13% Crab
(>400GeV, 0.3)
Whipple
(Perkins+ 2006)
<1-2% Crab
(>150GeV, point-like)
MAGIC
(Aleksic+ 2009)
Abell 2029 (15h10m, 05 45’) 0.077 <14% Crab
(>400GeV, 0.3)
Whipple
(Perkins+ 2006)
Abell 496 (04h34m, -13 16’) 0.033 <5% Crab
(>0.57TeV, 0.6)
H.E.S.S.
(Aharonian+ 2008)
Abell 85 (00h42m, -09 21’) 0.055 <2% Crab
(>0.46TeV, 0.49)
H.E.S.S.
(Aharonian+ 2008)
Coma (12h59m, 27 58’) 0.023 <15% Crab
(>1TeV, 0.4)
H.E.S.S.
(Aharonian+ 2009)
Abell 3667 (20h12m, -56 50’) 0.055 <29% Crab
(>950GeV, 0.4)
CANGAROO-III
(Kiuchi+ 2009)
Abell 4038 (23h47m, -28 12’) 0.029 <12% Crab
(>750GeV, 0.25)
CANGAROO-III
(Kiuchi+ 2009)
8
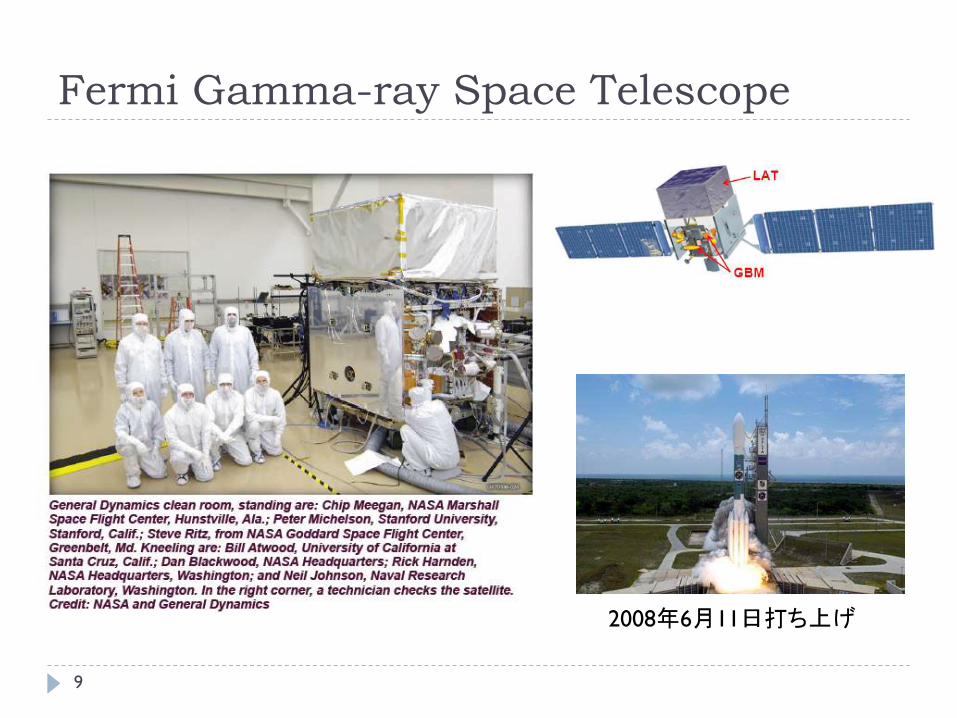
Fermi Gamma-ray Space Telescope
2008年6月11日打ち上げ
9

Pair telescope for high-energy gamma-rays
Evans 1955
10
•OSO-3 (1967-1968)
• SAS-2 (1972-1973)
•COS B (1975-1982)
•CGRO/EGRET (1991-2000)
•AGILE (2007-)
•Fermi (2008-)

Fermi Gamma-ray Space Telescope: spec
P. Michelson, March 2009
11

Sample event display (1)
12

Sample event display (2)
13
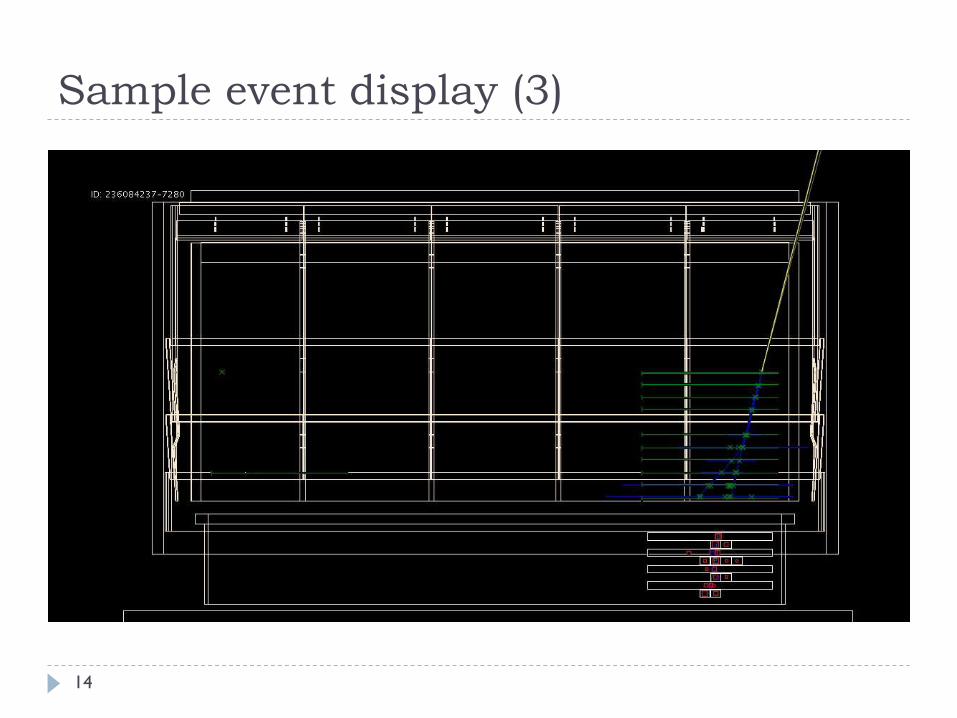
Sample event display (3)
14

Sample event display (4)
15

Event class and effective area
16
Class =
“Transient”
“Source”
“Diffuse”
Rando, arXiv:0907.0626
Transient
Source
Diffuse
Real event
distribution Fewer
background
“Diffuse” class
>100-200 MeV
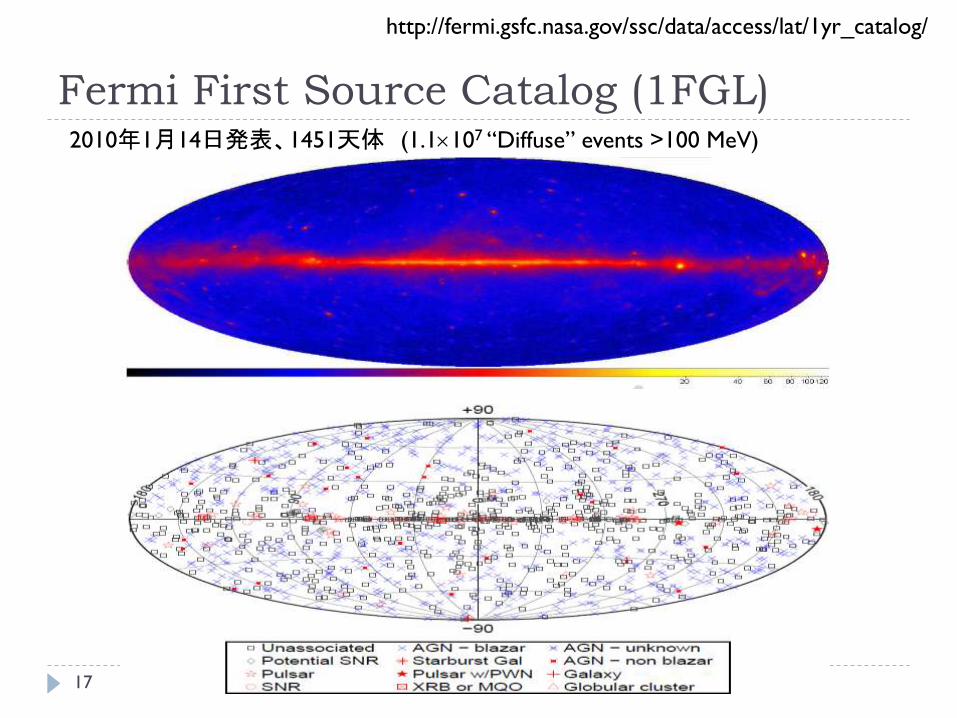
Fermi First Source Catalog (1FGL)
http://fermi.gsfc.nasa.gov/ssc/data/access/lat/1yr_catalog/
2010年1月14日発表、1451天体 (1.1107 “Diffuse” events >100 MeV)
17
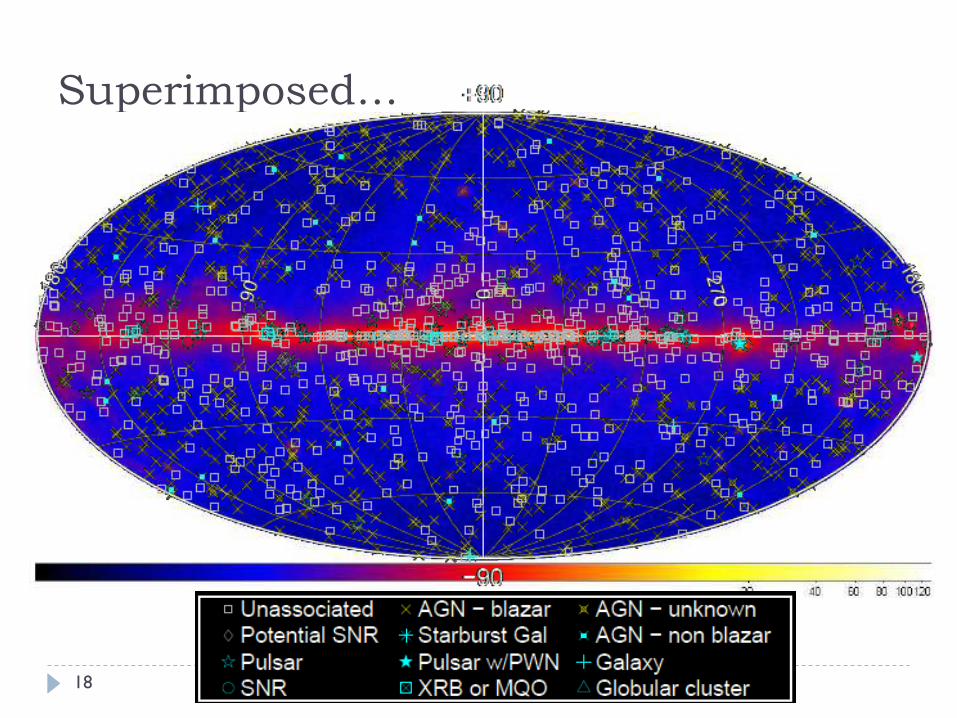
Superimposed…
18

Superimposed… (linear scale)
19
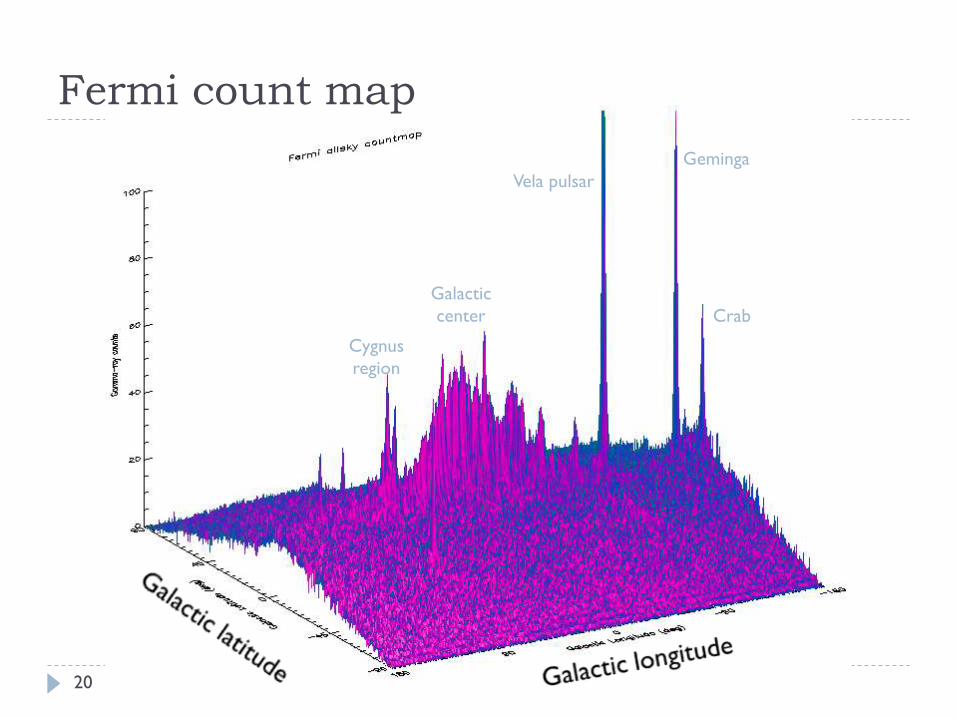
Cygnus
region
Galactic
center
Vela pulsar
Geminga
Crab
Fermi count map
20

Fermi Galactic diffuse model
21

Fermi isotropic model
22

Point sources = Observed intensity – Diffuse model
Observed
Galactic diffuse
Isotropic
Sources
-
-
=
23

Sources = residuals
Cygnus
region
Vela pulsar
Geminga
Crab
24
Heavily
depends
on diffuse
model!

Galactic diffuse emission: components
T. Porter, talk at TeV Particle Astrophysics (2009)
25

Galactic diffuse model: profile
T. Porter, talk at TeV Particle Astrophysics (2009)
26

Galactic diffuse model: spectrum
T. Porter, talk at TeV Particle Astrophysics (2009)
27
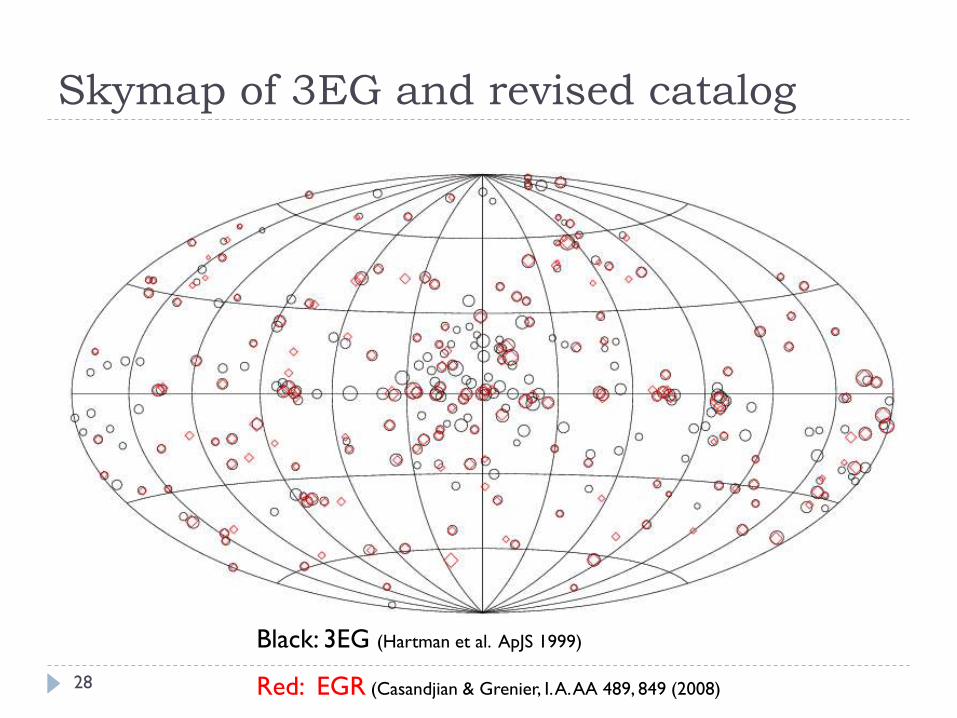
Skymap of 3EG and revised catalog
28
Black: 3EG (Hartman et al. ApJS 1999)
Red: EGR (Casandjian & Grenier, I. A. AA 489, 849 (2008)
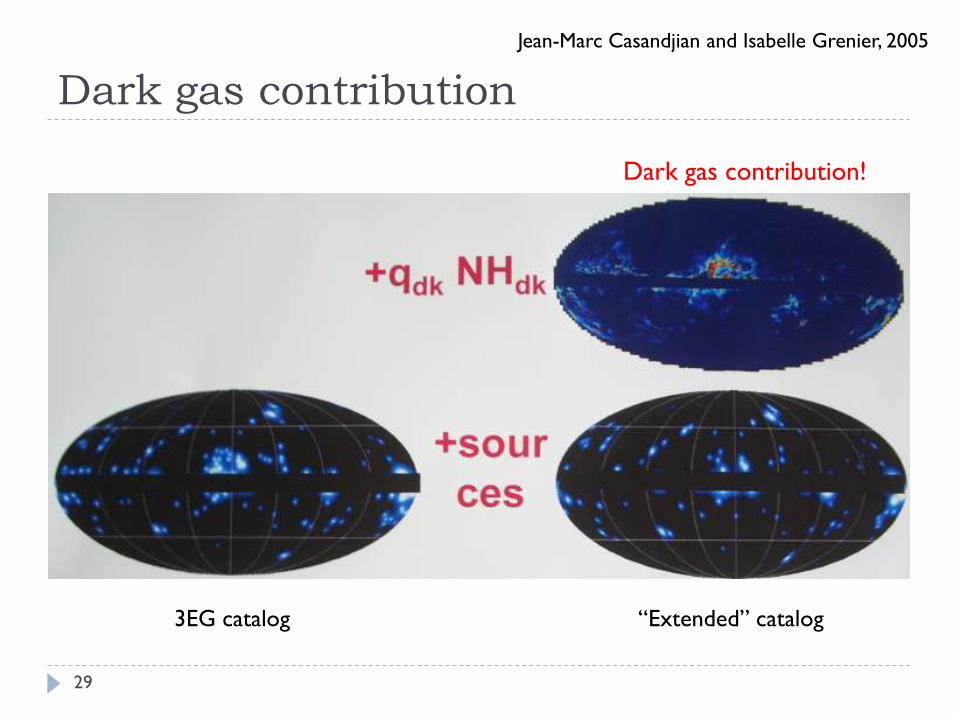
Dark gas contribution
29
3EG catalog “Extended” catalog
Dark gas contribution!
Jean-Marc Casandjian and Isabelle Grenier, 2005
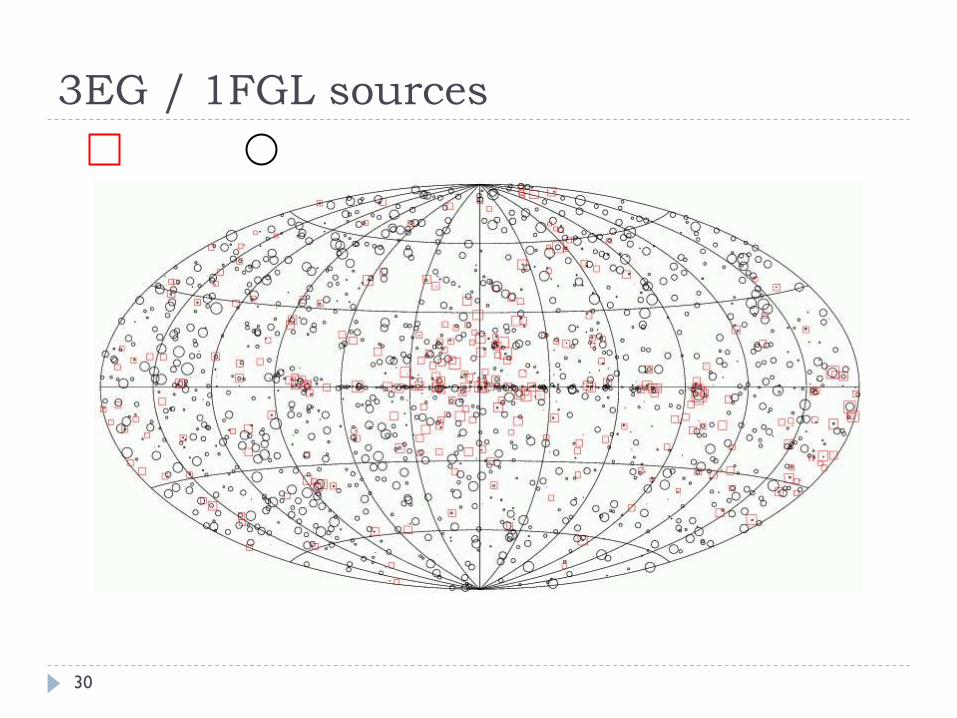
3EG / 1FGL sources
30

EGR / 1FGL sources
31
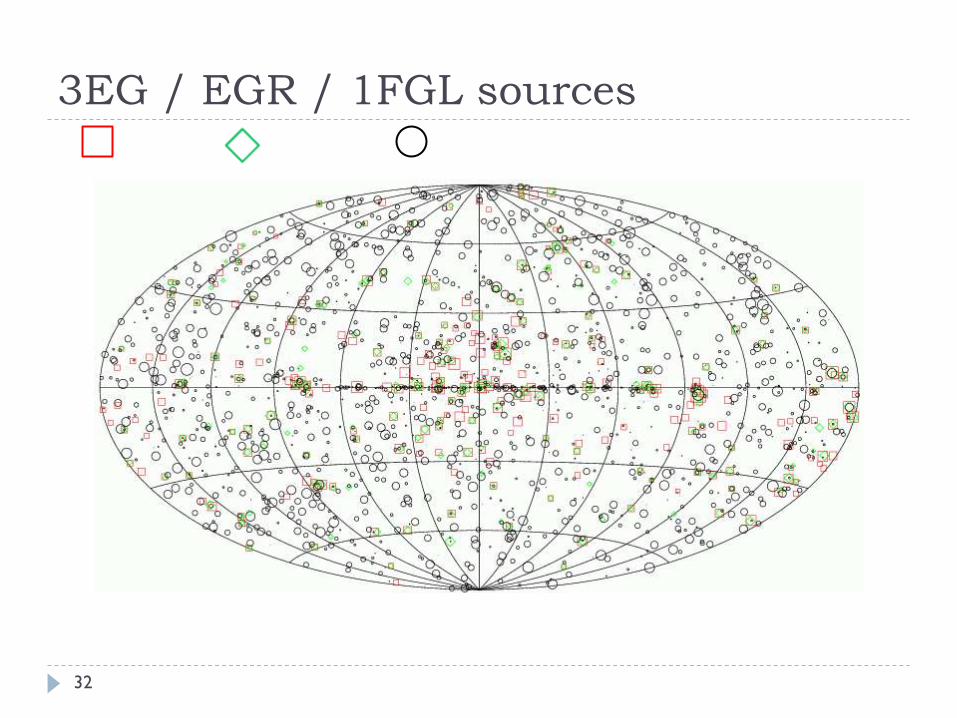
3EG / EGR / 1FGL sources
32
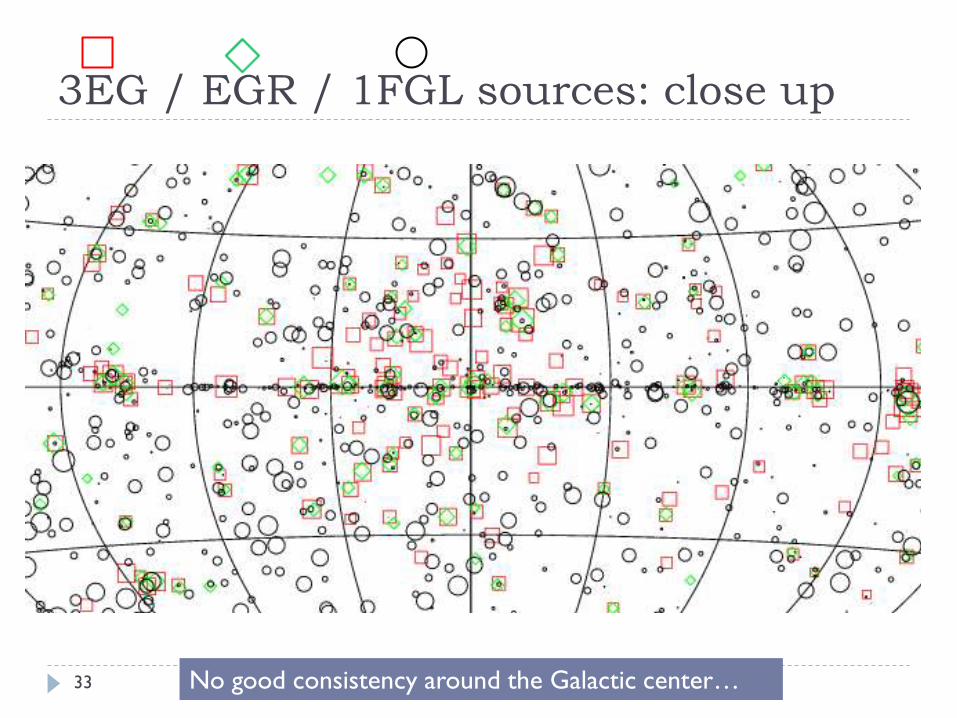
3EG / EGR / 1FGL sources: close up
33 No good consistency around the Galactic center…
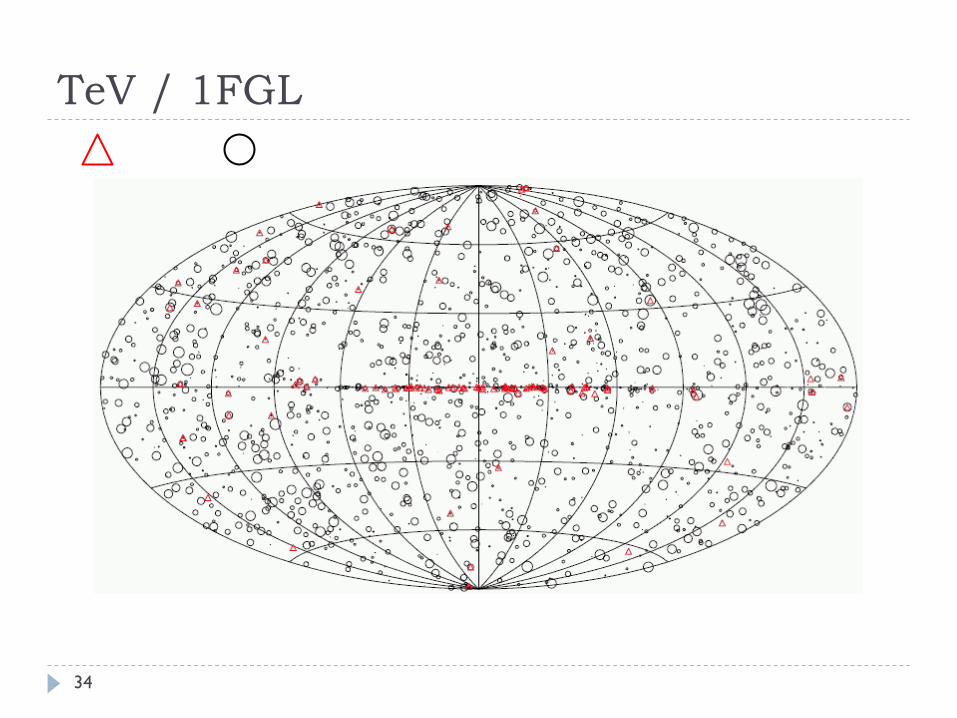
TeV / 1FGL
34
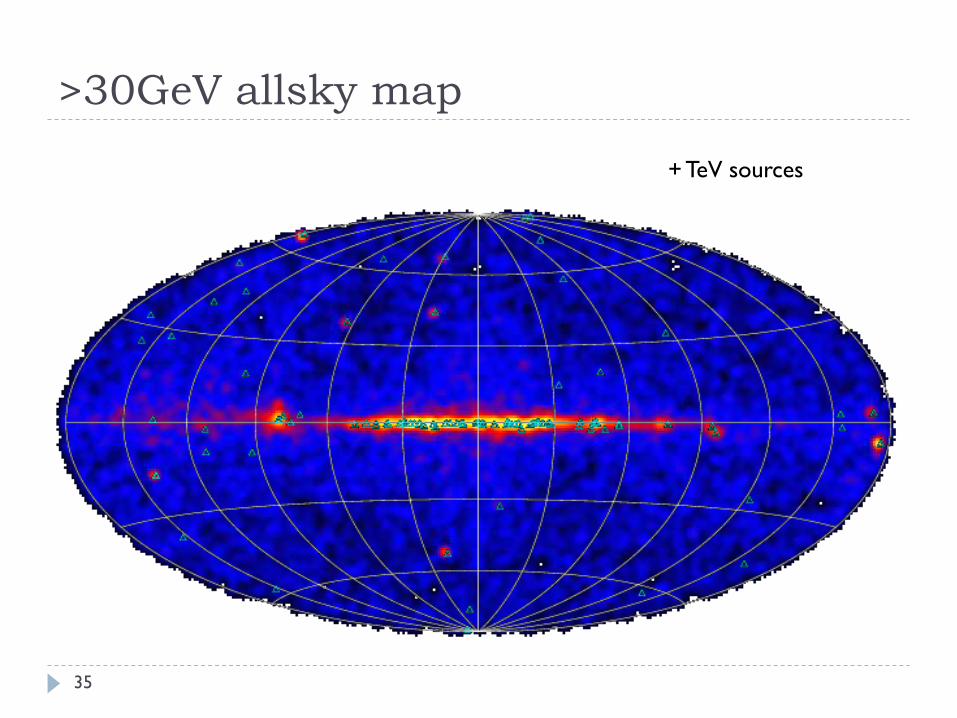
>30GeV allsky map
35
+ TeV sources

Extragalactic diffuse emission
36
Ackerman, talk at Femi symposium (Nov. 2009)
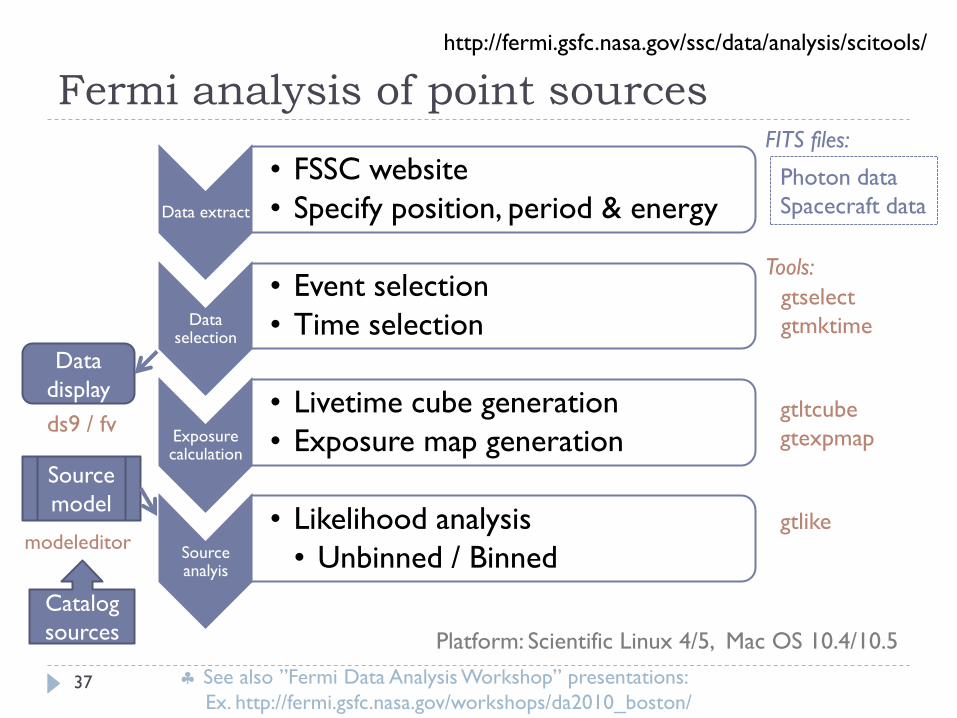
Fermi analysis of point sources
Data extract
• FSSC website
• Specify position, period & energy
Data selection
• Event selection
• Time selection
Exposure calculation
• Livetime cube generation
• Exposure map generation
Source analyis
• Likelihood analysis
• Unbinned / Binned
gtselect
gtmktime
gtltcube
gtexpmap
gtlike
Photon data
Spacecraft data
Tools:
FITS files:
http://fermi.gsfc.nasa.gov/ssc/data/analysis/scitools/
Platform: Scientific Linux 4/5, Mac OS 10.4/10.5
Data
display
Source
model
37
ds9 / fv
modeleditor
See also ”Fermi Data Analysis Workshop” presentations:
Ex. http://fermi.gsfc.nasa.gov/workshops/da2010_boston/
Catalog
sources

LAT data server http://fermi.gsfc.nasa.gov/cgi-bin/ssc/LAT/LATDataQuery.cgi
38
Mrk 501
START, 2009-09-30 00:00:00
Allsky files are ready…

Query
39
Click!
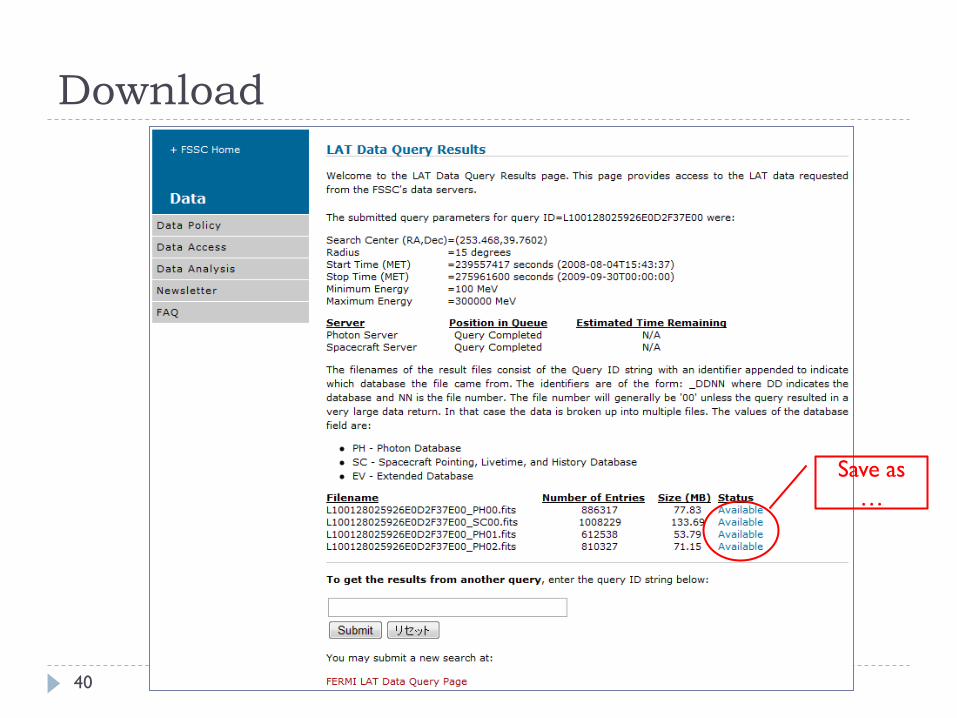
Download
40
Save as
…
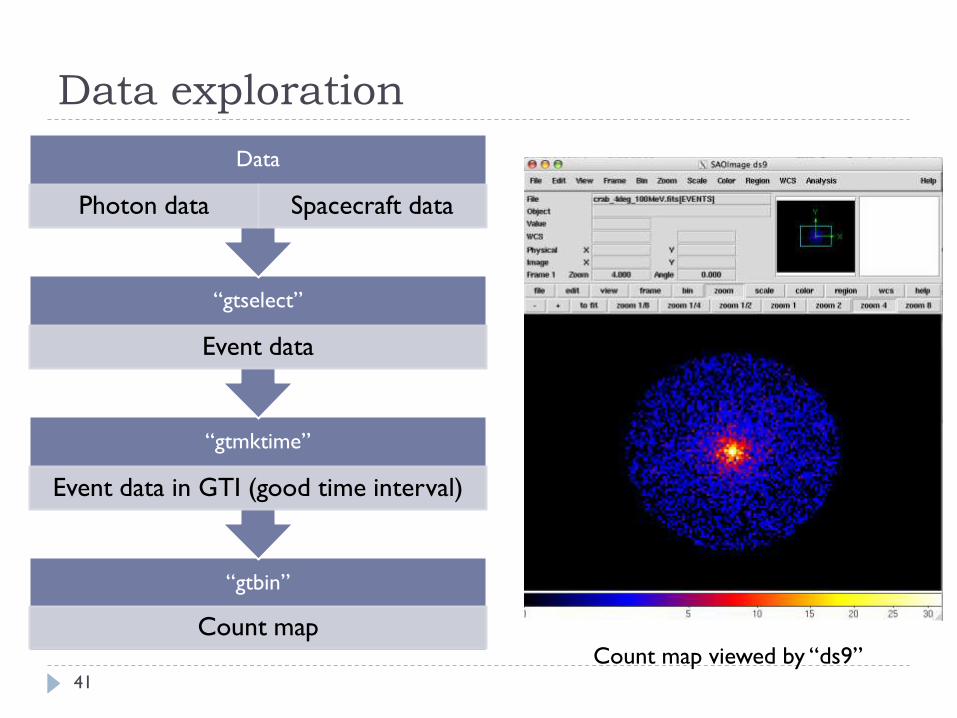
Data exploration
“gtbin”
Count map
“gtmktime”
Event data in GTI (good time interval)
“gtselect”
Event data
Data
Photon data Spacecraft data
Count map viewed by “ds9”41
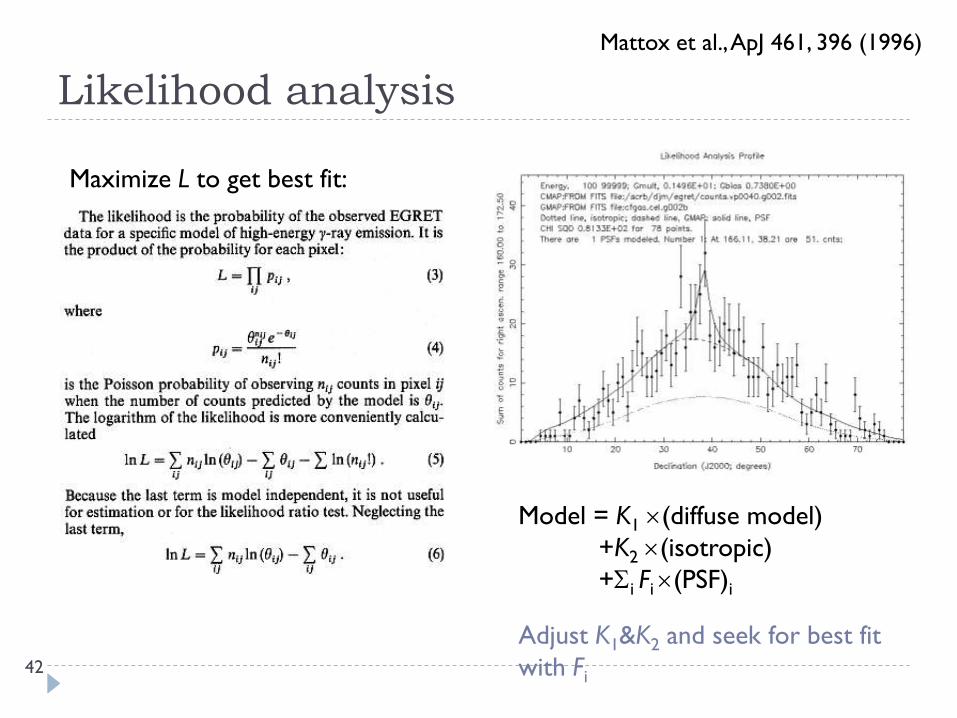
Likelihood analysis
42
Maximize L to get best fit:
Mattox et al., ApJ 461, 396 (1996)
Model = K1 (diffuse model)
+K2 (isotropic)
+i Fi (PSF)i
Adjust K1&K2 and seek for best fit
with Fi
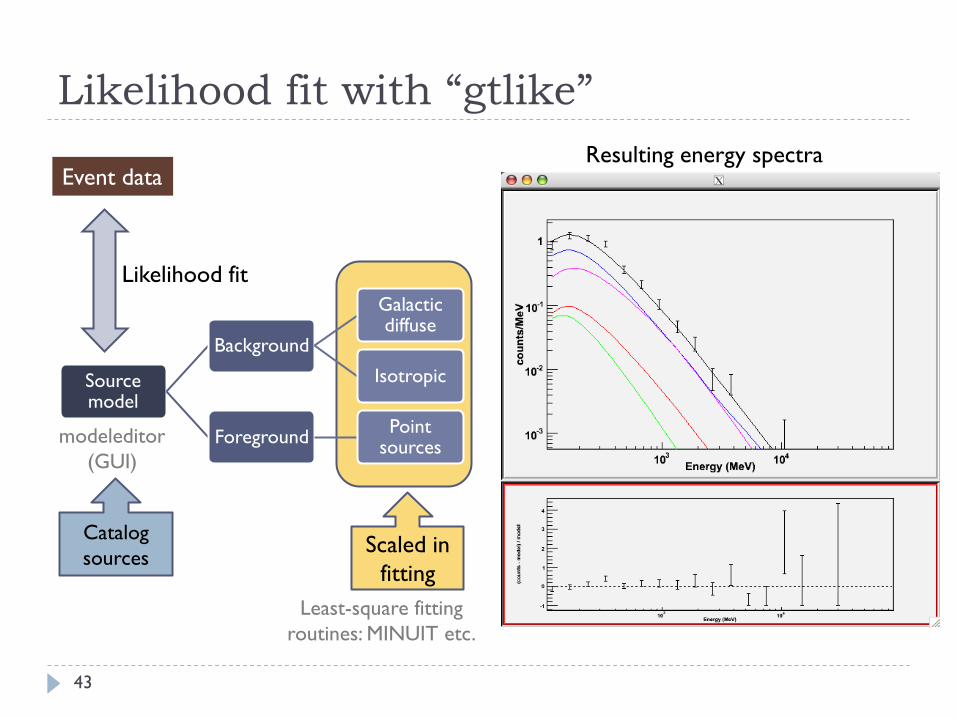
Likelihood fit with “gtlike”
Event data
Likelihood fit
Resulting energy spectra
43
Source model
Background
Galactic diffuse
Isotropic
ForegroundPoint
sources
Scaled in
fitting
Least-square fitting
routines: MINUIT etc.
modeleditor
(GUI)
Catalog
sources
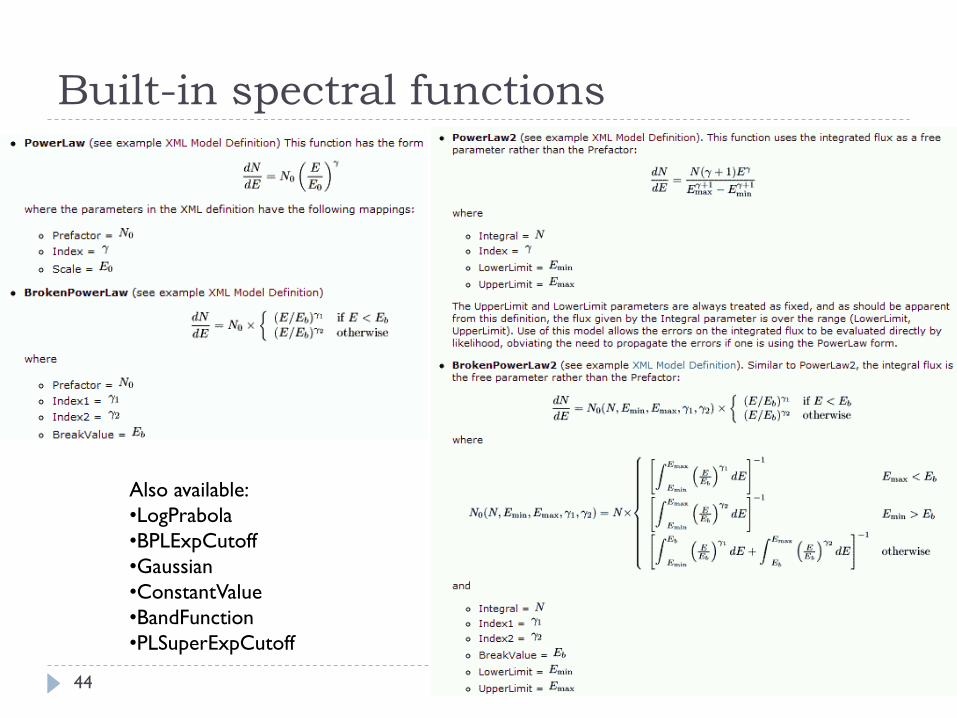
Built-in spectral functions
44
Also available:
•LogPrabola
•BPLExpCutoff
•Gaussian
•ConstantValue
•BandFunction
•PLSuperExpCutoff

Modeleditor
45 XML-format file … can be a part of the catalog XML file

Example session of “gtlike”
46
prompt> gtlike refit=yes plot=yes
Statistic to use (BINNED|UNBINNED) [UNBINNED]
Spacecraft file[none] spacecraft_data_file.fits
Event file[none] events_diffuse_filtered_gti.fits
Unbinned exposure map[none] expMap.fits
Exposure hypercube file[none] expCube.fits
Source model file[] src_model.xml
Response functions to use[P6_V3_DIFFUSE]
Optimizer (DRMNFB|NEWMINUIT|MINUIT|DRMNGB|LBFGS)
[DRMNFB]NEWMINUIT
(MORE OUTPUTS HERE...)
Computing TS values for each source (4 total)
....!
3C 273:
Prefactor: 10.7154 +/- 4.79318
Index: -2.39036 +/- 0.261339
Scale: 100
Npred: 28.651
ROI distance: 10.4409
TS value: 58.0328
3C 279:
Prefactor: 8.97673 +/- 5.45668
Index: -2.8986 +/- 0.470354
Scale: 100
Npred: 13.8568
ROI distance: 0
TS value: 17.8267
EG_v02:
Normalization: 1.11606 +/- 0.234866
Npred: 278.964
GAL_v02:
Value: 1.161 +/- 0.328156
Npred: 199.892
WARNING: Fit may be bad in range [100, 146.235] (MeV)
WARNING: Fit may be bad in range [4472.14, 6539.83] (MeV)
Total number of observed counts: 521
Total number of model events: 521.364
-log(Likelihood): 5979.486023
TS: Test statistics,
Behave like (TS)1/2 ~
(10.7 4.8)10-9(E/100)-2.390.26
TS=58
Be patient…

Fermiによる銀河団の観測 (Becktol+2009)
Bechtol et al., talk at TeV Particle Astrophysics (2009)
47

Fermiによる銀河団の観測 (Becktol+2009)
48
Bechtol et al., talk at TeV Particle Astrophysics (2009)

Fermiによる銀河団の観測 (Becktol+2009)
49
Bechtol et al., talk at TeV Particle Astrophysics (2009)

Fermi/LAT count map: Perseus
0.2-10 GeV
2008Aug-2009Sep
Ref: RASS (broad)
50

Fermi/LAT count map: Abell 2029
0.2-10 GeV
2008Aug-2009Sep
Ref: RASS (broad)
51
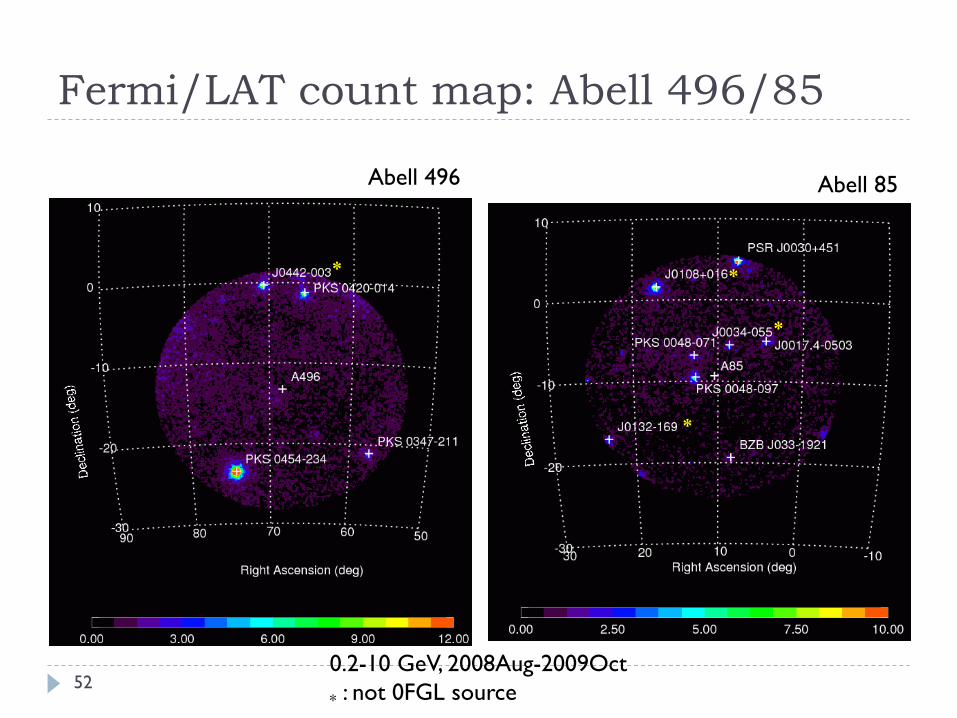
Fermi/LAT count map: Abell 496/85
0.2-10 GeV, 2008Aug-2009Oct
* : not 0FGL source
Abell 496 Abell 85
*
*
*
*
52

Fermi/LAT count map: Coma
0.2-10 GeV
2008Aug-2009Sep
* : not 0FGL source
Ref: RASS (broad)*
*
*
*
53

Fermi/LAT count map: Abell 3667
0.2-10 GeV
2008Aug-2009Sep
* : not 0FGL source
Ref: RASS (broad)
*
*
54

Fermi/LAT count map: Abell 4038
0.2-10 GeV
2008Aug-2009Sep
* : not 0FGL source
Ref: RASS (broad)
*
*
*
*
*
55

Upper limits
Name >100MeV
(95% C.L. )
>200MeV
(95% C.L. )
Bechtol et al.
(>100 MeV,
TeVPA 2009)
EGRET
(>100MeV,
Reimer+)
Note
Perseus ― ― 20 3.72 NGC1275
(point source)
Abell 2029 4.8 1.3 ― 7.49
Abell 496 1.2 0.61 ― 7.11
Abell 85 0.12 0.062 ― 6.32
Coma 0.88 0.44 0.6 3.81
Abell 3667 0.23 0.095 ― 3.82
Abell 4038 0.52 0.45 ― 3.60
[Unit: 10-8cm-2s-1]
Fermi Science Tools v.9.15.2, gtlike (unbinned),
point-like source, “PowerLaw2” model
Upper limits were calculated by Profile method
Preliminary
56
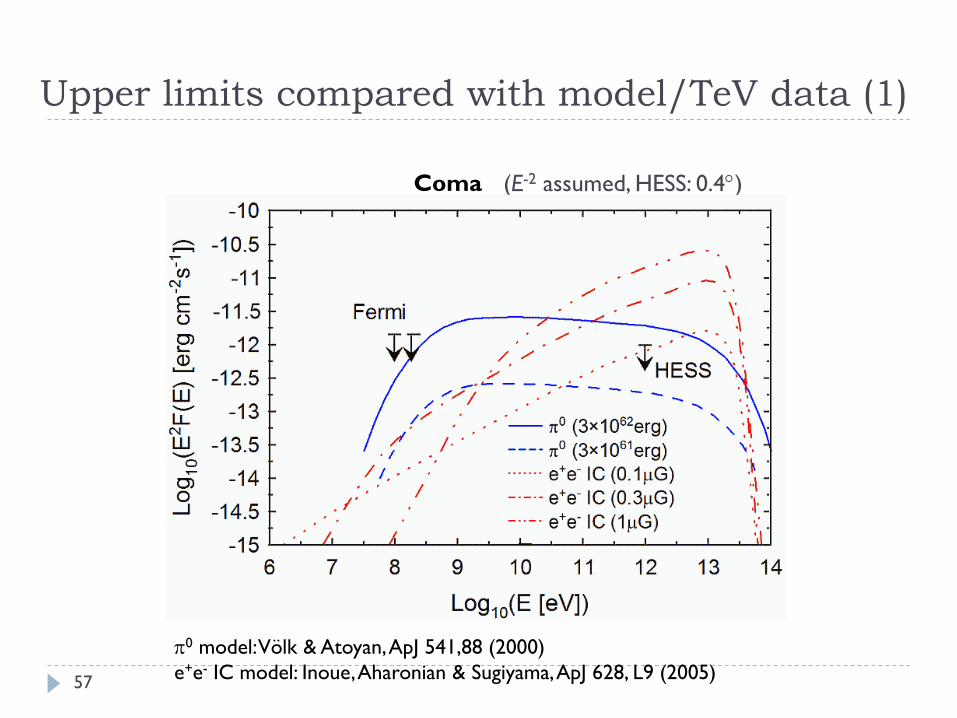
Upper limits compared with model/TeV data (1)
0 model: Völk & Atoyan, ApJ 541,88 (2000)
e+e- IC model: Inoue, Aharonian & Sugiyama, ApJ 628, L9 (2005)
Coma (E-2 assumed, HESS: 0.4)
57

Upper limits compared with model/TeV data (2)
A4038A3667EGRET EGRET
Fermi
Fermi
CANGAROO-III CANGAROO-III
Figures taken from Kiuchi et al., ApJ 704, 240 (2009)
58
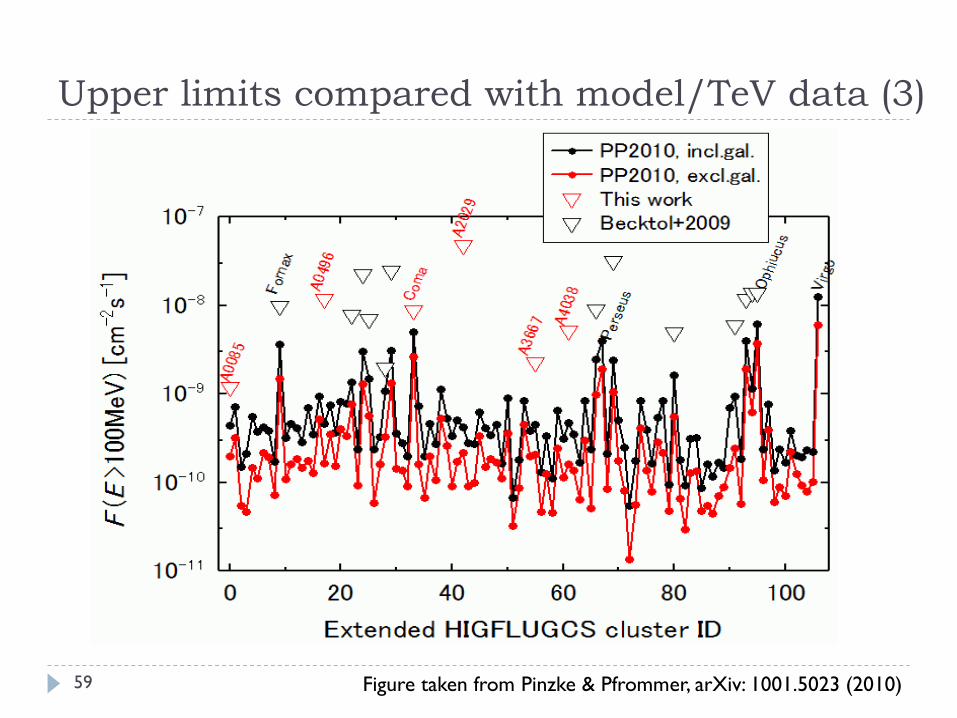
Upper limits compared with model/TeV data (3)
59 Figure taken from Pinzke & Pfrommer, arXiv: 1001.5023 (2010)

Gamma-ray luminosity upper limit
60

X-ray vs gamma-ray luminosity
61 X-ray luminosity: Reiprich & Bohringer, ApJ 567, 716 (2002) [HIFLUGSCS]
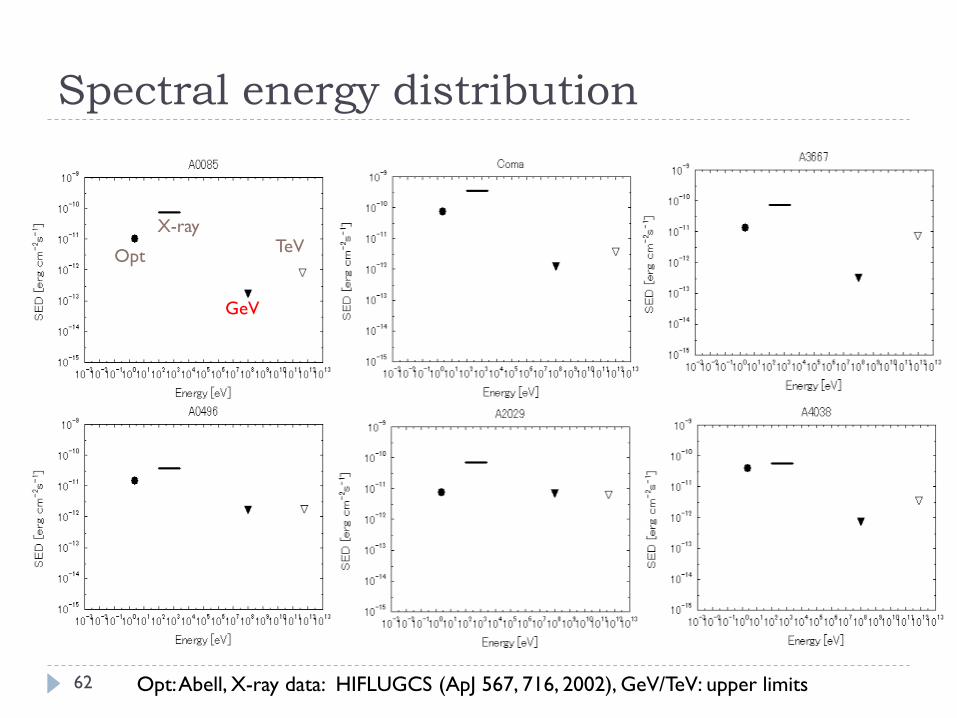
Spectral energy distribution
62 Opt: Abell, X-ray data: HIFLUGCS (ApJ 567, 716, 2002), GeV/TeV: upper limits
X-ray
GeV
TeVOpt
Summary
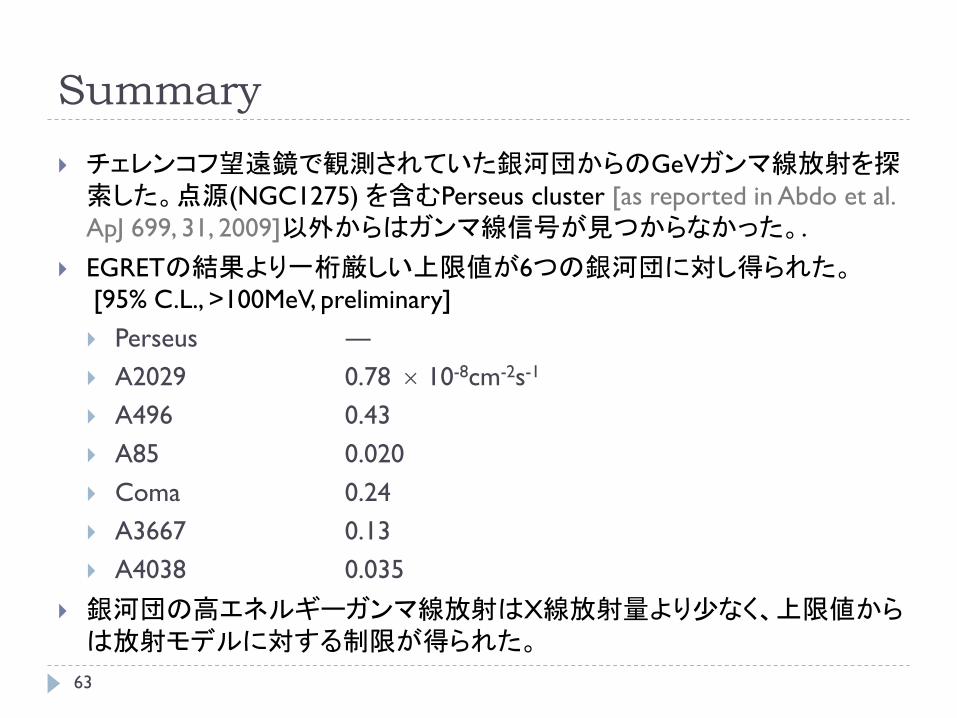
チェレンコフ望遠鏡で観測されていた銀河団からのGeVガンマ線放射を探索した。点源(NGC1275) を含むPerseus cluster [as reported in Abdo et al.
ApJ 699, 31, 2009]以外からはガンマ線信号が見つからなかった。.
EGRETの結果より一桁厳しい上限値が6つの銀河団に対し得られた。[95% C.L., >100MeV, preliminary]
Perseus ―
A2029 0.78 10-8cm-2s-1
A496 0.43
A85 0.020
Coma 0.24
A3667 0.13
A4038 0.035
銀河団の高エネルギーガンマ線放射はX線放射量より少なく、上限値からは放射モデルに対する制限が得られた。
63