Embed Size (px)
Citation preview
Final Results
for the year ended 30 June 2015.
Disclaimer
This presentation, which has been prepared by Regenersis PLC (“the Company”), includes statements that are, or may be
deemed to be, “forward-looking statements”. These forward-looking statements can be identified by the use of forward-
looking terminology, including the terms “believes”, “estimates”, “plans”, “projects”, “anticipates”, “expects”, “foresees”,
“intends”, “may”, “will” or “should” or, in each case, their negative or other variations or comparable terminology. These
forward-looking statements include matters that are not historical facts and include statements regarding the Company’s
intentions, beliefs or current expectations. By their nature, forward-looking statements involve risk and uncertainty because
they relate to future events and circumstances. A number of factors could cause actual results and developments to differ
materially from those expressed or implied by the forward looking statements. Any forward-looking statements in this
presentation reflect the Company’s view with respect to future events and other risks, uncertainties and assumptions
relating to the Company’s operations, results of operations, growth strategy and liquidity. The Company undertakes no
obligation publicly to release the results of any revisions or up-dates to any forward-looking statements in this presentation
that may occur due to change in its expectations or to reflect events or circumstances after the date of this presentation.
This presentation comprises information which is already in the public domain. No reliance may be placed for any
purposes whatsoever on the information contained in this document or on its completeness. None of the Company, its
advisers, or any other party is under any duty to update or inform you of any changes to the information contained in this
presentation.
2
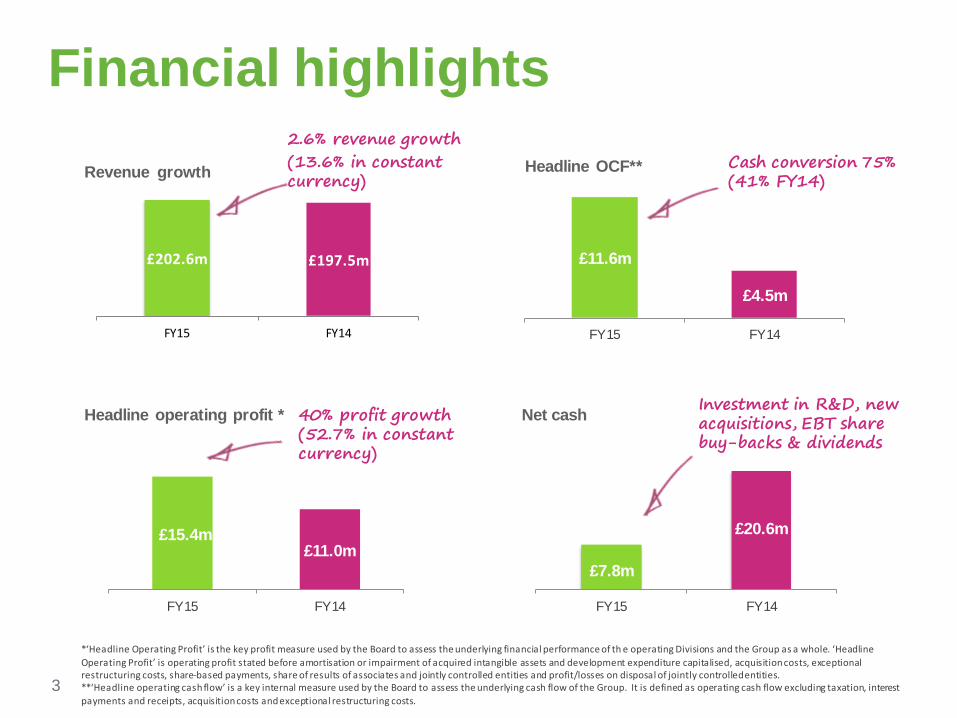
£7.8m
£20.6m
FY15 FY14
£202.6m £197.5m
FY15 FY14
Financial highlights2.6% revenue growth(13.6% in constant currency)Revenue growth
Headline operating profit *
Headline OCF** Cash conversion 75% (41% FY14)
Net cash
*‘Headline Operating Profit’ is the key profit measure used by the Board to assess the underlying financial performance of th e operating Divisions and the Group as a whole. ‘Headline
Operating Profit’ is operating profit stated before amortisation or impairment of acquired intangible assets and development expenditure capitalised, acquisition costs, exceptional restructuring costs, share-based payments, share of results of associates and jointly controlled entities and profit/losses on disposal of jointly controlled entities.**‘Headline operating cash flow’ is a key internal measure used by the Board to assess the underlying cash flow of the Group. It is defined as operating cash flow excluding taxation, interest
payments and receipts, acquisition costs and exceptional restructuring costs.
40% profit growth (52.7% in constant currency)
Investment in R&D, new acquisitions, EBT share buy-backs & dividends
£11.0m£15.4m
FY14FY15
£4.5m
£11.6m
FY14FY15
3
Overview
Solid results across divisions on a constant currency basis
Blancco significantly stronger – revenue, profit, technology, leadership team
Exploring strategic alternatives for the Aftermarket Services business (i.e. non-software)
Increased focus on Digital Security Software
Strengthened Board
4
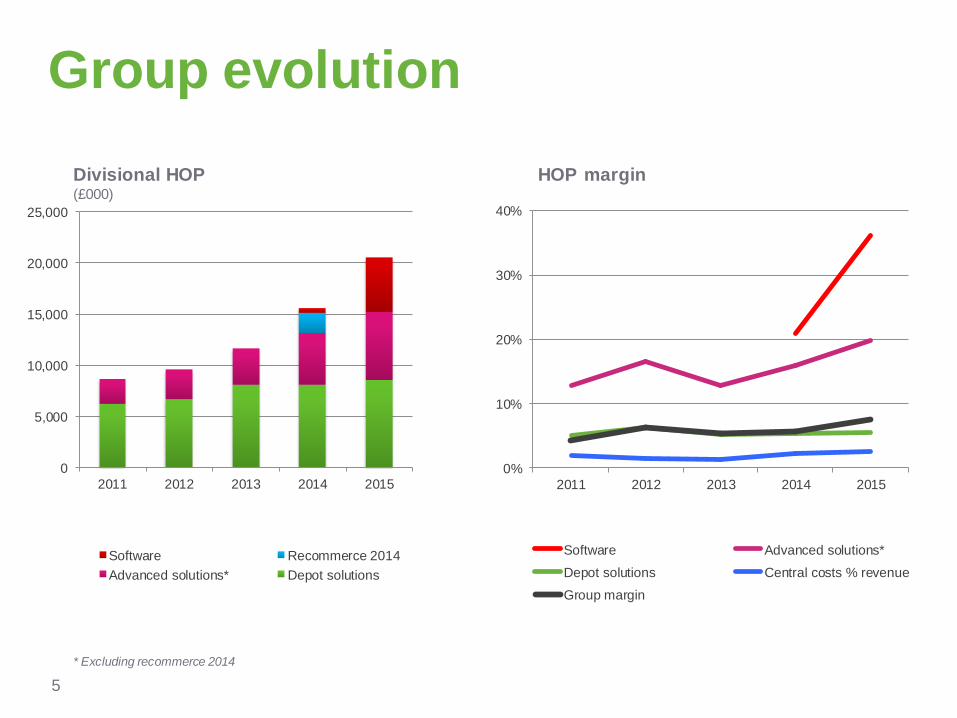
Group evolution
0
5,000
10,000
15,000
20,000
25,000
2011 2012 2013 2014 2015
Software Recommerce 2014
Advanced solutions* Depot solutions
0%
10%
20%
30%
40%
2011 2012 2013 2014 2015
Software Advanced solutions*
Depot solutions Central costs % revenue
Group margin
* Excluding recommerce 2014
Divisional HOP(£000)
HOP margin
5
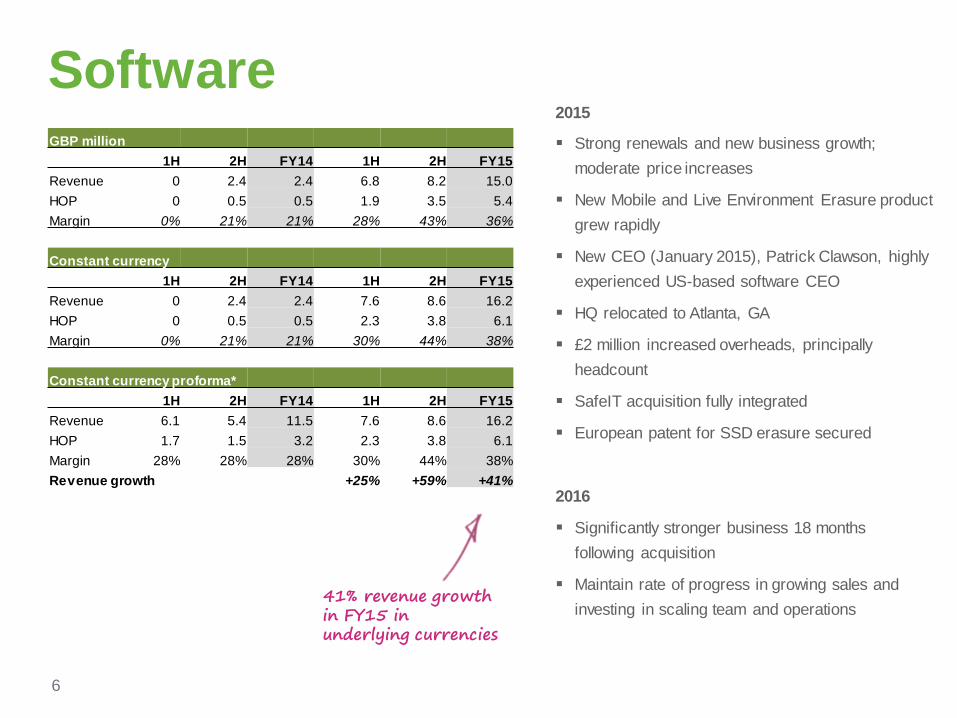
GBP million
1H 2H FY14 1H 2H FY15
Revenue 0 2.4 2.4 6.8 8.2 15.0
HOP 0 0.5 0.5 1.9 3.5 5.4
Margin 0% 21% 21% 28% 43% 36%
Constant currency
1H 2H FY14 1H 2H FY15
Revenue 0 2.4 2.4 7.6 8.6 16.2
HOP 0 0.5 0.5 2.3 3.8 6.1
Margin 0% 21% 21% 30% 44% 38%
Constant currency proforma*
1H 2H FY14 1H 2H FY15
Revenue 6.1 5.4 11.5 7.6 8.6 16.2
HOP 1.7 1.5 3.2 2.3 3.8 6.1
Margin 28% 28% 28% 30% 44% 38%
Revenue growth +25% +59% +41%
2015
Strong renewals and new business growth;
moderate price increases
New Mobile and Live Environment Erasure product
grew rapidly
New CEO (January 2015), Patrick Clawson, highly
experienced US-based software CEO
HQ relocated to Atlanta, GA
£2 million increased overheads, principally
headcount
SafeIT acquisition fully integrated
European patent for SSD erasure secured
2016
Significantly stronger business 18 months
following acquisition
Maintain rate of progress in growing sales and
investing in scaling team and operations
Software
41% revenue growth in FY15 in underlying currencies
6
Video
7
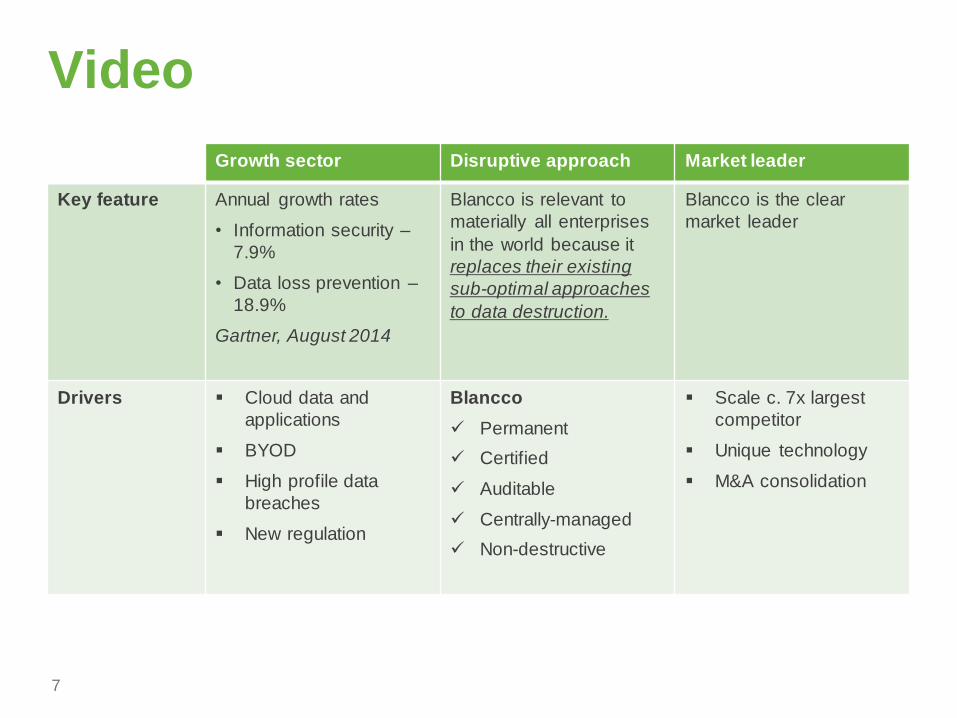
Growth sector Disruptive approach Market leader
Key feature Annual growth rates
• Information security –
7.9%
• Data loss prevention –
18.9%
Gartner, August 2014
Blancco is relevant to
materially all enterprises
in the world because it
replaces their existing
sub-optimal approaches
to data destruction.
Blancco is the clear
market leader
Drivers Cloud data and
applications
BYOD
High profile data
breaches
New regulation
Blancco
Permanent
Certified
Auditable
Centrally-managed
Non-destructive
Scale c. 7x largest
competitor
Unique technology
M&A consolidation
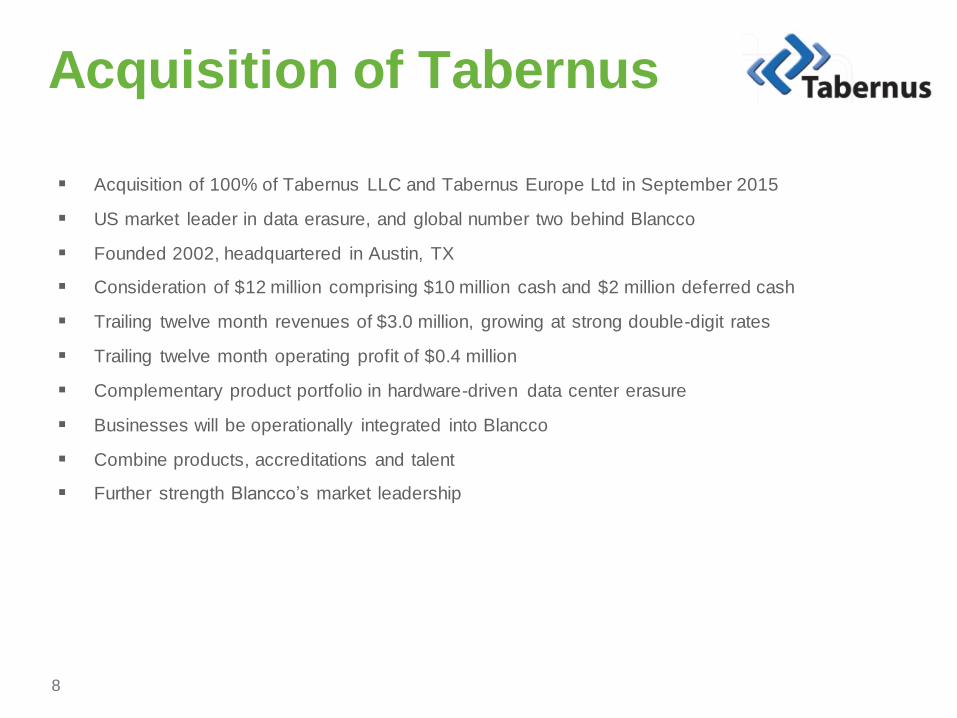
Acquisition of Tabernus
Acquisition of 100% of Tabernus LLC and Tabernus Europe Ltd in September 2015
US market leader in data erasure, and global number two behind Blancco
Founded 2002, headquartered in Austin, TX
Consideration of $12 million comprising $10 million cash and $2 million deferred cash
Trailing twelve month revenues of $3.0 million, growing at strong double-digit rates
Trailing twelve month operating profit of $0.4 million
Complementary product portfolio in hardware-driven data center erasure
Businesses will be operationally integrated into Blancco
Combine products, accreditations and talent
Further strength Blancco’s market leadership
8
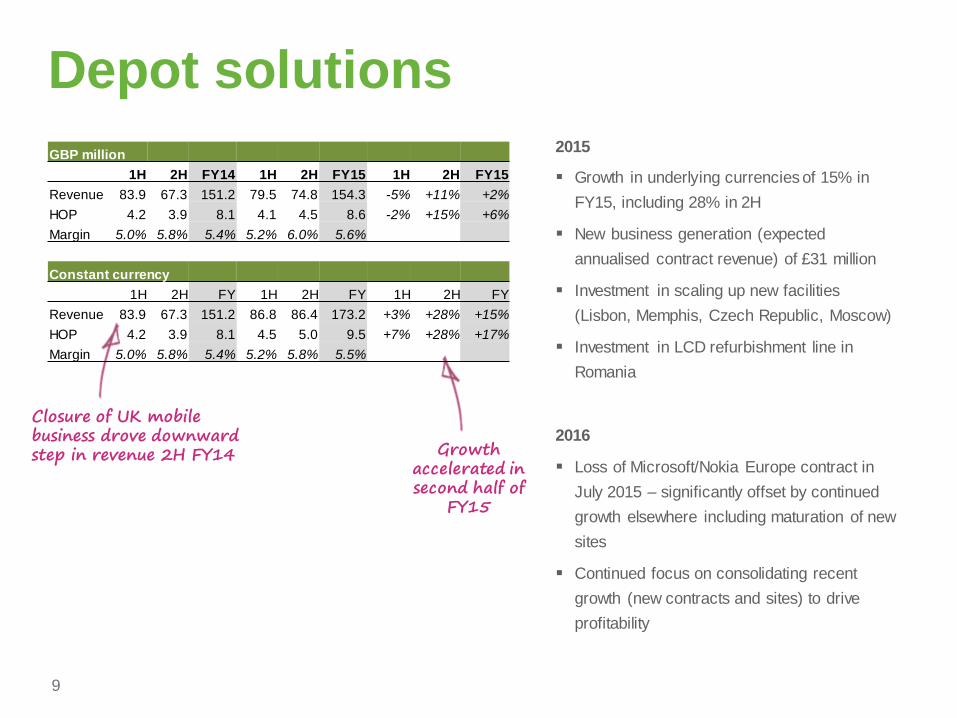
Depot solutions
2015
Growth in underlying currencies of 15% in
FY15, including 28% in 2H
New business generation (expected
annualised contract revenue) of £31 million
Investment in scaling up new facilities
(Lisbon, Memphis, Czech Republic, Moscow)
Investment in LCD refurbishment line in
Romania
2016
Loss of Microsoft/Nokia Europe contract in
July 2015 – significantly offset by continued
growth elsewhere including maturation of new
sites
Continued focus on consolidating recent
growth (new contracts and sites) to drive
profitability
Closure of UK mobile business drove downward step in revenue 2H FY14 Growth
accelerated in second half of
FY15
GBP million
1H 2H FY14 1H 2H FY15 1H 2H FY15
Revenue 83.9 67.3 151.2 79.5 74.8 154.3 -5% +11% +2%
HOP 4.2 3.9 8.1 4.1 4.5 8.6 -2% +15% +6%
Margin 5.0% 5.8% 5.4% 5.2% 6.0% 5.6%
Constant currency
1H 2H FY 1H 2H FY 1H 2H FY
Revenue 83.9 67.3 151.2 86.8 86.4 173.2 +3% +28% +15%
HOP 4.2 3.9 8.1 4.5 5.0 9.5 +7% +28% +17%
Margin 5.0% 5.8% 5.4% 5.2% 5.8% 5.5%
9
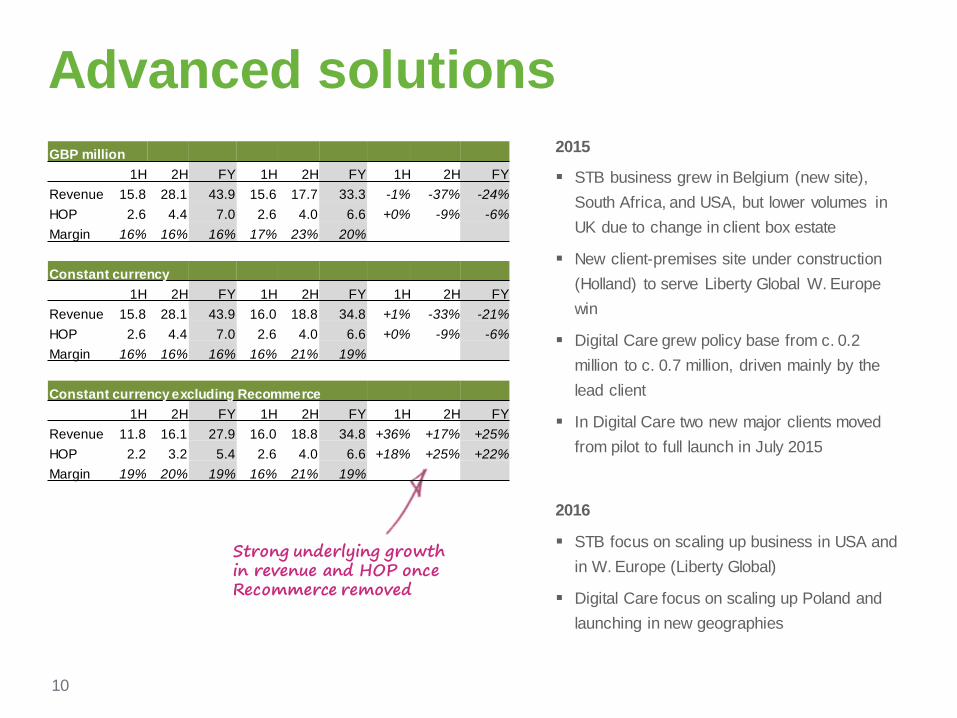
Advanced solutions
Strong underlying growth in revenue and HOP once Recommerce removed
2015
STB business grew in Belgium (new site),
South Africa, and USA, but lower volumes in
UK due to change in client box estate
New client-premises site under construction
(Holland) to serve Liberty Global W. Europe
win
Digital Care grew policy base from c. 0.2
million to c. 0.7 million, driven mainly by the
lead client
In Digital Care two new major clients moved
from pilot to full launch in July 2015
2016
STB focus on scaling up business in USA and
in W. Europe (Liberty Global)
Digital Care focus on scaling up Poland and
launching in new geographies
GBP million
1H 2H FY 1H 2H FY 1H 2H FY
Revenue 15.8 28.1 43.9 15.6 17.7 33.3 -1% -37% -24%
HOP 2.6 4.4 7.0 2.6 4.0 6.6 +0% -9% -6%
Margin 16% 16% 16% 17% 23% 20%
Constant currency
1H 2H FY 1H 2H FY 1H 2H FY
Revenue 15.8 28.1 43.9 16.0 18.8 34.8 +1% -33% -21%
HOP 2.6 4.4 7.0 2.6 4.0 6.6 +0% -9% -6%
Margin 16% 16% 16% 16% 21% 19%
Constant currency excluding Recommerce
1H 2H FY 1H 2H FY 1H 2H FY
Revenue 11.8 16.1 27.9 16.0 18.8 34.8 +36% +17% +25%
HOP 2.2 3.2 5.4 2.6 4.0 6.6 +18% +25% +22%
Margin 19% 20% 19% 16% 21% 19%
10
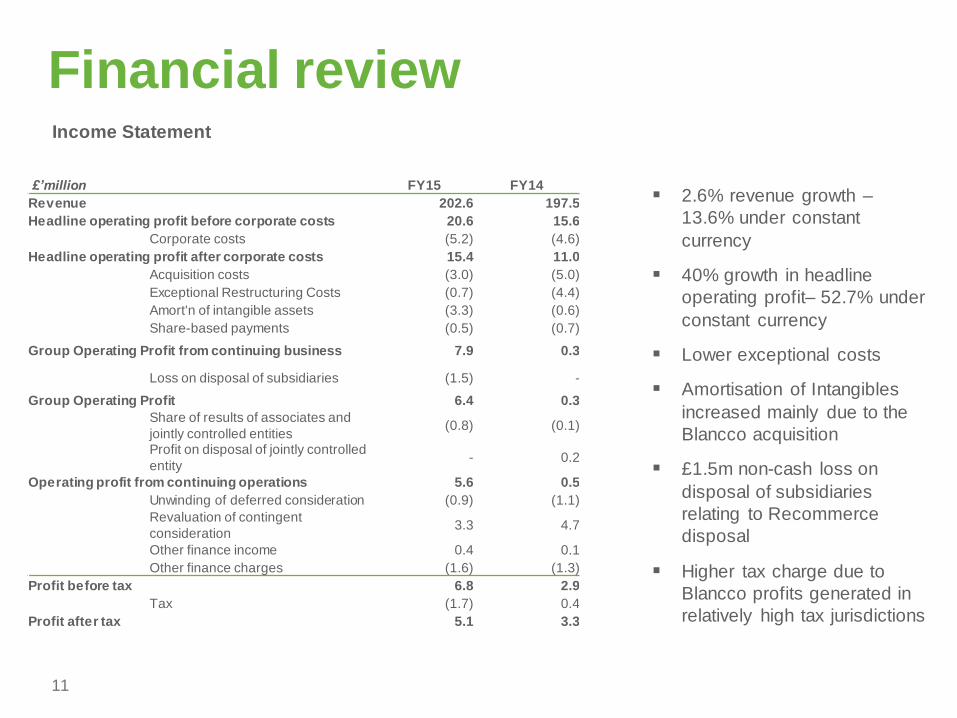
Financial reviewIncome Statement
2.6% revenue growth –
13.6% under constant
currency
40% growth in headline
operating profit– 52.7% under
constant currency
Lower exceptional costs
Amortisation of Intangibles
increased mainly due to the
Blancco acquisition
£1.5m non-cash loss on
disposal of subsidiaries
relating to Recommerce
disposal
Higher tax charge due to
Blancco profits generated in
relatively high tax jurisdictions
11
£’million FY15 FY14
Revenue 202.6 197.5
Headline operating profit before corporate costs 20.6 15.6
Corporate costs (5.2) (4.6)
Headline operating profit after corporate costs 15.4 11.0
Acquisition costs (3.0) (5.0)
Exceptional Restructuring Costs (0.7) (4.4)
Amort'n of intangible assets (3.3) (0.6)
Share-based payments (0.5) (0.7)
Group Operating Profit from continuing business 7.9 0.3
Loss on disposal of subsidiaries (1.5) -
Group Operating Profit 6.4 0.3
Share of results of associates and
jointly controlled entities(0.8) (0.1)
Profit on disposal of jointly controlled
entity- 0.2
Operating profit from continuing operations 5.6 0.5
Unwinding of deferred consideration (0.9) (1.1)
Revaluation of contingent
consideration3.3 4.7
Other finance income 0.4 0.1
Other finance charges (1.6) (1.3)
Profit before tax 6.8 2.9
Tax (1.7) 0.4
Profit after tax 5.1 3.3
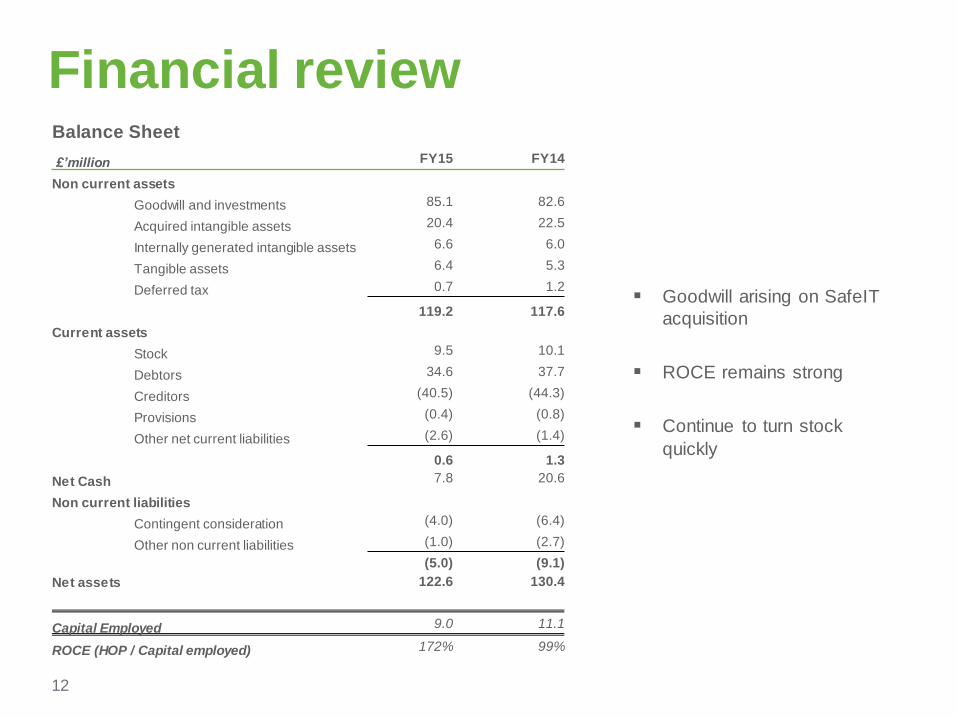
Financial review
Goodwill arising on SafeIT
acquisition
ROCE remains strong
Continue to turn stock
quickly
£’million FY15 FY14
Non current assets
Goodwill and investments 85.1 82.6
Acquired intangible assets 20.4 22.5
Internally generated intangible assets 6.6 6.0
Tangible assets 6.4 5.3
Deferred tax 0.7 1.2
119.2 117.6
Current assets
Stock 9.5 10.1
Debtors 34.6 37.7
Creditors (40.5) (44.3)
Provisions (0.4) (0.8)
Other net current liabilities (2.6) (1.4)
0.6 1.3
Net Cash 7.8 20.6
Non current liabilities
Contingent consideration (4.0) (6.4)
Other non current liabilities (1.0) (2.7)
(5.0) (9.1)
Net assets 122.6 130.4
Capital Employed 9.0 11.1
ROCE (HOP / Capital employed) 172% 99%
12
Balance Sheet
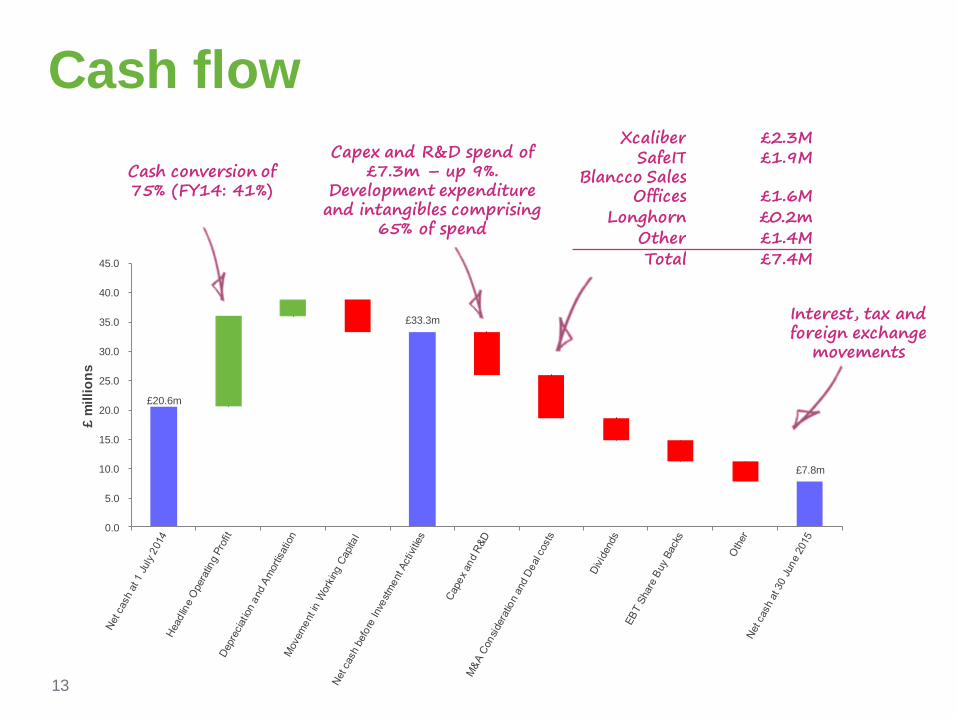
£20.6m
£33.3m
£7.8m
0.0
5.0
10.0
15.0
20.0
25.0
30.0
35.0
40.0
45.0
£ m
illi
on
s
Capex and R&D spend of £7.3m – up 9%.
Development expenditure and intangibles comprising
65% of spend
Xcaliber £2.3MSafeIT £1.9M
Blancco Sales Offices £1.6M
Longhorn £0.2mOther £1.4MTotal £7.4M
Interest, tax and foreign exchange
movements
Cash conversion of 75% (FY14: 41%)
Cash flow
13
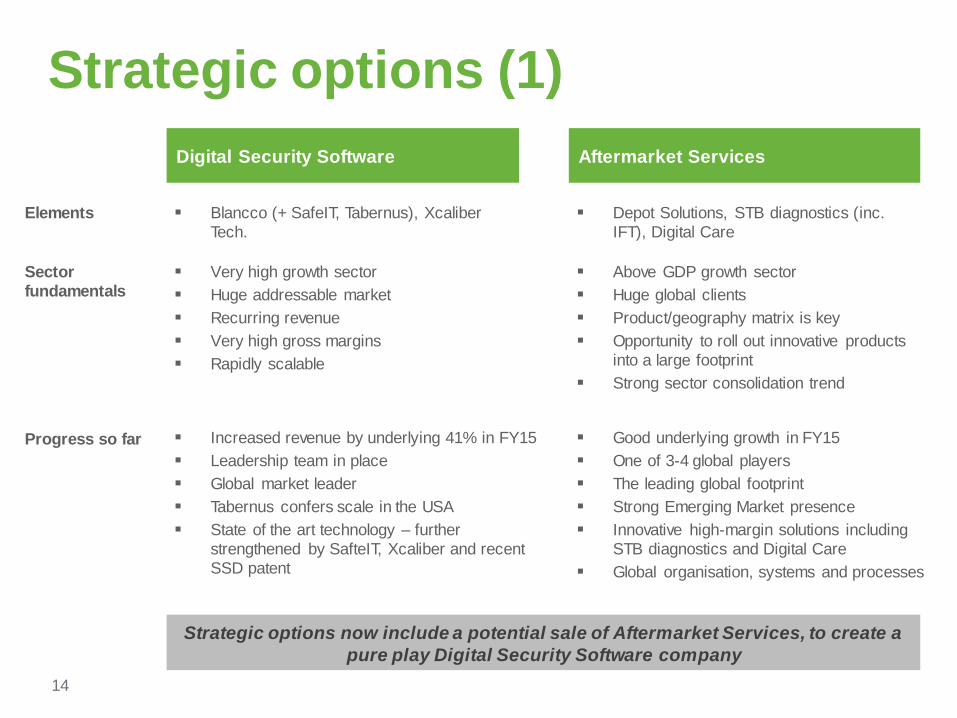
Strategic options (1)
Very high growth sector
Huge addressable market
Recurring revenue
Very high gross margins
Rapidly scalable
Above GDP growth sector
Huge global clients
Product/geography matrix is key
Opportunity to roll out innovative products
into a large footprint
Strong sector consolidation trend
Digital Security Software Aftermarket Services
14
Blancco (+ SafeIT, Tabernus), Xcaliber
Tech.
Depot Solutions, STB diagnostics (inc.
IFT), Digital Care
Increased revenue by underlying 41% in FY15
Leadership team in place
Global market leader
Tabernus confers scale in the USA
State of the art technology – further
strengthened by SafteIT, Xcaliber and recent
SSD patent
Sector
fundamentals
Elements
Progress so far Good underlying growth in FY15
One of 3-4 global players
The leading global footprint
Strong Emerging Market presence
Innovative high-margin solutions including
STB diagnostics and Digital Care
Global organisation, systems and processes
Strategic options now include a potential sale of Aftermarket Services, to create a
pure play Digital Security Software company
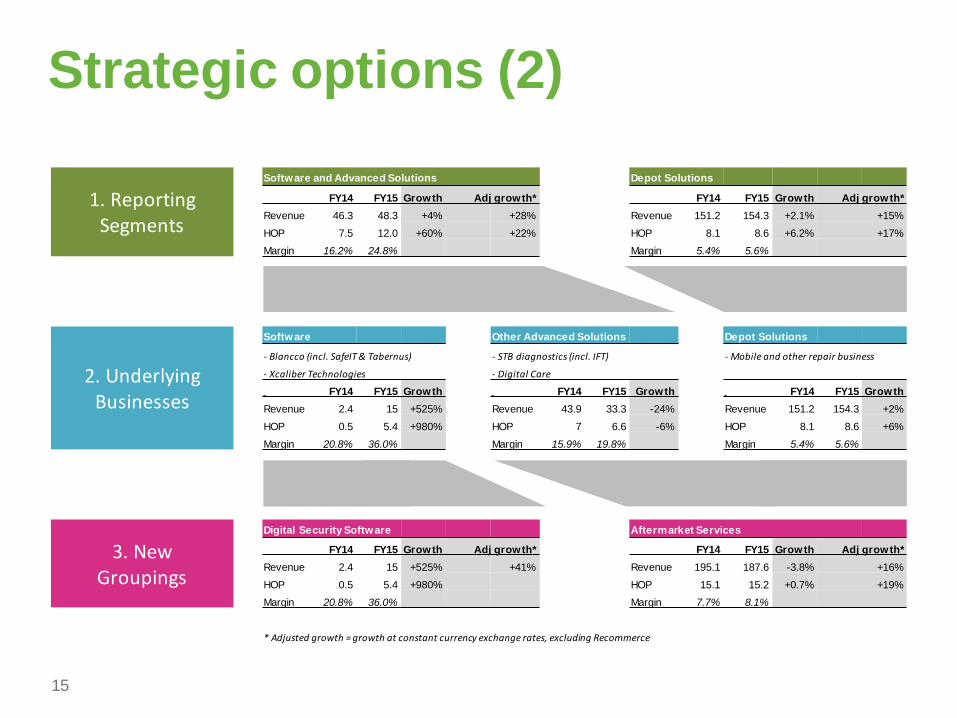
Strategic options (2)
1. Reporting Segments
Software and Advanced Solutions Depot Solutions
FY14 FY15 Growth Adj growth* FY14 FY15 Growth Adj growth*
Revenue 46.3 48.3 +4% +28% Revenue 151.2 154.3 +2.1% +15%
HOP 7.5 12.0 +60% +22% HOP 8.1 8.6 +6.2% +17%
Margin 16.2% 24.8% Margin 5.4% 5.6%
2. Underlying Businesses
Software Other Advanced Solutions Depot Solutions
- Blancco (incl. SafeIT & Tabernus) - STB diagnostics (incl. IFT) - Mobile and other repair business
- Xcaliber Technologies - Digital Care
FY14 FY15 Growth FY14 FY15 Growth FY14 FY15 Growth
Revenue 2.4 15 +525% Revenue 43.9 33.3 -24% Revenue 151.2 154.3 +2%
HOP 0.5 5.4 +980% HOP 7 6.6 -6% HOP 8.1 8.6 +6%
Margin 20.8% 36.0% Margin 15.9% 19.8% Margin 5.4% 5.6%
3. New Groupings
Digital Security Software Aftermarket Services
FY14 FY15 Growth Adj growth* FY14 FY15 Growth Adj growth*
Revenue 2.4 15 +525% +41% Revenue 195.1 187.6 -3.8% +16%
HOP 0.5 5.4 +980% HOP 15.1 15.2 +0.7% +19%
Margin 20.8% 36.0% Margin 7.7% 8.1%
* Adjusted growth = growth at constant currency exchange rates, excluding Recommerce
15
Leadership
Executive management
Chairman focused on strategic sale process
Transition to Non-executive Chairman upon successful conclusion
Two divisional CEOs now have commercial responsibility for 100% of the business
Move to single Group CEO in a pure-play software group scenario
Non-executives
Welcome Tom Skelton, previously non-executive director of Micro Focus International Plc
Thanks to Tom Russell who shortly steps down from the board
16
Conclusions and outlook
Trading in the current financial year to date, and outlook for the remainder of the year, are in line
with expectations.
Following 18 months of intensive organic and M&A activity since acquisition, Blancco is a much
larger and stronger business, with a high quality US-based management team, exciting new
products, an even stronger market position, and a substantially increased revenue base. Blancco
is expected to continue to grow revenue and profits rapidly in FY16.
The Aftermarket Services business (including Depot Solutions, Digital Care and Set Top Box
diagnostics) is solidly placed and the Group is strongly positioned financially to pursue the
potential strategic process identified.
The board aims to successfully conclude its exploration of strategic alternatives by March 2016, at
which point the Board would transition from the current interim arrangement to having a single
Group CEO.
In this process the Board is focused on both the delivery of shareholder value and a significant
return of cash to shareholders.
17