Embed Size (px)
Citation preview
For updated information, please visit www.ibef.org January 2018
FINANCIAL SERVICES
Table of Content
Executive Summary………………….……3
Advantage India…………………….……. 4
Market Overview ……………………..…...6
Recent Trends and Strategies....……….17
Case studies…..………….…………….....30
Growth Drivers and Opportunities……….20
Key Industry Organisations...…….....….. 33
Useful Information……….……….......….. 35
For updated information, please visit www.ibef.org 3 Financial Services
EXECUTIVE SUMMARY
Source: IMF, ICRA, Economic Times, Capgemini Wealth Report, Aranca Research, ^ - as per a report by EY
In 2016, India’s Gross National Savings (GNS), as a percentage of GDP, stood at 28.9 per cent, as against
the GNS of developed nations like the UK (15.1 per cent) and that of emerging nations like Brazil (15.8 per
cent) and Russia (28.6 per cent).
Gross national savings
above 30 per cent of
GDP
India has 219,000 high net worth individuals having net wealth of US$ 877 billion as of 2016, and the
population of HNWIs is expected to double by 2020.
India’s HNWI population
to double by 2020
Mutual fund industry AUM recorded a CAGR of 15.25 per cent over FY07–17. India is considered one of the
preferred investment destinations globally. The Association of Mutual Funds in India (AMFI) is targeting
nearly five fold growth in assets under management (AUM) to INR 95 lakh crore (US$ 1.47 trillion) and a
more than three times growth in investor accounts to 130 million by 2025.
Robust AUM growth
A total of 153 initial public offers (IPOs) were issued in the Indian stock markets in 2017, which raised a total of
US$ 11.6 billion.^
Fundraising via IPOs on
the rise
Note: HNWI – High Net Worth Individual, NBFC – Non-Banking Financial Company, AUM – Assets Under Management
Financial Services
ADVANTAGE INDIA
For updated information, please visit www.ibef.org 5 Financial Services
ADVANTAGE INDIA
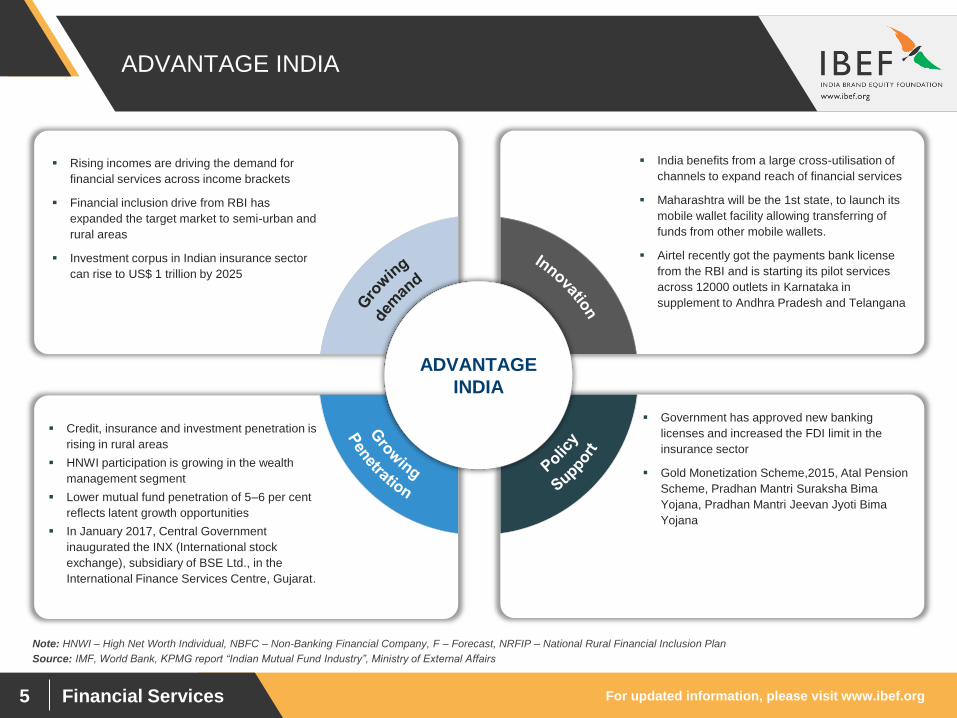
Rising incomes are driving the demand for
financial services across income brackets
Financial inclusion drive from RBI has
expanded the target market to semi-urban and
rural areas
Investment corpus in Indian insurance sector
can rise to US$ 1 trillion by 2025
India benefits from a large cross-utilisation of
channels to expand reach of financial services
Maharashtra will be the 1st state, to launch its
mobile wallet facility allowing transferring of
funds from other mobile wallets.
Airtel recently got the payments bank license
from the RBI and is starting its pilot services
across 12000 outlets in Karnataka in
supplement to Andhra Pradesh and Telangana
Credit, insurance and investment penetration is
rising in rural areas
HNWI participation is growing in the wealth
management segment
Lower mutual fund penetration of 5–6 per cent
reflects latent growth opportunities
In January 2017, Central Government
inaugurated the INX (International stock
exchange), subsidiary of BSE Ltd., in the
International Finance Services Centre, Gujarat.
Government has approved new banking
licenses and increased the FDI limit in the
insurance sector
Gold Monetization Scheme,2015, Atal Pension
Scheme, Pradhan Mantri Suraksha Bima
Yojana, Pradhan Mantri Jeevan Jyoti Bima
Yojana
ADVANTAGE
INDIA
Source: IMF, World Bank, KPMG report “Indian Mutual Fund Industry”, Ministry of External Affairs
Note: HNWI – High Net Worth Individual, NBFC – Non-Banking Financial Company, F – Forecast, NRFIP – National Rural Financial Inclusion Plan
Financial Services
MARKET
OVERVIEW
For updated information, please visit www.ibef.org 7 Financial Services
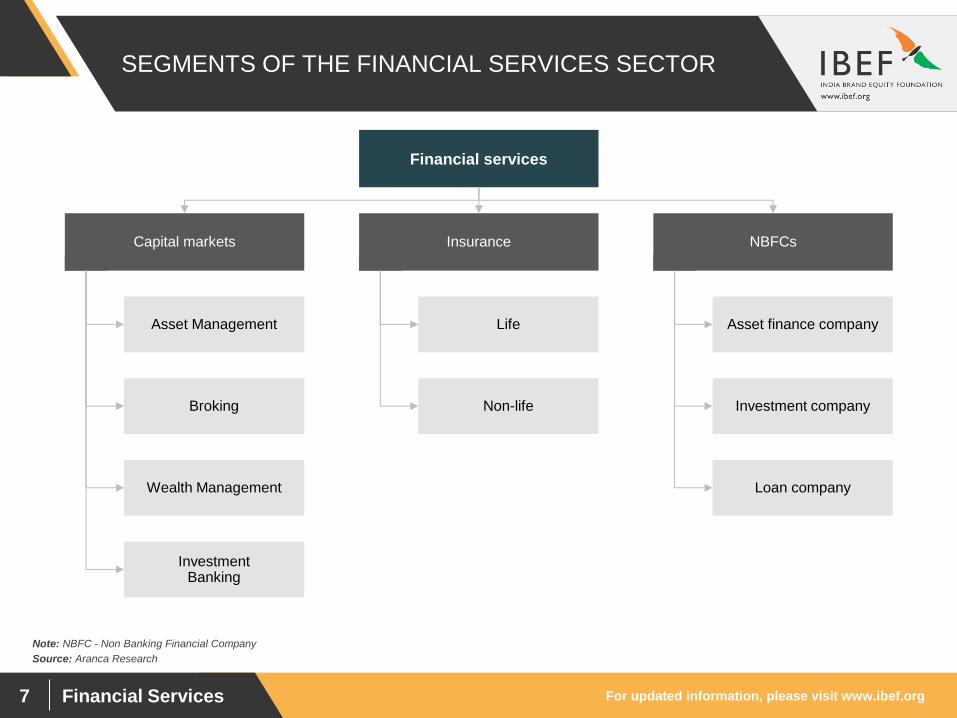
SEGMENTS OF THE FINANCIAL SERVICES SECTOR
Source: Aranca Research
Note: NBFC - Non Banking Financial Company
Financial services
Asset Management
Broking
Wealth Management
Investment Banking
Life
Non-life
Asset finance company
Investment company
Loan company
Capital markets Insurance NBFCs
For updated information, please visit www.ibef.org 8 Financial Services
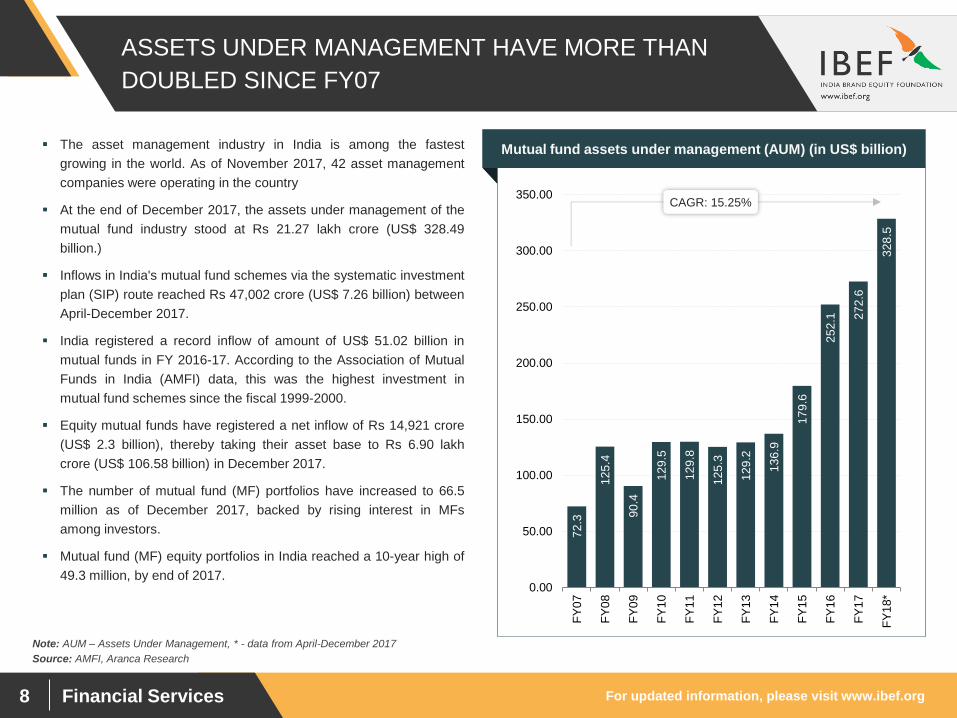
ASSETS UNDER MANAGEMENT HAVE MORE THAN
DOUBLED SINCE FY07
Source: AMFI, Aranca Research
72
.3
12
5.4
90
.4
12
9.5
12
9.8
12
5.3
12
9.2
13
6.9
17
9.6
25
2.1
27
2.6
32
8.5
0.00
50.00
100.00
150.00
200.00
250.00
300.00
350.00
FY
07
FY
08
FY
09
FY
10
FY
11
FY
12
FY
13
FY
14
FY
15
FY
16
FY
17
FY
18*
The asset management industry in India is among the fastest
growing in the world. As of November 2017, 42 asset management
companies were operating in the country
At the end of December 2017, the assets under management of the
mutual fund industry stood at Rs 21.27 lakh crore (US$ 328.49
billion.)
Inflows in India's mutual fund schemes via the systematic investment
plan (SIP) route reached Rs 47,002 crore (US$ 7.26 billion) between
April-December 2017.
India registered a record inflow of amount of US$ 51.02 billion in
mutual funds in FY 2016-17. According to the Association of Mutual
Funds in India (AMFI) data, this was the highest investment in
mutual fund schemes since the fiscal 1999-2000.
Equity mutual funds have registered a net inflow of Rs 14,921 crore
(US$ 2.3 billion), thereby taking their asset base to Rs 6.90 lakh
crore (US$ 106.58 billion) in December 2017.
The number of mutual fund (MF) portfolios have increased to 66.5
million as of December 2017, backed by rising interest in MFs
among investors.
Mutual fund (MF) equity portfolios in India reached a 10-year high of
49.3 million, by end of 2017.
Visakhapatnam port traffic (million tonnes) Mutual fund assets under management (AUM) (in US$ billion)
CAGR: 15.25%
Note: AUM – Assets Under Management, * - data from April-December 2017
For updated information, please visit www.ibef.org 9 Financial Services
CORPORATE INVESTORS ARE BY FAR THE LARGEST
INVESTOR IN MUTUAL FUNDS CATEGORY
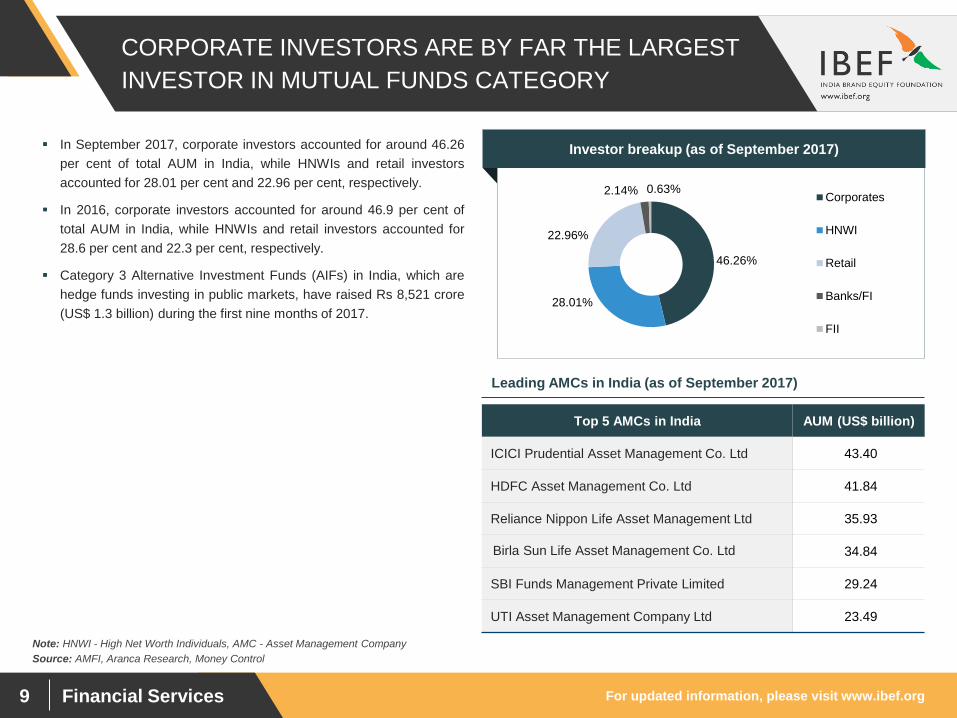
In September 2017, corporate investors accounted for around 46.26
per cent of total AUM in India, while HNWIs and retail investors
accounted for 28.01 per cent and 22.96 per cent, respectively.
In 2016, corporate investors accounted for around 46.9 per cent of
total AUM in India, while HNWIs and retail investors accounted for
28.6 per cent and 22.3 per cent, respectively.
Category 3 Alternative Investment Funds (AIFs) in India, which are
hedge funds investing in public markets, have raised Rs 8,521 crore
(US$ 1.3 billion) during the first nine months of 2017.
Source: AMFI, Aranca Research, Money Control
Leading AMCs in India (as of September 2017)
46.26%
28.01%
22.96%
2.14% 0.63% Corporates
HNWI
Retail
Banks/FI
FII
Note: HNWI - High Net Worth Individuals, AMC - Asset Management Company
Top 5 AMCs in India AUM (US$ billion)
ICICI Prudential Asset Management Co. Ltd 43.40
HDFC Asset Management Co. Ltd 41.84
Reliance Nippon Life Asset Management Ltd 35.93
Birla Sun Life Asset Management Co. Ltd 34.84
SBI Funds Management Private Limited 29.24
UTI Asset Management Company Ltd 23.49
Investor breakup (as of September 2017)
For updated information, please visit www.ibef.org 10 Financial Services
BROKING: EQUITY MARKET TURNOVER INCREASED
SIGNIFICANTLY IN RECENT YEARS
Source: National Stock Exchange, SEBI,
Note: CAGR – Compounded Annual Growth Rate; NSE – National Stock Exchange, ^ - as per World Bank's Ease of Doing Business 2018 report, CY – calendar year
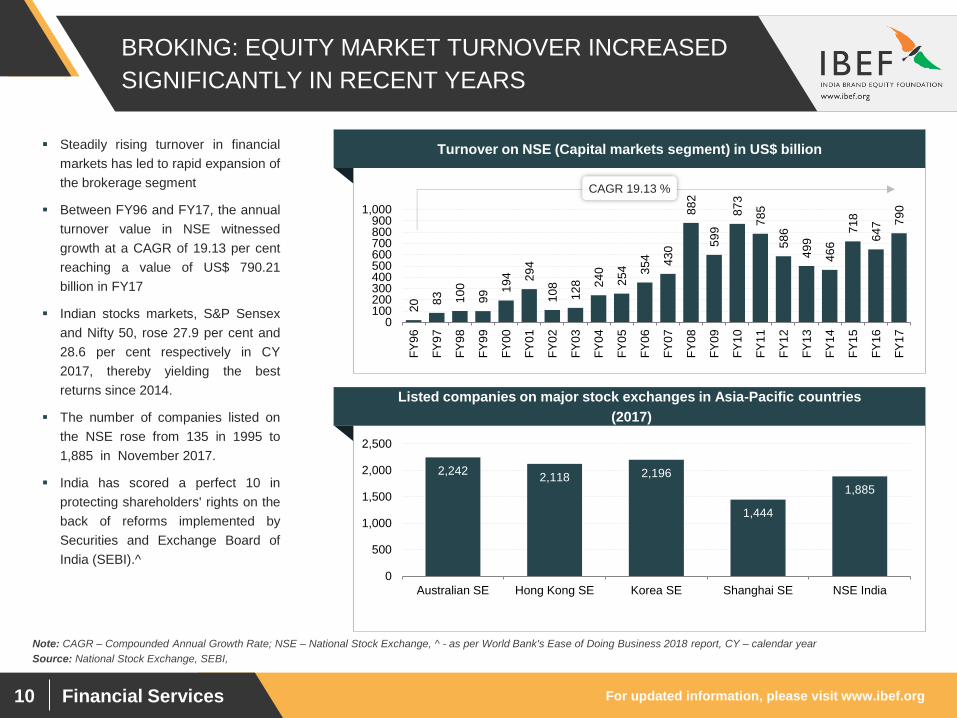
Steadily rising turnover in financial
markets has led to rapid expansion of
the brokerage segment
Between FY96 and FY17, the annual
turnover value in NSE witnessed
growth at a CAGR of 19.13 per cent
reaching a value of US$ 790.21
billion in FY17
Indian stocks markets, S&P Sensex
and Nifty 50, rose 27.9 per cent and
28.6 per cent respectively in CY
2017, thereby yielding the best
returns since 2014.
The number of companies listed on
the NSE rose from 135 in 1995 to
1,885 in November 2017.
India has scored a perfect 10 in
protecting shareholders' rights on the
back of reforms implemented by
Securities and Exchange Board of
India (SEBI).^
Turnover on NSE (Capital markets segment) in US$ billion
2,242 2,118 2,196
1,444
1,885
0
500
1,000
1,500
2,000
2,500
Australian SE Hong Kong SE Korea SE Shanghai SE NSE India
20
83
10
0
99
19
4
29
4
10
8
12
8
24
0
25
4
35
4
43
0
88
2
59
9
87
3
78
5
58
6
49
9
46
6
71
8
64
7 79
0
0100200300400500600700800900
1,000
FY
96
FY
97
FY
98
FY
99
FY
00
FY
01
FY
02
FY
03
FY
04
FY
05
FY
06
FY
07
FY
08
FY
09
FY
10
FY
11
FY
12
FY
13
FY
14
FY
15
FY
16
FY
17
CAGR 19.13 %
Listed companies on major stock exchanges in Asia-Pacific countries
(2017)
For updated information, please visit www.ibef.org 11 Financial Services
VIBRANT CAPITAL MARKET EVIDENT THROUGH
LARGE NUMBER OF LISTINGS
Companies listed on NSE and BSE
Amount raised by IPOs (US$ million)
5,8
50
6,0
49
6,2
68
6,3
61
6,4
45
6,6
41
6,7
79
6,8
77
7,0
24
7,3
57
7,7
19
76
51
75
01
0
1,000
2,000
3,000
4,000
5,000
6,000
7,000
8,000
9,000
FY
06
FY
07
FY
08
FY
09
FY
10
FY
11
FY
12
FY
13
FY
14
FY
15
FY
16
FY
17
FY
18*
31
8
3,8
99
5,1
73
92
1
1,0
15
18
8
47
2
2,3
15
4,5
35
10
,88
8
0
2,000
4,000
6,000
8,000
10,000
12,000
FY09 FY10 FY11 FY12 FY13 FY14 FY15 FY16 FY17 FY18*
Source: SEBI, ^ - as per a report by EY
Note: FII – Foreign Institutional Investors, NSE – National Stock Exchange, BSE – Bombay Stock Exchange, * - As of December 2017, ^ - as per a study by rating agency ICRA
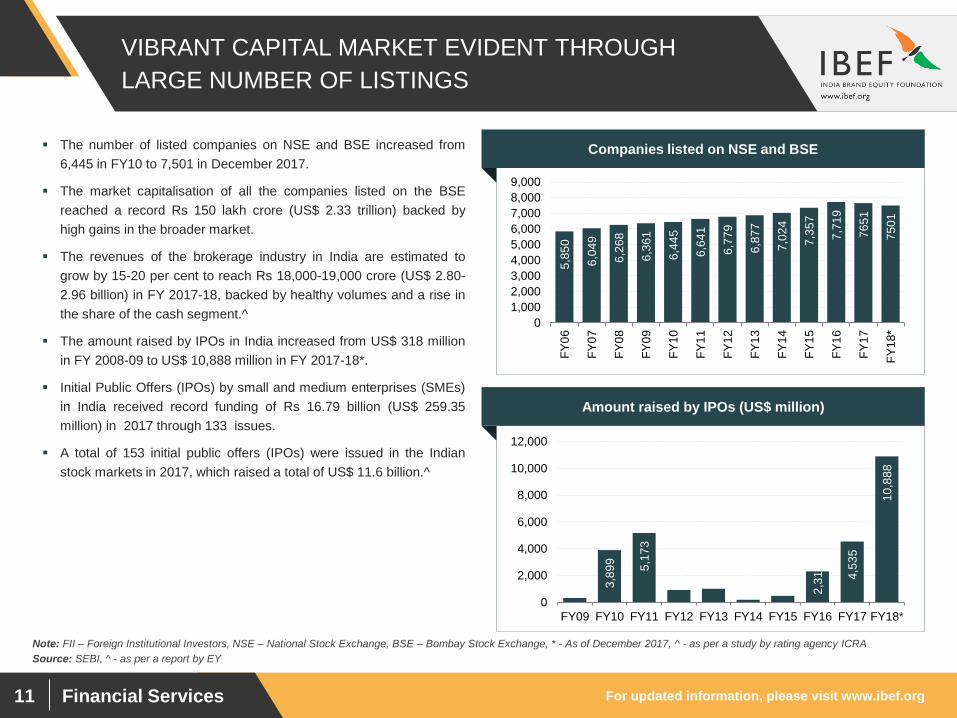
The number of listed companies on NSE and BSE increased from
6,445 in FY10 to 7,501 in December 2017.
The market capitalisation of all the companies listed on the BSE
reached a record Rs 150 lakh crore (US$ 2.33 trillion) backed by
high gains in the broader market.
The revenues of the brokerage industry in India are estimated to
grow by 15-20 per cent to reach Rs 18,000-19,000 crore (US$ 2.80-
2.96 billion) in FY 2017-18, backed by healthy volumes and a rise in
the share of the cash segment.^
The amount raised by IPOs in India increased from US$ 318 million
in FY 2008-09 to US$ 10,888 million in FY 2017-18*.
Initial Public Offers (IPOs) by small and medium enterprises (SMEs)
in India received record funding of Rs 16.79 billion (US$ 259.35
million) in 2017 through 133 issues.
A total of 153 initial public offers (IPOs) were issued in the Indian
stock markets in 2017, which raised a total of US$ 11.6 billion.^
For updated information, please visit www.ibef.org 12 Financial Services
84
,00
0 1
,20
,00
0 1,5
3,0
00
1,2
5,0
00
1,5
3,0
00
1,5
6,0
00
1,9
8,0
00
2,0
0,0
00
2,1
9,0
00
-
50,000
1,00,000
1,50,000
2,00,000
2,50,000
2008 2009 2010 2011 2012 2013 2014 2015 2016
WEALTH MANAGEMENT: AN EMERGING SEGMENT
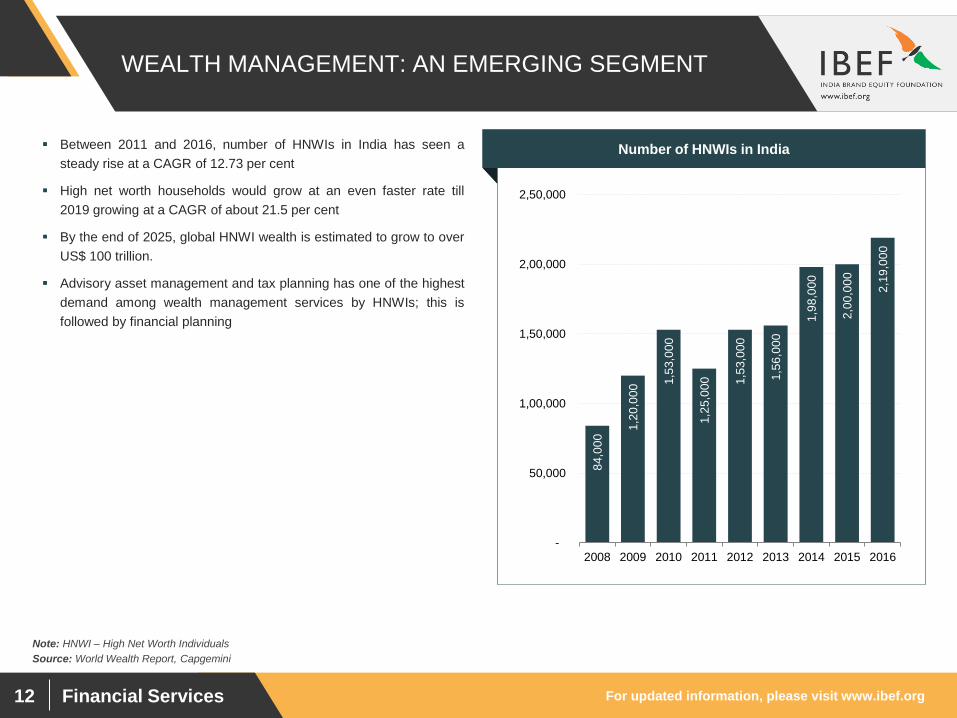
Between 2011 and 2016, number of HNWIs in India has seen a
steady rise at a CAGR of 12.73 per cent
High net worth households would grow at an even faster rate till
2019 growing at a CAGR of about 21.5 per cent
By the end of 2025, global HNWI wealth is estimated to grow to over
US$ 100 trillion.
Advisory asset management and tax planning has one of the highest
demand among wealth management services by HNWIs; this is
followed by financial planning
Visakhapatnam port traffic (million tonnes) Number of HNWIs in India
Source: World Wealth Report, Capgemini
Note: HNWI – High Net Worth Individuals
For updated information, please visit www.ibef.org 13 Financial Services
THE LIFE INSURANCE SEGMENT HAS GROWN
SIGNIFICANTLY IN RECENT YEARS
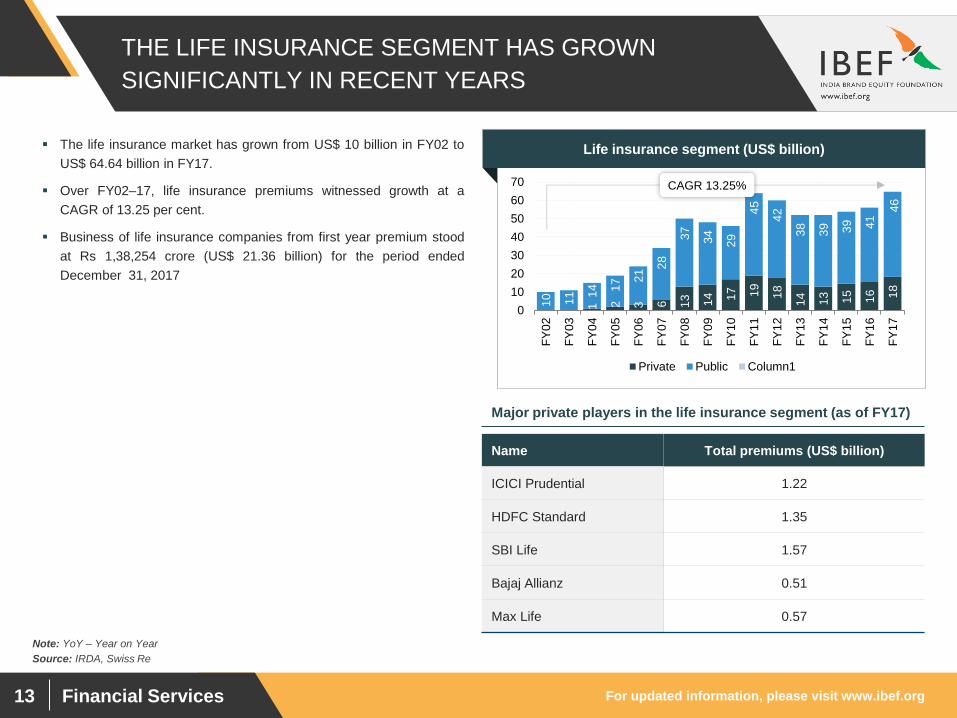
The life insurance market has grown from US$ 10 billion in FY02 to
US$ 64.64 billion in FY17.
Over FY02–17, life insurance premiums witnessed growth at a
CAGR of 13.25 per cent.
Business of life insurance companies from first year premium stood
at Rs 1,38,254 crore (US$ 21.36 billion) for the period ended
December 31, 2017
Source: IRDA, Swiss Re
Major private players in the life insurance segment (as of FY17)
Note: YoY – Year on Year
Name Total premiums (US$ billion)
ICICI Prudential 1.22
HDFC Standard 1.35
SBI Life 1.57
Bajaj Allianz 0.51
Max Life 0.57
0
0
1 2
3
6
13
14
17
19
18
14
13
15
16
18
10
11
14
17
21
28
37
34
29
45
42
38
39
39
41
46
0
10
20
30
40
50
60
70
FY
02
FY
03
FY
04
FY
05
FY
06
FY
07
FY
08
FY
09
FY
10
FY
11
FY
12
FY
13
FY
14
FY
15
FY
16
FY
17
Private Public Column1
CAGR 13.25%
Life insurance segment (US$ billion)
For updated information, please visit www.ibef.org 14 Financial Services
NON-LIFE INSURANCE SEGMENT HAS BEEN RISING
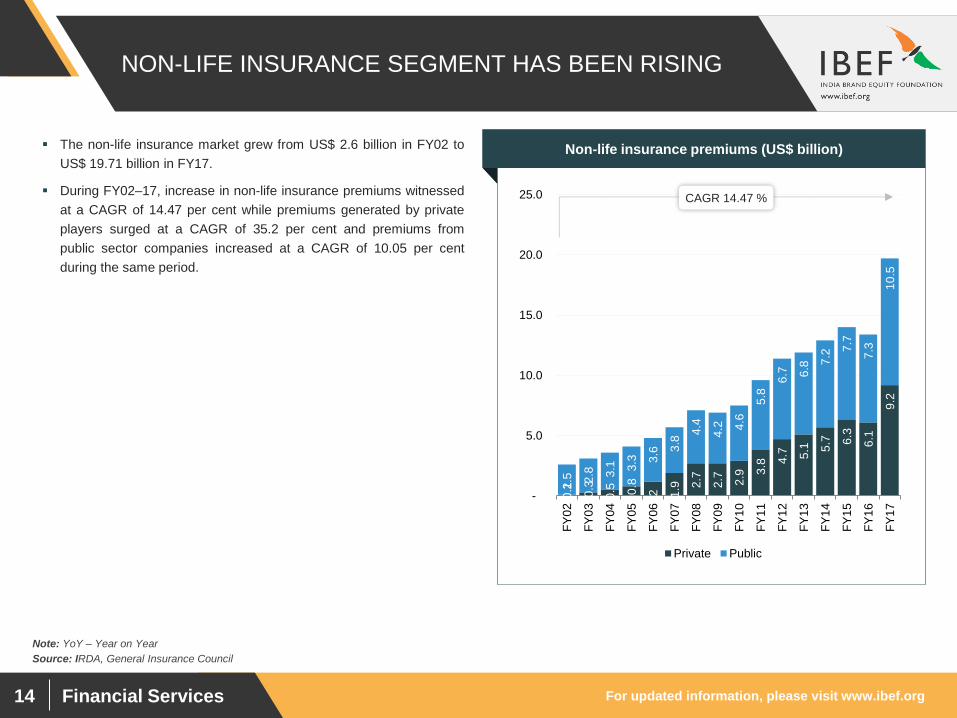
The non-life insurance market grew from US$ 2.6 billion in FY02 to
US$ 19.71 billion in FY17.
During FY02–17, increase in non-life insurance premiums witnessed
at a CAGR of 14.47 per cent while premiums generated by private
players surged at a CAGR of 35.2 per cent and premiums from
public sector companies increased at a CAGR of 10.05 per cent
during the same period.
Visakhapatnam port traffic (million tonnes) Non-life insurance premiums (US$ billion)
Source: IRDA, General Insurance Council
Note: YoY – Year on Year
0.1
0.3
0.5
0.8
1.2
1.9
2.7
2.7
2.9
3.8
4.7
5.1
5.7
6.3
6.1
9.2
2.5
2.8
3.1
3.3
3.6
3.8
4.4
4.2
4.6
5.8
6.7
6.8
7.2
7.7
7.3
10
.5
-
5.0
10.0
15.0
20.0
25.0
FY
02
FY
03
FY
04
FY
05
FY
06
FY
07
FY
08
FY
09
FY
10
FY
11
FY
12
FY
13
FY
14
FY
15
FY
16
FY
17
Private Public
CAGR 14.47 %
For updated information, please visit www.ibef.org 15 Financial Services
29
3.7
8
42
1.9
7
61
0.8
2
85
4.8
2
1,0
56
.04
1,6
10
.97
4,3
13
.76
5,6
51
.21
6,0
98
.52
-
1,000
2,000
3,000
4,000
5,000
6,000
7,000
FY
09
FY
10
FY
11
FY
12
FY
13
FY
14
FY
15
FY
16
FY
17 P
NBFC: GROWING IN PROMINENCE
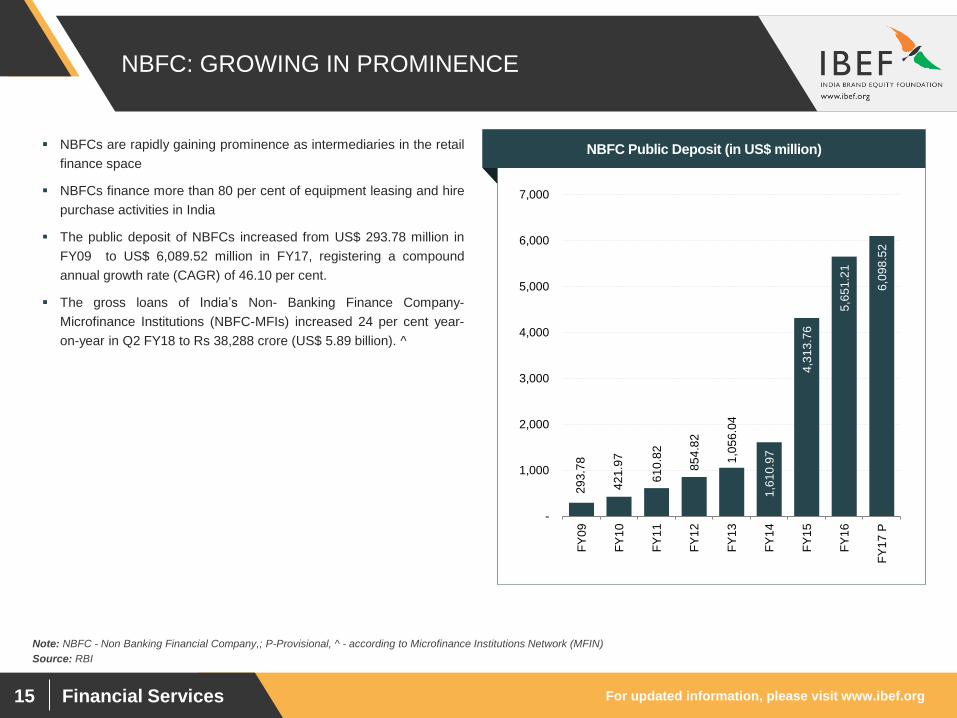
NBFCs are rapidly gaining prominence as intermediaries in the retail
finance space
NBFCs finance more than 80 per cent of equipment leasing and hire
purchase activities in India
The public deposit of NBFCs increased from US$ 293.78 million in
FY09 to US$ 6,089.52 million in FY17, registering a compound
annual growth rate (CAGR) of 46.10 per cent.
The gross loans of India’s Non- Banking Finance Company-
Microfinance Institutions (NBFC-MFIs) increased 24 per cent year-
on-year in Q2 FY18 to Rs 38,288 crore (US$ 5.89 billion). ^
Visakhapatnam port traffic (million tonnes) NBFC Public Deposit (in US$ million)
Source: RBI
Note: NBFC - Non Banking Financial Company,; P-Provisional, ^ - according to Microfinance Institutions Network (MFIN)
For updated information, please visit www.ibef.org 16 Financial Services
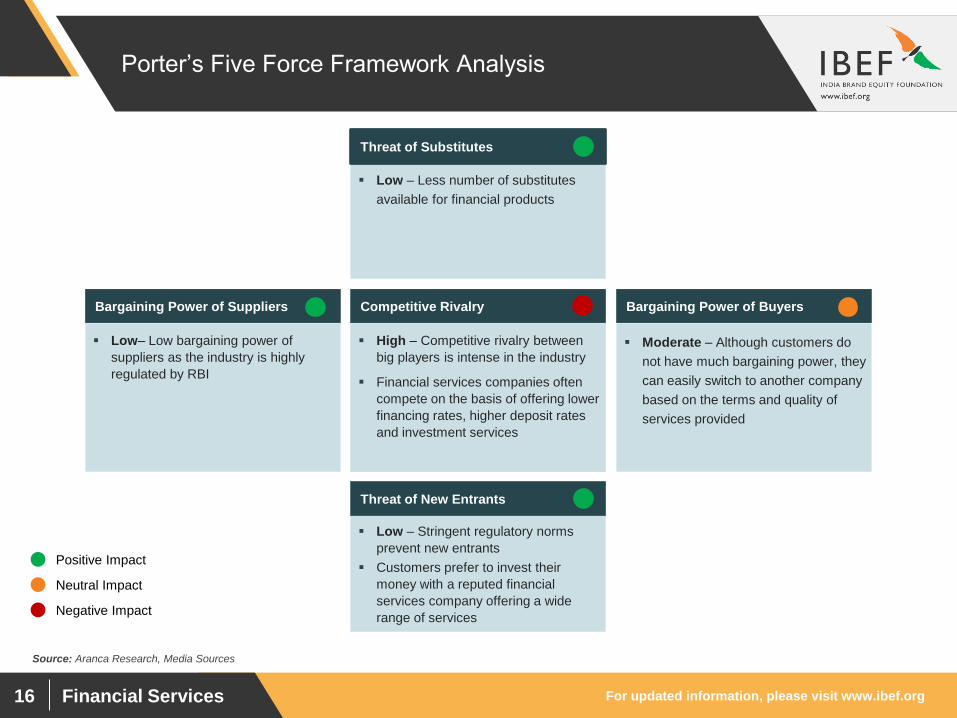
Porter’s Five Force Framework Analysis
Low– Low bargaining power of
suppliers as the industry is highly
regulated by RBI
Bargaining Power of Suppliers
Low – Less number of substitutes
available for financial products
Threat of Substitutes
High – Competitive rivalry between
big players is intense in the industry
Financial services companies often
compete on the basis of offering lower
financing rates, higher deposit rates
and investment services
Competitive Rivalry
Low – Stringent regulatory norms
prevent new entrants
Customers prefer to invest their
money with a reputed financial
services company offering a wide
range of services
Threat of New Entrants
Moderate – Although customers do
not have much bargaining power, they
can easily switch to another company
based on the terms and quality of
services provided
Bargaining Power of Buyers
Positive Impact
Neutral Impact
Negative Impact
Source: Aranca Research, Media Sources
Financial Services
RECENT TRENDS
AND STRATEGIES
For updated information, please visit www.ibef.org 18 Financial Services
RECENT TRENDS
Source: Aranca Research
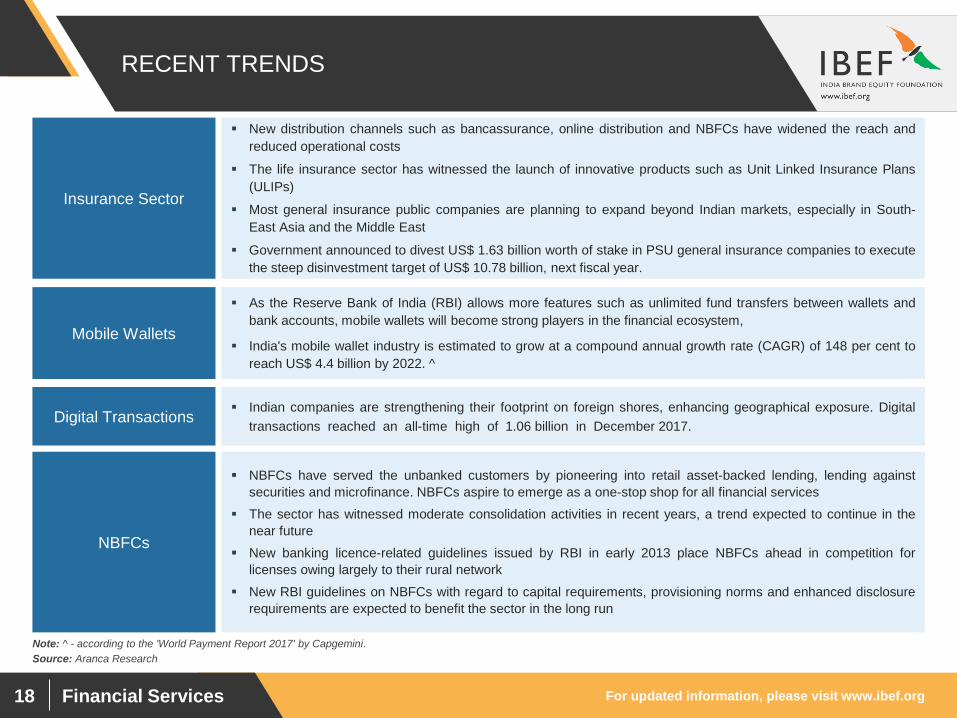
New distribution channels such as bancassurance, online distribution and NBFCs have widened the reach and
reduced operational costs
The life insurance sector has witnessed the launch of innovative products such as Unit Linked Insurance Plans
(ULIPs)
Most general insurance public companies are planning to expand beyond Indian markets, especially in South-
East Asia and the Middle East
Government announced to divest US$ 1.63 billion worth of stake in PSU general insurance companies to execute
the steep disinvestment target of US$ 10.78 billion, next fiscal year.
As the Reserve Bank of India (RBI) allows more features such as unlimited fund transfers between wallets and
bank accounts, mobile wallets will become strong players in the financial ecosystem,
India's mobile wallet industry is estimated to grow at a compound annual growth rate (CAGR) of 148 per cent to
reach US$ 4.4 billion by 2022. ^
NBFCs have served the unbanked customers by pioneering into retail asset-backed lending, lending against
securities and microfinance. NBFCs aspire to emerge as a one-stop shop for all financial services
The sector has witnessed moderate consolidation activities in recent years, a trend expected to continue in the
near future
New banking licence-related guidelines issued by RBI in early 2013 place NBFCs ahead in competition for
licenses owing largely to their rural network
New RBI guidelines on NBFCs with regard to capital requirements, provisioning norms and enhanced disclosure
requirements are expected to benefit the sector in the long run
Insurance Sector
Mobile Wallets
NBFCs
Note: ^ - according to the 'World Payment Report 2017' by Capgemini.
Indian companies are strengthening their footprint on foreign shores, enhancing geographical exposure. Digital
transactions reached an all-time high of 1.06 billion in December 2017. Digital Transactions
Financial Services
GROWTH
DRIVER AND
OPPORTUNITIES

For updated information, please visit www.ibef.org 20 Financial Services
GROSS NATIONAL SAVINGS TO CONTINUE GROWING
AT A HEALTHY PACE
Gross national savings are estimated to increase from US$669
billion in 2015 to US$ 940 billion in 2019, growing at a CAGR of 8.87
per cent
India’s HNWIs wealth is likely to expand at a CAGR of 19.7 per cent
and reach around US$ 3 trillion by 2020
As per Union Budget 2017-18, government has allocated US$ 1.48
billion for recapitalisation of Public Sector Banks in the country
Visakhapatnam port traffic (million tonnes) Gross national savings (US$ billion)
Source: IMF, Reserve Bank of India,
Note: F – Forecast, Deloitte Center for Financial Services
620 632
682 648
669 655
765
846
940
0
100
200
300
400
500
600
700
800
900
1000
2011 2012 2013 2014 2015 2016 2017 F2018 F2019 F
For updated information, please visit www.ibef.org 21 Financial Services
CONTINUED GROWTH IN EQUITIES AND INNOVATIVE
PRODUCTS
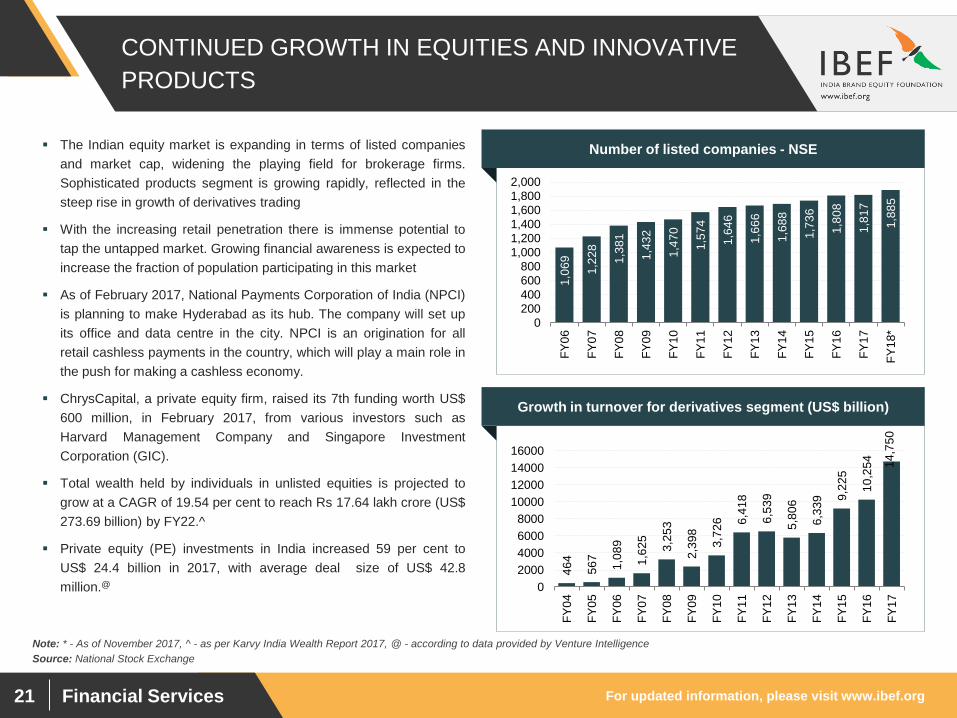
Number of listed companies - NSE
Growth in turnover for derivatives segment (US$ billion)
Source: National Stock Exchange
1,0
69
1,2
28
1,3
81
1,4
32
1,4
70
1,5
74
1,6
46
1,6
66
1,6
88
1,7
36
1,8
08
1,8
17
1,8
85
0
200
400
600
800
1,000
1,200
1,400
1,600
1,800
2,000
FY
06
FY
07
FY
08
FY
09
FY
10
FY
11
FY
12
FY
13
FY
14
FY
15
FY
16
FY
17
FY
18*
46
4
56
7
1,0
89
1,6
25
3,2
53
2,3
98
3,7
26
6,4
18
6,5
39
5,8
06
6,3
39
9,2
25
10
,25
4
14
,75
0
0
2000
4000
6000
8000
10000
12000
14000
16000
FY
04
FY
05
FY
06
FY
07
FY
08
FY
09
FY
10
FY
11
FY
12
FY
13
FY
14
FY
15
FY
16
FY
17
The Indian equity market is expanding in terms of listed companies
and market cap, widening the playing field for brokerage firms.
Sophisticated products segment is growing rapidly, reflected in the
steep rise in growth of derivatives trading
With the increasing retail penetration there is immense potential to
tap the untapped market. Growing financial awareness is expected to
increase the fraction of population participating in this market
As of February 2017, National Payments Corporation of India (NPCI)
is planning to make Hyderabad as its hub. The company will set up
its office and data centre in the city. NPCI is an origination for all
retail cashless payments in the country, which will play a main role in
the push for making a cashless economy.
ChrysCapital, a private equity firm, raised its 7th funding worth US$
600 million, in February 2017, from various investors such as
Harvard Management Company and Singapore Investment
Corporation (GIC).
Total wealth held by individuals in unlisted equities is projected to
grow at a CAGR of 19.54 per cent to reach Rs 17.64 lakh crore (US$
273.69 billion) by FY22.^
Private equity (PE) investments in India increased 59 per cent to
US$ 24.4 billion in 2017, with average deal size of US$ 42.8
million.@
Note: * - As of November 2017, ^ - as per Karvy India Wealth Report 2017, @ - according to data provided by Venture Intelligence
For updated information, please visit www.ibef.org 22 Financial Services
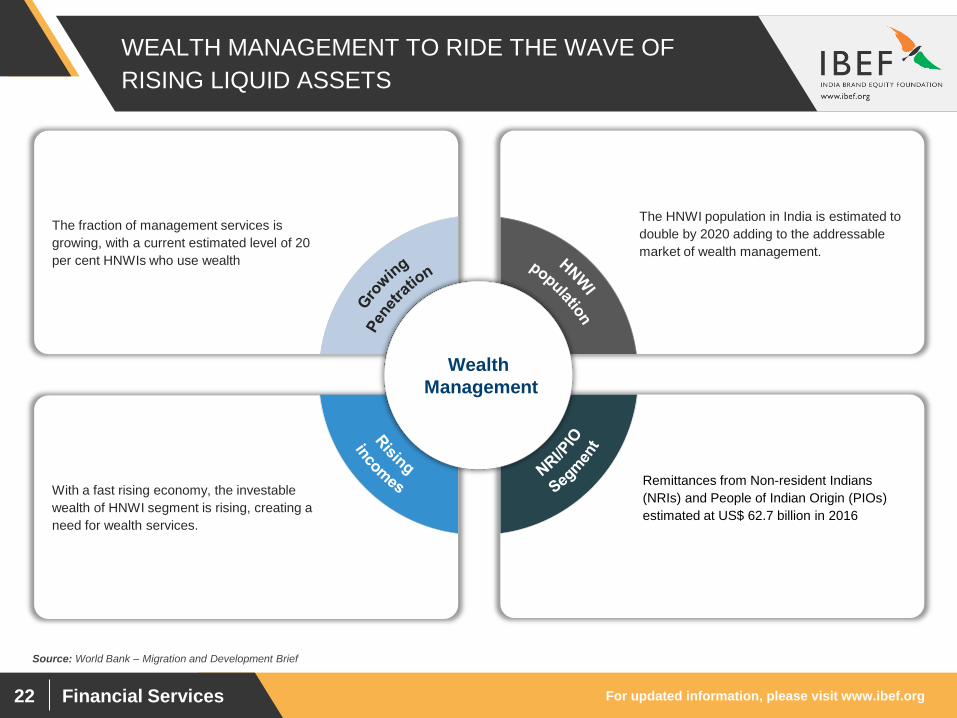
WEALTH MANAGEMENT TO RIDE THE WAVE OF
RISING LIQUID ASSETS
The fraction of management services is
growing, with a current estimated level of 20
per cent HNWIs who use wealth
The HNWI population in India is estimated to
double by 2020 adding to the addressable
market of wealth management.
With a fast rising economy, the investable
wealth of HNWI segment is rising, creating a
need for wealth services.
Remittances from Non-resident Indians
(NRIs) and People of Indian Origin (PIOs)
estimated at US$ 62.7 billion in 2016
Wealth
Management
Source: World Bank – Migration and Development Brief
For updated information, please visit www.ibef.org 23 Financial Services
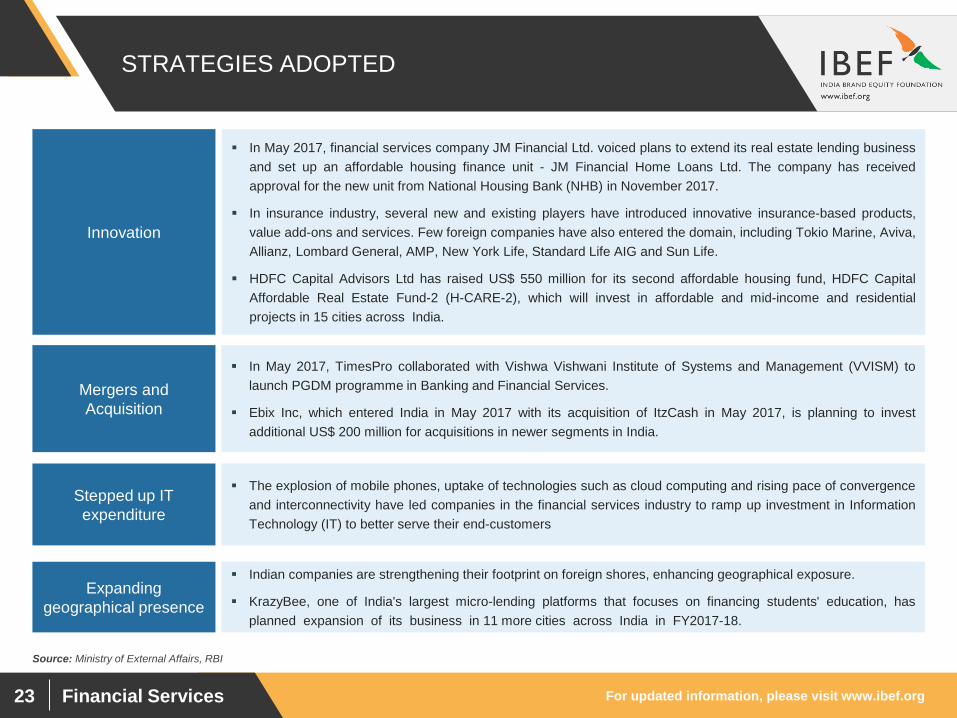
STRATEGIES ADOPTED
Source: Ministry of External Affairs, RBI
Indian companies are strengthening their footprint on foreign shores, enhancing geographical exposure.
KrazyBee, one of India's largest micro-lending platforms that focuses on financing students' education, has
planned expansion of its business in 11 more cities across India in FY2017-18.
In May 2017, financial services company JM Financial Ltd. voiced plans to extend its real estate lending business
and set up an affordable housing finance unit - JM Financial Home Loans Ltd. The company has received
approval for the new unit from National Housing Bank (NHB) in November 2017.
In insurance industry, several new and existing players have introduced innovative insurance-based products,
value add-ons and services. Few foreign companies have also entered the domain, including Tokio Marine, Aviva,
Allianz, Lombard General, AMP, New York Life, Standard Life AIG and Sun Life.
HDFC Capital Advisors Ltd has raised US$ 550 million for its second affordable housing fund, HDFC Capital
Affordable Real Estate Fund-2 (H-CARE-2), which will invest in affordable and mid-income and residential
projects in 15 cities across India.
Innovation
In May 2017, TimesPro collaborated with Vishwa Vishwani Institute of Systems and Management (VVISM) to
launch PGDM programme in Banking and Financial Services.
Ebix Inc, which entered India in May 2017 with its acquisition of ItzCash in May 2017, is planning to invest
additional US$ 200 million for acquisitions in newer segments in India.
Mergers and
Acquisition
The explosion of mobile phones, uptake of technologies such as cloud computing and rising pace of convergence
and interconnectivity have led companies in the financial services industry to ramp up investment in Information
Technology (IT) to better serve their end-customers
Stepped up IT
expenditure
Expanding
geographical presence
For updated information, please visit www.ibef.org 24 Financial Services
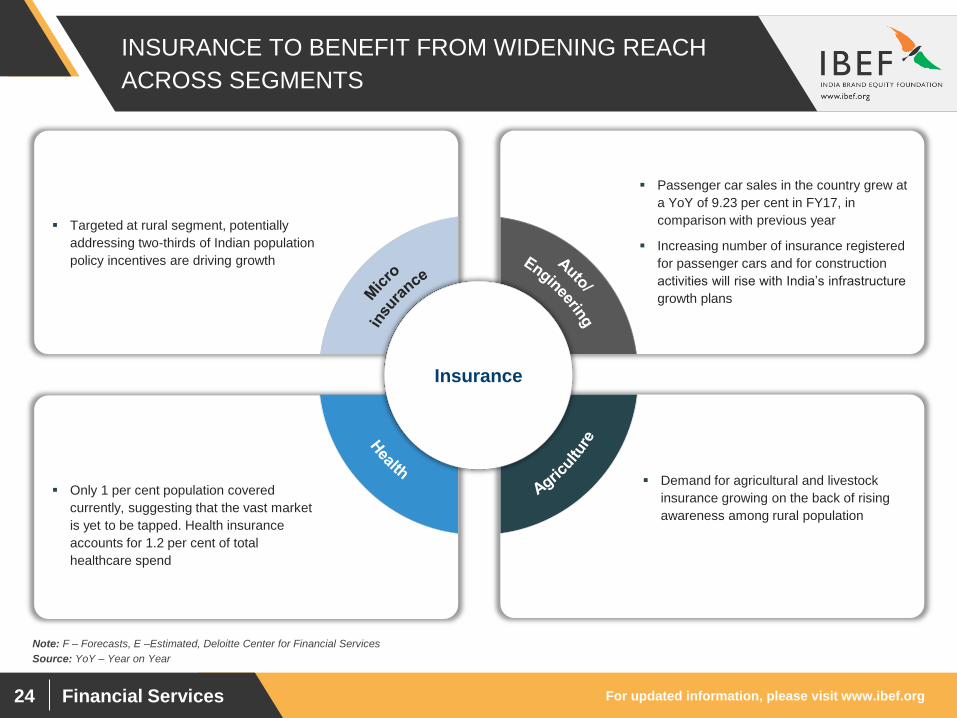
INSURANCE TO BENEFIT FROM WIDENING REACH
ACROSS SEGMENTS
Targeted at rural segment, potentially
addressing two-thirds of Indian population
policy incentives are driving growth
Passenger car sales in the country grew at
a YoY of 9.23 per cent in FY17, in
comparison with previous year
Increasing number of insurance registered
for passenger cars and for construction
activities will rise with India’s infrastructure
growth plans
Only 1 per cent population covered
currently, suggesting that the vast market
is yet to be tapped. Health insurance
accounts for 1.2 per cent of total
healthcare spend
Demand for agricultural and livestock
insurance growing on the back of rising
awareness among rural population
Insurance
Source: YoY – Year on Year
Note: F – Forecasts, E –Estimated, Deloitte Center for Financial Services
For updated information, please visit www.ibef.org 25 Financial Services
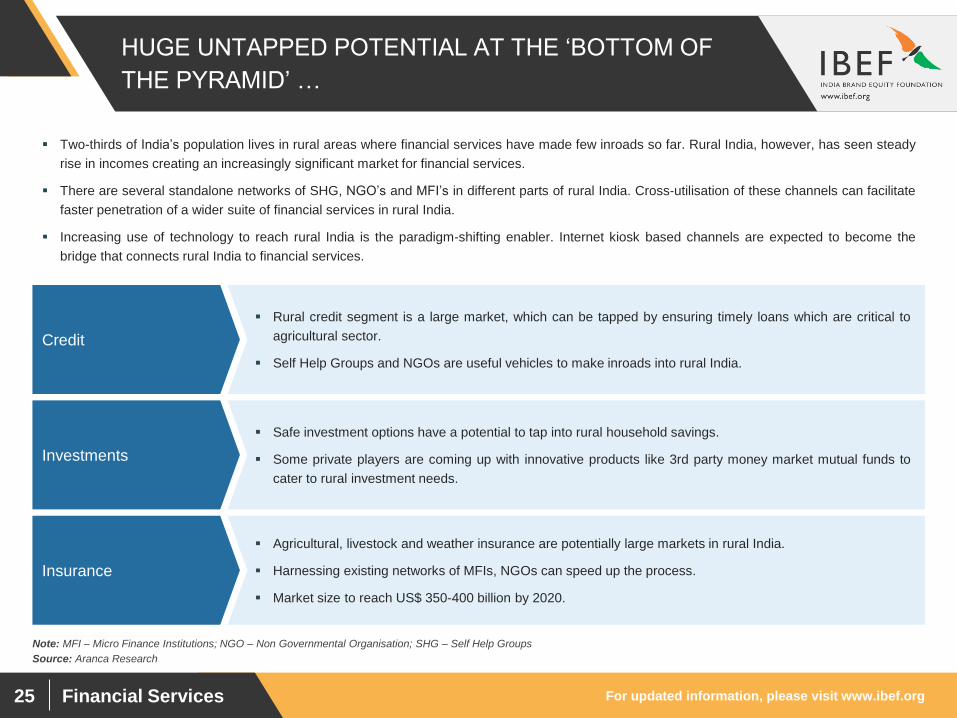
HUGE UNTAPPED POTENTIAL AT THE ‘BOTTOM OF
THE PYRAMID’ …
Source: Aranca Research
Note: MFI – Micro Finance Institutions; NGO – Non Governmental Organisation; SHG – Self Help Groups
Two-thirds of India’s population lives in rural areas where financial services have made few inroads so far. Rural India, however, has seen steady
rise in incomes creating an increasingly significant market for financial services.
There are several standalone networks of SHG, NGO’s and MFI’s in different parts of rural India. Cross-utilisation of these channels can facilitate
faster penetration of a wider suite of financial services in rural India.
Increasing use of technology to reach rural India is the paradigm-shifting enabler. Internet kiosk based channels are expected to become the
bridge that connects rural India to financial services.
Rural credit segment is a large market, which can be tapped by ensuring timely loans which are critical to
agricultural sector.
Self Help Groups and NGOs are useful vehicles to make inroads into rural India.
Credit
Safe investment options have a potential to tap into rural household savings.
Some private players are coming up with innovative products like 3rd party money market mutual funds to
cater to rural investment needs.
Investments
Agricultural, livestock and weather insurance are potentially large markets in rural India.
Harnessing existing networks of MFIs, NGOs can speed up the process.
Market size to reach US$ 350-400 billion by 2020.
Insurance
For updated information, please visit www.ibef.org 26 Financial Services
... AS WELL AS AT THE OTHER END OF THE
SPECTRUM
Source: Aranca Research
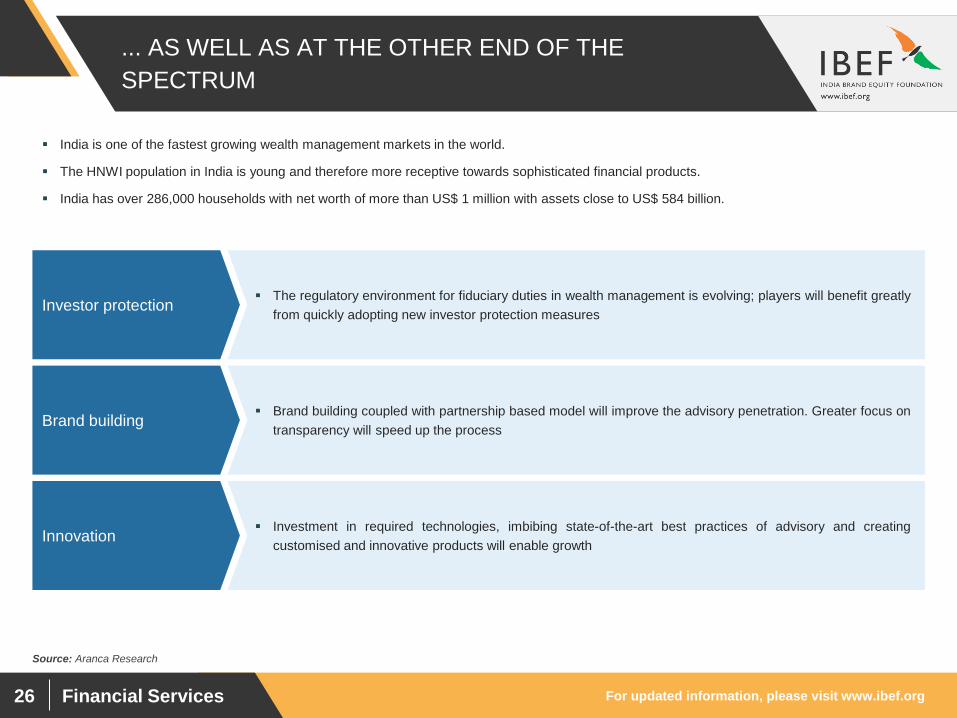
India is one of the fastest growing wealth management markets in the world.
The HNWI population in India is young and therefore more receptive towards sophisticated financial products.
India has over 286,000 households with net worth of more than US$ 1 million with assets close to US$ 584 billion.
The regulatory environment for fiduciary duties in wealth management is evolving; players will benefit greatly
from quickly adopting new investor protection measures Investor protection
Brand building coupled with partnership based model will improve the advisory penetration. Greater focus on
transparency will speed up the process Brand building
Investment in required technologies, imbibing state-of-the-art best practices of advisory and creating
customised and innovative products will enable growth Innovation
For updated information, please visit www.ibef.org 27 Financial Services
HNWI POPULATION TO DOUBLE BY 2020
Source: Deloitte Center for Financial Services, Capgemini Asia Pacific Wealth Report 2017
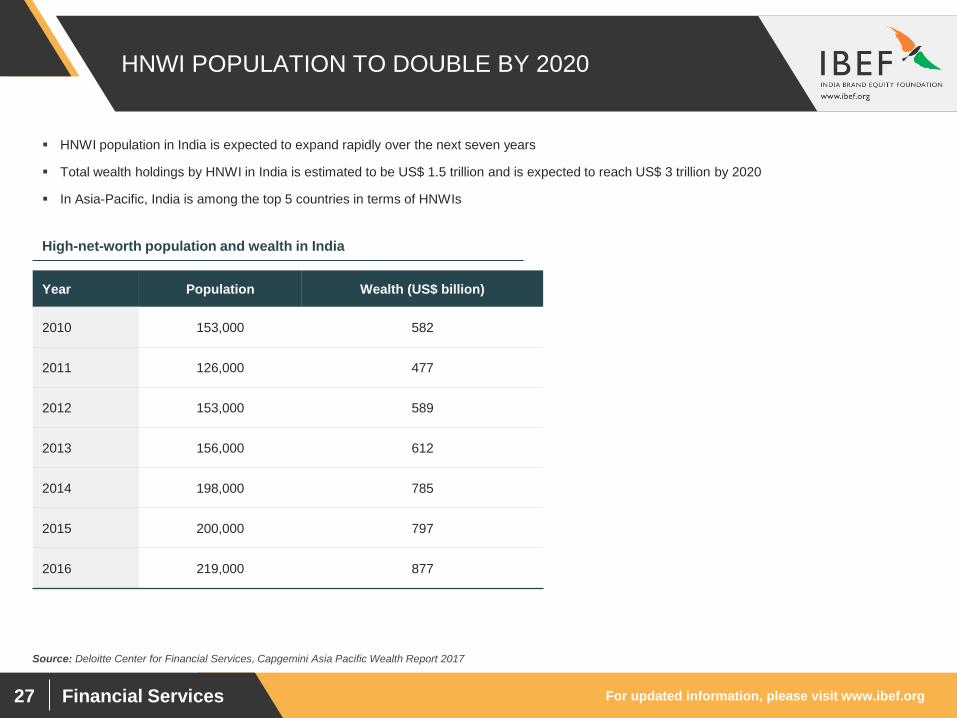
HNWI population in India is expected to expand rapidly over the next seven years
Total wealth holdings by HNWI in India is estimated to be US$ 1.5 trillion and is expected to reach US$ 3 trillion by 2020
In Asia-Pacific, India is among the top 5 countries in terms of HNWIs
High-net-worth population and wealth in India
Year Population Wealth (US$ billion)
2010 153,000 582
2011 126,000 477
2012 153,000 589
2013 156,000 612
2014 198,000 785
2015 200,000 797
2016 219,000 877
For updated information, please visit www.ibef.org 28 Financial Services
FAVOURABLE POLICY MEASURES AND
GOVERNMENT INITIATIVES
Source: Dun and Bradstreet., Media articles
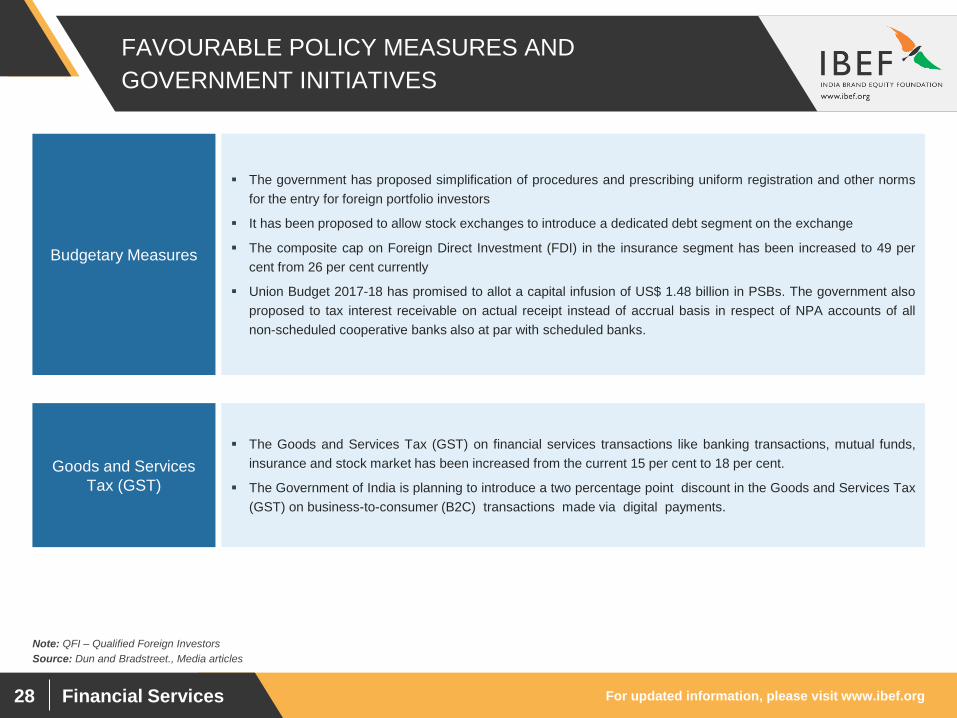
The government has proposed simplification of procedures and prescribing uniform registration and other norms
for the entry for foreign portfolio investors
It has been proposed to allow stock exchanges to introduce a dedicated debt segment on the exchange
The composite cap on Foreign Direct Investment (FDI) in the insurance segment has been increased to 49 per
cent from 26 per cent currently
Union Budget 2017-18 has promised to allot a capital infusion of US$ 1.48 billion in PSBs. The government also
proposed to tax interest receivable on actual receipt instead of accrual basis in respect of NPA accounts of all
non-scheduled cooperative banks also at par with scheduled banks.
Budgetary Measures
Note: QFI – Qualified Foreign Investors
The Goods and Services Tax (GST) on financial services transactions like banking transactions, mutual funds,
insurance and stock market has been increased from the current 15 per cent to 18 per cent.
The Government of India is planning to introduce a two percentage point discount in the Goods and Services Tax
(GST) on business-to-consumer (B2C) transactions made via digital payments.
Goods and Services
Tax (GST)
For updated information, please visit www.ibef.org 29 Financial Services
FAVOURABLE POLICY MEASURES AND
GOVERNMENT INITIATIVES
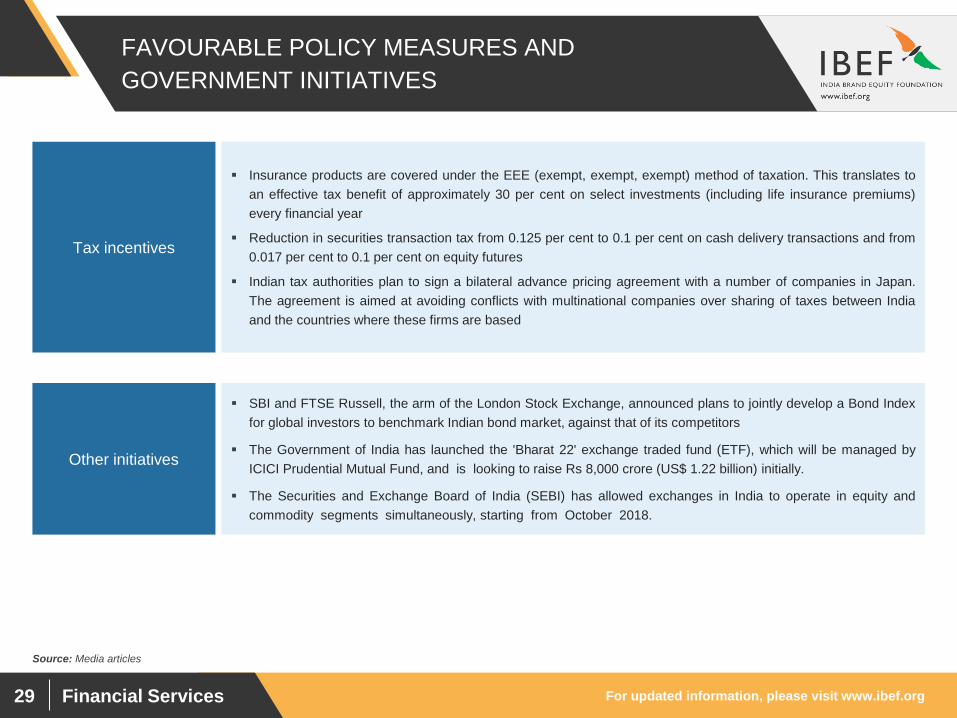
SBI and FTSE Russell, the arm of the London Stock Exchange, announced plans to jointly develop a Bond Index
for global investors to benchmark Indian bond market, against that of its competitors
The Government of India has launched the 'Bharat 22' exchange traded fund (ETF), which will be managed by
ICICI Prudential Mutual Fund, and is looking to raise Rs 8,000 crore (US$ 1.22 billion) initially.
The Securities and Exchange Board of India (SEBI) has allowed exchanges in India to operate in equity and
commodity segments simultaneously, starting from October 2018.
Other initiatives
Insurance products are covered under the EEE (exempt, exempt, exempt) method of taxation. This translates to
an effective tax benefit of approximately 30 per cent on select investments (including life insurance premiums)
every financial year
Reduction in securities transaction tax from 0.125 per cent to 0.1 per cent on cash delivery transactions and from
0.017 per cent to 0.1 per cent on equity futures
Indian tax authorities plan to sign a bilateral advance pricing agreement with a number of companies in Japan.
The agreement is aimed at avoiding conflicts with multinational companies over sharing of taxes between India
and the countries where these firms are based
Tax incentives
Source: Media articles
Financial Services
CASE STUDIES
For updated information, please visit www.ibef.org 31 Financial Services
SHRIRAM TRANSPORT FINANCE CO LTD
Source: Company website
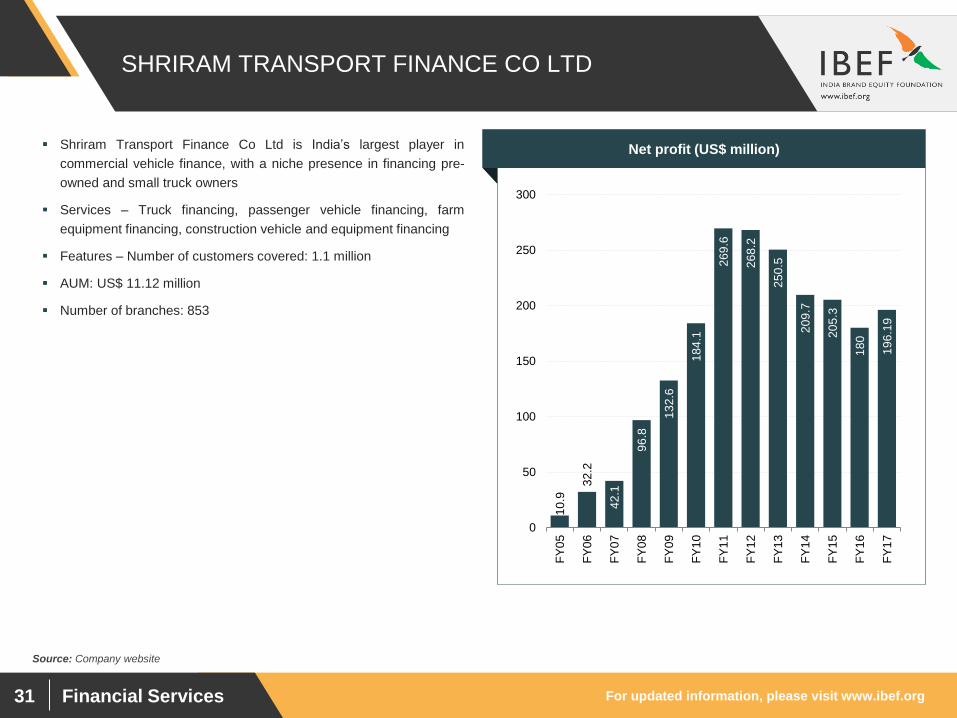
Shriram Transport Finance Co Ltd is India’s largest player in
commercial vehicle finance, with a niche presence in financing pre-
owned and small truck owners
Services – Truck financing, passenger vehicle financing, farm
equipment financing, construction vehicle and equipment financing
Features – Number of customers covered: 1.1 million
AUM: US$ 11.12 million
Number of branches: 853
Visakhapatnam port traffic (million tonnes) Net profit (US$ million)
10
.9
32
.2
42
.1
96
.8
13
2.6
18
4.1
26
9.6
26
8.2
25
0.5
20
9.7
20
5.3
18
0
19
6.1
9
0
50
100
150
200
250
300
FY
05
FY
06
FY
07
FY
08
FY
09
FY
10
FY
11
FY
12
FY
13
FY
14
FY
15
FY
16
FY
17
For updated information, please visit www.ibef.org 32 Financial Services
MUTHOOT FINANCE LTD
Source: Company website
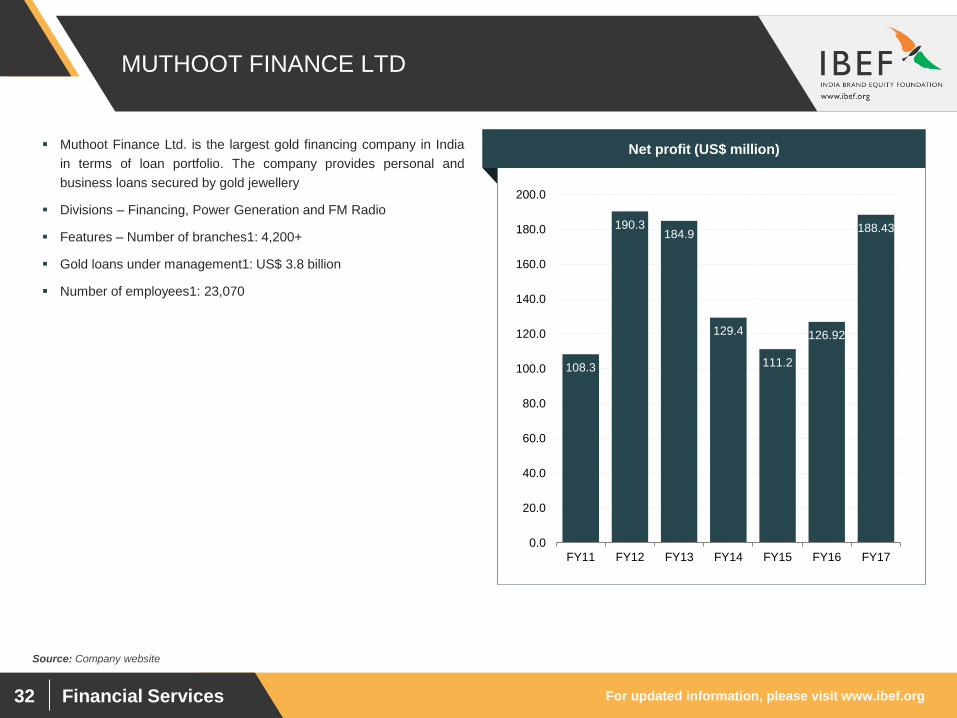
Muthoot Finance Ltd. is the largest gold financing company in India
in terms of loan portfolio. The company provides personal and
business loans secured by gold jewellery
Divisions – Financing, Power Generation and FM Radio
Features – Number of branches1: 4,200+
Gold loans under management1: US$ 3.8 billion
Number of employees1: 23,070
Visakhapatnam port traffic (million tonnes) Net profit (US$ million)
108.3
190.3 184.9
129.4
111.2
126.92
188.43
0.0
20.0
40.0
60.0
80.0
100.0
120.0
140.0
160.0
180.0
200.0
FY11 FY12 FY13 FY14 FY15 FY16 FY17
Financial Services
KEY INDUSTRY
ORGANISATIONS
For updated information, please visit www.ibef.org 34 Financial Services
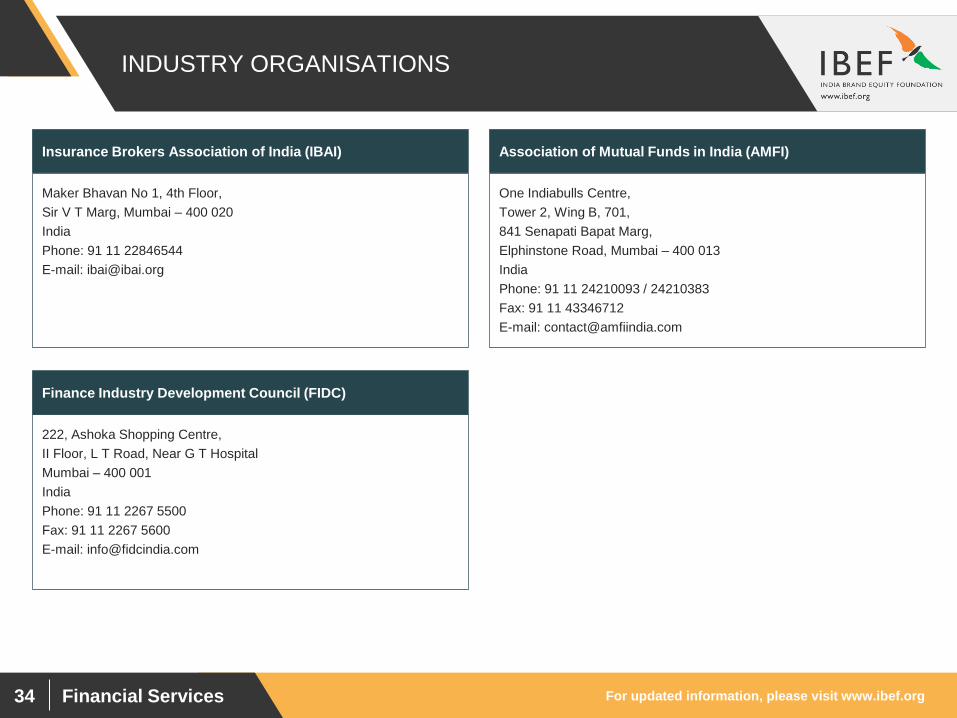
INDUSTRY ORGANISATIONS
Maker Bhavan No 1, 4th Floor,
Sir V T Marg, Mumbai – 400 020
India
Phone: 91 11 22846544
E-mail: [email protected]
Insurance Brokers Association of India (IBAI)
One Indiabulls Centre,
Tower 2, Wing B, 701,
841 Senapati Bapat Marg,
Elphinstone Road, Mumbai – 400 013
India
Phone: 91 11 24210093 / 24210383
Fax: 91 11 43346712
E-mail: [email protected]
Association of Mutual Funds in India (AMFI)
222, Ashoka Shopping Centre,
II Floor, L T Road, Near G T Hospital
Mumbai – 400 001
India
Phone: 91 11 2267 5500
Fax: 91 11 2267 5600
E-mail: [email protected]
Finance Industry Development Council (FIDC)
Financial Services
USEFUL
INFORMATION
For updated information, please visit www.ibef.org 36 Financial Services
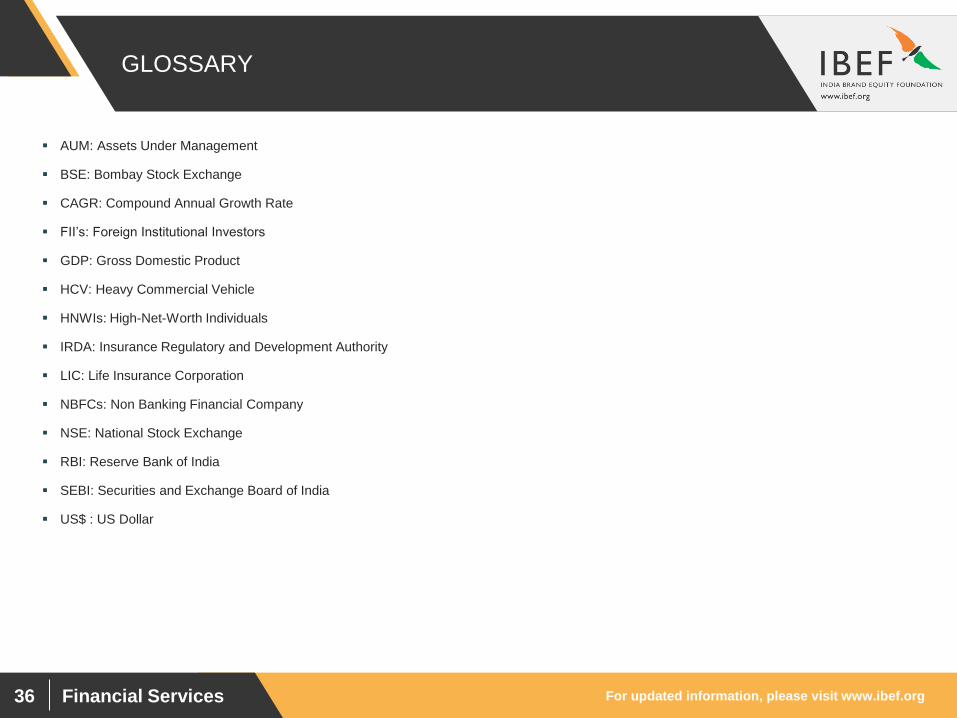
GLOSSARY
AUM: Assets Under Management
BSE: Bombay Stock Exchange
CAGR: Compound Annual Growth Rate
FII’s: Foreign Institutional Investors
GDP: Gross Domestic Product
HCV: Heavy Commercial Vehicle
HNWIs: High-Net-Worth Individuals
IRDA: Insurance Regulatory and Development Authority
LIC: Life Insurance Corporation
NBFCs: Non Banking Financial Company
NSE: National Stock Exchange
RBI: Reserve Bank of India
SEBI: Securities and Exchange Board of India
US$ : US Dollar
For updated information, please visit www.ibef.org 37 Financial Services
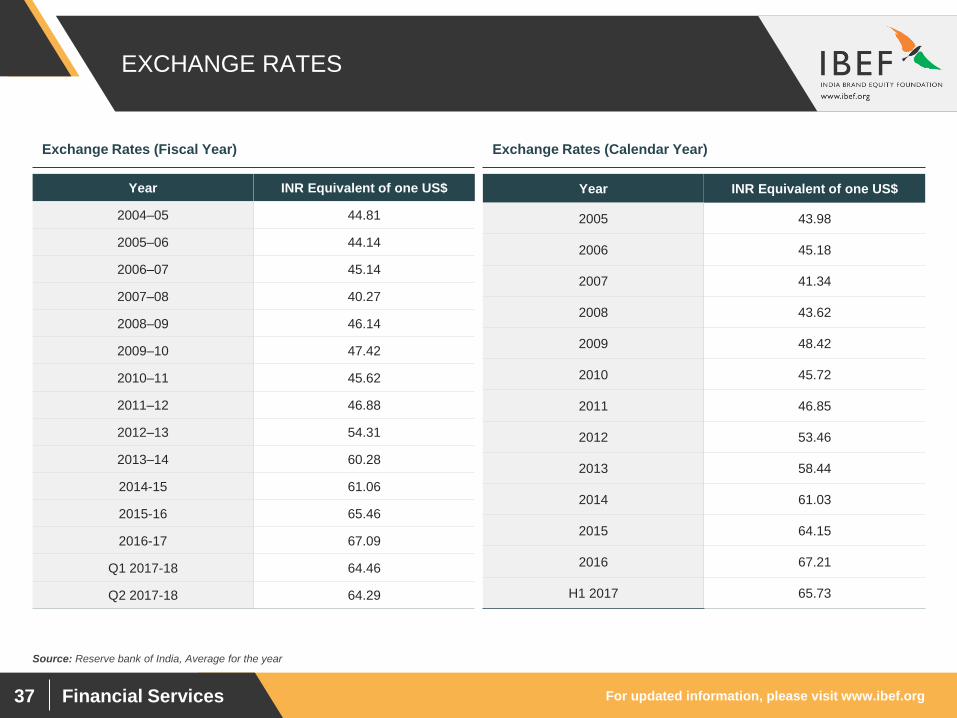
EXCHANGE RATES
Exchange Rates (Fiscal Year) Exchange Rates (Calendar Year)
Year INR Equivalent of one US$
2004–05 44.81
2005–06 44.14
2006–07 45.14
2007–08 40.27
2008–09 46.14
2009–10 47.42
2010–11 45.62
2011–12 46.88
2012–13 54.31
2013–14 60.28
2014-15 61.06
2015-16 65.46
2016-17 67.09
Q1 2017-18 64.46
Q2 2017-18 64.29
Year INR Equivalent of one US$
2005 43.98
2006 45.18
2007 41.34
2008 43.62
2009 48.42
2010 45.72
2011 46.85
2012 53.46
2013 58.44
2014 61.03
2015 64.15
2016 67.21
H1 2017 65.73
Source: Reserve bank of India, Average for the year
For updated information, please visit www.ibef.org 38 Financial Services
DISCLAIMER
India Brand Equity Foundation (IBEF) engaged Aranca to prepare this presentation and the same has been prepared by Aranca in consultation
with IBEF.
All rights reserved. All copyright in this presentation and related works is solely and exclusively owned by IBEF. The same may not be reproduced,
wholly or in part in any material form (including photocopying or storing it in any medium by electronic means and whether or not transiently or
incidentally to some other use of this presentation), modified or in any manner communicated to any third party except with the written approval
of IBEF.
This presentation is for information purposes only. While due care has been taken during the compilation of this presentation to ensure that the
information is accurate to the best of Aranca and IBEF’s knowledge and belief, the content is not to be construed in any manner whatsoever as a
substitute for professional advice.
Aranca and IBEF neither recommend nor endorse any specific products or services that may have been mentioned in this presentation and nor do
they assume any liability or responsibility for the outcome of decisions taken as a result of any reliance placed on this presentation.
Neither Aranca nor IBEF shall be liable for any direct or indirect damages that may arise due to any act or omission on the part of the user due to any
reliance placed or guidance taken from any portion of this presentation.