Embed Size (px)
Citation preview
© 2016. Published by The Company of Biologists Ltd.
Osteocrin, a peptide secreted from the heart and other tissues, contributes to
cranial osteogenesis and chondrogenesis in zebrafish
Ayano Chiba1, Haruko Watanabe-Takano1, Kenta Terai2, Hajime Fukui1,
Takahiro Miyazaki1, Mami Uemura2, Hisashi Hashimoto3,4, Masahiko Hibi3,4, Shigetomo
Fukuhara5, and Naoki Mochizuki1,6
1Department of Cell Biology, 6AMED-CREST, National Cerebral and Cardiovascular Center
Research Institute, 5-7-1 Fujishirodai, Suita, Osaka 565-8565, Japan 2Laboratory of Function and Morphology, Institute of Molecular and Cellular
Biosciences, University of Tokyo, 1-1-1 Yayoi, Bunkyo-ku, Tokyo 113-0032, Japan 3Laboratory of Organogenesis and Organ Function, Bioscience and Biotechnology Center, 4Devision of Biological Science, Graduate School of Science Nagoya, Nagoya University,
Furo-cho, Chigusa-ku, Nagoya, Aichi 464-8061, Japan 5Department of Molecular Pathophysiology, Institute of Advanced Medical Science, Nippon
Medical School, 1-396 Kosugi-machi, Nakahara-ku, Kawasaki, Kanagawa 211-8533, Japan
Summary Statement: Osteocrin functions as a hormone that controls the remote
bone/cartilage formation by augmenting C-type natriuretic peptide-dependent natriuretic
peptide receptor-2 activation
Key words: Osteocrin, heart, peptide, osteogenesis, chondreogenesis
Author for correspondence: Naoki Mochizuki
e-mail: [email protected]
Dev
elo
pmen
t • A
dvan
ce a
rtic
le
http://dev.biologists.org/lookup/doi/10.1242/dev.143354Access the most recent version at First posted online on 19 December 2016 as 10.1242/dev.143354
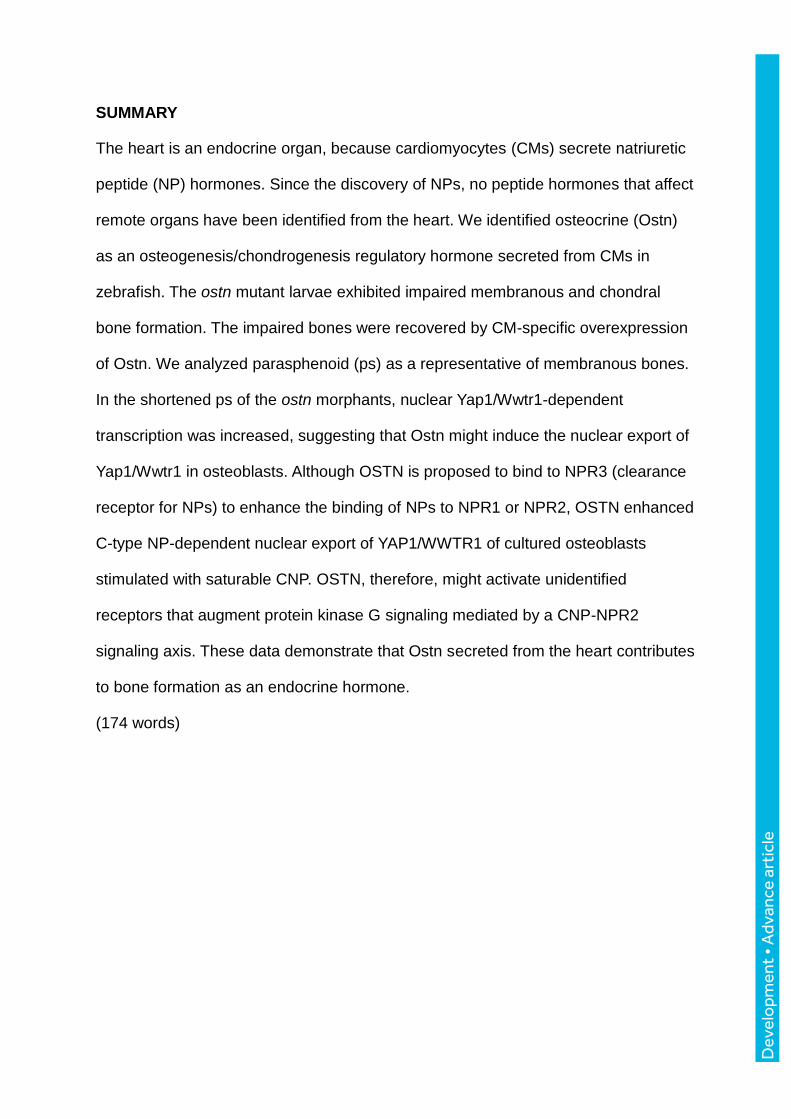
SUMMARY
The heart is an endocrine organ, because cardiomyocytes (CMs) secrete natriuretic
peptide (NP) hormones. Since the discovery of NPs, no peptide hormones that affect
remote organs have been identified from the heart. We identified osteocrine (Ostn)
as an osteogenesis/chondrogenesis regulatory hormone secreted from CMs in
zebrafish. The ostn mutant larvae exhibited impaired membranous and chondral
bone formation. The impaired bones were recovered by CM-specific overexpression
of Ostn. We analyzed parasphenoid (ps) as a representative of membranous bones.
In the shortened ps of the ostn morphants, nuclear Yap1/Wwtr1-dependent
transcription was increased, suggesting that Ostn might induce the nuclear export of
Yap1/Wwtr1 in osteoblasts. Although OSTN is proposed to bind to NPR3 (clearance
receptor for NPs) to enhance the binding of NPs to NPR1 or NPR2, OSTN enhanced
C-type NP-dependent nuclear export of YAP1/WWTR1 of cultured osteoblasts
stimulated with saturable CNP. OSTN, therefore, might activate unidentified
receptors that augment protein kinase G signaling mediated by a CNP-NPR2
signaling axis. These data demonstrate that Ostn secreted from the heart contributes
to bone formation as an endocrine hormone.
(174 words)
Dev
elo
pmen
t • A
dvan
ce a
rtic
le
INTRODUCTION
The heart is not only an essential pump for circulation but also an endocrine organ to secrete
natriuretic peptide (NP) hormones including atrial natriuretic peptide (ANP) and brain (B-
type) natriuretic peptide (BNP) (Ogawa and de Bold, 2014). Cardiomyocytes (CMs) secrete
vascular endothelial growth factor-A and angiopoietin-1 to direct coronary vascular
development in a paracrine-dependent manner by acting on endothelial cells during
cardiogenesis (Arita et al., 2014; Riley and Smart, 2011). Therefore, CMs have potential to
secrete functional peptides, although CM is mainly constituted by contractile sarcomere
proteins. Besides ANP and BNP, no other secretory peptides that function as an endocrine
hormone have been reported.
The NP family consists of ANP, BNP, and C-Type NP (CNP). These NPs bind to a single
transmembrane receptor NP receptor family, NPR1, NPR2, and NPR3. Among them, while
NPR1 and NPR2 have a guanylate cyclase domain, NPR3 does not. NPR3 functions as a
clearance receptor for ANP and BNP or as a Gi-activating receptor (Potter et al., 2006). ANP
induces natriuresis in the kidney and relaxation of smooth muscle via NPR1 and NPR2. ANP
exerts paracrine/autocrine roles on CMs in the heart, because ANP has been recently reported
to regulate CM proliferation in zebrafish (Becker et al., 2014). In contrast to ANP and BNP,
CNP is produced in a variety of tissues and organs including uterus, ovarium, cartilaginous
tissues, blood vessels and osteoblasts (Hagiwara et al., 1994; Stepan et al., 1999; Stepan et
al., 2002; Suda et al., 1996). It characteristically elongates long bones through NPR2
expressed on chondrocytes. The physiological relevance of CNP-NPR2 signaling to bone
formation is apparent because CNP knockout mice and Npr2 knockout mice exhibit dwarfism
(Komatsu et al., 2002; Tamura et al., 2004). Conversely, the forced expression of CNP and
the depletion of Npr3 result in the increased bone length in mice (Dauphinee et al., 2013;
Kake et al., 2009; Matsukawa et al., 1999).
Bone growth depends on endochondral ossification and intramembranous ossification
Dev
elo
pmen
t • A
dvan
ce a
rtic
le
(Karsenty et al., 2009). The former is found in the growth of the long bones, whereas the
latter is found in the calvaria and clavicle. The chondrocyte lineage cells: prechondrogenic
cells, proliferating chondrocytes, prehypertrophic chondrocytes, and hypertrophic
chondrocytes participating in the endochondral ossification respond to BNP and CNP,
because these cells express NPR2 receptors (Suda et al., 1998; Yasoda et al., 2004).
Therefore, enhancement of BNP/CNP-NPR2 signaling results in extension of long bones.
During the intramembranous ossification, osteoblasts differentiated from mesenchymal stem
cells (MSCs) proliferate and secrete bone matrix, thereby contributing to bone formation in a
manner independent of chondrocytes (Soltanoff et al., 2009).
Osteocrin (OSTN) is proposed to belong to NP family, because it contains similar amino
acid sequence to NPs (Moffatt and Thomas, 2009; Potter et al., 2006). OSTN and Musclin are
originally identified by signal-sequence trap methods as the same molecule from bone and
muscle, respectively (Nishizawa et al., 2004; Thomas et al., 2003). The carboxy-terminus of
OSTN seems to be cleaved at 76KKKR79 and 110KKR112 sites. The resulting two
fragments OSTN80-109 and OSTN113-130 have amino acid homology to NPs (Moffatt and
Thomas, 2009), although neither fragments have Cys-Cys signature that is conserved in NPs
and is essential for their circle structure. Nonetheless, OSTN is capable of binding to NPR3,
thereby hampering clearance activity of NPR3 for NPs (Thomas et al., 2003). Consistent with
these findings, Ostn transgenic (Tg) mice exhibit extended long bones and kyphosis
presumably owing to activation of NPR2 found in Bnp Tg mice (Suda et al., 1998; Thomas et
al., 2003). The physiological role for OSTN in osteogenesis remains unclear, although it has
been shown to function as a myokine utilizing Ostn knockout mice (Subbotina et al., 2015).
In this study, we aimed to search for secretory peptides from CMs of zebrafish and
identified Ostn derived from the hearts as an endocrine regulator for bone and cartilage. Ostn
depletion led to shortening of parasphenoid (ps) regulated by intramembranous ossification
and palatoquadrate (pq) regulated by chondrogenesis, while its overexpression resulted in
Dev
elo
pmen
t • A
dvan
ce a
rtic
le

elongation of ps and pq. We further investigated how Ostn regulates the ps formation and
found that Ostn regulates bone/cartilage formation by modifying CNP-dependent nuclear
export of transcription cofactors, Yap1 and Wwtr1.
Dev
elo
pmen
t • A
dvan
ce a
rtic
le
RESULTS
Ostn is expressed in cardiomyocytes
ANP and BNP produced in the heart induce natriuresis through activation of the NP receptors
expressed in the renal tubules. Thus, the heart is thought to be an endocrine organ. We first
aimed to search for secretory peptides produced from the heart. To obtain only CMs from the
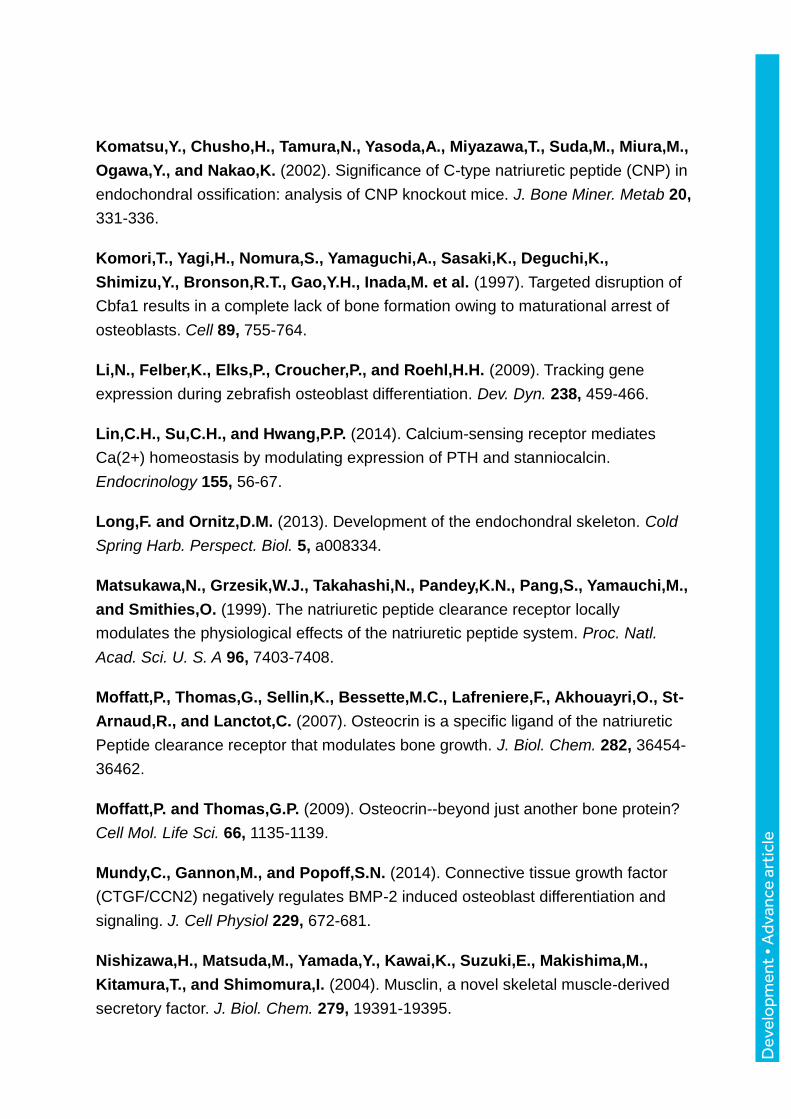
heart, we established two Tg zebrafish (Danio rerio) lines; Tg(myl7:NLS-mCherry) and
Tg(myl7:actn2-tdEos) (Fig. 1A, C; Movies 1, 2). Both nuclear localization signal (NLS)-
tagged-monomeric (m) Cherry and actinin alpha 2 (Actn2)-tandem (td) Eos were exclusively
expressed in the CMs using cardiac myosin light chain (myl7) promoter when we carefully
observed the fluorescence in the hearts using a lightsheet microscope and a confocal
microscope. Thus, we isolated CMs from the hearts of two Tg lines by fluorescence-
activating cell sorting (FACS) method. ostn mRNA was expressed in the CMs of both
Tg(myl7:NLS-mCherry) larvae and Tg(myl7:actn2-tdEos) larvae at 72 hours post-fertilization
(hpf) (Fig. 1B, D). The expression of mRNAs from the CMs was validated by the expression
of nppa, myl7, and actc1a. Moreover, the genes known to be expressed in CMs including
angpt1, bmp1a, and epo were detected by RNA-seq (Fig. 1B, D).
We then examined the expression of ostn mRNA by whole mount in situ hybridization
(WISH) using larvae at 72 hpf. ostn mRNAs were detected in the heart, corpuscles of
Stannius (CS), and head (Fig. 2A). ostn mRNAs were expressed in the heart where myl7
mRNAs were detected. Moreover, the expression of ostn mRNAs seemed to be more in the
ventricle than in the atrium (Fig. 2B). The expression of ostn mRNA at CS was confirmed by
WISH of that of calcium-sensing receptor (casr) (Lin et al., 2014). Although the expression
of ostn mRNAs was exclusively expressed in the heart and CS (36 hpf), it started to be
detected in the head at 72 hpf (Fig 2B). Therefore, we examined the detailed expression in the
head using brain sections and examined whether its expression overlaps that of myocytes
(myod1), osteoblasts (sp7), and chondrocytes (sox9a). We found no clear overlapping
Dev
elo
pmen
t • A
dvan
ce a
rtic
le
expression of ostn mRNA and other marker gene mRNAs (Fig. S1). In addition, we
investigated Ostn mRNA expression in adult mice (Mus musculus) and embryos using reverse
transcription (RT)-PCR. Ostn mRNAs were mainly expressed in the bones and muscles in the
adult mice, whereas subtle expression was detected in both atrium and ventricle of the
embryonic heart (Fig. S2A, B). These data suggest the possibility that Ostn secreted from
CMs of zebrafish might function as a hormone affecting remote organs including bones
during early embryogenesis, because mouse OSTN affects bone formation (Moffatt et al.,
2007).
Ostn derived from cardiomyocytes contribute to membranous bone formation
To study the function of Ostn in zebrafish osteogenesis, we developed ostn knockout fish
using transcription activator-like effector nuclease (TALEN). TALEN targeting to ostn
successfully deleted 5 base pairs. The resulting allele encoded 40 mutated amino acids from
18Phe (F) followed by a premature termination codon (Fig. 3A). We named these ostn
mutants ostnncv105 and screened the mutants by analyzing genome using PstI (Fig. 3A, B). We
also developed Tg(myl7:ostn,hsp70l:EGFP) line in which Ostn is expressed exclusively in
the heart to investigate the effect of overexpression of Ostn on bone formation. We noticed
the shortened heads in the ostnncv105 mutant larvae (Fig. 3C, D). We further examined the
length of head and body during the development from embryo and larva. The significant
shortening of the head length was observed at 6 days post-fertilization (dpf), when the growth
of bones and cartilages became active (Fig. S3A, B). Thus, we quantitatively measured the
ratio of the head length to the total body length and the length of cranial bones: entopterygoid
(ent), parasphenoid (ps), branchiostegal ray (bsr), and cleithrum (cl). The head length of the
mutant was shorter than the control at 7dpf. While the length of the ps in the ostnncv105 mutant
larvae was shorter than that of the wild type larvae, the length of other intracranial
membranous bones; ent, bsr, and cl, was comparable among ostnncv105 mutants,
Dev
elo
pmen
t • A
dvan
ce a
rtic
le
Tg(myl7:ostn,hsp70l:EGFP), and wild type larvae at 7 dpf (Fig. 3D, E). The head length of
the ostnncv105 mutant larvae was shorter than that of the control larvae at 10 dpf (Fig S4A).
Consistently, the length of the bones in the ostnncv105 mutant larvae was shorter than that of
the control larvae (Fig. S4B, C). We then examined the effect of ostn knockdown using
morpholino oligonucleotide (MO) on the length of the ps. In the ostn morphants, the length of
the ps was shorter than that of the larvae injected with vehicle (Fig. S4D-F). We confirmed
that the circulation of the ostn morphants was unaffected (Movies 3, 4). To further examine
the contribution of Ostn derived from CMs to bone formation, we crossed the
Tg(myl7:ostn,hsp70l:EGFP) fish with the ostnncv105 fish. The shortened ps found in the
ostnncv105 mutant larvae was reversed by the overexpression of Ostn in the CMs (Fig. 3F, G).
These data suggest that Ostn derived from the CMs might contribute to bone formation.
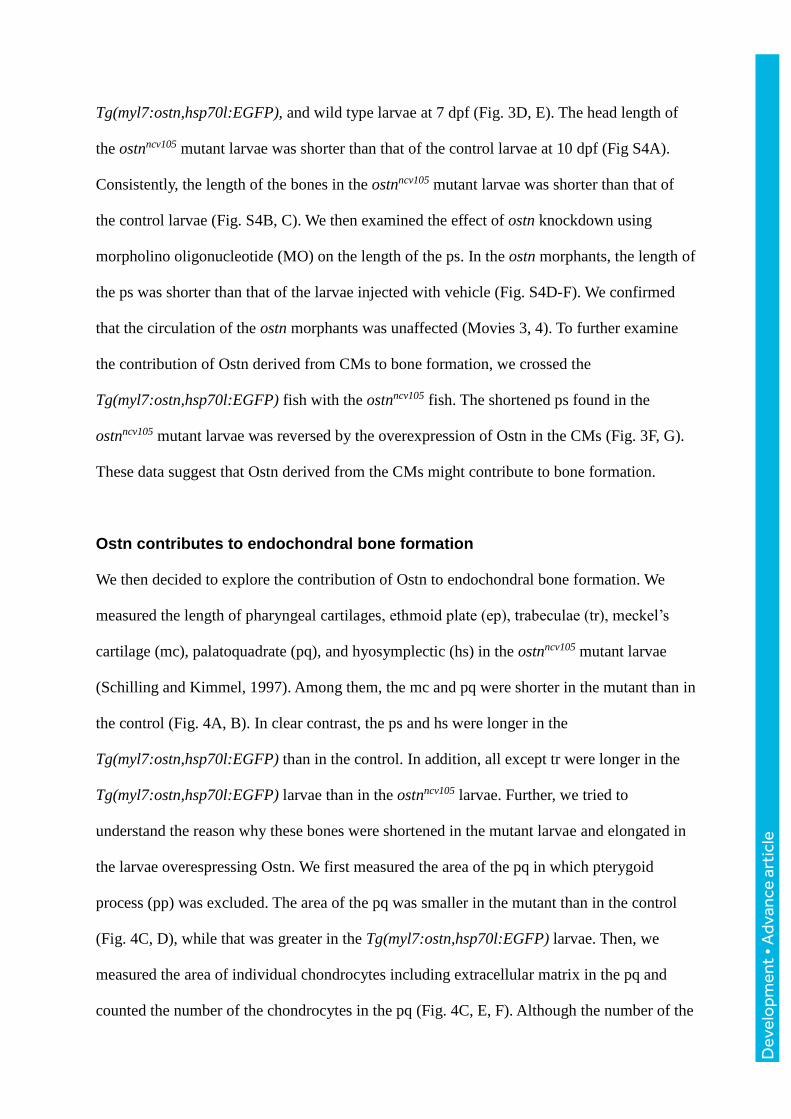
Ostn contributes to endochondral bone formation
We then decided to explore the contribution of Ostn to endochondral bone formation. We
measured the length of pharyngeal cartilages, ethmoid plate (ep), trabeculae (tr), meckel’s
cartilage (mc), palatoquadrate (pq), and hyosymplectic (hs) in the ostnncv105 mutant larvae
(Schilling and Kimmel, 1997). Among them, the mc and pq were shorter in the mutant than in
the control (Fig. 4A, B). In clear contrast, the ps and hs were longer in the
Tg(myl7:ostn,hsp70l:EGFP) than in the control. In addition, all except tr were longer in the
Tg(myl7:ostn,hsp70l:EGFP) larvae than in the ostnncv105 larvae. Further, we tried to
understand the reason why these bones were shortened in the mutant larvae and elongated in
the larvae overespressing Ostn. We first measured the area of the pq in which pterygoid
process (pp) was excluded. The area of the pq was smaller in the mutant than in the control
(Fig. 4C, D), while that was greater in the Tg(myl7:ostn,hsp70l:EGFP) larvae. Then, we
measured the area of individual chondrocytes including extracellular matrix in the pq and
counted the number of the chondrocytes in the pq (Fig. 4C, E, F). Although the number of the
Dev
elo
pmen
t • A
dvan
ce a
rtic
le
cells was comparable between the mutant and control, the area of individual chondrocyte was
smaller in the mutant larvae and greater in the Tg(myl7:ostn,hsp70l:EGFP) larvae than in the
control, suggesting that Ostn might be involved in the regulation of endochondral bone
formation. Collectively, our data indicate the contribution of Ostn to both membranous and
endochondral bone formation.
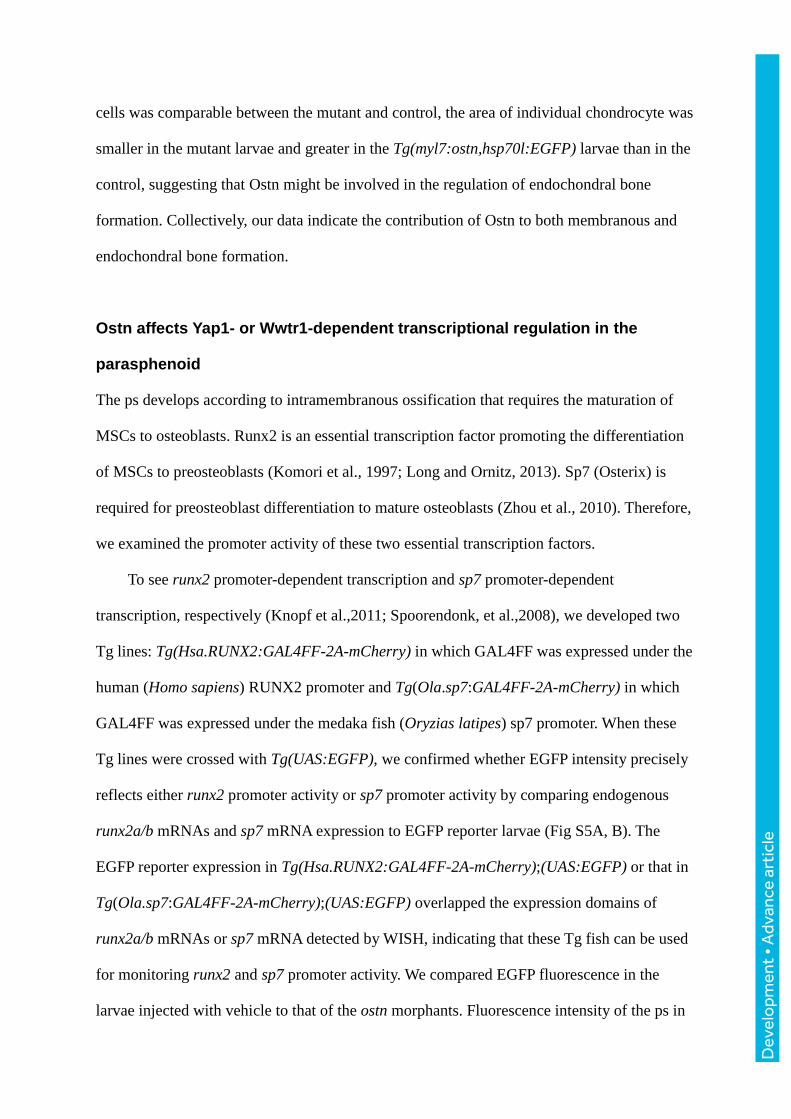
Ostn affects Yap1- or Wwtr1-dependent transcriptional regulation in the
parasphenoid
The ps develops according to intramembranous ossification that requires the maturation of
MSCs to osteoblasts. Runx2 is an essential transcription factor promoting the differentiation
of MSCs to preosteoblasts (Komori et al., 1997; Long and Ornitz, 2013). Sp7 (Osterix) is
required for preosteoblast differentiation to mature osteoblasts (Zhou et al., 2010). Therefore,
we examined the promoter activity of these two essential transcription factors.
To see runx2 promoter-dependent transcription and sp7 promoter-dependent
transcription, respectively (Knopf et al.,2011; Spoorendonk, et al.,2008), we developed two
Tg lines: Tg(Hsa.RUNX2:GAL4FF-2A-mCherry) in which GAL4FF was expressed under the
human (Homo sapiens) RUNX2 promoter and Tg(Ola.sp7:GAL4FF-2A-mCherry) in which
GAL4FF was expressed under the medaka fish (Oryzias latipes) sp7 promoter. When these
Tg lines were crossed with Tg(UAS:EGFP), we confirmed whether EGFP intensity precisely
reflects either runx2 promoter activity or sp7 promoter activity by comparing endogenous
runx2a/b mRNAs and sp7 mRNA expression to EGFP reporter larvae (Fig S5A, B). The
EGFP reporter expression in Tg(Hsa.RUNX2:GAL4FF-2A-mCherry);(UAS:EGFP) or that in
Tg(Ola.sp7:GAL4FF-2A-mCherry);(UAS:EGFP) overlapped the expression domains of
runx2a/b mRNAs or sp7 mRNA detected by WISH, indicating that these Tg fish can be used
for monitoring runx2 and sp7 promoter activity. We compared EGFP fluorescence in the
larvae injected with vehicle to that of the ostn morphants. Fluorescence intensity of the ps in
Dev
elo
pmen
t • A
dvan
ce a
rtic
le
the ostn morphants was comparable to that of the control larvae (Fig 5A), indicating that the
promoter activity of runx2 and sp7 is not affected by Ostn.
The function of YAP1 and WWTR1 (TAZ) in osteogenesis has been controversial. YAP1
represses RUNX2-mediated transcription (Zaidi et al., 2004). WWTR1 functions as a
coactivator for RUNX2 during MSC differentiation to osteoblast (Hong et al., 2005).
Meanwhile, osteoblast-specific overexpression of WWTR1 enhances bone formation (Yang
et al., 2013). We, thus, monitored Yap1/Wwtr1 transcriptional activity using the
Tg(Ola.sp7:Gal4db-Hsa.TEAD2N-2A-mCherry);(UAS:EGFP) larvae in which nuclear
translocated Yap1 or Wwtr1 induces GAL4/UAS system-driven EGFP expression (Fig 5B).
When ostn was knocked down using MO, Yap1/Wwtr1-dependent transcription was
increased (Fig. 5C, D), suggesting that nuclear translocation of Yap1/Wwtr1 is suppressed by
Ostn-mediated signaling. Consistent with the results of the ps length at 7 dpf (Fig. 3E), Yap1-
dependent transcription in the op, bsr, and ent at 6 dpf was comparable between the ostn
and control morphants (Fig. S8A, B).
To test whether Yap1 regulates growth of the ps, we overexpressed a constitutively active
form of Yap1, Yap1-5SA or a dominant negative form of Yap1, Yap1-Tead interfering peptide
(Ytip) (von et al., 2012; Zhao et al., 2007). The larvae expressing Yap1-5SA were selected by
the expression of mCherry expressed in the crystallin alpha A (cryaa) promoter-active eyes.
When Yap1-5SA was transiently expressed using sp7 promoter and GAL4/UAS system, the
ps became shortened (Fig. 5E, F). In clear contrast, when Ytip was stably expressed in the ps
using GAL4/UAS system, the ps became elongated (Fig. 5G, H). These data suggest that
Ostn-dependent inhibition of Yap1-mediated signal is involved in the growth of membranous
bones.
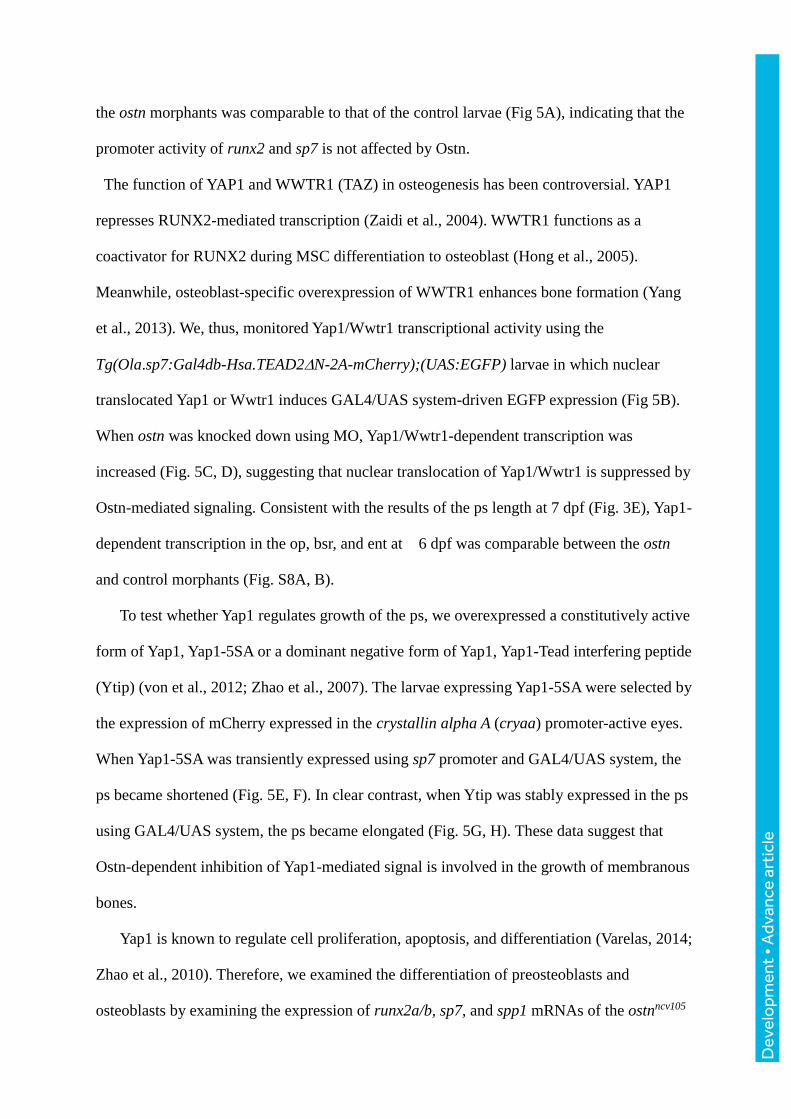
Yap1 is known to regulate cell proliferation, apoptosis, and differentiation (Varelas, 2014;
Zhao et al., 2010). Therefore, we examined the differentiation of preosteoblasts and
osteoblasts by examining the expression of runx2a/b, sp7, and spp1 mRNAs of the ostnncv105
Dev
elo
pmen
t • A
dvan
ce a
rtic
le
mutant larvae. The expression of these genes was comparable between the mutant and control
larvae (Fig. S6A-D). Furthermore, we analyzed cell proliferation and apoptosis in the ps of
the ostn and control morphants. Proliferation of the ps cells marked by EGFP was analyzed
by EdU incorporation in the morphants. There was no difference of proliferation between the
two groups (Fig. S7A, C). We used another Tg fish, Tg(Ola.sp7:EGFP) to directly mark cells
in the ps. By TUNEL staining, apoptotic cells were barely or not detected in the ps cells of
either the ostn or control morphants of this Tg larvae (Fig. S7B, D). Furthermore, we
investigated the maturation of osteoblasts and chondrocytes by examining the expression of
col10a1 mRNAs that is known to be inhibited by Yap1 (Deng et al., 2016). There was no
significant expression difference between the control and ostnncv105 mutant larvae at 4 dpf
when we examined the expression by WISH. However, when we examined it by quantitative
(q)RT-PCR, the expression of col10a1 mRNAs was suppressed in the ostnncv105 mutant larvae
at 7 dpf.
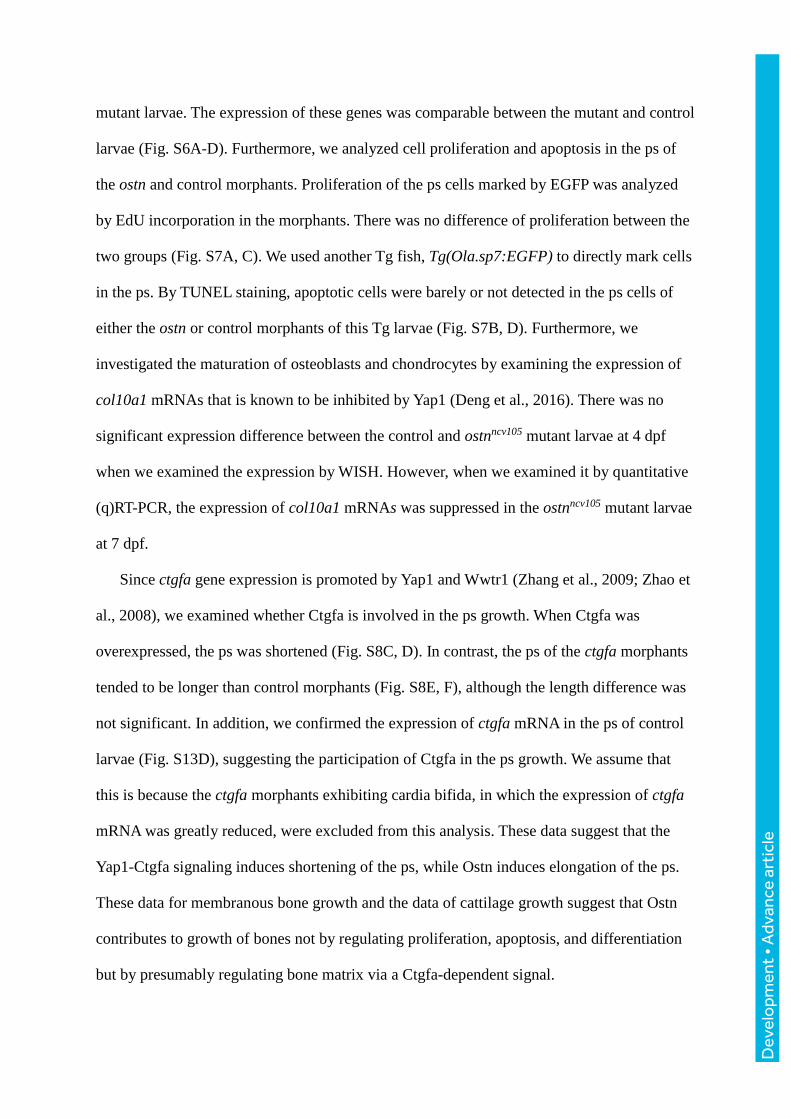
Since ctgfa gene expression is promoted by Yap1 and Wwtr1 (Zhang et al., 2009; Zhao et
al., 2008), we examined whether Ctgfa is involved in the ps growth. When Ctgfa was
overexpressed, the ps was shortened (Fig. S8C, D). In contrast, the ps of the ctgfa morphants
tended to be longer than control morphants (Fig. S8E, F), although the length difference was
not significant. In addition, we confirmed the expression of ctgfa mRNA in the ps of control
larvae (Fig. S13D), suggesting the participation of Ctgfa in the ps growth. We assume that
this is because the ctgfa morphants exhibiting cardia bifida, in which the expression of ctgfa
mRNA was greatly reduced, were excluded from this analysis. These data suggest that the
Yap1-Ctgfa signaling induces shortening of the ps, while Ostn induces elongation of the ps.
These data for membranous bone growth and the data of cattilage growth suggest that Ostn
contributes to growth of bones not by regulating proliferation, apoptosis, and differentiation
but by presumably regulating bone matrix via a Ctgfa-dependent signal.
Dev
elo
pmen
t • A
dvan
ce a
rtic
le
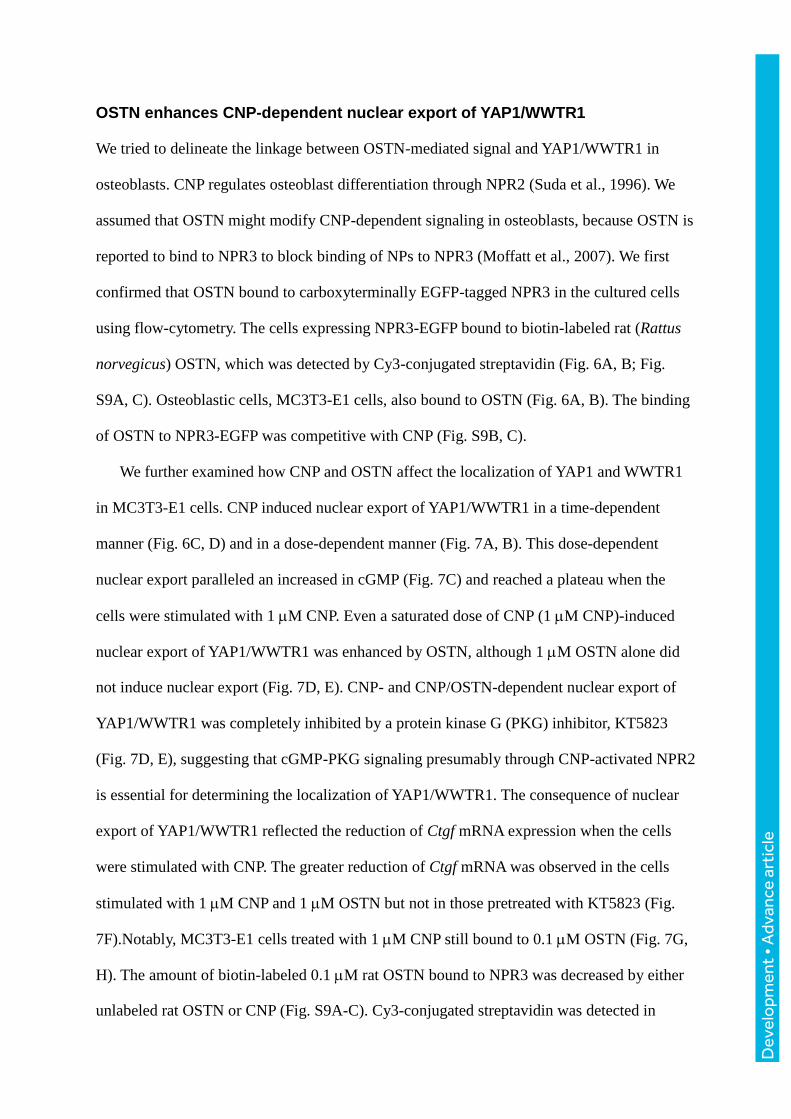
OSTN enhances CNP-dependent nuclear export of YAP1/WWTR1
We tried to delineate the linkage between OSTN-mediated signal and YAP1/WWTR1 in
osteoblasts. CNP regulates osteoblast differentiation through NPR2 (Suda et al., 1996). We
assumed that OSTN might modify CNP-dependent signaling in osteoblasts, because OSTN is
reported to bind to NPR3 to block binding of NPs to NPR3 (Moffatt et al., 2007). We first
confirmed that OSTN bound to carboxyterminally EGFP-tagged NPR3 in the cultured cells
using flow-cytometry. The cells expressing NPR3-EGFP bound to biotin-labeled rat (Rattus
norvegicus) OSTN, which was detected by Cy3-conjugated streptavidin (Fig. 6A, B; Fig.
S9A, C). Osteoblastic cells, MC3T3-E1 cells, also bound to OSTN (Fig. 6A, B). The binding
of OSTN to NPR3-EGFP was competitive with CNP (Fig. S9B, C).
We further examined how CNP and OSTN affect the localization of YAP1 and WWTR1
in MC3T3-E1 cells. CNP induced nuclear export of YAP1/WWTR1 in a time-dependent
manner (Fig. 6C, D) and in a dose-dependent manner (Fig. 7A, B). This dose-dependent
nuclear export paralleled an increased in cGMP (Fig. 7C) and reached a plateau when the
cells were stimulated with 1 M CNP. Even a saturated dose of CNP (1 M CNP)-induced
nuclear export of YAP1/WWTR1 was enhanced by OSTN, although 1 M OSTN alone did
not induce nuclear export (Fig. 7D, E). CNP- and CNP/OSTN-dependent nuclear export of
YAP1/WWTR1 was completely inhibited by a protein kinase G (PKG) inhibitor, KT5823
(Fig. 7D, E), suggesting that cGMP-PKG signaling presumably through CNP-activated NPR2
is essential for determining the localization of YAP1/WWTR1. The consequence of nuclear
export of YAP1/WWTR1 reflected the reduction of Ctgf mRNA expression when the cells
were stimulated with CNP. The greater reduction of Ctgf mRNA was observed in the cells
stimulated with 1 M CNP and 1 M OSTN but not in those pretreated with KT5823 (Fig.
7F).Notably, MC3T3-E1 cells treated with 1 M CNP still bound to 0.1 M OSTN (Fig. 7G,
H). The amount of biotin-labeled 0.1 M rat OSTN bound to NPR3 was decreased by either
unlabeled rat OSTN or CNP (Fig. S9A-C). Cy3-conjugated streptavidin was detected in
Dev
elo
pmen
t • A
dvan
ce a
rtic
le
MC3T3-E1 cells that were not treated with either unlabeled rat OSTN or biotin alone. Biotin-
labeled 0.1 M rat OSTN binding to MC3T3-E1 cells was not affected by insulin, which was
used as a negative control (Fig. S10A, B). Collectively, these data suggest that OSTN can
bind to unidentified receptors besides NPR3 in MC3T3-E1 cells.
Because we found that endochondral bone formation was regulated by Ostn in zebrafish
(Fig. 4), we examined the effect of Ostn on CNP-dependent localization of YAP1/WWTR1 in
chondrogenic cells, ATDC5. CNP induced nuclear export of YAP1/WWTR1 in both time-
and dose-dependent manner in ATDC5 cells similar to MC3T3-E1 cells (Fig. S11A-D). These
data indicate that CNP-dependent signal induces nuclear export of YAP1/WWTR1 in
chondrogenic cells.
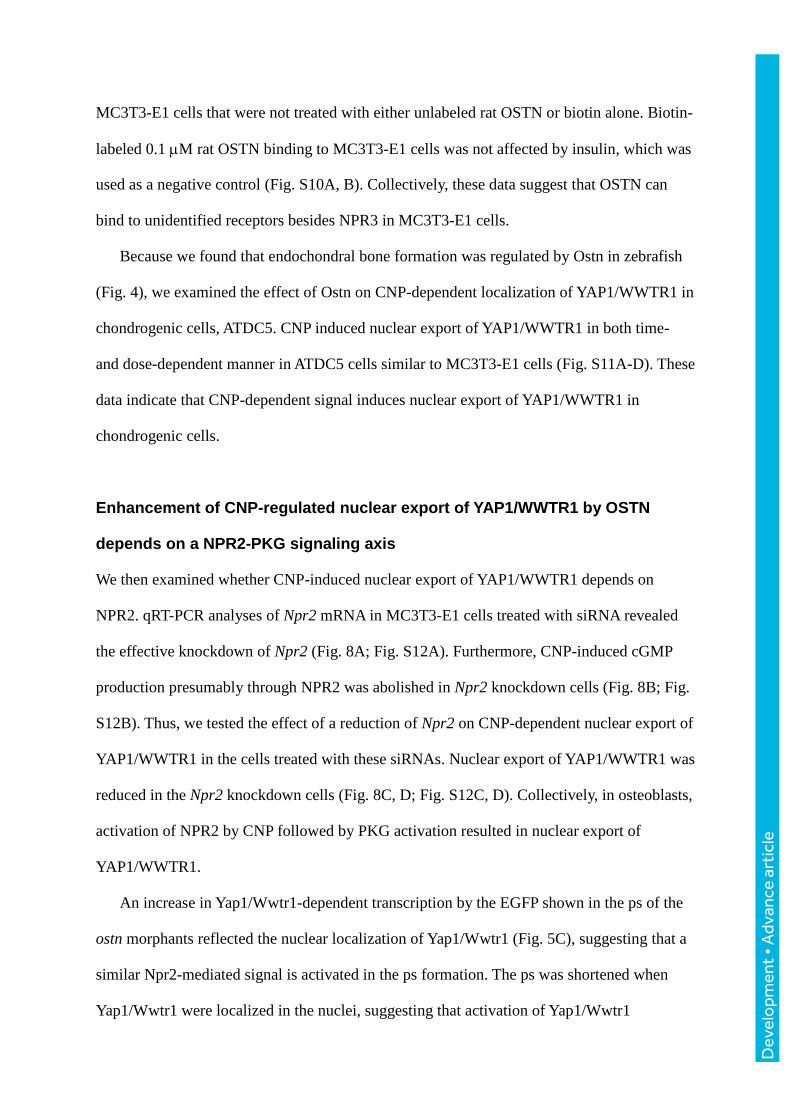
Enhancement of CNP-regulated nuclear export of YAP1/WWTR1 by OSTN
depends on a NPR2-PKG signaling axis
We then examined whether CNP-induced nuclear export of YAP1/WWTR1 depends on
NPR2. qRT-PCR analyses of Npr2 mRNA in MC3T3-E1 cells treated with siRNA revealed
the effective knockdown of Npr2 (Fig. 8A; Fig. S12A). Furthermore, CNP-induced cGMP
production presumably through NPR2 was abolished in Npr2 knockdown cells (Fig. 8B; Fig.
S12B). Thus, we tested the effect of a reduction of Npr2 on CNP-dependent nuclear export of
YAP1/WWTR1 in the cells treated with these siRNAs. Nuclear export of YAP1/WWTR1 was
reduced in the Npr2 knockdown cells (Fig. 8C, D; Fig. S12C, D). Collectively, in osteoblasts,
activation of NPR2 by CNP followed by PKG activation resulted in nuclear export of
YAP1/WWTR1.
An increase in Yap1/Wwtr1-dependent transcription by the EGFP shown in the ps of the
ostn morphants reflected the nuclear localization of Yap1/Wwtr1 (Fig. 5C), suggesting that a
similar Npr2-mediated signal is activated in the ps formation. The ps was shortened when
Yap1/Wwtr1 were localized in the nuclei, suggesting that activation of Yap1/Wwtr1
Dev
elo
pmen
t • A
dvan
ce a
rtic
le
transcription results in the shortening of the ps. To test that Npr2-dependent signal
participates in the ps formation, we examined how the reduction of Npr2 expression affects
the ps formation. Before examining this effect, we analyzed the expression of npr2, npr3, and
nppcl mRNAs. The WISH analyses revealed that npr2 mRNA was detected in head
mesenchyme, pectral fin bud/pectral fin, ceratohyal, and hyosymplectic. npr3 mRNA was
detected in midbrain hindbrain boundary and floor plate. nppcl mRNA was also detected in
the brain (Fig. S13A-C). Although we tried to examine the npr2 mRNA and npr3 mRNA in
the ps of the larvae at 5 dpf, these mRNAs were barely detected in the ps (Fig. S13D). These
data suggest that at least Nppcl-Npr2/Npr3 might function in zebrafish, although we failed to
detect their expression in the ps.
The morpholinos against npr2 were validated by examining the splicing efficiency (Fig.
S14A). The npr2 morphants exhibited shortened ps at 5 dpf (Fig. 8E, F). Furthermore, this
shortening of the ps was rescued by the injection of npr2 mRNA in the larvae at 7 dpf (Fig.
S14B, C). These data indicate that Npr2-mediated signal is involved in the regulation of bone
growth in vivo.
Dev
elo
pmen
t • A
dvan
ce a
rtic
le
DISCUSSION
We identified Ostn as an endocrine hormone produced in the heart that regulates osteogenesis
and chondrogenesis in zebrafish. Besides ANP and BNP, no endocrine hormones affecting
remote organs have been reported in the heart. Although OSTN is proposed to belong to NP
family, it lacks the cysteine residues that render itself circular by a disulfide bridge that is
conserved among NP family members: ANP, BNP, and CNP (Potter et al., 2006; Riley and
Smart, 2011). In addition, OSTN binds to NPR3 but not NPR2, thereby augmenting CNP-
dependent NPR2 activation by inhibiting clearance of CNP in chondrocytes but not in
osteoblasts (Moffatt et al., 2007). In agreement with this notion, our data suggest that Ostn
contributes to both membranous bone formation and endochondral bone formation by
inducing nuclear export of Yap1/Wwtr1. The present data also suggest that Ostn activates an
unidentified receptor to regulate osteogenesis in zebrafish. Therefore, we provide evidence
that the heart secretes a new peptide regulating bone formation, although it is unlikely to
belong to the NP family.
We found that membranous bones and endochondral bones were shortened in the
ostnncv105 mutant larvae. At the early stage, Ostn affected the growth of the ps among the
cranial bones that develop according to intramembranous ossification. The ps develops earlier
than other bones (Verreijdt et al., 2006). Thus, we could detect the shortening of the ps at an
early stage (7 dpf). At the later stage, other membranous bones were also shortened.
Furthermore, cartilages were shortened. These data suggest that the common signaling
pathway regulates growth of both bones. As mammalian chondrocytes express Runx2 and
Col10a1, zebrafish osteoblasts express these genes (Li et al., 2009). We noticed no alteration
of Runx2 expression in the ostnncv105 mutant larvae. Therefore, Ostn-mediated signal might be
involved in the promoting expression of the genes that are essential for bone matrix
apposition.
Dev
elo
pmen
t • A
dvan
ce a
rtic
le
OSTN augments CNP-dependent nuclear export of YAP1/WWTR1 in osteoblasts and
chondrocytes. It is of note that CNP induces export of YAP1/WWTR1 in those cells. There
have been no report that NPs regulate the localization of YAP1/WWTR1. Inhibition of PKG
resulted in the inhibition of export of YAP1/WWTR1. Although protein kinase A, another
Ser/Thr kinase, is reported to determine the localization of YAP1 through LATS kinase
(Iglesias-Bartolome et al., 2015; Kim et al., 2013), PKG-dependent regulation has not been
reported. OSTN-Tg mice exhibit elongated bones and kyphosis that are also found in BNP-
Tg mice, CNP-Tg mice, and Npr3 knockout mice (Jaubert et al., 1999; Kake et al., 2009;
Matsukawa et al., 1999; Yasoda et al., 2004). Elongation of bones is thought to be ascribed to
modulation of CNP-NPR3 signaling by OSTN in chondrocytes (Moffatt et al., 2007). OSTN
binds to NPR3 and is proposed to inhibit clearance of CNP, thereby resulting in augmentation
of CNP-dependent signal. Notably, OSTN augmented YAP1/WWTR1 nuclear export at a
saturated concentration of CNP for NP receptors. These results suggested that OSTN binds to
an unidentified receptor to modulate CNP-dependent signaling downstream of NPR2,
because OSTN itself did not induce nuclear export of YAP1/WWTR1 in osteoblasts. We need
to identify the OSTN-specific receptor to clearly delineate the OSTN signaling that is not
through NPR3.
The role for YAP1/WWTR1-dependent signal in osteogenesis remains controversial.
WWTR1 regulates the differentiation of MSCs to osteoblasts (Hong et al., 2005).
Overexpression of WWTR1 in mice leads to an increased bone mass by RUNX2-dependent
transcription (Yang et al., 2013). On the other hand, YAP1 represses RUNX2-transciptional
activity by binding to RUNX2 (Zaidi et al., 2004). One group reports that fibroblast growth
factor 2 (FGF2) downregulates WWTR1 in MC3T3-E1 cells to induce proliferation of the
cells (Eda et al., 2008), whereas another group demonstrated that FGF2 induces
differentiation of osteoblasts (Byun et al., 2014). Therefore, it is still controversial how
YAP1/WWTR1 function in osteoblasts after the differentiation from MSCs in vivo.
Dev
elo
pmen
t • A
dvan
ce a
rtic
le
Proliferation, differentiation, and apoptosis in the osteoblasts are not altered in the ostn
morphants. However, the size of chondrocytes was smaller in the ostn mutants than the
control, suggesting that Yap1/Wwtr1-mediated signal might participate in bone matrix
deposition or mineralization. The expression of col10a1 mRNAs was decreased in the
ostnncv105 mutant larvae at 7 dpf. Because mRNAs were prepared from the whole larvae, it is
unclear whether this decrease was attributable to that in the osteoblasts or chondrocytes. The
expression of Col10a1 has been transcriptionally inhibited by Yap1 (Deng, et al., 2016), our
results are consistent with this previous report.
The CTGF-dependent bone formation appears to be complicated. While Ctgf-deficient
mice show impaired chondrocyte proliferation and matrix composition in the hypertrophic
chondrocytes (Ivkovic et al., 2003), overexpression of CTGF using osteocalcin promoter
results in the impairment of osteoblastic activity due to decreased mineral apposition
(Smerdel-Ramoya et al., 2008). However, another study reports that CTGF-deficient
osteoblasts exhibit reduced proliferation but normal mineralization (Mundy et al., 2014).
These results suggest that CTGF expression promoted by YAP1/WWTR1 might function in
bone formation stage-dependent and cell-dependent manners.
Ostn from the CS that controls calcium homeostasis might also contribute to the bone
formation. We found that Ostn was expressed in the CS where Casr and stanniocalcin are
expressed (Lin et al., 2014; Tseng et al., 2009). In the CS, Casr senses the extracellular Ca2+
and regulates stanniocalcin that acts on Na+/K+-ATPase –rich cells in zebrafish functioning in
Ca2+ absorption (Tseng et al., 2009). Therefore, if Ostn regulates Ca2+ balance through the
CS, the impaired bone formation found in the ostnncv105 mutant larvae might be ascribed to
the dysfunction of the CS.
In summary, we demonstrate that Ostn produced in CMs contributes to the formation of
both membranous and endochondral bone (Fig. 9). OSTN enhanced peak CNP-dependent
nuclear export of YAP1/WWTR1 in the osteoblasts and chondrocytes. Our data suggest that
Dev
elo
pmen
t • A
dvan
ce a
rtic
le

Ostn regulates osteogenesis and chondrogenesis in zebrafish cooperatively through NP-
dependent signaling and through the unidentified Ostn receptor-mediated signaling.
Dev
elo
pmen
t • A
dvan
ce a
rtic
le
MATERIALS AND METHODS
Zebrafish husbandry
Zebrafish were maintained under standard conditions. The experiments using zebrafish were
approved by the institutional animal committee of the National Cerebral and Cardiovascular
Center and performed according to the guidelines of the institute. Embryos and larvae were
staged by hpf at 28°C (Kimmel et al., 1995).
Plasmids
Construction of Tol2-based plasmids used to establish Tg zebrafish lines is described in the
supplementary Materials and Methods.
Tg and mutant fish lines
Transgenic zebrafish lines and the ostnncv105 mutant zebrafish line were established as
described in the supplementary Materials and Methods. Tg(UAS:EGFP) fish line was
provided by K. Kawakami (National Institute of Genetics, Japan) (Asakawa et al., 2008).
FACS and RNA-seq
mCherry- or tdEos-positive cells were isolated by FACS from Tg(myl7:NLS-mCherry) or
Tg(myl7:actn2-tdEos) larvae, respectively. The isolated cells were subjected to RNA-seq
analyses as described in the supplementary Materials and Methods.
WISH
Embryos and larvae at 1-4 dpf were hybridized with digoxigenin labeled antisense RNA
probes as described in the supplementary Materials and Methods.
Dev
elo
pmen
t • A
dvan
ce a
rtic
le
Bone staining
Larvae at 5-10 dpf were stained membranous bones with Alizarin red S and cartilages with
Alcian Blue 8GX as described in the supplementary Materials and Methods.
Microinjection of oligonucleotide and mRNA
For gene knock down, one-cell stage embryos were injected with MO. For protein over
expression, one-cell stage embryos were injected with mRNA as described in the
supplementary Materials and Methods.
Image acquisition by microscopes and image processing
Larvae were anesthetized and mounted in 1% low-melting agarose on a 35-mm-diameter
glass-base dish (Asahi Techno Glass) as previously described (Kashiwada et al., 2015).
Fluorescence images were recorded with a confocal microscope (FV1000 or FV1200,
Olympus) with 20x water objective lens (XLUMPlanFL, 1.0NA, Olympus) or a multi
photon-microscope (FV1000PME, Olympus) with 25x water objective lens (XLPlan,
1.05NA, Olympus). Images processed with a FV10-ASW 4.1 software (Olympus) were
analyzed by an IMARIS 7.7.1 software (Bitplane).
OSTN binding assay
Streptavidin conjugated Cy3 was incubated with biotin-labeled rat OSTN to form OSTN-B–
SA-Cy3. 293T cells expressed NPR3-EGFP or EGFP and MC3T3-E1 cells were suspended,
incubated with OSTN-B–SA-Cy3, and measured fluorescence intensities by FACS as
described in the supplementary Materials and Methods.
Dev
elo
pmen
t • A
dvan
ce a
rtic
le
Immunocytochemical analyses
MC3T3-E1 cells and ATDC5 cells were subjected to immunocytochemistry with anti-
YAP1/WWTR1 antibody at 1:300 as described in the supplementary Materials and Methods.
Quantitative analyses of fluorescence
To quantify the Yap1/Wwtr1 transcriptional activity in membranous bone, confocal stack
fluorescence images of EGFP and Alizarin red in the membranous bone regions of
Tg(Ola.sp7:Gal4db-Hsa.TEAD2N-2A-mCherry);(UAS:EGFP) fish larvae at 6 dpf were
recorded. The mean EGFP fluorescence intensity within a circle (100 m2) of EGFP-positive
cells was measured using a FV10-ASW 4.1 software (Olympus).
To quantify the percentage of MC3T3-E1 and ATDC5 cells showing YAP1/WWTR1
cytoplasmic localization, each cell was measured for the mean fluorescence intensity of
YAP1/WWTR1 staining inside a circle (8 m in diameter) in the cytoplasm or nucleus using
MetaMorph software (Molecular Devices). Cells showing that the ratio of the cytoplasmic
intensity divided by the nuclear intensity was greater than one were considered to be positive
for the cytoplasmic localization of YAP1/WWTR1. The percentage of the cells showing
cytoplasmic localization among the total cells was calculated using the unbiased images of
four different microscopic fields.
Statistical analysis
Data are expressed as mean ± s.e.m. Statistical significance was determined by Student’s t-test
for paired samples or by one-way analysis of variance (ANOVA) with Turkey’s test. Data were
considered statistically significant at p<0.05
Dev
elo
pmen
t • A
dvan
ce a
rtic
le
Acknowledgements
We thank Koichi Kawakami (National Institute of Genetics, Japan) for providing us with
Tg(UAS:EGFP) fish; Gary Felsenfeld (National Institutes of Health, USA), Hiroshi Nishina
(Tokyo Medical and Dental University, Japan) and John Kuwada (University of Michigan,
USA) for valuable materials; Manami Sone, Keiko Hiratomi, Wakana Koeda, Mayumi Ueda,
and Tomo Babazono for excellent technical assistance; and Eri Okamoto and Shigemi
Toyoshima for fish care. We are grateful to the National BioResource Project from MEXT,
Japan for several lines of fish.
Competing interests
The authors declare no competing or financial interests.
Author contribution
A.C., H.W.T., M.U., K.T, T.M. H.F., H.H., and M.H. performed experiments; H.W.T., S.F.
and N.M. designed the research; A.C., H.W.T., and N.M. wrote the paper.
Funding
This work was partly supported by JSPS KAKENHI Grant Number 22122003 and
16H02618, AMED-CREST Grant Number 13414779 to N.M., by Health Labor Science
Research Grants to N.M., and by the grant from Takeda Science Foundation to N.M..
Supplementary information
Supplementary 14 figures, four movies, and materials and methods are in the supplementary
materials.
Dev
elo
pmen
t • A
dvan
ce a
rtic
le
References
Arita,Y., Nakaoka,Y., Matsunaga,T., Kidoya,H., Yamamizu,K., Arima,Y., Kataoka-
Hashimoto,T., Ikeoka,K., Yasui,T., Masaki,T. et al. (2014). Myocardium-derived
angiopoietin-1 is essential for coronary vein formation in the developing heart. Nat.
Commun. 5, 4552.
Asakawa,K., Suster,M.L., Mizusawa,K., Nagayoshi,S., Kotani,T., Urasaki,A.,
Kishimoto,Y., Hibi,M., and Kawakami,K. (2008). Genetic dissection of neural
circuits by Tol2 transposon-mediated Gal4 gene and enhancer trapping in zebrafish.
Proc. Natl. Acad. Sci. U. S. A 105, 1255-1260.
Becker,J.R., Chatterjee,S., Robinson,T.Y., Bennett,J.S., Panakova,D.,
Galindo,C.L., Zhong,L., Shin,J.T., Coy,S.M., Kelly,A.E. et al. (2014). Differential
activation of natriuretic peptide receptors modulates cardiomyocyte proliferation
during development. Development 141, 335-345.
Byun,M.R., Kim,A.R., Hwang,J.H., Kim,K.M., Hwang,E.S., and Hong,J.H. (2014).
FGF2 stimulates osteogenic differentiation through ERK induced TAZ expression.
Bone 58, 72-80.
Dauphinee,S.M., Eva,M.M., Yuki,K.E., Herman,M., Vidal,S.M., and Malo,D.
(2013). Characterization of two ENU-induced mutations affecting mouse skeletal
morphology. G3. (Bethesda. ) 3, 1753-1758.
Deng,Y., Wu,A., Li,P., Li, G., Qin, L., Song, H., and Mak,K.K. (2016). Yap1
regulates multiple steps of chondrocyte differentiation during skeletal development
and bone repair. Cell Rep. 14, 2224-2237.
Eda,H., Aoki,K., Marumo,K., Fujii,K., and Ohkawa,K. (2008). FGF-2 signaling
induces downregulation of TAZ protein in osteoblastic MC3T3-E1 cells. Biochem.
Biophys. Res. Commun. 366, 471-475.
Hagiwara,H., Sakaguchi,H., Itakura,M., Yoshimoto,T., Furuya,M., Tanaka,S., and
Hirose,S. (1994). Autocrine regulation of rat chondrocyte proliferation by natriuretic
peptide C and its receptor, natriuretic peptide receptor-B. J. Biol. Chem. 269, 10729-
10733.
Hong,J.H., Hwang,E.S., McManus,M.T., Amsterdam,A., Tian,Y., Kalmukova,R.,
Mueller,E., Benjamin,T., Spiegelman,B.M., Sharp,P.A. et al. (2005). TAZ, a
Dev
elo
pmen
t • A
dvan
ce a
rtic
le
transcriptional modulator of mesenchymal stem cell differentiation. Science 309,
1074-1078.
Iglesias-Bartolome,R., Torres,D., Marone,R., Feng,X., Martin,D., Simaan,M.,
Chen,M., Weinstein,L.S., Taylor,S.S., Molinolo,A.A. et al. (2015). Inactivation of a
Galpha(s)-PKA tumour suppressor pathway in skin stem cells initiates basal-cell
carcinogenesis. Nat. Cell Biol. 17, 793-803.
Ivkovic,S., Yoon,B.S., Popoff,S.N., Safadi,F.F., Libuda,D.E., Stephenson,R.C.,
Daluiski,A., and Lyons,K.M. (2003). Connective tissue growth factor coordinates
chondrogenesis and angiogenesis during skeletal development. Development 130,
2779-2791.
Jaubert,J., Jaubert,F., Martin,N., Washburn,L.L., Lee,B.K., Eicher,E.M., and
Guenet,J.L. (1999). Three new allelic mouse mutations that cause skeletal
overgrowth involve the natriuretic peptide receptor C gene (Npr3). Proc. Natl. Acad.
Sci. U. S. A 96, 10278-10283.
Kake,T., Kitamura,H., Adachi,Y., Yoshioka,T., Watanabe,T., Matsushita,H.,
Fujii,T., Kondo,E., Tachibe,T., Kawase,Y. et al. (2009). Chronically elevated plasma
C-type natriuretic peptide level stimulates skeletal growth in transgenic mice. Am. J.
Physiol Endocrinol. Metab 297, E1339-E1348.
Karsenty,G., Kronenberg,H.M., and Settembre,C. (2009). Genetic control of bone
formation. Annu. Rev. Cell Dev. Biol. 25, 629-648.
Kashiwada,T., Fukuhara,S., Terai,K., Tanaka,T., Wakayama,Y., Ando,K.,
Nakajima,H., Fukui,H., Yuge,S., Saito,Y. et al. (2015). beta-Catenin-dependent
transcription is central to Bmp-mediated formation of venous vessels. Development
142, 497-509.
Kim,M., Kim,M., Lee,S., Kuninaka,S., Saya,H., Lee,H., Lee,S., and Lim,D.S.
(2013). cAMP/PKA signalling reinforces the LATS-YAP pathway to fully suppress
YAP in response to actin cytoskeletal changes. EMBO J. 32, 1543-1555.
Kimmel,C.B., Ballard,W.W., Kimmel,S.R., Ullmann,B., and Schilling,T.F. (1995).
Stages of embryonic development of the zebrafish. Dev. Dyn. 203, 253-310.
Knopf,F., Hammond,C., Chekuru,A., Kurth,T., Hans,S., Weber,C.W., Mahatma,G.,
Fisher,S., Brand,M., Schulte-Merker,S. et al. (2011). Bone regenerates via
dedifferentiation of osteoblasts in the zebrafish fin. Dev. Cell 20, 713-724.
Dev
elo
pmen
t • A
dvan
ce a
rtic
le
Komatsu,Y., Chusho,H., Tamura,N., Yasoda,A., Miyazawa,T., Suda,M., Miura,M.,
Ogawa,Y., and Nakao,K. (2002). Significance of C-type natriuretic peptide (CNP) in
endochondral ossification: analysis of CNP knockout mice. J. Bone Miner. Metab 20,
331-336.
Komori,T., Yagi,H., Nomura,S., Yamaguchi,A., Sasaki,K., Deguchi,K.,
Shimizu,Y., Bronson,R.T., Gao,Y.H., Inada,M. et al. (1997). Targeted disruption of
Cbfa1 results in a complete lack of bone formation owing to maturational arrest of
osteoblasts. Cell 89, 755-764.
Li,N., Felber,K., Elks,P., Croucher,P., and Roehl,H.H. (2009). Tracking gene
expression during zebrafish osteoblast differentiation. Dev. Dyn. 238, 459-466.
Lin,C.H., Su,C.H., and Hwang,P.P. (2014). Calcium-sensing receptor mediates
Ca(2+) homeostasis by modulating expression of PTH and stanniocalcin.
Endocrinology 155, 56-67.
Long,F. and Ornitz,D.M. (2013). Development of the endochondral skeleton. Cold
Spring Harb. Perspect. Biol. 5, a008334.
Matsukawa,N., Grzesik,W.J., Takahashi,N., Pandey,K.N., Pang,S., Yamauchi,M.,
and Smithies,O. (1999). The natriuretic peptide clearance receptor locally
modulates the physiological effects of the natriuretic peptide system. Proc. Natl.
Acad. Sci. U. S. A 96, 7403-7408.
Moffatt,P., Thomas,G., Sellin,K., Bessette,M.C., Lafreniere,F., Akhouayri,O., St-
Arnaud,R., and Lanctot,C. (2007). Osteocrin is a specific ligand of the natriuretic
Peptide clearance receptor that modulates bone growth. J. Biol. Chem. 282, 36454-
36462.
Moffatt,P. and Thomas,G.P. (2009). Osteocrin--beyond just another bone protein?
Cell Mol. Life Sci. 66, 1135-1139.
Mundy,C., Gannon,M., and Popoff,S.N. (2014). Connective tissue growth factor
(CTGF/CCN2) negatively regulates BMP-2 induced osteoblast differentiation and
signaling. J. Cell Physiol 229, 672-681.
Nishizawa,H., Matsuda,M., Yamada,Y., Kawai,K., Suzuki,E., Makishima,M.,
Kitamura,T., and Shimomura,I. (2004). Musclin, a novel skeletal muscle-derived
secretory factor. J. Biol. Chem. 279, 19391-19395.
Dev
elo
pmen
t • A
dvan
ce a
rtic
le
Ogawa,T. and de Bold,A.J. (2014). The heart as an endocrine organ. Endocr.
Connect. 3, R31-R44.
Potter,L.R., Abbey-Hosch,S., and Dickey,D.M. (2006). Natriuretic peptides, their
receptors, and cyclic guanosine monophosphate-dependent signaling functions.
Endocr. Rev. 27, 47-72.
Riley,P.R. and Smart,N. (2011). Vascularizing the heart. Cardiovasc. Res. 91, 260-
268.
Schilling,T.F. and Kimmel,C.B. (1997). Musculoskeletal patterning in the
pharyngeal segments of the zebrafish embryo. Development 124, 2945-2960.
Smerdel-Ramoya,A., Zanotti,S., Stadmeyer,L., Durant,D., and Canalis,E. (2008).
Skeletal overexpression of connective tissue growth factor impairs bone formation
and causes osteopenia. Endocrinology 149, 4374-4381.
Soltanoff,C.S., Yang,S., Chen,W., and Li,Y.P. (2009). Signaling networks that
control the lineage commitment and differentiation of bone cells. Crit Rev. Eukaryot.
Gene Expr. 19, 1-46.
Spoorendonk,K.M., Peterson-Maduro,J., Renn,J., Trowe,T., Kranenbarg,S.,
Winkler,C., and Schulte-Merker,S. (2008). Retinoic acid and Cyp26b1 are critical
regulators of osteogenesis in the axial skeleton. Development 135, 3765-3774.
Stepan,H., Faber,R., Stegemann,S., Schultheiss,H.P., and Walther,T. (2002).
Expression of C-type natriuretic peptide in human placenta and myometrium in
normal pregnancies and pregnancies complicated by intrauterine growth retardation.
Preliminary results. Fetal Diagn. Ther. 17, 37-41.
Stepan,H., Leitner,E., Siems,W.E., Maul,B., and Walther,T. (1999). mRNA
quantification of C-type natriuretic peptide in brain areas of rodents. Peptides 20,
1243-1245.
Subbotina,E., Sierra,A., Zhu,Z., Gao,Z., Koganti,S.R., Reyes,S., Stepniak,E.,
Walsh,S.A., Acevedo,M.R., Perez-Terzic,C.M. et al. (2015). Musclin is an activity-
stimulated myokine that enhances physical endurance. Proc. Natl. Acad. Sci. U. S. A
112, 16042-16047.
Suda,M., Ogawa,Y., Tanaka,K., Tamura,N., Yasoda,A., Takigawa,T., Uehira,M.,
Nishimoto,H., Itoh,H., Saito,Y. et al. (1998). Skeletal overgrowth in transgenic mice
Dev
elo
pmen
t • A
dvan
ce a
rtic
le
that overexpress brain natriuretic peptide. Proc. Natl. Acad. Sci. U. S. A 95, 2337-
2342.
Suda,M., Tanaka,K., Fukushima,M., Natsui,K., Yasoda,A., Komatsu,Y.,
Ogawa,Y., Itoh,H., and Nakao,K. (1996). C-type natriuretic peptide as an
autocrine/paracrine regulator of osteoblast. Evidence for possible presence of bone
natriuretic peptide system. Biochem. Biophys. Res. Commun. 223, 1-6.
Tamura,N., Doolittle,L.K., Hammer,R.E., Shelton,J.M., Richardson,J.A., and
Garbers,D.L. (2004). Critical roles of the guanylyl cyclase B receptor in
endochondral ossification and development of female reproductive organs. Proc.
Natl. Acad. Sci. U. S. A 101, 17300-17305.
Thomas,G., Moffatt,P., Salois,P., Gaumond,M.H., Gingras,R., Godin,E., Miao,D.,
Goltzman,D., and Lanctot,C. (2003). Osteocrin, a novel bone-specific secreted
protein that modulates the osteoblast phenotype. J. Biol. Chem. 278, 50563-50571.
Tseng,D.Y., Chou,M.Y., Tseng,Y.C., Hsiao,C.D., Huang,C.J., Kaneko,T., and
Hwang,P.P. (2009). Effects of stanniocalcin 1 on calcium uptake in zebrafish (Danio
rerio) embryo. Am. J. Physiol Regul. Integr. Comp Physiol 296, R549-R557.
Varelas,X. (2014). The Hippo pathway effectors TAZ and YAP in development,
homeostasis and disease. Development 141, 1614-1626.
Verreijdt,L., Debiais-Thibaud,M., Borday-Birraux,V., Van der Heyden,C.,
Sire,J.Y., and Huysseune,A. (2006). Expression of the dlx gene family during
formation of the cranial bones in the zebrafish (Danio rerio): differential involvement
in the visceral skeleton and braincase. Dev. Dyn. 235, 1371-1389.
von,G.A., Lin,Z., Schlegelmilch,K., Honor,L.B., Pan,G.M., Buck,J.N., Ma,Q.,
Ishiwata,T., Zhou,B., Camargo,F.D. et al. (2012). YAP1, the nuclear target of Hippo
signaling, stimulates heart growth through cardiomyocyte proliferation but not
hypertrophy. Proc. Natl. Acad. Sci. U. S. A 109, 2394-2399.
Yang,J.Y., Cho,S.W., An,J.H., Jung,J.Y., Kim,S.W., Kim,S.Y., Kim,J.E., and
Shin,C.S. (2013). Osteoblast-targeted overexpression of TAZ increases bone mass
in vivo. PLoS. One. 8, e56585.
Yasoda,A., Komatsu,Y., Chusho,H., Miyazawa,T., Ozasa,A., Miura,M.,
Kurihara,T., Rogi,T., Tanaka,S., Suda,M. et al. (2004). Overexpression of CNP in
chondrocytes rescues achondroplasia through a MAPK-dependent pathway. Nat.
Dev
elo
pmen
t • A
dvan
ce a
rtic
le

Med. 10, 80-86.
Zaidi,S.K., Sullivan,A.J., Medina,R., Ito,Y., van Wijnen,A.J., Stein,J.L., Lian,J.B.,
and Stein,G.S. (2004). Tyrosine phosphorylation controls Runx2-mediated
subnuclear targeting of YAP to repress transcription. EMBO J. 23, 790-799.
Zhang,H., Liu,C.Y., Zha,Z.Y., Zhao,B., Yao,J., Zhao,S., Xiong,Y., Lei,Q.Y., and
Guan,K.L. (2009). TEAD transcription factors mediate the function of TAZ in cell
growth and epithelial-mesenchymal transition. J. Biol. Chem. 284, 13355-13362.
Zhao,B., Li,L., Lei,Q., and Guan,K.L. (2010). The Hippo-YAP pathway in organ size
control and tumorigenesis: an updated version. Genes Dev. 24, 862-874.
Zhao,B., Wei,X., Li,W., Udan,R.S., Yang,Q., Kim,J., Xie,J., Ikenoue,T., Yu,J., Li,L.
et al. (2007). Inactivation of YAP oncoprotein by the Hippo pathway is involved in cell
contact inhibition and tissue growth control. Genes Dev. 21, 2747-2761.
Zhao,B., Ye,X., Yu,J., Li,L., Li,W., Li,S., Yu,J., Lin,J.D., Wang,C.Y.,
Chinnaiyan,A.M. et al. (2008). TEAD mediates YAP-dependent gene induction and
growth control. Genes Dev. 22, 1962-1971.
Zhou,X., Zhang,Z., Feng,J.Q., Dusevich,V.M., Sinha,K., Zhang,H., Darnay,B.G.,
and de,C.B. (2010). Multiple functions of Osterix are required for bone growth and
homeostasis in postnatal mice. Proc. Natl. Acad. Sci. U. S. A 107, 12919-12924.
Dev
elo
pmen
t • A
dvan
ce a
rtic
le
Figures
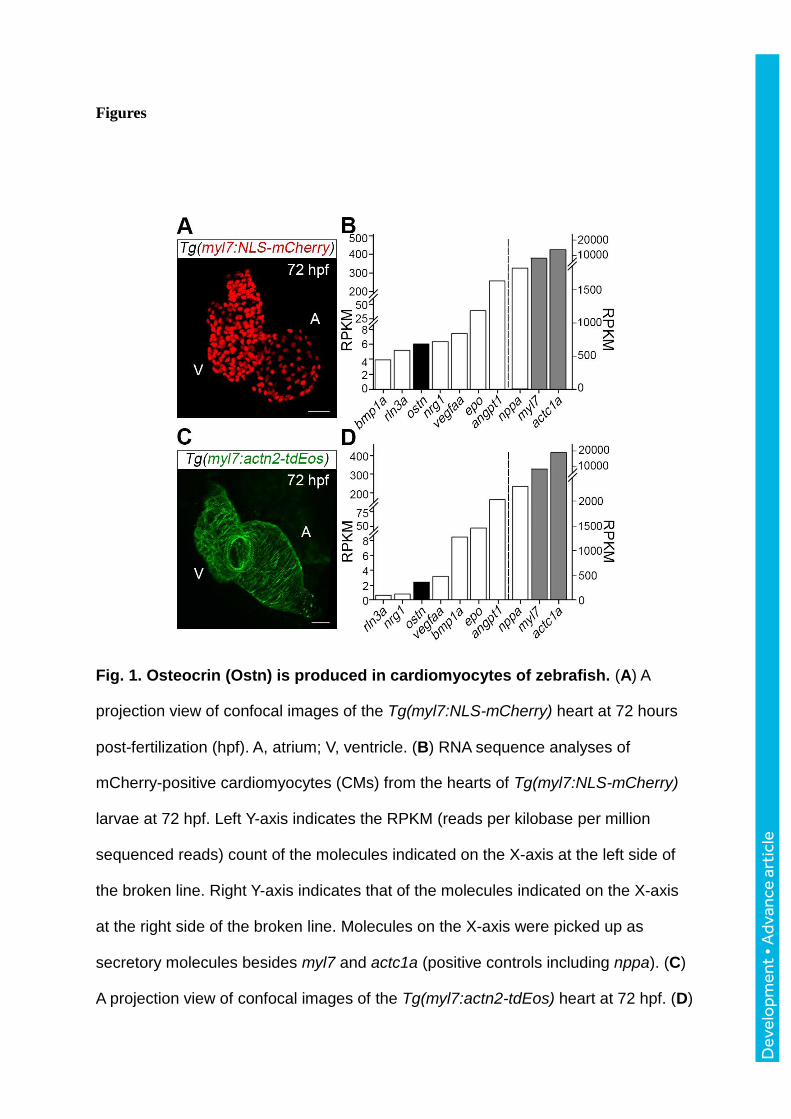
Fig. 1. Osteocrin (Ostn) is produced in cardiomyocytes of zebrafish. (A) A
projection view of confocal images of the Tg(myl7:NLS-mCherry) heart at 72 hours
post-fertilization (hpf). A, atrium; V, ventricle. (B) RNA sequence analyses of
mCherry-positive cardiomyocytes (CMs) from the hearts of Tg(myl7:NLS-mCherry)
larvae at 72 hpf. Left Y-axis indicates the RPKM (reads per kilobase per million
sequenced reads) count of the molecules indicated on the X-axis at the left side of
the broken line. Right Y-axis indicates that of the molecules indicated on the X-axis
at the right side of the broken line. Molecules on the X-axis were picked up as
secretory molecules besides myl7 and actc1a (positive controls including nppa). (C)
A projection view of confocal images of the Tg(myl7:actn2-tdEos) heart at 72 hpf. (D)
Dev
elo
pmen
t • A
dvan
ce a
rtic
le

RNA sequence analyses of tdEos-positive CMs of Tg(myl7:actn2-tdEos). X- and Y-
axes are the same as (B). gene names: bmp1a, bone morphogenetic protein 1a;
rln3a, relaxin 3a; ostn, osteocrin; nrg1, neuregulin1; vegfaa, vascular endothelial
growth factor Aa; epo, elythropoietin; angpt1, angiopoietin 1; nppa, natriuretic
peptide A; myl7, myosin, light chain 7, regulatory; actc1a, actin, alpha, cardiac
muscle 1a. Scale bars, 30 m.
Dev
elo
pmen
t • A
dvan
ce a
rtic
le
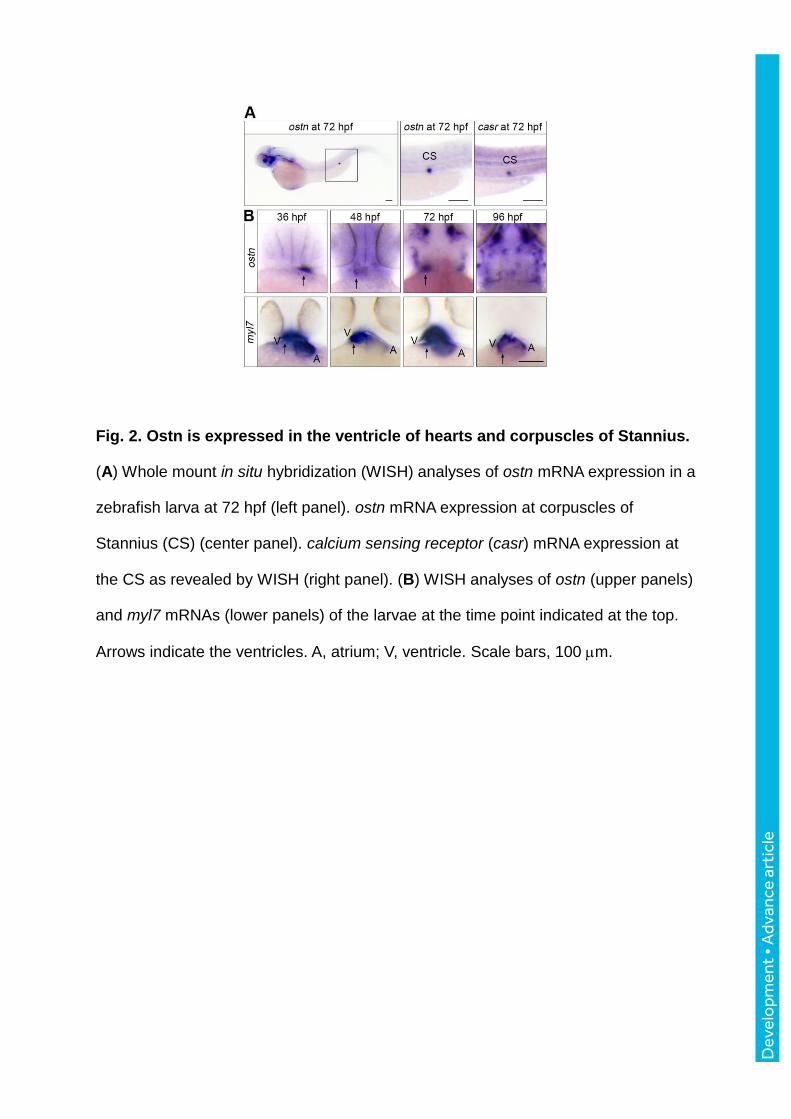
Fig. 2. Ostn is expressed in the ventricle of hearts and corpuscles of Stannius.
(A) Whole mount in situ hybridization (WISH) analyses of ostn mRNA expression in a
zebrafish larva at 72 hpf (left panel). ostn mRNA expression at corpuscles of
Stannius (CS) (center panel). calcium sensing receptor (casr) mRNA expression at
the CS as revealed by WISH (right panel). (B) WISH analyses of ostn (upper panels)
and myl7 mRNAs (lower panels) of the larvae at the time point indicated at the top.
Arrows indicate the ventricles. A, atrium; V, ventricle. Scale bars, 100 m.
Dev
elo
pmen
t • A
dvan
ce a
rtic
le
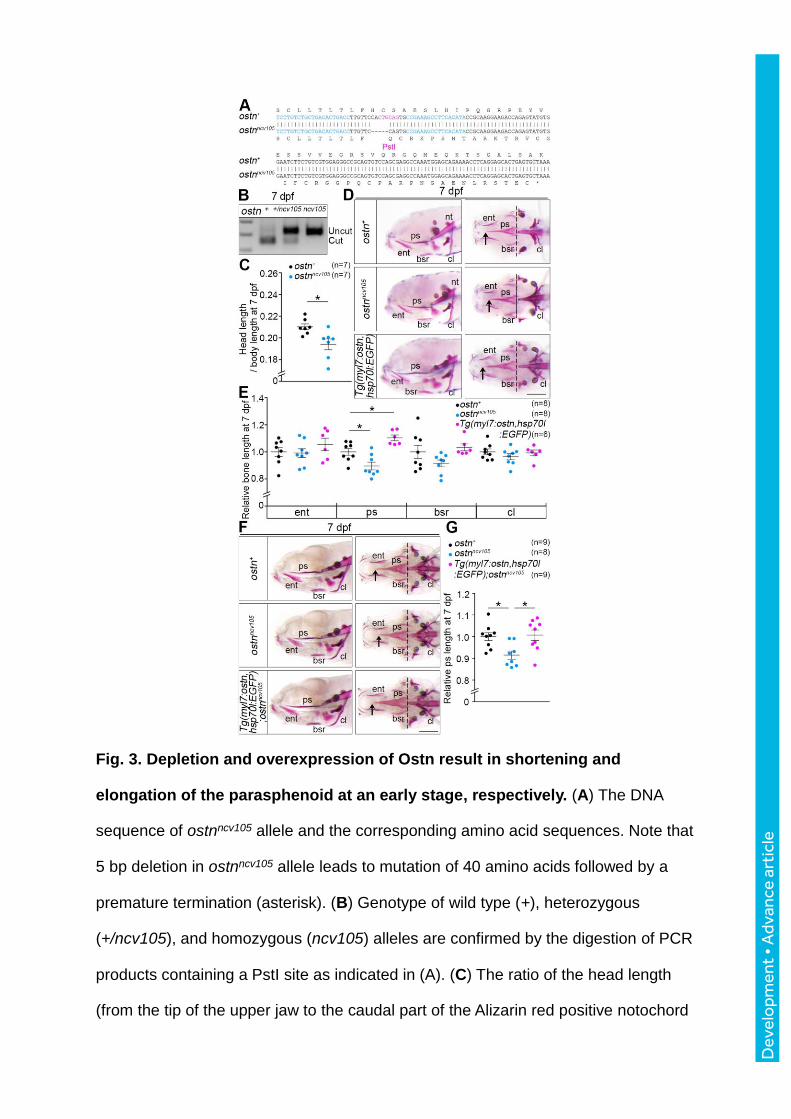
Fig. 3. Depletion and overexpression of Ostn result in shortening and
elongation of the parasphenoid at an early stage, respectively. (A) The DNA
sequence of ostnncv105 allele and the corresponding amino acid sequences. Note that
5 bp deletion in ostnncv105 allele leads to mutation of 40 amino acids followed by a
premature termination (asterisk). (B) Genotype of wild type (+), heterozygous
(+/ncv105), and homozygous (ncv105) alleles are confirmed by the digestion of PCR
products containing a PstI site as indicated in (A). (C) The ratio of the head length
(from the tip of the upper jaw to the caudal part of the Alizarin red positive notochord
Dev
elo
pmen
t • A
dvan
ce a
rtic
le
[nt]) to the body length (from the tip of the upper jaw to the end of the tail) of the 7
days post-fertilization (dpf) wild type (+) or homozygous mutant (ncv105) larvae.
Each plot indicates the data of an individual larva. In the following graphs, the
number (n) of larvae examined in the experiment is indicated in the graph unless
otherwise described. (D) Representative images of alizarin red staining of the 7 dpf
larvae of wild type (top), ostnncv105 homozygous mutant (middle), and
Tg(myl7:ostn,hsp70l:EGFP) (bottom). Lateral view (left panels) and ventral view
(right panels), anterior to the left. Arrows and broken lines indicate the tip and the top
of the concave in the caudal part of the parasphenoid (ps), respectively. (E)
Quantitative analyses of length of cranial bones of the larvae at 7 dpf: Each relative
bone length to the mean length of wild type bones is plotted. entopterygoid (ent),
parasphenoid (ps), branchiostegal ray (bsr), and cleithrum (cl). Relative length of
bones of ostnncv105 larvae and transgenic larvae to wild type control larvae are
plotted. The length of the ps was measured as that between arrow and broken line
as shown in (D). Average and standard error are presented within the plots of each
group. (F) Representative images of alizarin red staining of the 7 dpf larvae of wild
type (top), ostnncv105 homozygous mutant (middle), and
Tg(myl7:ostn,hsp70l:EGFP);ostnncv105. Lateral view (left panels) and ventral view
(right panels), anterior to the left. (G) Quantitative analyses of (F). The data were
analyzed by Student’s t-test or one-way ANOVA with Tukey’s test. Statistical
significance, *p < 0.05. Error bars indicate s.e.m. Scale bars, 200 m.
Dev
elo
pmen
t • A
dvan
ce a
rtic
le
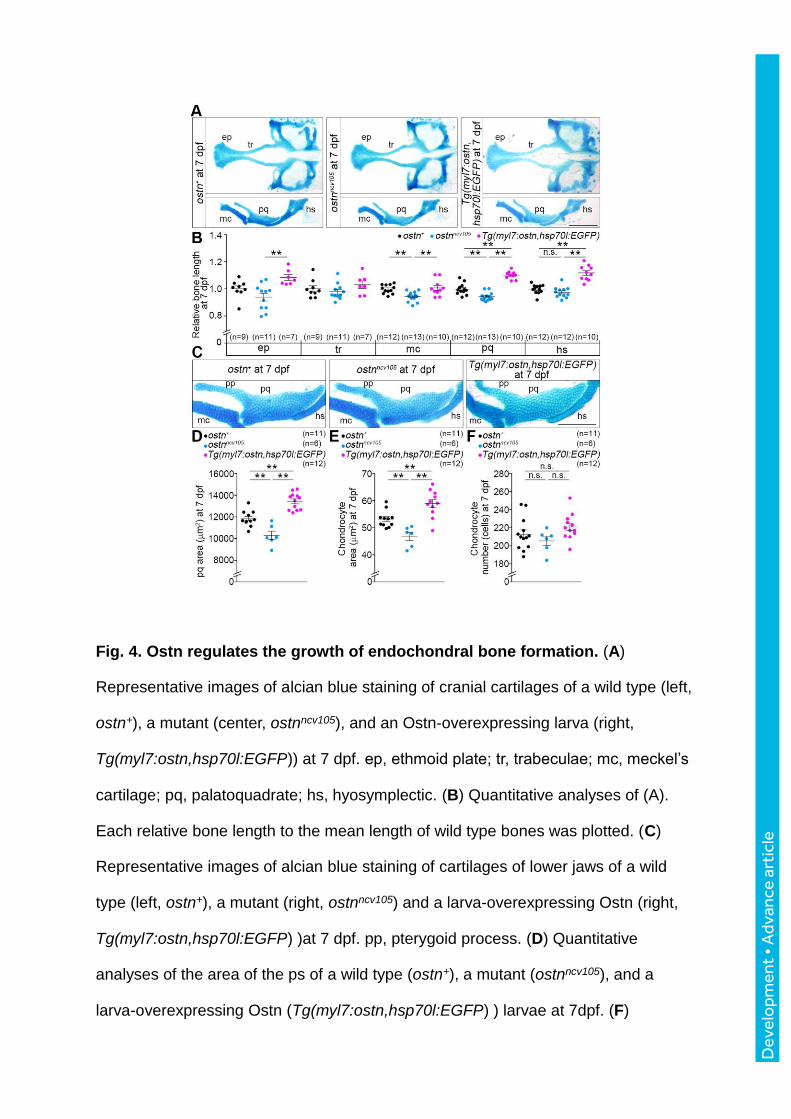
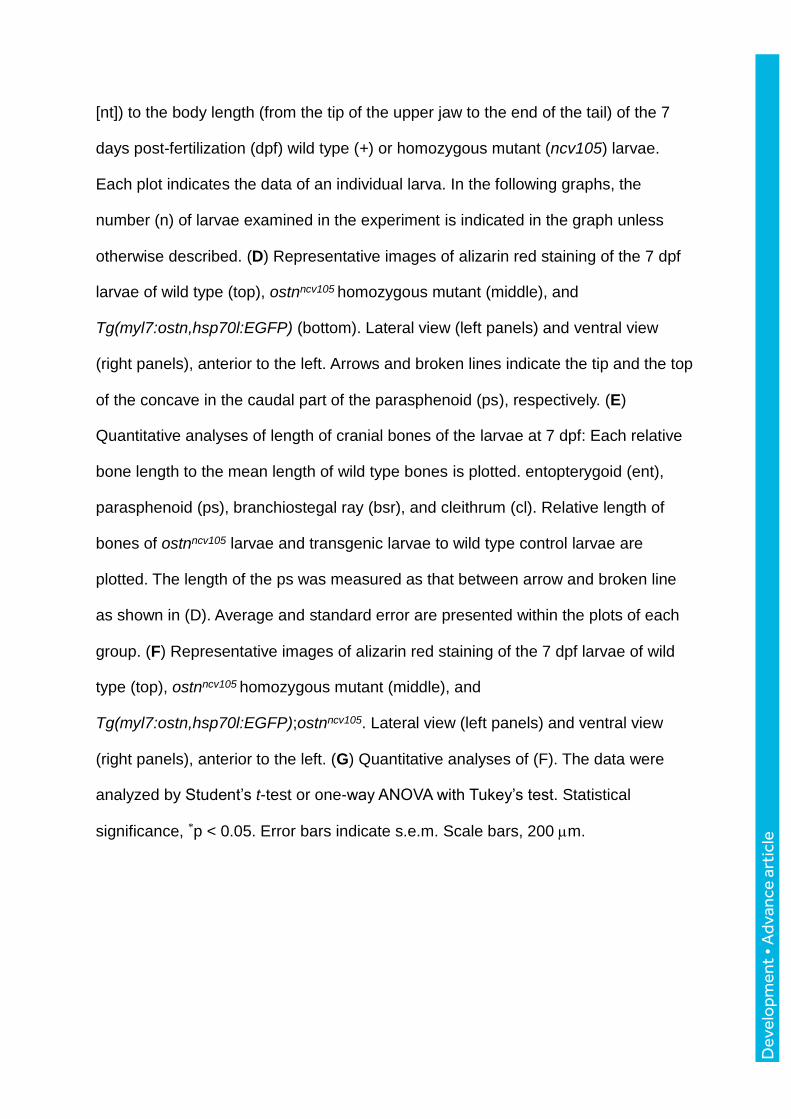
Fig. 4. Ostn regulates the growth of endochondral bone formation. (A)
Representative images of alcian blue staining of cranial cartilages of a wild type (left,
ostn+), a mutant (center, ostnncv105), and an Ostn-overexpressing larva (right,
Tg(myl7:ostn,hsp70l:EGFP)) at 7 dpf. ep, ethmoid plate; tr, trabeculae; mc, meckel’s
cartilage; pq, palatoquadrate; hs, hyosymplectic. (B) Quantitative analyses of (A).
Each relative bone length to the mean length of wild type bones was plotted. (C)
Representative images of alcian blue staining of cartilages of lower jaws of a wild
type (left, ostn+), a mutant (right, ostnncv105) and a larva-overexpressing Ostn (right,
Tg(myl7:ostn,hsp70l:EGFP) )at 7 dpf. pp, pterygoid process. (D) Quantitative
analyses of the area of the ps of a wild type (ostn+), a mutant (ostnncv105), and a
larva-overexpressing Ostn (Tg(myl7:ostn,hsp70l:EGFP) ) larvae at 7dpf. (F)
Dev
elo
pmen
t • A
dvan
ce a
rtic
le

Quantitative analyses of the area of each chondrocyte in the pq. (G) The number of
chondrocytes in the pq. Statistical significance, **p < 0.01. n.s., no significance
between two groups. Scale bars, 200 m (A) and 100 m (C).
Dev
elo
pmen
t • A
dvan
ce a
rtic
le
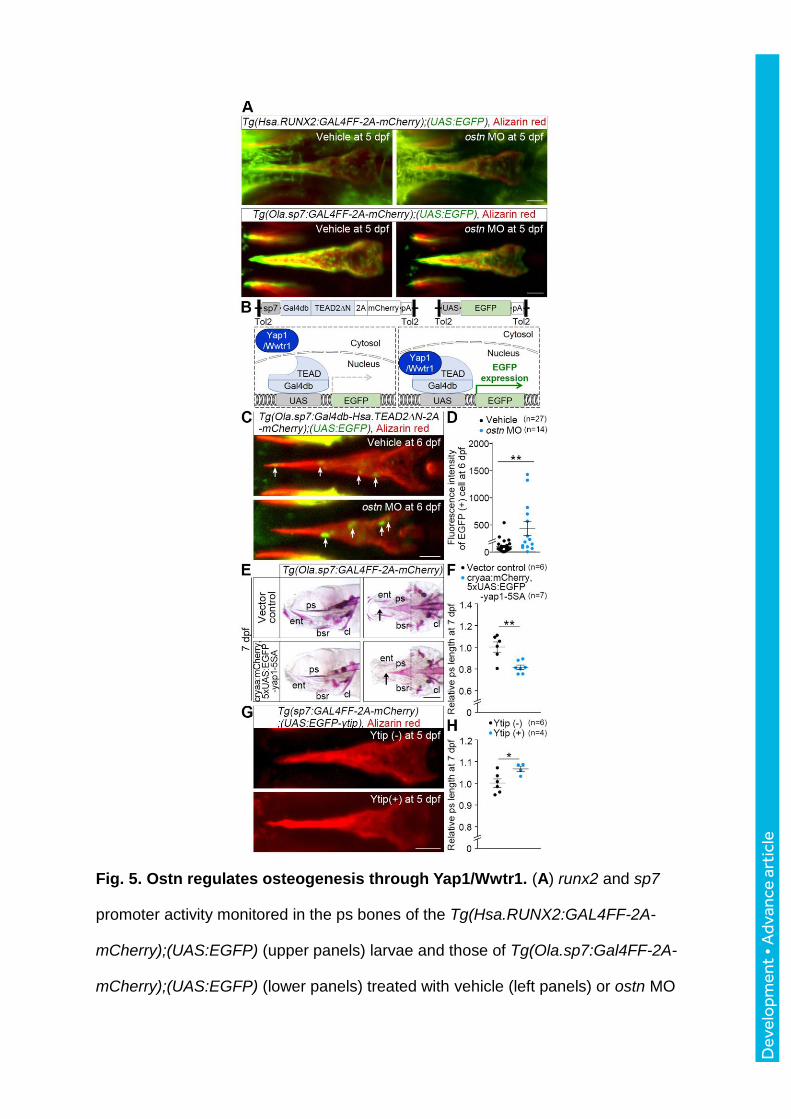
Fig. 5. Ostn regulates osteogenesis through Yap1/Wwtr1. (A) runx2 and sp7
promoter activity monitored in the ps bones of the Tg(Hsa.RUNX2:GAL4FF-2A-
mCherry);(UAS:EGFP) (upper panels) larvae and those of Tg(Ola.sp7:Gal4FF-2A-
mCherry);(UAS:EGFP) (lower panels) treated with vehicle (left panels) or ostn MO
Dev
elo
pmen
t • A
dvan
ce a
rtic
le
(right panels). Confocal images of promoter-activity (EGFP) monitoring fish larvae
stained with alizarin red at 5 dpf. (B) Schematic illustration of the Tg fish enabling us
to detect nuclear translocation of Yap1/Wwtr1 by EGFP expression in the tissues
where sp7 promoter is active. (C) Confocal images of the ps of the Tg fish larvae
injected with vehicle (upper panel) or ostn MO (lower panel) and stained with alizarin
red at 6 dpf. Arrows denote EGFP-positive cells corresponding to the cells in which
Yap1/Wwtr1 enter into the nucleus. (D) Quantitative analysis of (C). The intensity of
EGFP-positive area in the ps is plotted. The number of EGFP-positive area is
indicated on the top. (E) Representative images of alizarin red staining of the
Tg(Ola.sp7:Gal4FF-2A-mCherry) larvae (7 dpf) transiently transfected with the
plasmids as indicated on the left. Lateral view (left) and ventral view (right), anterior
to the left. Arrows and broken lines indicate the tip and the top of concave of caudal
part of ps, respectively. (F) Quantitative analyses of ps length of the larvae of (E).
The length of ps was measured similar to Fig. 3E. (G) Representative images of the
alizarin staining of the ps of Tg(Ola.sp7:GAL4FF-2A-mCherry);(UAS:EGFP-ytip) at
5dpf. (H) Quantitative analyses of (G). Each relative length to the mean length of the
ps was plotted. Statistical significance, *p < 0.05; **p < 0.01. Scale bars, 50 m (A, C,
and G) and 200 m (E).
D
evel
opm
ent •
Adv
ance
art
icle
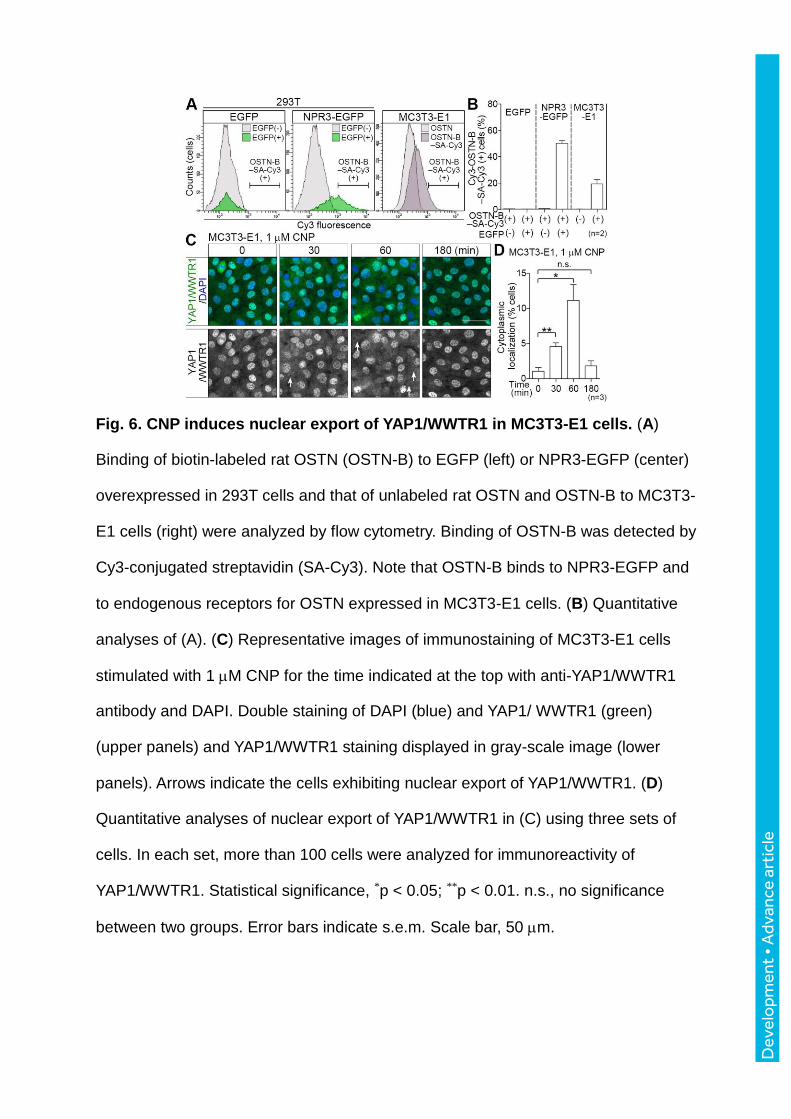
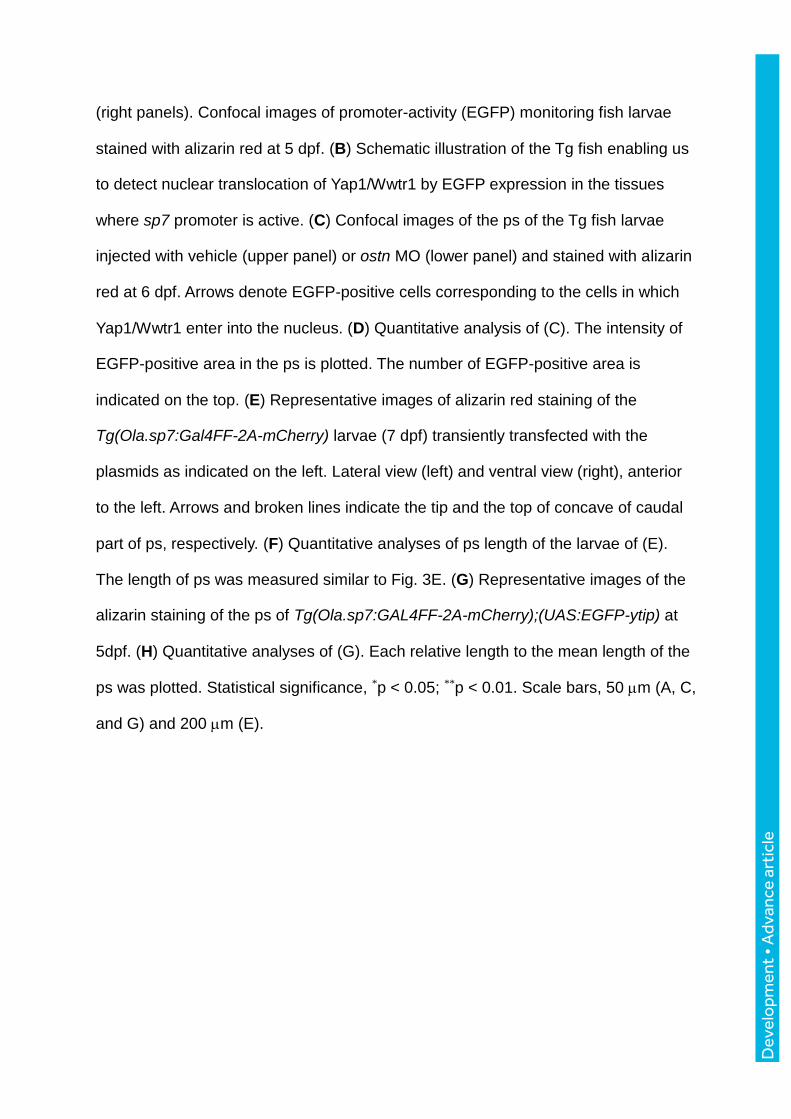
Fig. 6. CNP induces nuclear export of YAP1/WWTR1 in MC3T3-E1 cells. (A)
Binding of biotin-labeled rat OSTN (OSTN-B) to EGFP (left) or NPR3-EGFP (center)
overexpressed in 293T cells and that of unlabeled rat OSTN and OSTN-B to MC3T3-
E1 cells (right) were analyzed by flow cytometry. Binding of OSTN-B was detected by
Cy3-conjugated streptavidin (SA-Cy3). Note that OSTN-B binds to NPR3-EGFP and
to endogenous receptors for OSTN expressed in MC3T3-E1 cells. (B) Quantitative
analyses of (A). (C) Representative images of immunostaining of MC3T3-E1 cells
stimulated with 1 M CNP for the time indicated at the top with anti-YAP1/WWTR1
antibody and DAPI. Double staining of DAPI (blue) and YAP1/ WWTR1 (green)
(upper panels) and YAP1/WWTR1 staining displayed in gray-scale image (lower
panels). Arrows indicate the cells exhibiting nuclear export of YAP1/WWTR1. (D)
Quantitative analyses of nuclear export of YAP1/WWTR1 in (C) using three sets of
cells. In each set, more than 100 cells were analyzed for immunoreactivity of
YAP1/WWTR1. Statistical significance, *p < 0.05; **p < 0.01. n.s., no significance
between two groups. Error bars indicate s.e.m. Scale bar, 50 m.
Dev
elo
pmen
t • A
dvan
ce a
rtic
le
Fig. 7. OSTN enhances CNP-induced nuclear export of YAP1/WWTR1 in
MC3T3-E1 cells. (A) Representative images of immunostaining of MC3T3-E1 cells
stimulated for 60 min with CNP at the dose indicated on the top with anti-
YAP1/WWTR1 antibody and DAPI. (B) Quantitative analyses of nuclear export of
YAP1/WWTR1 in (A) using 4 sets of cells. In each set, more than 100 cells were
analyzed for immunoreactivity of YAP1/WWTR1. (C) Measurement of cGMP in
MC3T3-E1 cells stimulated with CNP at the dose indicated at the bottom for 15 min.
(D) Representative images of immunostaining of MC3T3-E1 cells pretreated with or
without a PKG inhibitor, KT5823 (1 M) stimulated for 60 min with CNP (1 M) and
Ostn (1 M) as indicated on the top with anti-YAP1/WWTR1 antibody. Arrows
indicate the cells exhibiting cytoplasmic localization of YAP1/WWTR1. (E) Nuclear
export of YAP1/WWTR1 in the cells under the condition described in (D) were
Dev
elo
pmen
t • A
dvan
ce a
rtic
le
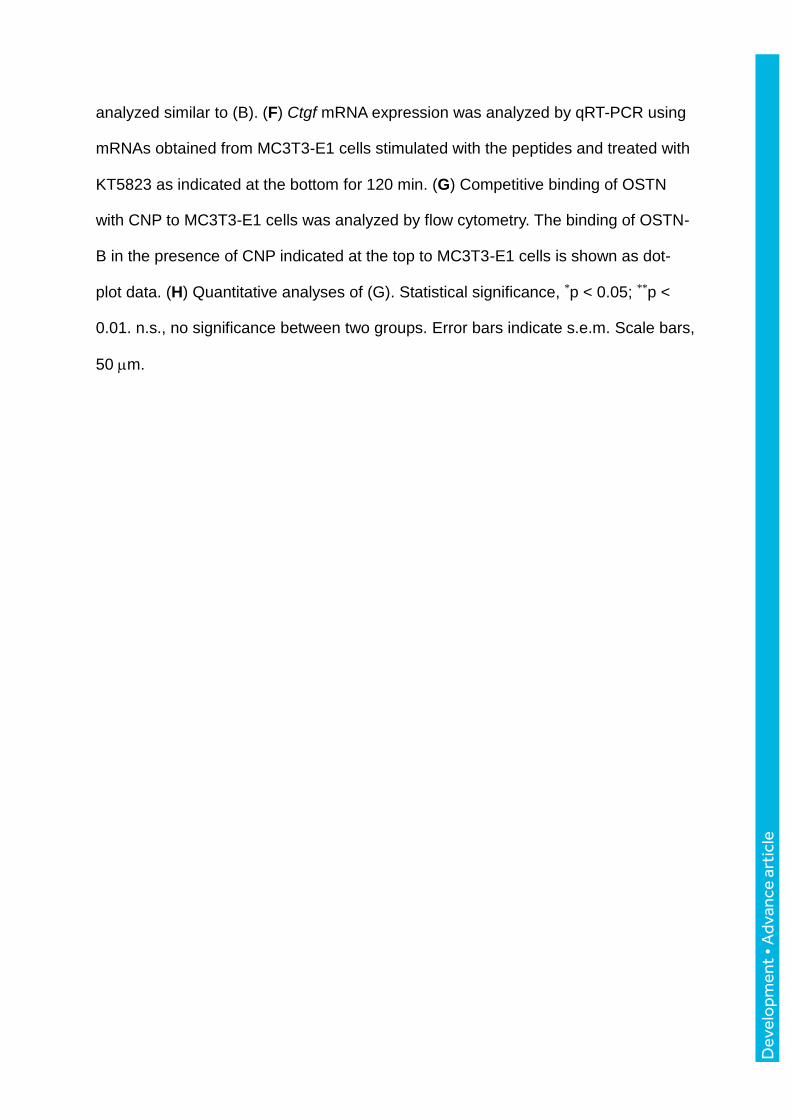
analyzed similar to (B). (F) Ctgf mRNA expression was analyzed by qRT-PCR using
mRNAs obtained from MC3T3-E1 cells stimulated with the peptides and treated with
KT5823 as indicated at the bottom for 120 min. (G) Competitive binding of OSTN
with CNP to MC3T3-E1 cells was analyzed by flow cytometry. The binding of OSTN-
B in the presence of CNP indicated at the top to MC3T3-E1 cells is shown as dot-
plot data. (H) Quantitative analyses of (G). Statistical significance, *p < 0.05; **p <
0.01. n.s., no significance between two groups. Error bars indicate s.e.m. Scale bars,
50 m.
Dev
elo
pmen
t • A
dvan
ce a
rtic
le
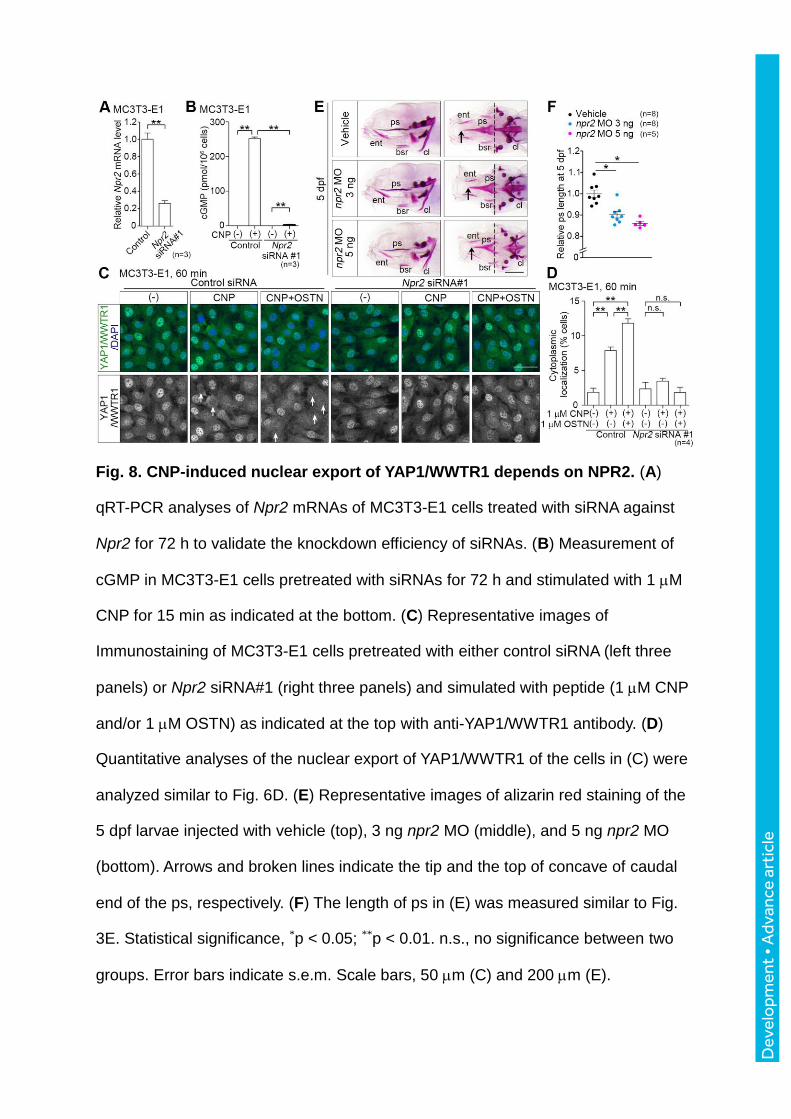
Fig. 8. CNP-induced nuclear export of YAP1/WWTR1 depends on NPR2. (A)
qRT-PCR analyses of Npr2 mRNAs of MC3T3-E1 cells treated with siRNA against
Npr2 for 72 h to validate the knockdown efficiency of siRNAs. (B) Measurement of
cGMP in MC3T3-E1 cells pretreated with siRNAs for 72 h and stimulated with 1 M
CNP for 15 min as indicated at the bottom. (C) Representative images of
Immunostaining of MC3T3-E1 cells pretreated with either control siRNA (left three
panels) or Npr2 siRNA#1 (right three panels) and simulated with peptide (1 M CNP
and/or 1 M OSTN) as indicated at the top with anti-YAP1/WWTR1 antibody. (D)
Quantitative analyses of the nuclear export of YAP1/WWTR1 of the cells in (C) were
analyzed similar to Fig. 6D. (E) Representative images of alizarin red staining of the
5 dpf larvae injected with vehicle (top), 3 ng npr2 MO (middle), and 5 ng npr2 MO
(bottom). Arrows and broken lines indicate the tip and the top of concave of caudal
end of the ps, respectively. (F) The length of ps in (E) was measured similar to Fig.
3E. Statistical significance, *p < 0.05; **p < 0.01. n.s., no significance between two
groups. Error bars indicate s.e.m. Scale bars, 50 m (C) and 200 m (E).
Dev
elo
pmen
t • A
dvan
ce a
rtic
le
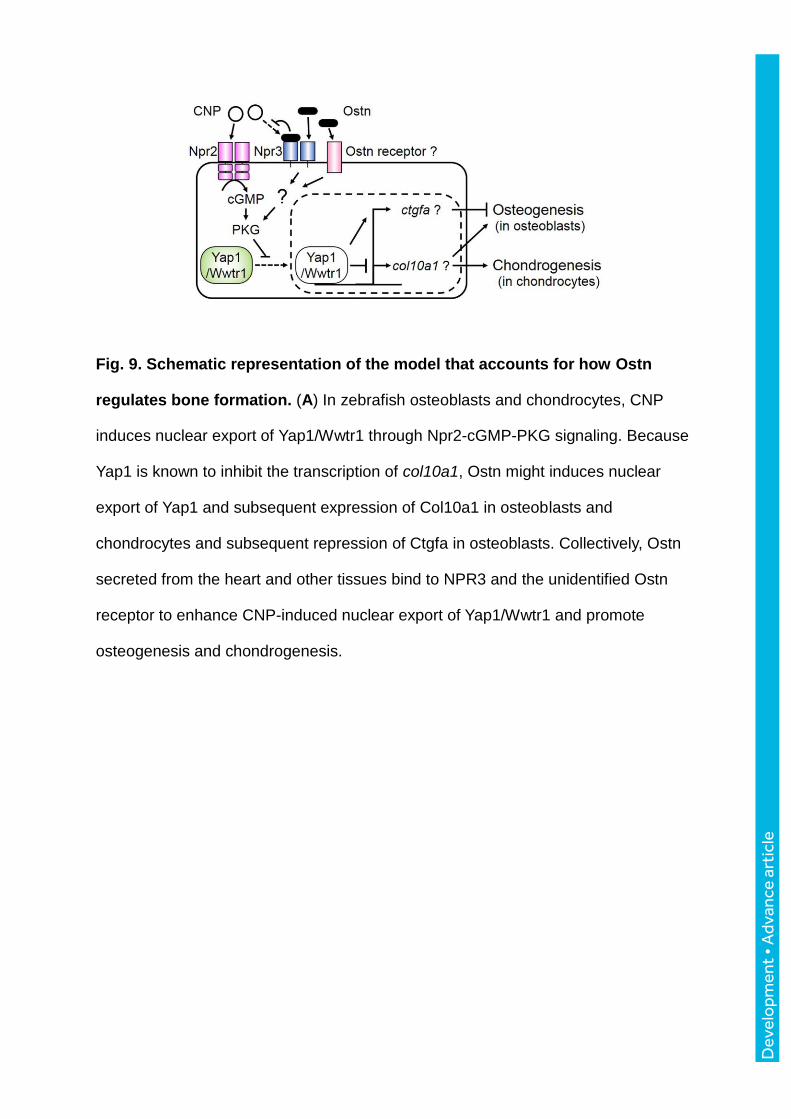
Fig. 9. Schematic representation of the model that accounts for how Ostn
regulates bone formation. (A) In zebrafish osteoblasts and chondrocytes, CNP
induces nuclear export of Yap1/Wwtr1 through Npr2-cGMP-PKG signaling. Because
Yap1 is known to inhibit the transcription of col10a1, Ostn might induces nuclear
export of Yap1 and subsequent expression of Col10a1 in osteoblasts and
chondrocytes and subsequent repression of Ctgfa in osteoblasts. Collectively, Ostn
secreted from the heart and other tissues bind to NPR3 and the unidentified Ostn
receptor to enhance CNP-induced nuclear export of Yap1/Wwtr1 and promote
osteogenesis and chondrogenesis.
Dev
elo
pmen
t • A
dvan
ce a
rtic
le
Supplementary Materials and Methods
Plasmids
A promoter/enhancer sequence (chr1: 28,292,241 – 28,293,179) of zebrafish (Danio
rerio) crystallin, alpha A (cryaa) gene (cryaa promoter), that (chr5:9,071,149-
9,075,275) of medaka (Oryzias latipes) Sp7 transcription factor (sp7) gene (Ola.sp7
promoter), and that (chr6:45,506,296-45,506,852) of human (Homo sapiens) runt
related transcription factor 2 (RUNX2) gene (Hsa.RUNX2 promoter) were obtained by
the PCR amplification of species-specific genomic DNA, respectively (Knopf et al.,
2011; Kurita et al., 2003; Spoorendonk et al., 2008). The medaka genomic DNA was
kindly provided by H. Nishina (Tokyo Medical and Dental University, Japan). A
promoter/enhancer sequence of myosin, light chain 7, regulatory (myl7) gene (myl7
promoter) was described previously (Fukui et al., 2014).
Either full length or partial cDNA fragments encoding zebrafish actinin, alpha 2
(actn2), osteocrin (ostn), calcium-sensing receptor (casr), myogenic differentiation 1
(myod1), sex determining region Y-box 9a (sox9a), runx2b, secreted phosphoprotein 1
(spp1), collagen, type X, alpha 1 (col10a1), natriuretic peptide receptor 2 (npr2),
natriuretic peptide receptor 3 (npr3), natriuretic peptide C, like (nppcl), mouse (Mus
musculus) Ostn (Mmu.Ostn), and human NPR3 (Hsa.NPR3) were amplified by PCR
using species-specific cDNA libraries as templates and cloned into pCR4 Blunt TOPO
vector (Thermo Fisher scientific). Primers used for cloning were listed in supplementary
data (Table S1). cDNA fragments of zebrafish connective tissue growth factor a (ctgfa),
yes-associated protein 1 (yap1)-5SA, Yap1–Tead interfering peptide (ytip), runx2a, sp7
and Hsa. TEA domain transcription factor 2 (TEAD2) were described previously (Fukui
et al., 2014; Kashiwada et al., 2015; Uemura et al., 2016). A cDNA fragment encoding a
Development 144: doi:10.1242/dev.143354: Supplementary information
Dev
elo
pmen
t • S
uppl
emen
tary
info
rmat
ion
yeast (Saccharomyces cerevisiae) GAL4-DNA-binding domain (Gal4db) fused to two
transcriptional activation domains from VP16 (GAL4FF) was derived from a
pCS2+Gal4FF vector.
To generate a pTol2-myl7 vector, a myl7 promoter was inserted into pTol2 vector,
which was kindly provided by K. Kawakami (National Institute of Genetics, Japan)
(Kawakami et al., 2004; Urasaki et al., 2006).
To construct a pTol2-myl7:actn2-tdEos plasmid, EGFP cDNA was removed from
pEGFP-N1 vector (Clontech) and replaced with tandem (td) Eos cDNA derived from
pcDNA3Flag-td-EosFP (Funakoshi) (ptdEos-N1 vector). A ptdEos-N1-actn2 plasmid
was constructed by inserting actn2 cDNA into the ptdEos-N1 vector. Finally, a cDNA
fragment encoding tdEos-tagged actn2 was subcloned into the pTol2-myl7 vector.
To construct a pTol2-myl7:ostn-HS4-hsp70l:EGFP plasmid, a chicken (Gallus
gallus) -globin insulator (HS4) derived from pJC13-1 vector, which was a gift from G.
Felsenfeld (National Institute of Health, USA) (Chung et al., 1993) and a multiple
cloning site (MCS) were sequentially subcloned into the pTol2-myl7: nuclear
localization signal (NLS) tagged–monomeric (m) Cherry vector (Fukui et al., 2014)
(pTol2-myl7:NLS-mCherry-HS4-MCS). A zebrafish heat shock protein (hsp70l)
promoter followed by EGFP (hsp70l:EGFP) derived from pHSP70/4 EGFP plasmid
(provided by J. Kuwada, University of Michigan, USA) (Halloran et al., 2000) were
inserted into the pTol2-myl7:NLS-mCherry-HS4-MCS to generate pTol2-myl7:NLS-
mCherry-HS4- hsp70l:EGFP. Finally, a NLS-mCherry cDNA fragment was removed
and replaced with an ostn cDNA fragment.
To construct a pTol2-Ola.sp7:EGFP plasmid, a DNA fragment encoding EGFP and
an Ola.sp7 promoter were sequentially inserted in to the pTol2 vector.
Development 144: doi:10.1242/dev.143354: Supplementary information
Dev
elo
pmen
t • S
uppl
emen
tary
info
rmat
ion
To construct a pTol2-Ola.sp7:GAL4FF-2A-mCherry plasmid, a cDNA fragment
encoding GAL4FF followed by 2A peptide and mCherry (GAL4FF-2A-mCherry) and
an Ola.sp7 promoter were sequentially inserted into the pTol2 vector. To construct a
pTol2-Hsa.RUNX2:GAL4FF-2A-mCherry plasmid, a cDNA fragment encoding
GAL4FF-2A-mCherry and a Hsa.RUNX2 promoter followed by a TATA box region of
an adenovirus E1b minimal promoter derived from pFR-Luc (Stratagene) were
sequentially inserted into the pTol2 vector. To construct a pTol2-Ola.sp7:Gal4db-
Hsa.TEADN-2A-mCherry plasmid, a cDNA fragment encoding Gal4db was fused to
Hsa.TEAD2 cDNA lacking amino-terminus (1-113 a.a.) followed by 2A peptide and
mCherry (Gal4db-Hsa.TEADN-2A-mCherry). Gal4db-Hsa.TEADN-2A-mCherry
and Ola.sp7 promoter were sequentially inserted into the pTol2 vector.
To construct a pTol2-myl7:NLS-EGFP-HS4-UAS:EGFP-ytip, a DNA fragment
encoding NLS-mCherry was removed from pTol2-myl7:NLS-mCherry-HS4-MCS
vector and replaced with a cDNA fragment encoding NLS-EGFP. An upstream
activating sequence (UAS) along with an E1b minimal promoter derived from
pBluescript II-UAS:GFP vector was inserted to construct a pTol2-myl7:NLS-EGFP-
HS4-UAS-MCS vector. Finally, a cDNA fragment encoding ytip was inserted into the
pTol2-myl7:NLS-EGFP-HS4-UAS-MCS vector.
To construct a pTol2-cryaa:NLS-mCherry-HS4-UAS:EGFP-yap1-5SA plasmid, a
myl7 promoter of a pTol2-myl7:NLS-mCherry-HS4-MCS vector was replaced by a
cryaa promoter. A 5xUAS promoter derived from pTol2-5xUAS vector, a gift from K.
Kawakami (National Institute of Genetics, Japan) (Asakawa et al., 2008; Distel et al.,
2009), was subcloned to generate a pTol2-cryaa:NLS-mCherry-HS4-5xUAS-MCS
vector. Finally, a cDNA fragment encoding yap1-5SA was inserted into the pTol2-
Development 144: doi:10.1242/dev.143354: Supplementary information
Dev
elo
pmen
t • S
uppl
emen
tary
info
rmat
ion
cryaa:NLS-mCherry-HS4-5xUAS-MCS vector. To construct a pEGFP-N1-Hsa.NPR3
plasmid, a Hsa.NPR3 cDNA was inserted into the pEGFP-N1 vector. To construct a
pCS3-npr2-EGFP plasmid, an npr2 cDNA was inserted into the pEGFP-N1 vector. A
cDNA fragment of npr2-EGFP was inserted into the pCS3 vector.
Transgenic (Tg) fish lines and knockout fish by a transcription activator-
like effector nuclease (TALEN) method
The transgenic fish lines; Tg(myl7:actn2-tdEos), Tg(myl7:ostn,hsp70l:EGFP),
Tg(Hsa.RUNX2:GAL4FF-2A-mCherry), Tg(Ola.sp7:EGFP),Tg(Ola.sp7:GAL4FF-2A-
mCherry), Tg(Ola.sp7:Gal4db-Hsa.TEAD2N-2A-mCherry), and Tg(myl7:NLS-EGFP,
UAS:EGFP-ytip) fish lines were established by injecting Tol2-based plasmids (30 pg)
with transposase mRNAs (25 pg) into the one-cell stage of wild type strain AB
zebrafish embryos (Kawakami et al., 2004; Urasaki et al., 2006). Embryos were selected
at 2-5 days post-fertilization (dpf) and grown to adults, among which germline founders
were identified by promoter specific fluorescence expression. Tg(myl7:NLS-mCherry)
fish line was reported previously (Fukui et al., 2014).
TALEN sequence against the second exon of ostn was designed using TAL Effector
Nucleotide Targeter (Doyle et al., 2012). The ostn TALEN was generated using Golden
Gate TALEN and TAL Effector Kit 2.0 (Addgene) (Cermak et al., 2011). The ostn
TALEN recognition sequences are: 5’-TCTTGTCTGCTGACACTGACC-3’ and 5’-
CCGAAAGCCTTCACATA-3’. The sequence between the two binding sites contains a
16-bp spacer with a PstI site (TTGTTCCACTGCAGTG, PstI site underlined). TALEN
mRNAs were in vitro transcribed from SacI-linearized expression plasmids with T3
RNA polymerase using a mMESSAGE mRNA kit (Ambion). A total of 200 pg TALEN
mRNAs was microinjected into one-cell stage embryos. Mutant alleles were identified
Development 144: doi:10.1242/dev.143354: Supplementary information
Dev
elo
pmen
t • S
uppl
emen
tary
info
rmat
ion
by PstI digestion of a PCR product generated with the primers listed in the supplemental
information (Table S1).
Chemicals, peptides, and antibodies
KT5823 was purchased from Calbiochem; synthetic human C-type natriuretic peptide
(CNP) -22 from Peptide Institute; anti-YAP1/WWTR1 antibody (63.7) from Santa
Cruz, Alexa Fluor 488-labeled secondary antibody and 4’, 6-diamidino-2-phenylindole,
dihydrochloride (DAPI) from Thermo Fisher Scientific; Streptavidin Cy3 conjugate,
insulin, and 3-isobutyl-1-methylxathine (IBMX) were from Sigma-Aldrich. Mouse
osteocrin (OSTN) (80-130 a.a.), rat (Rattus norvegicus) OSTN (82-132 a.a.), and biotin-
labeled rat OSTN (82-132 a.a.) were synthetized by Sigma-Aldrich.
Microinjection of oligonucleotide and mRNA
For morpholino oligonucleotide (MO)-mediated gene knock down, embryos were
injected at the one-cell stage with 4-10 ng of Control MO (Gene Tools), 8-15 ng of ostn
splicing block MO (5’-CATTTCTTTATTTCACTACCTCTGC-3’), 3-5 ng of npr2
splicing block MO (5’-AACCAAGAACACTCAACTCACCCCA-3’), and 4 ng of
translation block ctgfa MO (5’-GAGTCATTCCAGAAAACATGATGAC -3’). The
sequence of ctgfa MO has already been validated (Fukui et al., 2014).
Capped mRNAs were in vitro transcribed with SP6 RNA polymerase using a
mMESSAGE mMACHINE kit (Ambion). For protein overexpression, one-cell stage
embryos were injected with 100 pg of EGFP mRNA or 100 pg of ctgfa mRNA. For
rescue experiment, one-cell stage embryos were coinjected with 4 ng of npr2 MO and
160 pg of npr2-EGFP mRNA.
Development 144: doi:10.1242/dev.143354: Supplementary information
Dev
elo
pmen
t • S
uppl
emen
tary
info
rmat
ion
For EGFP-Yap1-5SA expression, one-cell stage of Tg(Ola.sp7:GAL4FF-2A-
mCherry) embryos were injected with 30 pg of pTol2-cryaa-NLS-mcherry-HS4-
5xUAS-EGFP-yap1-5SA plasmid. As a negative control, embryos were injected with 30
pg of pTol2-cryaa-NLS-mCherry-HS4-5xUAS-MCS plasmid and mCherry-positive
embryos were selected for the experiment.
Fluorescence-activated cell sorting (FACS)
Hearts resected from the Tg(myl7:NLS-mCherry) or Tg(myl7:actn2-tdEos) larvae at 72
hours post-fertilization (hpf) were collected into a 1.5 ml tube, washed in phosphate
buffered saline (PBS), and incubated with 1 ml of protease solution (PBS with 5 mg/ml
trypsin and 1 mM EDTA, pH 8.0) for 1 h under occasional pipetting. Digestion of the
hearts were terminated with 200 l of stop solution (PBS with 30% fetal bovine serum
[FBS] and 6 mM calcium chloride). The dissociated cells in suspension medium (phenol
red free Dulbecco’s modified Eagle’s medium [DMEM, Life Technologies] with 1%
FBS, 0.8 mM calcium chloride, 50 U/ml penicillin, and 0.05 mg/ml streptomycin) were
subjected to cell sorting using a FACS Aria III cell sorter (BD Bioscience). mCherry- or
tdEos-positive cells were collected as cardiomyocytes for further RNA preparation.
RNA preparation, RNA sequence (RNA-seq), and quantitative (q) RT-PCR
For RNA-seq, total RNAs were prepared from mCherry- or tdEos-positive cells using a
NucleoSpin XS kit (Macherey-Nagel) according to the manufacture’s instruction.
Reverse transcription (RT) and cDNA library preparation were performed with a
SMARTer Ultra Low RNA kit (Clontech). cDNA was fragmented with a Covaris S 220
instrument (Covaris). Subsequently, the sample was end-repaired, dA-tailed, adaptor
ligated, and then subjected to PCR by using a NEBNext DNA Library Preparation and
Development 144: doi:10.1242/dev.143354: Supplementary information
Dev
elo
pmen
t • S
uppl
emen
tary
info
rmat
ion
NEBNext Multiplex oligos for Illumina (New England BioLabs). The sample was
sequenced by using a MiSeq (Illumina) to generate pair-end 150-bp reads. Raw reads
were mapped to zebrafish genome (DanRer7). Expression levels were measured by
calculating reads per kilobase per million sequenced reads (RPKM) and normalized
trimmed mean of M-values (TMM) method using an Avadis NGS software (Strand Life
Sciences).
For RT-PCR, total RNAs were prepared from zebrafish larvae, mouse organs, or
MC3T3-E1 cells using TRIzol reagent (Thrmo Fisher Scientific). RNAs were reverse-
transcribed by random hexamer primers using SuperScript III (Thrmo Fisher Scientific)
according to the manufacturer’s instructions. PCR reactions was performed with
TaKaRa Ex Taq Hot Start Version (TaKaRa) in a 2720 Thermal Cycler (Thrmo Fisher
Scientific). For qRT-PCR, PCR reactions were performed with KOD SYBR qPCR Mix
(TOYOBO) in a Mastercycler Realplex (Eppendorf). The primers used for RT-PCR and
qRT-PCR were listed in supplementary data (Table S1).
Whole mount in situ hybridization (WISH)
Antisense ostn, casr, myl7, myod1, sp7, sox9a, runx2a, runx2b, spp1, col10a1, npr2,
npr3, nppcl, and ctgfa RNA probes labeled with digoxigenin (DIG) were in vitro
transcribed using an RNA labeling kit (Roche). WISH was performed according to the
standard protocol as described previously (Fukui et al., 2014). Briefly, embryos and
larvae were fixed in 4% paraformaldehyde (PFA) in PBS, dehydrated in methanol
(MeOH), and gradually rehydrated into PBS containing 0.1% Tween 20 (PBS-T). For
parasphenoid (ps) observation, larvae were resected the lower jaws. After digestion by
PBS-T containing proteinase K (Roche) for 15-50 min, embryos and larvae were fixed
Development 144: doi:10.1242/dev.143354: Supplementary information
Dev
elo
pmen
t • S
uppl
emen
tary
info
rmat
ion
in 4% PFA and hybridized with antisense RNA probes at 65°C (ostn, casr, myl7, and
myod1 probes) or 70°C (the others) overnight in hybridization buffer (5 x SSC, 50%
formamide, 5 mM EDTA, 0.1% tween20, 50 g/ml heparin, and 1 mg/ml torula RNA).
After hybridization, embryos and larvae were incubated with anti-DIG antibody
conjugated with alkaline phosphatase (Roche) in blocking buffer at 4°C overnight. The
colorimetric reaction was carried out using BM purple (Roche). Images of the embryos
were recorded with a SZX16 Stereo microscope (Olympus).
Plastic section for ISH
Larvae hybridized with antisense ostn, myod1, sp7, and sox9a probe were dehydrate
with acetone, embedded in Technovit 8100 (Heraeus Kulzer), and cut into 10 m thick
sections with a microtome (RM2125RT, Leica). Images of the sections were recorded
with a BX51 microscope (Olympus).
Bone staining
Larvae at 5-10 dpf were fixed in PBS containing 4% PFA at 4°C overnight and stored in
100% MeOH at -20°C. For alizarin red staining, larvae were gradually rehydrated into
water, bleached in 1.5% hydrogen peroxide in 1% potassium hydroxide (KOH) for 30
min, and washed in water. The bones were stained with 0.04 mg/ml Alizarin Red S in
1% KOH, destained with 20% glycerol in 1% KOH for 1 h, and stored in 50% glycerol
in 0.25% KOH. For alcian blue staining, larvae were stained with 0.02% Alcian Blue
8GX in 70% ethanol (EtOH) containing 80 mM magnesium chloride (MgCl2) at room
temperature (RT) overnight, rehydrated into water, bleached in 1.5% hydrogen peroxide
in 1% KOH for 30 min, and stored in 50% glycerol in 0.25% KOH. Cartilages were
Development 144: doi:10.1242/dev.143354: Supplementary information
Dev
elo
pmen
t • S
uppl
emen
tary
info
rmat
ion
dissected out, mounted in glycerol on slide glasses, and covered with cover slips. Bone
images were recorded with a SZX16 Stereo microscope (Olympus) and the bone length
was measured by a DP2-BSW software (Olympus). To detect the chondrocyte area,
each chondrocyte was demarcated by drawing lines in the middle of cell border and
measured the area inside of the lines.
To visualize live mineralized bone, larvae were incubated in 0.003% Alizarin red in
0.03% sea salt for 1 h. Confocal images were taken with a FV1000 confocal microscope
system (Olympus) and the bone length was measured by Imaris software (Bitplane).
Measurement of head length
Embryos and larvae at 2-6 dpf were fixed in PBS containing 4% PFA at 4°C overnight,
washed in PBS, and mounted in glycerol. Images were recorded with a SZX16 Stereo
microscope (Olympus). The head length was measured by a DP2-BSW software
(Olympus).
5-Ethynyl-2-deoxyuridine (EdU) assay
Larvae at 5 dpf were incubated in 200 M EdU (Tokyo Chemical Industry). After 24 h
incubation, larvae were fixed in 4% PFA at 4°C overnight and dehydrated with MeOH.
Larvae were rehydrated into PBS-T, resected their brain by forceps, permeabilized by
0.5% triton X-100, blocked with 3% bovine serum albumin (BSA) at RT for 30 min,
and stained with Click-iT EdU Alexa Fluor 647 Imaging Kit (Thermo Fisher Scientific)
for 30 min. The quantification of EdU-positive cells were performed by using the
images of the stained sections observed by a FV1000 confocal microscope (Olympus)
and analyzed by IMARIS7.7.1 software (Bitplane).
Development 144: doi:10.1242/dev.143354: Supplementary information
Dev
elo
pmen
t • S
uppl
emen
tary
info
rmat
ion
TdT-mediated dUTP nick end labeling (TUNEL) assay
Larvae at 6 dpf were fixed in 4% PFA at 4°C overnight and dehydrated with MeOH.
Larvae were rehydrated into PBS-T, resected the brain by forceps, digested by PBS-T
containing proteinase K for 50 min at RT, and fixed in 4% PFA for 20 min at RT. After
three times washing with PBS-T, larva were incubated with In Situ Cell Death Detection
Kit, TMR red (Roche) for 60 min at 37°C. The quantification of TUNEL-positive cells
were performed by using the images of the stained sections observed by a FV1000
confocal microscope (Olympus) and analyzed by IMARIS7.7.1 software (Bitplane).
Cell Culture, transfection, and siRNA-mediated knockdown
Murine MC3T3-E1 osteoblast-like cells were obtained from Riken BRC and cultured in
minimum essential medium (MEM, Thrmo Fisher Scientific) with 10% FBS and
antibiotics (100 mg/ml streptomycin and 100 U/ml penicillin). Human embryonic
kidney 293T cells and Murine NIH3T3 fibroblast cells were cultured in DMEM
(Nacalai Tesque) with 10% FBS and antibiotics. Murine ATDC5 chondrocyte cells were
obtained from Riken BRC and cultured in a 1:1 mixture of DMEM and Ham's F-12
Nutrient Mixture (Nacalai Tesque) (DMEM/F12) with 5% FBS. 293T cells transfected
with plasmids using polyethylenimine (PEI) max (Polyscience) were subjected to
binding assay. MC3T3-E1 cells transfected with siRNAs from Thrmo Fisher Scientific
(listed in supplementary Table S2) using Lipofectamine RNAi MAX reagents (Thrmo
Fisher Scientific) were subjected to immunocytochemical analyses.
Development 144: doi:10.1242/dev.143354: Supplementary information
Dev
elo
pmen
t • S
uppl
emen
tary
info
rmat
ion
Streptavidin conjugated Cy3 was diluted ten times and incubated with biotin, rat OSTN,
or biotin-labeled rat OSTN on ice for 15 min to form OSTN-B–SA-Cy3. 293T cells
transfected with pEGFP-N1-NPR3 or pEGFP-C1 empty vector (Clontech) and MC3T3-
E1 cells were cultured for more than 24 h. 293T cells detached by pipetting using PBS
and MC3T3-E1 cells treated by trypsin were resuspended with DMEM containing 10%
FBS at 2x10⁶ cells/ml. After the incubation of cells with either CNP or unlabeled rat
OSTN for 5 min, 0.1 M OSTN-B–SA-Cy3 was added into the mixture and incubated
for 30 min. The cells were washed with 15 ml PBS and resuspended in PBS containing
1% BSA, 0.2 mg/ml sodium azide, and SYTOX Blue Dead Cell Stain (Thrmo Fisher
Scientific). Cy3 and EGFP fluorescence intensities were measured by FACS Aria III cell
sorter (BD Bioscience). The data was analyzed using FACSDiva software (BD
Bioscience).
Immunocytochemical analyses
MC3T3-E1 cells or ATDC5 cells were plated in 35-mm glass-base dishes (Asahi Techno
Glass) coated with 1% gelatin. To examine the localization of YAP1/WWTR1, the cells
were stimulated with human CNP for the time indicated in the figures in the presence or
absence of mouse OSTN with or without a protein kinase G (PKG) inhibitor. After
stimulation, the cells were fixed in PBS containing 4% PFA at RT for 15 min,
permeabilized with 0.2% Triton X-100 at RT for 10 min, and blocked with PBS
containing 3% BSA at RT for 1 h. The cells were immunostained with anti-
YAP/WWTR1 antibody at RT for 2 h and visualized using Alexa Fluor 488-labeled
secondary antibody. DAPI was used to counterstain nuclei. Fluorescence images of
Alexa 488 and DAPI were recorded with a confocal microscope (FV1000, Olympus)
OSTN binding assay
Development 144: doi:10.1242/dev.143354: Supplementary information
Dev
elo
pmen
t • S
uppl
emen
tary
info
rmat
ion
with 40x water objective lens (LUMPlanFL, FN 26.5, Olympus).
Measurements of intracellular cGMP
MC3T3-E1 cells, grown in 24 well plates, were incubated with incubation medium
(DMEM containing 0.1% BSA and 500 M IBMX) at 37°C for 30 min. The cells were
subsequently stimulated with incubation medium containing 0.1-100 M human CNP at
37°C for 15 min, replaced with ice cold 70% EtOH, and stored at -80°C. Cell lysates
were transferred to test tubes, concentrated using a speedvac concentrator (Thermo
scientific), and resuspended in 25 l of double distilled water. The amount of cGMP in
each cell lysate was measured using a cyclic GMP radioimmunoassay kit (Yamasa)
according to the manufacturer's protocol.
Light sheet imaging
To record fluorescence in the beating heart, we used a lightsheet microscope (Lightsheet
Z.1, Carl Zeiss). Larvae were anesthetized in 0.016% tricaine in 0.03% sea salt and
transferred into 50 l glass capillaries with 1% low-melting agarose dissolved in 0.03%
sea salt. Images were processed with a ZEN2012 software (Carl Zeiss).
Bright field movie
To record bright field movies of larvae heart beating of, we used a SZX16 Stereo
microscope (Olympus). Images were processed with a DP2-BSW software (Olympus).
Development 144: doi:10.1242/dev.143354: Supplementary information
Dev
elo
pmen
t • S
uppl
emen
tary
info
rmat
ion
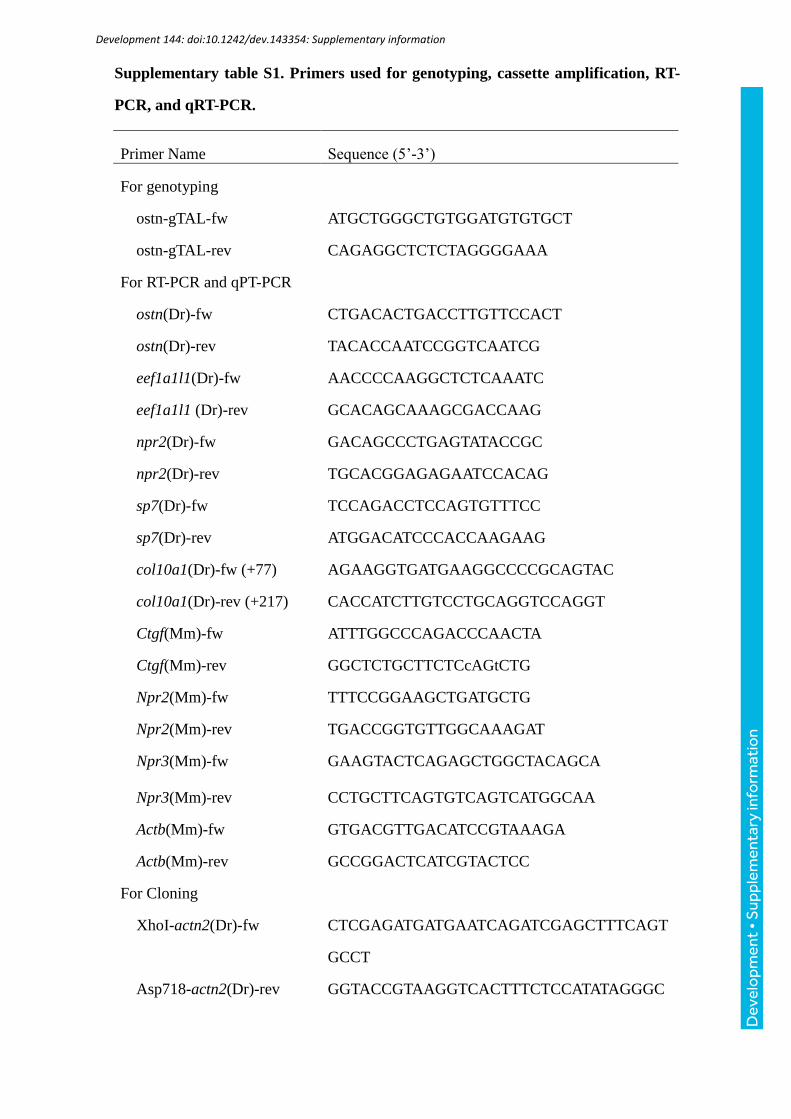
Primer Name Sequence (5’-3’)
For genotyping
ostn-gTAL-fw ATGCTGGGCTGTGGATGTGTGCT
ostn-gTAL-rev CAGAGGCTCTCTAGGGGAAA
For RT-PCR and qPT-PCR
ostn(Dr)-fw CTGACACTGACCTTGTTCCACT
ostn(Dr)-rev TACACCAATCCGGTCAATCG
eef1a1l1(Dr)-fw AACCCCAAGGCTCTCAAATC
eef1a1l1 (Dr)-rev GCACAGCAAAGCGACCAAG
npr2(Dr)-fw GACAGCCCTGAGTATACCGC
npr2(Dr)-rev TGCACGGAGAGAATCCACAG
sp7(Dr)-fw TCCAGACCTCCAGTGTTTCC
sp7(Dr)-rev ATGGACATCCCACCAAGAAG
col10a1(Dr)-fw (+77) AGAAGGTGATGAAGGCCCCGCAGTAC
col10a1(Dr)-rev (+217) CACCATCTTGTCCTGCAGGTCCAGGT
Ctgf(Mm)-fw ATTTGGCCCAGACCCAACTA
Ctgf(Mm)-rev GGCTCTGCTTCTCcAGtCTG
Npr2(Mm)-fw TTTCCGGAAGCTGATGCTG
Npr2(Mm)-rev TGACCGGTGTTGGCAAAGAT
Npr3(Mm)-fw GAAGTACTCAGAGCTGGCTACAGCA
Npr3(Mm)-rev CCTGCTTCAGTGTCAGTCATGGCAA
Actb(Mm)-fw GTGACGTTGACATCCGTAAAGA
Actb(Mm)-rev GCCGGACTCATCGTACTCC
For Cloning
XhoI-actn2(Dr)-fw CTCGAGATGATGAATCAGATCGAGCTTTCAGT
GCCT
Asp718-actn2(Dr)-rev GGTACCGTAAGGTCACTTTCTCCATATAGGGC
Supplementary table S1. Primers used for genotyping, cassette amplification, RT-
PCR, and qRT-PCR.
Development 144: doi:10.1242/dev.143354: Supplementary information
Dev
elo
pmen
t • S
uppl
emen
tary
info
rmat
ion
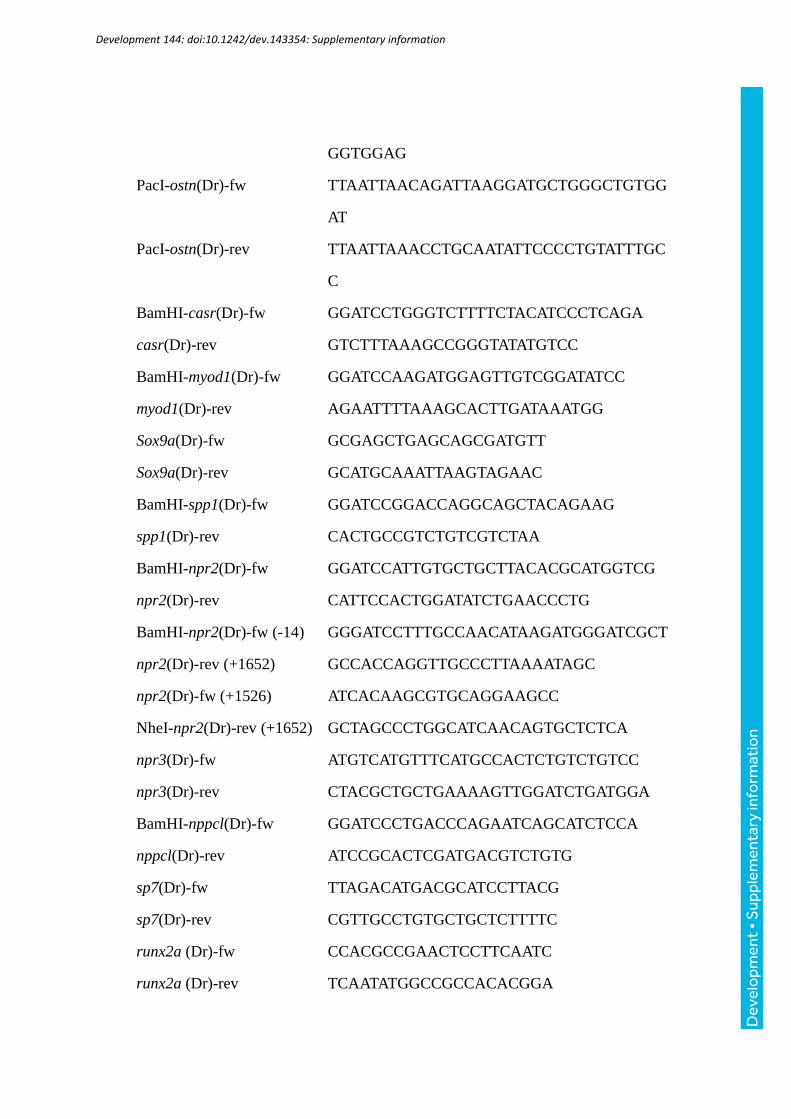
GGTGGAG
PacI-ostn(Dr)-fw TTAATTAACAGATTAAGGATGCTGGGCTGTGG
AT
PacI-ostn(Dr)-rev TTAATTAAACCTGCAATATTCCCCTGTATTTGC
C
BamHI-casr(Dr)-fw GGATCCTGGGTCTTTTCTACATCCCTCAGA
casr(Dr)-rev GTCTTTAAAGCCGGGTATATGTCC
BamHI-myod1(Dr)-fw GGATCCAAGATGGAGTTGTCGGATATCC
myod1(Dr)-rev AGAATTTTAAAGCACTTGATAAATGG
Sox9a(Dr)-fw GCGAGCTGAGCAGCGATGTT
Sox9a(Dr)-rev GCATGCAAATTAAGTAGAAC
BamHI-spp1(Dr)-fw GGATCCGGACCAGGCAGCTACAGAAG
spp1(Dr)-rev CACTGCCGTCTGTCGTCTAA
BamHI-npr2(Dr)-fw GGATCCATTGTGCTGCTTACACGCATGGTCG
npr2(Dr)-rev CATTCCACTGGATATCTGAACCCTG
BamHI-npr2(Dr)-fw (-14) GGGATCCTTTGCCAACATAAGATGGGATCGCT
npr2(Dr)-rev (+1652) GCCACCAGGTTGCCCTTAAAATAGC
npr2(Dr)-fw (+1526) ATCACAAGCGTGCAGGAAGCC
NheI-npr2(Dr)-rev (+1652) GCTAGCCCTGGCATCAACAGTGCTCTCA
npr3(Dr)-fw ATGTCATGTTTCATGCCACTCTGTCTGTCC
npr3(Dr)-rev CTACGCTGCTGAAAAGTTGGATCTGATGGA
BamHI-nppcl(Dr)-fw GGATCCCTGACCCAGAATCAGCATCTCCA
nppcl(Dr)-rev ATCCGCACTCGATGACGTCTGTG
sp7(Dr)-fw TTAGACATGACGCATCCTTACG
sp7(Dr)-rev CGTTGCCTGTGCTGCTCTTTTC
runx2a (Dr)-fw CCACGCCGAACTCCTTCAATC
runx2a (Dr)-rev TCAATATGGCCGCCACACGGA
Development 144: doi:10.1242/dev.143354: Supplementary information
Dev
elo
pmen
t • S
uppl
emen
tary
info
rmat
ion
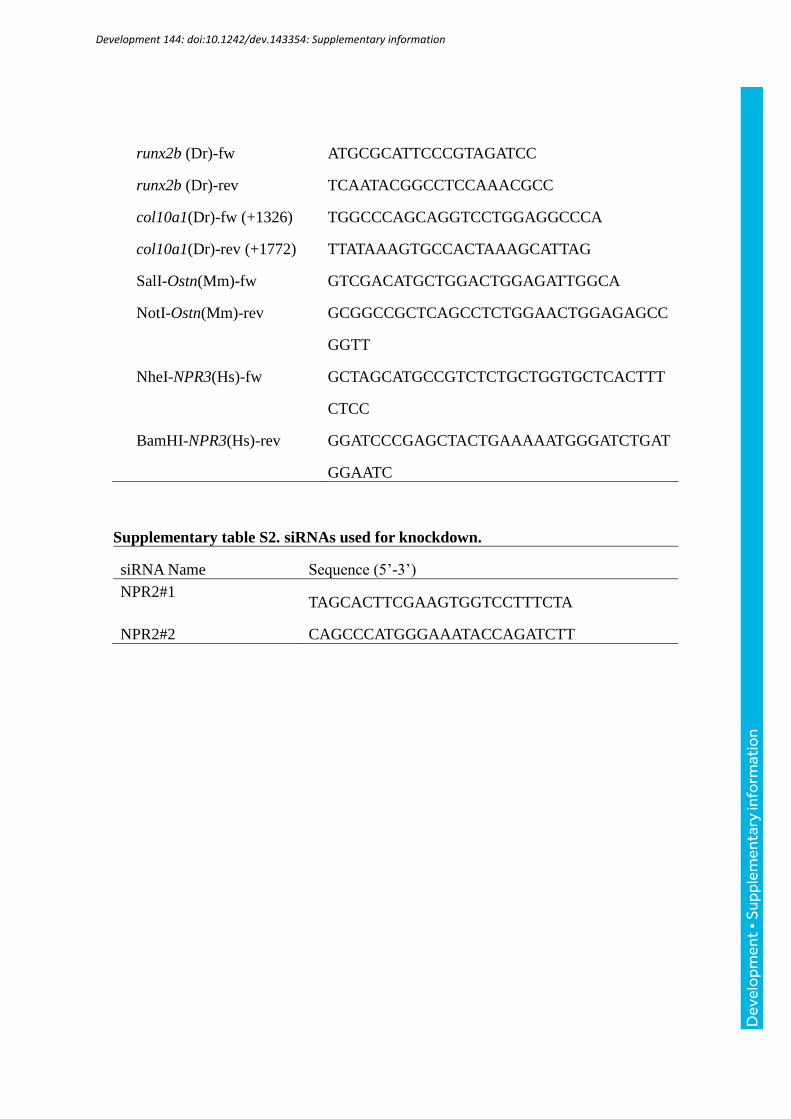
runx2b (Dr)-fw ATGCGCATTCCCGTAGATCC
runx2b (Dr)-rev TCAATACGGCCTCCAAACGCC
col10a1(Dr)-fw (+1326) TGGCCCAGCAGGTCCTGGAGGCCCA
col10a1(Dr)-rev (+1772) TTATAAAGTGCCACTAAAGCATTAG
SalI-Ostn(Mm)-fw GTCGACATGCTGGACTGGAGATTGGCA
NotI-Ostn(Mm)-rev GCGGCCGCTCAGCCTCTGGAACTGGAGAGCC
GGTT
NheI-NPR3(Hs)-fw GCTAGCATGCCGTCTCTGCTGGTGCTCACTTT
CTCC
BamHI-NPR3(Hs)-rev GGATCCCGAGCTACTGAAAAATGGGATCTGAT
GGAATC
Supplementary table S2. siRNAs used for knockdown.
siRNA Name Sequence (5’-3’)
NPR2#1 TAGCACTTCGAAGTGGTCCTTTCTA
NPR2#2 CAGCCCATGGGAAATACCAGATCTT
Development 144: doi:10.1242/dev.143354: Supplementary information
Dev
elo
pmen
t • S
uppl
emen
tary
info
rmat
ion
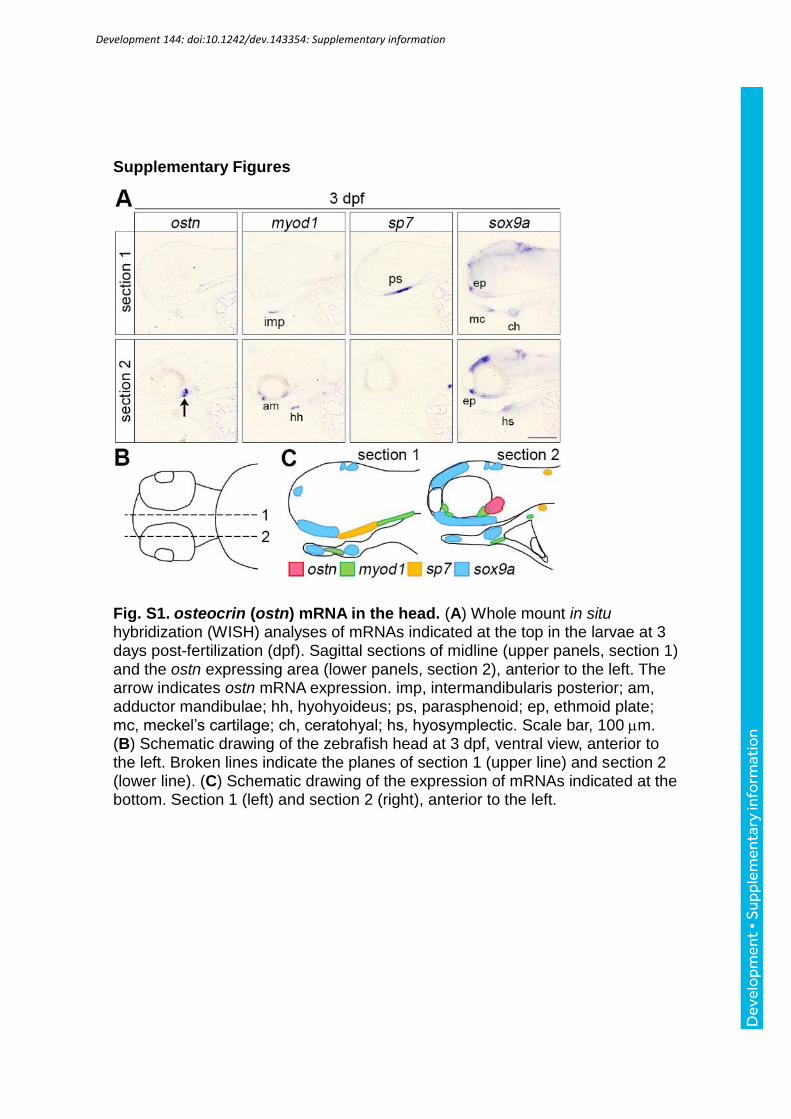
Supplementary Figures
Fig. S1. osteocrin (ostn) mRNA in the head. (A) Whole mount in situ hybridization (WISH) analyses of mRNAs indicated at the top in the larvae at 3 days post-fertilization (dpf). Sagittal sections of midline (upper panels, section 1) and the ostn expressing area (lower panels, section 2), anterior to the left. The arrow indicates ostn mRNA expression. imp, intermandibularis posterior; am, adductor mandibulae; hh, hyohyoideus; ps, parasphenoid; ep, ethmoid plate; mc, meckel’s cartilage; ch, ceratohyal; hs, hyosymplectic. Scale bar, 100 m. (B) Schematic drawing of the zebrafish head at 3 dpf, ventral view, anterior to the left. Broken lines indicate the planes of section 1 (upper line) and section 2 (lower line). (C) Schematic drawing of the expression of mRNAs indicated at the bottom. Section 1 (left) and section 2 (right), anterior to the left.
Development 144: doi:10.1242/dev.143354: Supplementary information
Dev
elo
pmen
t • S
uppl
emen
tary
info
rmat
ion
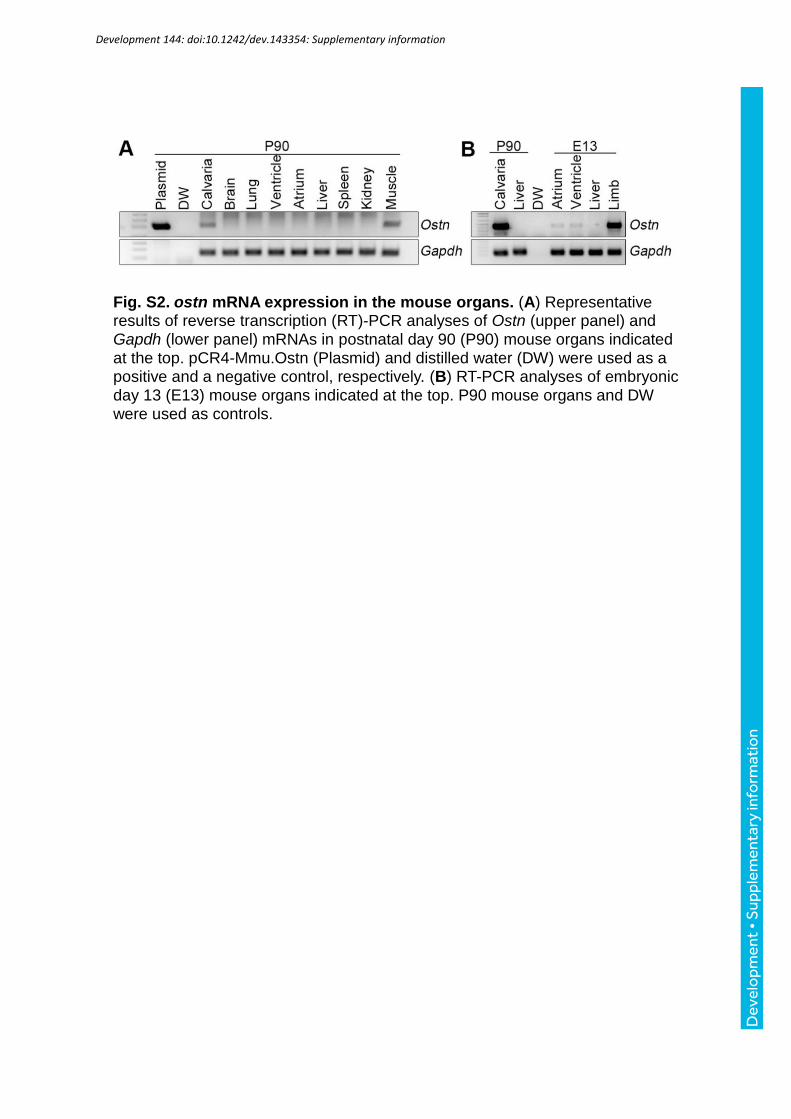
Fig. S2. ostn mRNA expression in the mouse organs. (A) Representative results of reverse transcription (RT)-PCR analyses of Ostn (upper panel) and Gapdh (lower panel) mRNAs in postnatal day 90 (P90) mouse organs indicated at the top. pCR4-Mmu.Ostn (Plasmid) and distilled water (DW) were used as a positive and a negative control, respectively. (B) RT-PCR analyses of embryonic day 13 (E13) mouse organs indicated at the top. P90 mouse organs and DW were used as controls.
Development 144: doi:10.1242/dev.143354: Supplementary information
Dev
elo
pmen
t • S
uppl
emen
tary
info
rmat
ion
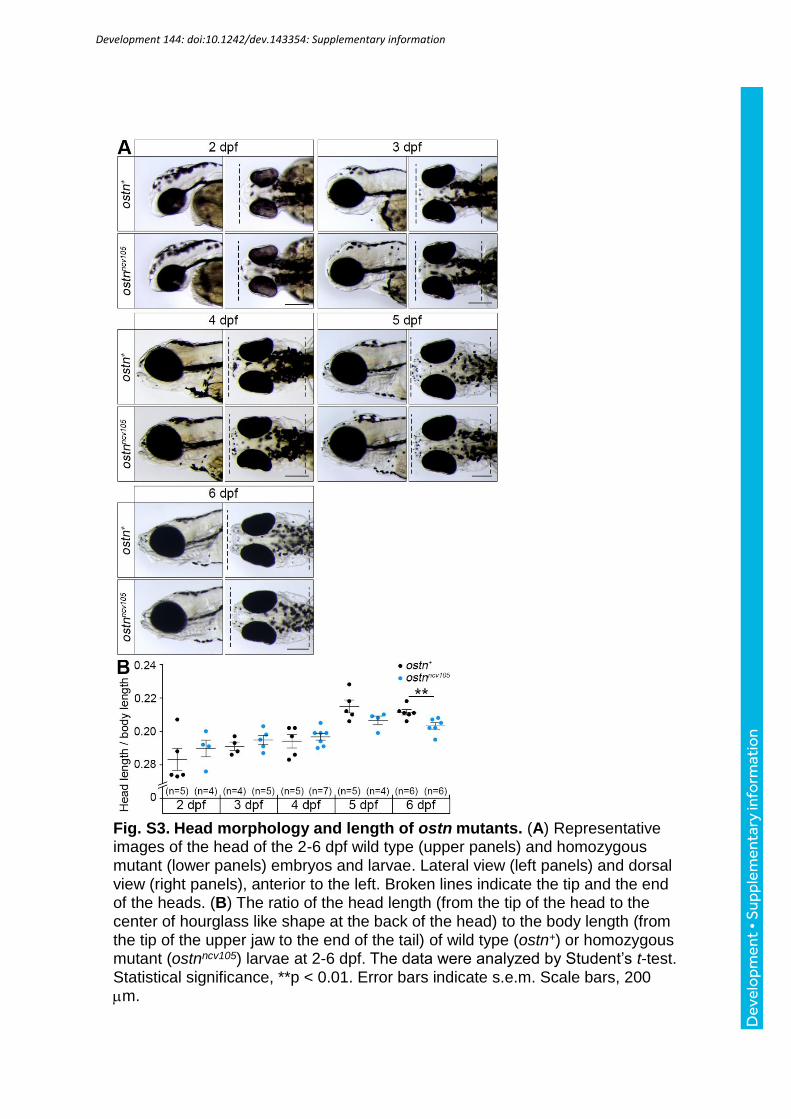
Fig. S3. Head morphology and length of ostn mutants. (A) Representative images of the head of the 2-6 dpf wild type (upper panels) and homozygous mutant (lower panels) embryos and larvae. Lateral view (left panels) and dorsal view (right panels), anterior to the left. Broken lines indicate the tip and the end of the heads. (B) The ratio of the head length (from the tip of the head to the center of hourglass like shape at the back of the head) to the body length (from the tip of the upper jaw to the end of the tail) of wild type (ostn+) or homozygous mutant (ostnncv105) larvae at 2-6 dpf. The data were analyzed by Student’s t-test. Statistical significance, **p < 0.01. Error bars indicate s.e.m. Scale bars, 200 m.
Development 144: doi:10.1242/dev.143354: Supplementary information
Dev
elo
pmen
t • S
uppl
emen
tary
info
rmat
ion
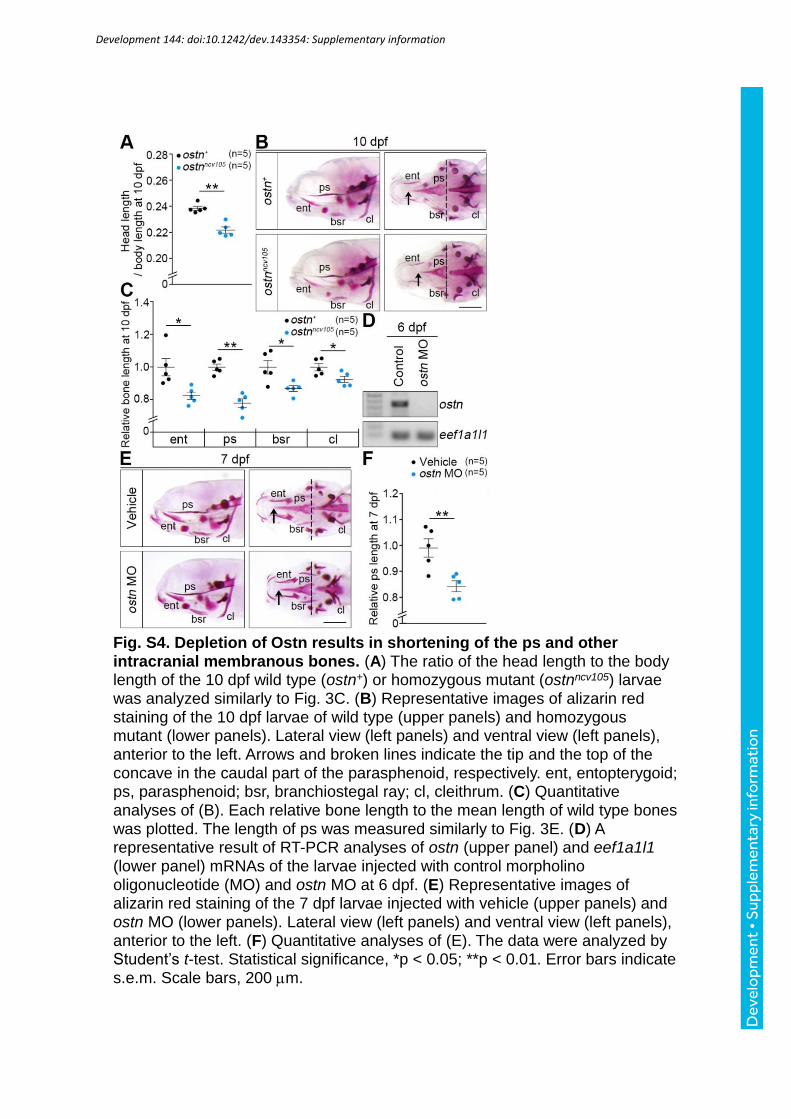
Fig. S4. Depletion of Ostn results in shortening of the ps and other intracranial membranous bones. (A) The ratio of the head length to the body length of the 10 dpf wild type (ostn+) or homozygous mutant (ostnncv105) larvae was analyzed similarly to Fig. 3C. (B) Representative images of alizarin red staining of the 10 dpf larvae of wild type (upper panels) and homozygous mutant (lower panels). Lateral view (left panels) and ventral view (left panels), anterior to the left. Arrows and broken lines indicate the tip and the top of the concave in the caudal part of the parasphenoid, respectively. ent, entopterygoid; ps, parasphenoid; bsr, branchiostegal ray; cl, cleithrum. (C) Quantitative analyses of (B). Each relative bone length to the mean length of wild type bones was plotted. The length of ps was measured similarly to Fig. 3E. (D) A representative result of RT-PCR analyses of ostn (upper panel) and eef1a1l1 (lower panel) mRNAs of the larvae injected with control morpholino
oligonucleotide (MO) and ostn MO at 6 dpf. (E) Representative images of alizarin red staining of the 7 dpf larvae injected with vehicle (upper panels) and ostn MO (lower panels). Lateral view (left panels) and ventral view (left panels), anterior to the left. (F) Quantitative analyses of (E). The data were analyzed by Student’s t-test. Statistical significance, *p < 0.05; **p < 0.01. Error bars indicate s.e.m. Scale bars, 200 m.
Development 144: doi:10.1242/dev.143354: Supplementary information
Dev
elo
pmen
t • S
uppl
emen
tary
info
rmat
ion
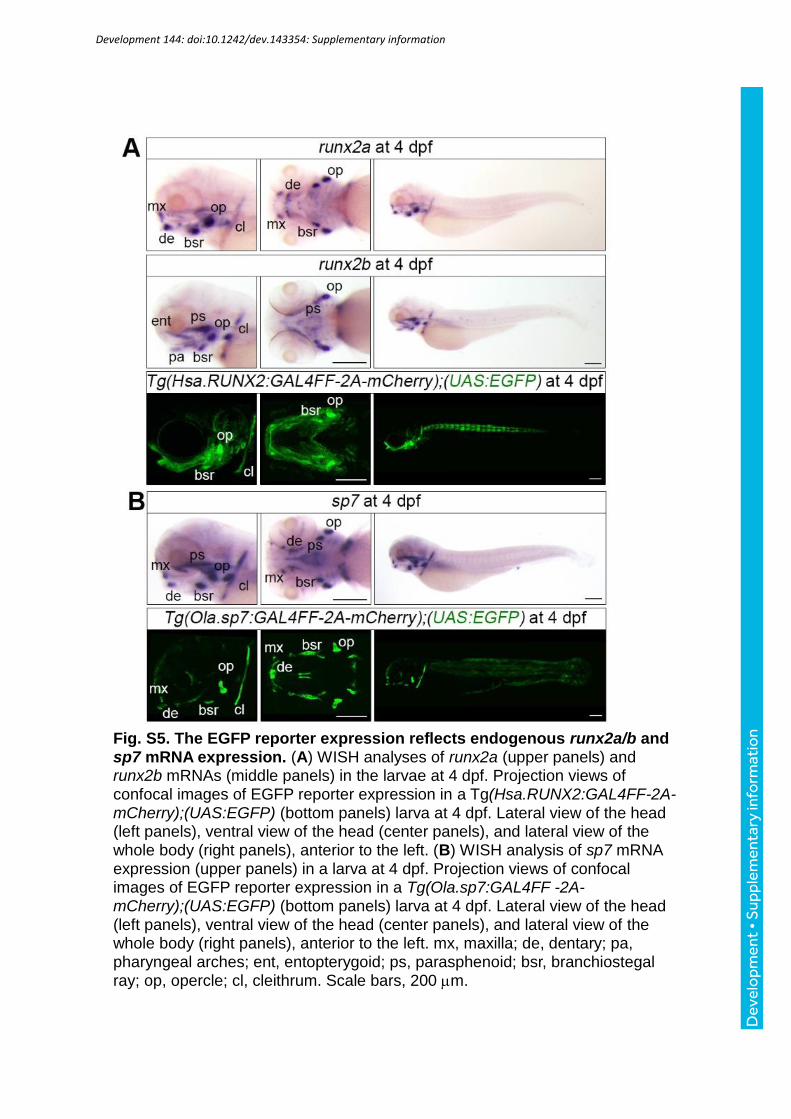
Fig. S5. The EGFP reporter expression reflects endogenous runx2a/b and sp7 mRNA expression. (A) WISH analyses of runx2a (upper panels) and runx2b mRNAs (middle panels) in the larvae at 4 dpf. Projection views of confocal images of EGFP reporter expression in a Tg(Hsa.RUNX2:GAL4FF-2A-mCherry);(UAS:EGFP) (bottom panels) larva at 4 dpf. Lateral view of the head (left panels), ventral view of the head (center panels), and lateral view of the whole body (right panels), anterior to the left. (B) WISH analysis of sp7 mRNA expression (upper panels) in a larva at 4 dpf. Projection views of confocal images of EGFP reporter expression in a Tg(Ola.sp7:GAL4FF -2A-mCherry);(UAS:EGFP) (bottom panels) larva at 4 dpf. Lateral view of the head (left panels), ventral view of the head (center panels), and lateral view of the whole body (right panels), anterior to the left. mx, maxilla; de, dentary; pa, pharyngeal arches; ent, entopterygoid; ps, parasphenoid; bsr, branchiostegal ray; op, opercle; cl, cleithrum. Scale bars, 200 m.
Development 144: doi:10.1242/dev.143354: Supplementary information
Dev
elo
pmen
t • S
uppl
emen
tary
info
rmat
ion
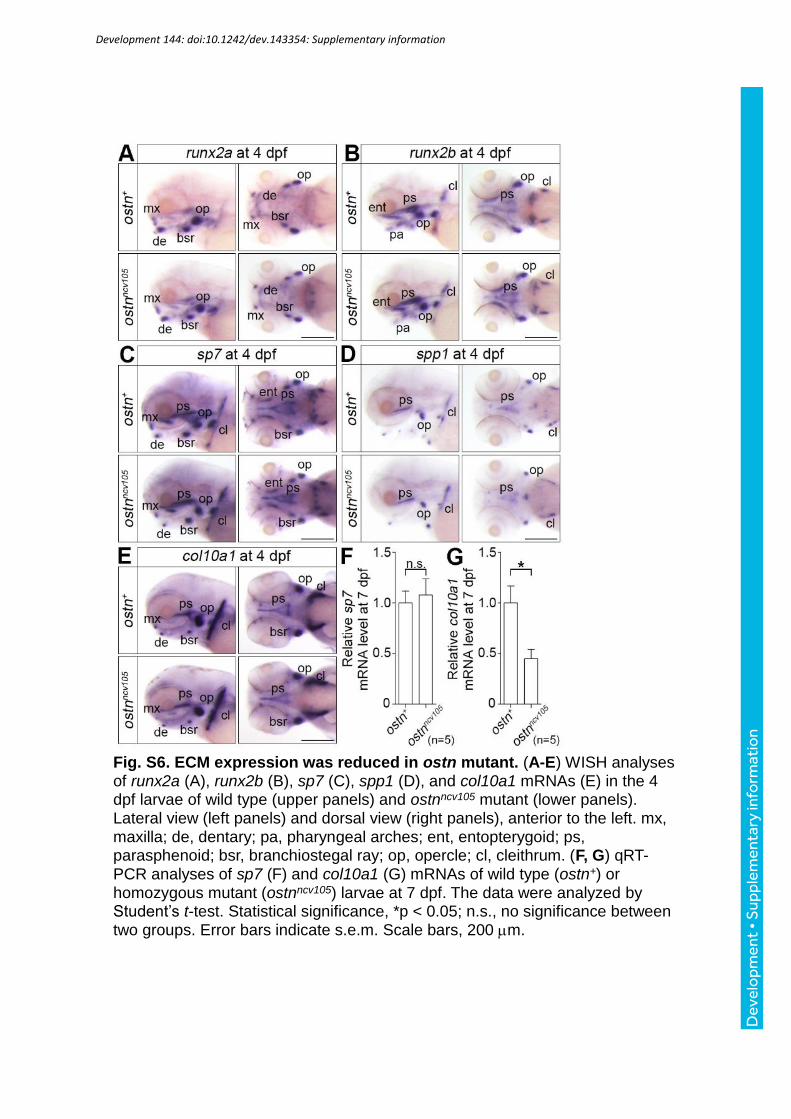
Fig. S6. ECM expression was reduced in ostn mutant. (A-E) WISH analyses of runx2a (A), runx2b (B), sp7 (C), spp1 (D), and col10a1 mRNAs (E) in the 4 dpf larvae of wild type (upper panels) and ostnncv105 mutant (lower panels). Lateral view (left panels) and dorsal view (right panels), anterior to the left. mx, maxilla; de, dentary; pa, pharyngeal arches; ent, entopterygoid; ps, parasphenoid; bsr, branchiostegal ray; op, opercle; cl, cleithrum. (F, G) qRT-
PCR analyses of sp7 (F) and col10a1 (G) mRNAs of wild type (ostn+) or homozygous mutant (ostnncv105) larvae at 7 dpf. The data were analyzed by Student’s t-test. Statistical significance, *p < 0.05; n.s., no significance between two groups. Error bars indicate s.e.m. Scale bars, 200 m.
Development 144: doi:10.1242/dev.143354: Supplementary information
Dev
elo
pmen
t • S
uppl
emen
tary
info
rmat
ion
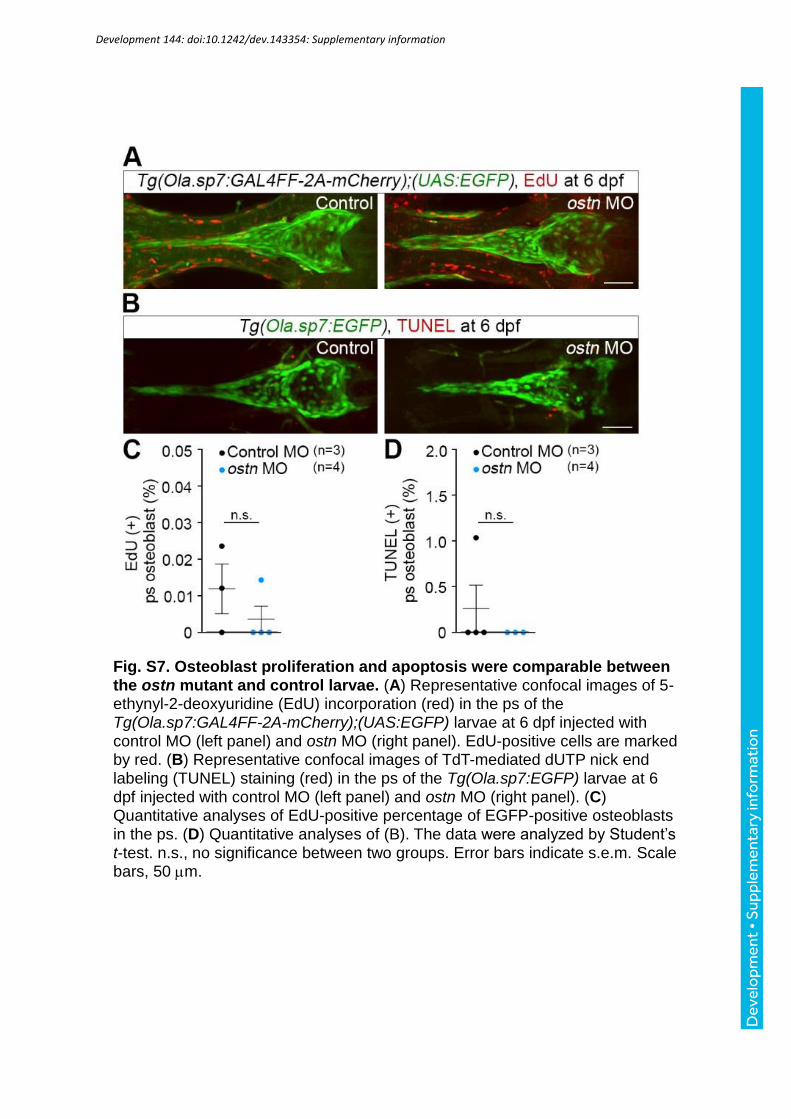
Fig. S7. Osteoblast proliferation and apoptosis were comparable between the ostn mutant and control larvae. (A) Representative confocal images of 5-ethynyl-2-deoxyuridine (EdU) incorporation (red) in the ps of the Tg(Ola.sp7:GAL4FF-2A-mCherry);(UAS:EGFP) larvae at 6 dpf injected with control MO (left panel) and ostn MO (right panel). EdU-positive cells are marked by red. (B) Representative confocal images of TdT-mediated dUTP nick end labeling (TUNEL) staining (red) in the ps of the Tg(Ola.sp7:EGFP) larvae at 6 dpf injected with control MO (left panel) and ostn MO (right panel). (C) Quantitative analyses of EdU-positive percentage of EGFP-positive osteoblasts in the ps. (D) Quantitative analyses of (B). The data were analyzed by Student’s t-test. n.s., no significance between two groups. Error bars indicate s.e.m. Scale bars, 50 m.
Development 144: doi:10.1242/dev.143354: Supplementary information
Dev
elo
pmen
t • S
uppl
emen
tary
info
rmat
ion
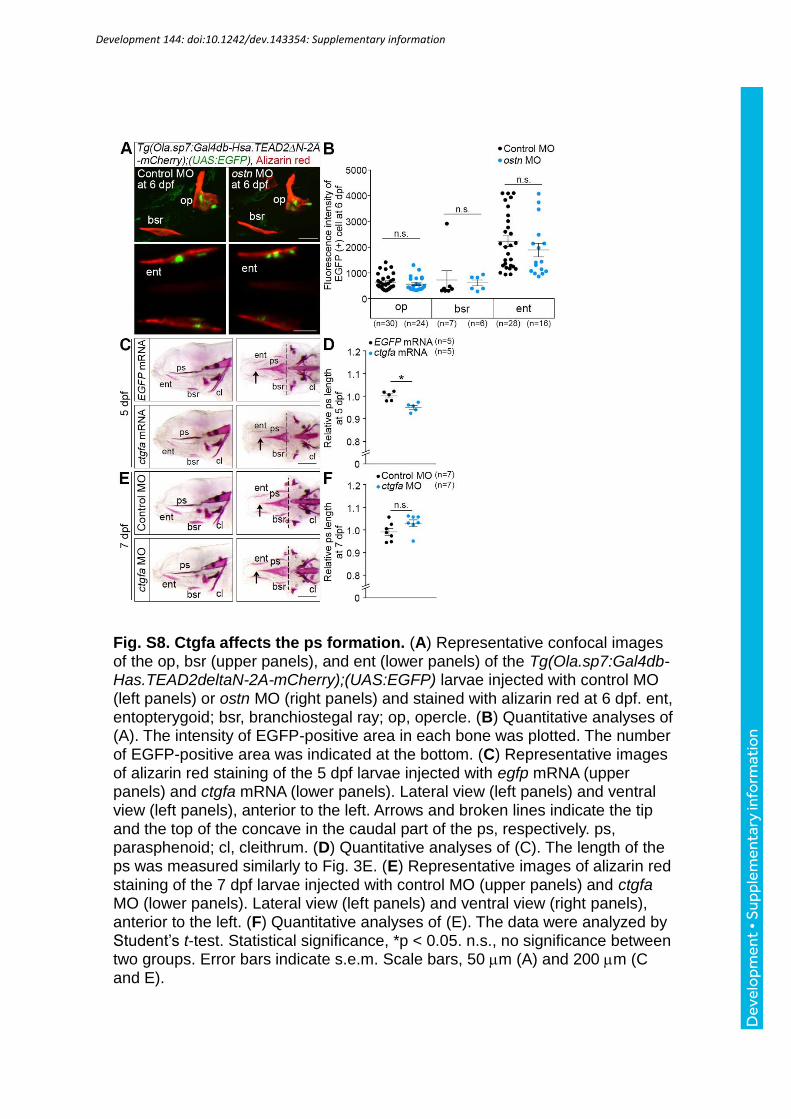
Fig. S8. Ctgfa affects the ps formation. (A) Representative confocal images of the op, bsr (upper panels), and ent (lower panels) of the Tg(Ola.sp7:Gal4db-Has.TEAD2deltaN-2A-mCherry);(UAS:EGFP) larvae injected with control MO (left panels) or ostn MO (right panels) and stained with alizarin red at 6 dpf. ent, entopterygoid; bsr, branchiostegal ray; op, opercle. (B) Quantitative analyses of (A). The intensity of EGFP-positive area in each bone was plotted. The number of EGFP-positive area was indicated at the bottom. (C) Representative images of alizarin red staining of the 5 dpf larvae injected with egfp mRNA (upper panels) and ctgfa mRNA (lower panels). Lateral view (left panels) and ventral view (left panels), anterior to the left. Arrows and broken lines indicate the tip and the top of the concave in the caudal part of the ps, respectively. ps, parasphenoid; cl, cleithrum. (D) Quantitative analyses of (C). The length of the ps was measured similarly to Fig. 3E. (E) Representative images of alizarin red
staining of the 7 dpf larvae injected with control MO (upper panels) and ctgfa MO (lower panels). Lateral view (left panels) and ventral view (right panels), anterior to the left. (F) Quantitative analyses of (E). The data were analyzed by Student’s t-test. Statistical significance, *p < 0.05. n.s., no significance between two groups. Error bars indicate s.e.m. Scale bars, 50 m (A) and 200 m (C and E).
Development 144: doi:10.1242/dev.143354: Supplementary information
Dev
elo
pmen
t • S
uppl
emen
tary
info
rmat
ion
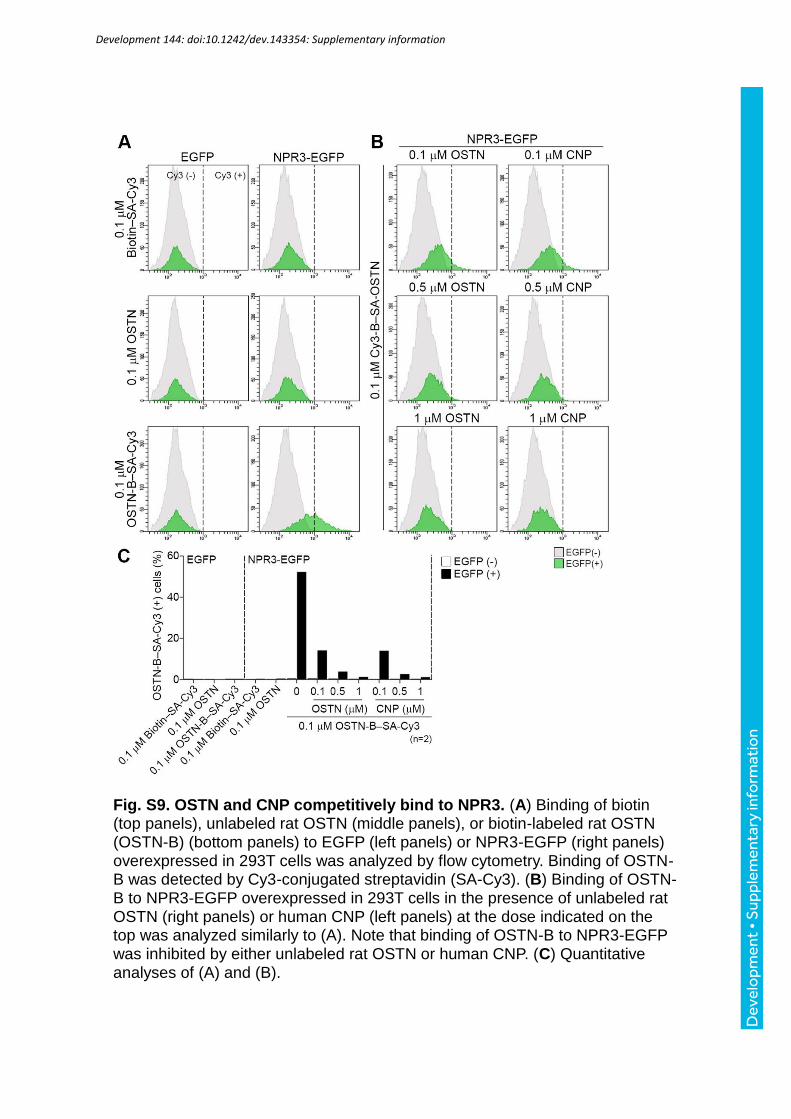
Fig. S9. OSTN and CNP competitively bind to NPR3. (A) Binding of biotin (top panels), unlabeled rat OSTN (middle panels), or biotin-labeled rat OSTN (OSTN-B) (bottom panels) to EGFP (left panels) or NPR3-EGFP (right panels) overexpressed in 293T cells was analyzed by flow cytometry. Binding of OSTN-B was detected by Cy3-conjugated streptavidin (SA-Cy3). (B) Binding of OSTN-B to NPR3-EGFP overexpressed in 293T cells in the presence of unlabeled rat OSTN (right panels) or human CNP (left panels) at the dose indicated on the top was analyzed similarly to (A). Note that binding of OSTN-B to NPR3-EGFP was inhibited by either unlabeled rat OSTN or human CNP. (C) Quantitative analyses of (A) and (B).
Development 144: doi:10.1242/dev.143354: Supplementary information
Dev
elo
pmen
t • S
uppl
emen
tary
info
rmat
ion
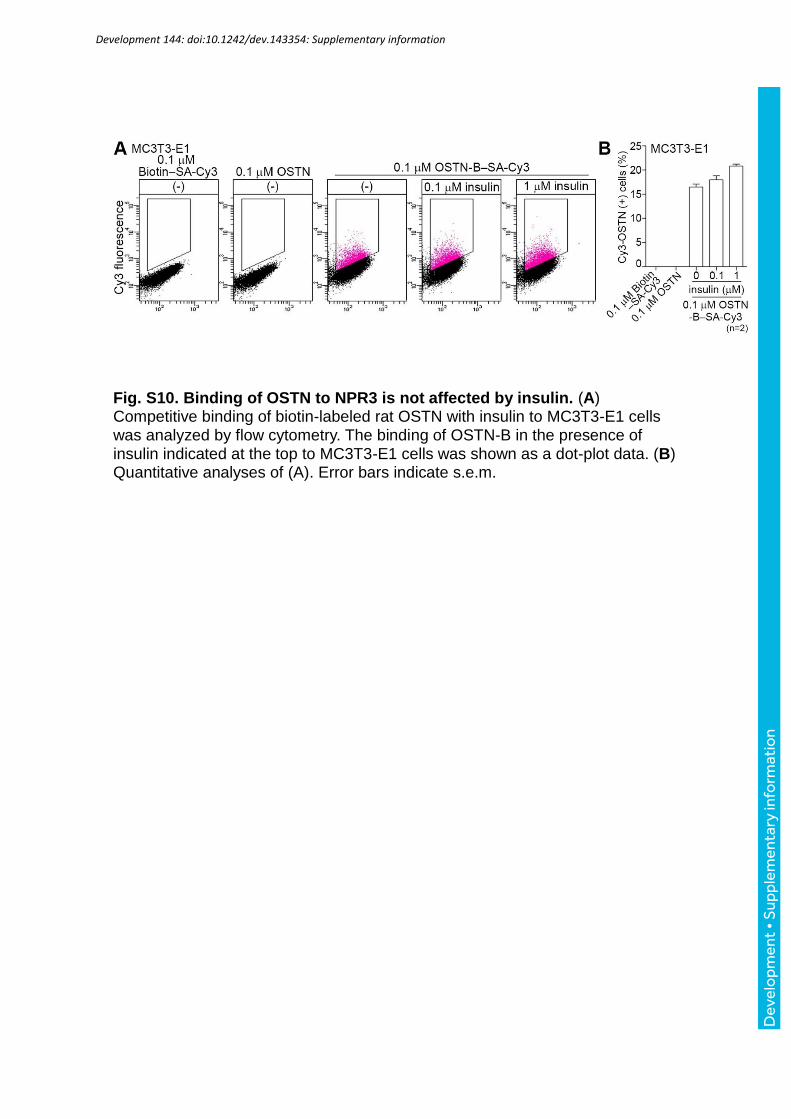
Fig. S10. Binding of OSTN to NPR3 is not affected by insulin. (A) Competitive binding of biotin-labeled rat OSTN with insulin to MC3T3-E1 cells was analyzed by flow cytometry. The binding of OSTN-B in the presence of insulin indicated at the top to MC3T3-E1 cells was shown as a dot-plot data. (B) Quantitative analyses of (A). Error bars indicate s.e.m.
Development 144: doi:10.1242/dev.143354: Supplementary information
Dev
elo
pmen
t • S
uppl
emen
tary
info
rmat
ion
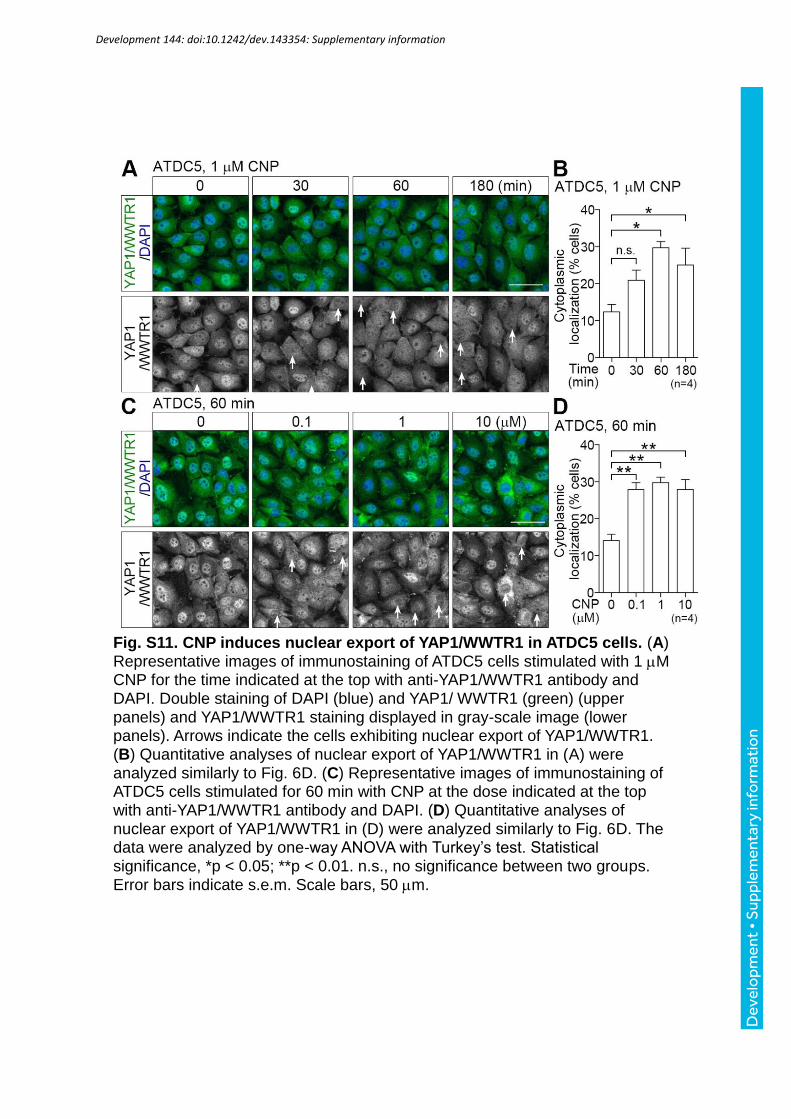
Fig. S11. CNP induces nuclear export of YAP1/WWTR1 in ATDC5 cells. (A) Representative images of immunostaining of ATDC5 cells stimulated with 1 M CNP for the time indicated at the top with anti-YAP1/WWTR1 antibody and DAPI. Double staining of DAPI (blue) and YAP1/ WWTR1 (green) (upper panels) and YAP1/WWTR1 staining displayed in gray-scale image (lower panels). Arrows indicate the cells exhibiting nuclear export of YAP1/WWTR1. (B) Quantitative analyses of nuclear export of YAP1/WWTR1 in (A) were analyzed similarly to Fig. 6D. (C) Representative images of immunostaining of ATDC5 cells stimulated for 60 min with CNP at the dose indicated at the top with anti-YAP1/WWTR1 antibody and DAPI. (D) Quantitative analyses of nuclear export of YAP1/WWTR1 in (D) were analyzed similarly to Fig. 6D. The data were analyzed by one-way ANOVA with Turkey’s test. Statistical significance, *p < 0.05; **p < 0.01. n.s., no significance between two groups.
Error bars indicate s.e.m. Scale bars, 50 m.
Development 144: doi:10.1242/dev.143354: Supplementary information
Dev
elo
pmen
t • S
uppl
emen
tary
info
rmat
ion
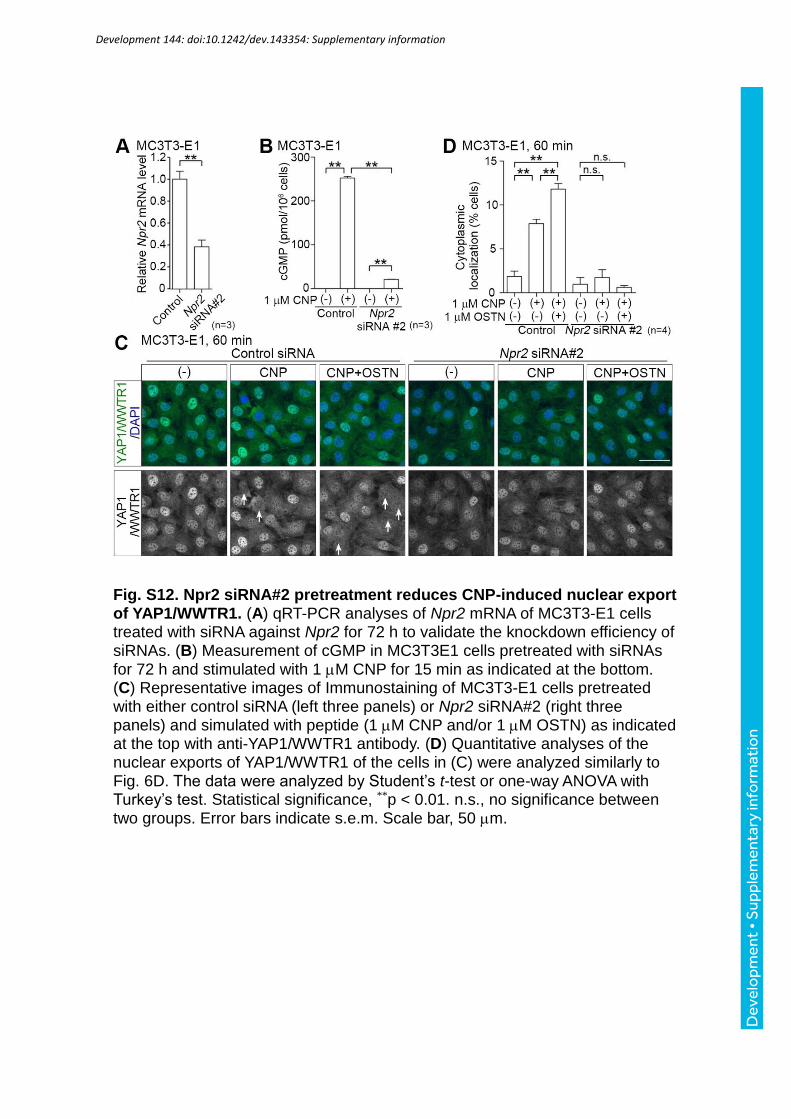
Fig. S12. Npr2 siRNA#2 pretreatment reduces CNP-induced nuclear export of YAP1/WWTR1. (A) qRT-PCR analyses of Npr2 mRNA of MC3T3-E1 cells treated with siRNA against Npr2 for 72 h to validate the knockdown efficiency of siRNAs. (B) Measurement of cGMP in MC3T3E1 cells pretreated with siRNAs for 72 h and stimulated with 1 M CNP for 15 min as indicated at the bottom. (C) Representative images of Immunostaining of MC3T3-E1 cells pretreated with either control siRNA (left three panels) or Npr2 siRNA#2 (right three panels) and simulated with peptide (1 M CNP and/or 1 M OSTN) as indicated at the top with anti-YAP1/WWTR1 antibody. (D) Quantitative analyses of the nuclear exports of YAP1/WWTR1 of the cells in (C) were analyzed similarly to Fig. 6D. The data were analyzed by Student’s t-test or one-way ANOVA with Turkey’s test. Statistical significance, **p < 0.01. n.s., no significance between two groups. Error bars indicate s.e.m. Scale bar, 50 m.
Development 144: doi:10.1242/dev.143354: Supplementary information
Dev
elo
pmen
t • S
uppl
emen
tary
info
rmat
ion
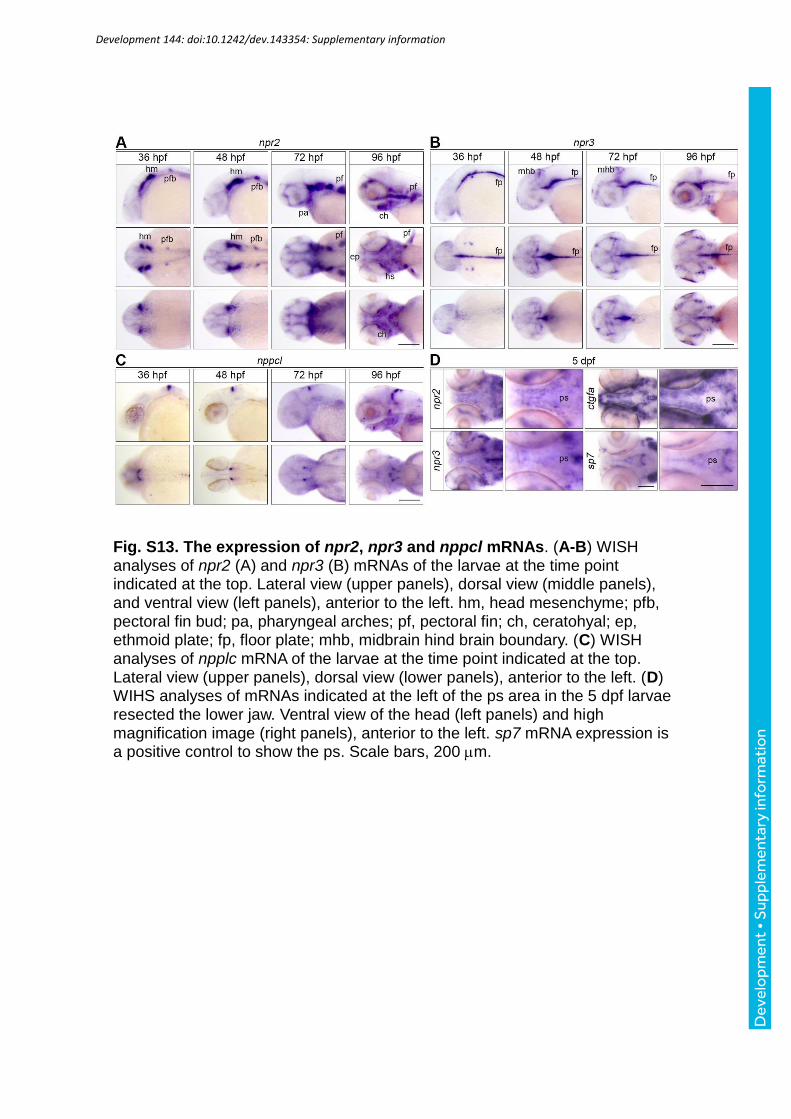
Fig. S13. The expression of npr2, npr3 and nppcl mRNAs. (A-B) WISH analyses of npr2 (A) and npr3 (B) mRNAs of the larvae at the time point indicated at the top. Lateral view (upper panels), dorsal view (middle panels), and ventral view (left panels), anterior to the left. hm, head mesenchyme; pfb, pectoral fin bud; pa, pharyngeal arches; pf, pectoral fin; ch, ceratohyal; ep, ethmoid plate; fp, floor plate; mhb, midbrain hind brain boundary. (C) WISH analyses of npplc mRNA of the larvae at the time point indicated at the top. Lateral view (upper panels), dorsal view (lower panels), anterior to the left. (D) WIHS analyses of mRNAs indicated at the left of the ps area in the 5 dpf larvae resected the lower jaw. Ventral view of the head (left panels) and high magnification image (right panels), anterior to the left. sp7 mRNA expression is a positive control to show the ps. Scale bars, 200 m.
Development 144: doi:10.1242/dev.143354: Supplementary information
Dev
elo
pmen
t • S
uppl
emen
tary
info
rmat
ion
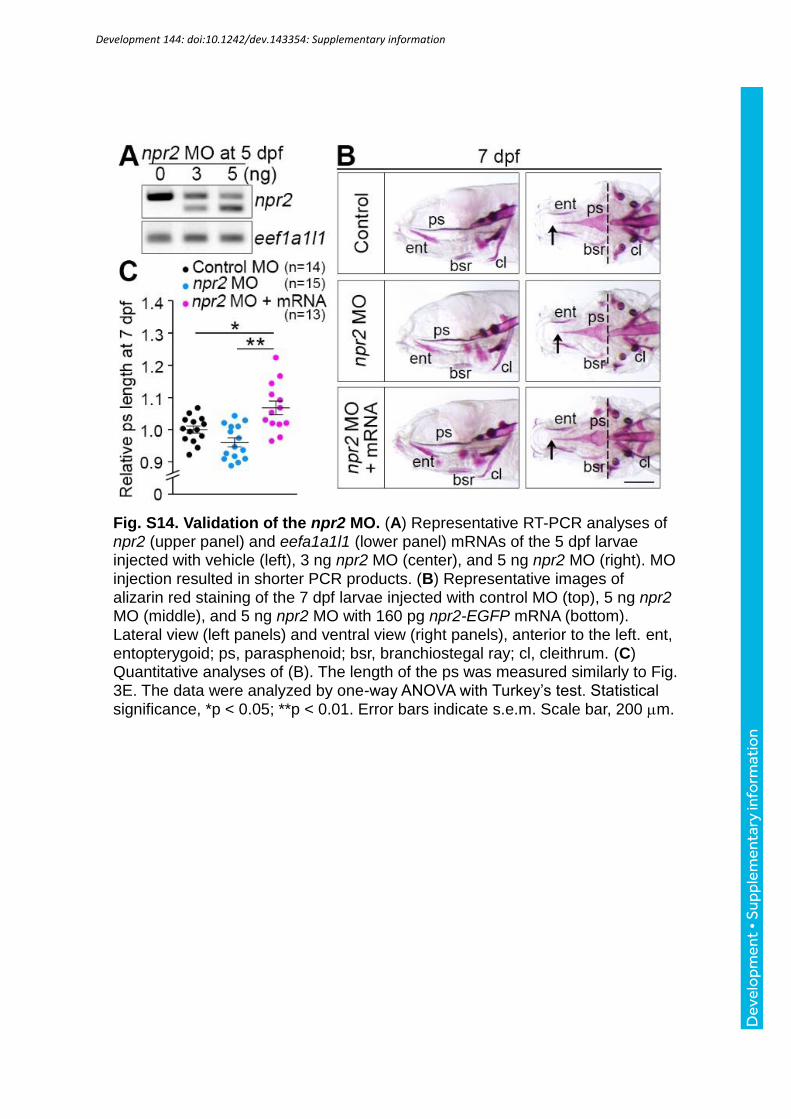
Fig. S14. Validation of the npr2 MO. (A) Representative RT-PCR analyses of npr2 (upper panel) and eefa1a1l1 (lower panel) mRNAs of the 5 dpf larvae injected with vehicle (left), 3 ng npr2 MO (center), and 5 ng npr2 MO (right). MO injection resulted in shorter PCR products. (B) Representative images of alizarin red staining of the 7 dpf larvae injected with control MO (top), 5 ng npr2 MO (middle), and 5 ng npr2 MO with 160 pg npr2-EGFP mRNA (bottom). Lateral view (left panels) and ventral view (right panels), anterior to the left. ent, entopterygoid; ps, parasphenoid; bsr, branchiostegal ray; cl, cleithrum. (C) Quantitative analyses of (B). The length of the ps was measured similarly to Fig. 3E. The data were analyzed by one-way ANOVA with Turkey’s test. Statistical significance, *p < 0.05; **p < 0.01. Error bars indicate s.e.m. Scale bar, 200 m.
Development 144: doi:10.1242/dev.143354: Supplementary information
Dev
elo
pmen
t • S
uppl
emen
tary
info
rmat
ion
References
Asakawa,K., Suster,M.L., Mizusawa,K., Nagayoshi,S., Kotani,T., Urasaki,A.,
Kishimoto,Y., Hibi,M., and Kawakami,K. (2008). Genetic dissection of neural
circuits by Tol2 transposon-mediated Gal4 gene and enhancer trapping in
zebrafish. Proc. Natl. Acad. Sci. U. S. A 105, 1255-1260.
Cermak,T., Doyle,E.L., Christian,M., Wang,L., Zhang,Y., Schmidt,C.,
Baller,J.A., Somia,N.V., Bogdanove,A.J., and Voytas,D.F. (2011). Efficient
design and assembly of custom TALEN and other TAL effector-based constructs
for DNA targeting. Nucleic Acids Res. 39, e82.
Distel,M., Wullimann,M.F., and Koster,R.W. (2009). Optimized Gal4 genetics
for permanent gene expression mapping in zebrafish. Proc. Natl. Acad. Sci. U.
S. A 106, 13365-13370.
Doyle,E.L., Booher,N.J., Standage,D.S., Voytas,D.F., Brendel,V.P.,
Vandyk,J.K., and Bogdanove,A.J. (2012). TAL Effector-Nucleotide Targeter
(TALE-NT) 2.0: tools for TAL effector design and target prediction. Nucleic Acids
Res. 40, W117-W122.
Fukui,H., Terai,K., Nakajima,H., Chiba,A., Fukuhara,S., and Mochizuki,N.
(2014). S1P-Yap1 signaling regulates endoderm formation required for cardiac
precursor cell migration in zebrafish. Dev. Cell 31, 128-136.
Halloran,M.C., Sato-Maeda,M., Warren,J.T., Su,F., Lele,Z., Krone,P.H.,
Kuwada,J.Y., and Shoji,W. (2000). Laser-induced gene expression in specific
cells of transgenic zebrafish. Development 127, 1953-1960.
Kashiwada,T., Fukuhara,S., Terai,K., Tanaka,T., Wakayama,Y., Ando,K.,
Nakajima,H., Fukui,H., Yuge,S., Saito,Y. et al. (2015). beta-catenin-dependent
transcription is central to Bmp-mediated formation of venous vessels.
Development 142, 497-509.
Kawakami,K., Takeda,H., Kawakami,N., Kobayashi,M., Matsuda,N., and
Mishina,M. (2004). A transposon-mediated gene trap approach identifies
developmentally regulated genes in zebrafish. Dev. Cell 7, 133-144.
Kimmel,C.B., Ballard,W.W., Kimmel,S.R., Ullmann,B., and Schilling,T.F.
(1995). Stages of embryonic development of the zebrafish. Dev. Dyn. 203, 253-
310.
Knopf,F., Hammond,C., Chekuru,A., Kurth,T., Hans,S., Weber,C.W.,
Mahatma,G., Fisher,S., Brand,M., Schulte-Merker,S. et al. (2011). Bone
Development 144: doi:10.1242/dev.143354: Supplementary information
Dev
elo
pmen
t • S
uppl
emen
tary
info
rmat
ion
regenerates via dedifferentiation of osteoblasts in the zebrafish fin. Dev. Cell 20,
713-724.
Kurita,R., Sagara,H., Aoki,Y., Link,B.A., Arai,K., and Watanabe,S. (2003).
Suppression of lens growth by alphaA-crystallin promoter-driven expression of
diphtheria toxin results in disruption of retinal cell organization in zebrafish. Dev.
Biol. 255, 113-127.
Spoorendonk,K.M., Peterson-Maduro,J., Renn,J., Trowe,T., Kranenbarg,S.,
Winkler,C., and Schulte-Merker,S. (2008). Retinoic acid and Cyp26b1 are
critical regulators of osteogenesis in the axial skeleton. Development 135, 3765-
3774.
Uemura,M., Nagasawa,A., and Terai,K. (2016). Yap/Taz transcriptional activity
in endothelial cells promotes intramembranous ossification via the BMP
pathway. Sci. Rep. 6, 27473.
Urasaki,A., Morvan,G., and Kawakami,K. (2006). Functional dissection of the
Tol2 transposable element identified the minimal cis-sequence and a highly
repetitive sequence in the subterminal region essential for transposition.
Genetics 174, 639-649.
Development 144: doi:10.1242/dev.143354: Supplementary information
Dev
elo
pmen
t • S
uppl
emen
tary
info
rmat
ion
Development 144: doi:10.1242/dev.143354: Supplementary information
Supplementary movie 1. Video image of a beating heart of Tg(myl7:NLS-mCherry)
larva at 72 hpf obtained by a light sheet microscope.
Dev
elo
pmen
t • S
uppl
emen
tary
info
rmat
ion
Development 144: doi:10.1242/dev.143354: Supplementary information
Supplementary movie 2. Video image of a beating heart of Tg(myl7:actn2-tdEos)
larva at 72 hpf obtained by a light sheet microscope.
Dev
elo
pmen
t • S
uppl
emen
tary
info
rmat
ion
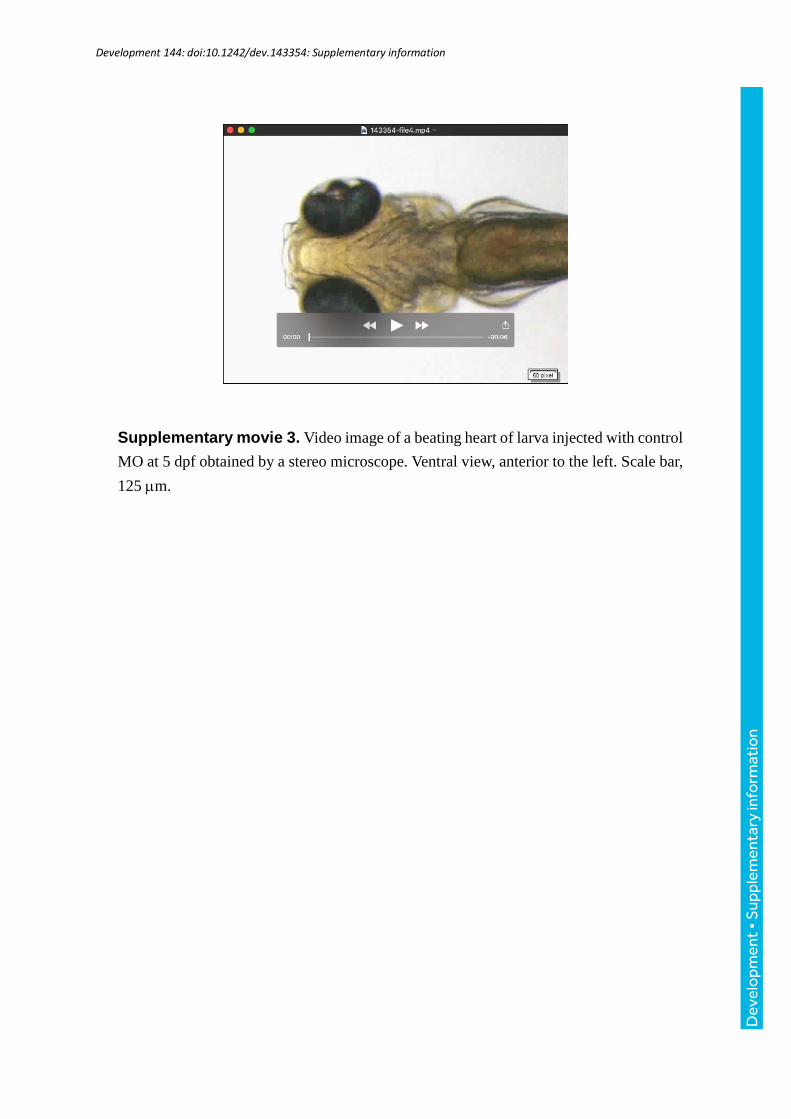
Development 144: doi:10.1242/dev.143354: Supplementary information
Supplementary movie 3. Video image of a beating heart of larva injected with control
MO at 5 dpf obtained by a stereo microscope. Ventral view, anterior to the left. Scale bar,
125 m.
Dev
elo
pmen
t • S
uppl
emen
tary
info
rmat
ion
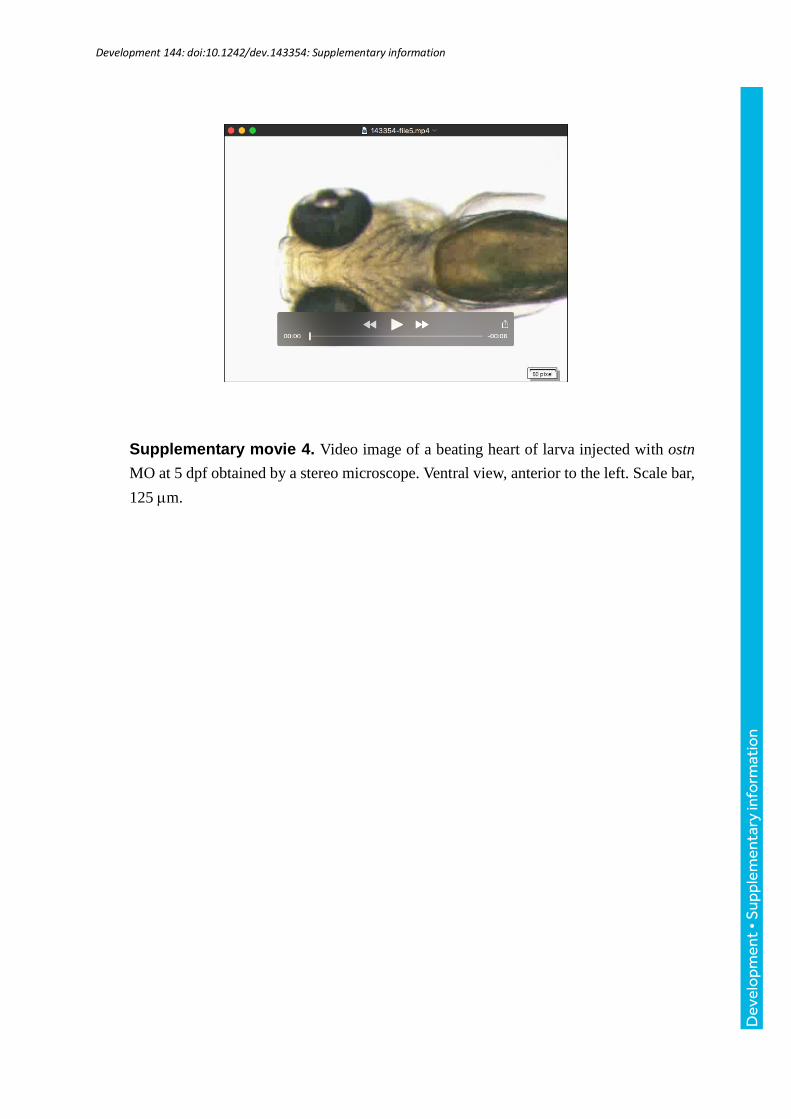
Development 144: doi:10.1242/dev.143354: Supplementary information
Supplementary movie 4. Video image of a beating heart of larva injected with ostn
MO at 5 dpf obtained by a stereo microscope. Ventral view, anterior to the left. Scale bar,
125 m.
Dev
elo
pmen
t • S
uppl
emen
tary
info
rmat
ion