Embed Size (px)
Citation preview
FFiissccaall DDeecceennttrraalliizzaattiioonn
TThhee CCaassee ooff TThhaaiillaanndd∗∗
Sutapa Amornvivat, Ph.D. Ministry of Finance
Thailand [email protected]
∗ The author would like to thank many colleagues at the Ministry of Finance, the Ministry of Interior, the
National Economic and Social Development Board, the Bank of Thailand and the Fiscal Policy Research Institute, especially Dr.Kanit Sangsubhan, for their invaluable inputs. The view expressed in this paper does necessarily reflect that of the Ministry of Finance.
Fiscal Decentralization: the Case of Thailand
Sutapa Amornvivat, PhD Page 2 15 Feb. 04
Fiscal Decentralization: The Case of Thailand Introduction................................................................................................................................3 1. Development of Political Decentralization............................................................................3
1.1 Thailand’s Administrative Structure...............................................................................3 1.2 The Constitutional Mandate for Decentralization...........................................................4 1.3 The Decentralization Act of 1999...................................................................................5
2. Fiscal Framework...................................................................................................................5 2.1 Expenditure Assignment.................................................................................................6 2.2 Revenue Assignment ......................................................................................................6 2.3 Intergovernmental Transfers...........................................................................................7 2.4 Local Government Borrowing ........................................................................................8 2.5 Accountability Mechanism .............................................................................................8 2.6 Monitoring and Evaluation .............................................................................................8
3. Current Condition .................................................................................................................9 3.1 Efficiency........................................................................................................................9 3.2 Capacity ........................................................................................................................11 3.3 Autonomy .....................................................................................................................13 3.4 Adequacy ......................................................................................................................15
Final Remark............................................................................................................................18 Reference .................................................................................................................................19 List of Tables Table 1 : Local Governments' Outlays in Total Public Spending and GDP; 1986-2002 ..........9 Table 2 : Components of Local Expenditure, 1997-2002........................................................10 Table 3 : Disbursement of Subsidies with Transfers of Responsibilities, FY2002 .................10 Table 4 : Revenue Share, 1997-2002.......................................................................................11 Table 5 : Local Revenue by Sources, 1997-2002 ....................................................................12 Table 6 : Growth of Locally-Collected Revenue.....................................................................12 Table 7 : Autonomy Index of Local Revenues, FY2002 .........................................................13 Table 8 : Theoretical Impact of Fiscal Decentralization..........................................................16 Table 9 : Comparison of transfer and cross-subsidies before and after fiscal decentralization
..........................................................................................................................................17 List of Figures Figure 1 : Administrative Structure of the Royal Thai Government .........................................4 Figure 2 : Fiscal Balance of Combined PAOs+TAOs in All Provinces (excluding Bangkok),
FY2002 ............................................................................................................................15 Figure 3 : Total tax levied (Tp) versus total cash expenditure (Gp) in 75 provinces, before and
after fiscal decentralization ..............................................................................................18 ____________________
Fiscal Decentralization: the Case of Thailand
Sutapa Amornvivat, PhD Page 3 15 Feb. 04
Introduction This paper gives an overview of fiscal decentralization in Thailand. It is divided into
4 sections. The first section begins by describing Thailand’s administrative structure and the past development of political and fiscal decentralization. The second section summarizes the present fiscal framework in the following order: expenditure assignment, revenue assignment, intergovernmental transfers, local government borrowing, accountability mechanism, and monitoring and evaluation procedure. In the third section, the current implementation of fiscal decentralization is analyzed. Key problems on fiscal decentralization—such as efficiency of service deliveries, absorptive capacity, local autonomy, and financial adequacy—are identified and illustrated using available data. The paper concludes in the forth sector.
1. Development of Political Decentralization Decentralization has been an active policy issue since 1992 when there was a political
movement to have appointed provincial governors replaced by elected ones. However, the new decentralization era in Thailand did not start until the new constitution was promulgated in 1997. The Decentralization Act of 1999 soon followed and provided a more concrete framework for the decentralization process. A particular attention focused on the fiscal aspect as mandated in the Decentralization Act of 1999. 1
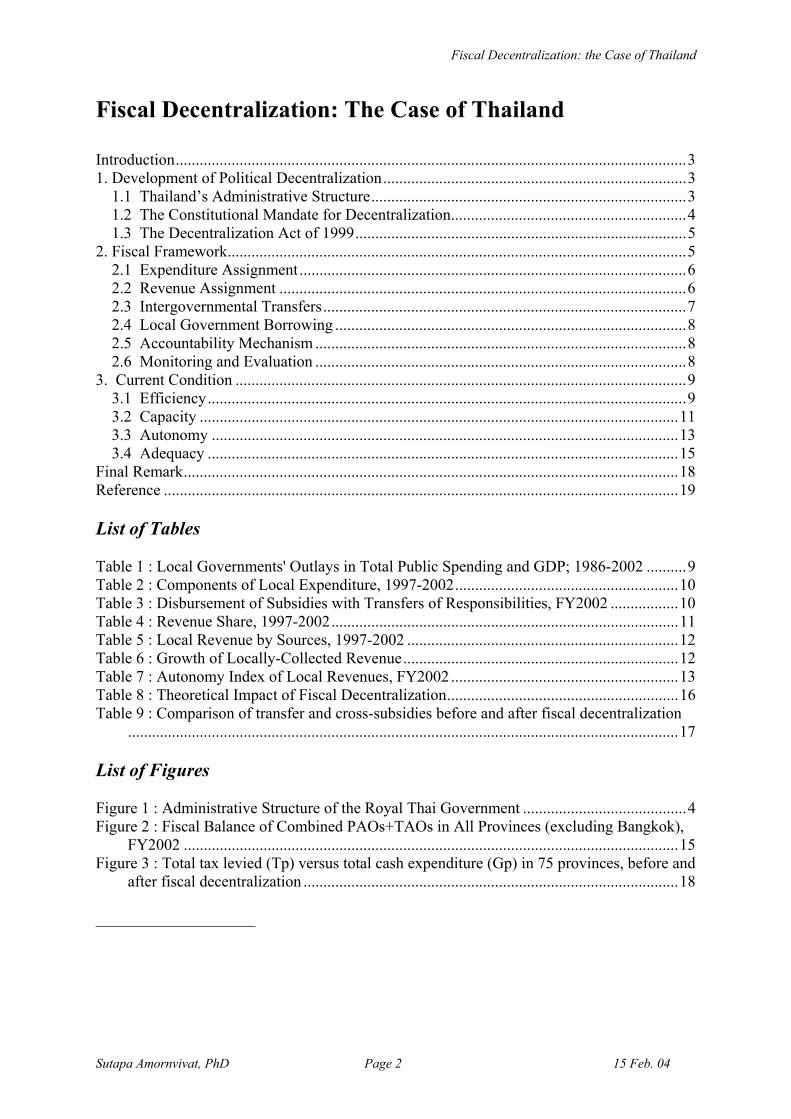
1.1 Thailand’s Administrative Structure The Kingdom of Thailand is a unitary state. According to the Thai Administrative
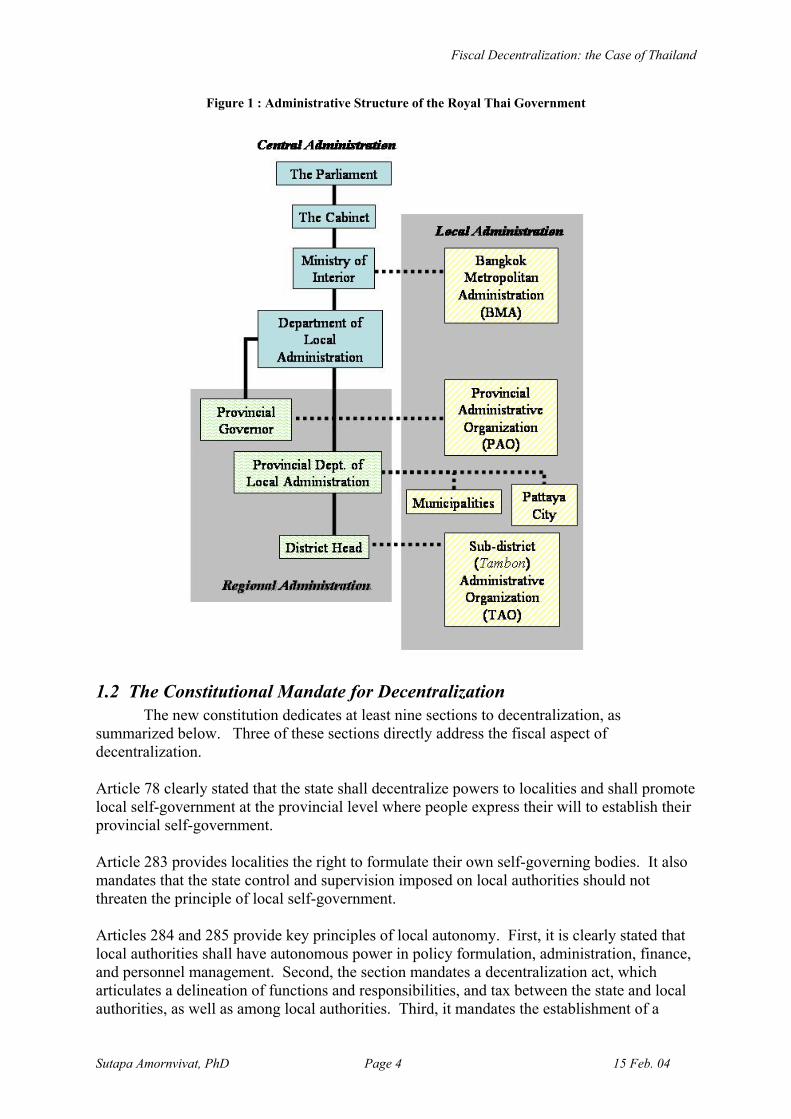
Act of 1991, the Royal Thai Government’s administration incorporates three administrative levels that include central, regional, and local authorities as illustrated in Figure 1.
Regional Administration The administration of a province is comprised of an appointed governor and a number of provincial departments, which are field units of the central government. The district administration, a sub-level of the province, is administered by the “District Head,” who is appointed by the Department of Local Administration, Ministry of Interior. A district administration roots down to the sub-district (Tambon) and village (Mooban) levels. Local Administration Local authorities in Thailand are statuary bodies of national government. There are altogether 7,951 units of local authorities, which can be classified into five forms. They include
1. Provincial Administrative Organization (PAO), 2. Municipality, 3. Sub-district (Tambon) Administrative Organization (TAO), 4. Bangkok Metropolitan Administration (BMA), and 5. Pattaya City.
1 Suwanmala (2002) gives an extensive description of Thailand’s administrative structure and decentralization
process under the New Constitution of 1997.
Fiscal Decentralization: the Case of Thailand
Sutapa Amornvivat, PhD Page 4 15 Feb. 04
Figure 1 : Administrative Structure of the Royal Thai Government
1.2 The Constitutional Mandate for Decentralization The new constitution dedicates at least nine sections to decentralization, as
summarized below. Three of these sections directly address the fiscal aspect of decentralization. Article 78 clearly stated that the state shall decentralize powers to localities and shall promote local self-government at the provincial level where people express their will to establish their provincial self-government. Article 283 provides localities the right to formulate their own self-governing bodies. It also mandates that the state control and supervision imposed on local authorities should not threaten the principle of local self-government. Articles 284 and 285 provide key principles of local autonomy. First, it is clearly stated that local authorities shall have autonomous power in policy formulation, administration, finance, and personnel management. Second, the section mandates a decentralization act, which articulates a delineation of functions and responsibilities, and tax between the state and local authorities, as well as among local authorities. Third, it mandates the establishment of a
Fiscal Decentralization: the Case of Thailand
Sutapa Amornvivat, PhD Page 5 15 Feb. 04
decentralization committee, which in turn will prepare the decentralization plan, review, monitor, and provide policy recommendations for the Cabinet concerning the implementation of decentralization plan and process. The committee is dedicated to have equal numbers of representatives from local authorities, central government agencies, and qualified persons. Local council and executive bodies are mandated to be locally elected and to hold office for four years. Persons who are employees of government agencies, local authorities, and state enterprises are not eligible to be members of local councils and executive bodies. Articles 286 and 287 provide the right of local residents to recall votes when local elected officials are not trustworthy. Article 288 provides that a local civil service law shall be established. The law shall prescribe the establishment of local personnel committee, comprised of equal numbers of representatives from local authorities, central government agencies, and qualified persons. Articles 289 and 290 enable local authorities to carry out additional functions, including the preservation of local arts, heritages, and culture, providing education and training, preservation and managing natural resources, environment, sanitation, and the promotion of livable communities.
1.3 The Decentralization Act of 1999 The Decentralization Act of 1999 became effective on November 18, 1999. The act is
due from Chapter 284 of the Constitution Act of 1997, which mandates that
“…For the purpose of the continual development of decentralization to a higher level, there shall be the law determining plains and process of decentralization, the substance of which shall at least provide the following matters. The delineation of powers and duties of public service delivery between the State and local authorities and among local authorities themselves. The allocations of taxes and duties between the State and local government authorities, which in which functions and responsibilities of the State and local authorities shall be taken into accounted. The establishment of a committee in charge of the duties in (1) and (2). The committee shall consist, in an equal number, of representative of relevant government agencies, representatives of local authorities, and qualified persons possessing the qualifications as provided by the law…”
The Act is aimed at serving as the backbone of decentralization. There are 5 sections including, (1) the Office of National Decentralization Committee (ONDC), (2) local services responsibilities, (3) the allocation of taxes and duties, (4) the decentralization plan, and (5) measures for transitional period. The Act codifies the functions and responsibilities of the different types of local government organizations (i.e., TAOs, PAOs, BMA). Despite the impact of the Act on awareness of public at large, many existing laws and regulations must be revised to eliminate contradictions with the Act and subsequent decentralization efforts, as well as to improve clarity. The conflict between the Act and existing Department of Local Administration’s regulations pertaining to local borrowing is one example. This issue shall be further discussed in Section 2.4.
2. Fiscal Framework
Fiscal Decentralization: the Case of Thailand
Sutapa Amornvivat, PhD Page 6 15 Feb. 04
2.1 Expenditure Assignment At present, no explicit expenditure assignments to local government units have been
made despite the development since the Decentralization Act of 1999. The Act specifies which functions are to be decentralized to local governments. Since the central framework is still evolving, expenditure responsibility assignments for each level of government are not clearly stated and often misunderstood. Thus, public awareness is limited. Local governments have limited authority to set priorities and make expenditure allocation decisions. Local budgets must still be approved by the provincial governor (or district council), and central agencies monitor spending financed by general and specific subsidies. Most of the central government’s transfers are tied to specific functions/programs, thereby restricting local government’s autonomy. Beginning in FY03, most subsidies are in the form of sectoral block grants, which allow local governments more flexibility than the current subsidy structure. It is also expected that before FY2006, tax sharing arrangements will be more suitable and that local governments will have more authority. Despite current limited authority on expenditure allocation among local government units, local governments have a reasonable degree of autonomy in designing service delivery. Several of the central agencies consulted indicated that local governments are fairly free to deliver the services in the manner deemed most appropriate and cost effective. Contracting out, for example, is occurring. National laws and regulations, however, still set ceilings on user fees, thereby restricting local governments’ ability to recover costs associated with certain services.
2.2 Revenue Assignment The bluntest part of the Decentralization Act of 1999 is perhaps its financial
decentralization benchmarks. It mandates that local revenues shall be at least 20% and 35% of the government’s total revenue in the fiscal years of 2001 and 2006, respectively.
How has the government coped with the mandate of increasing local share of revenues? As local sources of revenues were limited, Thai government employed two immediate measures to stimulate local revenues: (1) shifting some tax bases from national to local authorities, and (2) increasing local grants. Shifting tax bases had been implemented in two dimensions. First, some national tax bases has been shifted to local, namely mineral resource tax, land registration fees, gambling tax, groundwater fees, and swallow nest tax. National agencies collect most of these taxes and transfer revenues to local authorities afterward. However, as these taxes are not very productive in generating revenues, the measure does not have significant impacts on share of local revenues. The second dimension is to increase share of local government in two prominent share taxes: value-added tax and excise taxes. This results in dramatic jump in local revenues. As illustrated in Table 5, local revenue sharing from value added tax has been significantly increased since 2001.
Fiscal Decentralization: the Case of Thailand
Sutapa Amornvivat, PhD Page 7 15 Feb. 04
Local governments have inadequate authority to levy taxes and impose fees. The Act details the revenue sources and applicable ceilings, if any, for local governments, but local administrations’ ability to set their own tax rates and user fees is still quite limited at present. The Office of National Decentralization Committee has approved various local tax reforms; the property tax and the land and construction tax will be reformed to become a broad-based property tax.
2.3 Intergovernmental Transfers Intergovernmental transfers in Thai context include grants and shared revenue. As
mentioned earlier, the shared revenue—generated from value added tax and excise taxes—constitutes a large portion of local revenues. However, both types of these intergovernmental transfers are not determined objectively and openly.
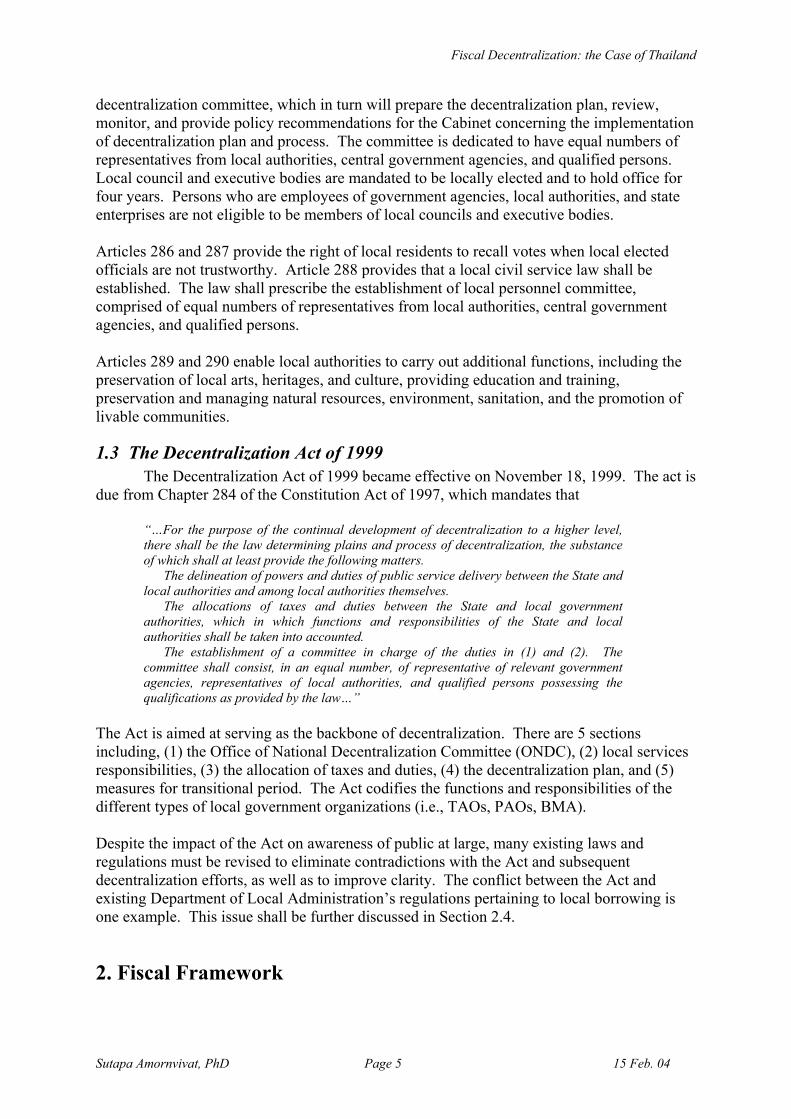
Most grants are distributed in an ad hoc and highly politicized manner. Proposals incorporating more formula-based transfers and revised tax sharing arrangements are currently being considered. Such changes would greatly enhance transparency and predictability of grants and shared revenues, which represent more than 80 percent of local revenues. Allocation formulae for shared revenues are also quite arbitrary. Per capita allocations are commonly used, but may be too simple in that they do not reflect revenue capacity or expenditure need. Furthermore, current allocation formulae are based on outdated socioeconomic and demographic data. The intergovernmental transfer system is evolving along with the process of decentralization. Before FY01, the central government relied on the general and specific grants. During a transition period, “subsidies with transfer of responsibility” were introduced to allow the government to decentralize according to the pace of local capacity building. In FY03, “sectoral block subsidies” replaced these subsidies. 2000 2001 2002 2003 2004 General and Specific Grants Subsidies with Transfer of Responsibility Sectoral Block Subsidies Source : The Fiscal Policy Office, Ministry of Finance
• General grants are distributed to local administrations based on indicators that are proxies for local government expenditure needs and revenue capacities; these grants are administered by the Department of Local Administration. 2
• Specific grants must be spent on specific purposes (e.g., infrastructure); these grants are also administered by the Department of Local Administration.
• Subsidies with transfer of responsibility are allocated only to TAOs. These subsidies were used in FY01 and FY02 to aid the transition from central to local service delivery, and to meet the 20 percent target. An amount is set aside for each local government for specific purposes. Local governments must submit a plan before the funds can be disbursed. These subsidies are administered by various agencies.
2 Indicators include number of students, elderly, villages, and population, and local revenue.
Fiscal Decentralization: the Case of Thailand
Sutapa Amornvivat, PhD Page 8 15 Feb. 04
• Sectoral block subsidies started in FY03. These subsidies specify the sector on which the funds should be spent, while granting local administrations more autonomy than the two grants listed above.
2.4 Local Government Borrowing Municipalities and tambons (sub-districts) are permitted to borrow under Article 28 of
the Act. The Act, however, contradicts existing Department of Local Administration’s regulations, which only permit municipalities to borrow with the governor’s concurrence. Regulatory changes are, therefore, necessary. The law and regulations should also be made consistent with the Public Debt Management Act currently being considered by the Parliament.
2.5 Accountability Mechanism The lack of understanding with regard to fiscal decentralization within the
government is the result of weak dissemination of information. However, the public can easily access data on central and local resource allocations. General budget information is available in paper form and through the internet, while the availability of detailed data is limited. By law, local budget information must be made publicly available, but actual public disclosure is still limited. In addition, the significant lag (approximately 18 months) in local financial data limits their usefulness. As a result, only keenly interested individuals and groups tend to know where and how to obtain resource allocation information. Thus, the accountability mechanism has yet to fully develop.
2.6 Monitoring and Evaluation To date, the performance of local government has not been monitored with regards to
outcomes. While very little outcome data is currently collected, the performance budget reform underway at the national level will encourage more outcome/impact-oriented budgeting on the local level. Regular and fair elections are held on the local level; the terms of office are reasonable. Locally elected officials hold office for a period of four years according to Section IX, Article 284 of Thailand's constitution. Politicians are able to serve more than one term. Although local council members are elected, provincial administration is essentially an extension of the central government as the governor is appointed by the Ministry of Interior. Each local administration must report to the provincial governor or district chief. Increasing citizen participation is a major aim of decentralization. Citizen involvement in local public decision-making is growing in Thailand. Newspaper editorials and public demonstrations reflect the strength of the free press and free speech. Public hearings and civic fora are becoming increasingly common to solicit public opinions and feedbacks on specific projects. For example, projects must be presented at civic fora before funding from the Rural Development Fund can be approved. Public participation in local resource allocation (i.e., annual budgets), however, is still limited. But, in future, civic participation is expected to increase at the local level.
Fiscal Decentralization: the Case of Thailand
Sutapa Amornvivat, PhD Page 9 15 Feb. 04
3. Current Condition This section captures the current implementation of fiscal decentralization. The discussion is divided into 4 topics: efficiency, capacity, autonomy, and adequacy. The first topic encompasses growth of local public spending, development of services being transferred and efficiency of local expenditure aspect. Secondly, absorptive capacity of local revenues is analysed. The third topic discusses local autonomy on both revenue and expenditure assignment. The last topic analyzes the adequacy of fiscal revenue with regard to the expenditure and the impact of fiscal decentralization process on equitability among local governments and in comparison with the central government.
3.1 Efficiency
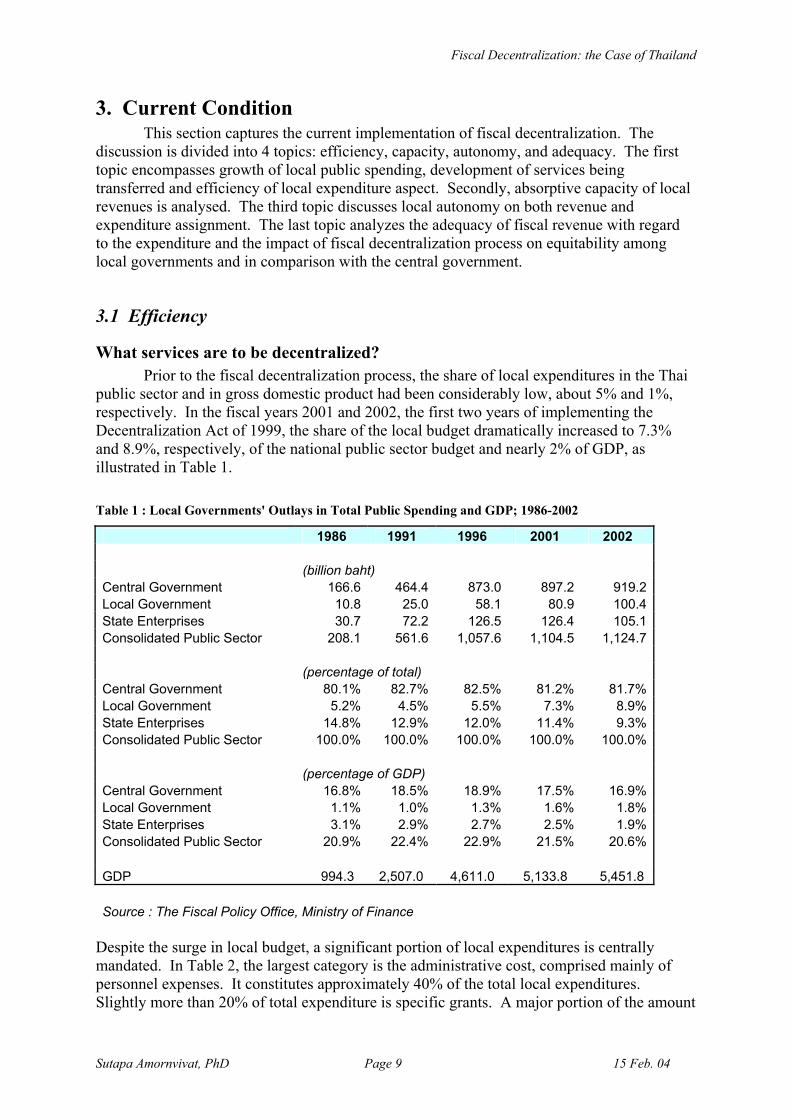
What services are to be decentralized? Prior to the fiscal decentralization process, the share of local expenditures in the Thai
public sector and in gross domestic product had been considerably low, about 5% and 1%, respectively. In the fiscal years 2001 and 2002, the first two years of implementing the Decentralization Act of 1999, the share of the local budget dramatically increased to 7.3% and 8.9%, respectively, of the national public sector budget and nearly 2% of GDP, as illustrated in Table 1. Table 1 : Local Governments' Outlays in Total Public Spending and GDP; 1986-2002
1986 1991 1996 2001 2002 (billion baht) Central Government 166.6 464.4 873.0 897.2 919.2 Local Government 10.8 25.0 58.1 80.9 100.4 State Enterprises 30.7 72.2 126.5 126.4 105.1 Consolidated Public Sector 208.1 561.6 1,057.6 1,104.5 1,124.7 (percentage of total) Central Government 80.1% 82.7% 82.5% 81.2% 81.7% Local Government 5.2% 4.5% 5.5% 7.3% 8.9% State Enterprises 14.8% 12.9% 12.0% 11.4% 9.3% Consolidated Public Sector 100.0% 100.0% 100.0% 100.0% 100.0% (percentage of GDP) Central Government 16.8% 18.5% 18.9% 17.5% 16.9% Local Government 1.1% 1.0% 1.3% 1.6% 1.8% State Enterprises 3.1% 2.9% 2.7% 2.5% 1.9% Consolidated Public Sector 20.9% 22.4% 22.9% 21.5% 20.6% GDP 994.3 2,507.0 4,611.0 5,133.8 5,451.8 Source : The Fiscal Policy Office, Ministry of Finance
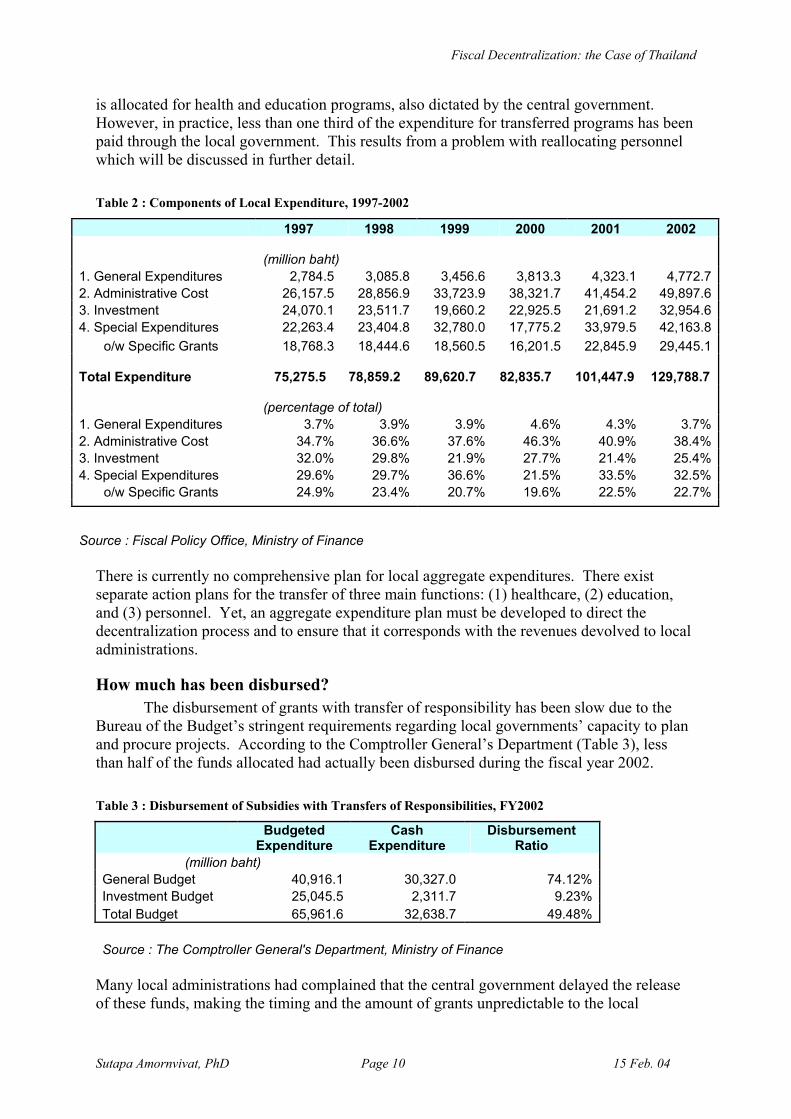
Despite the surge in local budget, a significant portion of local expenditures is centrally mandated. In Table 2, the largest category is the administrative cost, comprised mainly of personnel expenses. It constitutes approximately 40% of the total local expenditures. Slightly more than 20% of total expenditure is specific grants. A major portion of the amount
Fiscal Decentralization: the Case of Thailand
Sutapa Amornvivat, PhD Page 10 15 Feb. 04
is allocated for health and education programs, also dictated by the central government. However, in practice, less than one third of the expenditure for transferred programs has been paid through the local government. This results from a problem with reallocating personnel which will be discussed in further detail. Table 2 : Components of Local Expenditure, 1997-2002
1997 1998 1999 2000 2001 2002
(million baht)
1. General Expenditures 2,784.5 3,085.8 3,456.6 3,813.3 4,323.1 4,772.7 2. Administrative Cost 26,157.5 28,856.9 33,723.9 38,321.7 41,454.2 49,897.6 3. Investment 24,070.1 23,511.7 19,660.2 22,925.5 21,691.2 32,954.6 4. Special Expenditures 22,263.4 23,404.8 32,780.0 17,775.2 33,979.5 42,163.8
o/w Specific Grants 18,768.3 18,444.6 18,560.5 16,201.5 22,845.9 29,445.1
Total Expenditure 75,275.5 78,859.2
89,620.7
82,835.7
101,447.9
129,788.7
(percentage of total)
1. General Expenditures 3.7% 3.9% 3.9% 4.6% 4.3% 3.7%2. Administrative Cost 34.7% 36.6% 37.6% 46.3% 40.9% 38.4%3. Investment 32.0% 29.8% 21.9% 27.7% 21.4% 25.4%4. Special Expenditures 29.6% 29.7% 36.6% 21.5% 33.5% 32.5%
o/w Specific Grants 24.9% 23.4% 20.7% 19.6% 22.5% 22.7%
Source : Fiscal Policy Office, Ministry of Finance There is currently no comprehensive plan for local aggregate expenditures. There exist separate action plans for the transfer of three main functions: (1) healthcare, (2) education, and (3) personnel. Yet, an aggregate expenditure plan must be developed to direct the decentralization process and to ensure that it corresponds with the revenues devolved to local administrations.
How much has been disbursed? The disbursement of grants with transfer of responsibility has been slow due to the
Bureau of the Budget’s stringent requirements regarding local governments’ capacity to plan and procure projects. According to the Comptroller General’s Department (Table 3), less than half of the funds allocated had actually been disbursed during the fiscal year 2002.
Table 3 : Disbursement of Subsidies with Transfers of Responsibilities, FY2002
Budgeted Expenditure
Cash Expenditure
Disbursement Ratio
(million baht) General Budget 40,916.1 30,327.0 74.12% Investment Budget 25,045.5 2,311.7 9.23% Total Budget 65,961.6 32,638.7 49.48% Source : The Comptroller General's Department, Ministry of Finance
Many local administrations had complained that the central government delayed the release of these funds, making the timing and the amount of grants unpredictable to the local
Fiscal Decentralization: the Case of Thailand
Sutapa Amornvivat, PhD Page 11 15 Feb. 04
governments. Consequently a majority of planned projects could not be disbursed by the end of the fiscal years. Some of the problems with the budget in the past have been solved, and disbursements are expected to be faster and smoother in FY03.
3.2 Capacity
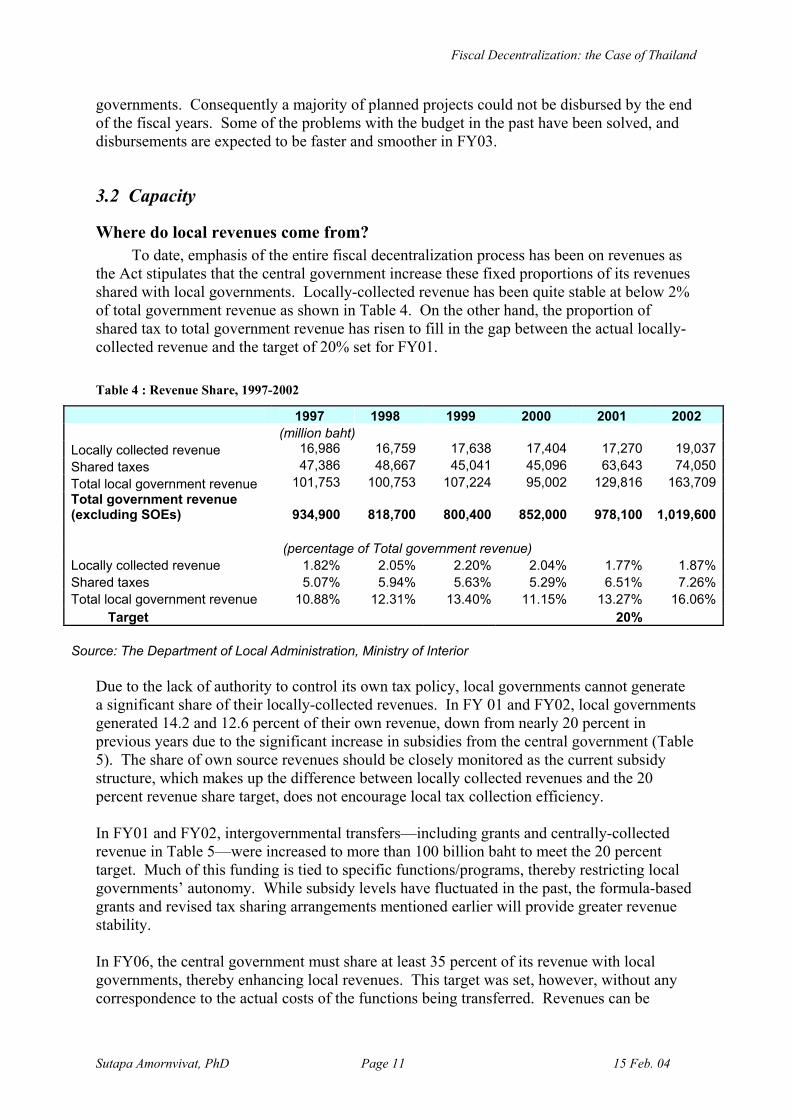
Where do local revenues come from? To date, emphasis of the entire fiscal decentralization process has been on revenues as
the Act stipulates that the central government increase these fixed proportions of its revenues shared with local governments. Locally-collected revenue has been quite stable at below 2% of total government revenue as shown in Table 4. On the other hand, the proportion of shared tax to total government revenue has risen to fill in the gap between the actual locally-collected revenue and the target of 20% set for FY01.
Table 4 : Revenue Share, 1997-2002
1997 1998 1999 2000 2001 2002 (million baht) Locally collected revenue 16,986 16,759 17,638 17,404 17,270 19,037 Shared taxes 47,386 48,667 45,041 45,096 63,643 74,050 Total local government revenue 101,753 100,753 107,224 95,002 129,816 163,709 Total government revenue (excluding SOEs)
934,900
818,700
800,400
852,000
978,100
1,019,600
(percentage of Total government revenue) Locally collected revenue 1.82% 2.05% 2.20% 2.04% 1.77% 1.87%Shared taxes 5.07% 5.94% 5.63% 5.29% 6.51% 7.26%Total local government revenue 10.88% 12.31% 13.40% 11.15% 13.27% 16.06% Target 20% Source: The Department of Local Administration, Ministry of Interior
Due to the lack of authority to control its own tax policy, local governments cannot generate a significant share of their locally-collected revenues. In FY 01 and FY02, local governments generated 14.2 and 12.6 percent of their own revenue, down from nearly 20 percent in previous years due to the significant increase in subsidies from the central government (Table 5). The share of own source revenues should be closely monitored as the current subsidy structure, which makes up the difference between locally collected revenues and the 20 percent revenue share target, does not encourage local tax collection efficiency. In FY01 and FY02, intergovernmental transfers—including grants and centrally-collected revenue in Table 5—were increased to more than 100 billion baht to meet the 20 percent target. Much of this funding is tied to specific functions/programs, thereby restricting local governments’ autonomy. While subsidy levels have fluctuated in the past, the formula-based grants and revised tax sharing arrangements mentioned earlier will provide greater revenue stability. In FY06, the central government must share at least 35 percent of its revenue with local governments, thereby enhancing local revenues. This target was set, however, without any correspondence to the actual costs of the functions being transferred. Revenues can be
Fiscal Decentralization: the Case of Thailand
Sutapa Amornvivat, PhD Page 12 15 Feb. 04
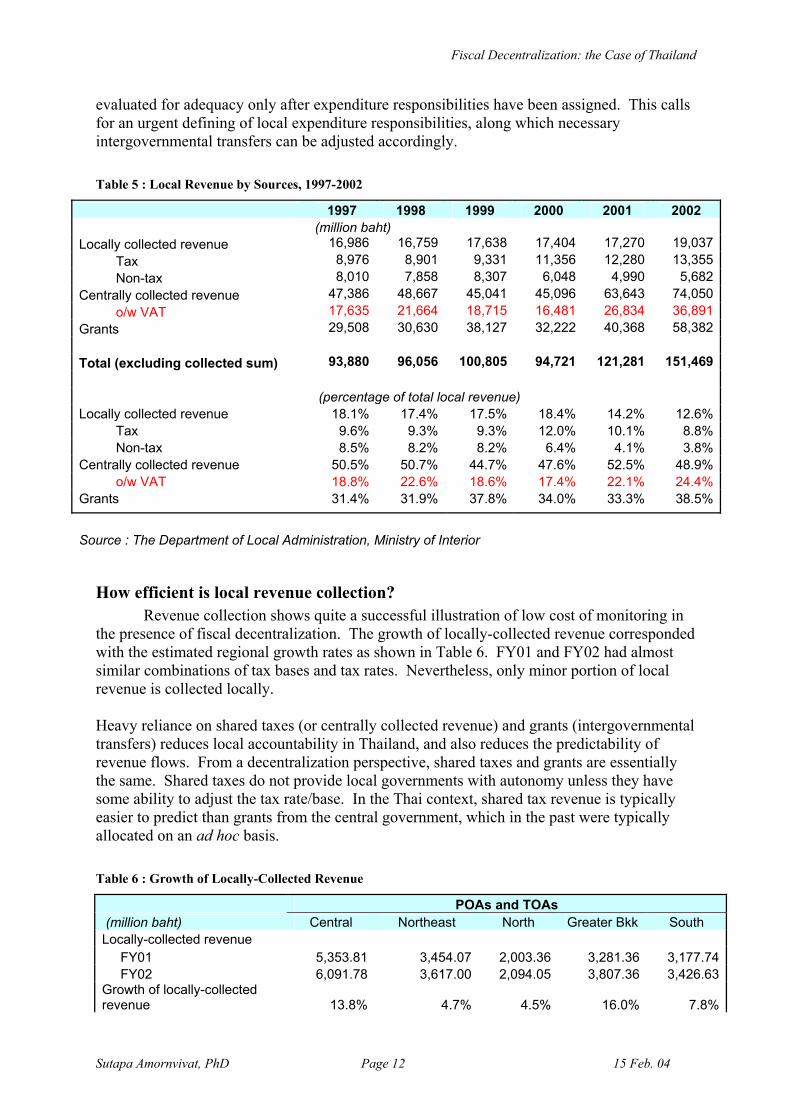
evaluated for adequacy only after expenditure responsibilities have been assigned. This calls for an urgent defining of local expenditure responsibilities, along which necessary intergovernmental transfers can be adjusted accordingly. Table 5 : Local Revenue by Sources, 1997-2002
1997 1998 1999 2000 2001 2002 (million baht) Locally collected revenue 16,986 16,759 17,638 17,404 17,270 19,037 Tax 8,976 8,901 9,331 11,356 12,280 13,355 Non-tax 8,010 7,858 8,307 6,048 4,990 5,682 Centrally collected revenue 47,386 48,667 45,041 45,096 63,643 74,050 o/w VAT 17,635 21,664 18,715 16,481 26,834 36,891Grants 29,508 30,630 38,127 32,222 40,368 58,382 Total (excluding collected sum) 93,880 96,056 100,805 94,721 121,281 151,469 (percentage of total local revenue) Locally collected revenue 18.1% 17.4% 17.5% 18.4% 14.2% 12.6% Tax 9.6% 9.3% 9.3% 12.0% 10.1% 8.8% Non-tax 8.5% 8.2% 8.2% 6.4% 4.1% 3.8%Centrally collected revenue 50.5% 50.7% 44.7% 47.6% 52.5% 48.9% o/w VAT 18.8% 22.6% 18.6% 17.4% 22.1% 24.4%Grants 31.4% 31.9% 37.8% 34.0% 33.3% 38.5%
Source : The Department of Local Administration, Ministry of Interior
How efficient is local revenue collection? Revenue collection shows quite a successful illustration of low cost of monitoring in
the presence of fiscal decentralization. The growth of locally-collected revenue corresponded with the estimated regional growth rates as shown in Table 6. FY01 and FY02 had almost similar combinations of tax bases and tax rates. Nevertheless, only minor portion of local revenue is collected locally.
Heavy reliance on shared taxes (or centrally collected revenue) and grants (intergovernmental transfers) reduces local accountability in Thailand, and also reduces the predictability of revenue flows. From a decentralization perspective, shared taxes and grants are essentially the same. Shared taxes do not provide local governments with autonomy unless they have some ability to adjust the tax rate/base. In the Thai context, shared tax revenue is typically easier to predict than grants from the central government, which in the past were typically allocated on an ad hoc basis. Table 6 : Growth of Locally-Collected Revenue
POAs and TOAs (million baht) Central Northeast North Greater Bkk South Locally-collected revenue FY01 5,353.81 3,454.07 2,003.36 3,281.36 3,177.74 FY02 6,091.78 3,617.00 2,094.05 3,807.36 3,426.63 Growth of locally-collected revenue 13.8% 4.7% 4.5% 16.0% 7.8%
Fiscal Decentralization: the Case of Thailand
Sutapa Amornvivat, PhD Page 13 15 Feb. 04
POAs and TOAs (million baht) Central Northeast North Greater Bkk South Growth of regional economy 11.7% 6.0% 5.5% 14.6% 12.1% Source : The National Economic and Social Development Board
3.3 Autonomy
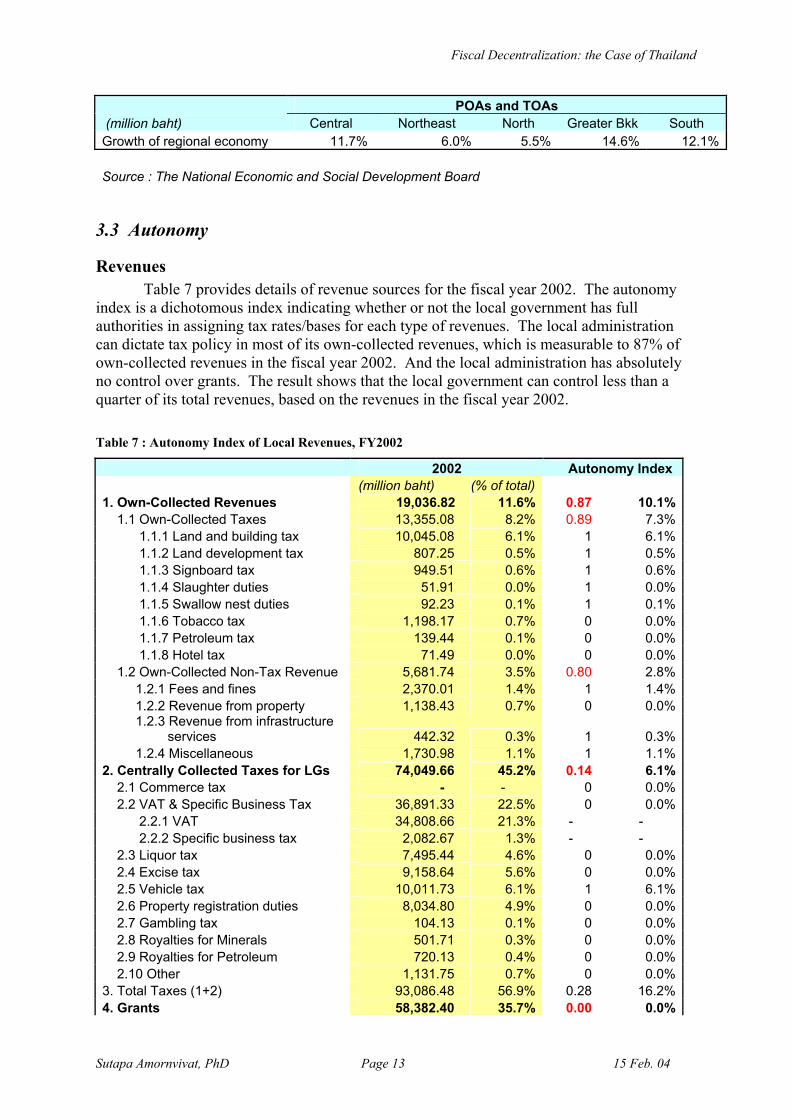
Revenues Table 7 provides details of revenue sources for the fiscal year 2002. The autonomy
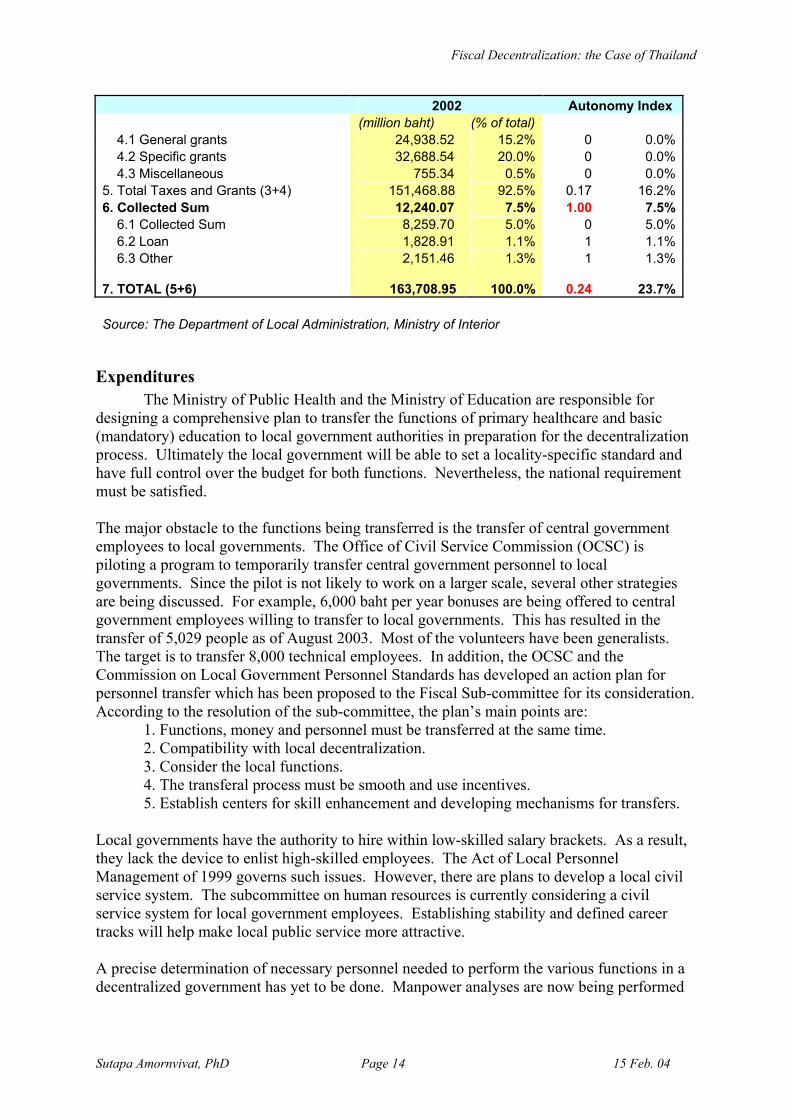
index is a dichotomous index indicating whether or not the local government has full authorities in assigning tax rates/bases for each type of revenues. The local administration can dictate tax policy in most of its own-collected revenues, which is measurable to 87% of own-collected revenues in the fiscal year 2002. And the local administration has absolutely no control over grants. The result shows that the local government can control less than a quarter of its total revenues, based on the revenues in the fiscal year 2002. Table 7 : Autonomy Index of Local Revenues, FY2002
2002 Autonomy Index (million baht) (% of total)
1. Own-Collected Revenues 19,036.82 11.6% 0.87 10.1% 1.1 Own-Collected Taxes 13,355.08 8.2% 0.89 7.3% 1.1.1 Land and building tax 10,045.08 6.1% 1 6.1% 1.1.2 Land development tax 807.25 0.5% 1 0.5% 1.1.3 Signboard tax 949.51 0.6% 1 0.6% 1.1.4 Slaughter duties 51.91 0.0% 1 0.0% 1.1.5 Swallow nest duties 92.23 0.1% 1 0.1% 1.1.6 Tobacco tax 1,198.17 0.7% 0 0.0% 1.1.7 Petroleum tax 139.44 0.1% 0 0.0% 1.1.8 Hotel tax 71.49 0.0% 0 0.0% 1.2 Own-Collected Non-Tax Revenue 5,681.74 3.5% 0.80 2.8% 1.2.1 Fees and fines 2,370.01 1.4% 1 1.4% 1.2.2 Revenue from property 1,138.43 0.7% 0 0.0% 1.2.3 Revenue from infrastructure
services 442.32 0.3% 1 0.3% 1.2.4 Miscellaneous 1,730.98 1.1% 1 1.1%2. Centrally Collected Taxes for LGs 74,049.66 45.2% 0.14 6.1% 2.1 Commerce tax - - 0 0.0% 2.2 VAT & Specific Business Tax 36,891.33 22.5% 0 0.0% 2.2.1 VAT 34,808.66 21.3% - - 2.2.2 Specific business tax 2,082.67 1.3% - - 2.3 Liquor tax 7,495.44 4.6% 0 0.0% 2.4 Excise tax 9,158.64 5.6% 0 0.0% 2.5 Vehicle tax 10,011.73 6.1% 1 6.1% 2.6 Property registration duties 8,034.80 4.9% 0 0.0% 2.7 Gambling tax 104.13 0.1% 0 0.0% 2.8 Royalties for Minerals 501.71 0.3% 0 0.0% 2.9 Royalties for Petroleum 720.13 0.4% 0 0.0% 2.10 Other 1,131.75 0.7% 0 0.0%3. Total Taxes (1+2) 93,086.48 56.9% 0.28 16.2%4. Grants 58,382.40 35.7% 0.00 0.0%
Fiscal Decentralization: the Case of Thailand
Sutapa Amornvivat, PhD Page 14 15 Feb. 04
2002 Autonomy Index (million baht) (% of total)
4.1 General grants 24,938.52 15.2% 0 0.0% 4.2 Specific grants 32,688.54 20.0% 0 0.0% 4.3 Miscellaneous 755.34 0.5% 0 0.0%5. Total Taxes and Grants (3+4) 151,468.88 92.5% 0.17 16.2%6. Collected Sum 12,240.07 7.5% 1.00 7.5% 6.1 Collected Sum 8,259.70 5.0% 0 5.0% 6.2 Loan 1,828.91 1.1% 1 1.1% 6.3 Other 2,151.46 1.3% 1 1.3%
7. TOTAL (5+6)
163,708.95 100.0% 0.24 23.7% Source: The Department of Local Administration, Ministry of Interior
Expenditures The Ministry of Public Health and the Ministry of Education are responsible for
designing a comprehensive plan to transfer the functions of primary healthcare and basic (mandatory) education to local government authorities in preparation for the decentralization process. Ultimately the local government will be able to set a locality-specific standard and have full control over the budget for both functions. Nevertheless, the national requirement must be satisfied. The major obstacle to the functions being transferred is the transfer of central government employees to local governments. The Office of Civil Service Commission (OCSC) is piloting a program to temporarily transfer central government personnel to local governments. Since the pilot is not likely to work on a larger scale, several other strategies are being discussed. For example, 6,000 baht per year bonuses are being offered to central government employees willing to transfer to local governments. This has resulted in the transfer of 5,029 people as of August 2003. Most of the volunteers have been generalists. The target is to transfer 8,000 technical employees. In addition, the OCSC and the Commission on Local Government Personnel Standards has developed an action plan for personnel transfer which has been proposed to the Fiscal Sub-committee for its consideration. According to the resolution of the sub-committee, the plan’s main points are:
1. Functions, money and personnel must be transferred at the same time. 2. Compatibility with local decentralization. 3. Consider the local functions. 4. The transferal process must be smooth and use incentives. 5. Establish centers for skill enhancement and developing mechanisms for transfers.
Local governments have the authority to hire within low-skilled salary brackets. As a result, they lack the device to enlist high-skilled employees. The Act of Local Personnel Management of 1999 governs such issues. However, there are plans to develop a local civil service system. The subcommittee on human resources is currently considering a civil service system for local government employees. Establishing stability and defined career tracks will help make local public service more attractive. A precise determination of necessary personnel needed to perform the various functions in a decentralized government has yet to be done. Manpower analyses are now being performed
Fiscal Decentralization: the Case of Thailand
Sutapa Amornvivat, PhD Page 15 15 Feb. 04
by the Ministry of Interior to determine what skills and personnel will be needed by the local governments to function in their new roles. Local government personnel have received little training on how to manage and operate in their new roles. The Department of Local Administration and a variety of other agencies do offer training, but the classroom approach and the generality of many of the courses do not promote the development of the technical capacities needed. At present, there is no coordinated plan or system to build the capacity of local governments.
3.4 Adequacy
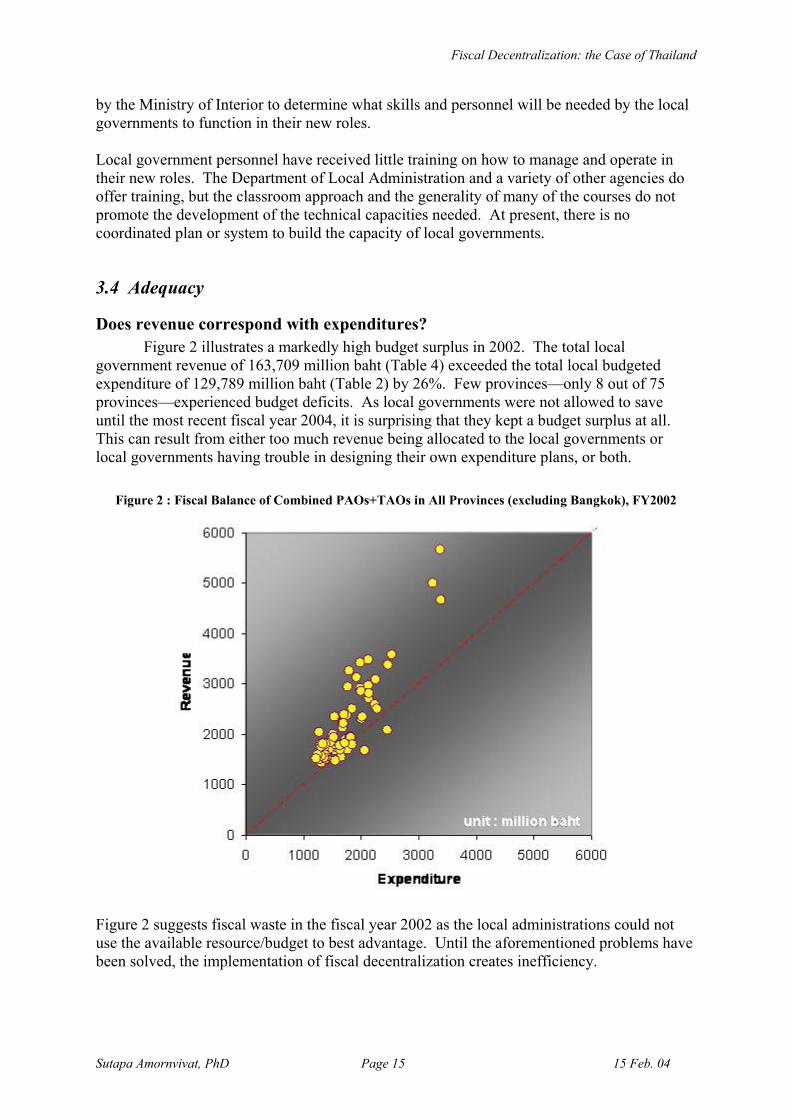
Does revenue correspond with expenditures? Figure 2 illustrates a markedly high budget surplus in 2002. The total local
government revenue of 163,709 million baht (Table 4) exceeded the total local budgeted expenditure of 129,789 million baht (Table 2) by 26%. Few provinces—only 8 out of 75 provinces—experienced budget deficits. As local governments were not allowed to save until the most recent fiscal year 2004, it is surprising that they kept a budget surplus at all. This can result from either too much revenue being allocated to the local governments or local governments having trouble in designing their own expenditure plans, or both.
Figure 2 : Fiscal Balance of Combined PAOs+TAOs in All Provinces (excluding Bangkok), FY2002
Figure 2 suggests fiscal waste in the fiscal year 2002 as the local administrations could not use the available resource/budget to best advantage. Until the aforementioned problems have been solved, the implementation of fiscal decentralization creates inefficiency.
Fiscal Decentralization: the Case of Thailand
Sutapa Amornvivat, PhD Page 16 15 Feb. 04
Even if there currently is a fiscal surplus, it is likely that local governments may experience insufficient funding once all functions of mandated service delivery have been fully transferred to local responsibilities in the near future. Local government will go through a learning period where service delivery costs outbalance those of central provision. The risks of higher expenditures or lower service levels should be identified and managed. The local governments are allowed to save since FY04; these fiscal surpluses can help smooth future expenditure hikes.
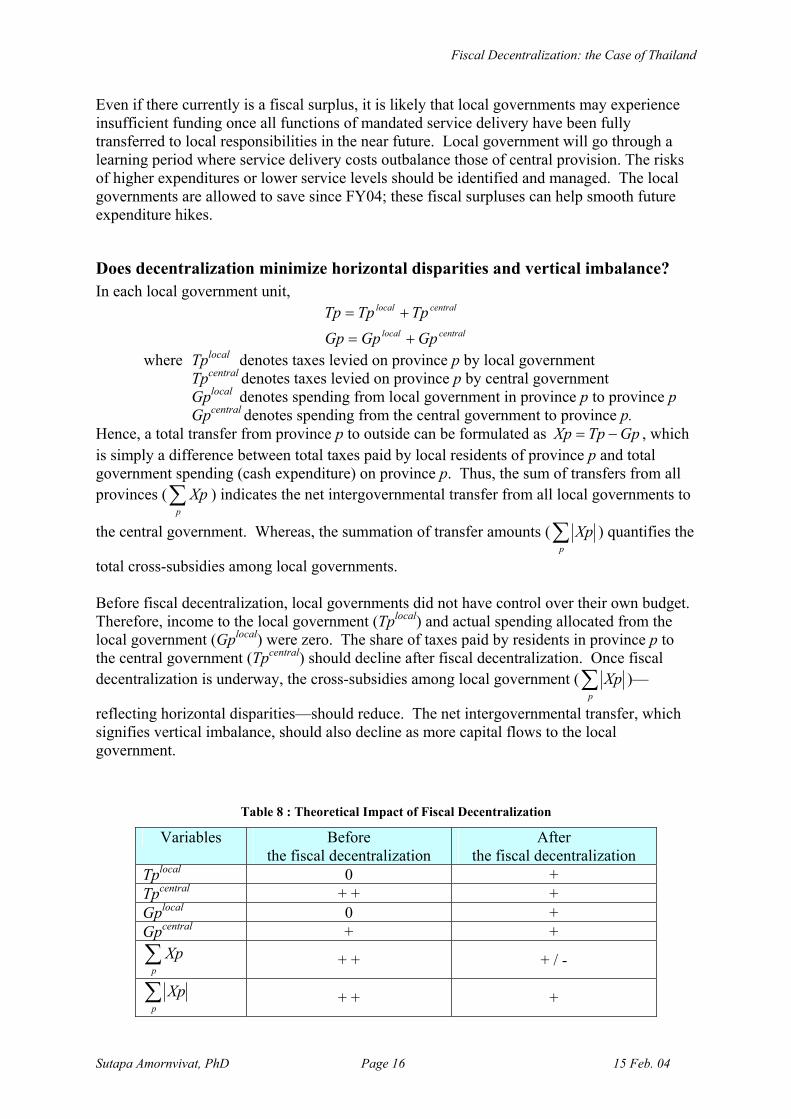
Does decentralization minimize horizontal disparities and vertical imbalance? In each local government unit,
centrallocal
centrallocal
GpGpGpTpTpTp+=
+=
where Tplocal denotes taxes levied on province p by local government Tpcentral denotes taxes levied on province p by central government Gplocal denotes spending from local government in province p to province p Gpcentral denotes spending from the central government to province p. Hence, a total transfer from province p to outside can be formulated as GpTpXp −= , which is simply a difference between total taxes paid by local residents of province p and total government spending (cash expenditure) on province p. Thus, the sum of transfers from all provinces (∑
p
Xp ) indicates the net intergovernmental transfer from all local governments to
the central government. Whereas, the summation of transfer amounts (∑p
Xp ) quantifies the
total cross-subsidies among local governments. Before fiscal decentralization, local governments did not have control over their own budget. Therefore, income to the local government (Tplocal) and actual spending allocated from the local government (Gplocal) were zero. The share of taxes paid by residents in province p to the central government (Tpcentral) should decline after fiscal decentralization. Once fiscal decentralization is underway, the cross-subsidies among local government (∑
pXp )—
reflecting horizontal disparities—should reduce. The net intergovernmental transfer, which signifies vertical imbalance, should also decline as more capital flows to the local government.
Table 8 : Theoretical Impact of Fiscal Decentralization
Variables Before the fiscal decentralization
After the fiscal decentralization
Tplocal 0 + Tpcentral + + + Gplocal 0 + Gpcentral + + ∑
pXp + + + / -
∑p
Xp + + +
Fiscal Decentralization: the Case of Thailand
Sutapa Amornvivat, PhD Page 17 15 Feb. 04
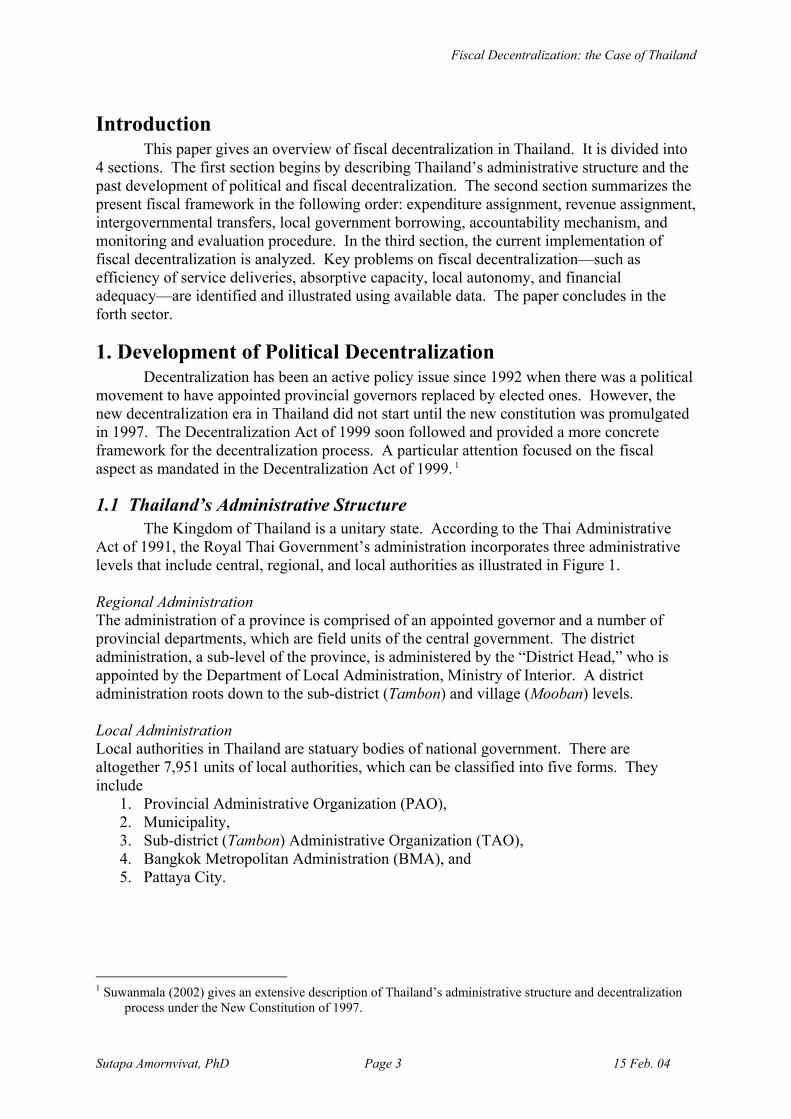
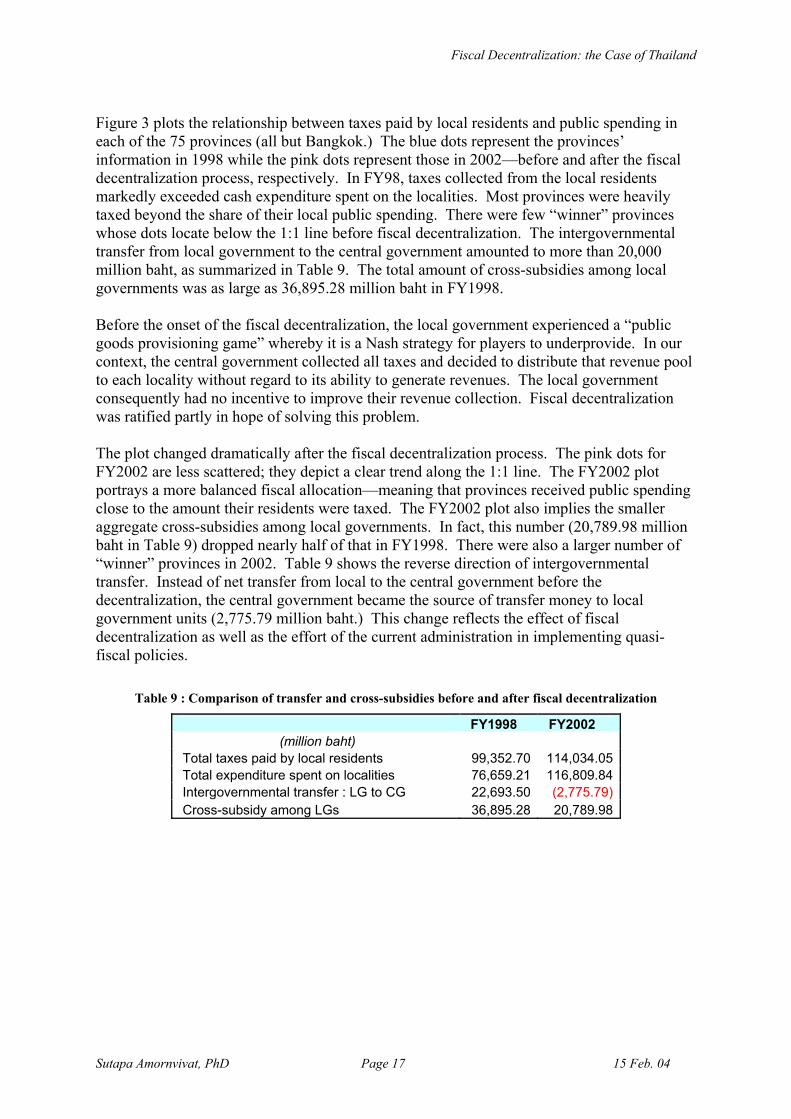
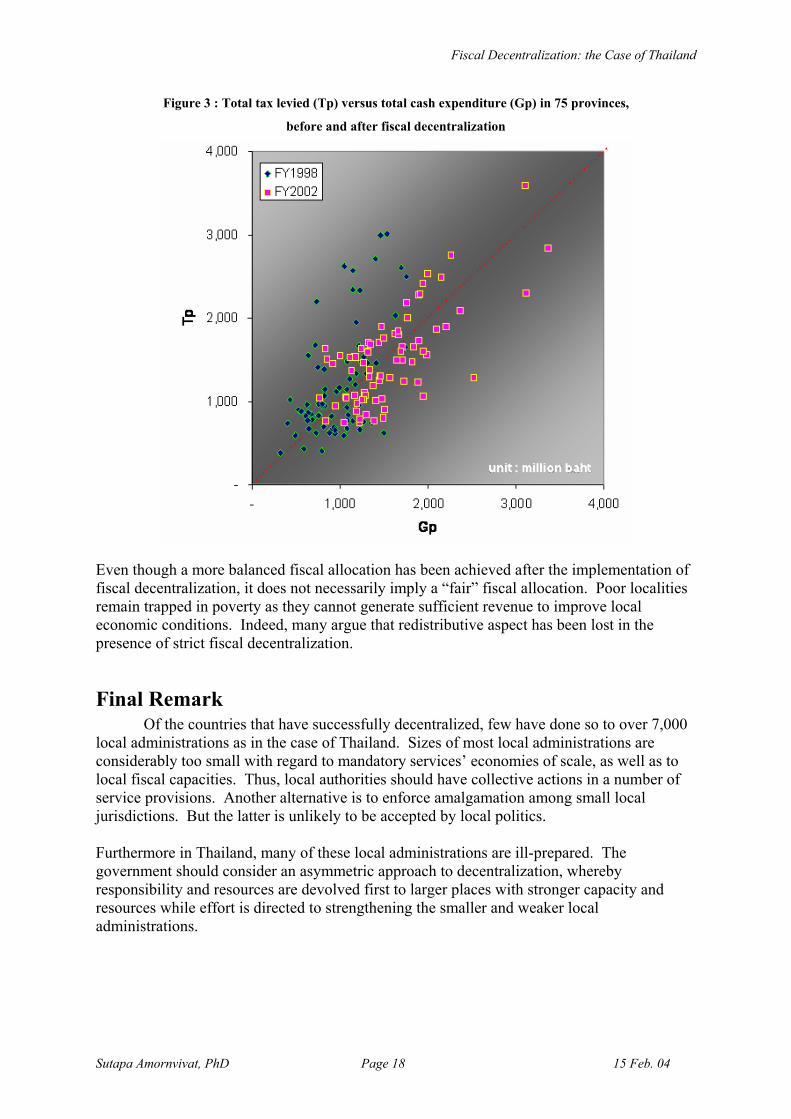
Figure 3 plots the relationship between taxes paid by local residents and public spending in each of the 75 provinces (all but Bangkok.) The blue dots represent the provinces’ information in 1998 while the pink dots represent those in 2002—before and after the fiscal decentralization process, respectively. In FY98, taxes collected from the local residents markedly exceeded cash expenditure spent on the localities. Most provinces were heavily taxed beyond the share of their local public spending. There were few “winner” provinces whose dots locate below the 1:1 line before fiscal decentralization. The intergovernmental transfer from local government to the central government amounted to more than 20,000 million baht, as summarized in Table 9. The total amount of cross-subsidies among local governments was as large as 36,895.28 million baht in FY1998. Before the onset of the fiscal decentralization, the local government experienced a “public goods provisioning game” whereby it is a Nash strategy for players to underprovide. In our context, the central government collected all taxes and decided to distribute that revenue pool to each locality without regard to its ability to generate revenues. The local government consequently had no incentive to improve their revenue collection. Fiscal decentralization was ratified partly in hope of solving this problem. The plot changed dramatically after the fiscal decentralization process. The pink dots for FY2002 are less scattered; they depict a clear trend along the 1:1 line. The FY2002 plot portrays a more balanced fiscal allocation—meaning that provinces received public spending close to the amount their residents were taxed. The FY2002 plot also implies the smaller aggregate cross-subsidies among local governments. In fact, this number (20,789.98 million baht in Table 9) dropped nearly half of that in FY1998. There were also a larger number of “winner” provinces in 2002. Table 9 shows the reverse direction of intergovernmental transfer. Instead of net transfer from local to the central government before the decentralization, the central government became the source of transfer money to local government units (2,775.79 million baht.) This change reflects the effect of fiscal decentralization as well as the effort of the current administration in implementing quasi-fiscal policies.
Table 9 : Comparison of transfer and cross-subsidies before and after fiscal decentralization
FY1998 FY2002 (million baht)
Total taxes paid by local residents 99,352.70 114,034.05 Total expenditure spent on localities 76,659.21 116,809.84 Intergovernmental transfer : LG to CG 22,693.50 (2,775.79) Cross-subsidy among LGs 36,895.28 20,789.98
Fiscal Decentralization: the Case of Thailand
Sutapa Amornvivat, PhD Page 18 15 Feb. 04
Figure 3 : Total tax levied (Tp) versus total cash expenditure (Gp) in 75 provinces,
before and after fiscal decentralization
Even though a more balanced fiscal allocation has been achieved after the implementation of fiscal decentralization, it does not necessarily imply a “fair” fiscal allocation. Poor localities remain trapped in poverty as they cannot generate sufficient revenue to improve local economic conditions. Indeed, many argue that redistributive aspect has been lost in the presence of strict fiscal decentralization.
Final Remark Of the countries that have successfully decentralized, few have done so to over 7,000 local administrations as in the case of Thailand. Sizes of most local administrations are considerably too small with regard to mandatory services’ economies of scale, as well as to local fiscal capacities. Thus, local authorities should have collective actions in a number of service provisions. Another alternative is to enforce amalgamation among small local jurisdictions. But the latter is unlikely to be accepted by local politics. Furthermore in Thailand, many of these local administrations are ill-prepared. The government should consider an asymmetric approach to decentralization, whereby responsibility and resources are devolved first to larger places with stronger capacity and resources while effort is directed to strengthening the smaller and weaker local administrations.
Fiscal Decentralization: the Case of Thailand
Sutapa Amornvivat, PhD Page 19 15 Feb. 04
Reference The Bureau of the Budget, “Disbursements of Functional Decentralization Fund, FY 2002,”
An unpublished document, 2002. The Constitution of Thai Kingdom, BA 2540 (1997). The Decentralization Act of 1999. Ministry of Finance, Thailand. Fiscal Report of 2003. Fiscal Policy Office. Suwanmala, Charas. "Fiscal Decentralization in Thailand," presented at EAP Staff Learning
Course on Intergovernmental Fiscal Relations and Local Financial Management Decentralization and Intergovernmental Fiscal Relations in East Asia, 6-8 June, 2002. Bangkok, Thailand
Weist, Dana. "Thailand's Decentralization: Progress and Prospects," prepared for the KPI Annual Congress III on Decentralization and Local Government in Thailand, November 2001.