Embed Size (px)
DESCRIPTION
Fisiología Integral de la Obesidad: Obesidad y Diabetes. Dario C. Ramirez Laboratorio de Medicina Experimental y Terapéuticas Cátedra de Genética Molecular Facebook : Dario C Ramirez E-mail: [email protected]. Obesidad: definición, etiología y prevalencia. - PowerPoint PPT Presentation
Citation preview
Fisiología Integral de la Obesidad: Obesidad y
Diabetes
Dario C. RamirezLaboratorio de Medicina Experimental y Terapéuticas
Cátedra de Genética Molecular
Facebook: Dario C RamirezE-mail: [email protected]
Obesidad: definición, etiología y prevalencia
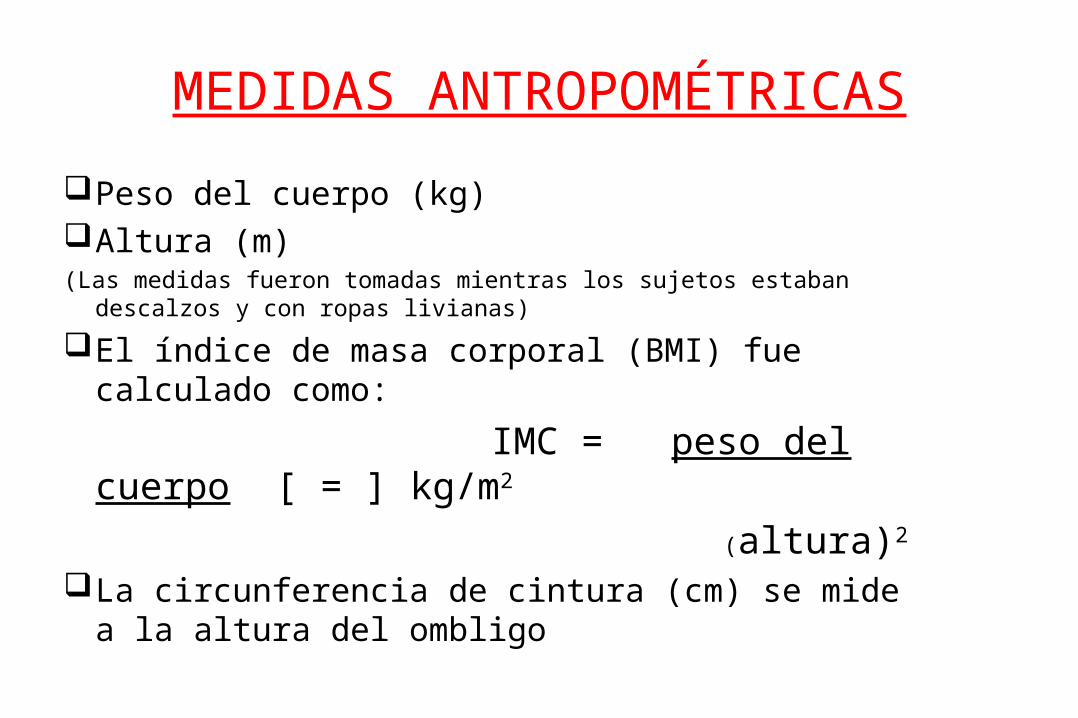
MEDIDAS ANTROPOMÉTRICAS
Peso del cuerpo (kg)Altura (m)(Las medidas fueron tomadas mientras los sujetos estaban descalzos y con ropas
livianas)
El índice de masa corporal (BMI) fue calculado como:
IMC = peso del cuerpo [ = ] kg/m2
(altura)2
La circunferencia de cintura (cm) se mide a la altura del ombligo
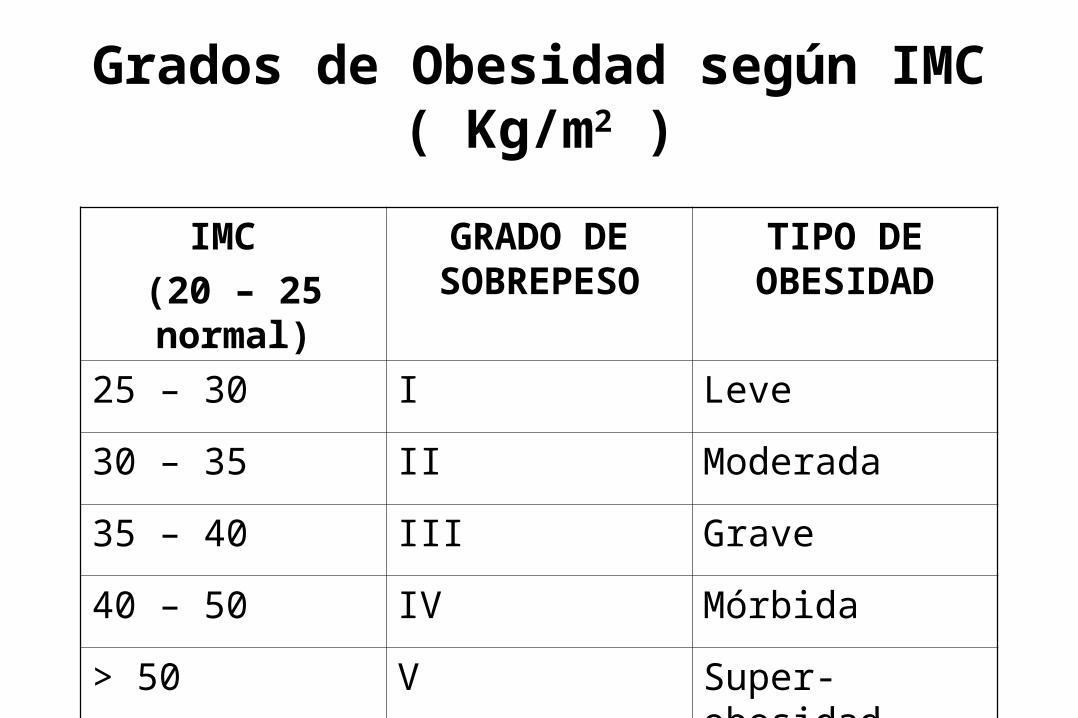
Grados de Obesidad según IMC ( Kg/m2 )
IMC
(20 – 25 normal)
GRADO DE SOBREPESO
TIPO DE OBESIDAD
25 – 30 I Leve
30 – 35 II Moderada
35 – 40 III Grave
40 – 50 IV Mórbida
> 50 V Super-obesidad

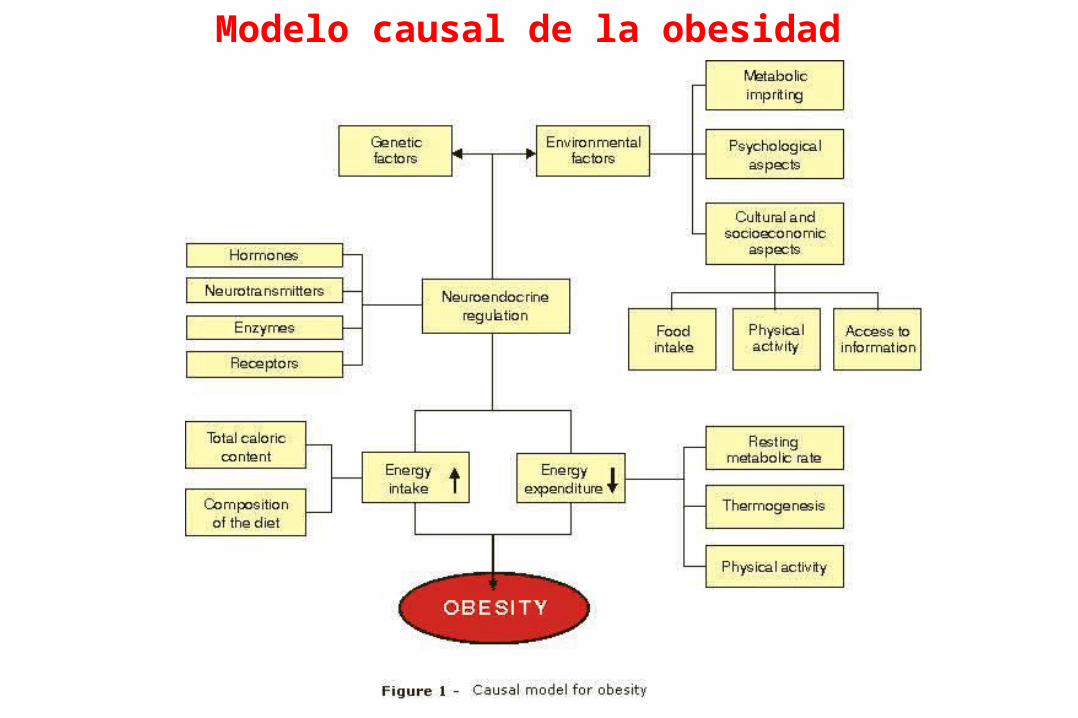
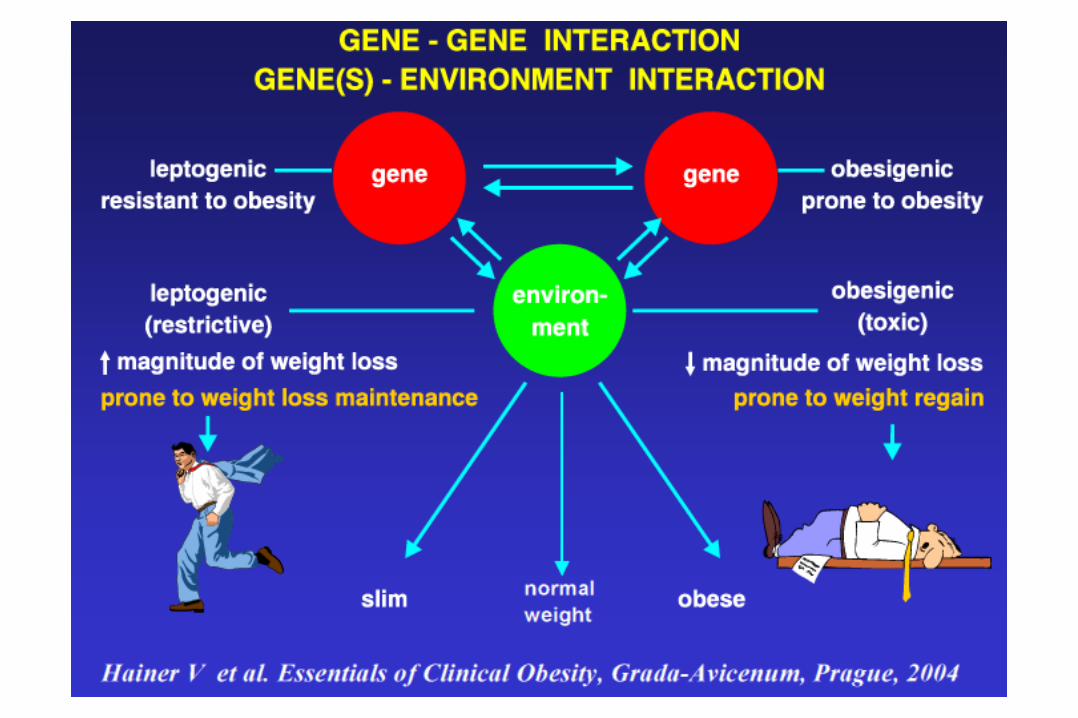
Modelo causal de la obesidad

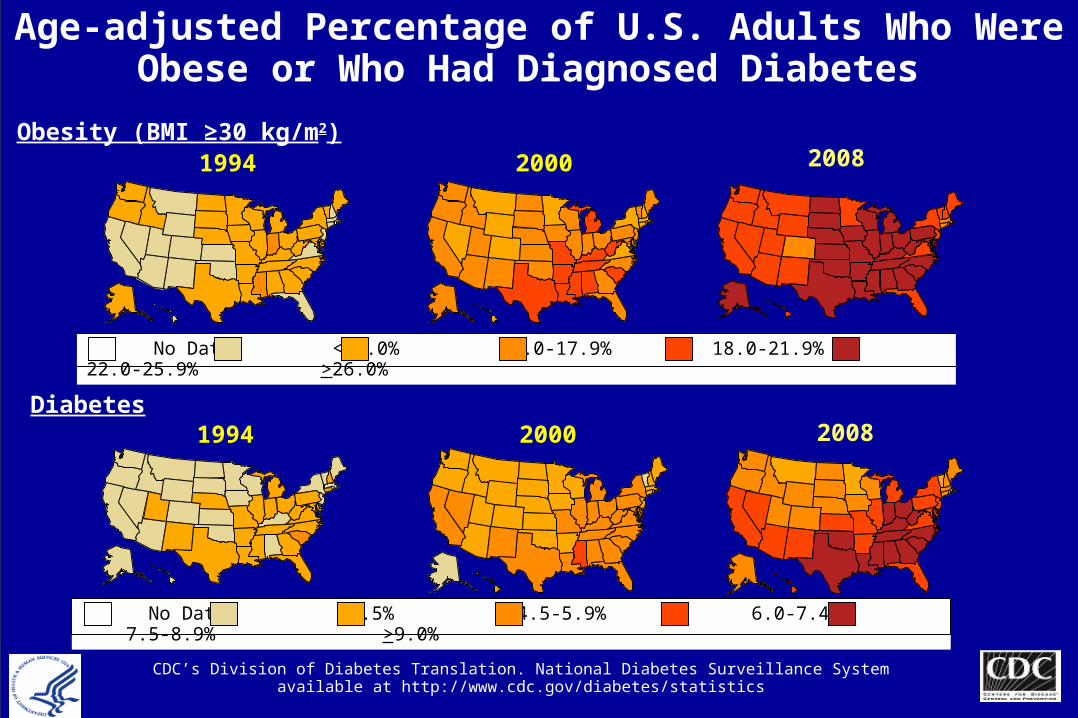
2008
Age-adjusted Percentage of U.S. Adults Who Were Obese or Who Had Diagnosed Diabetes
Obesity (BMI ≥30 kg/m2)
Diabetes
1994
1994
2000
2000
No Data <14.0% 14.0-17.9% 18.0-21.9% 22.0-25.9% >26.0%
No Data <4.5% 4.5-5.9% 6.0-7.4% 7.5-8.9% >9.0%
CDC’s Division of Diabetes Translation. National Diabetes Surveillance System available at http://www.cdc.gov/diabetes/statistics
2008
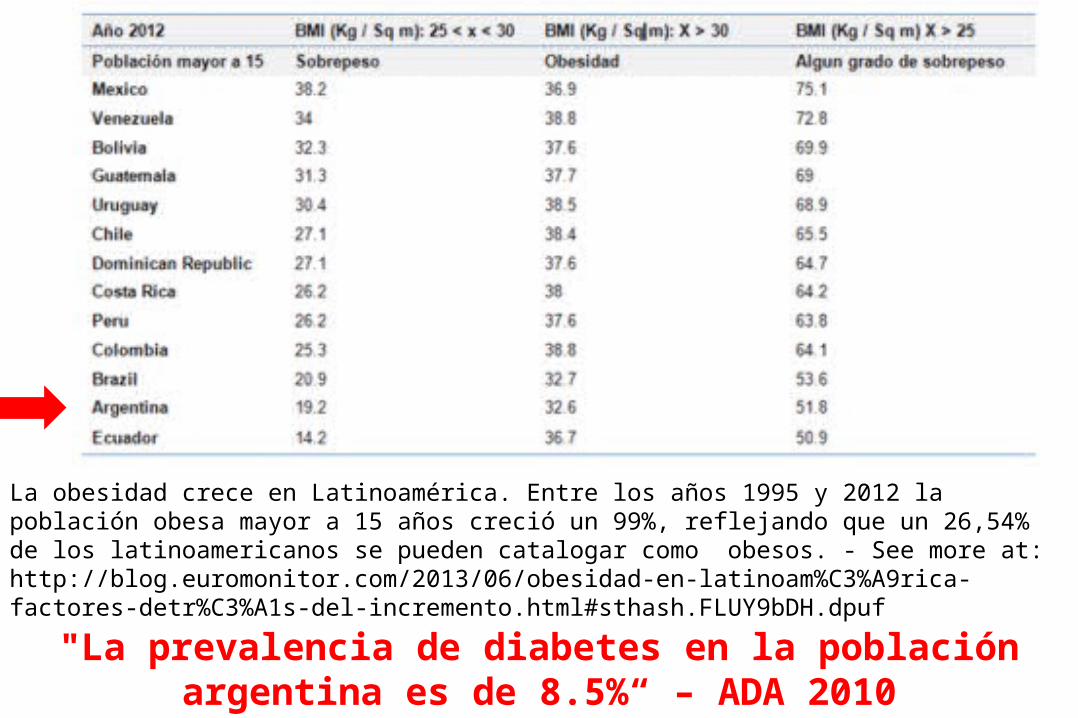
"La prevalencia de diabetes en la población argentina es de 8.5%“ – ADA 2010
La obesidad crece en Latinoamérica. Entre los años 1995 y 2012 la población obesa mayor a 15 años creció un 99%, reflejando que un 26,54% de los latinoamericanos se pueden catalogar como obesos. - See more at: http://blog.euromonitor.com/2013/06/obesidad-en-latinoam%C3%A9rica-factores-detr%C3%A1s-del-incremento.html#sthash.FLUY9bDH.dpuf
Complicaciones metabólicas de la obesidad
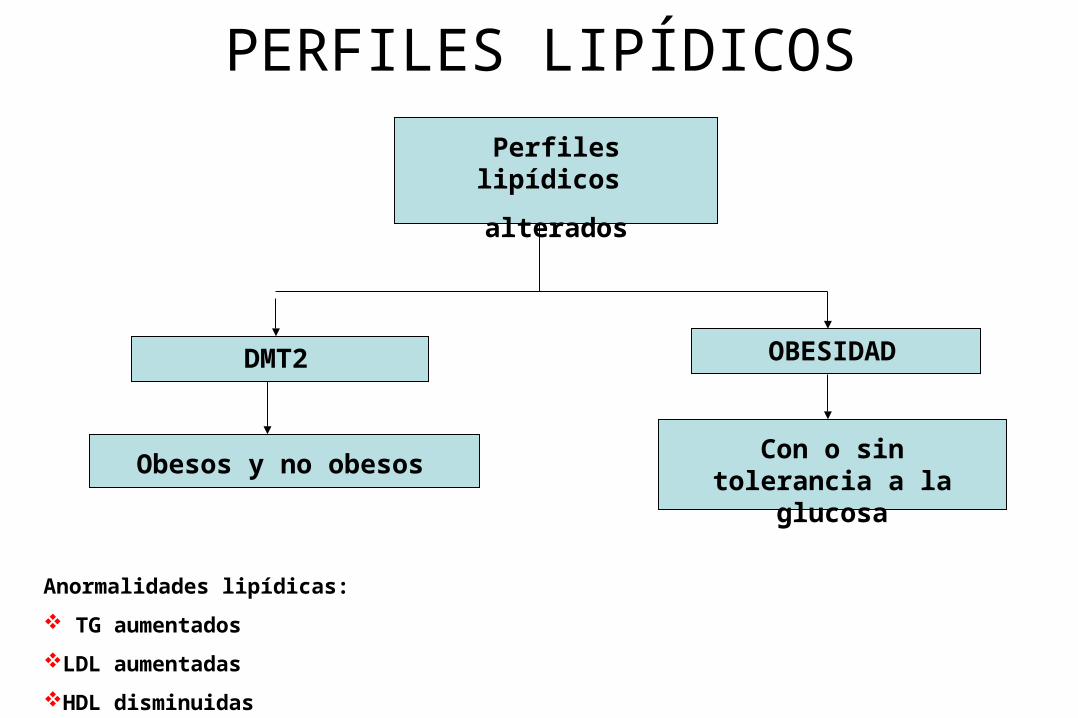
PERFILES LIPÍDICOS
Perfiles lipídicos
alterados
DMT2 OBESIDAD
Obesos y no obesosCon o sin tolerancia a la
glucosa
Anormalidades lipídicas:
TG aumentados
LDL aumentadas
HDL disminuidas
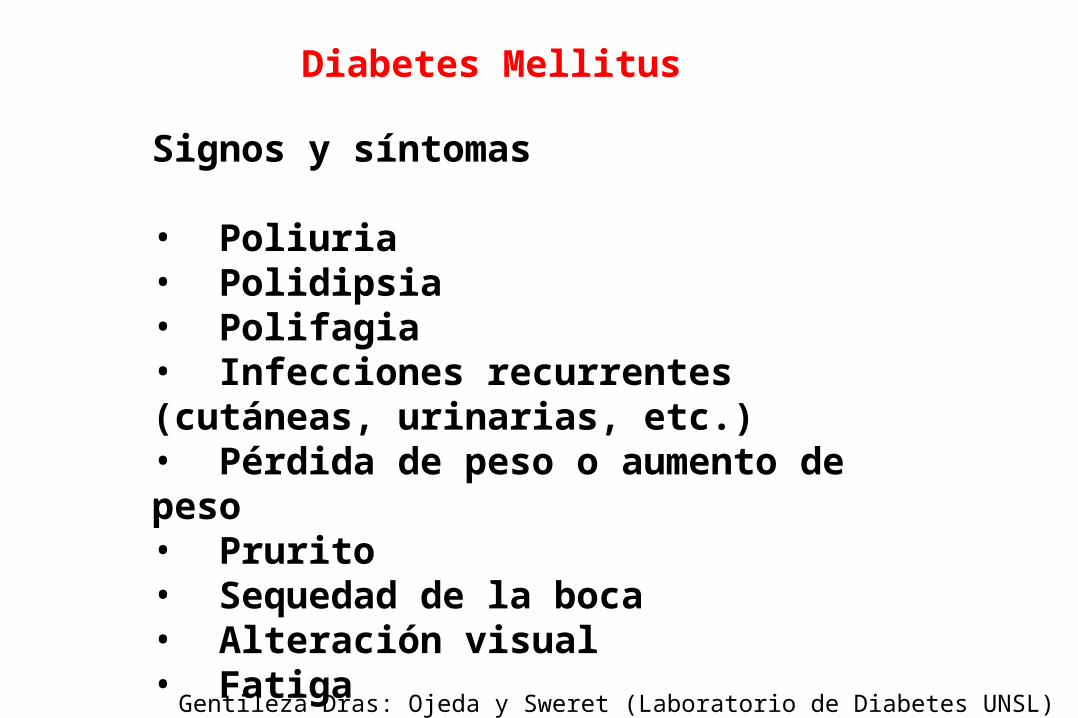
Signos y síntomas
• Poliuria • Polidipsia • Polifagia • Infecciones recurrentes (cutáneas, urinarias, etc.)• Pérdida de peso o aumento de peso• Prurito• Sequedad de la boca• Alteración visual• Fatiga
Diabetes Mellitus
Gentileza Dras: Ojeda y Sweret (Laboratorio de Diabetes UNSL)
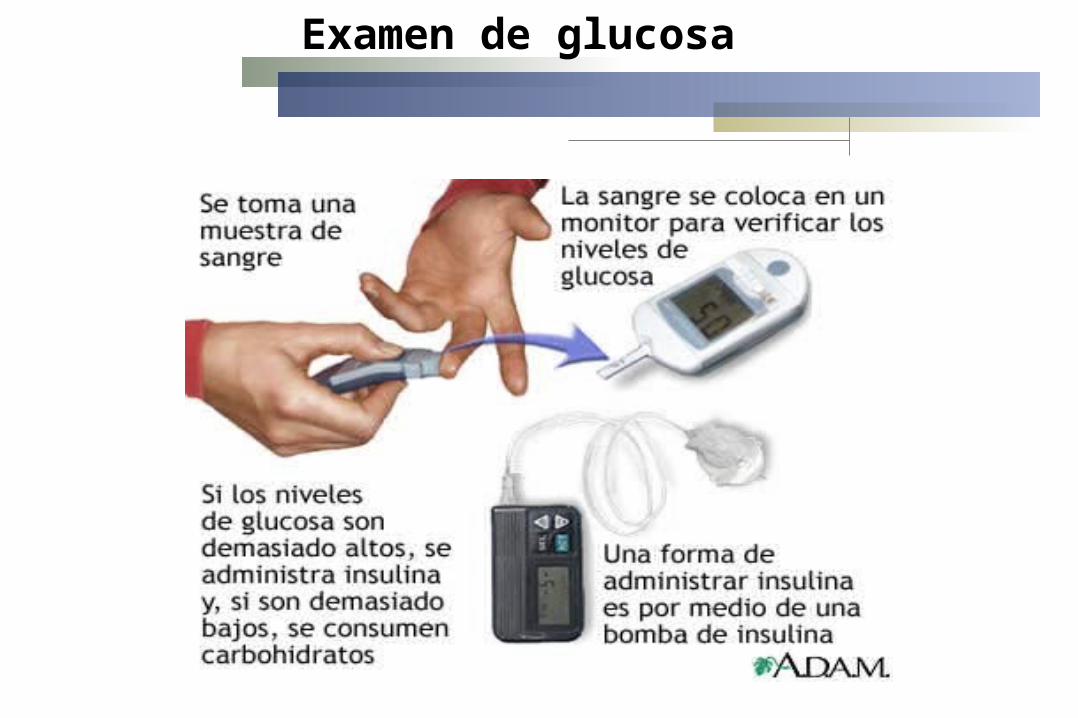
Examen de glucosa
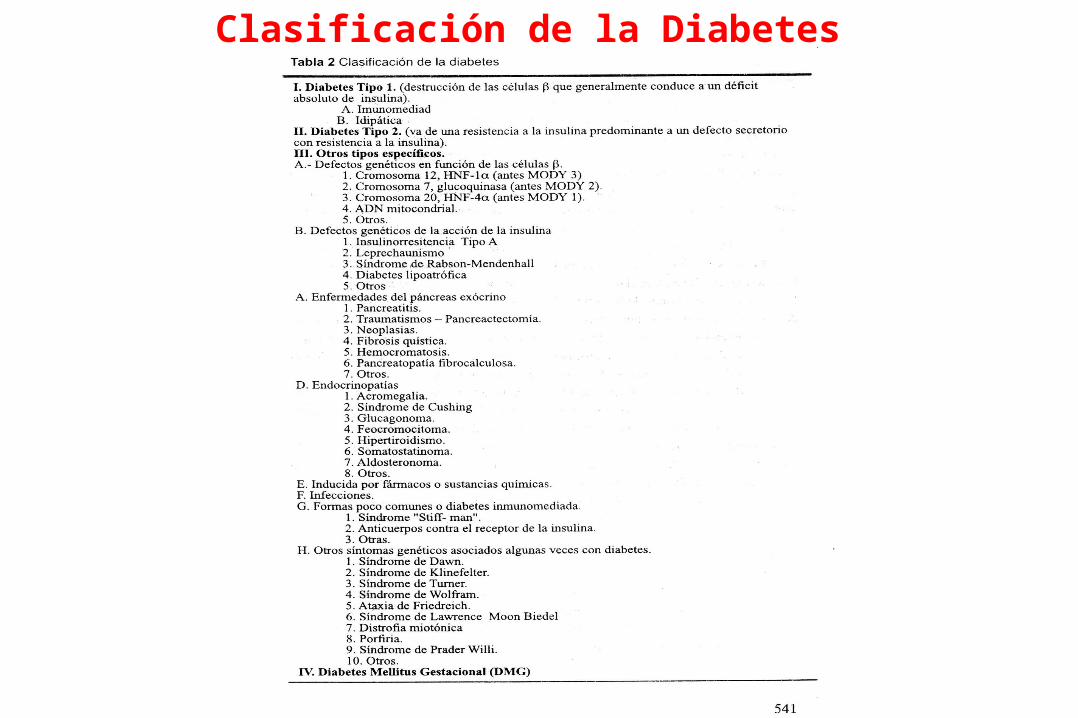
Clasificación de la Diabetes
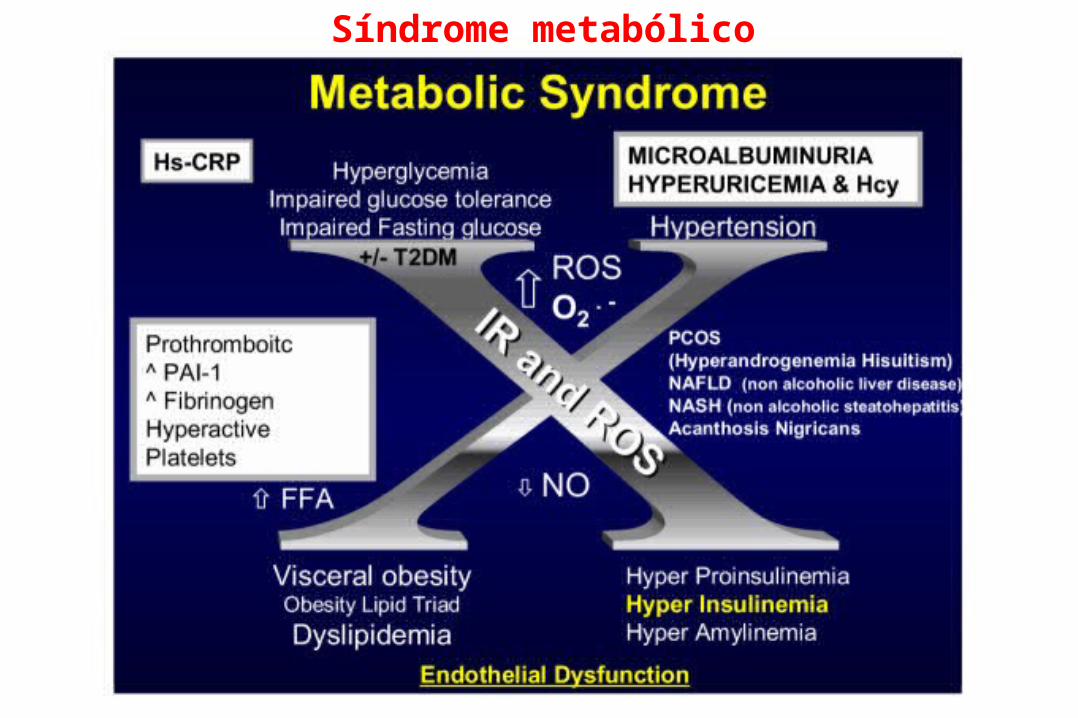
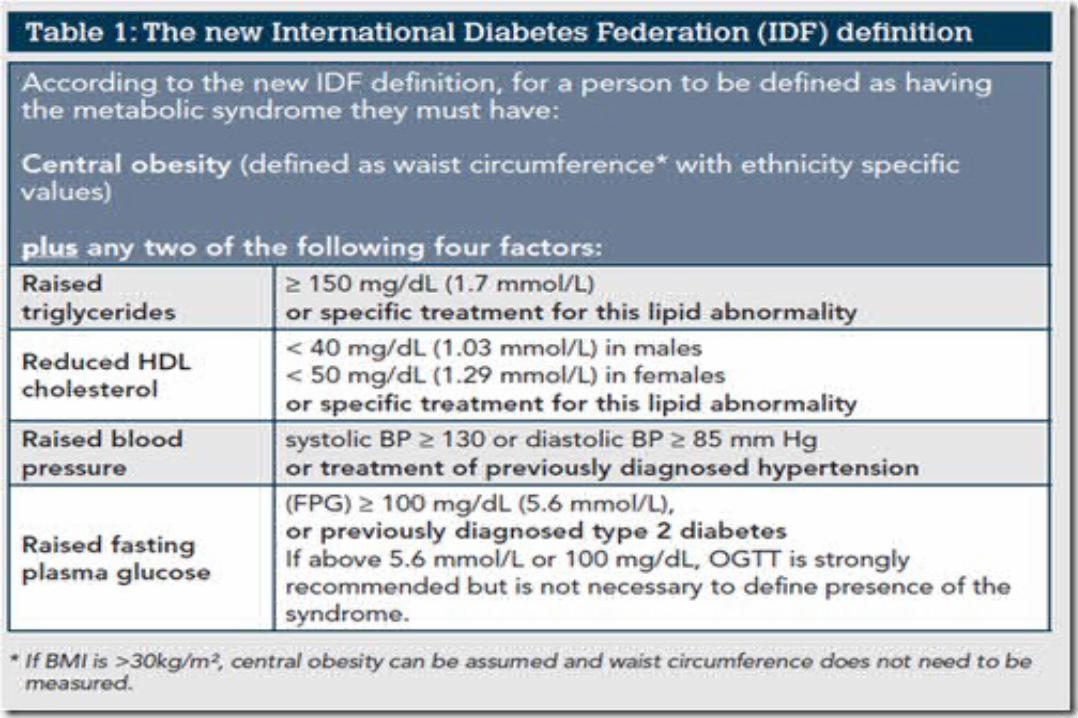
Síndrome metabólico
La inflamación del TA es la causante de las
metabolopatías asociadas a la obesidad
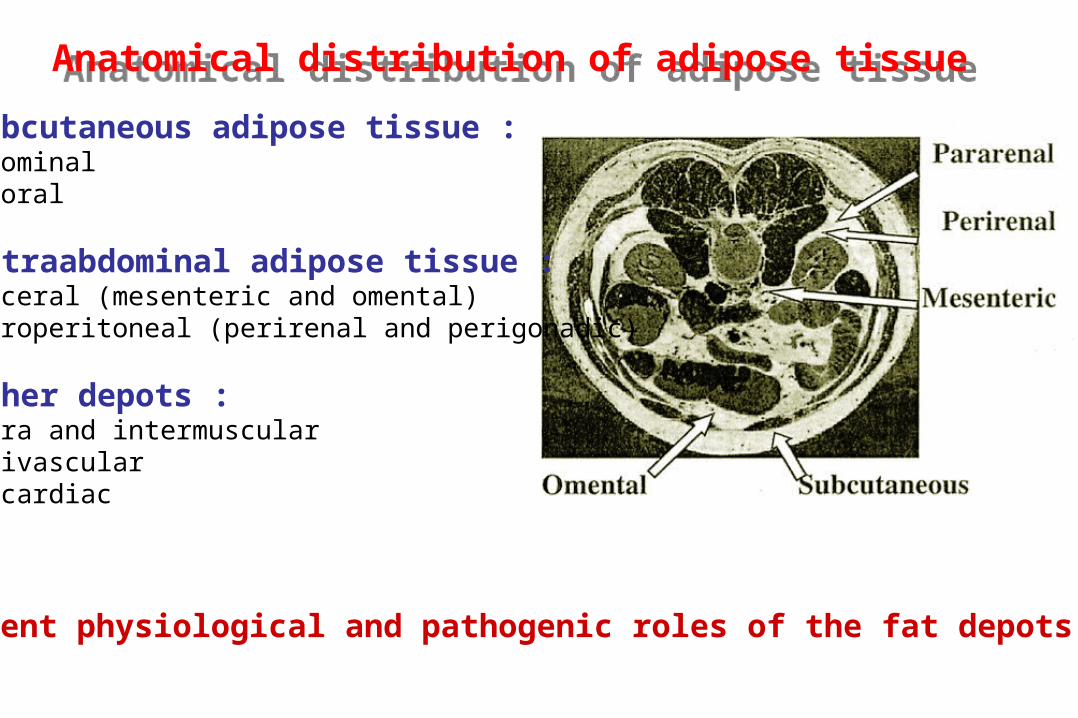
Subcutaneous adipose tissue :- abdominal- femoral
Intraabdominal adipose tissue :- visceral (mesenteric and omental)- retroperitoneal (perirenal and perigonadic)
Other depots :- intra and intermuscular- perivascular- epicardiac
Anatomical distribution of adipose tissueAnatomical distribution of adipose tissue
Different physiological and pathogenic roles of the fat depots
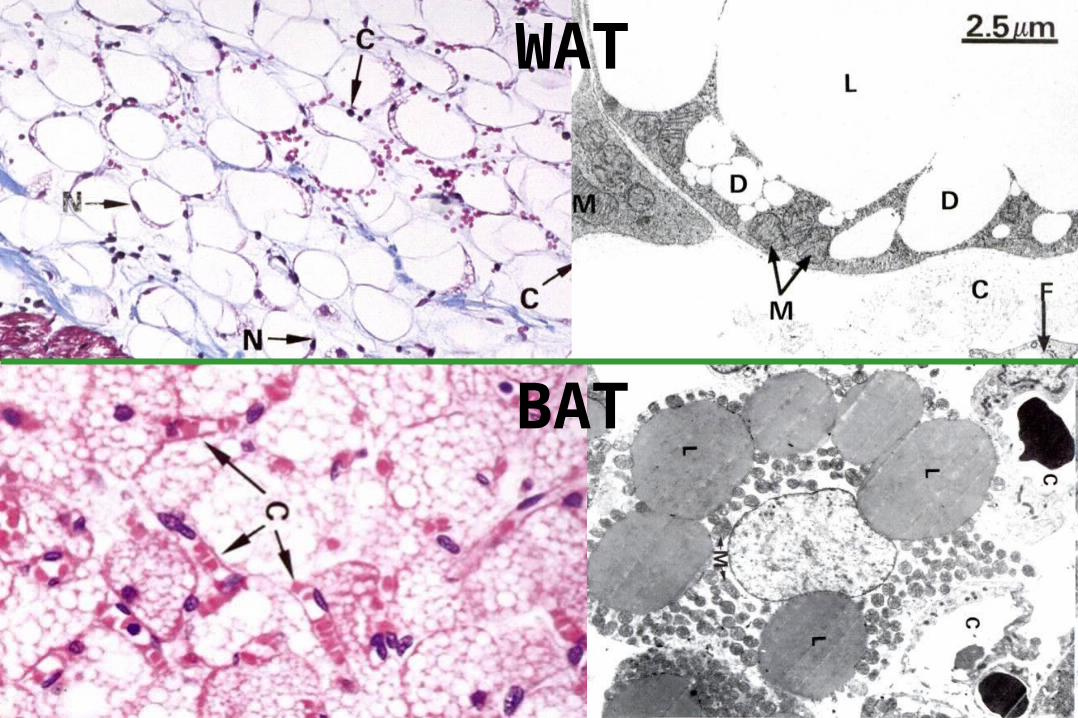
WAT
BAT
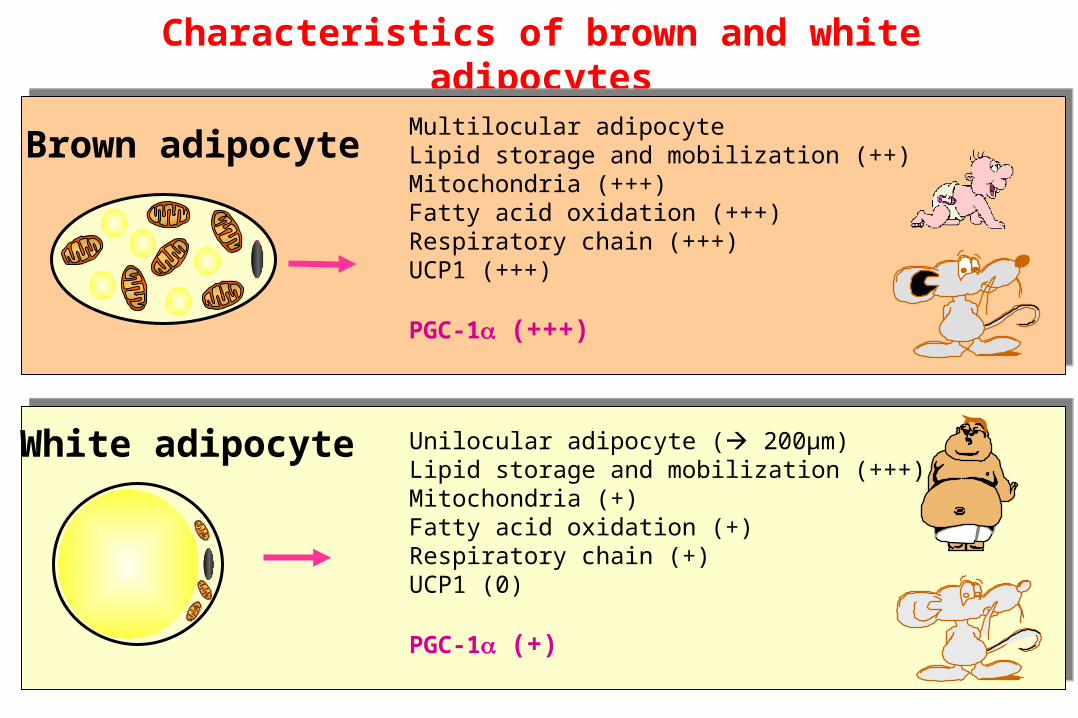
Characteristics of brown and white adipocytes
White adipocyte Unilocular adipocyte ( 200µm)Lipid storage and mobilization (+++)Mitochondria (+)Fatty acid oxidation (+)Respiratory chain (+)UCP1 (0)
PGC-1 (+)
Brown adipocyteMultilocular adipocyteLipid storage and mobilization (++)Mitochondria (+++)Fatty acid oxidation (+++)Respiratory chain (+++)UCP1 (+++)
PGC-1 (+++)
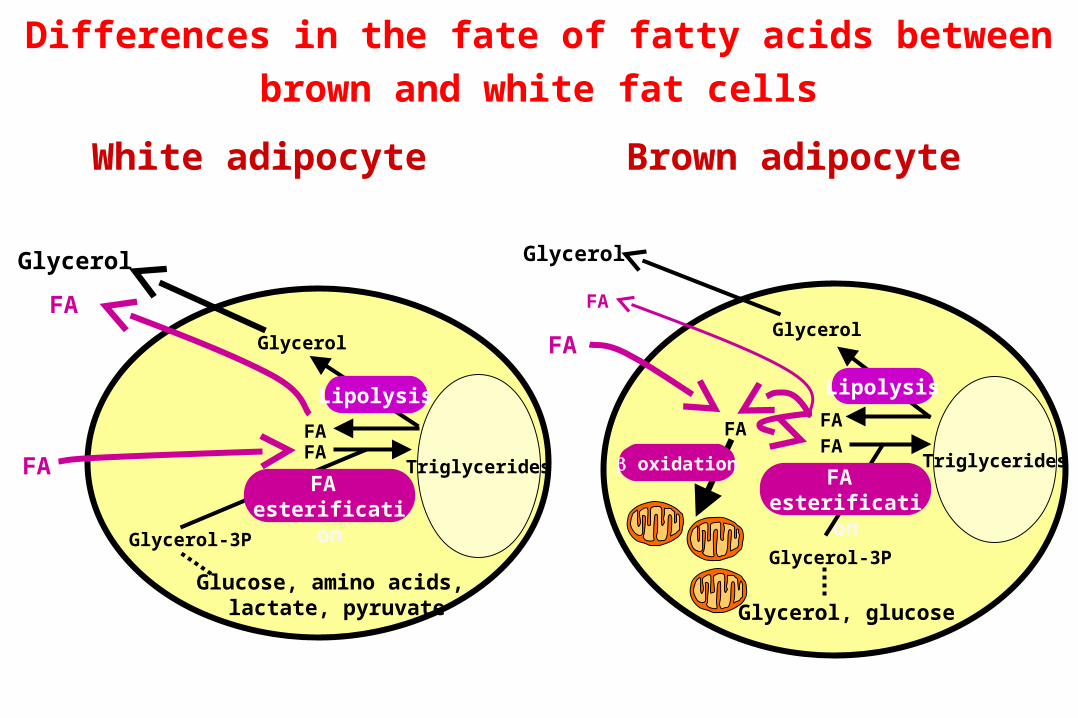
Differences in the fate of fatty acids between brown and
white fat cells
FAFA
Glycerol
Lipolysis
FA esterification
FA
Glycerol
TriglyceridesFA
Glycerol-3P
FA
Glycerol
FA
oxidation
FA
Glycerol
Triglycerides
White adipocyte Brown adipocyte
Glycerol-3P
Glucose, amino acids, lactate, pyruvate
Lipolysis
FA esterification
FA
Glycerol, glucose
FA

ADIPOCYTE HYPERTROPHY
& HYPERPLASIA
ADIPOCYTE HYPERTROPHY
& HYPERPLASIA
ANGIOGENESISANGIOGENESIS
INFLAMMATIONINFLAMMATIONMacrophages
Mature adipocytes
Preadipocytes
Endothelial cells
Mature adipocytes
Preadipocytes
Adipose tissue development : beyond adipocyte differentiation
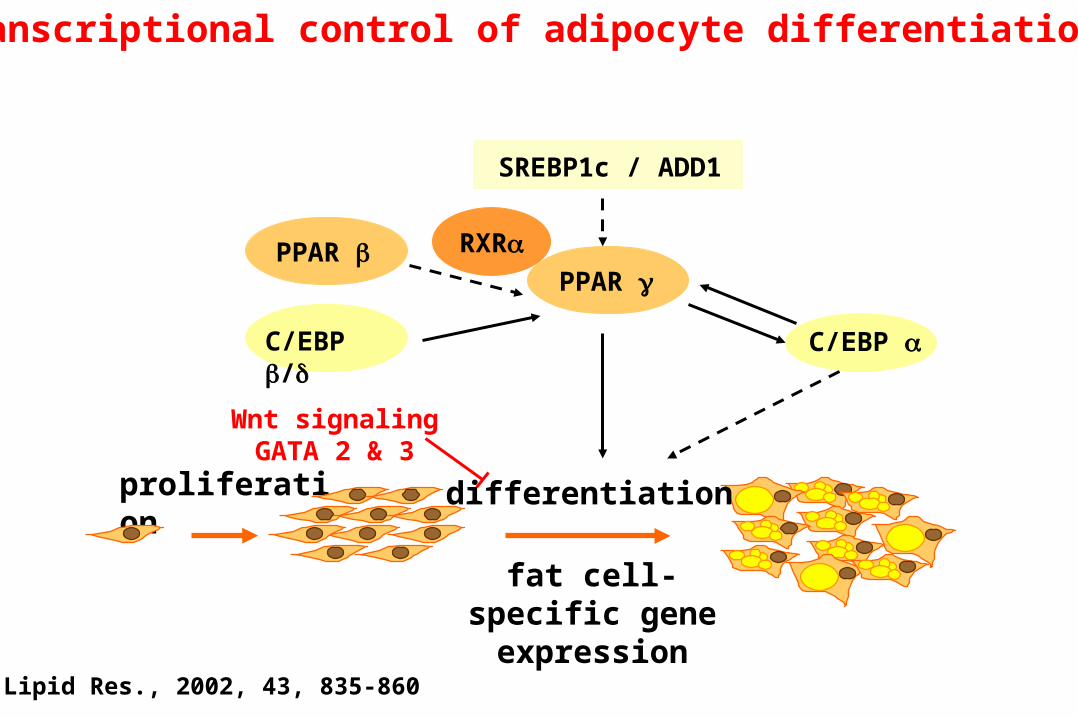
proliferation
fat cell-specific gene expression
differentiation
Transcriptional control of adipocyte differentiation
Wnt signalingGATA 2 & 3
SREBP1c / ADD1
C/EBP /
PPAR
C/EBP
RXRPPAR
J. Lipid Res., 2002, 43, 835-860
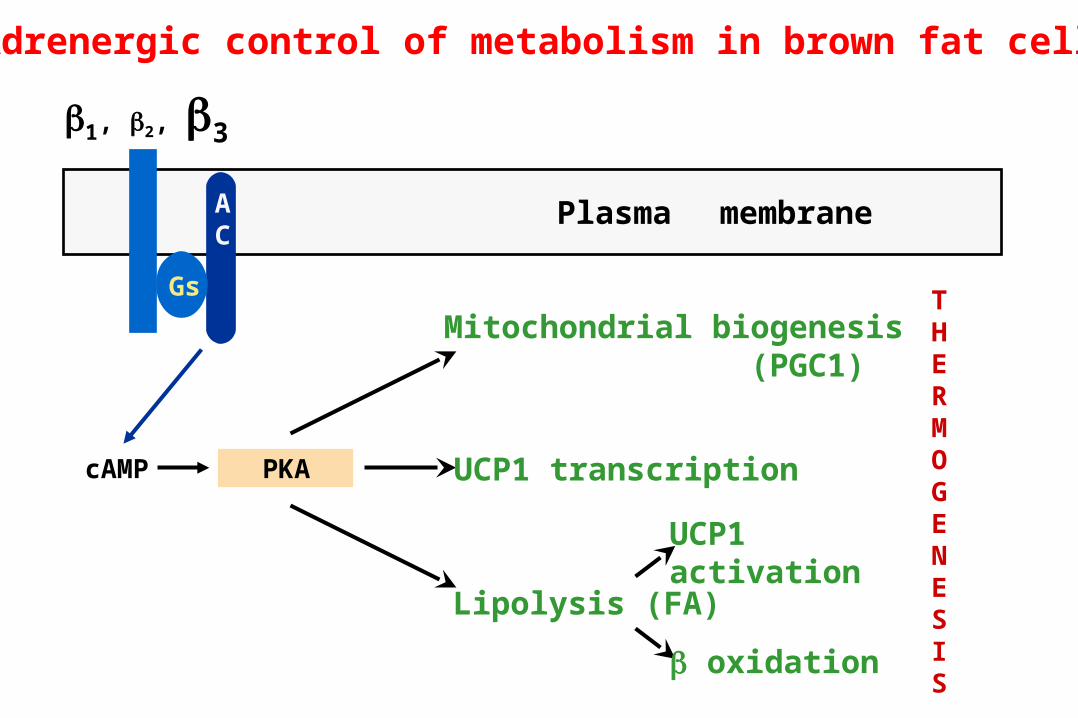
1, 2, 3
cAMP PKA
AC
Gs
Plasma membrane
Mitochondrial biogenesis (PGC1)
UCP1 transcription
Lipolysis (FA)
UCP1 activation
oxidation
THERMOGENESIS
Adrenergic control of metabolism in brown fat cells
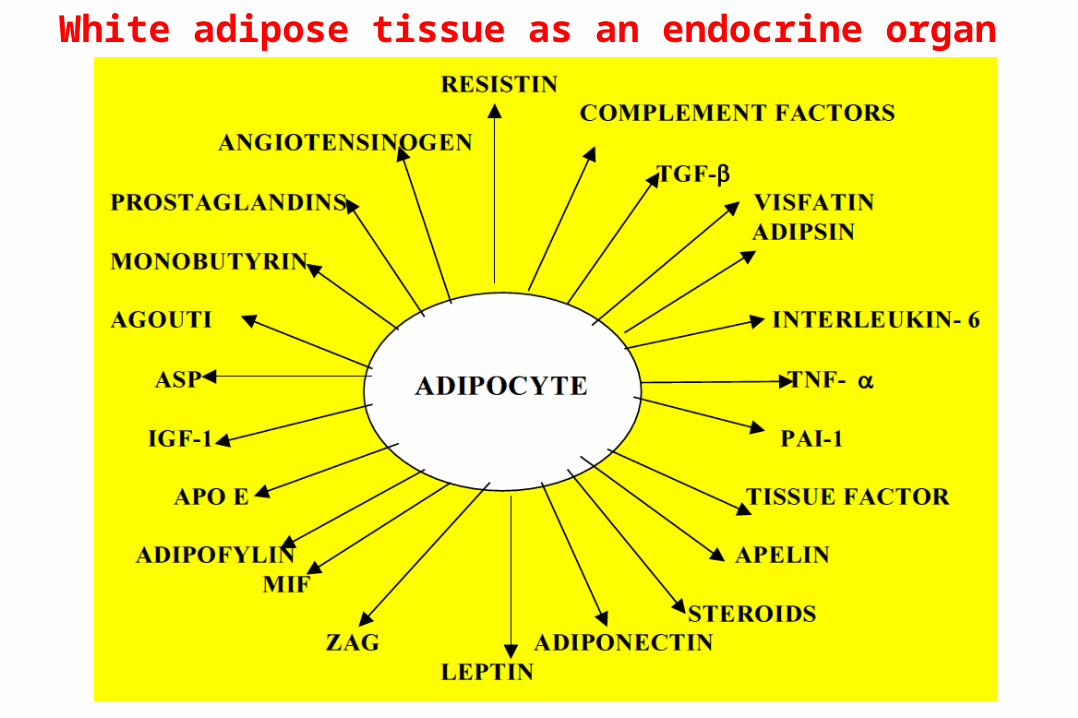
White adipose tissue as an endocrine organ
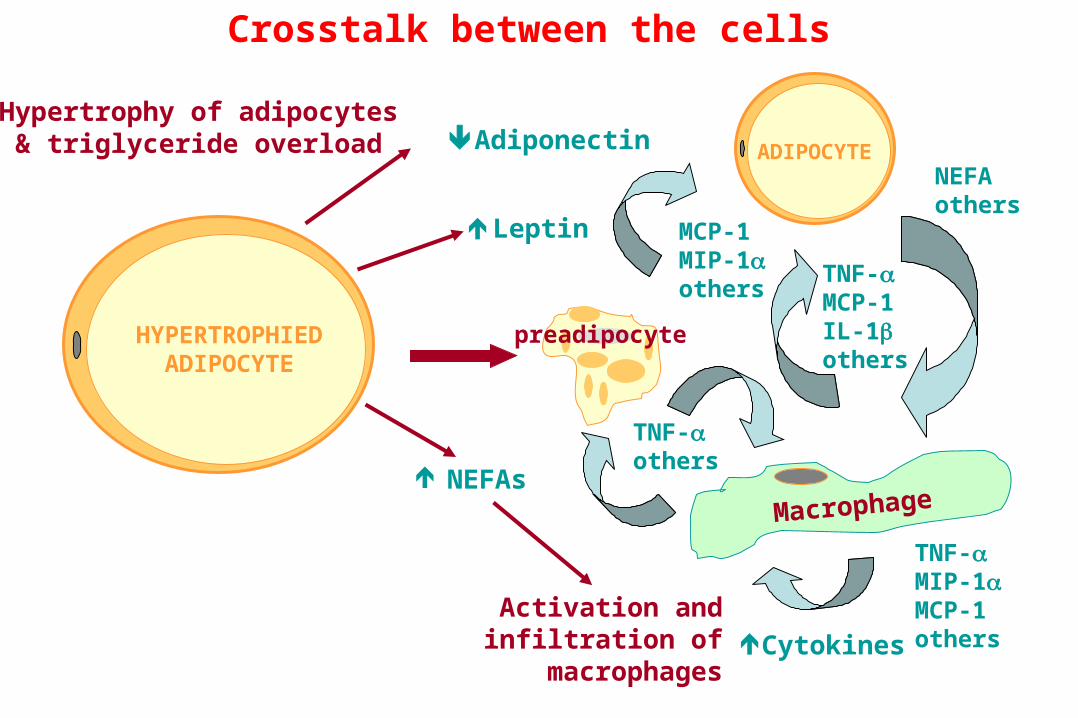
Hypertrophy of adipocytes& triglyceride overload
Activation andinfiltration of
macrophages
Adiponectin
TNF-MIP-1MCP-1others
MCP-1MIP-1others
TNF-others
TNF-MCP-1IL-1others
NEFAothers
HYPERTROPHIEDADIPOCYTE
ADIPOCYTE
MacrophageNEFAs
Leptin
Cytokines
preadipocyte
Crosstalk between the cells
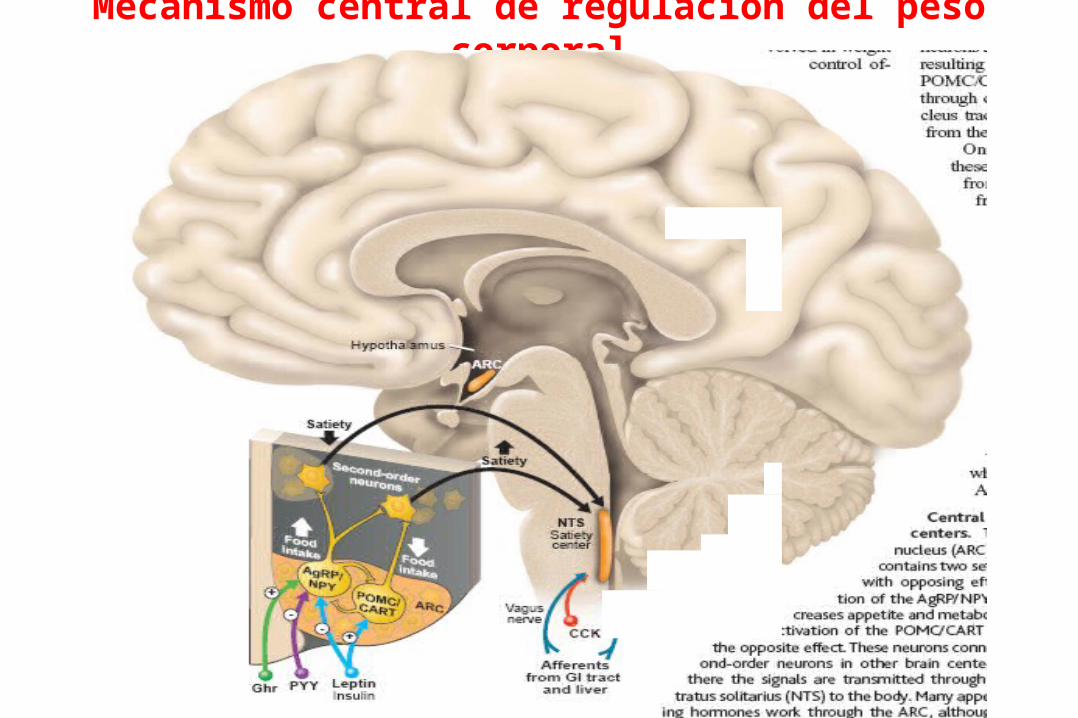
Mecanismo central de regulación del peso corporal
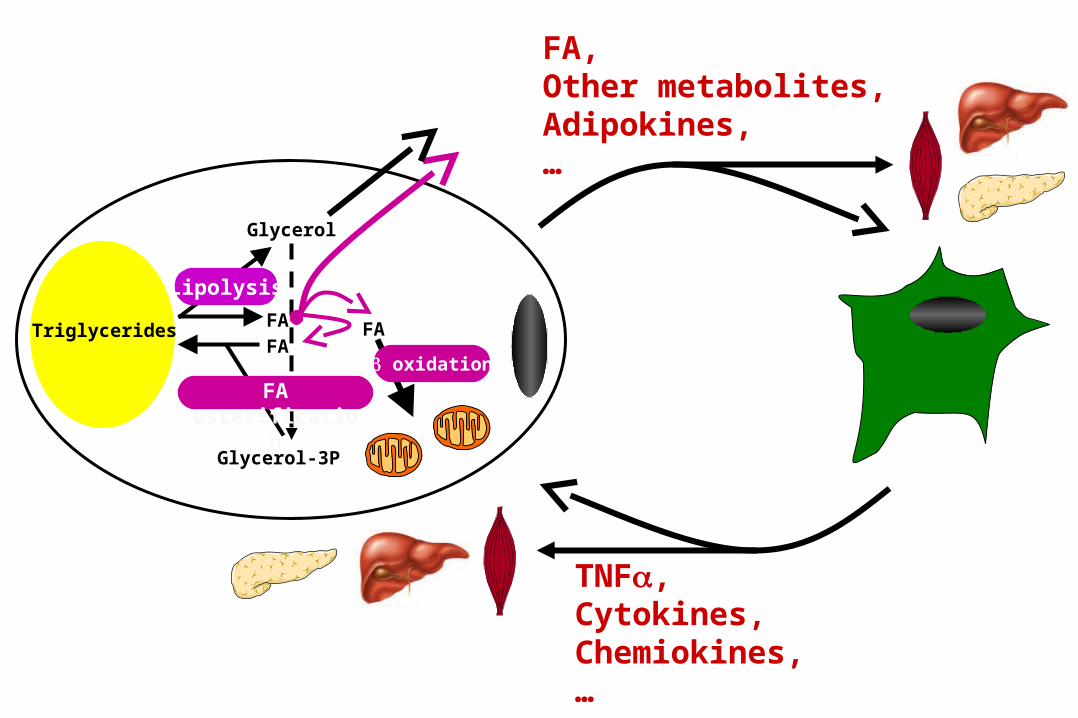
FA,Other metabolites,Adipokines,…
TNF,Cytokines,Chemiokines,…
FA
Glycerol-3P
FA
Glycerol
FA
oxidation
Lipolysis
FA esterification
Triglycerides
El rol de los macrófagos en la
inflamación del TA en obesidad
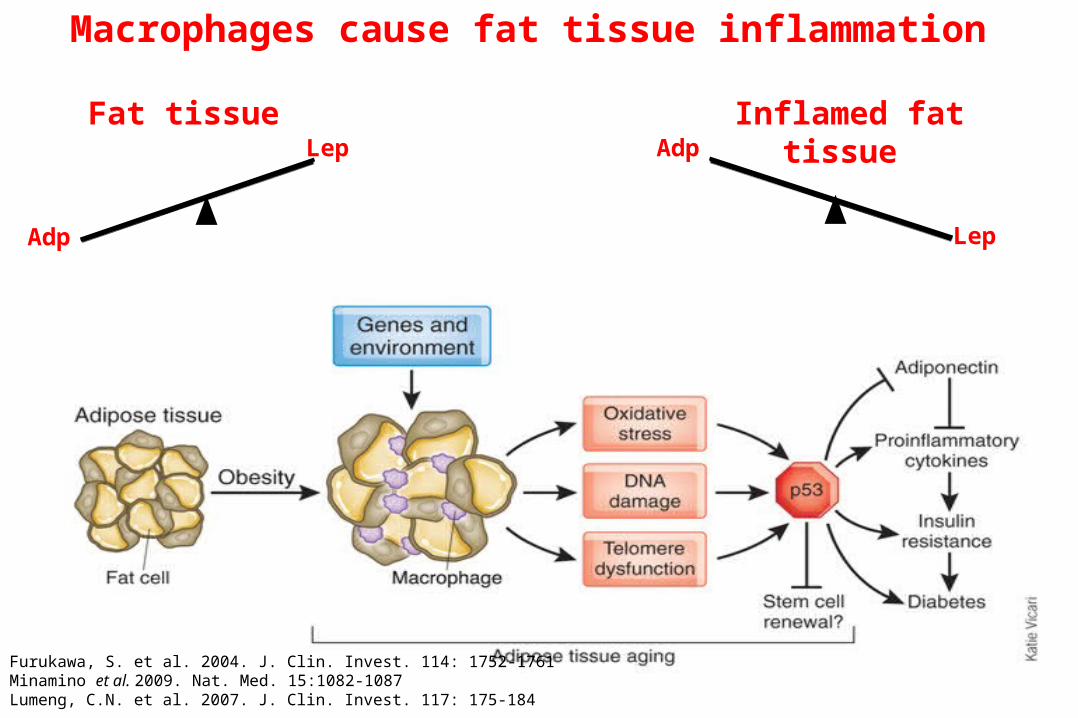
Macrophages cause fat tissue inflammation
Furukawa, S. et al. 2004. J. Clin. Invest. 114: 1752-1761Minamino et al. 2009. Nat. Med. 15:1082-1087Lumeng, C.N. et al. 2007. J. Clin. Invest. 117: 175-184
Fat tissue
Adp
Lep
Lep
AdpInflamed fat tissue
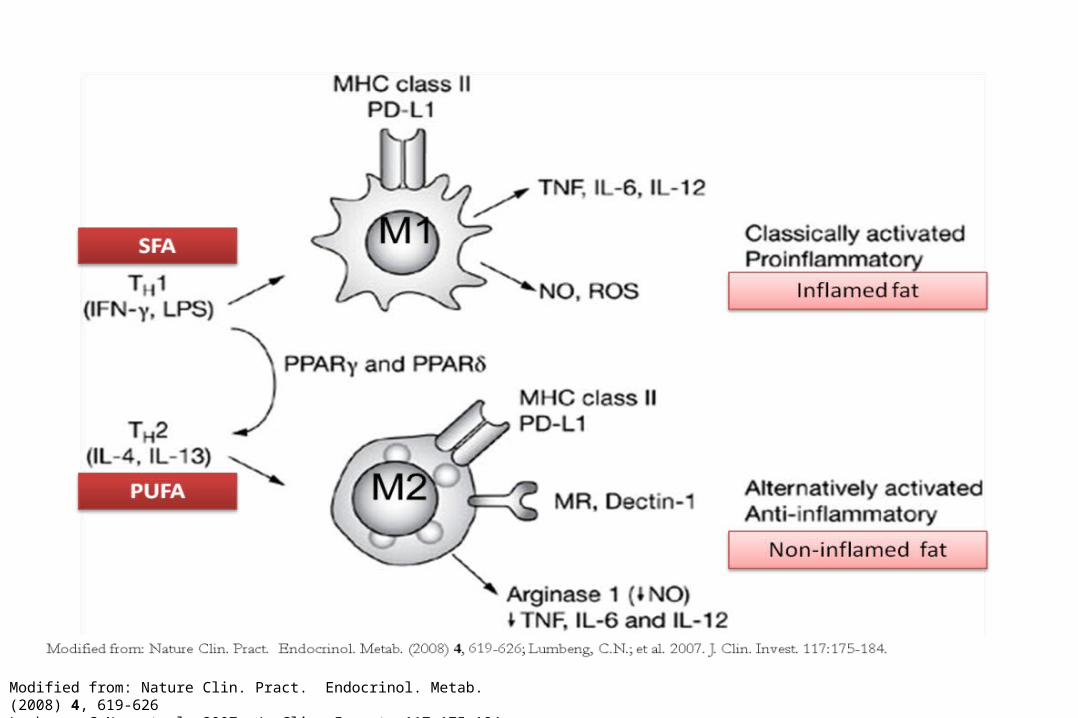
Modified from: Nature Clin. Pract. Endocrinol. Metab. (2008) 4, 619-626Lumbeng, C.N.; et al. 2007. J. Clin. Invest. 117:175-184.
Klo
tin
g,
N.
et a
l. A
m J
Ph
ysio
l E
nd
ocr
ino
l M
etab
299
: E
506-
E51
5 20
10
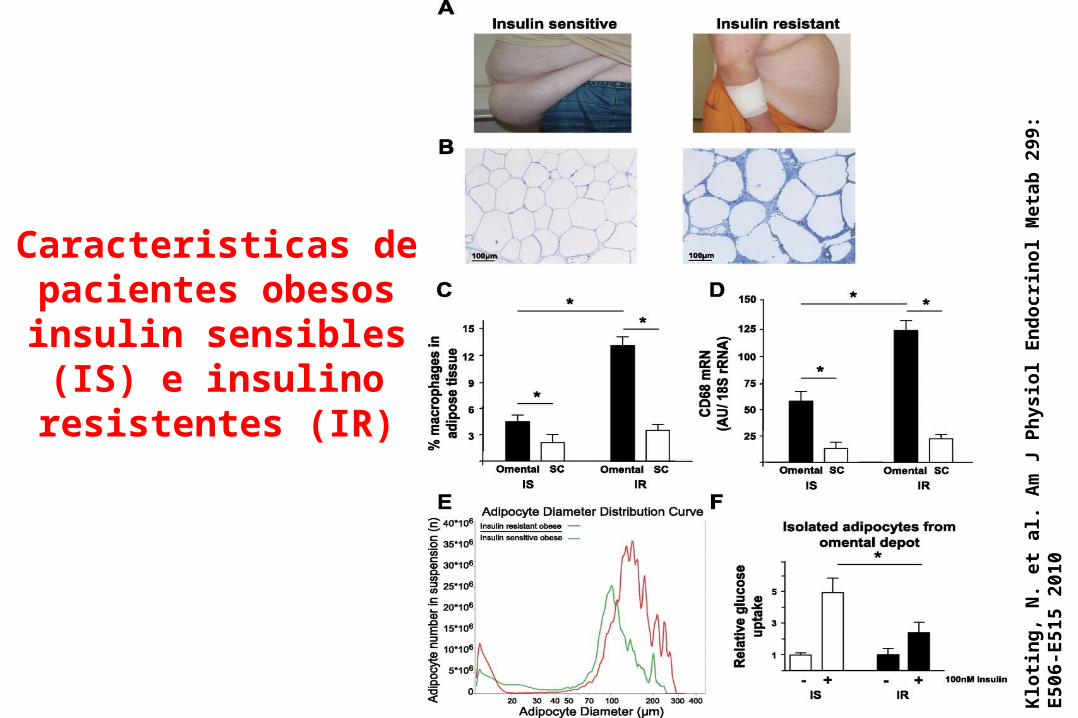
Caracteristicas de pacientes obesos
insulin sensibles (IS) e insulino resistentes
(IR)
4
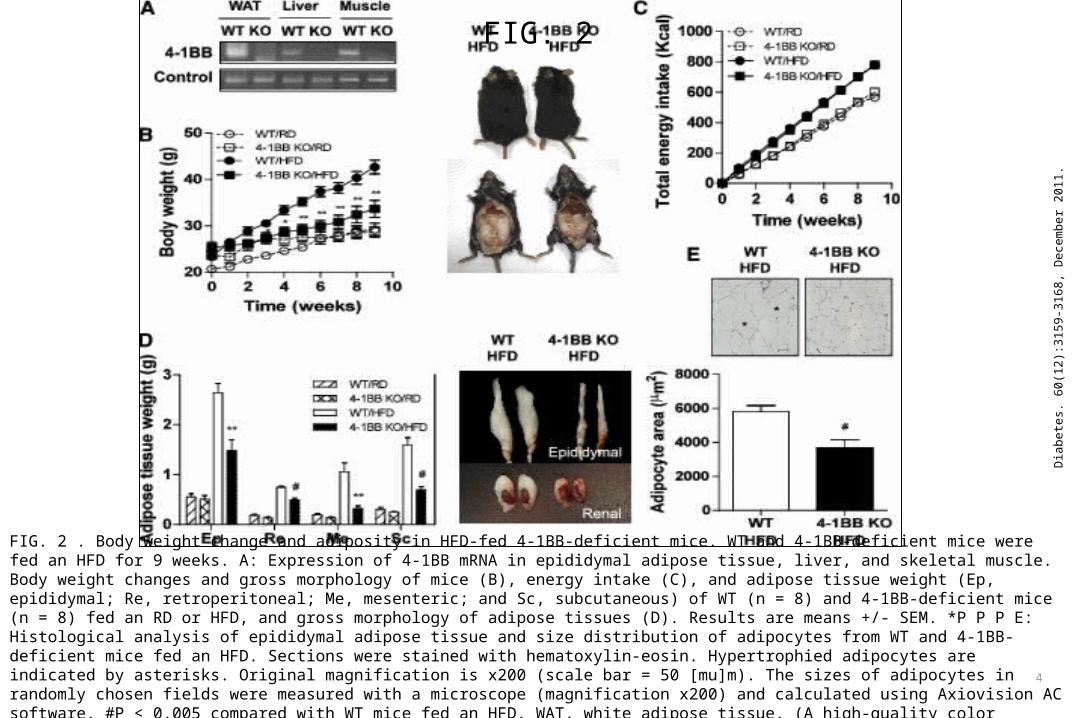
FIG. 2
Dia
bete
s. 6
0(12
):315
9-31
68, D
ecem
ber 2
011.
FIG. 2 . Body weight change and adiposity in HFD-fed 4-1BB-deficient mice. WT and 4-1BB-deficient mice were fed an HFD for 9 weeks. A: Expression of 4-1BB mRNA in epididymal adipose tissue, liver, and skeletal muscle. Body weight changes and gross morphology of mice (B), energy intake (C), and adipose tissue weight (Ep, epididymal; Re, retroperitoneal; Me, mesenteric; and Sc, subcutaneous) of WT (n = 8) and 4-1BB-deficient mice (n = 8) fed an RD or HFD, and gross morphology of adipose tissues (D). Results are means +/- SEM. *P P P E: Histological analysis of epididymal adipose tissue and size distribution of adipocytes from WT and 4-1BB-deficient mice fed an HFD. Sections were stained with hematoxylin-eosin. Hypertrophied adipocytes are indicated by asterisks. Original magnification is x200 (scale bar = 50 [mu]m). The sizes of adipocytes in randomly chosen fields were measured with a microscope (magnification x200) and calculated using Axiovision AC software. #P < 0.005 compared with WT mice fed an HFD. WAT, white adipose tissue. (A high-quality color representation of this figure is available in the online issue.)

Aspectos bioquímicos de la obesidad y sus
complicaciones
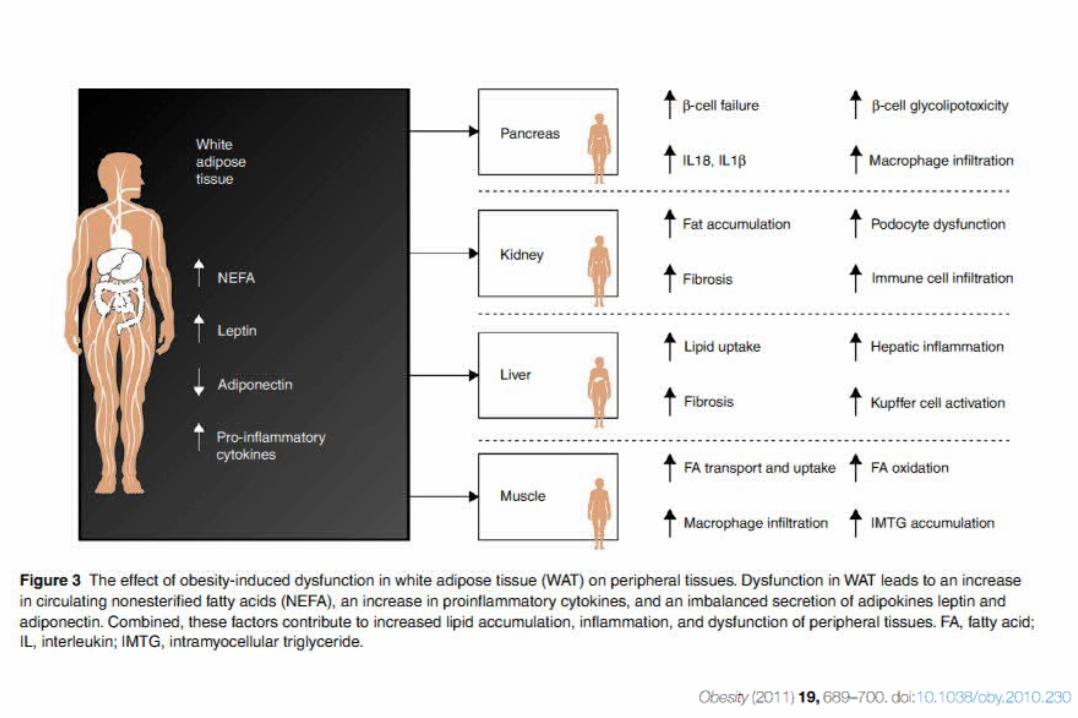
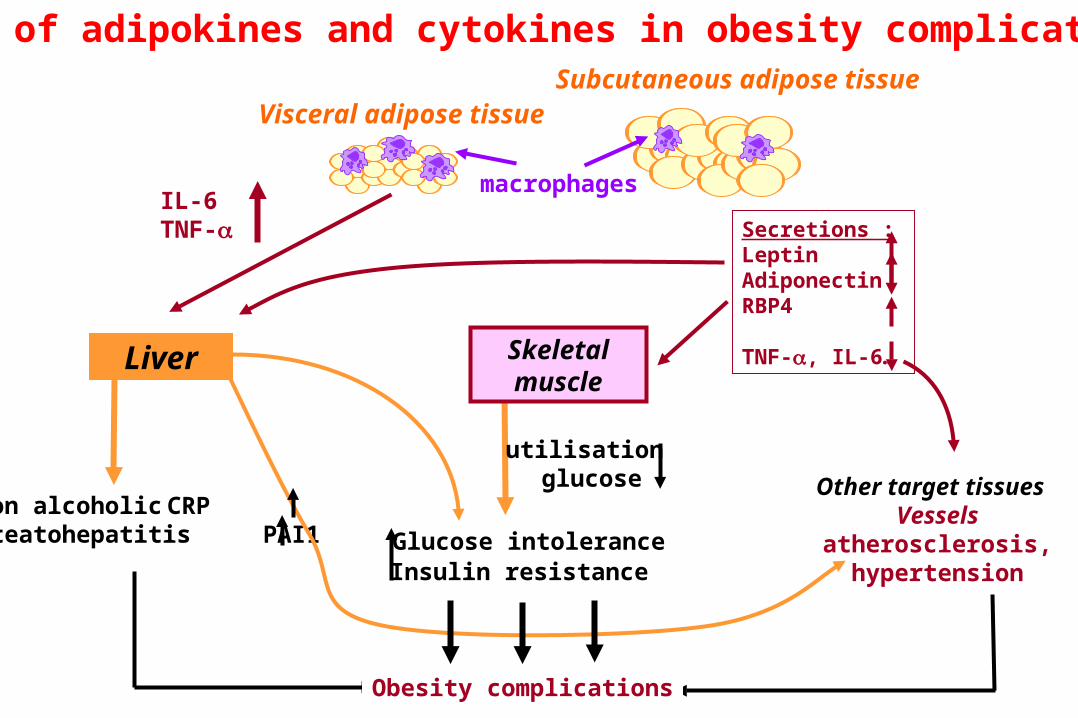
Role of adipokines and cytokines in obesity complications
IL-6TNF-
Liver
utilisation glucose
Skeletalmuscle
macrophages
Other target tissues Vessels
atherosclerosis, hypertension
Secretions :LeptinAdiponectinRBP4
TNF-, IL-6…
Non alcoholic CRPsteatohepatitis PAI1
Visceral adipose tissueSubcutaneous adipose tissue
Obesity complications
Glucose intoleranceInsulin resistance
Pancreas
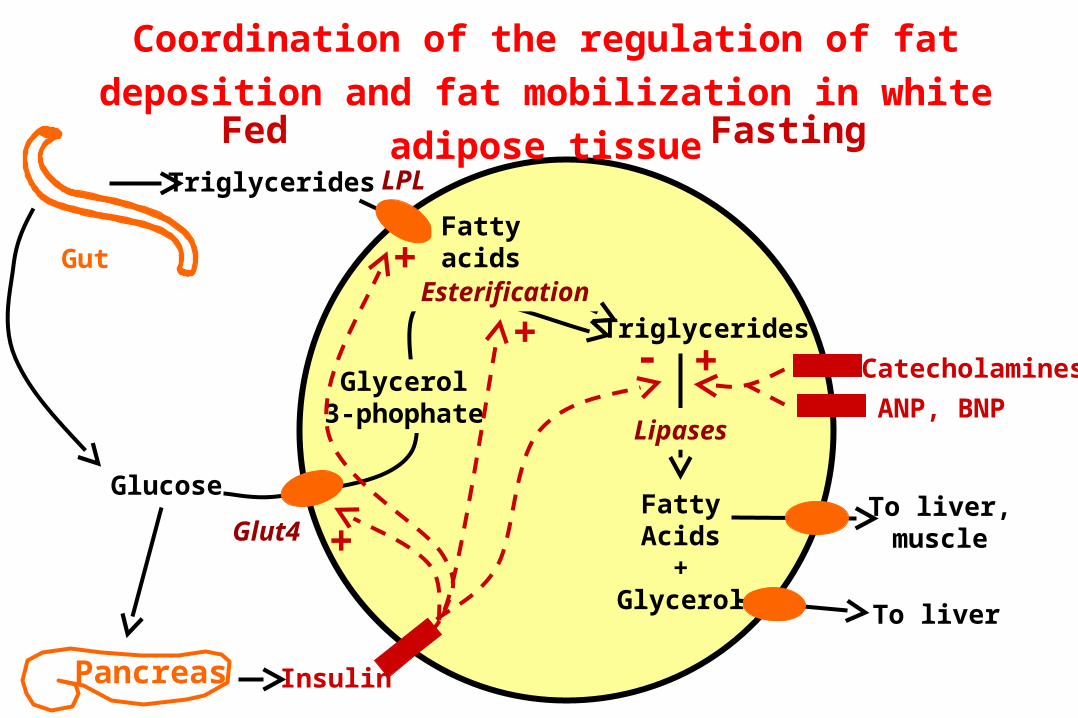
Fed Fasting
Gut
Triglycerides
Coordination of the regulation of fat deposition and fat
mobilization in white adipose tissue
Triglycerides
LPL
Glut4
Glucose
Glycerol3-phophate
FattyAcids
+Glycerol To liver
To liver,muscle
Insulin
Esterification
Fattyacids
+
+
+
Lipases
- Catecholamines
ANP, BNP
+
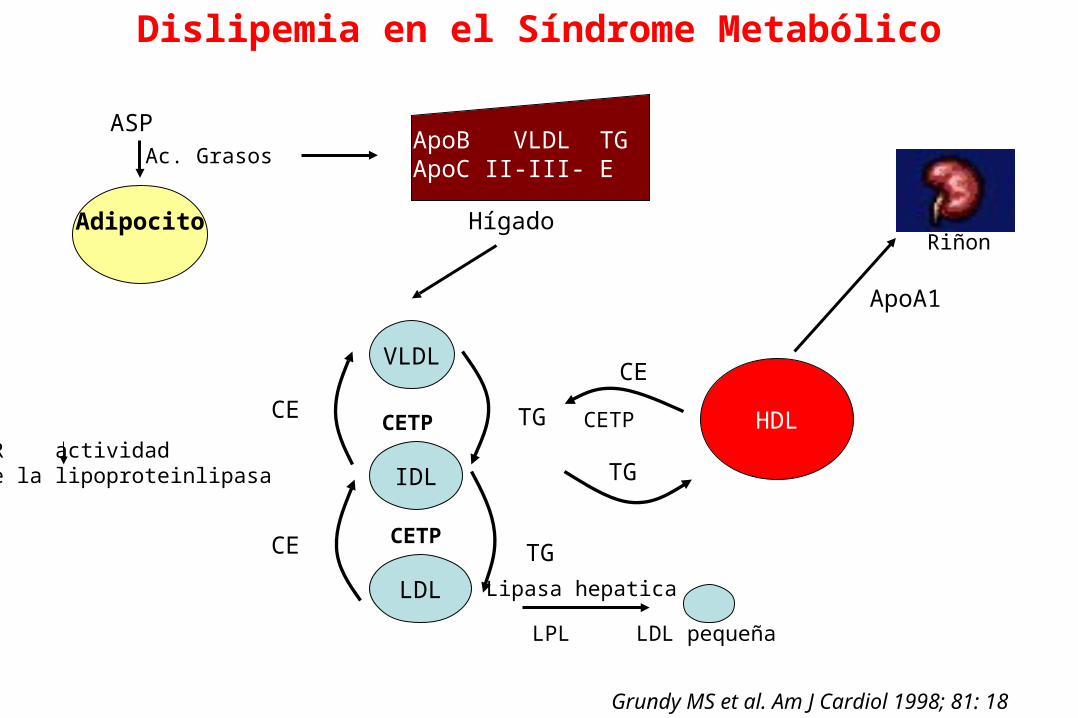
Adipocito
ASPAc. Grasos
ApoB VLDL TGApoC II-III- E
Hígado
VLDL
IDL
LDL
CETP
CETP
CE
CE
TG
TG
LDL pequeña
Lipasa hepatica
LPL
HDL
CE
TG
CETP
ApoA1
Grundy MS et al. Am J Cardiol 1998; 81: 18
Dislipemia en el Síndrome Metabólico
Riñon
IR actividadde la lipoproteinlipasa
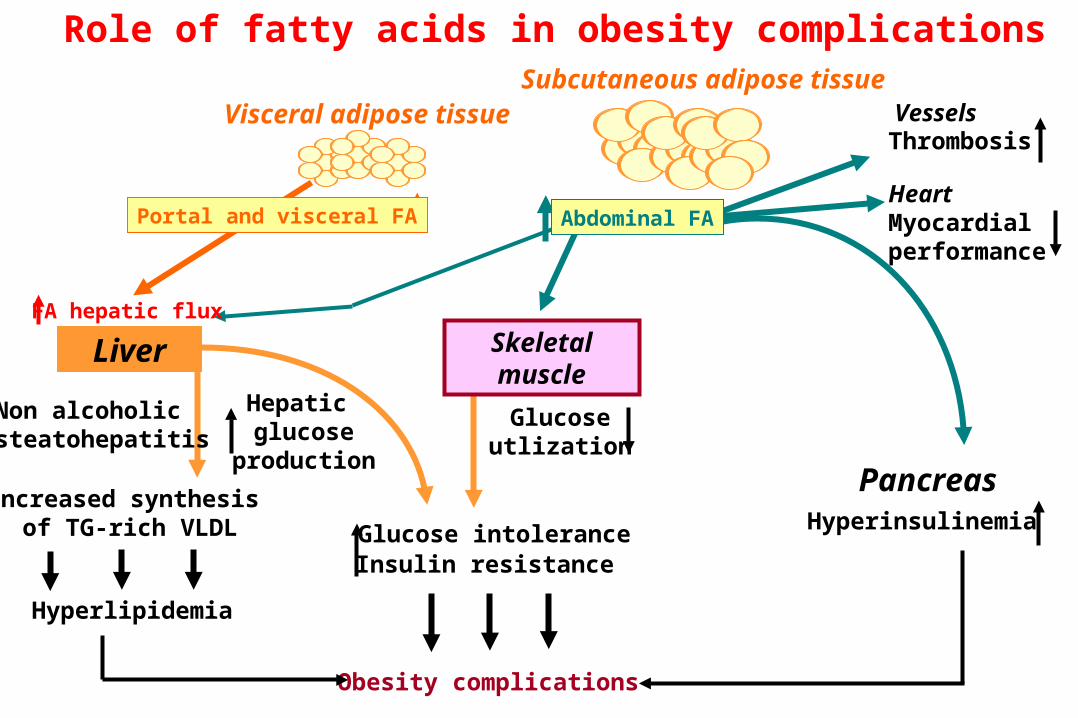
Obesity complications
Increased synthesis of TG-rich VLDL
Visceral adipose tissue
Glucose intoleranceInsulin resistance
Hyperlipidemia
Liver
Hepatic glucose
production
Glucoseutlization
Skeletalmuscle
Pancreas
FA hepatic flux
Portal and visceral FA
Hyperinsulinemia
VesselsThrombosis
HeartMyocardialperformance
Role of fatty acids in obesity complicationsSubcutaneous adipose tissue
Abdominal FA
Non alcoholic steatohepatitis
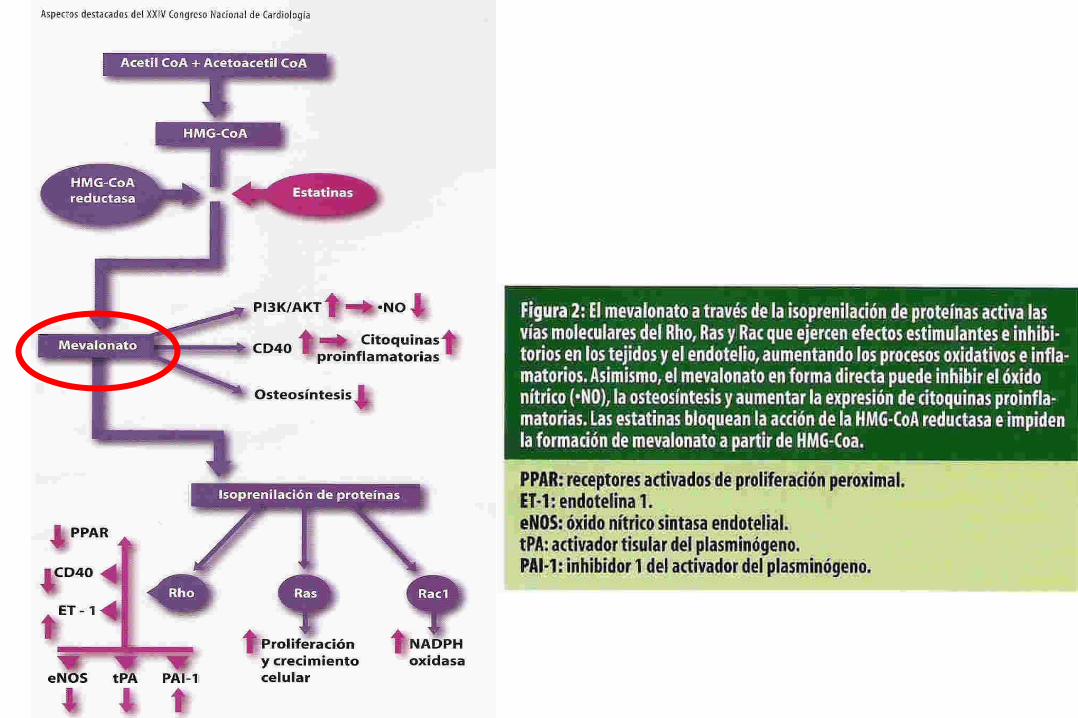
Bases moleculares de la resistencia a la insulina en obesidad
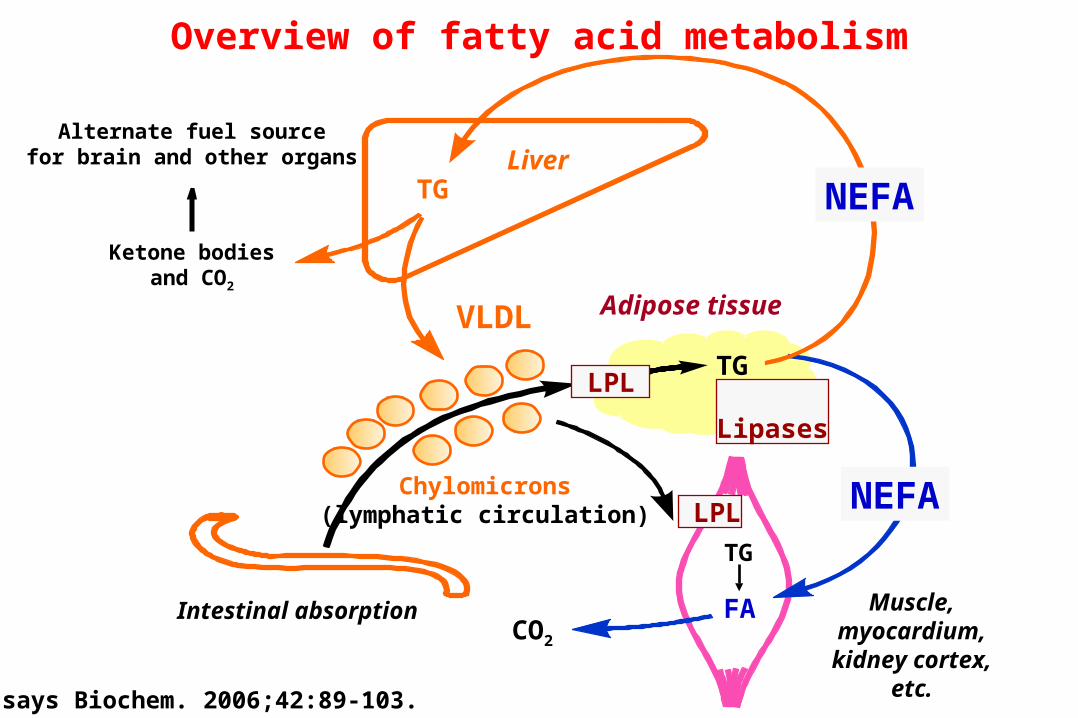
Alternate fuel sourcefor brain and other organs Liver
Ketone bodiesand CO2
VLDL Adipose tissue
TG LPL Lipases
Chylomicrons(lymphatic circulation)
Intestinal absorption Muscle,myocardium,kidney cortex,
etc.
LPL
TG
CO2
FA
TG NEFA
NEFA
Overview of fatty acid metabolism
Essays Biochem. 2006;42:89-103.
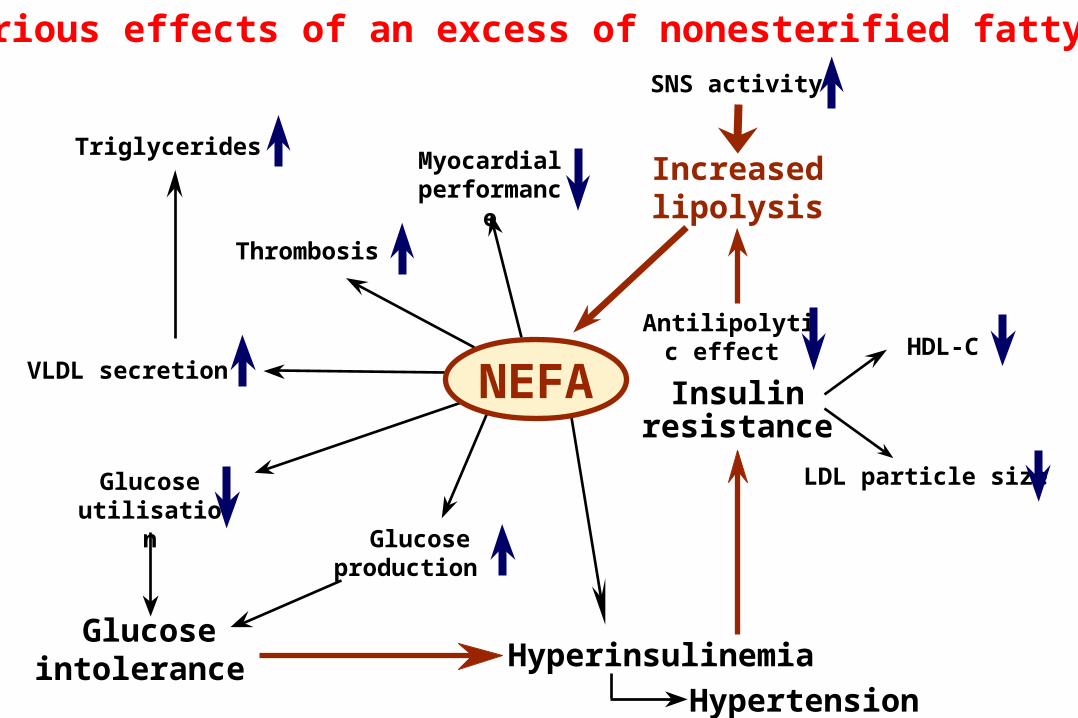
Hyperinsulinemia
Hypertension
Insulinresistance
Increased lipolysis
HDL-C
LDL particle size
Glucose production
Glucose utilisation
Glucose intolerance
VLDL secretion
Triglycerides
Thrombosis
Myocardial performance
SNS activity
Antilipolytic
effect
NEFA
Deleterious effects of an excess of nonesterified fatty acids
De Luca & Olefsky, FEBS Lett. 2008,582(1): 97–105
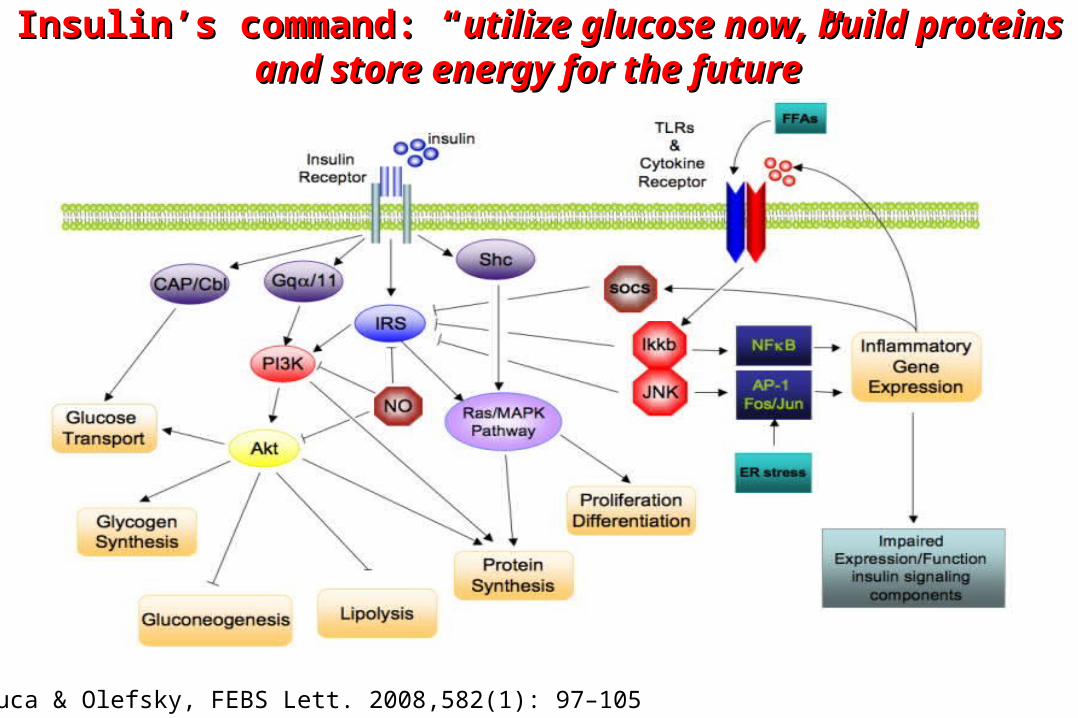
Insulin’s command: “Insulin’s command: “utilize glucose now, build proteins and utilize glucose now, build proteins and store energy for the futurestore energy for the future””
2
Jour
nal o
f Clin
ical
Inve
stiga
tion.
116
(7):1
793-
1801
, Jul
y 20
06.
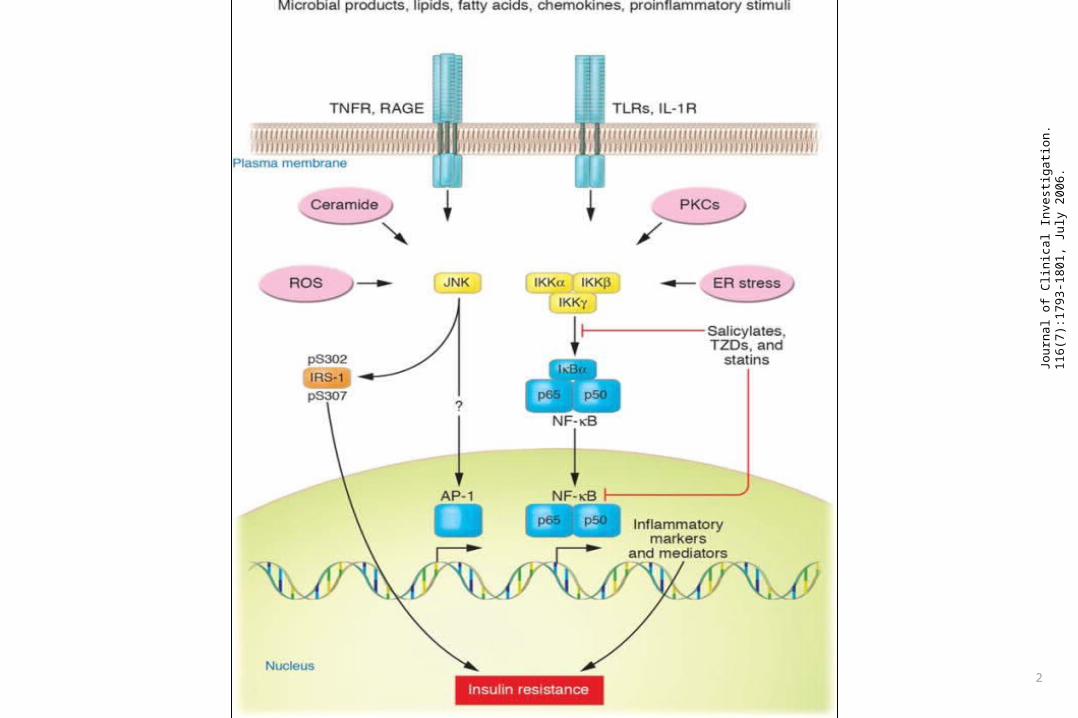
7
Nat
ure.
444
(712
1):8
60-8
67, D
ecem
ber 1
4, 2
006.
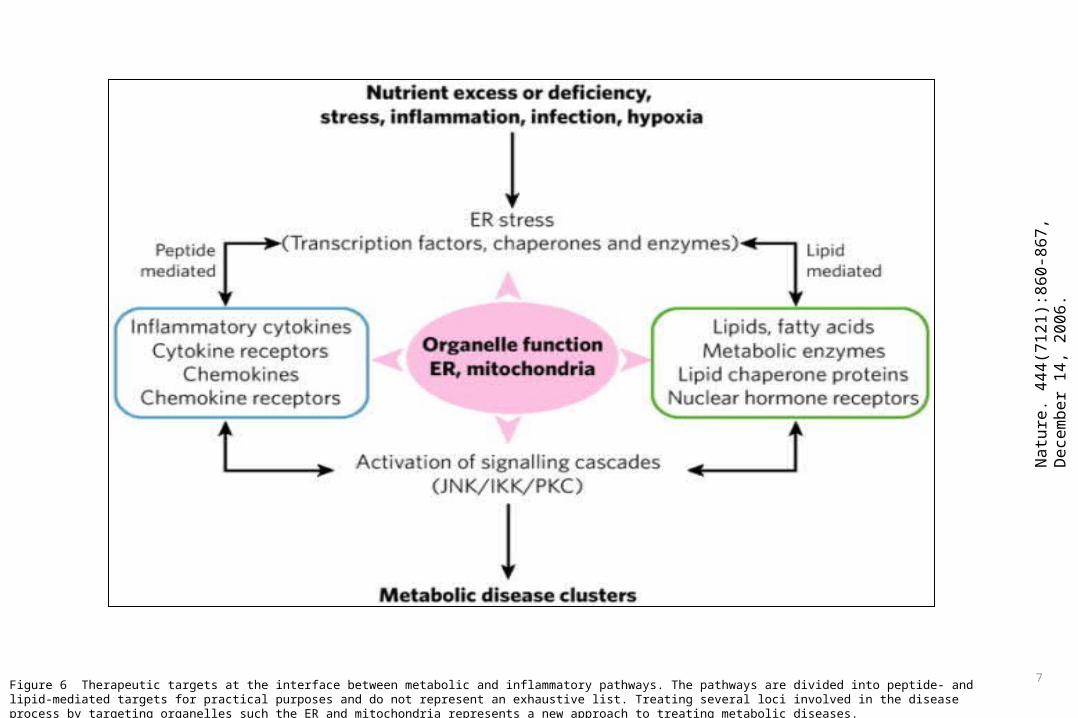
Figure 6 Therapeutic targets at the interface between metabolic and inflammatory pathways. The pathways are divided into peptide- and lipid-mediated targets for practical purposes and do not represent an exhaustive list. Treating several loci involved in the disease process by targeting organelles such the ER and mitochondria represents a new approach to treating metabolic diseases.
6
Nat
ure.
444
(712
1):8
60-8
67, D
ecem
ber 1
4, 2
006.
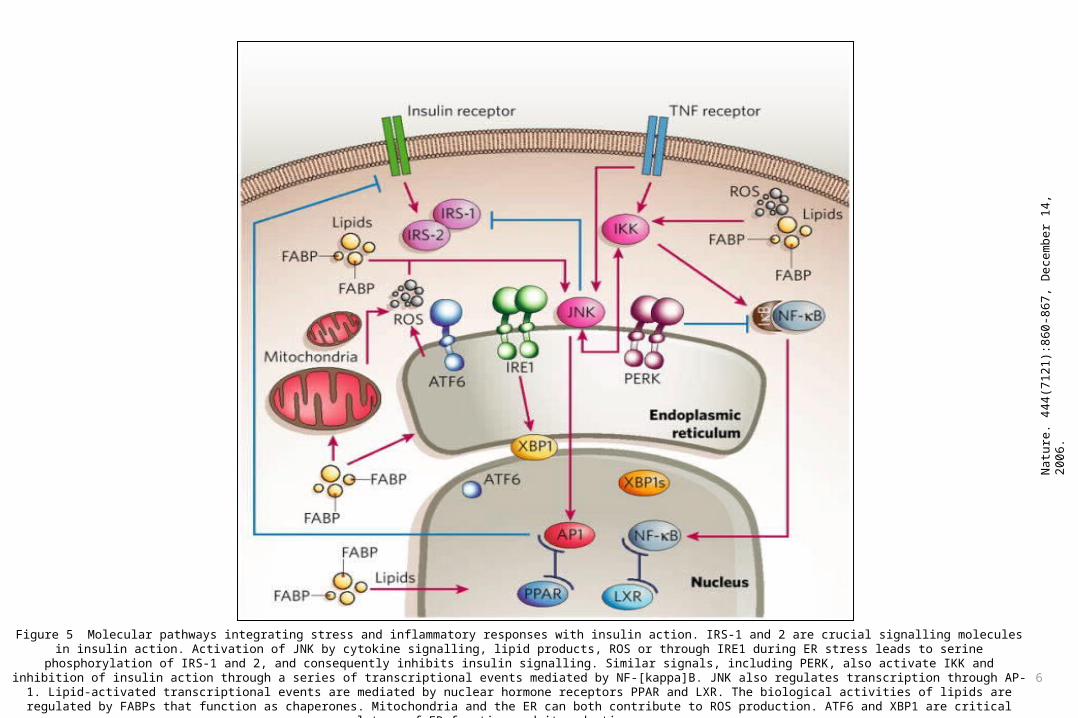
Figure 5 Molecular pathways integrating stress and inflammatory responses with insulin action. IRS-1 and 2 are crucial signalling molecules in insulin action. Activation of JNK by cytokine signalling, lipid products, ROS or through IRE1 during ER stress leads to serine phosphorylation of IRS-1 and 2, and consequently inhibits insulin signalling. Similar signals, including PERK, also activate IKK and inhibition of insulin action through a series of transcriptional events mediated by NF-[kappa]B. JNK also regulates transcription through AP-1. Lipid-activated transcriptional events are mediated by nuclear hormone receptors PPAR
and LXR. The biological activities of lipids are regulated by FABPs that function as chaperones. Mitochondria and the ER can both contribute to ROS production. ATF6 and XBP1 are critical regulators of ER function and its adaptive responses.
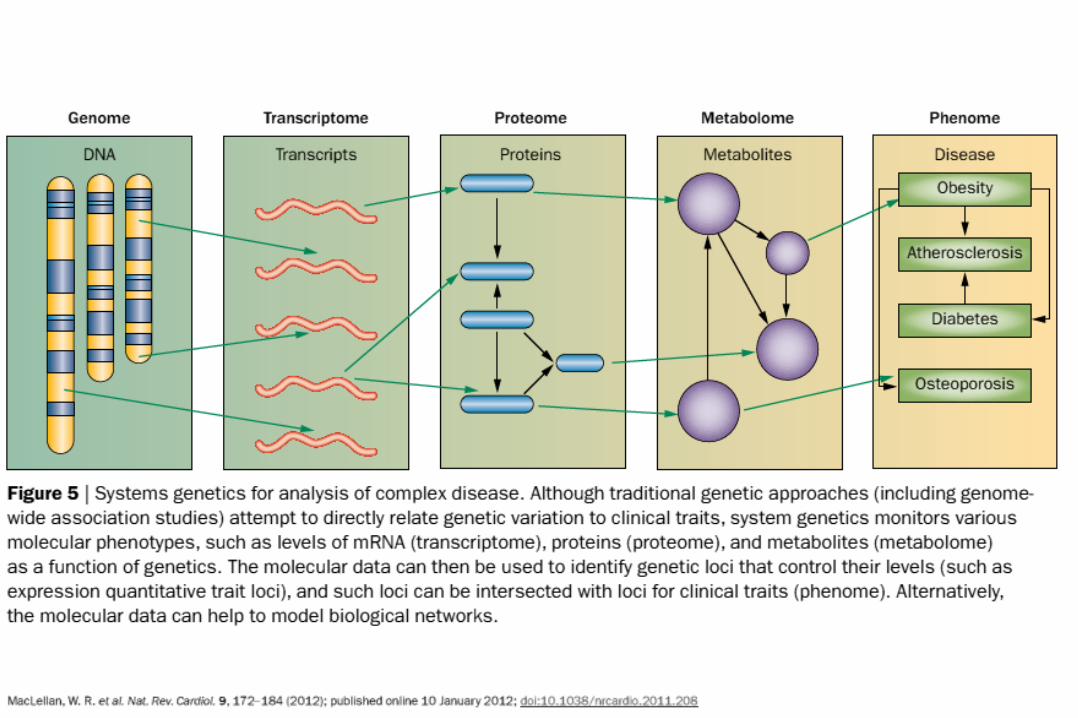
Genetics of obesity and its complications
50
Chromosome
GENE
RNA transcript
mRNA in nucleus
mRNA in cytoplasm
Polypeptide
ACTIVE PROTEIN
GENEExon
Intron
TailCap
NUCLEUS
Flowthroughnuclear envelope
CYTOPLASM
Breakdown of mRNA
Translation Broken-down mRNA
Broken-down protein
Cleavage/modification/activation
Breakdownof protein
DNA unpackingOther changes to DNA
TRANSCRIPTION
Addition of cap and tail
Splicing
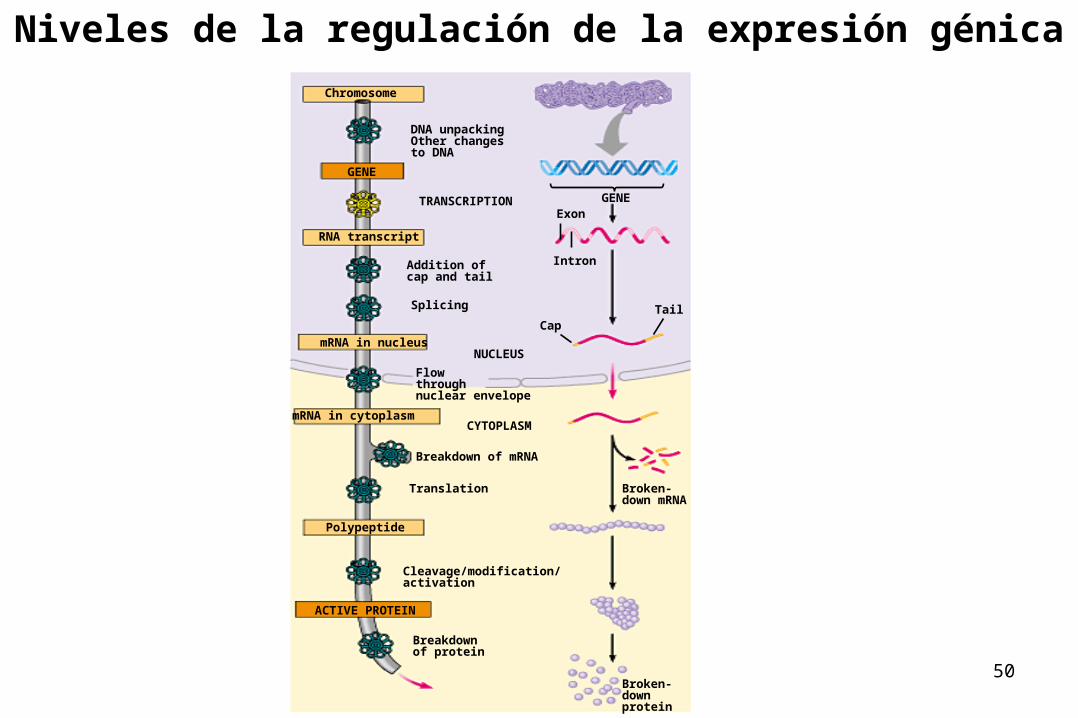
Niveles de la regulación de la expresión génica
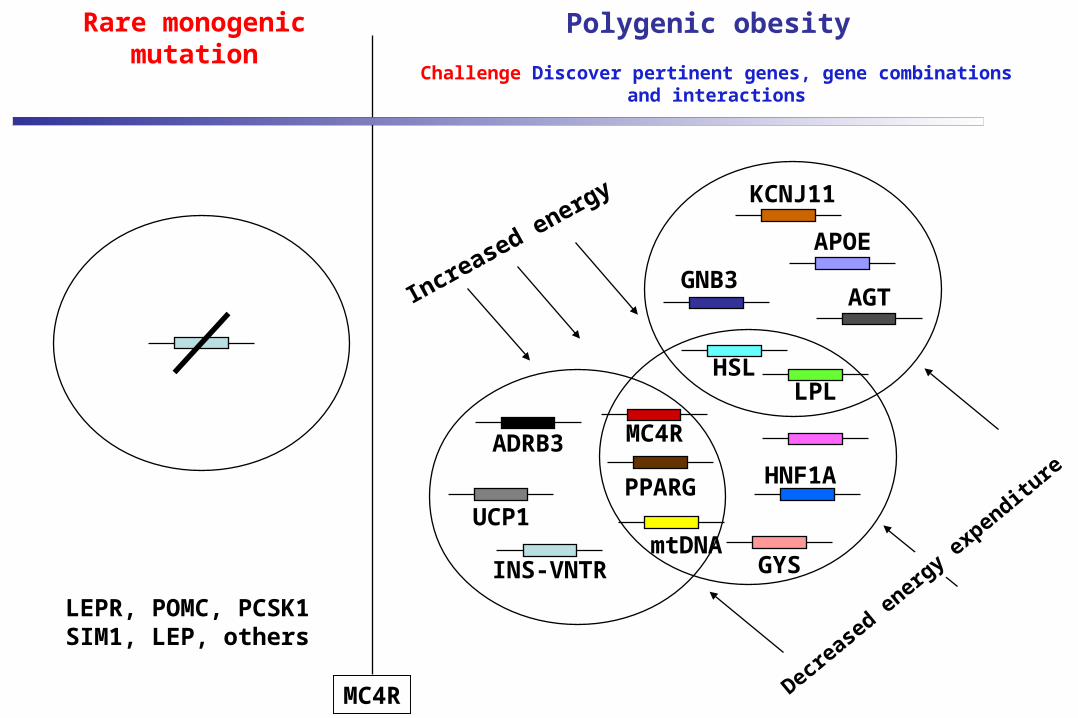
Polygenic obesity
Challenge Discover pertinent genes, gene combinations and interactions
Rare monogenic mutation
LEPR, POMC, PCSK1SIM1, LEP, others
Increase
d energy
INS-VNTR
MC4R
HNF1A
LPLHSL
PPARG
mtDNA
ADRB3
GYS
UCP1
Decre
ased
ener
gy ex
penditu
re
GNB3
APOE
AGT
KCNJ11
MC4R
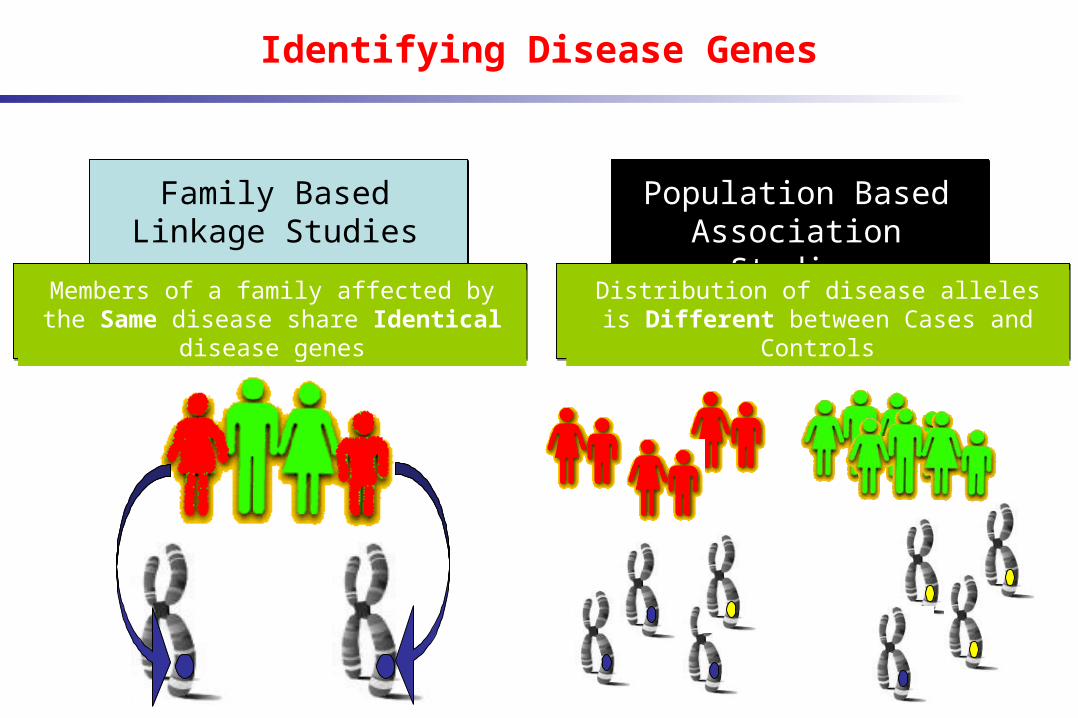
Identifying Disease Genes
Family Based Linkage Studies
Population Based Association Studies
Members of a family affected by the Same disease share Identical disease genes
Distribution of disease alleles is Different between Cases and Controls
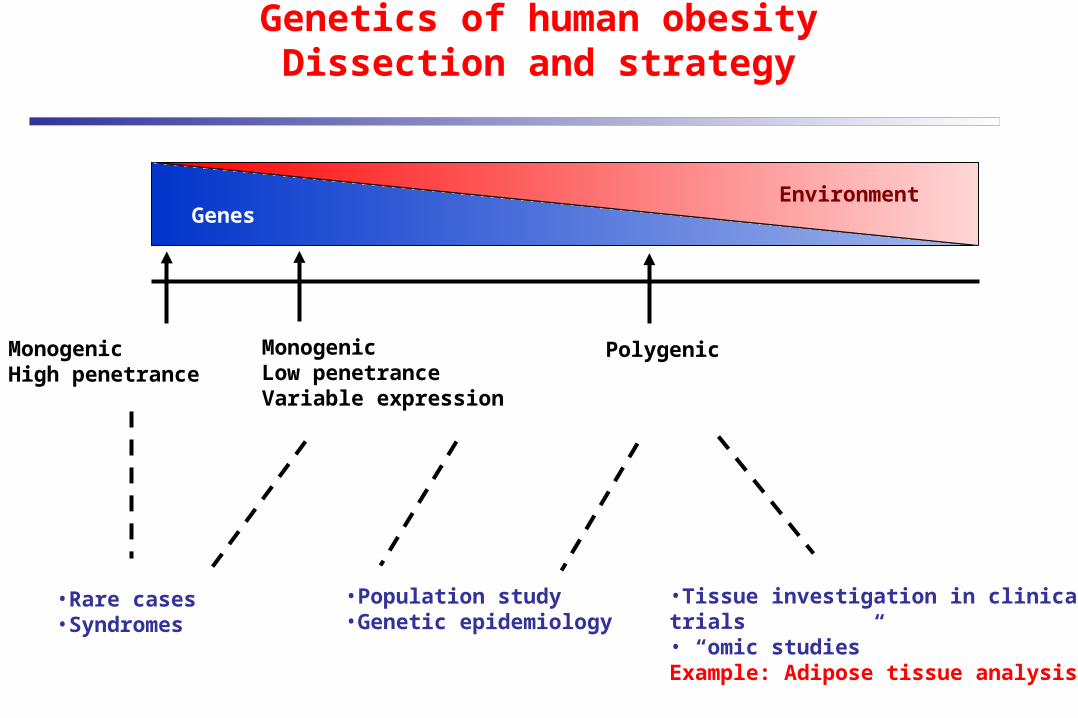
Genetics of human obesityDissection and strategy
EnvironmentGenes
MonogenicHigh penetrance
Monogenic Low penetranceVariable expression
Polygenic
•Rare cases•Syndromes
•Population study•Genetic epidemiology
•Tissue investigation in clinical trials • “omic studies”Example: Adipose tissue analysis
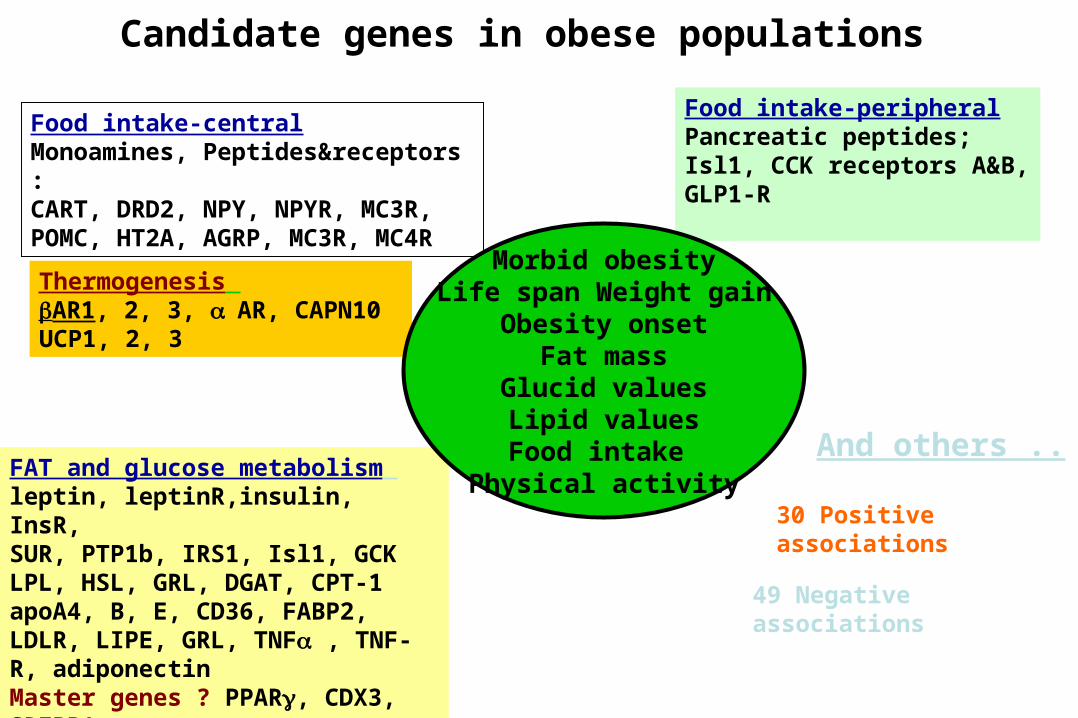
Candidate genes in obese populations
Food intake-centralMonoamines, Peptides&receptors : CART, DRD2, NPY, NPYR, MC3R, POMC, HT2A, AGRP, MC3R, MC4R
Food intake-peripheralPancreatic peptides; Isl1, CCK receptors A&B, GLP1-R
Thermogenesis AR1, 2, 3, AR, CAPN10UCP1, 2, 3
And others ..FAT and glucose metabolism leptin, leptinR,insulin, InsR, SUR, PTP1b, IRS1, Isl1, GCK LPL, HSL, GRL, DGAT, CPT-1apoA4, B, E, CD36, FABP2, LDLR, LIPE, GRL, TNF , TNF-R, adiponectinMaster genes ? PPAR, CDX3, SREBP1
49 Negative associations
30 Positive associations
Morbid obesityLife span Weight gain
Obesity onsetFat mass
Glucid valuesLipid valuesFood intake
Physical activity
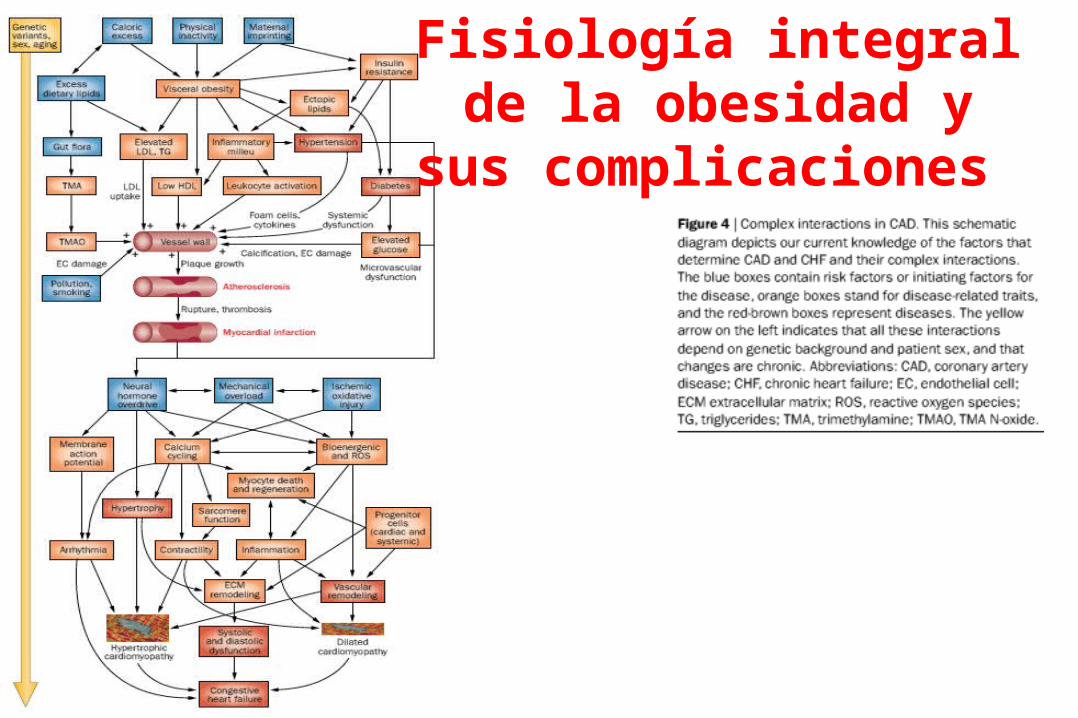
Fisiología integral de la obesidad y sus
complicaciones
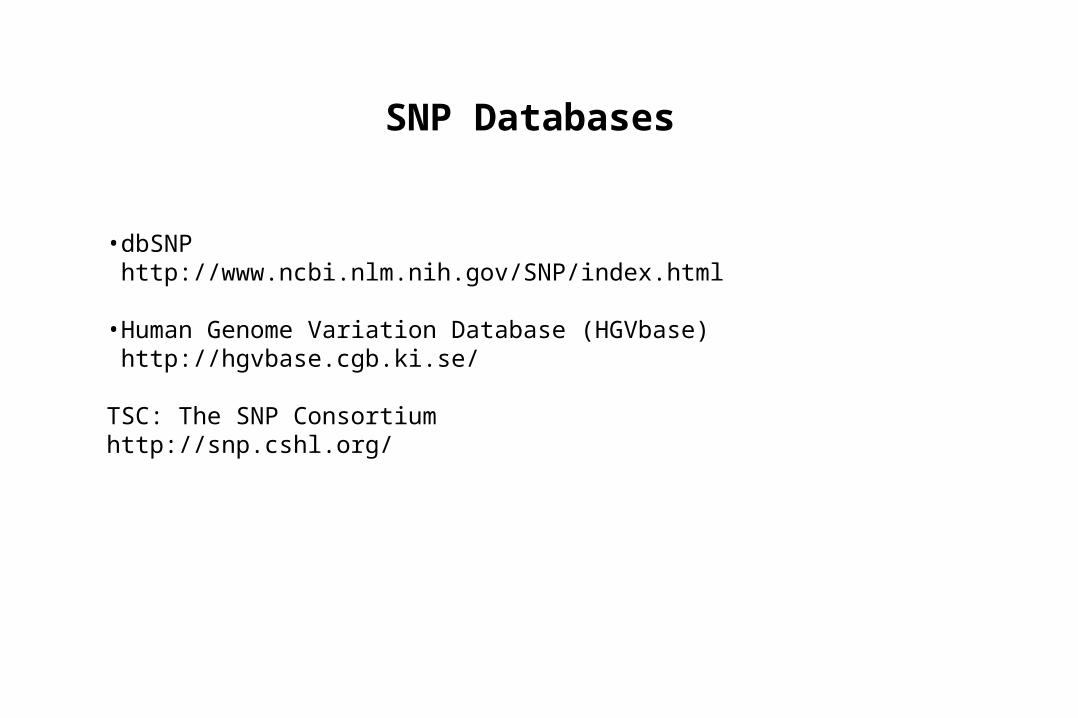
SNP Databases
•dbSNP http://www.ncbi.nlm.nih.gov/SNP/index.html
•Human Genome Variation Database (HGVbase) http://hgvbase.cgb.ki.se/
TSC: The SNP Consortiumhttp://snp.cshl.org/

Nuevos enfoques
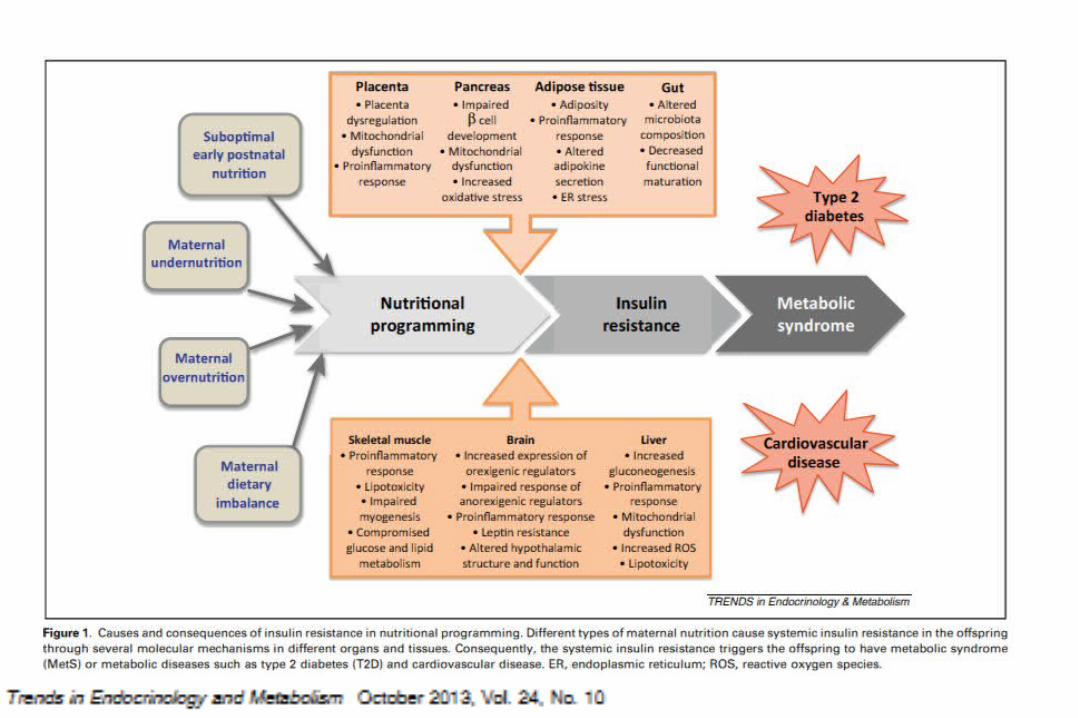
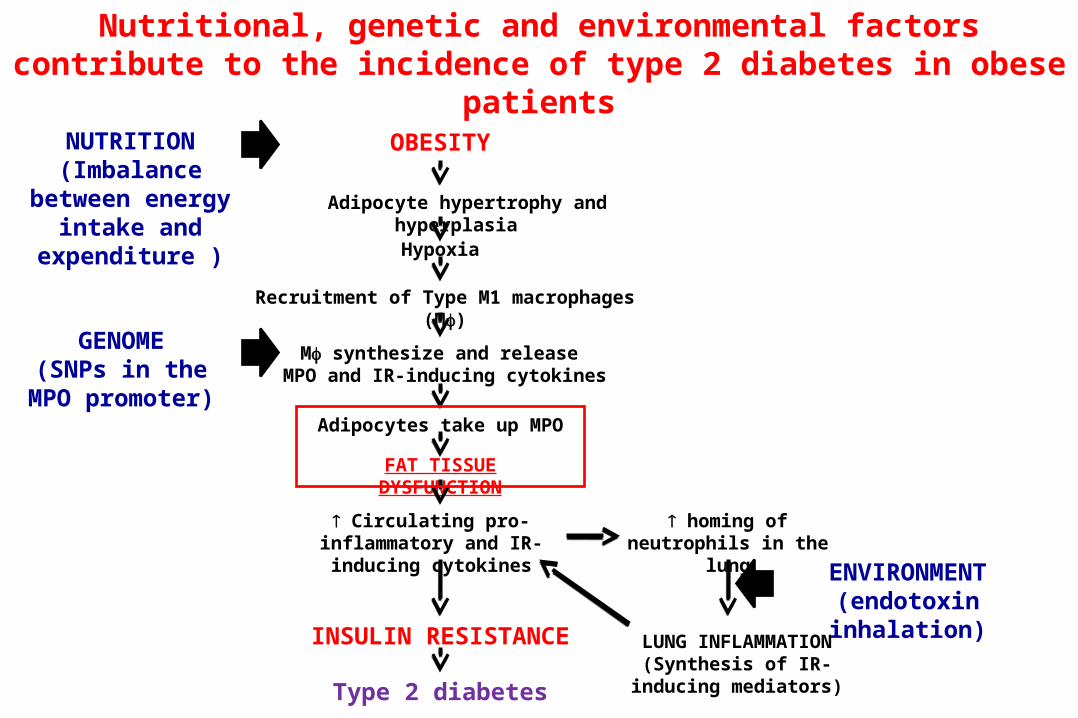
NUTRITION(Imbalance between
energy intake and expenditure )
GENOME(SNPs in the MPO
promoter)
ENVIRONMENT(endotoxin inhalation)
OBESITY
Adipocyte hypertrophy and hyperplasia
Hypoxia
Recruitment of Type M1 macrophages (M)
M synthesize and release MPO and IR-inducing cytokines
Adipocytes take up MPO
FAT TISSUE DYSFUNCTION
homing of neutrophils in the lung
LUNG INFLAMMATION(Synthesis of IR-inducing
mediators)
Circulating pro-inflammatory and IR-inducing cytokines
INSULIN RESISTANCE
Type 2 diabetes
Nutritional, genetic and environmental factors contribute to the incidence of type 2 diabetes in obese patients