Embed Size (px)
Citation preview

www.huawei.com
Fixed broadband solutions for rural areas: a techno -economic analysis
Presentation at the Department of Economics, Universidad Complutense de Madrid
Madrid, Spain, November 2014
Juan Rendon SchneirSenior Finance and Regulatory Manager Huawei Western Europe DepartmentDüsseldorf, [email protected]
Page 2Commercial in Confidence
Content
• Introduction
• Network scenarios
• Costing methodology
• Results
• Conclusions
Page 3Commercial in Confidence
IntroductionStatus of NGA deployment in the European Union
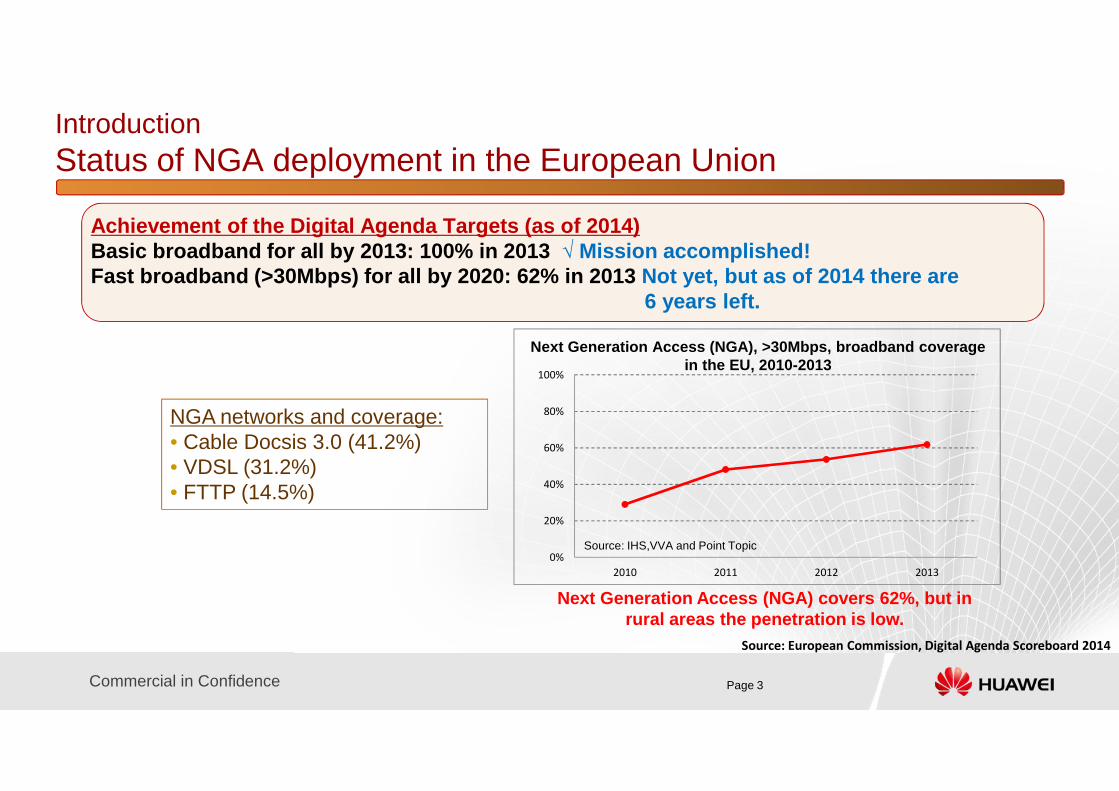
Achievement of the Digital Agenda Targets (as of 20 14)Basic broadband for all by 2013: 100% in 2013 √ Mission accomplished!Fast broadband (>30Mbps) for all by 2020: 62% in 20 13 Not yet, but as of 2014 there are
6 years left.
0%
20%
40%
60%
80%
100%
2010 2011 2012 2013
Next Generation Access (NGA), >30Mbps, broadband cov erage in the EU, 2010-2013
Source: IHS,VVA and Point Topic
Next Generation Access (NGA) covers 62%, but in rural areas the penetration is low.
Source: European Commission, Digital Agenda Scoreboard 2014
NGA networks and coverage: • Cable Docsis 3.0 (41.2%)• VDSL (31.2%)• FTTP (14.5%)
Page 4Commercial in Confidence
IntroductionLack of NGA deployment in rural areas in Europe
Source: European Commission, Digital Agenda Scoreboard 2014
0%
10%
20%
30%
40%
50%
60%
70%
80%
90%
100%
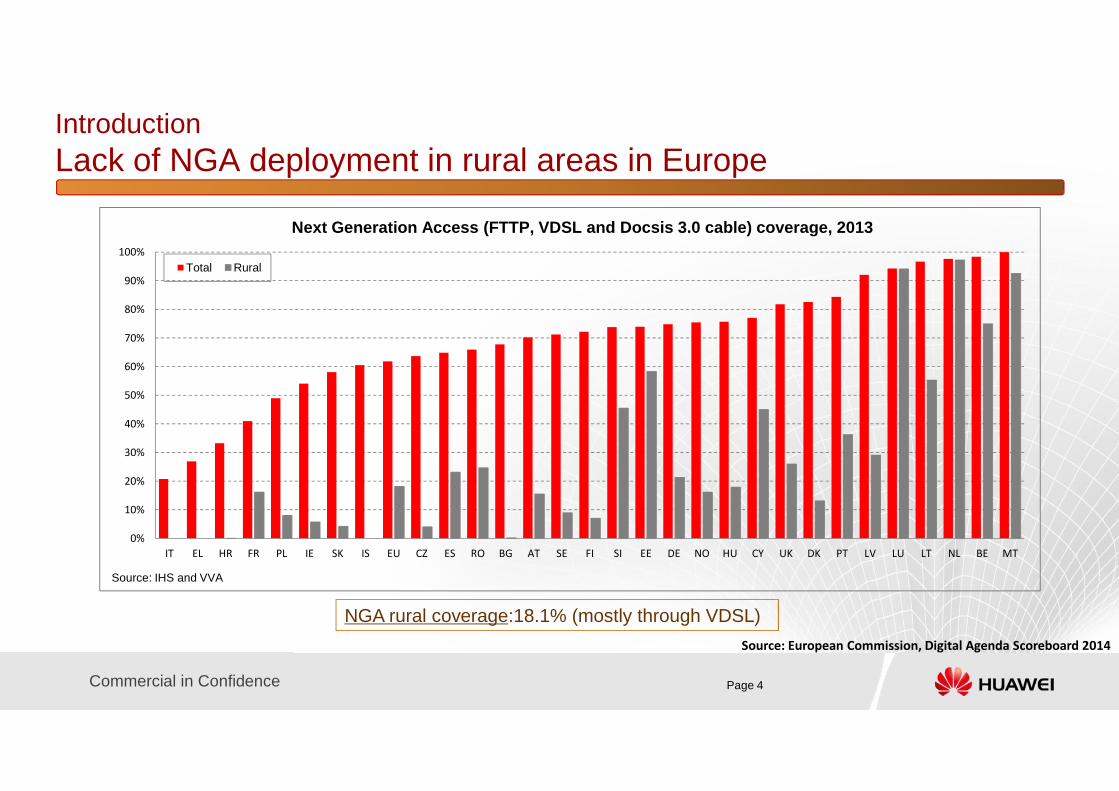
IT EL HR FR PL IE SK IS EU CZ ES RO BG AT SE FI SI EE DE NO HU CY UK DK PT LV LU LT NL BE MT
Total Rural
Next Generation Access (FTTP, VDSL and Docsis 3.0 ca ble) coverage, 2013
Source: IHS and VVA
NGA rural coverage:18.1% (mostly through VDSL)
Page 5Commercial in Confidence
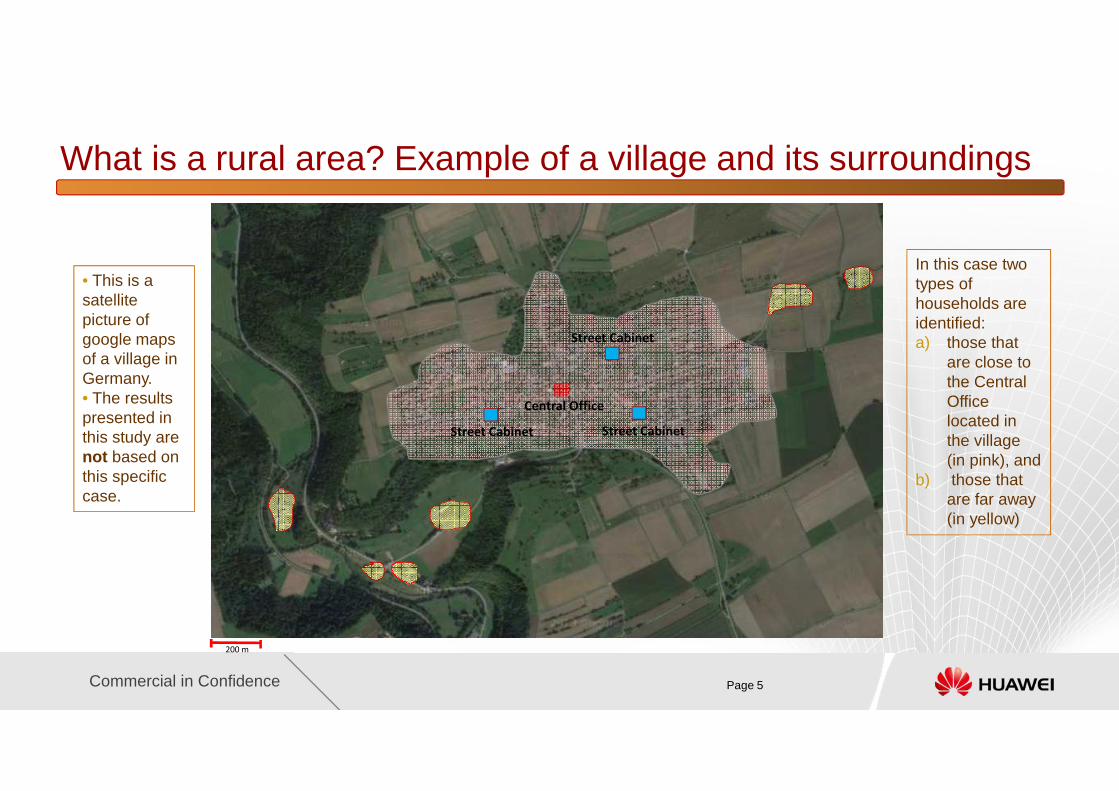
What is a rural area? Example of a village and its surroundings
200 m
Central Office
• This is a satellite picture of google maps of a village in Germany. • The results presented in this study are not based on this specific case.
In this case two types of households are identified: a) those that
are close to the Central Office located in the village (in pink), and
b) those that are far away (in yellow)
Street Cabinet Street Cabinet
Street Cabinet
Page 6Commercial in Confidence
Australian NBN Co: Importance of the cost analysis
Why 93% with fibre? The cost curve provides the ans wer
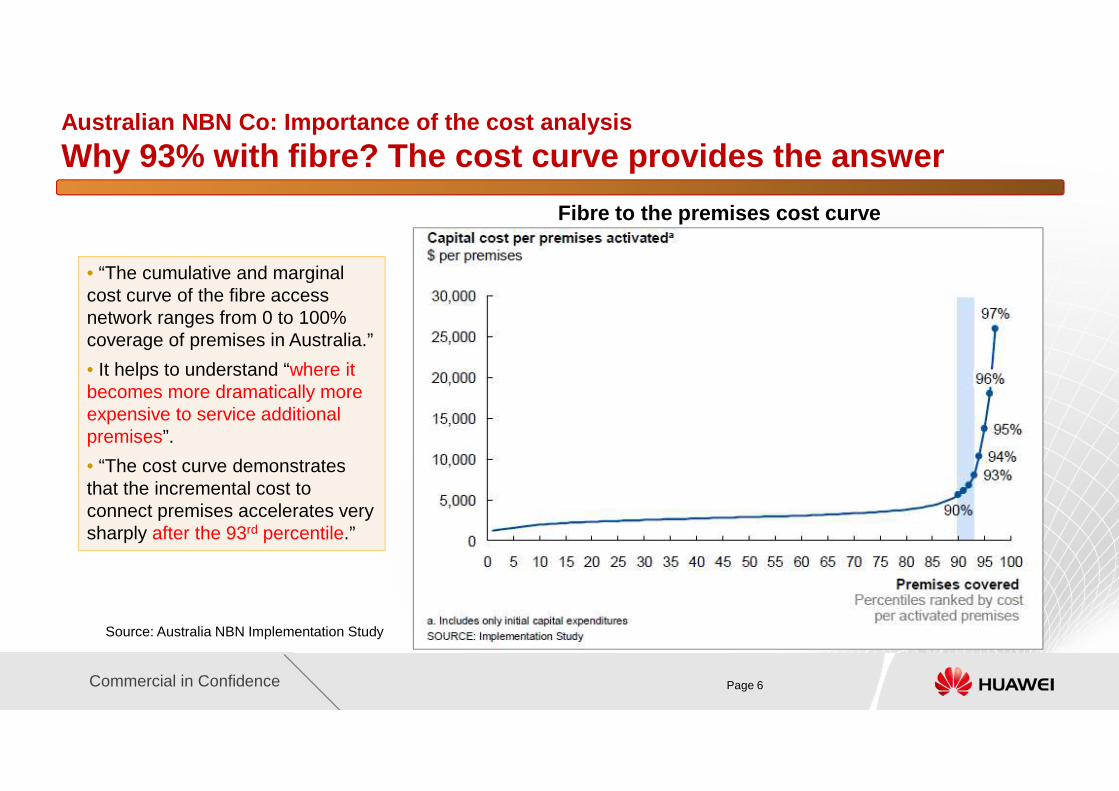
• “The cumulative and marginal cost curve of the fibre access network ranges from 0 to 100% coverage of premises in Australia.”
• It helps to understand “where it becomes more dramatically more expensive to service additional premises”.
• “The cost curve demonstrates that the incremental cost to connect premises accelerates very sharply after the 93rd percentile.”
Source: Australia NBN Implementation Study
Fibre to the premises cost curve
Page 7Commercial in Confidence
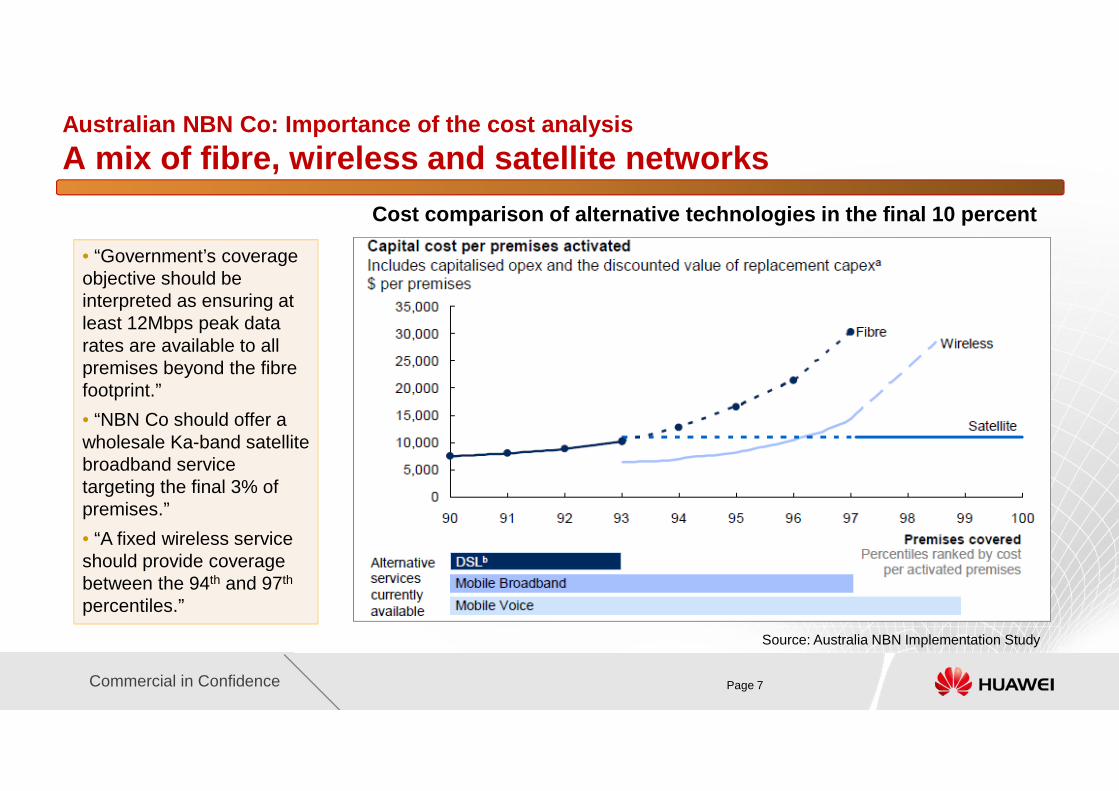
Australian NBN Co: Importance of the cost analysis
A mix of fibre, wireless and satellite networks
Source: Australia NBN Implementation Study
• “Government’s coverage objective should be interpreted as ensuring at least 12Mbps peak data rates are available to all premises beyond the fibrefootprint.”
• “NBN Co should offer a wholesale Ka-band satellite broadband service targeting the final 3% of premises.”
• “A fixed wireless service should provide coverage between the 94th and 97th
percentiles.”
Cost comparison of alternative technologies in the final 10 percent
Page 8Commercial in Confidence
• In many cases NGA deployment in urban areas - and for a few suburban areas - can
be provided by means of competition. The business case in these areas is rather clear.
• As of 2014, there is very little deployment of NGA networks in rural areas.
• Policy makers and operators in Europe are examining different possibilities to
provide high-speed fixed broadband services in rural areas over the next years.
• This presentation examines the use of different NGA networks in rural areas.
• A techno-economic analysis of the following networks is provided:
• FTTC Vectoring
• FTTdP-Street G.fast
• FTTdP-Building G.fast
• FTTH GPON
IntroductionMotivation and Objectives
Page 9Commercial in Confidence
Content
• Introduction
• Network scenarios
• Costing methodology
• Results
• Conclusions
Page 10Commercial in Confidence
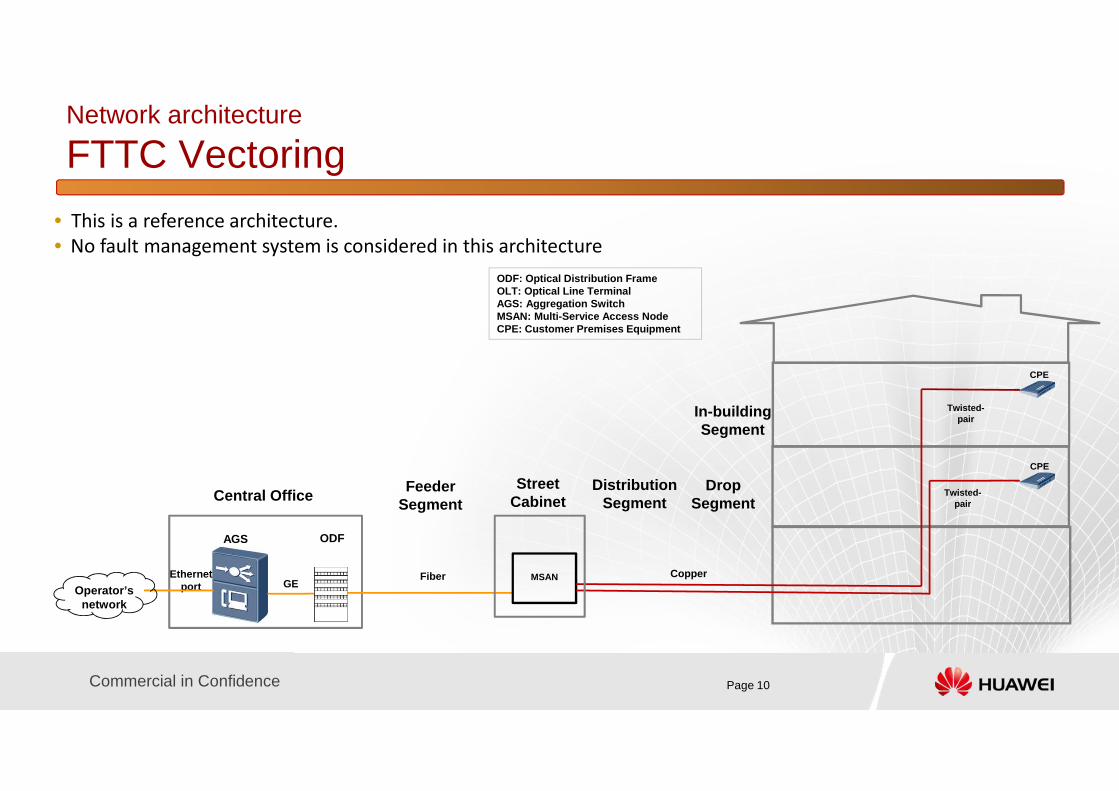
Network architecture
FTTC Vectoring
• This is a reference architecture.
• No fault management system is considered in this architecture
Feeder Segment
Distribution SegmentCentral Office
ODFAGS
EthernetportOperator’s
network
GE
ODF: Optical Distribution FrameOLT: Optical Line TerminalAGS: Aggregation SwitchMSAN: Multi-Service Access NodeCPE: Customer Premises Equipment
CopperMSAN
CPE
Twisted-pair
CPE
Twisted-pair
In-building Segment
Fiber
Street Cabinet
Drop Segment

Page 11Commercial in Confidence
Network architecture
FTTdP-Street G.fast
• This is a reference architecture.
• No fault management system is considered in this architecture
Feeder Segment
Distribution Segment
Street Cabinet Central Office
Splitter 1:8
ODFOLT
Ethernetport FiberOperator’s
network
GPON port Fiber
DPU Cabinet
RPF CPE
Copper
RPF CPE
CopperIn-building Segment
Drop Segment
MDF
Copper
CPE: Customer Premises EquipmentDPU: Distribution Point UnitMDF: Main Distribution FrameODF: Optical Distribution FrameOLT: Optical Line TerminalRPF: Reverse Power Feeding
Page 12Commercial in Confidence
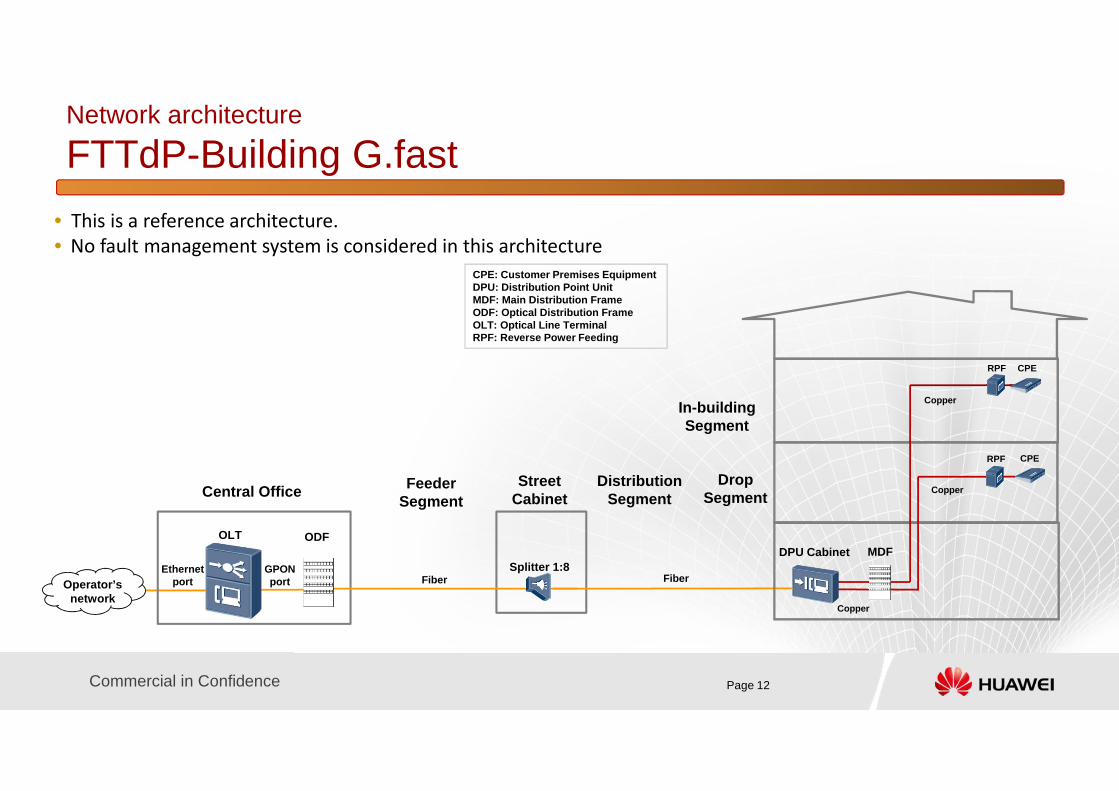
Network architecture
FTTdP-Building G.fast
• This is a reference architecture.
• No fault management system is considered in this architecture
Feeder Segment
Distribution Segment
Street Cabinet Central Office
Splitter 1:8
ODFOLT
Ethernetport FiberOperator’s
network
GPON port Fiber
DPU Cabinet
RPF CPE
Copper
RPF CPE
CopperIn-building Segment
Drop Segment
MDF
Copper
CPE: Customer Premises EquipmentDPU: Distribution Point UnitMDF: Main Distribution FrameODF: Optical Distribution FrameOLT: Optical Line TerminalRPF: Reverse Power Feeding
Page 13Commercial in Confidence
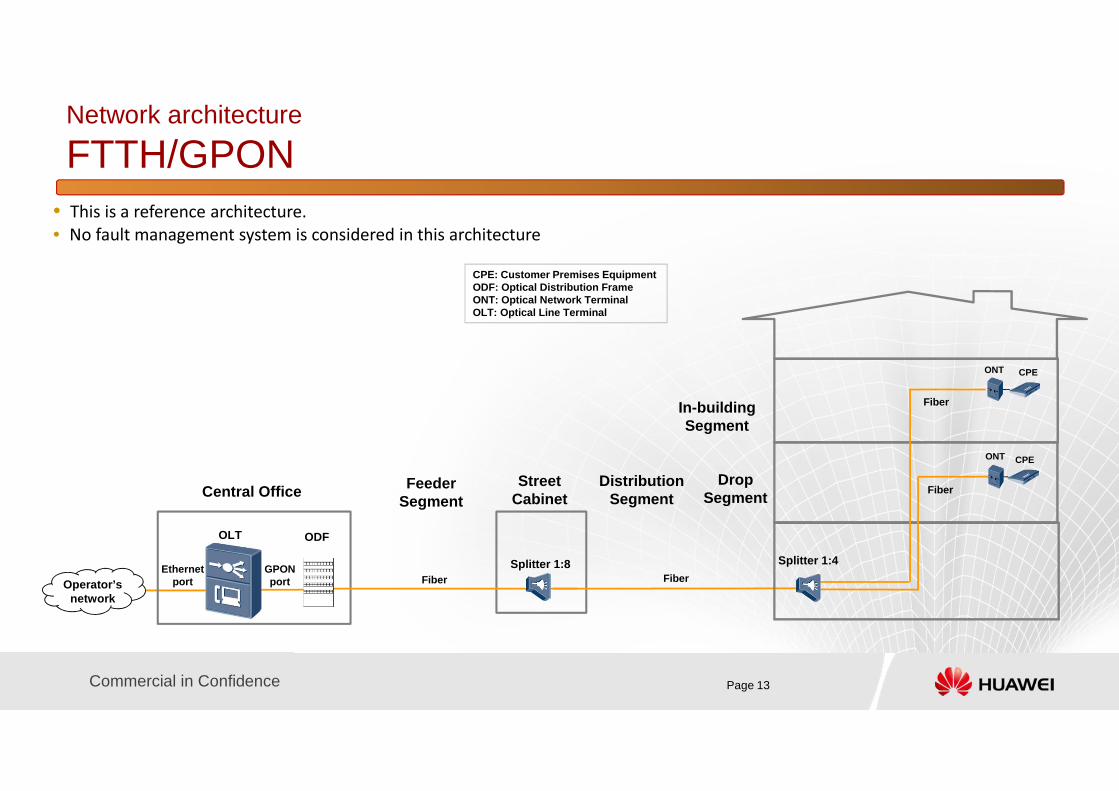
Network architecture
FTTH/GPON• This is a reference architecture.
• No fault management system is considered in this architecture
Feeder Segment
Distribution Segment
Street Cabinet Central Office
Splitter 1:8
ODFOLT
Ethernetport FiberOperator’s
network
GPON port Fiber
Fiber
FiberIn-building Segment
Drop Segment
Splitter 1:4
CPE: Customer Premises EquipmentODF: Optical Distribution FrameONT: Optical Network TerminalOLT: Optical Line Terminal
ONT CPE
CPEONT
Page 14Commercial in Confidence
Content
• Introduction
• Network scenarios
• Costing methodology
• Results
• Conclusions
Page 15Commercial in Confidence
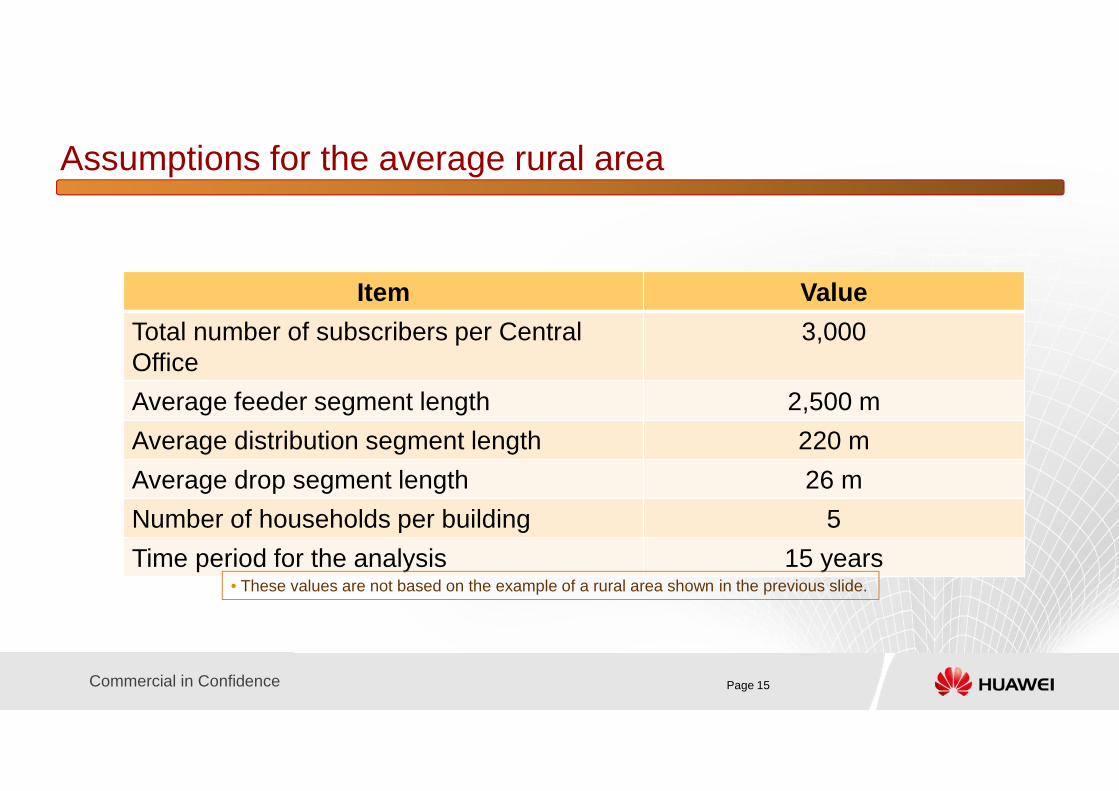
Assumptions for the average rural area
Item Value
Total number of subscribers per Central Office
3,000
Average feeder segment length 2,500 m
Average distribution segment length 220 m
Average drop segment length 26 m
Number of households per building 5
Time period for the analysis 15 years• These values are not based on the example of a rural area shown in the previous slide.
Page 16Commercial in Confidence
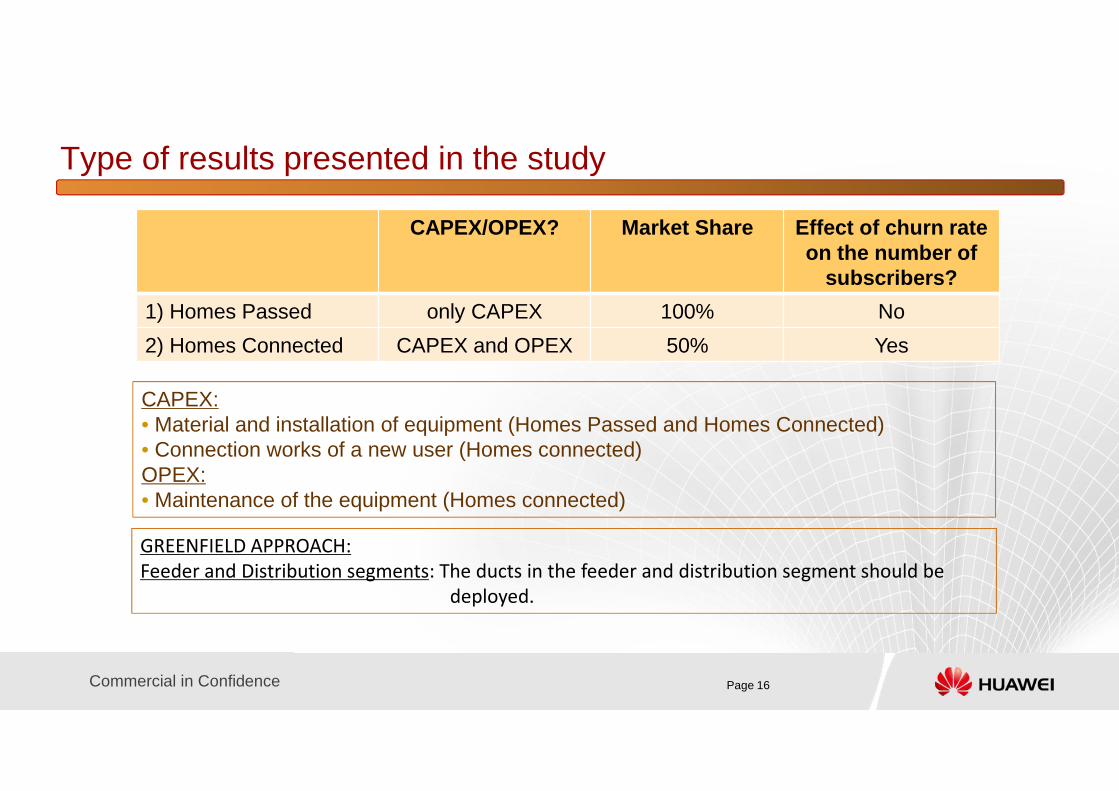
Type of results presented in the study
CAPEX/OPEX? Market Share Effect of churn rate on the number of
subscribers?
1) Homes Passed only CAPEX 100% No
2) Homes Connected CAPEX and OPEX 50% Yes
CAPEX: • Material and installation of equipment (Homes Passed and Homes Connected)• Connection works of a new user (Homes connected)OPEX: • Maintenance of the equipment (Homes connected)
GREENFIELD APPROACH:
Feeder and Distribution segments: The ducts in the feeder and distribution segment should be
deployed.
Page 17Commercial in Confidence
Content
• Introduction
• Network scenarios
• Costing methodology
• Results
• Conclusions
Page 18Commercial in Confidence
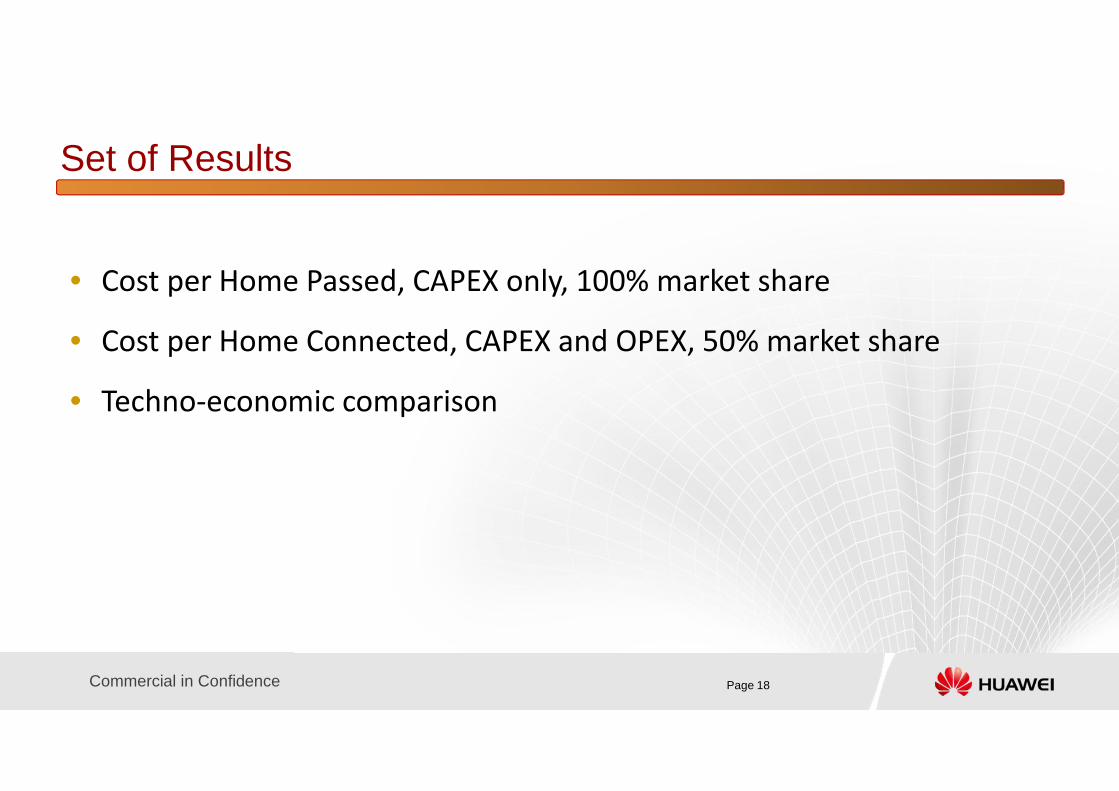
Set of Results
• Cost per Home Passed, CAPEX only, 100% market share
• Cost per Home Connected, CAPEX and OPEX, 50% market share
• Techno-economic comparison
Page 19Commercial in Confidence
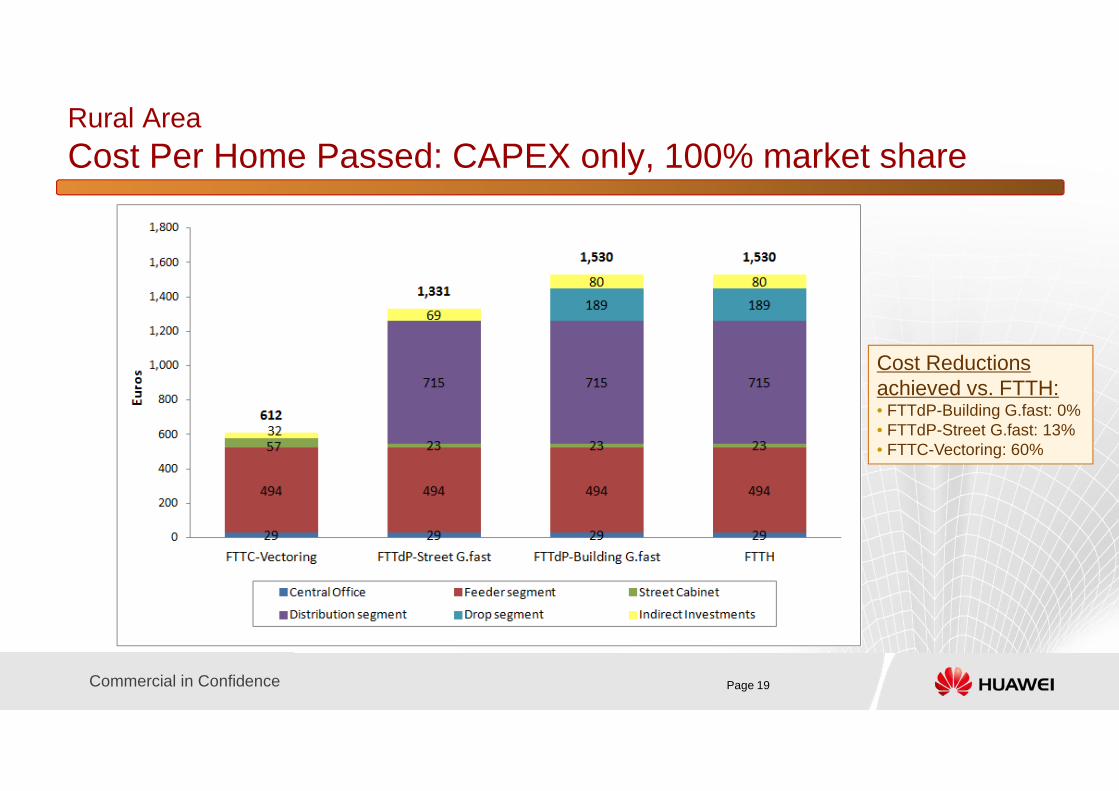
Rural Area
Cost Per Home Passed: CAPEX only, 100% market share
Cost Reductions achieved vs. FTTH: • FTTdP-Building G.fast: 0%• FTTdP-Street G.fast: 13%• FTTC-Vectoring: 60%
Page 20Commercial in Confidence
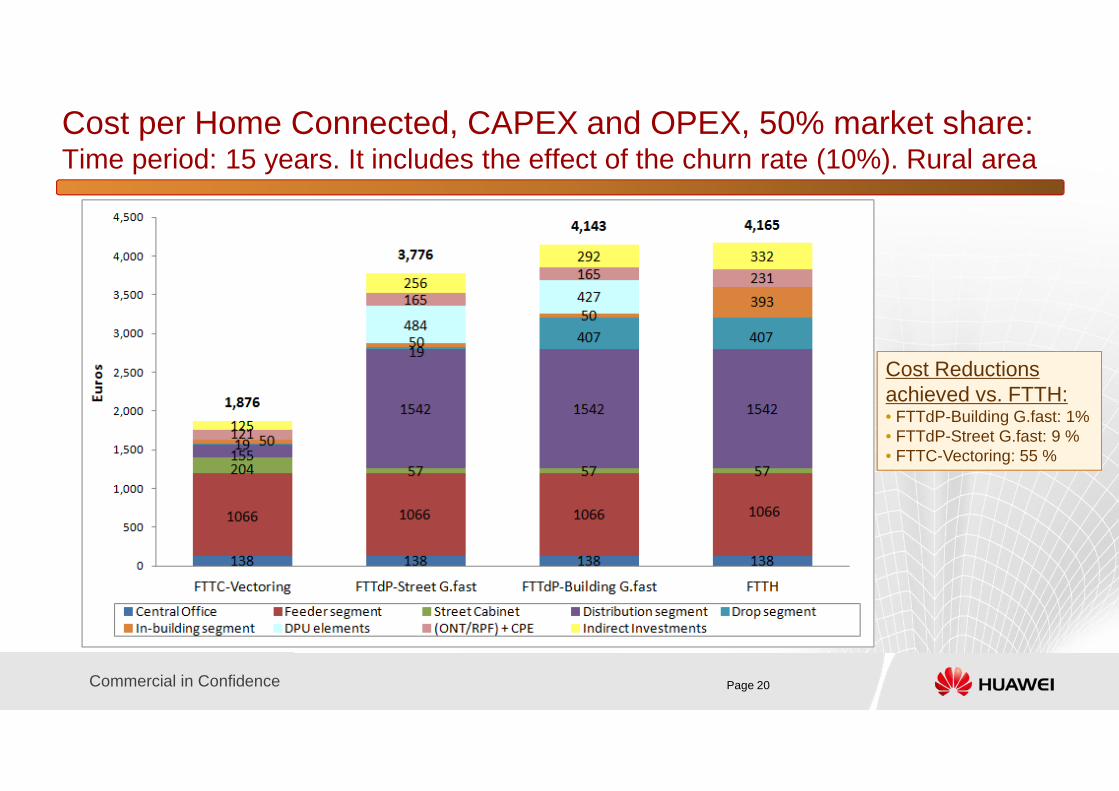
Cost per Home Connected, CAPEX and OPEX, 50% market share:Time period: 15 years. It includes the effect of the churn rate (10%). Rural area
Cost Reductions achieved vs. FTTH: • FTTdP-Building G.fast: 1%• FTTdP-Street G.fast: 9 %• FTTC-Vectoring: 55 %
Page 21Commercial in Confidence
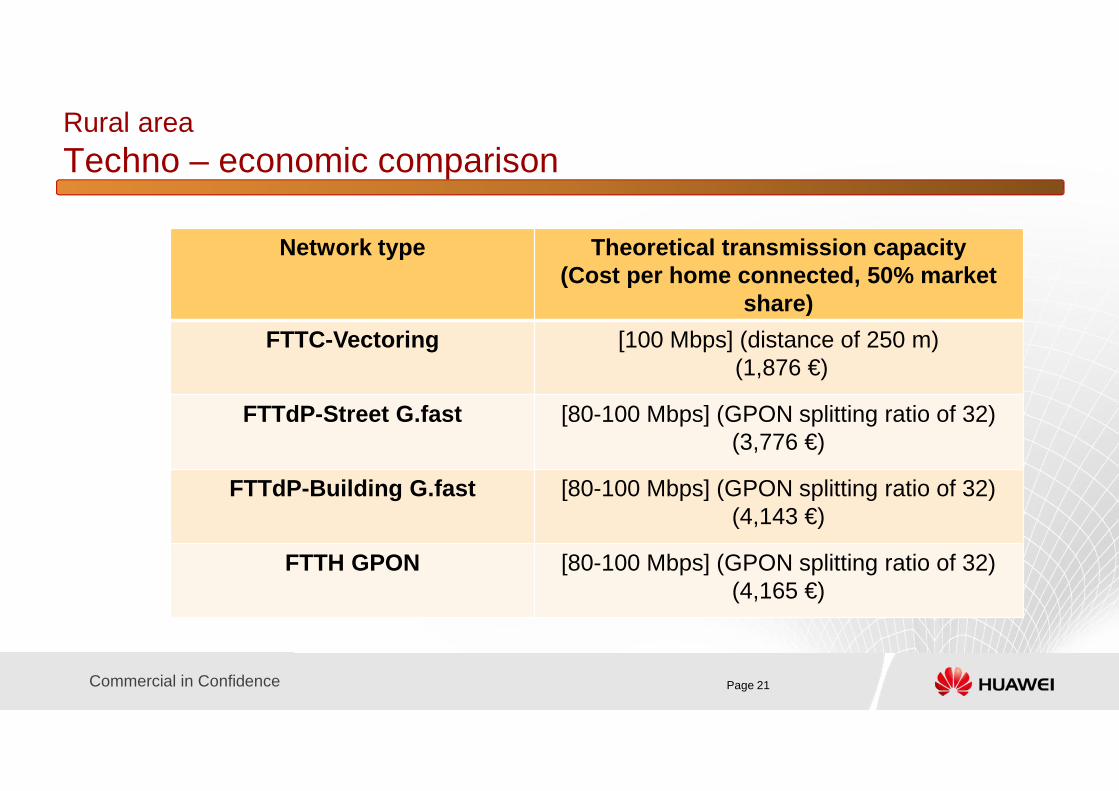
Rural area
Techno – economic comparison
Network type Theoretical transmission capacity (Cost per home connected, 50% market
share)
FTTC-Vectoring [100 Mbps] (distance of 250 m)(1,876 €)
FTTdP-Street G.fast [80-100 Mbps] (GPON splitting ratio of 32)(3,776 €)
FTTdP-Building G.fast [80-100 Mbps] (GPON splitting ratio of 32)(4,143 €)
FTTH GPON [80-100 Mbps] (GPON splitting ratio of 32)(4,165 €)
Page 22Commercial in Confidence
Content
• Introduction
• Network scenarios
• Costing methodology
• Results
• Conclusions
Page 23Commercial in Confidence
Conclusions
• In rural areas, the cost of FTTC-Vectoring is lower than the cost of the
other networks described (FTTH and FTTdP G.fast)
• The cost of FTTdP G.fast is lower than the cost of FTTH.
• The question that operators and policy makers will ask is: which
broadband capacity should be provided?
• More rural scenarios will be studied to understand better the technical
and cost implications of fixed broadband access networks.
Thank Youwww.huawei.com
Copyright©2013 Huawei Technologies Co., Ltd. All Rights Reserved.
The information in this document may contain predictive statements including, without limitation, statements regarding the future financialand operating results, future product portfolio, new technology, etc. There are a number of factors that could cause actual results anddevelopments to differ materially from those expressed or implied in the predictive statements. Therefore, such information is provided forreference purpose only and constitutes neither an offer nor an acceptance. Huawei may change the information at any time without notice.