Embed Size (px)
Citation preview

វិទ សានបណ្ដុះបណា្ដល និង ្រសាវ្រជាវេដើម ីអភិវឌ ន៍កម្ពុជា
CDRI—Cambodia’s leading independent development policy research institute
របាយការណ៍ថ្មីៗស្តីពីេសដ្ឋកិច្ចកម្ពុជា Flash Report on the Cambodian Economy
កញញ ២០១២ / September 2012
រត័ន វឌ ន / Roth Vathana ប៉ុន ដូរ ី ¼ Pon Dorina
បកែ្របេ យ៖ យូ សិទធីរទិធ និង េខង េសង
ភនេំពញ កមពុជ Phnom Penh, Cambodia
TO SUBSCRIBE, PLEASE CONTACT:
Office address: #56, Street 315, Tuol Kork, Phnom Penh, Cambodia; postal address: CDRI, PO Box 622 Phnom Penh, Cambodia; tel: (855-23) 881-384/881-701/881-916/883-603 ; fax: (855-23) 880-734 ; email: [email protected]; website: http://www.cdri.org.kh
ISSN 1810-6358

Cambodia Economic Flash Report –September 2012
Cambodia Development Resource Institute – Page 2
ករបក្រ យ ងសំខន់ៗ របយករណ៍េនះ បក្រ យពសូីចនករេសដ្ឋកិចចមយួចនួំនរបស់កមពុជ នងិប ្ត ្របេទសជៃដគូពណិជជកមម េ យេធ្វើករេ្រប បេធៀបតេួលខកនុងែខថមីៗេនះ ជមយួនងឹែខមនុៗ។ កនុង្រតីមសទី២ ឆន ២ំ០១២ វនិិេយគគតិជ្រទពយសកមមជប់ បខ់ងឧស ហកមមអនុមត័េ យ CDC ធ្ល កចុ់ះ ១៦,៧% មក្រតមឹ ១៧៣,៧ ន ដុ ្ល រ េធៀបនងឹ្រតមីសមនុ ឬធ្ល កចុ់ះ ៣២,៤% េធៀបនងឹមយួឆន មំនុ។ កនុងែខកកក ចនំួនេភញ វបរេទសមកដល់សរបុេកើន ១៣% េធៀបនងឹែខមុន ឬេកើន ១៩% េធៀបនងឹមយួឆន មំនុ។ េភញ វមកលំែហេកើន ១៣,០% (១៥,០% េធៀបនងឹមយួឆន មំនុ) មកេធ្វើជំនួញេកើន ១២,០% (១៧,០% េធៀបនងឹមយួឆន ំមនុ) នងិមកកនុងបណំងេផ ងៗេកើន ៣០% (៣៨១% េធៀបនងឹមយួឆន មំនុ)។ េនែខកកក តៃម្លអនុមតគិេ្រមង ងសងភ់មូ្ិរគឹះនងិផទះ េកើន ៧៩៦,៥% (១៥,៥% េធៀបមយួឆន មុំន) ដល់ ១២,៨ នដុ ្ល រ គេ្រមងេផ ងៗេកើន ៨០៧,២% (១៧៣,២% េធៀបនងឹមយួឆន មំុន) ដល់ ៣៤,១ នដុ ្ល រ។ តៃម្លអនុមតិគេ្រមង ងសងផ់ទះែល្វង េកើន ៣០៣% េធៀបនងឹែខមុន ប៉ែុន្តធ្ល កចុ់ះ ៤៨,១% េធៀបនងឹមយួឆន មំនុ មក្រតឹម ២៩,៤ នដុ ្ល រ។ េនែខមថុិន សនទស នៃ៍ថ្លទនំញិេ្របើ្របស់ (្រគបមុ់ខទនំញិ) េកើន ០,១% េធៀបនងឹែខមុន (១,៨% េធៀបនងឹែខដូចគន ឆន មំុន)។ ៃថ្លេសប ង រ នងិេភសជជៈគម នជត្ិរ េកើន ០,៩% (៣,២% េធៀបនងឹមយួឆន មំុន) សេម្ល កបពំកន់ងិែសបកេជើងេកើន ០,៥% (៣,៨% េធៀបនងឹមយួឆន មំនុ) នងិ ៃថ្លសមភ រៈបពំកន់ងិៃថ្លដំេណើ រករកនុងផទះេកើន ០,៣% (៣,៦% េធៀបនងឹមយួឆន មំនុ)។ កនុងែខដែដល ៃថ្ល ន កេ់ន នងិៃថ្លទកឹេភ្លើងធ្ល កចុ់ះ ០,៨% ប៉ែុន្តេកើន ០,៦% េធៀបនងឹមយួឆន មុំន។ េនែខសី ៃថ្លេ្របង ំង េកើន ៧,៦% េធៀបនងឹែខមុន (២,៩% េធៀបនងឹមយួឆន មំុន) ដល់ ៥៣៤១េរៀល/លី្រត នងិេ្របងម៉សូ៊ត េកើន ៦,៦% (៣,៩% េធៀបនងឹមយួឆន មំនុ) ដល់ ៥០៥៧េរៀល/លី្រត។ េនែខមថុិន អ្រ ករ្របកេ់លើបេញញ ើជ្របកេ់រៀលរយៈេពល១២ែខ គឺ ៥,៨% (ធ្ល កចុ់ះ ០,៣ ឯក ភគរយេធៀបនងឹែខមនុ) េហើយស្រមបប់េញញ ើជ្របកដុ់ ្ល រ គ ឺ៤,៤% (ធ្ល កចុ់ះ ០,០៤ ឯក ភគរយ)។ េនែខសី ្របកេ់រៀលេនទផី រេឡើងៃថ្ល ០,០២% េធៀបនងឹែខមុន (០,៦% េធៀបនងឹមយួឆន មំនុ) ទល់នងឹ្របកដុ់ ្ល រ ប៉ុែន្តេនេថរទល់នងឹ្របកប់តៃថ នងិ្របកដុ់ងេវៀត ម។ េនែខមថុិន ករនេំចញសេម្ល កបំពក ់ (្រគប្់របេភទ) េកើន ២៨,៤% េធៀបនងឹែខមុន (១៨,៦% េធៀបនងឹមយួឆន មំនុ) ដល់ ៤១១,២ នដុ ្ល រ េហើយករនេំចញែសបកេជើង េកើន ៦,៩% (២៣,៩% េធៀបនងឹមយួឆន មំនុ) ដល់ ២៧,៩ នដុ ្ល រ។ ករនេំចញផលិតផល យនភណ័្ឌ េផ ងេទៀតេកើន ៣,៣% ដល់ ៥,៣ នដុ ្ល រ ប៉ែុន្តធ្ល កចុ់ះ ៣,៥% េធៀបនងឹមយួឆន មំនុ។ កនុងែខដែដល ករនចូំលែដកែថបេកើន ២,៣% (២២៦,០% េធៀបនងឹមយួឆន មំនុ) ដល់ ១២,៥ នដុ ្ល រ េហើយករនចូំលសមភ រៈសំណង ់ េកើន ២២,១% (២០,៧% េធៀបនងឹមយួឆន មំុន) ដល់ ៥,៥ នដុ ្ល រ រឯីករនចូំលសីុមង៉ត់ ៍ ធ្ល កចុ់ះ ២៣,៤% ប៉ុែន្តេកើន ១៧,៤% េធៀបនងឹមយួឆន មំនុ។ ករនចូំលេ្របង ំងេកើន ៧,៨% េធៀបនងឹែខមុន (១០,៩% េធៀបនងឹមយួឆន មំនុ) េហើយករនចូំលេ្របងម៉សូតេខម េកើន ៣,៦% (៦,៦% េធៀបនងឹមយួឆន មំនុ) រឯីករនចូំលេ្របងម៉សូតធ្ល កចុ់ះ ១៣,៦% មក្រតឹម ៣៩,៥ នដុ ្ល រ ប៉ែុន្តេកើន ០,៨% េធៀបនងឹមយួឆន មំនុ ។
Highlights
This report highlights a number of economic indicators of Cambodia and its partners. It compares recent figures with those of earlier periods.
Fixed asset investments in industry approved by the Council for the Development of Cambodia in the second quarter of 2012 decreased by 16.7 percent from a quarter earlier or 32.4 percent year on year, to USD173.7 m.
In July, total foreign visitor arrivals increased by 13 percent from the preceding month (19.0 percent year on year). Holiday arrivals rose by 13 percent (15 percent year on year), business arrivals by 12 percent (17 percent year on year) and “other” arrivals by 30 percent (381 percent year on year).
In July, the value of construction approvals for villas and houses rose by 796.5 percent (15.5 percent year on year) to USD12.8 m and of “others” by 807.2 percent (173.2 percent year on year) to USD34.1 m. The value of flat construction approvals rose 303 percent from a month earlier, but year on year decrease by 48.1 percent to USD29.4 m.
In June, the consumer price index (all items) went up 0.1 percent from the preceding month (1.8 percent from the same period last year). Prices of food and non-alcoholic beverages rose by 0.9 percent (3.2 percent year on year), clothing and footwear by 0.5 percent (3.8 percent year on year) and household furnishings and operations by 0.3 percent (3.6 percent year on year). In the same month, housing and utilities prices dropped by 0.8 percent, but increased 0.6 percent year on year.
In August, the price of gasoline increased by 7.6 percent from a month earlier (2.9 percent year on year) to KHR5341/litre and of diesel by 6.6 percent (3.9 percent year on year) to KHR5057/litre.
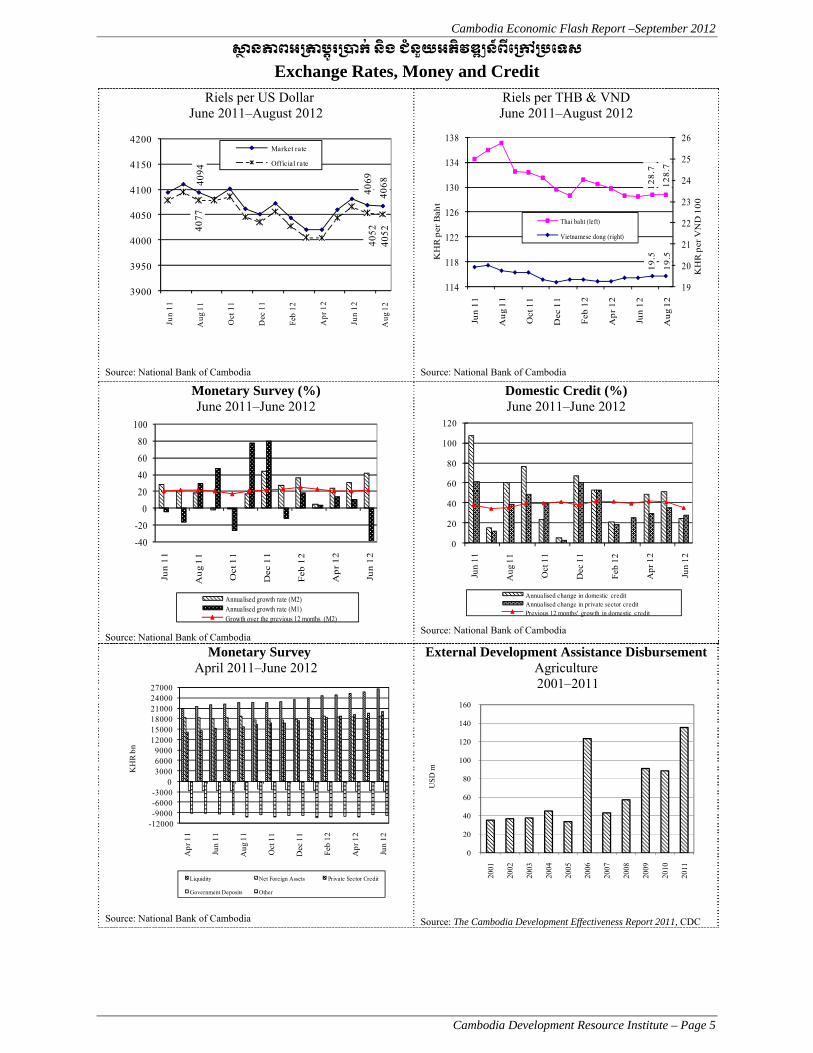
In June, the interest rate on 12-month riel deposits was 5.8 percent (a 0.3 percentage point drop from a month earlier) and that of dollar deposits was 4.4 percent (a 0.04 percentage point decrease).
In August, the market exchange rate of the riel appreciated 0.02 percent (0.6 percent year on year) against the dollar. The riel exchange rate remained unchanged against the Thai baht and the Vietnamese dong.
Exports of clothing (all kinds) in June rose by 28.4 percent from the previous month (18.6 percent year on year) to USD411.2 m and shoes by 6.9 percent (23.9 percent year on year) to USD27.9 m. Exports of other textile products increased by 3.3 percent, but decreased by 3.5 percent year on year, to USD5.3 m. In the same month, imports of steel went up 2.3 percent (226.0 percent year on year) to USD12.5 m and construction equipment by 22.1 percent (20.7 percent year on year) to USD5.5 m. Imports of cement went down 23.4 percent, but increased 17.4 percent year on year. Imports of gasoline rose by 7.8 percent from a month earlier (10.9 percent year on year) and fuel oil by 3.6 percent (6.6 percent year on year). Imports of diesel oil dropped by 13.6 percent, but rose by 0.8 percent year

Cambodia Economic Flash Report –September 2012
Cambodia Development Resource Institute – Page 3
កនុងែខមថុិន ចណូំលចរន្តសរុបរបស់រ ្ឋ ភបិល ធ្ល កចុ់ះ ៧,៥% មក្រតឹម ៥៧២,៨ពន់ នេរៀល េធៀបនងឹែខមុន ប៉ែុន្តេកើន ២៧,៩% េធៀបនងឹឆន ំមនុ។ ចណូំលបនពពីនធនចូំលនងិនេំចញេកើន ១០,៦% (១៩,២% េធៀបនងឹឆន មំនុ)។ ចណូំលពនធកនុង្រសុក ធ្ល កចុ់ះ ៧,៥% (េកើន ៣៤,៨ េធៀបនងឹឆន មុំន) េហើយ ចណូំលមនិែមនពនធ ធ្ល កចុ់ះ ៣០,១% (េកើន ៦,២% េធៀបនងឹឆន មំនុ)។ កនុងែខដែដល ចំ យចរន្តសរបុរបស់រ ្ឋ ភបិល េកើន ៧,២% ដល់ ៥៧៥,២ពន់ នេរៀល ប៉ែុន្តធ្ល កចុ់ះ ៦,៣% េធៀបនងឹឆន មំុន។ ចំ យេលើេបៀវត រ ៍ធ្ល កចុ់ះ ៣២,៥% (៩,៨% េធៀបនងឹឆន មុំន) មក្រតឹម ២០៤,៥ពន់ នេរៀល រឯីឧបតថមភធន នងិជនួំយសងគមកចិចេកើន ៩២,៧% ដល់ ១៨៣,៦ពន់ នេរៀល ប៉ែុន្តធ្ល កចុ់ះ ២៦,៨% េធៀបនងឹមយួឆន មំនុ ។ េនែខមថុិន អងករៃថ េឡើងៃថ្ល ១៤,២% េធៀបនងឹែខមុន (៣២,០% េធៀបនងឹមយួឆន មំនុ) ដល់ ៧៣៧,៩ដុ ្ល រ/េ ន។ េកសូ៊ ធ្ល កៃ់ថ្ល ៦,១% (២៩,២% េធៀបនងឹមយួឆន មំនុ) មក្រតមឹ ៣១០៤,៩ដុ ្ល រ/េ ន រឯីេមដឡូំងេឈើ េឡើងៃថ្ល ១២,២% ដល់ ៣៣៧,៥ដុ ្ល រ/េ ន ប៉ែុន្តធ្ល កៃ់ថ្ល ១៣,០% េធៀបនងឹមយួឆន មំនុ។ ករនេំចញអងករេនៃថ ធ្ល កចុ់ះ ៣៩,៦% េធៀបនងឹែខមនុ (៤៩,៣% េធៀបនងឹមយួឆន មំុន) មក្រតឹម ៣០៦,២ នដុ ្ល រ េហើយករនេំចញេកសូ៊ធមមជត ិ នងិជរ័ធមមជត ិ ធ្ល កចុ់ះ ៩,៤% (៣១,៥% េធៀបនងឹមយួឆន មំនុ) មក្រតមឹ ៦៥៣,២ នដុ ្ល រ។ ករនេំចញេម ដឡូំងេឈើ ធ្ល កចុ់ះ ៣៧,៤% មក្រតមឹ ១២១,៣ នដុ ្ល រ ប៉ែុន្តេកើន ២៧,៨% េធៀបនងឹមយួឆន មុំន ។ េនែខមថុិន អងករេនេវៀត ម ធ្ល កៃ់ថ្ល ២,៧% េធៀបនងឹែខមុន (៩,១% េធៀបនងឹមយួឆន មំនុ) មក្រតឹម ៤៣៦,៧ដុ ្ល រ/េ ន េហើយេកសូ៊ធ្ល កៃ់ថ្ល ៩,៥% (៣៤,៩% េធៀបនងឹមយួឆន មំនុ) មក្រតមឹ ២៨៣៣,៣ដុ ្ល រ/េ ន រឯី្រគប់ ្វ យចនទ ី េឡើងៃថ្ល ៣,៤% ដល់ ៧០០០ដុ ្ល រ/េ ន ប៉ែុន្តធ្ល កៃ់ថ្ល ១៧,៣% េធៀបនងឹមយួឆន មំនុ។ កនុងែខដែដល ករនេំចញអងករ េកើន ១៥,៧% (១៩,៣% េធៀបនងឹមយួែខមនុ) ដល់ ៣៨៣ នដុ ្ល រ េហើយ្រគប់ ្វ យចន័ទ ី េកើន ៣,៤% (២១,២% េធៀបនងឹមយួឆន មំនុ) ដល់ ១៥៤ នដុ ្ល រ រឯីករនេំចញេកសូ៊ ធ្ល កចុ់ះ ២៧,៦% (៣០,៣% េធៀបនងឹមយួឆន មំនុ) មក្រតឹម ១៧០ នដុ ្ល រ។ េនែខកកក ករនេំចញរបស់សហរដ្ឋ េមរកិ ធ្ល កចុ់ះ ១,៤% មក្រតឹម ១៣០,៨ពន់ នដុ ្ល រ េធៀបនងឹែខមុន ប៉ែុន្តេកើន ៣,១% េធៀបនងឹមយួឆន មុំន។ ករនេំចញេនតបំនអ់រឺ ៉ ូ ធ្ល កចុ់ះ ៥,៦% (៥,១% េធៀបនងឹមយួឆន មុំន) មក្រតមឹ ១៩១ពន់ នដុ ្ល រ េហើយករនេំចញរបស់ជប៉នុធ្ល កចុ់ះ ៦,១% (៧,១ េធៀបនឹងមយួឆន មំនុ) មក្រតឹម ៦៦,៨ពន់ នេរៀល។ េនែខសី អងករ USA 2/4 េឡើងៃថ្ល ២,៣% ដល់ ៥៨៥ដុ ្ល រ/េ ន េធៀបនងឹែខមុន ប៉ែុន្តធ្ល កៃ់ថ្ល ៥,៥% េធៀបនងឹឆន មុំន។ អងករ Thai 100% B េឡើងៃថ្ល ២,៩% (៣,៣% េធៀបនងឹមយួឆន មំនុ) ដល់ ៦០១ដុ ្ល រ/េ ន។ កនុងែខដែដល សែណ្ត កេសៀង (US No.1) េឡើងៃថ្ល ១,១% (២៨,១% េធៀបនងឹមយួឆន មំនុ) ដល់ ៦៥៦,៦ដុ ្ល រ/េ ន នងិ េពត (US No.2) េឡើងៃថ្ល ១,២% (៧,៩% េធៀបនងឹមយួឆន មំនុ) ដល់ ៣៣១,២ដុ ្ល រ/េ ន។ េកសូ៊ (SMR 5) ធ្ល កៃ់ថ្ល ៩,៧% េធៀបនងឹែខមុន (៤៣,១% េធៀបនងឹមយួឆន មំនុ) មក្រតឹម ២៦៦០,៨ដុ ្ល រ/េ ន។ កនុងែខសី េ្របង ំង (US Gulf Coast) េឡើងៃថ្ល ១២,២% (៦,៣% េធៀបនងឹមយួឆន មំនុ) ដល់ ០,៧៨ដុ ្ល រ/លី្រត េហើយេ្របងម៉សូ៊ត (Low sulphur No2) េឡើងៃថ្ល ៩,១% (៥,៨% េធៀបនងឹមយួឆន មំនុ) ដល់ ០,៨៣ដុ ្ល រ/លី្រត។
on year, to USD39.5 m.
In June, total government current revenue went down 7.5 percent from the preceding month but year on year increased by 27.9 percent, to KHR572.8 bn. Revenue from import and export taxes rose by 10.6 percent (19.2 percent year on year). Revenue from domestic taxes dropped by 7.5 percent (34.8 percent increase year on year) and from non-taxes by 30.1 percent (6.2 percent rise year on year). In the same period, total current expenditure increased by 7.2 percent but year on year dropped by 6.3 percent to KHR575.2 bn. Expenditure on wages went down 32.5 percent (9.8 percent year on year) to KHR204.5 bn, while that on subsidies and social assistance rose by 92.7 percent, but year on year decreased by 26.8 percent to KHR183.6 bn.
The price of Thai rice in June increased by 14.2 percent from a month earlier (32.0 percent year on year) to USD737.9/tonne. The price of rubber dropped by 6.1 percent (29.2 percent year on year) to USD3104.9/tonne. The price of tapioca went up 12.2 percent but year on year dropped by 13.0 percent to USD337.5/tonne. Exports of Thai rice went down 39.6 percent from the preceding month (49.3 percent year on year) to USD306.2 m and natural rubber and similar natural gums by 9.4 percent (31.5 percent drop year on year) to USD653.2 m. Exports of tapioca decreased by 37.4 percent, but year on year rose by 27.8 percent to USD121.3 m.
In June, rice prices in Vietnam decreased by 2.7 percent from the preceding month (9.1 percent year on year) to USD436.7/tonne and rubber by 9.5 percent (34.9 percent year on year) to USD2833.3/tonne. The price of cashew nuts rose by 3.4 percent but year on year dropped by 17.3 percent to USD7000/tonne. In the same period, exports of rice went up 15.7 percent (19.3 percent year on year) to USD383 m and cashew nuts by 3.4 percent (21.2 percent year on year) to USD154 m. Exports of rubber dropped by 27.6 percent (30.3 percent year on year) to USD170 m.
In July, US exports declined by 1.4 percent from a month earlier, but year on year increased by 3.1 percent to USD130.8 bn. Exports of the euro zone dropped 5.6 percent (5.1 percent year on year) to USD191 bn and of Japan by 6.1 percent (7.1 percent year on year) to USD66.8 bn.
In August, the price of USA 2/4 rice rose 2.3 percent from the preceding month, but year on year dropped by 5.5 percent, to USD585/tonne. Thai 100% B rice increased by 2.9 percent (3.3 percent year on year) to USD601/tonne. In the same month, the price of soybeans (US No. 1) rose 1.1 percent (28.1 percent year on year) to USD656.6/tonne and maize (US No. 2) by 1.2 percent (7.9 percent year on year) to USD331.2/tonne. The price of rubber (SMR 5) dropped by 9.7 percent from a month earlier (43.1 percent year on year) to USD2660.8/tonne. In August, the price of gasoline (US Gulf Coast) went up 12.2 percent (6.3 percent year on year) to USD0.78/litre and of diesel (low sulphur No. 2) by 9.1 percent (5.8 percent year on year) to USD0.83/litre.

Cambodia Economic Flash Report –September 2012
Cambodia Development Resource Institute – Page 4
សកម្មភាពេសដ្ឋកចិ្ចសខំាន់ៗ និង ៃថ្លទំនិញេនៅកម្ពុជា Main Economic Activities and Consumer Prices in Cambodia
Fixed Asset Investment Approvals by CDC Industry
2009 Q2–2012 Q2
0
500
1000
1500
2000
250009
Q3
09Q
4
10Q
1
10Q
2
10Q
3
10Q
4
11Q
1
11Q
2
11Q
3
11Q
4
12Q
1
12Q
2
USD
m
Including expansion projects. Source: Council for the Development of Cambodia
Foreign Visitor Arrivals July 2011–July 2012
194
258
13
14
3
12
0
50
100
150
200
250
300
350
400
Ju
l 1
1
Sep
11
No
v 1
1
Jan
12
Mar
12
May
12
Ju
l 1
2
00
0 p
ers
ons
Other Business Holiday
Source: Ministry of Tourism
Phnom Penh: Value of Construction Approvals July 2011–July 2012
11.1 12.8
56.7
29.4
12.5
34.1
0
20
40
60
80
100
120
140
160
180
Jul 1
1
Sep
11
No
v 1
1
Jan
12
Mar
12
May
12
Jul 1
2
US
D m
Other
Flats
Villas & houses
Source: Municipality of Phnom Penh
Consumer Price Index (December 2006=100) Dec 2010–June 2012
Source: National institute of statistics Phnom Penh: Gasoline & Diesel Prices
June 2011–August 2012
53
41
50
57
4200
4400
4600
4800
5000
5200
5400
5600
5800
Jun
11
Au
g 1
1
Oct
11
Dec
11
Feb
12
Ap
r 1
2
Jun
12
Au
g 1
2
Rie
ls/ℓ
Diesel
Gasoline
Source: CDRI
Interest Rates on 12-Month Bank Deposits (%) June 2011–June 2012
0
1
2
3
4
5
6
7
Jun
11
Au
g 1
1
Oct 1
1
Dec 1
1
Feb
12
Ap
r 1
2
Jun
12
Per
cen
tag
e P
er A
nn
um
Riel deposit rate
Dollar deposit rate
Source: Economic & Monetary Statistics, NBC
100115130145D A A
Cambodia Economic Flash Report –September 2012
Cambodia Development Resource Institute – Page 5
សានភាពអ្រតាប្តូរ្របាក ់និង ជំនួយអភិវឌ ន៍ពីេ្រកៅ្របេទស Exchange Rates, Money and Credit
Riels per US Dollar June 2011–August 2012
4094
4069
4068
4077
4052
4052
3900
3950
4000
4050
4100
4150
4200
Jun
11
Aug
11
Oct
11
Dec
11
Feb
12
Ap
r 12
Jun
12
Aug
12
Market rate
Official rate
Source: National Bank of Cambodia
Riels per THB & VND June 2011–August 2012
12
8.7
12
8.7
19
.5
19
.5
19
20
21
22
23
24
25
26
114
118
122
126
130
134
138
Jun
11
Au
g 1
1
Oct
11
Dec
11
Feb
12
Ap
r 1
2
Jun
12
Au
g 1
2
KH
R p
er V
ND
10
0
KH
R p
er B
aht
Thai baht (left)
Vietnamese dong (right)
Source: National Bank of Cambodia
Monetary Survey (%) June 2011–June 2012
-40
-20
0
20
40
60
80
100
Jun
11
Au
g 1
1
Oct
11
Dec
11
Feb
12
Ap
r 1
2
Jun
12
Annualised growth rate (M2)Annualised growth rate (M1)Growth over the previous 12 months (M2)
Source: National Bank of Cambodia
Domestic Credit (%)
June 2011–June 2012
0
20
40
60
80
100
120
Jun
11
Au
g 1
1
Oct
11
Dec
11
Feb
12
Ap
r 1
2
Jun
12
Annualised change in domestic credit Annualised change in private sector credit Previous 12 months' growth in domestic credit
Source: National Bank of Cambodia
Monetary Survey April 2011–June 2012
-12000-9000-6000-3000
0300060009000
120001500018000210002400027000
Ap
r 1
1
Jun
11
Au
g 1
1
Oct
11
Dec
11
Feb
12
Ap
r 1
2
Jun
12
KH
R b
n
Liquidity Net Foreign Assets Private Sector Credit
Government Deposits Other
Source: National Bank of Cambodia
External Development Assistance Disbursement Agriculture 2001–2011
Source: The Cambodia Development Effectiveness Report 2011, CDC
0
20
40
60
80
100
120
140
160
2001
2002
2003
2004
2005
2006
2007
2008
2009
2010
2011
US
D m

Cambodia Economic Flash Report –September 2012
Cambodia Development Resource Institute – Page 6
ពាណិជ្ជកម្មេ្រកៅ្របេទស និង ការអនវុត្តថវិកាជាតិ External Trade and National Budget Operations
Cambodian Imports April 2011–June 2012
4.6 5.5
5.46.4
3.8
12.5
0
5
10
15
20
25
30
Apr
11
Jun
11
Aug
11
Oct
11
Dec
11
Feb
12
Apr
12
Jun
12
US
D m
Steel
Cement
Construction equipment
Source: Economic & Monetary Statistics, NBC
Cambodian Exports April 2011–June 2012
436.0 411.2
29.727.9
5.75.3
0
50
100
150
200
250
300
350
400
450
500
Apr
11
Jun
11
Aug
11
Oct
11
Dec
11
Feb
12
Apr
12
Jun
12
USD
m
Other textile products
Shoes
Clothing (all kinds)
Source: Economic & Monetary Statistics, NBC
Imports: Energy April 2011–June 2012
0
10
20
30
40
50
60
Ap
r 1
1
Jun
11
Au
g 1
1
Oct
11
Dec
11
Feb
12
Ap
r 1
2
Jun
12
US
D m
Gasoline Diesel Fuel oil
Source: Economic & Monetary Statistics, NBC
Current Budget Operations April 2011–June 2012
-166.29
-2.332
-200
-100
0
100
200
300
400
500
Ap
r 1
1
Jun
11
Au
g 1
1
Oct
11
Dec
11
Feb
12
Ap
r 1
2
Jun
12
KH
R b
n
Source: MEF Bulletin
Current Budget Revenue April 2011–June 2012
298 402
95
113
55
58
0
100
200
300
400
500
600
700
800
Ap
r 1
1
Jun
11
Au
g 1
1
Oct 1
1
Dec 1
1
Feb
12
Ap
r 1
2
Jun
12
KH
R b
n
Non-taxImport and export taxesDomestic taxes
Source: MEF Bulletin
Current Budget Expenditure April 2011–June 2012
226.9 204.5
250.9
183.6
136.1
187.1
0
100
200
300
400
500
600
700
800
Ap
r 1
1
Jun
11
Au
g 1
1
Oct 1
1
Dec 1
1
Feb
12
Ap
r 1
2
Jun
12
KHR bn
Other services Subsidies and social assistance Wages
Source: MEF Bulletin

Cambodia Economic Flash Report –September 2012
Cambodia Development Resource Institute – Page 7
ៃថ្លេស ៀងអាហារតាមេខត្តក្នងុ្របេទសកម្ពជុា Provincial Food Prices
Food Prices in Siem Reap Province June 2011–August 2012
Source: CDRI
Food Prices in Battambang Province June 2011–August 2012
Source: CDRI Food Prices in Kompong Cham Province
June 2011–August 2012
Source: CDRI
Food Prices in Kampot Province June 2011–August 2012
Source: CDRI
Food Prices in Svay Rieng Province June 2011–August 2012
Source: CDRI
Food Prices in Kompong Speu Province June 2011–August 2012
Source: CDRI
5000
10000
15000
20000
25000
30000
35000
500
4000
7500
11000
14500
18000
21500
25000
Jun
11
Aug
11
Oct
11
Dec
11
Feb
12
Apr
12
Jun
12
Aug
12
Rie
ls/k
g
Rie
ls/k
g
Rice-Phka Knhei (left) Fresh fish (left)
1st quality pork (right) 1st quality beef (right)
5000
10000
15000
20000
25000
30000
35000
500
4000
7500
11000
14500
18000
21500
Jun
11
Aug
11
Oct
11
Dec
11
Feb
12
Apr
12
Jun
12
Aug
12
Rie
ls/k
g
Rie
ls/k
g
Rice-Phka Knhei (left) Fresh fish (left)
1st quality pork (right) 1st quality beef (right)
5000
10000
15000
20000
25000
30000
35000
500
4000
7500
11000
14500
18000
21500
Jun
11
Aug
11
Oct
11
Dec
11
Feb
12
Apr
12
Jun
12
Aug
12
Rie
ls/k
g
Rie
ls/k
g
Rice-Phka Knhei(left) Fresh fish (left)
1st quality pork (right) 1st quality beef (right)
5000
10000
15000
20000
25000
30000
35000
500
4000
7500
11000
14500
18000
21500
Jun
11
Aug
11
Oct
11
Dec
11
Feb
12
Apr
12
Jun
12
Aug
12
Rie
ls/k
g
Rie
ls/k
g
Rice-Phka Knhei(left) Fresh fish (left)
1st quality pork (right) 1st quality beef (right)
5000
9000
13000
17000
21000
25000
29000
500
4000
7500
11000
14500
18000
21500
Jun
11
Aug
11
Oct
11
Dec
11
Feb
12
Apr
12
Jun
12
Aug
12
Rie
ls/k
g
Rie
ls/k
g
Rice-Phka Knhei (left) Fresh fish (left)
1st quality pork (right) 1st quality beef (right)
3000
7000
11000
15000
19000
23000
27000
31000
500
4000
7500
11000
14500
18000
21500
25000
Jun
11
Aug
11
Oct
11
Dec
11
Feb
12
Apr
12
Jun
12
Aug
12
Rie
ls/k
g
Rie
ls/k
g
Rice-Phka Knhei (left) Fresh fish (left)
1st quality pork (right) 1st quality beef (right)

Cambodia Economic Flash Report –September 2012
Cambodia Development Resource Institute – Page 8
ៃថ្លទំនិញតាមេខត្តក្នុង្របេទសកម្ពុជា៖ តាមមុខទនិំញ Provincial Goods Prices in Cambodia
Cambodia: Rice Prices in Three Provinces
Source: CDRI
Cambodia: Rice Prices in Three Provinces
Source: CDRI
Cambodia: Fish Prices in Three Provinces
Source: CDRI
Cambodia: Fish Prices in Three Provinces
Source: CDRI
Cambodia: Pork Prices in Three Provinces
Source: CDRI
Cambodia: Pork Prices in Three Provinces
Source: CDRI
2725 26
50
2650
2600
2650 28
00
2750
2750
2600
2625
2650
2500
0
500
1000
1500
2000
2500
3000
3500
May 12 Jun 12 Jul 12 Aug 12
Rie
ls/k
g
Battambang
Kompong Speu
Kompong Cham
2900
2850
2750 29
00
2700
2700
2700 2700
2700 26
00
2700
2700
0
500
1000
1500
2000
2500
3000
3500
May 12 Jun 12 Jul 12 Aug 12
Rie
ls/k
g
Kampot
Siem Reap
Svay Rieng
1000
0
1275
0
1400
0
1550
0
1150
0
1250
0
1150
0
1050
0
1075
0
1125
0
1225
0
1200
0
0
2000
4000
6000
8000
10000
12000
14000
16000
18000
May 12 Jun 12 Jul 12 Aug 12
Rie
ls/k
g
Battambang
Kompong Speu
Kompong Cham
1625
0
1600
0
1625
0
1600
0
1000
0
1300
0
1300
0
1300
0
1200
0
1200
0
1200
0
1200
0
0
2000
4000
6000
8000
10000
12000
14000
16000
18000
May 12 Jun 12 Jul 12 Aug 12
Rie
ls/k
g
Kampot
Siem Reap
Svay Rieng
1775
0
1750
0
1725
0
1700
0
1900
0
1775
0
1625
0
1700
0
1775
0
1800
0
1800
0
1800
0
5000
7000
9000
11000
13000
15000
17000
19000
21000
May 12 Jun 12 Jul 12 Aug 12
Rie
ls/k
g
Battambang
Kompong Speu
Kompong Cham
2000
0
2000
0
2000
0
2000
0
2000
0
1800
0
1800
0
1800
01900
0
1900
0
2000
0
2000
0
5000
7000
9000
11000
13000
15000
17000
19000
21000
May 12 Jun 12 Jul 12 Aug 12
Rie
ls/k
g
Kampot
Siem Reap
Svay Rieng

Cambodia Economic Flash Report –September 2012
Cambodia Development Resource Institute – Page 9
ៃថ្លទំនិញ ការនំាេចញ និង ចំនួនេទសចរអន្តរជាតិេនៅក្នុង្របេទសជាៃដគូរបស់កម្ពុជា Goods Prices, Exports and International Tourist Arrivals to Partners of Cambodia
Thailand: Prices of Rubber, Rice and Tapioca April 2011–June 2012
Source: Bank of Thailand, Foreign Trade and Balance of Payments
Vietnam: Prices of Rubber, Rice and Cashew NutsApril 2011–June 2012
Source: General Statistics Office of Vietnam
Thailand: Exports April 2011–June 2012
Source: Customs Department of Thailand
Vietnam: Exports April 2011–June 2012
Source: General Statistics Office of Vietnam
Thailand: International Arrivals September 2010–November 2011
Source: Thailand Office of Tourism Development
Vietnam: International Arrivals May 2011–July 2012
Source: Estimates by General Statistics Office of Vietnam
0
1000
2000
3000
4000
5000
6000
7000
Apr
11
Jun
11
Aug
11
Oct
11
Dec
11
Feb
12
Apr
12
Jun
12
USD
per
tonn
e
Rice Rubber Tapioca
0
1000
2000
3000
4000
5000
6000
7000
8000
9000
10000
Apr
11
Jun
11
Aug
11
Oct
11
Dec
11
Feb
12
Apr
12
Jun
12
US
D p
er to
nne
Rice Rubber Cashew nuts
30
60
90
120
150
180
210
240
270
200
400
600
800
1000
1200
1400
1600
1800
Apr
11
Jun
11
Au g
11
Oct
11
Dec
11
Feb
12
Apr
12
Jun
12
USD
m
USD
m
Rice (left)Natural rubber and similar natural gums (left)Tapioca (right)
40
70
100
130
160
190
220
0
80
160
240
320
400
480
Apr
11
Jun
11
Aug
11
Oct
11
Dec
11
Feb
12
Apr
12
Jun
12
US
D m
US
D m
Rice (left) Rubber (left)Cashew nuts (right)
0
200
400
600
800
1000
1200
1400
1600
1800
Sep
10
Nov
10
Jan
11
Mar
11
May
11
Jul 1
1
Sep
11
Nov
11
000
pers
ons
South AsiaEuropeEast Asia
0
100
200
300
400
500
600
700
800
May
11
Jul 1
1
Sep
11
Nov
11
Jan
12
Mar
12
May
12
Jul 1
2
000
pers
ons
Others
Business
Tourism

Cambodia Economic Flash Report –September 2012
Cambodia Development Resource Institute – Page 10
សកម្មភាពេសដ្ឋកិច្ច និង អ្រតាអតិផរណាេនៅបណា្ដ្របេទសជាៃដគូរបស់កម្ពុជា Economic Activity and Inflation Rates of Selected Economic Partners of Cambodia
Year-on-Year Growth of Main Exports: Japan May 2011–July 2012
-40%
-20%
0%
20%
40%
60%
80%
100%
May
11
Jul 1
1
Sep
11
No
v 1
1
Jan
12
Mar
12
May
12
Jul 1
2
Manufactured goods Machinery Electricial machinery
Transport equipment Total
Source: Japanese Trade and Investment Statistics
Goods Exports: US, Euro Zone & Japan May 2011–July 2012
0
20
40
60
80
100
120
140
160
180
200
220
240
May
11
Jul 1
1
Sep
11
No
v 1
1
Jan
12
Mar
12
May
12
Jul 1
2
US
D b
n
US Euro zone Japan
Sources: BEA, Eurostat and OECD
External Trade: Malaysia May 2011–July 2012
0.02.04.06.08.0
10.012.014.016.018.020.022.0
May
11
Jul 1
1
Sep
11
Nov
11
Jan
12
Mar
12
May
12
Jul 1
2
USD
bn
ExportsImportsTrade balance
Source: Ministry of International Trade and Industry, Malaysia
Inflation Rates: US, Euro Zone & Japan (percent price change from a year earlier)
-1
0
1
2
3
4
5
May
11
Jul 1
1
Sep
11
Nov
11
Jan
12
Mar
12
May
12
Jul 1
2
USA Euro zone Japan
Sources: IMF and Economist (1 Sep 2012)
Inflation Rates: China, Hong Kong & South Korea (percent price change from a year earlier)
0123456789
May
11
Jul 1
1
Sep
11
No
v 1
1
Jan
12
Mar
12
May
12
Jul 1
2
China Hong Kong South Korea
Sources: IMF and Economist (1 Sep 2012)
Inflation Rates: Selected ASEAN Countries (percent price change from a year earlier)
Sources: IMF and Economist (1 Sep 2012)
0
1
2
3
4
5
6
May
11
Jul 1
1
Sep
11
No
v 1
1
Jan
12
Mar
12
May
12
Jul 1
2
Malaysia Singapore Thailand

Cambodia Economic Flash Report –September 2012
Cambodia Development Resource Institute – Page 11
អ្រតាប្តូរ្របាក ់និង សានភាពៃថ្លទំនញិេលើទផី រអន្តរជាតិ Exchange Rates and Commodity Prices in World Markets
KRW & HKD per USD February 2011–August 2012
7.74
7.75
7.76
7.77
7.78
7.79
7.80
7.81
7.82
7.83
1000
1020
1040
1060
1080
1100
1120
1140
1160
1180
Feb
11
Ap
r 1
1
Jun
11
Au
g 1
1
Oct
11
Dec
11
Feb
12
Ap
r 1
2
Jun
12
Au
g 1
2
HK
D
KR
W
KRW (left scale) HKD (right scale)
Source: Federal Reserve Bank of New York
EUR & JPY per USD February 2011–August 2012
0.510.540.570.600.630.660.690.720.750.780.810.840.87
7074788286909498
102106110114118
Feb
11
Ap
r 1
1
Jun
11
Au
g 1
1
Oct 1
1
Dec 1
1
Feb
12
Ap
r 1
2
Jun
12
Au
g 1
2
EU
R
JPY
JPY (left scale) EUR (right scale)
Source: Federal Reserve Bank of New York
THB & SGD per USD
February 2011–August 2012
22
24
26
28
30
32
34
36
38
40
1.20
1.23
1.26
1.29
1.32
1.35
1.38
1.41
1.44
1.47
Feb
11
Apr
11
Jun
11
Au g
11
Oct
11
Dec
11
Feb
12
Apr
12
Jun
12
Au g
12
TH
B
SGD
SGD (left scale)
THB (right scale)
Source: Federal Reserve Bank of New York
Rice: International Rice Price Index & Export Prices February 2011–August 2012
100
122
144
167
189
211
233
256
278
425
450
475
500
525
550
575
600
625
650
675
Feb
11
Ap
r 1
1
Jun
11
Au
g 1
1
Oct
11
Dec
11
Feb
12
Ap
r 1
2
Jun
12
Au
g 1
2
IPO
*
US
D p
er t
onne
FO
B
USA 2/4 (left) Thai 100% B (left) IPO (right)
Sources: Osiriz/InfoArroz *International Price Index of Osiriz/InfoArroz
Prices: Soybeans, Maize & Rubber February 2011–August 2012
0
500
1000
1500
2000
2500
3000
3500
4000
4500
5000
5500
6000
0
100
200
300
400
500
600
700
800
900
1000
1100
1200
Feb
11
Apr
11
Jun
11
Aug
11
Oct
11
Dec
11
Feb
12
Apr
12
Jun
12
Aug
12
USD
per
tonn
e FO
B
USD
per
tonn
e FO
B
Soybeans: US No.1, Yellow (left scale)Maize: US No.2, Yellow (left scale)Rubber SMR 5 (right scale)
Source: Food and Agriculture Organisation
Prices: Gasoline & Diesel Fuel June 2011–August 2012
73.7
78.478.5
83.0
0
10
20
30
40
50
60
70
80
90
100
Jun
11
Au
g 1
1
Oct
11
Dec
11
Feb
12
Ap
r 1
2
Jun
12
Au
g 1
2
US
Cen
ts
Gasoline: US Gulf Coast - US cents/litre
Diesel: low sulphur No.2 - US cents/litre
Source: US Energy Information Administration

Cambodia Economic Flash Report –September 2012
Cambodia Development Resource Institute – Page 12
ព័ត៌មានេសដ្ឋកិច្ច Economic News
ពត័ម៌នេសដ្ឋកចិចសំខន់ៗ កមពុជនេំចញេកសូ៊ ២២.៨៧៨េ ន កនុងឆមសទ១ី ឆន ២ំ០១២ មទិនននយ័ពី្រកសួងេសដ្ឋកិចច និងហិរញញ វតថុ កមពុជបននេំចញ
េកសូ៊ ២២.៨៧៨េ ន កនុងឆមសទី១ ឆន េំនះ ឬេកើន ១២,៩% េបើេធៀបនឹងរយៈេពលដូចគន កលពីឆន មំុន។ េទះយ៉ងេនះក្ត ីតៃម្លេកសូ៊នេំចញ បនធ្ល កចុ់ះ ២៤,៤% មក្រតឹម ៧៤,៥ នដុ ្ល រ េ យ រ ៃថ្លេកសូ៊អន្តរជតិបនធ្ល កចុ់ះ។ េនែខមថុិន ៃថ្លេកសូ៊អន្តរជតិ បនធ្ល កចុ់ះ ៣៦,៥% េធៀបនឹងមយួឆន មុំន មក្រតឹម ២៩២៨,៣ដុ ្ល រ/េ ន។ ្របេទស ៊ ន ជទីផ រចមបងស្រមបក់រនេំចញេកសូ៊។ កនុងរយៈេពលដែដល ករនេំចញេកសូ៊របស់្របេទសេវៀត ម និង ៃថ បនធ្ល កចុ់ះ ៤,៩% នងិ ២៥,៩% េរៀងគន ។
េនឆន ២ំ០១១ កមពុជ ផលិតេកសូ៊សងួតបន ៤៤.៩៦៩េ ន ឬេកើនេឡើង ៧,១% េធៀបនឹងរយៈេពលដូចគន កលពីឆន ២ំ០១០ េបើេយង មសថិតិពី្រកសួងកសិកមម រុកខ ្របមញ់ និងេន ទ។ ៃផទដី្របមូលផលជរ័េកសូ៊ េកើន ១៧,៦% េធៀបនឹងកលពីមយួឆន មុំន ដល់ ៤៥.១៦២ហិក ។
ករនេំចញរបស់កមពុជ េកើនដល់ ២,៥ពន់ នដុ ្ល រ េនឆមសទី១ ឬេកើន ១៣,៦% ពី ២,២ពន់ នដុ ្ល រ េនកនុងរយៈេពលដូចគន ឆន មុំន។ ករនេំចញេទសហភពអឺុរ ៉បុ (EU) េកើន ២៨,៩% ដល់ ៧៨០ នដុ ្ល រ េទប ្ត ្របេទស ៊ នេកើន ៦,២% ដល់ ១៥៥ នដុ ្ល រ េទ្របេទសជប៉ុនេកើន ៣៨,១% ដល់ ៩០,៧ នដុ ្ល រ េទ្របេទសេផ ងៗេទៀតេកើន ៣៨,៣% ដល់ ៥៣១ នដុ ្ល រ និង េទសហរដ្ឋ េមរកិេកើន ១,៩% ដល់ ៩៦៧ នដុ ្ល រ។
Economic News Highlights
Cambodia exports 22,878 tonnes of rubber in the first six months of 2012 Data from the Ministry of Economy and Finance show that Cambodia exported 22,878 tonnes of rubber in the first six months of this year, a 12.9 percent increase from the same period last year. However, the value of rubber exports dropped by 24.4 percent to USD74.5 m, due to the decrease in the international price of rubber. In June, the price declined by 36.5 percent year on year to USD2928.3/tonne. ASEAN countries are the major markets for rubber exports. In the same period, the value of rubber exports of Vietnam and Thailand also decreased by 4.9 percent and 25.9 percent, respectively. In 2011, Cambodia produced 44,969 metric tonnes of dried rubber, representing a 7.1 percent rise from 2010, according to the Ministry of Agriculture, Forestry and Fisheries. Tapping areas increased by 17.6 percent from a year earlier to 45,162 ha. Cambodia’s total exports reached approximately USD2.5 bn in the first six months, a 13.6 percent rise from USD2.2 bn in the same period last year. Exports to the EU rose by 28.9 percent to USD780 m, to ASEAN countries by 6.2 percent to USD155 m, to Japan by 38.1 percent to USD90.7 m, to other countries by 38.3 percent to USD531 m and to the US by 1.9 percent to USD967 m.
Links to others economic news
1. “IMF: Cambodia's economy expected to grow 7 pct in 2012” (http://news.xinhuanet.com/english/business/2012-10/02/c_131885405.htm)
2. “Cambodia to levy economic land concessions tax” (http://news.xinhuanet.com/english/world/2012-09/28/c_131880215.htm)
3. “Address at the Launching of the Tourism Strategic Development Plan 2012 – 2020” (http://www.cnv.org.kh/2012_releases/20sep12_tourism_NSDP_launch_speech.html0