Embed Size (px)
Citation preview
DATA EVALUATION RECORD FRESHWATER SEDIMENT Chironomus riparius EMERGENCE TEST
1. CHEMICAL: Trifluralin PC Code: 0361 01
2. TEST MATERIAL: Trifluralin Technical Purity: 96.3%
3. CITATION:
Authors: Knoch, M. Title: Assessment of Side Effects of Triflwalin Technical on the arvae of
the Midge, Chironomus riparius with the Laboratory Test ethod. Study Completion Date: November 1 1, 1996
Laboratory: Arbeitsgemeinschaft
4 GAB Biotechnologie GmbH & IFU Umweltanalytik GmbH1 D-75223 ~iefem-~schelbronn, Germany
Sponsor: Dow Agrosciences LLC 9330 Zionsville Road Indianapolis, IN 46268
Laboratory Report ID: 960 1 510 1 -ASCr MRID No.: 478070-13
4. REVIEWED BY: Christie E. Padova, Staff Scientist, Dynamac Corporation , Signature: LU Z. PA i
Date: 11/04/09 ~
APPROVED BY: Teri S. Myers, Senior Scientist, Cambridge Environmental 1nc.~
Signature: &'S Date: 12/08/09 ~ 5. APPROVED BY: Christine Hartless, OPPIEFEDIERB 1 I
Signature: --) Date: 5/7/10 ,
6. STUDY PARAMETERS
Scientific Name of Test Organism: Chironomus riparius Age of Test Organism: lSt instar larvae, 2 days post-hatch
Definitive Test Duration: 28 days Study Method: Static with aeration
Type of Concentrations: Nominal overlying water (associated TW4s were not applicable)
TEXT SEARCHABLE DOCUMENT - 2010
DP Barcode: 367525 MRID No.: 478070-13
7. CONCLUSIONS:
Results Synopsis: This study is classified as Supplemental and can be used in risk characterization. It should not be used in risk estimation as there were concerns regarding the actual exposure concentrations. Some reasons this study should not be used for risk estimation:
- concentration in pore water was not measured - concentrations in sediment were reported as mglvessel and it was not possible to
convert those values to mglkg-dry wt of sediment - trifluralin was detected on the film over the vessels, indicating material volatilized out
of the water - measured concentrations in overlying water did not increase consistently as nominal
concentrations increased (e.g., in the nominal concentrations of 1.0 and 2.0 mgL, the measured concentrations were 0.107 and 0.058 mgL, respectively). There was uncertainty regarding the actual exposure concentrations in the study vessels.
Emergence Percentage (nominal concentrations) NOAEC: 2.0 mg a iL LOAEC: 4.0 mg ai1L ECS0: 6.9 mg ai/L 95% C.I.: (4.6 to 10 mg aiL)
Development Rate (nominal concentrations) NOAEC: 0.25 mg ai/L LOAEC: 0.5 mg a i L IC50: S . 0 mg ai1L
Assessment endpoints: emergence rate and development rate (combined genders) Most sensitive endpoint based on NOAEC: development rate
8. ADEQUACY OF THE STUDY:
A. Classification: Supplemental
B. Rationale: It was reported that the study followed the BBA Guideline: Effects of plant protection products on the development of sediment-dwelling larvae of Chironomus riparius in a water sediment system (Streloke and Kopp, 1995) and OECD Guideline No. 207: Earthworm, Acute Toxicity Test, and does not fulfill any current U.S. EPA data requirement.
C. Reparability: N/A
DP Barcode: 367525 MRID No.: 478070-13
9. MAJOR GUIDELINE DEVIATIONS (from OECD Guideline 219):
1. The environmental conditions maintained during culturing and the health of t h ~ in-house culture was not reported.
2. The TOC and moisture content of the artificial sediment were not reported. 3. The sediment to overlying water depth ratio was ca. 1 :9, exceeded the maxim*
recommended ratio of 1 :4. I
4. Water hardness and ammonia levels were not monitored during the study. 5. Analysis of pore water for trifluralin concentrations was not performed.
10. SUBMISSION PURPOSE: LitigationIEndangered Species
11. MATERIALS AND METHODS
Stability of Compound Under Test Conditions: To assess the behavior of tdifluralin in the test system, samples of overlying water collected from the 1.0 and 8.0 m& levels (biological test systems) were analyzed on Days 0,3,7,28, and samples of sediment collected from the 1.0 and 8.0 mg/L levels (surrogate test systems) were analyded on Days 0,7, and 28. Data reported for the overlying water fiom surrogate test sybtems were not included in this discussion (see Reviewer's Comments section).
Trifluralin dissipates fiom the water phase rapidly. At Day 0 (2 hours followiqg application), maximum concentrations in overlying water were 41 and 3.4% off nominal levels at the 1.0 and 8.0 mg/L levels, respectively. The lower recovery at the 8~.0 mgL level was an effect of the low aqueous solubility of trifluralin and its tendency to aggregate at concentrations above its solubility. By Day 7, trifluralin was unddtectable in overlying water at both concentration levels.
In sediment, concentrations of trifluralin were 19.8 and 58.9% of nominal at the 1.0 and 8.0 mg/L levels, respectively, indicating that at solubility, nearly 60% of the applied is transferred to the determined whether transfer to the sediment or volatilization from solution wa$ responsible for the loss. It was noted that the color of the parafilm cage (not f h h e r described) turned to yellow during the test, and apparently an analysis of the cage was performed (methods not reported). At the 1.0 and 8.0 mgIL levels on Day 7, concentrations of trifluralin in sediment were 15.6 and 62.7% of the nominally applied, I respectively, and concentrations inlon the cage were 19.0 and 2.9% of the nom nally applied, respectively. On Day 28, trifluralin was not detected in sediment and ccounted F for 2.1% of the applied at the 1 .O mg/L level, and accounted for 41.5 and 2.8% of the nominally applied in the sediment and cage, respectively, at the 8.0 mg/L levell
DP Barcode: 367525 MRID No.: 478070-13
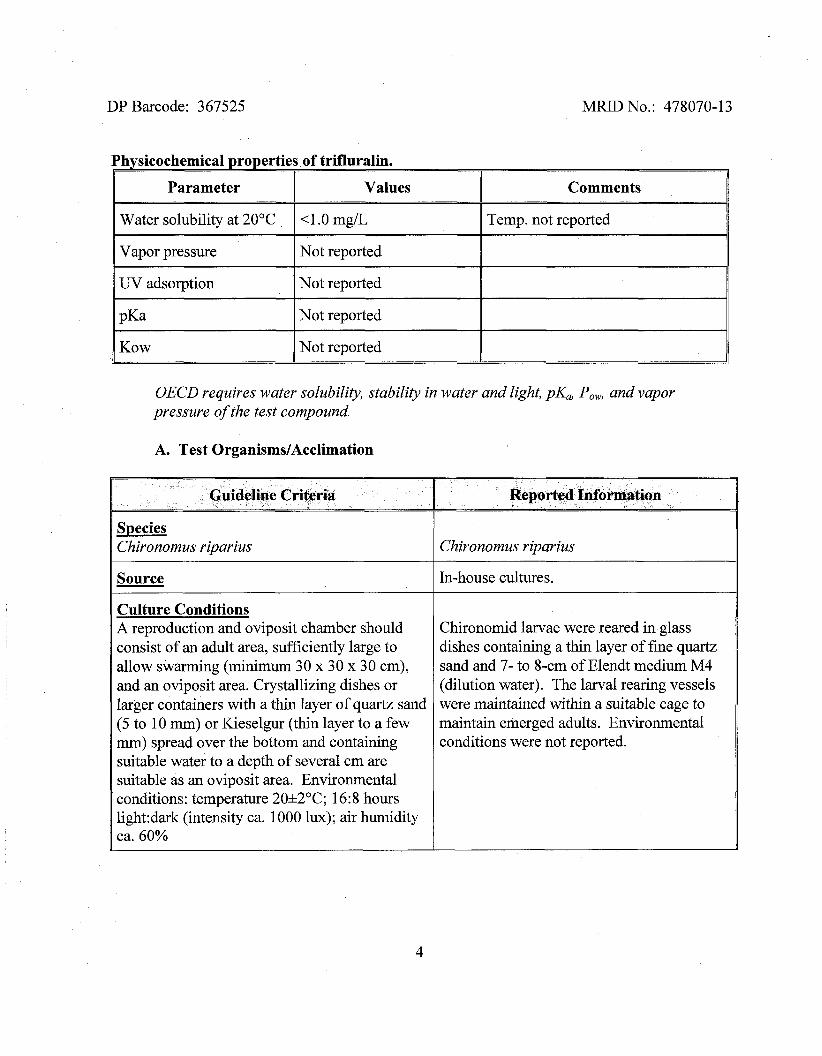
Physicochemical properties of trifluralin.
Water solubility at 20°C
Vapor pressure
11 ISow I Not reported 1 11
UV adsorption
P K ~
OECD requires water solubility, stability in water and light, pK, P o , and vapor pressure of the test compound.
4 . 0 mg/L
Not reported
Not reported
Not reported
A. Test Organisms/Acclimation
Temp. not reported
Guideline Criteria
Species Chironomus riparius
Source
Culture Conditions A reproduction and oviposit chamber should consist of an adult area, sufficiently large to allow swarming (minimum 30 x 30 x 30 cm), and an oviposit area. Crystallizing dishes or larger containers with a thin layer of quartz sand (5 to 10 mrn) or Kieselgur (thin layer to a few mm) spread over the bottom and containing suitable water to a depth of several cm are suitable as an oviposit area. Environmental conditions: temperature 20h2OC; 16:8 hours 1ight:dark (intensity ca. 1000 lux); air humidity ca. 60%
Reported Informtion
Chironomus riparius
In-house cultures.
Chironomid larvae were reared in glass dishes containing a thin layer of fine quartz sand and 7- to 8-cm of Elendt medium M4 (dilution water). The larval rearing vessels were maintained within a suitable cage to maintain emerged adults. Environmental conditions were not reported.
DP Barcode: 367525 MRID No.: 478070-13
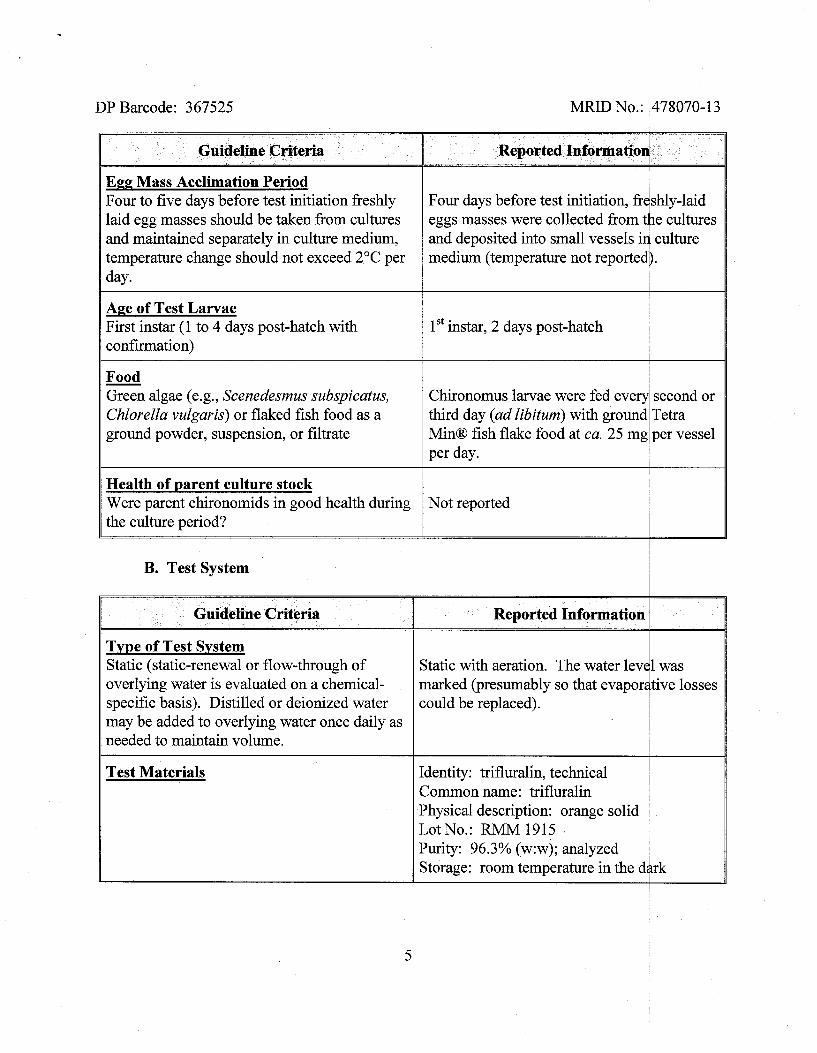
Guideline CJit-eria I Reported ~nfurmatiod
1" instar, 2 days post-hatch
Green algae (e.g., Scenedesmus subspicatus, Chironomus larvae were fed every second or Chlorella vulgaris) or flaked fish food as a third day (ad libitum) with ground Tetra ground powder, suspension, or filtrate
Health of parent culture stock
B. Test System I ~ Tvpe of Test Svstem Static (static-renewal or flow-through of
Physical description: orange solid Lot No.: RMM 1915 Purity: 96.3% (w:w); analyzed
DP Barcode: 367525 MRID No.: 478070-13
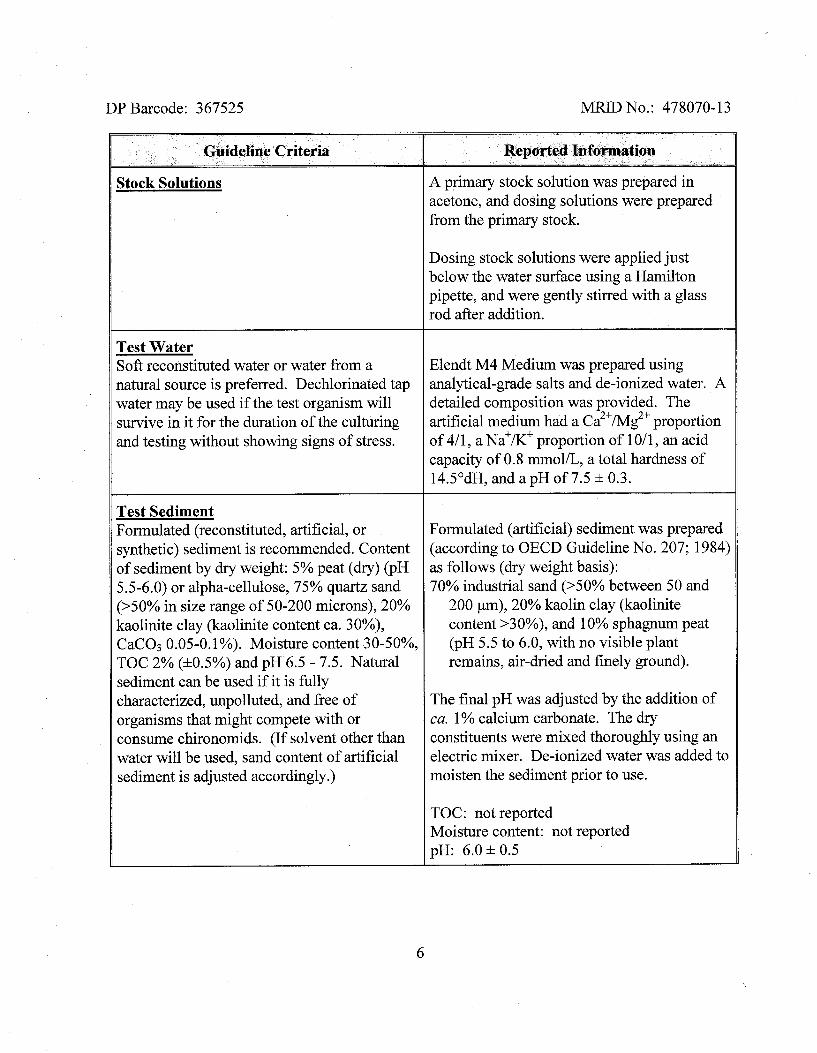
Guideline Criteria
Stock Solutions
Test Water Soft reconstituted water or water from a natural source is preferred. Dechlorinated tap water may be used if the test organism will survive in it for the duration of the culturing and testing without showing signs of stress.
Test Sediment Formulated (reconstituted, artificial, or synthetic) sediment is recommended. Content of sediment by drgr weight: 5% peat (dry) (pH 5.5-6.0) or alpha-cellulose, 75% quartz sand (>50% in size range of 50-200 microns), 20% kaolinite clay (kaolinite content ca. 30%), CaC03 0.05-0.1%). Moisture content 30-50%, TOC 2% (rt0.594) and pH 6.5 - 7.5. Natural sediment can be used if it is fully characterized, unpolluted, and free of organisms that might compete with or consume chironomids. (If solvent other than water will be used, sand content of artificial sediment is adjusted accordingly.)
Reported Infmxnation
A primary stock solution was prepared in acetone, and dosing solutions were prepared from the primary stock.
Dosing stock solutions were applied just below the water surface using a Hamilton pipette, and were gently stirred with a glass rod after addition.
Elendt M4 Medium was prepared using analytical-grade salts and de-ionized water. A detailed composition was provided. The artificial medium had a ca2+/Mg2+ proportion of 411, a N~+/R' proportion of 1011, an acid capacity of 0.8 mmollL, a total hardness of 14.5"dH7 and a pH of 7.5 h 0.3.
Formulated (artificial) sediment was prepared (according to OECD Guideline No. 207; 1984) as follows (dry weight basis): 70% industrial sand (>50% between 50 and
200 pm), 20% kaolin clay (kaolinite content >30%), and 10% sphagnum peat (pH 5.5 to 6.0, with no visible plant remains, air-dried and finely ground).
The final pH was adjusted by the addition of ca. 1% calcium carbonate. The dry constituents were mixed thoroughly using an electric mixer. De-ionized water was added to moisten the sediment prior to use.
TOC: not reported Moisture content: not reported pH: 6.0 k 0.5
DP Barcode: 367525 MRID No.: 478070-13
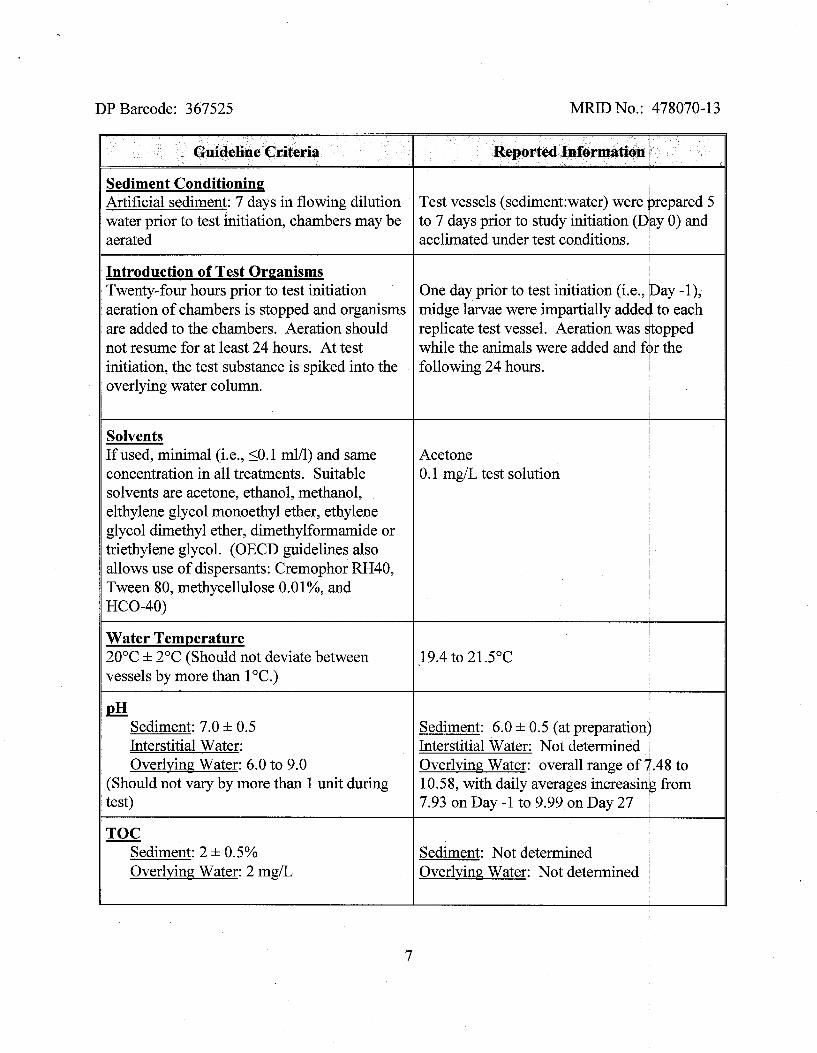
not resume for at least 24 hours. At test
overlying water column.
If used, minimal (i.e., 10.1 mlll) and same concentration in all treatments. Suitable 0.1 mg/L test solution solvents are acetone, ethanol, methanol, elthylene glycol monoethyl ether, ethylene glycol dimethyl ether, dimethylformamide or triethylene glycol. (OECD guidelines also
Sediment: 7.0 h 0.5 Sediment: 6.0 h 0.5 (at preparation) Interstitial Water: Interstitial Water: Not determined Overlying Water: 6.0 to 9.0 Overlying Water: overall range of 7.48 to
Sediment: 2 * 0.5% Sediment: Not determined Overlyina Water: 2 mg/L Overlying Water: Not determined
DP Barcode: 367525 MRID No.: 478070- 13
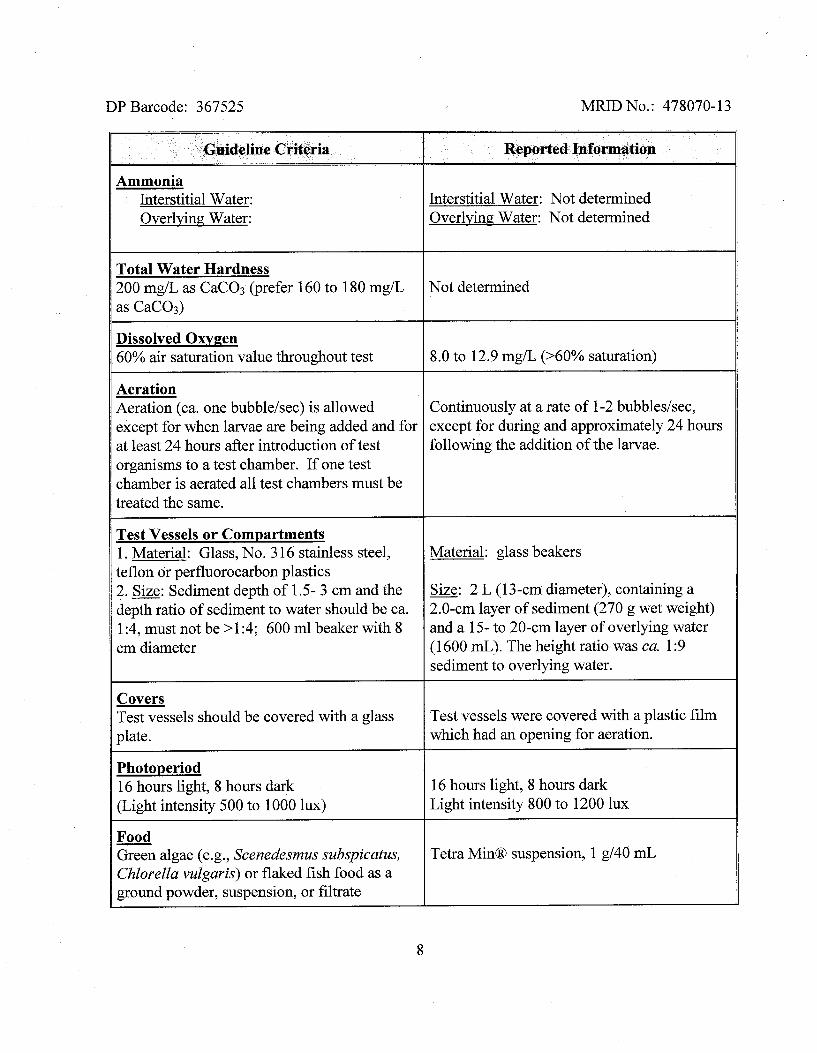
Ammonia Interstitial Water: Overlying Water:
Guideline Cri+eria
Interstitial Water: Not determined Overlying; Water: Not determined
Reported Infarmation
Total Water Hardness 200 mg/L as CaC03 (prefer 160 to 180 mg/L as CaC03)
Not determined
Aeration Aeration (ca. one bubblelsec) is allowed except for when larvae are being added and for at least 24 hours after introduction of test organisms to a test chamber. If one test chamber is aerated all test chambers must be treated the same.
I Dissolved Oxygen 60% air saturation value throughout test
Continuously at a rate of 1-2 bubbleslsec, except for during and approximately 24 hours following the addition of the larvae.
8.0 to 12.9 mg1L (>60% saturation) I
Test Vessels or Compartments 1. Material: Glass, No. 3 16 stainless steel, teflon or perfluorocarbon plastics 2. &: Sediment depth of 1.5- 3 cm and the depth ratio of sediment to water should be ca. 1 :4, must not be >1:4; 600 ml beaker with 8 cm diameter
Material: glass beakers
&: 2 L (13-cm diameter), containing a 2.0-cm layer of sediment (270 g wet weight) and a 15- to 20-cm layer of overlying water (1600 mL). The height ratio was ca. 1 :9 sediment to overlying water.
Covers Test vessels should be covered with a glass plate.
Test vessels were covered with a plastic film which had an opening for aeration.
Photoperiod 16 hours light, 8 hours dark (Light intensity 500 to 1000 lux)
16 hours light, 8 hours dark Light intensity 800 to 1200 lux
Food - Green algae (e.g . , Scenedesmus subspicatus, Chlorella vulgaris) or flaked fish food as a ground powder, suspension, or filtrate
Tetra MinB suspension, 1 g/40 mL
DP Barcode: 367525 MRID No.: 478070-13
I
C. Test Design ~
Guideline Criteria
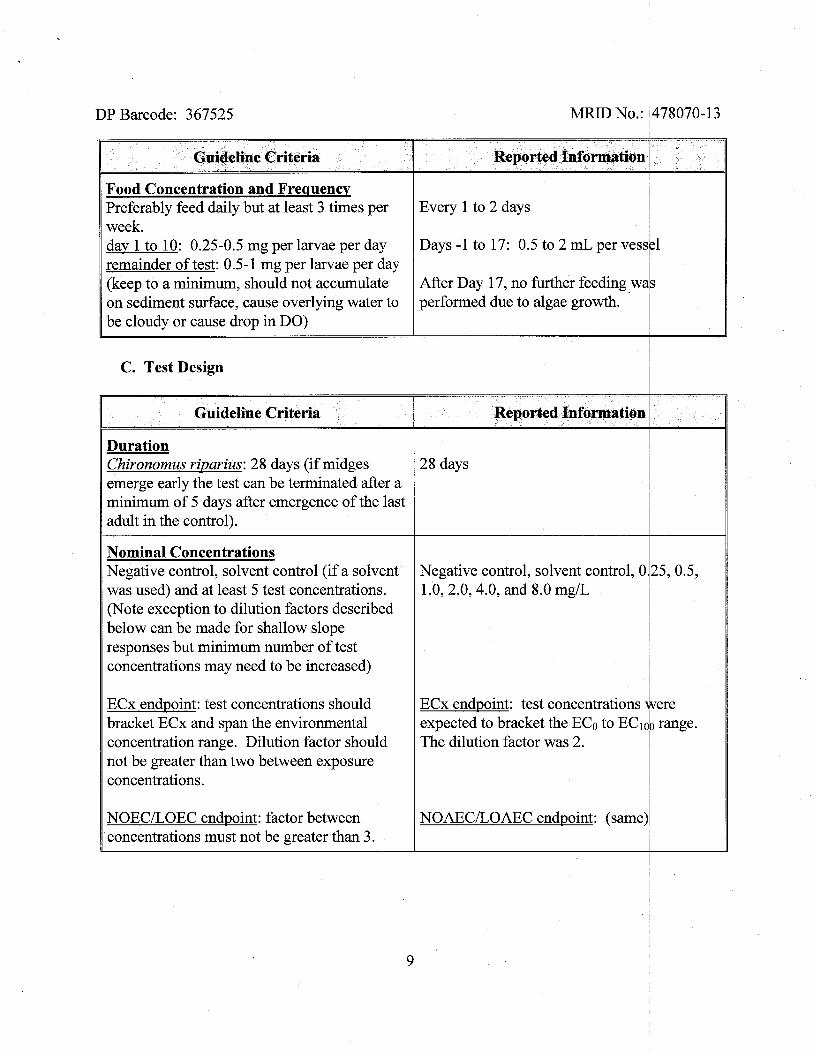
Food Concentration and Frequency Preferably feed daily but at least 3 times per week. day 1 to 10: 0.25-0.5 mg per larvae per day remainder of test: 0.5- 1 mg per larvae per day (keep to a minimum, should not accumulate on sediment surface, cause overlying water to be cloudy or cause drop in DO)
I
Reported Information ~ I
Every 1 to 2 days I I ,
Days -1 to 17: 0.5 to 2 mL per vess 1 e After Day 17, no further feeding was performed due to algae growth. ' ~
1 I
Guideline Criteria
Duration Chironomus rijparius: 28 days (if midges emerge early the test can be terminated after a minimum of 5 days after emergence of the last adult in the control).
Nominal Concentrations Negative control, solvent control (if a solvent was used) and at least 5 test concentrations. (Note exception to dilution factors described below can be made for shallow slope responses but minimum number of test concentrations may need to be increased)
ECx endpoint: test concentrations should bracket ECx and span the environmental concentration range. Dilution factor should not be greater than two between exposure concentrations.
NOECILOEC endpoint: factor between concentrations must not be greater than 3.
Reported Information
28 days 1 ~ I
Negative control, solvent control, 0 25,0.5, 1 .O, 2.0,4.0, and 8.0 mg/L
.I
I
ECx endpoint: test concentrations *ere expected to bracket the ECo to E C ~ ~ ~ range. The dilution factor was 2. 1
I
I I
NOAECILOAEC endpoint: same)^
DP Barcode: 367525 MRID No.: 478070-13
Guideline Criteria
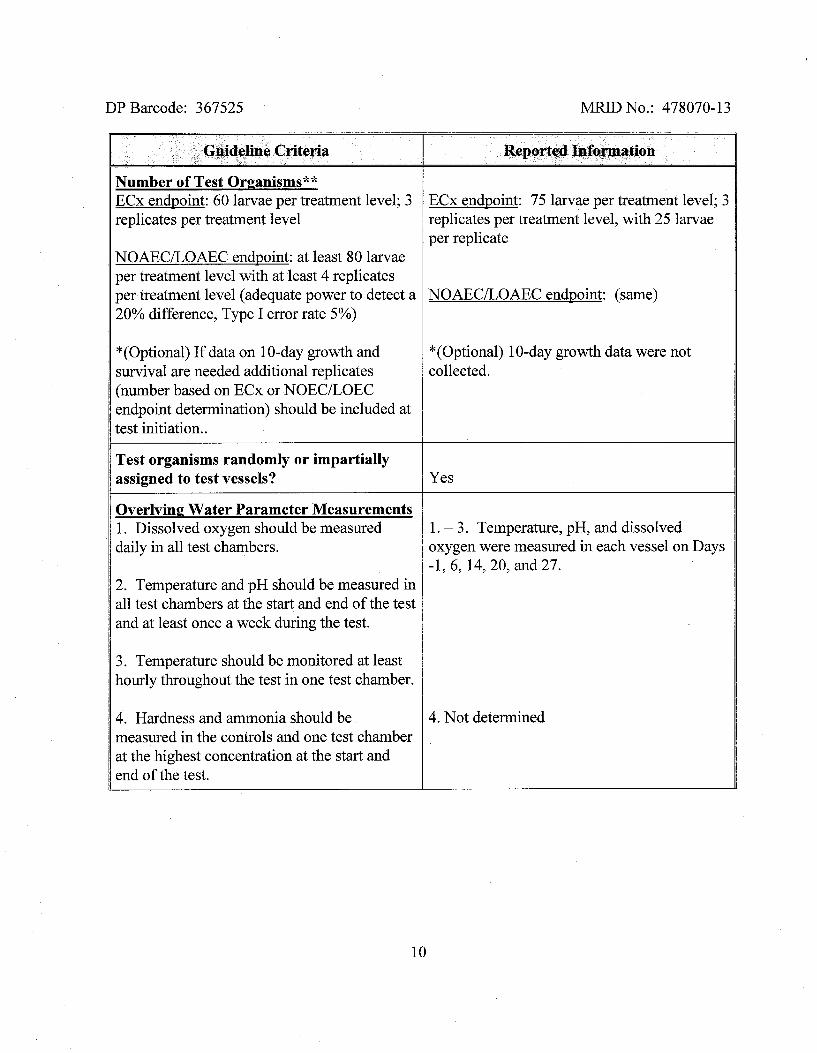
Number of Test Organisms** ECx endpoint: 60 larvae per treatment level; 3 replicates per treatment level
NOAECILOAEC endpoint: at least 80 larvae per treatment level with at least 4 replicates per treatment level (adequate power to detect a 20% difference, Type I error rate 5%)
*(Optional) If data on 10-day growth and survival are needed additional replicates (number based on ECx or NOECILOEC endpoint determination) should be included at test initiation..
Test organisms randomly or impartially assigned to test vessels?
Overlying Water Parameter Measurements 1. Dissolved oxygen should be measured daily in all test chambers.
2. Temperature and pH should be measured in all test chambers at the start and end of the test and at least once a week during the test.
3. Temperature should be monitored at least hourly throughout the test in one test chamber.
4. Hardness and ammonia should be measured in the controls and one test chamber at the highest concentration at the start and end of the test.
Reported I d ~ m a t i o n
ECx endpoint: 75 larvae per treatment level; 3 replicates per treatment level, with 25 larvae per replicate
NOAECLOAEC endpoint: (same)
*(Optional) 10-day growth data were not collected.
Yes
1. - 3. Temperature, pH, and dissolved oxygen were measured in each vessel on Days -1, 6, 14,20, and 27.
4. Not determined
DP Barcode: 367525 MRID No.: 478070-13
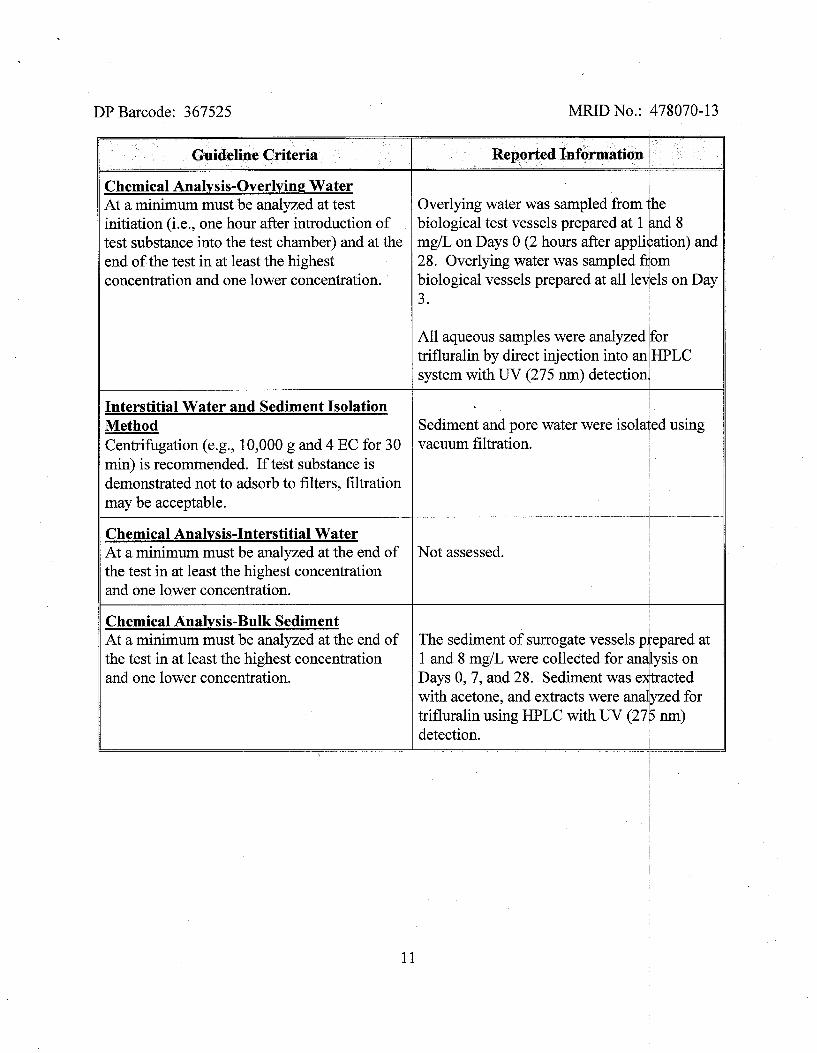
Chemical Analysis-Overlying Water At a minimum must be analyzed at test initiation (i.e., one hour after introduction of test substance into the test chamber) and at the end of the test in at least the highest
1 concentration and one lower concentration.
Guideiine Criteria
Interstitial Water and Sediment Isolation
Reported Information ~
Method Centrifugation (e.g., 10,000 g and 4 EC for 30 min) is recommended. If test substance is demonstrated not to adsorb to filters, filtration may be acceptable.
Chemical Analvsis-Interstitial Water At a minimum must be analyzed at the end of the test in at least the highest concentration and one lower concentration.
Overlying water was sampled from e biological test vessels prepared at 1 k d 8 mg/L on Days 0 (2 hours after applikation) and 28. Overlying water was sampled fitom biological vessels prepared at all ledels on Day
All aqueous samples were analyzed /for trifluralin by direct injection into an HPLC system with UV (275 nm) detection.
I
Sediment and pore water were isolaled using vacuum filtration.
Not assessed.
Chemical Analysis-Bulk Sediment At a minimum must be analyzed at the end of the test in at least the highest concentration and one lower concentration.
The sediment of surrogate vessels piepared at 1 and 8 mg/L were collected for analysis on Days 0,7, and 28. Sediment was edtracted with acetone, and extracts were a n a ~ z e d for trifluralin using HPLC with UV (27b nm) detection. I
DP Barcode: 367525 MRID No.: 478070-13
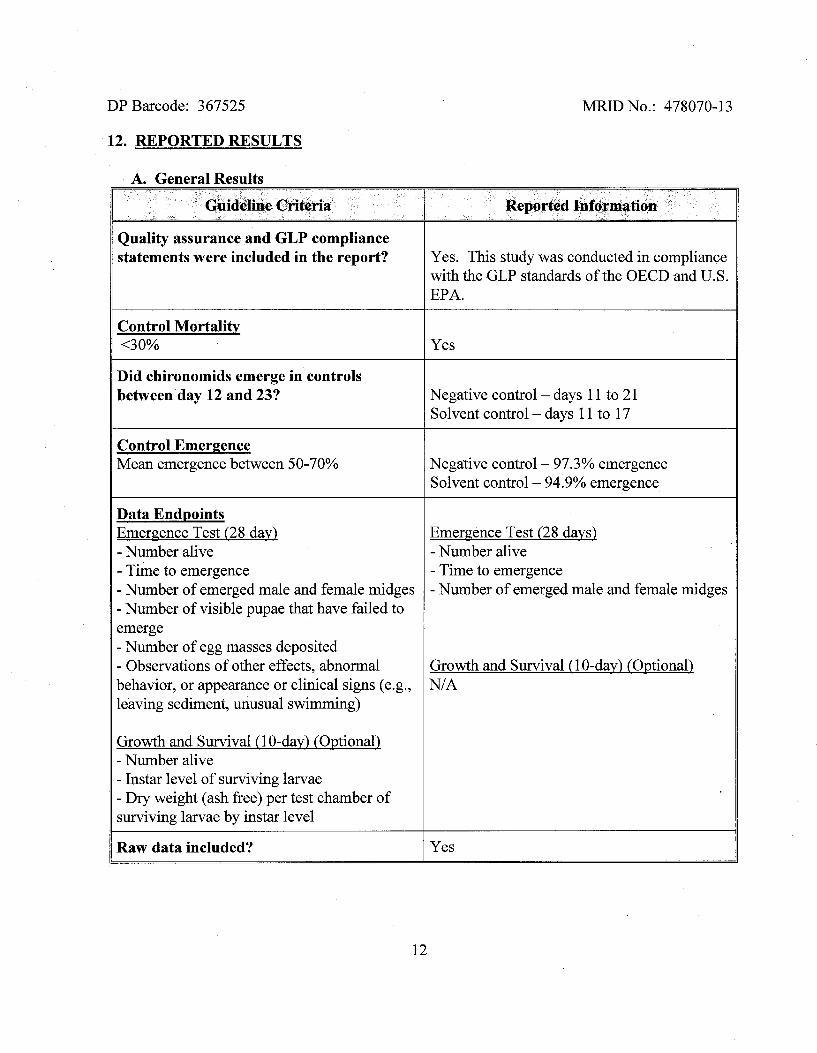
12. REPORTED RESULTS
Quality assurance and GLP compliance statements were included in the report?
A. General Results
Yes. This study was conducted in compliance with the GLP standards of the OECD and U.S. EPA.
Guideline Criteria
Control Mortalitv 1 -30%
Reported Information
Did chironomids emerge in controls between day 12 and 23? Negative control - days 1 1 to 2 1
Solvent control - days 1 1 to 17
Control Emergence Mean emergence between 50-70% Negative control - 97.3% emergence
Solvent control - 94.9% emergence
Data Endpoints Emergence Test (28 day) - Number alive - Time to emergence - Number of emerged male and female midges - Number of visible pupae that have failed to emerge - Number of egg masses deposited - Observations of other effects, abnormal behavior, or appearance or clinical signs (e.g., leaving sediment, unusual swimming)
Growth and Survival (1 0-day) (Optional) - Number alive - Instar level of surviving larvae - Dry weight (ash free) per test chamber of surviving larvae by instar level
Emergence Test (28 days) - Number alive - Time to emergence - Number of emerged male and female midges
Growth and Survival (1 0-day) (Optional) NI A
1 Raw data included? 1 yes 11
DP Barcode: 367525
Effects Data
MRID No.: 478070-1 3
sex ratio
Sex ~a t io@) (%I
E R ~
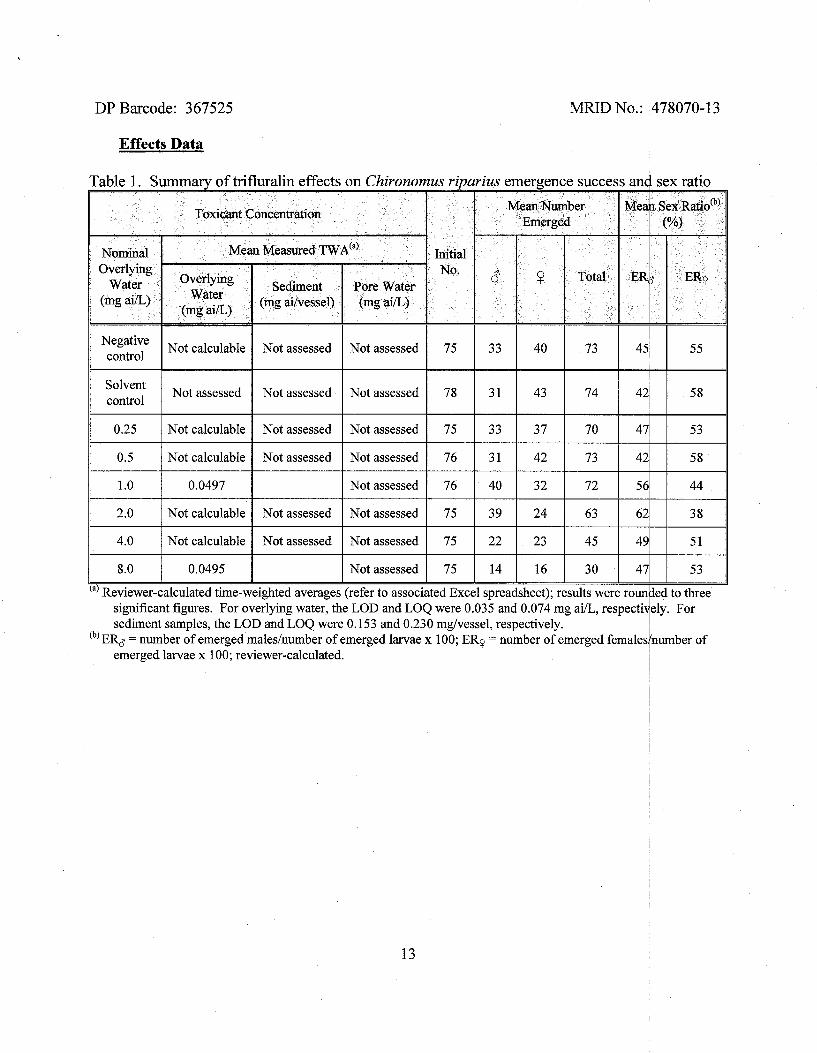
Table 1. Summary of trifluralin effects on Chironomus
Toxicant Concentration
Initial No.
Nominal Overlying
water 0% afi)
Negative control
control
0.25
0.5
1 .O
2.0
4.0
8.0
(a) Reviewer-calculated time-weighted averages (refer to associated Excel spreadsheet); results were rounded to three significant figures. For overlying water, the LOD and LOQ were 0.035 and 0.074 mg ai/L, respecti ely. For sediment samples, the LOD and LOQ were 0.153 and 0.230 mg/vessel, respectively. Y
" E R ~ = number of emerged malesinumber of emerged larvae x 100; ER9 = number of emerged femaleslnumber of emerged larvae x 100; reviewer-calculated. I
I
75
78
75
76
76
75
75
75
Mean Measured TWA(~)
ark
Meal
ER,l
riparius emergence success
Mean Number Emerged
$ Pore Water (mg a jn)
Not assessed
Not assessed
Not assessed
Not assessed
Not assessed
Not assessed
Not assessed
Not assessed
overlying Water
(mg sin)
Not calculable
Not assessed
Not calculable
Not calculable
0.0497
Not calculable
Not calculable
0.0495
Total
33
3 1
33
3 1
40
39
22
14
Sediment (mg ailvessel)
Not assessed
Not assessed
Not assessed
Not assessed
Not assessed
Not assessed
451 40
43
37
42
32
24
23
16
55 73
74
70
73
72
63
45
3 0
42 58
471 I
53
421 ' 1 58 I
56~ 44
62 I
49 I
47
38
5 1
53
DP Barcode: 367525 MRID No.: 478070-13
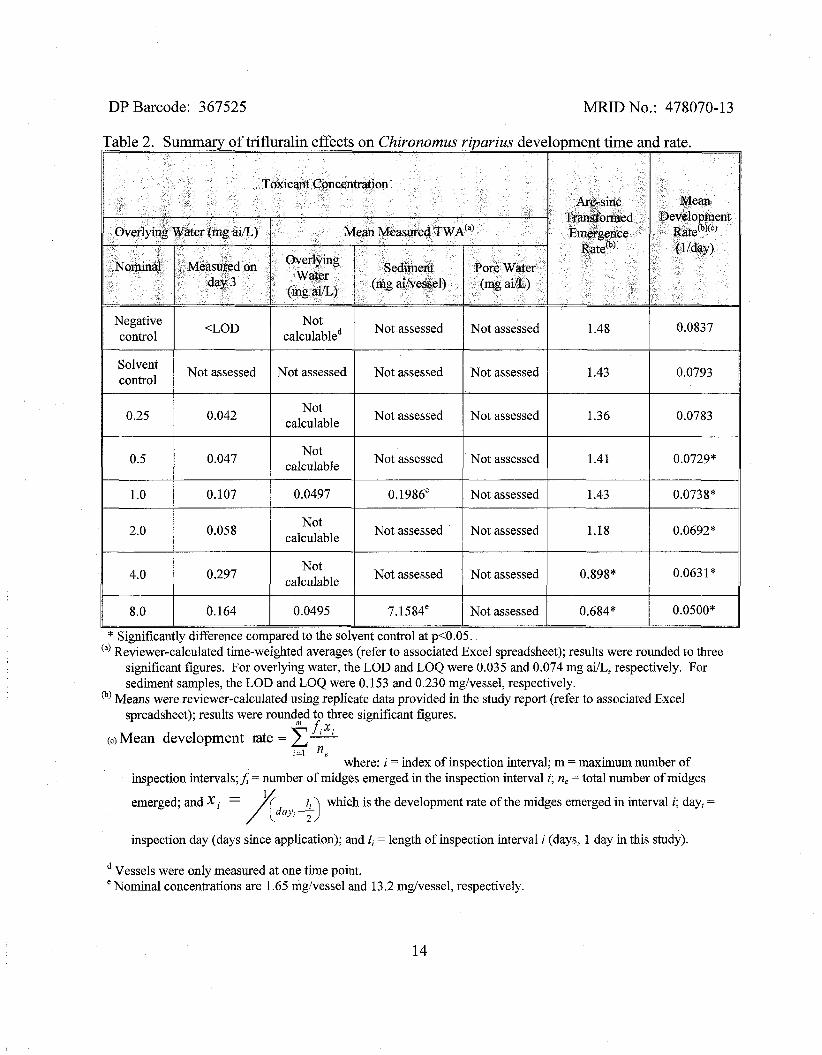
* Significantly difference compared to the solvent control at p<0.05. Reviewer-calculated time-weighted averages (refer to associated Excel spreadsheet); results were rounded to three
significant figures. For overlying water, the LOD and LOQ were 0.035 and 0.074 mg ai/L, respectively. For sediment samples, the LOD and LOQ were 0.153 and 0.230 mg/vessel, respectively.
(b) Means were reviewer-calculated using replicate data provided in the study report (refer to associated Excel spreadsheet); results were roundzd to three significant figures.
f1x1 M Mean development mte = x-
z=1 n, where: i = index of inspection interval; m = maximum number of
inspection intervals;$ = number of midges emerged in the inspection interval i; n, = total number of midges
emerged; and X i = which is the development rate of the midges emerged in interval i ; day, =
inspection day (days since application); and 1, = length of inspection interval i (days, 1 day in this study).
Vessels were only measured at one time point. Nominal concentrations are 1.65 mg/vessel and 13.2 mg/vessel, respectively.
DP Barcode: 367525 MRID No.: 478070-13
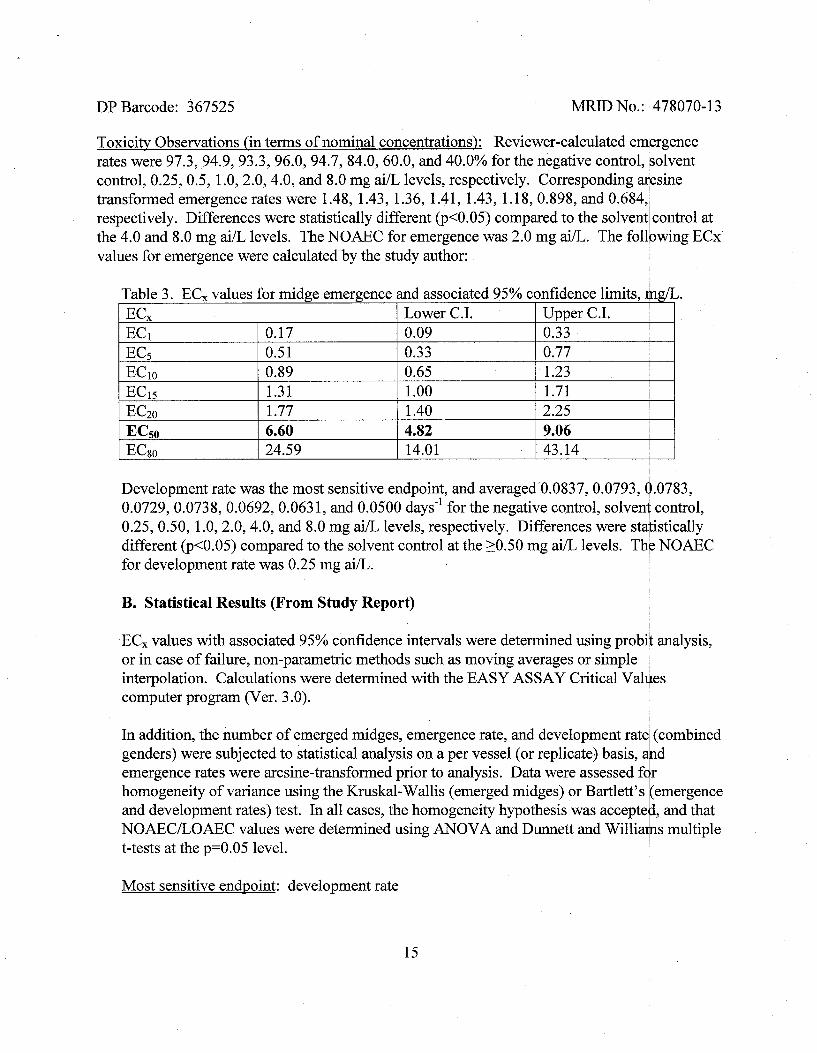
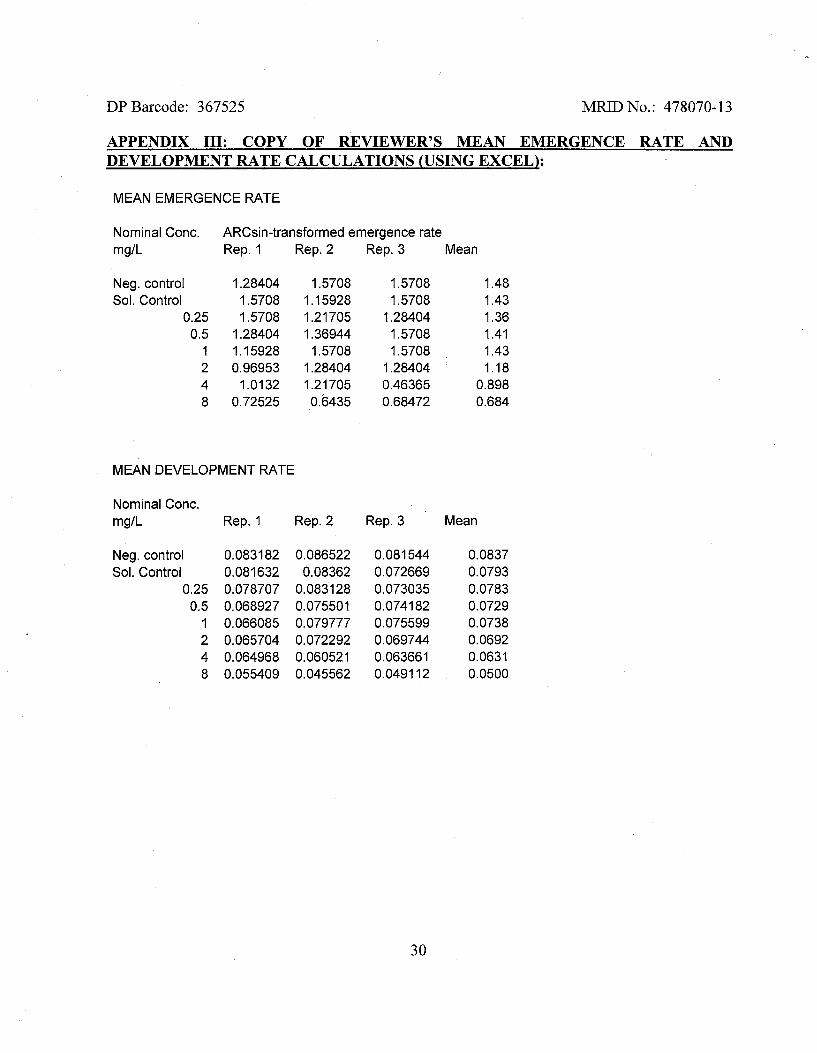
Toxicity Observations (in terms of nominal concentrations): Reviewer-calculated emergence rates were 97.3, 94.9,93.3,96.0,94.7, 84.0,60.0, and 40.0% for the negative control, solvent control, 0.25, 0.5, 1.0,2.0,4.0, and 8.0 mg ai/L levels, respectively. Corresponding arcsine transformed emergence rates were 1.48, 1.43, 1.36, 1.4 1, 1.43, 1.18,0.898, and 0.684,1 respectively. Differences were statistically different @<0.05) compared to the solvent control at the 4.0 and 8.0 mg ai/L levels. The NOAEC for emergence was 2.0 mg aiIL. The follpwing ECx values for emergence were calculated by the study author:
Table 3. EC, values for midge emergence and associated 95% confidence limits, $I~/L. I ECx I Lower C.I. I Upper C.I.
I
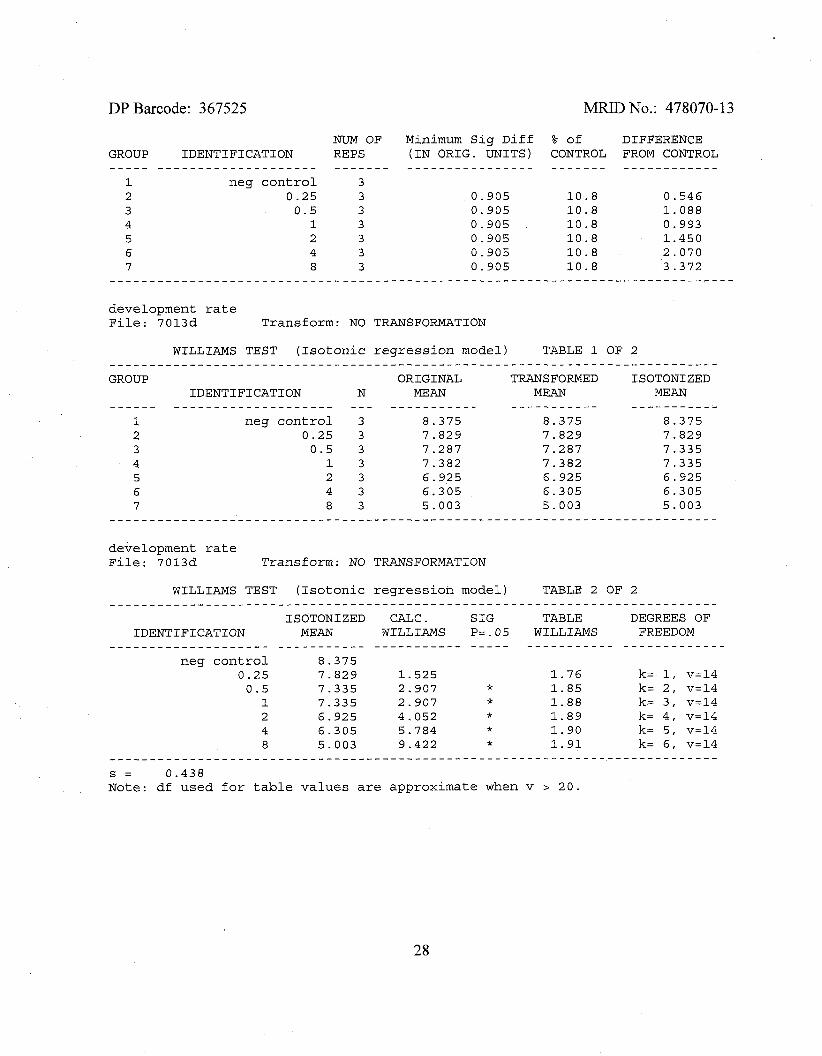
Development rate was the most sensitive endpoint, and averaged 0.0837, 0.0793, 0.0783, 0.0729,0.0738,0.0692,0.0631, and 0.0500 daysm1 for the negative control, solvenl control, 0.25, 0.50, 1 .O, 2.0,4.0, and 8.0 mg ailL levels, respectively. Differences were staristically different ($0.05) compared to the solvent control at the 20.50 mg ai/L levels. The NOAEC for development rate was 0.25 mg ai/L.
B. Statistical Results (From Study Report)
ECx values with associated 95% confidence intervals were determined using probik analysis, or in case of failure, non-parametric methods such as moving averages or simple interpolation. Calculations were determined with the EASY ASSAY Critical Valqes computer program (Ver. 3.0).
In addition, the number of emerged midges, emergence rate, and development rate (combined genders) were subjected to statistical analysis on a per vessel (or replicate) basis, &d emergence rates were arcsine-transformed prior to analysis. Data were assessed f r homogeneity of variance using the Kruskal-Wallis (emerged midges) or Bartlett's emergence 4 and development rates) test. In all cases, the homogeneity hypothesis was accepteq, and that NOAECILOAEC values were determined using ANOVA and Dunnett and Williaqhs multiple t-tests at the p=0.05 level.
Most sensitive endpoint: development rate
15
DP Barcode: 367525 MRID No.: 478070-1 3
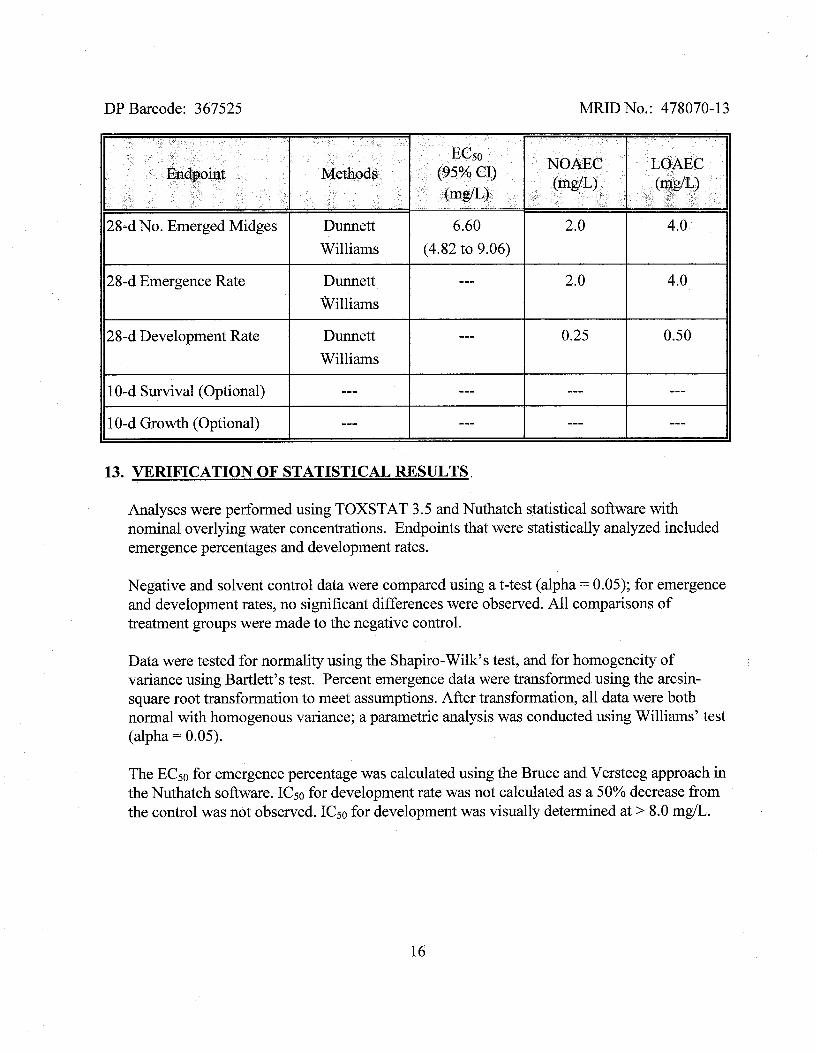
13. VERIFICATION OF STATISTICAL RESULTS
28-d Emergence Rate
28-d Development Rate
10-d Survival (Optional)
10-d Growth (Optional)
Analyses were performed using TOXSTAT 3.5 and Nuthatch statistical software with nominal overlying water concentrations. Endpoints that were statistically analyzed included emergence percentages and development rates.
Negative and solvent control data were compared using a t-test (alpha = 0.05); for emergence and development rates, no significant differences were observed. All comparisons of treatment groups were made to the negative control.
Dunnett Williams
Dunnett Williams
---
---
Data were tested for normality using the Shapiro-Wilk's test, and for homogeneity of variance using Bartlett's test. Percent emergence data were transformed using the arcsin- square root transformation to meet assumptions. After transformation, all data were both normal with homogenous variance; a parametric analysis was conducted using Williams' test (alpha = 0.05).
The EC5() for emergence percentage was calculated using the Bruce and Versteeg approach in the Nuthatch software. IC50 for development rate was not calculated as a 50% decrease from the control was not observed. ICS0 for development was visually determined at > 8.0 mg/L.
---
---
---
---
2.0
0.25
---
---
4.0
0.50
---
---
DP Barcode: 367525
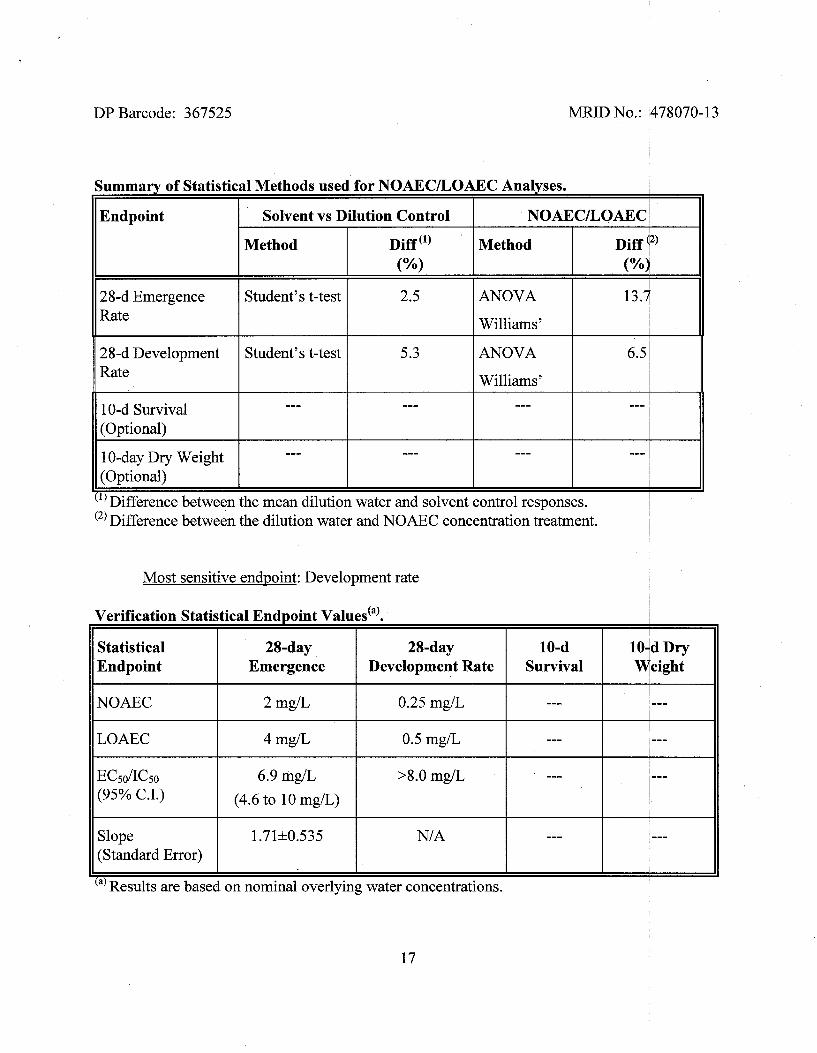
Summary of Statistical Methods used for NOAECLOAEC Analyses. 11 I I
Endpoint I Solvent vs Dilution Control I NOAECLOAEC
I Method I iff"' I Method I iff T)
28-d Emergence ( Student's t-test I 2.5 IANOVA I 13.7 Rate
11 28-d Development I Student's t-test I I
5.3 ANO OVA I 6.5 ~ 11 Rate I Williams' I 10-d Survival (Optional)
I I
(2) Difference between the dilution water and NOAEC concentration treatment. I
10-day Dry Weight (Optional)
Most sensitive endpoint: Development rate
---
Verification Statistical Endpoint I I I I I I
") Difference between the mean dilution water and solvent control remonses. I
---
Statistical Endpoint
---
---
NOAEC 1 2 mg/L 1 0.25 mg/L I --- I I---
---
28-day Emergence
I
--- i I ---
28-day 10-d Development Rate
--- 1 I
I
LOAEC
EC50/IC50 (95% C.I.)
(") Results are based on nominal overlying water concentrations.
Slope (Standard Error)
4 mg/L
6.9 mg/L
(4.6 to 1 0 mg/L)
1.71h0.535
0.5 mg/L
S . 0 mg/L
---
---
I
--- I
--- I
I
DP Barcode: 367525 MRID No.: 478070-13
14. REVIEWER'S COMMENTS:
The reviewer's conclusions generally agreed with the study author's. The NOAEC values, calculated by the reviewer using the negative control as a comparison to treated groups, were identical to those calculated by the study authors (using the solvent control as a comparison to treated groups). Results calculated by the reviewer will be reported in the study conclusions.
This study does not fulfill any current U.S. EPA guideline. However, it closely followed methods provided in OECD Guideline 219 (April 2004), "Sediment-Water Chironomid Toxicity Test Using Spiked Water", with the primary objective being to determine the median effect concentrations (EC,) associated with emergence (i.e., survival) of Chironomus riparius. In order for the test to be valid, OECD Guidance requires the following conditions: The emergence in the controls must be at least 70% at the end of the test; C. riparius emergence to adults should occur between 12 and 23 days after their insertion into the vessels; at the end of the test, pH and the dissolved oxygen concentration should be measured in each vessel (the oxygen concentration should be at least 60% of the air saturation value at the temperature used, the pH of overlying water should be in the 6-9 range in all test vessels); and the water temperature should not differ by more than kl.O°C. In this study, the pH values increased from an average of 7.93 on Day -1 to 9.99 on Day 27, and exceeded the limits of the proposal guideline due to the algae growth (which was also indicated by the high oxygen concentrations). The study author reported that this did not negatively affect the organisms in the test. All other validity requirements were fulfilled.
Overlying water (volume not reported) was sampled directly fiom the biological vessels prepared on Day 3 (all levels) and Days 0, 7, and 28 (1.0 and 8.0 mg/L levels only). In addition, surrogate vessels were prepared and used for sediment analysis on Days 0,7, and 28 (1.0 and 8.0 mg/L levels only). Although it was reported that overlying water was analyzed in surrogate test vessels collected on Days 0,7, and 28, the data provided for Days 0 and 7 (once converted fiom mglvessel to mg/L) were identical to data obtained fiom analysis of overlying water collected from biological samples for Days 0 and 3. Therefore, it was apparent that only sediment from the surrogate vessels was analyzed.
The volume of overlying water removed (directly from the biological samples) for trifluralin analysis was not reported; therefore, it is unknown what, if any, affect the change in volume had on the biological load or concentration of test substance in the system.
DP Barcode: 367525 MRID No.: 478070-13
The study was conducted for 30 days, 9 days following emergence of the last adult and after 90% of the chironomids had emerged from the solvent control vessels. However, for evaluation of the study, data fiom only 28 days were taken into account.
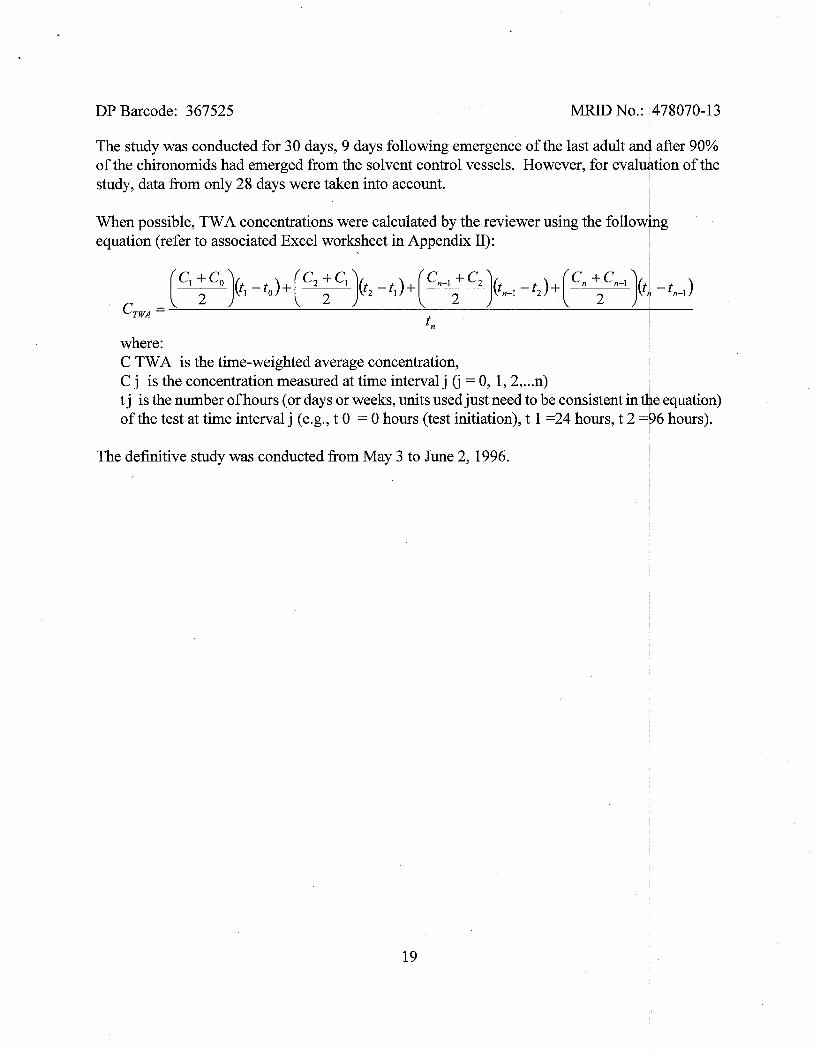
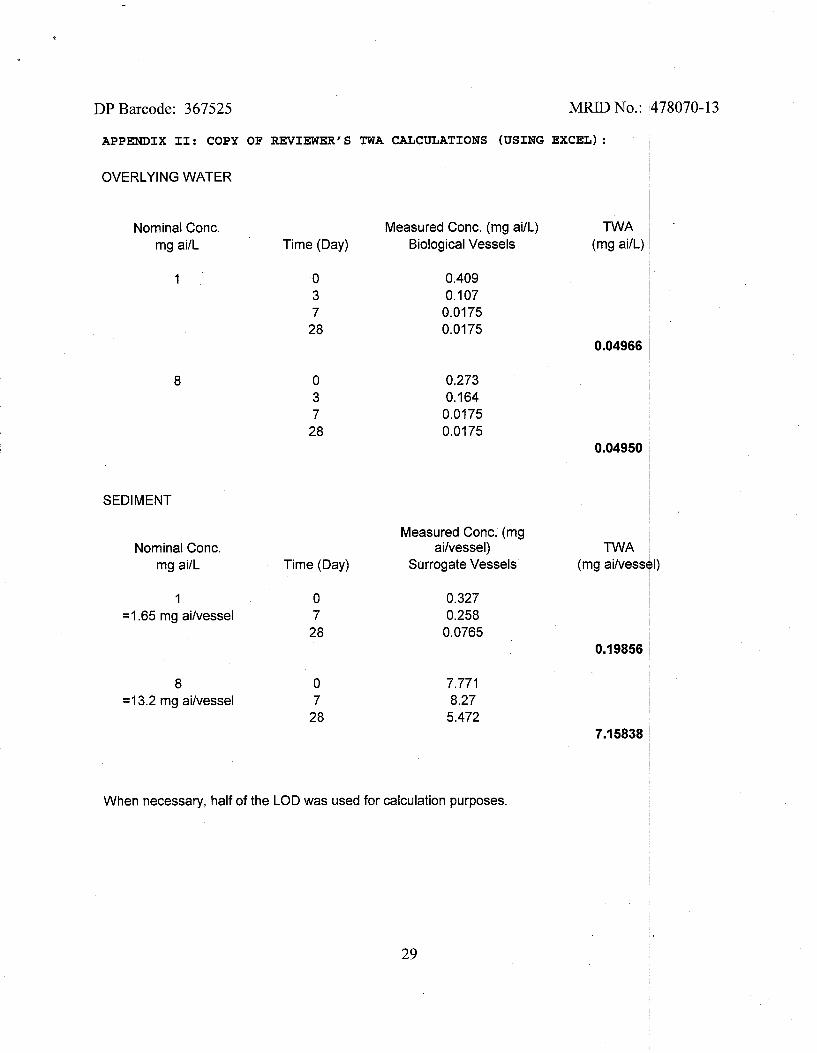
When possible, TWA concentrations were calculated by the reviewer using the following equation (refer to associated Excel worksheet in Appendix 11): I
where: C TWA is the time-weighted average concentration, C j is the concentration measured at time interval j (j = 0, 1,2, ... n) t j is the number of hours (or days or weeks, units used just need to be consistent in the equation) of the test at time interval j (e.g., t 0 = 0 hours (test initiation), t 1 =24 hours, t 2 =96 hours).
The definitive study was conducted fiom May 3 to June 2, 1996. I
DP Barcode: 367525 MRID No.: 478070-13
15. REFERENCES:
OECD. 2002. Proposal for a New Guideline 219: Sediment-Water Chironomid Toxicity Test Using Spiked Water. December 2002 Draft. Paris.
OECD. 1998. OECD Series on Principles of Good Laboratory Practice and Compliance Monitoring, Number 1. OECD Principles on Good Laboratory Practice (as revised in 1997) ENVlMClCHEM(98) 1 7.
European Community (EC). 1999. EC Directive 9911 11EC of 8 March 1999 (OJ No. L 7718-2 1, 231311 999).
U.S. EPA. FIFRA GLPS; Title 40 CFR Part 160 - Federal Insecticide, Fungicide and rodenticide Act (FIFRA); Good Laboratory Practice Standards, Final Rule.
Dow AgroSciences LLC. 2003. Certificate of Analysis for Radioactive Compounds Used as TestIReferencelControl Substances. FA&PC Number 034007. 15 May, 2003.
Dow AgroSciences LLC. 2003. Certificate of Analysis for Test/Reference/Control Substances. FA&PC Number 033 1 16. 2 May, 2003.
Dow AgroSciences LLc. 2003. Test Substance Distribution Certificate. TSN104 126. Dow AgroSciences LLC, Indianapolis, IN. 02 May, 2003.
Shapiro, S.S., and M.B. Wilk. 1965. An Analysis of Variance Test for Normality (complete samples). Biometrika, 52:591-611.
Winer, B.J. 1971. Statistical Methods in Experimental Design (2nd Ed.) McGraw-Hill. New York.
Steel, R.G.D. 1959. A Multiple Comparison Rank Sum Test: Treatments versus Control. Biometries, 1 5 :560-572.
Hollander, M., and D.A. Wolfe. 1973. Nonparametrie Statistical Methods. John Wiley, New York.
Gulley, D.D., A.M. Boetler, and H.L. Bergman. 1989. Toxstat Release 3.2. University of Wyoming, Laramie, Wyoming.
U.S. EPA. 1993. Probit Software Program Version 1.5.
DP Barcode: 367525 MRID No.: 478070-13
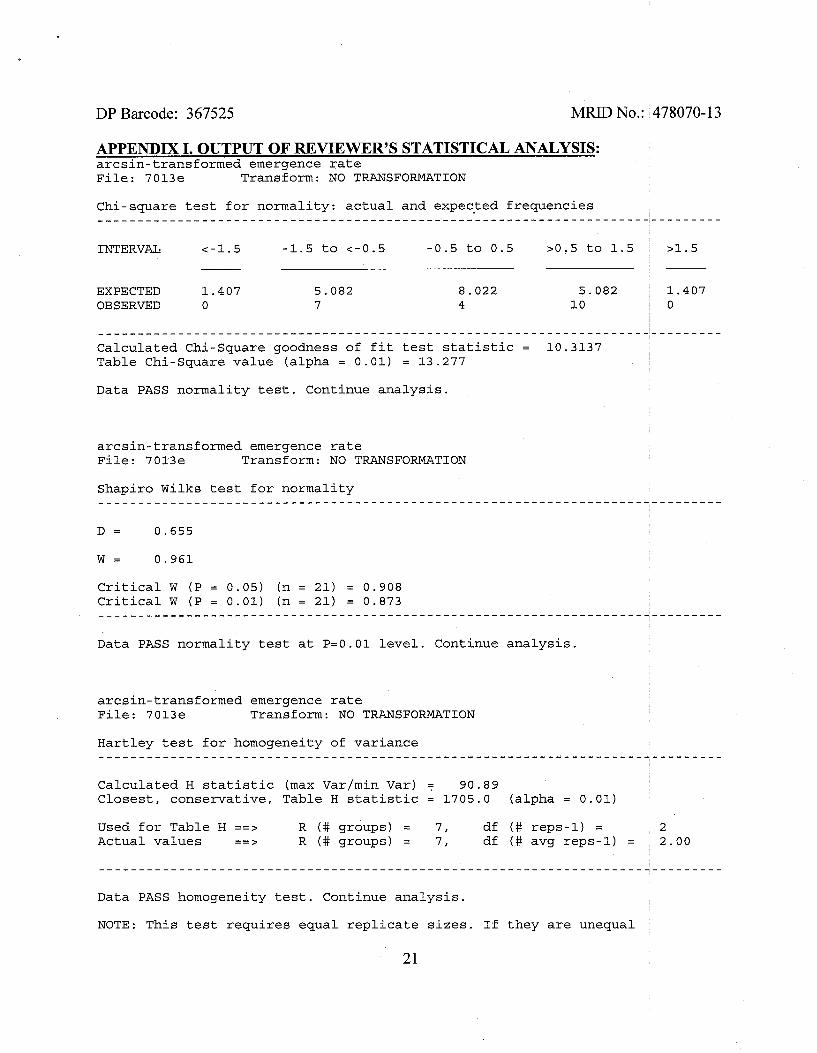
APPENDIX I. OUTPUT OF REVIEWER'S STATISTICAL ANALYSIS: arcsin-transformed emergence rate File: 7013e Transform: NO TRANSFORMATION
Chi-square test for normality: actual and expected frequencies . . . . . . . . . . . . . . . . . . . . . . . . . . . . . . . . . . . . . . . . . . . . . . . . . . . . . . . . . . . . . . . . . . . . . . . . . . . . . .
INTERVAL <-1.5 -1.5 to <-0.5 -0.5 to 0.5 >0.5 to 1.5 >1.5
EXPECTED 1.407 5.082 8.022 5.082 1.407 OBSERVED 0 7 4 10 0
. . . . . . . . . . . . . . . . . . . . . . . . . . . . . . . . . . . . . . . . . . . . . . . . . . . . . . . . . . . . . . . . . . . . . . . . . . . . . . Calculated Chi-square goodness of fit test statistic = 10.3137 Table Chi-Square value (alpha = 0.01) = 13.277
Data PASS normality test. Continue analysis.
arcsin-transformed emergence rate File: 7013e Transform: NO TRANSFORMATION
Shapiro Wilks test for normality . . . . . . . . . . . . . . . . . . . . . . . . . . . . . . . . . . . . . . . . . . . . . . . . . . . . . . . . . . . . . . . . . . . . . . . . . . . . . .
Critical W (P = 0.05) (n = 21) = 0.908 Critical W (P = 0.01) (n = 21) = 0.873 . . . . . . . . . . . . . . . . . . . . . . . . . . . . . . . . . . . . . . . . . . . . . . . . . . . . . . . . . . . . . . . . . . . . . . . . . . . . . .
Data PASS normality test at P=0.01 level. Continue analysis.
arcsin-transformed emergence rate File: 7013e Transform: NO TRANSFORMATION
Hartley test for homogeneity of variance . . . . . . . . . . . . . . . . . . . . . . . . . . . . . . . . . . . . . . . . . . . . . . . . . . . . . . . . . . . . . . . . . . . . . . . . . . . . . .
Calculated H statistic ( m a ~ ~ar/min Var) = 90.89 Closest, conservative, Table H statistic = 1705.0 (alpha = 0.01)
Used for Table H ==> R ( # groups) = 7, df ( # reps-1) = 2 Actual values ==> R ( # groups) = 7, df ( # avg reps-1) = 2.00
Data PASS homogeneity test. Continue analysis.
NOTE: This test requires equal replicate sizes. If they are unequal
2 1
DP Barcode: 367525 MRID No.: 478070-1 3
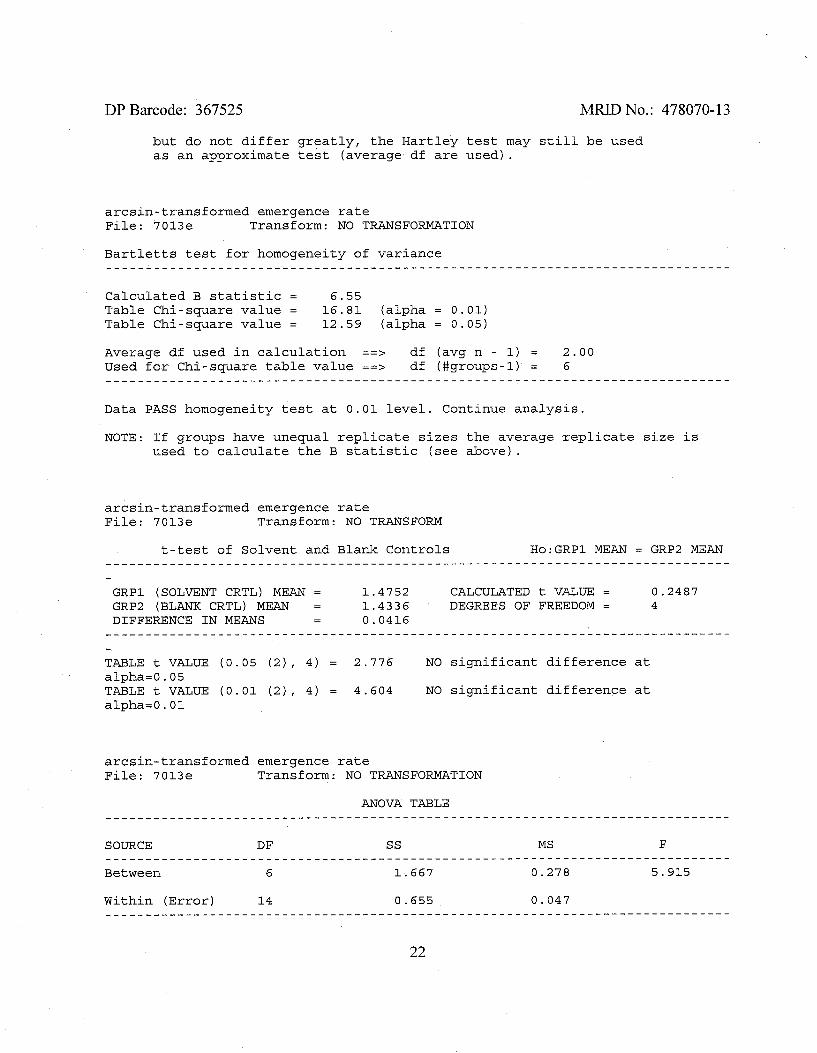
but do not differ greatly, the Hartley test may still be used as an approximate test (average df are used).
arcsin-transformed emergence rate File: 7013e Transform: NO TRANSFORMATION
Bartletts test for homogeneity of variance . . . . . . . . . . . . . . . . . . . . . . . . . . . . . . . . . . . . . . . . . . . . . . . . . . . . . . . . . . . . . . . . . . . . . . . . . . . . . .
Calculated B statistic = 6.55 Table Chi-square value = 16.81 (alpha = 0.01) Table Chi-square value = 12.59 (alpha = 0.05)
Average df used in calculation ==s df (avg n - 1) = 2.00 Used for Chi-square table value ==> df (#groups-1) = 6 . . . . . . . . . . . . . . . . . . . . . . . . . . . . . . . . . . . . . . . . . . . . . . . . . . . . . . . . . . . . . . . . . . . . . . . . . . . . . .
Data PASS homogeneity test at 0.01 level. Continue analysis.
NOTE: If groups have unequal replicate sizes the average replicate size is used to calculate the B statistic (see above).
arcsin-transformed emergence rate File: 7013e Transform: NO TRANSFORM
t-test of Solvent and Blank Controls Ho:GRPl MEAN = GRP2 MEAN . . . . . . . . . . . . . . . . . . . . . . . . . . . . . . . . . . . . . . . . . . . . . . . . . . . . . . . . . . . . . . . . . . . . . . . . . . . . . . - GRPl (SOLVENT CRTL) MEAN = 1.4752 CALCULATED t VALUE = 0.2487 GRP2 (BLANK CRTL) MEAN = 1.4336 DEGREES OF FREEDOM = 4 DIFFERENCE IN MEANS - - 0.0416
- TABLE t VALUE (0.05 (2), 4) = 2.776 NO significant difference at alpha=0.05 TABLEtVALUE (0.01(2), 4) = 4.604 Nosignificantdifferenceat alpha=0.01
arcsin-transformed emergence rate File: 7013e Transform: NO TRANSFORMATION
ANOVA TABLE . . . . . . . . . . . . . . . . . . . . . . . . . . . . . . . . . . . . . . . . . . . . . . . . . . . . . . . . . . . . . . . . . . . . . . . . . . . . . .
SOURCE DF S S MS F . . . . . . . . . . . . . . . . . . . . . . . . . . . . . . . . . . . . . . . . . . . . . . . . . . . . . . . . . . . . . . . . . . . . . . . . . . . . . . Between 6 1.667 0.278 5.915
Within (Error) 14 0.655 0.047 . . . . . . . . . . . . . . . . . . . . . . . . . . . . . . . . . . . . . . . . . . . . . . . . . . . . . . . . . . . . . . . . . . . . . . . . . . . . . .
DP Barcode: 367525 MRID No.: 478070-13
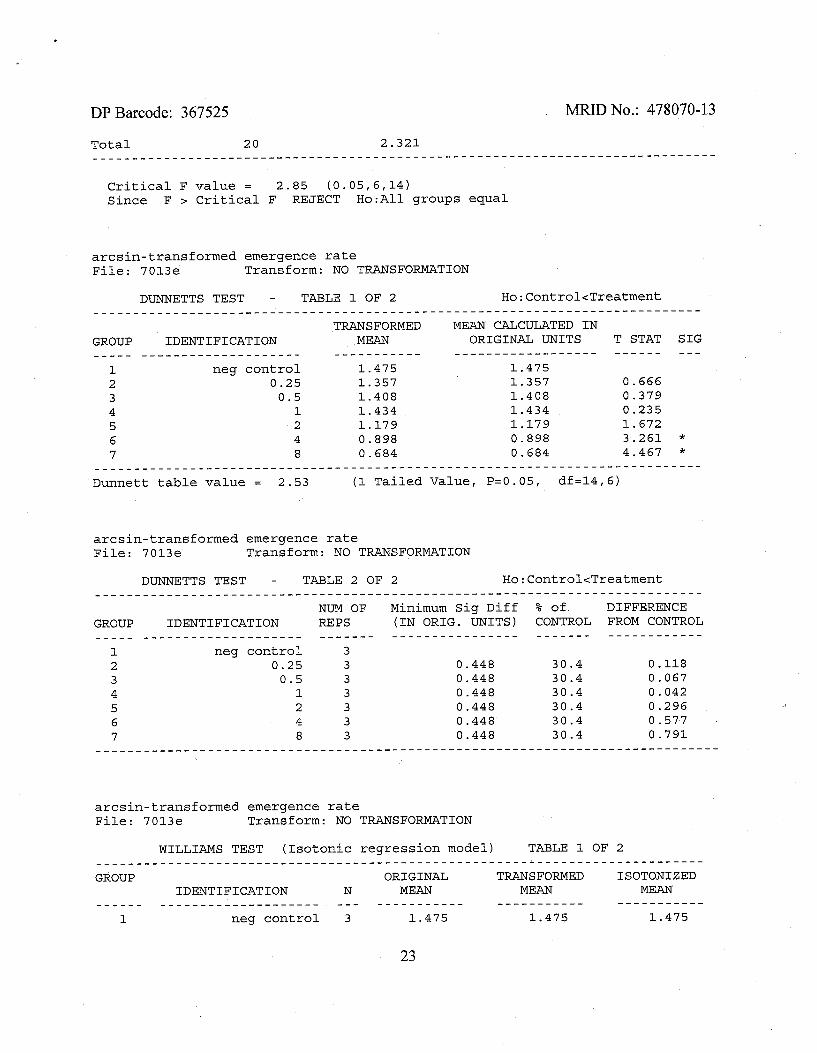
Total 2 0 2.321 _ _ _ _ _ _ _ _ _ _ _ _ _ _ _ _ _ _ _ - - - - - - - - - - - - - - - - - - - - - - - - - - - - - - - - - - - - - - - - - - - - - - - - - - + - - - - - - - -
Critical F value = 2.85 (0.05,6,14) Since F > Critical F REJECT Ho:A11 groups equal
arcsin-transformed emergence rate File: 7013e Transform: NO TRANSFORMATION
DUNNETTS TEST - TABLE 1 OF 2 Ho:Control<Treatmeht . . . . . . . . . . . . . . . . . . . . . . . . . . . . . . . . . . . . . . . . . . . . . . . . . . . . . . . . . . . . . . . . . . . . . . . . . . . .
TRANSFORMED MEAN CALCULATED IN GROUP IDENTIFICATION MEAN ORIGINAL UNITS T STAT SIG - - - - - . . . . . . . . . . . . . . . . . . . . - - - - - - - - - - - - - - - - - - - - - - - - - - - - - - - - - - - - - -
neg control 1.475 0.25 1.357 0.5 1.408
- - - - - - - - - - - - - - - - - - - - - - - - - - - - - - - - - - - - - - - - - - - - - - - - - - - - - - - - - - - - - - - - - - - - - , - - - - - - - Dunnett table value = 2.53 (1 Tailed Value, P=0.05, df =14,6)
arcsin-transformed emergence rate File: 7013e Transform: NO TRANSFORMATION
DUNNETTS TEST - TABLE 2 OF 2 Ho:Control<Treatmept . . . . . . . . . . . . . . . . . . . . . . . . . . . . . . . . . . . . . . . . . . . . . . . . . . . . . . . . . . . . . . . . . . . . . . . . . . . .
NUM OF Minimum Sig Diff % of DIFFE~RENCE GROUP IDENTIFICATION REPS (IN ORIG. UNITS) CONTROL FROM CONTROL
neg control 3 0.25 3 0.5 3 1 3 2 3 4 3 8 3
arcsin-transformed emergence rate File: 7013e Transform: NO TRANSFORMATION
WILLIAMS TEST (Isotonic regression model) TABLE 1 OF 2 . . . . . . . . . . . . . . . . . . . . . . . . . . . . . . . . . . . . . . . . . . . . . . . . . . . . . . . . . . . . . . . . . . . . . . . . . . . . GROUP ORIGINAL TRANSFORMED ISO~ONIZED
IDENTIFICATION N MEAN MEAN MEAN - - - - - - . . . . . . . . . . . . . . . . . . . . - - - - - - - - - - - - - - - - - - - - - - - - - - - - - - - - - - - -
1 neg control 3 1.475 1.475 1.475
DP Barcode: 367525 MRID No.: 478070-13
arcsin-transformed emergence rate File: 7013e Transform: NO TRANSFORMATION
WILLIAMS TEST (Isotonic regression model) TABLE 2 OF 2 . . . . . . . . . . . . . . . . . . . . . . . . . . . . . . . . . . . . . . . . . . . . . . . . . . . . . . . . . . . . . . . . . . . . . . . . . . . .
ISOTONIZED CALC. SIG TABLE DEGREES OF IDENTIFICATION MEAN WILLIAMS P=.05 WILLIAMS FREEDOM
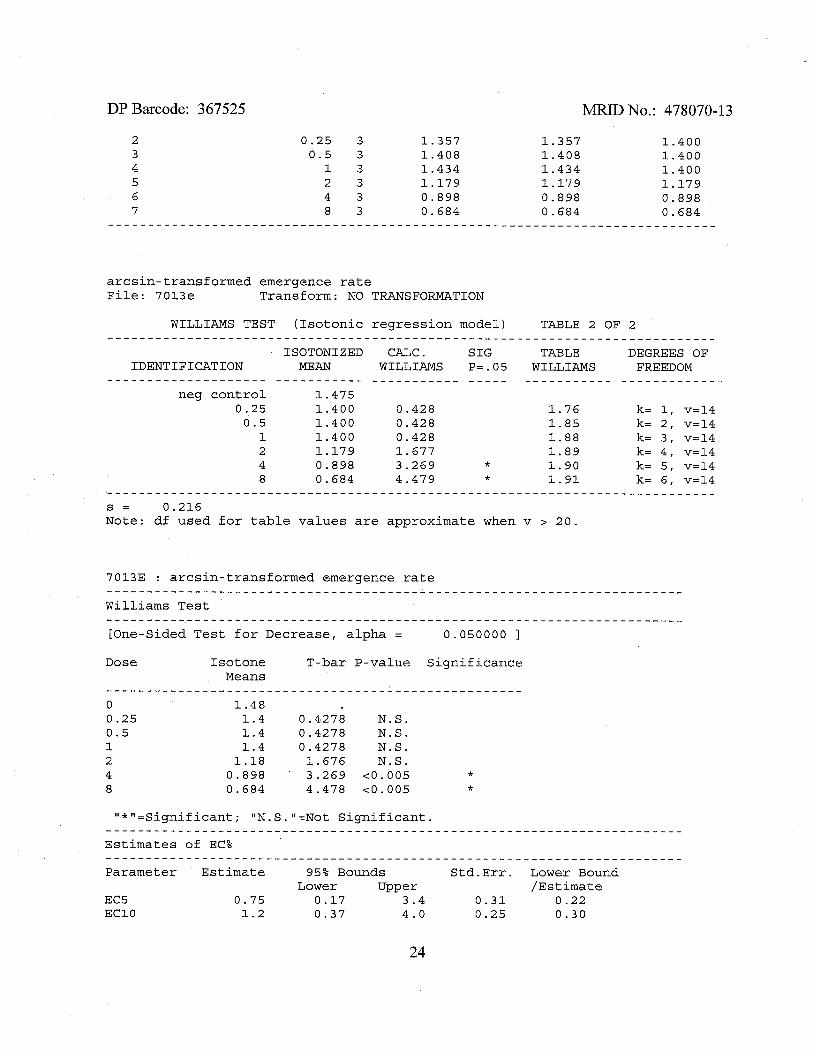
neg control 1.475 0.25 1.400 0.428 1.76 k= 1, v=14 0.5 1.400 0.428 1.85 k= 2, v=14 1 1.400 0.428 1.88 k= 3, v=14 2 1.179 1.677 1.89 k= 4, v=14 4 0.898 3.269 x 1.90 k= 5, v=14 8 0.684 4.479 * 1.91 k= 6, v=14
S = 0.216 Note: df used for table values are approximate when v s 20.
7013E : arcsin-transformed emergence rate . . . . . . . . . . . . . . . . . . . . . . . . . . . . . . . . . . . . . . . . . . . . . . . . . . . . . . . . . . . . . . . . . . . . . . . . Williams Test . . . . . . . . . . . . . . . . . . . . . . . . . . . . . . . . . . . . . . . . . . . . . . . . . . . . . . . . . . . . . . . . . . . . . . . . [One-sided Test for Decrease, alpha = 0.050000 1
Dose Isotone T-bar P-value Significance Means
1.48 1.4 0.4278 N.S. 1.4 0.4278 N.S. 1.4 0.4278 N.S. 1.18 1.676 N.S. 0.898 3.269 <0.005 x
0.684 4.478 <0.005 x
u*u=Significant; "N.S."=Not Significant . . . . . . . . . . . . . . . . . . . . . . . . . . . . . . . . . . . . . . . . . . . . . . . . . . . . . . . . . . . . . . . . . . . . . . . . Estimates of EC%
Parameter Estimate 95% Bounds Std-Err. Lower Bound Lower Upper /Estimate
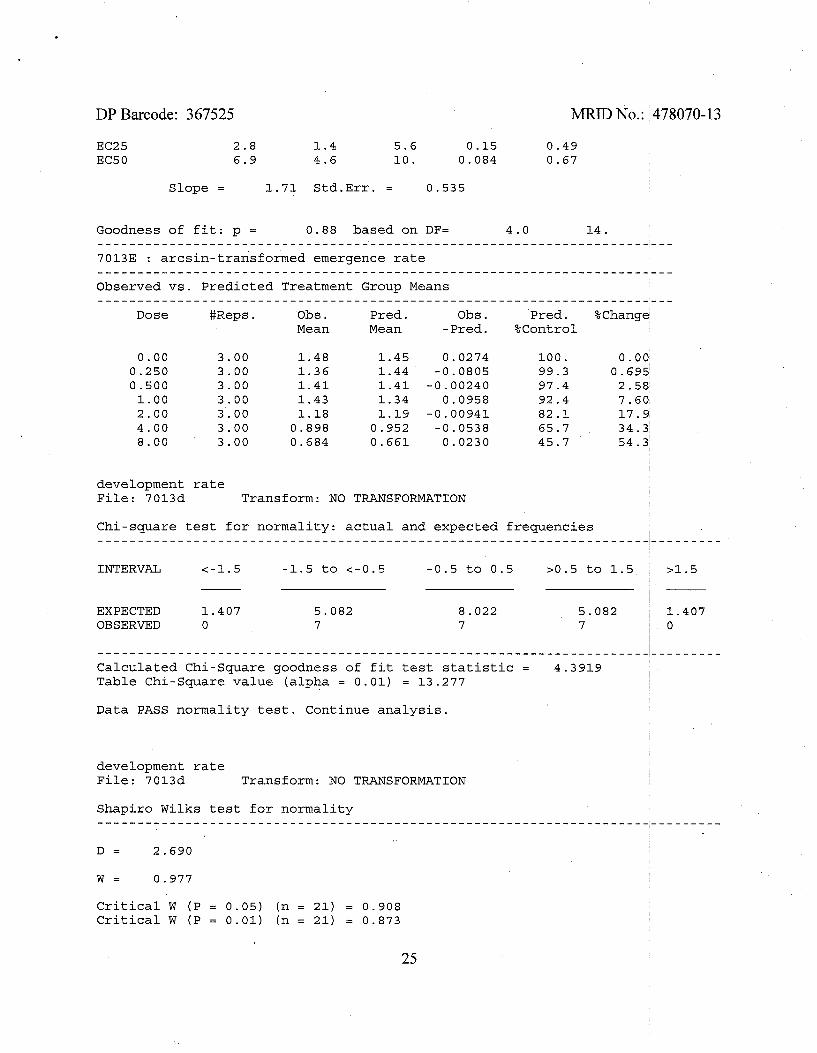
EC5 0.75 0.17 3 -4 0.31 0.22 EClO 1.2 0.37 4.0 0.25 0.30
DP Barcode: 367525 MRID No.: 478070-13
Slope = 1.71 Std.Err. = 0.535
Goodness of fit: p = 0.88 based on DF= 4.0 14. . . . . . . . . . . . . . . . . . . . . . . . . . . . . . . . . . . . . . . . . . . . . . . . . . . . . . . . . . . . . . . . . . . . . . . . . 7013E : arcsin-transformed emergence rate . . . . . . . . . . . . . . . . . . . . . . . . . . . . . . . . . . . . . . . . . . . . . . . . . . . . . . . . . . . . . . . . . . . . . . . . Observed vs. Predicted Treatment Group Means . . . . . . . . . . . . . . . . . . . . . . . . . . . . . . . . . . . . . . . . . . . . . . . . . . . . . . . . . . . . . . . . . . . . . . . .
Dose #Reps. Obs . Pred . Obs . Pred . %Change Mean Mean - Pred . %Control
development rate File: 7013d Transform: NO TRANSFORMATION
Chi-square test for normality: actual and expected frequencies - - - - - - - - - - - - - - - - - - - - - - - - - - - - - - - - - - - - - - - - - - - - - - - - - - - - - - - - - - - - - - - - - - - - - , - - - - - - - - -
INTERVAL <-1.5 -1.5 to <-0.5 -0.5 to 0.5 20.5 to 1.5 >I. 5
EXPECTED 1.407 5.082 OBSERVED 0 7
Calculated Chi-Square goodness of fit test statistic = 4.3919 Table Chi-Square value (alpha = 0.01) = 13.277
Data PASS normality test. Continue analysis.
development rate File: 7013d Transform: NO TRANSFORMATION
Shapiro Wilks test for normality . . . . . . . . . . . . . . . . . . . . . . . . . . . . . . . . . . . . . . . . . . . . . . . . . . . . . . . . . . . . . . . . . . . . . . . . . . . . . .
D = 2.690
Critical W (P = 0.05) (n = 21) = 0.908 Critical W (P = 0 -01) (n = 21) = 0.873
DP Barcode: 367525 MRID No.: 478070-13
. . . . . . . . . . . . . . . . . . . . . . . . . . . . . . . . . . . . . . . . . . . . . . . . . . . . . . . . . . . . . . . . . . . . . . . . . . . . . .
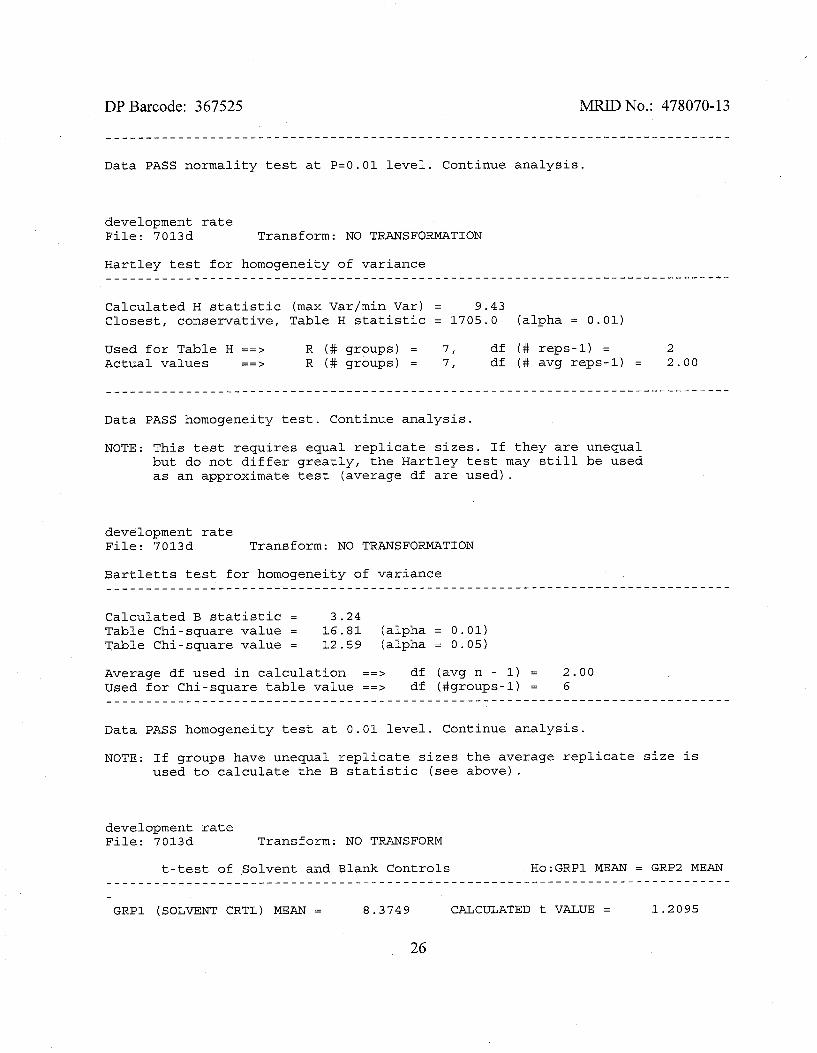
Data PASS normality test at P=0.01 level. Continue analysis.
development rate File: 7013d Transform: NO TRANSFORMATION
Hartley test for homogeneity of variance . . . . . . . . . . . . . . . . . . . . . . . . . . . . . . . . . . . . . . . . . . . . . . . . . . . . . . . . . . . . . . . . . . . . . . . . . . . . . .
Calculated H statistic (max ~ar/min Var) = 9.43 Closest, conservative, Table H statistic = 1705.0 (alpha = 0.01)
Used for Table H ==> R ( # groups) = 7, df ( # reps-1) = 2 Actual values ==> R ( # groups) = 7, df ( # avg reps-1) = 2.00
Data PASS homogeneity test. Continue analysis.
NOTE: This test requires equal replicate sizes. If they are unequal but do not differ greatly, the Hartley test may still be used as an approximate test (average df are used).
development rate File: 7013d Transform: NO TRANSFORMATION
Bartletts test for homogeneity of variance . . . . . . . . . . . . . . . . . . . . . . . . . . . . . . . . . . . . . . . . . . . . . . . . . . . . . . . . . . . . . . . . . . . . . . . . . . . . . .
Calculated B statistic = 3.24 Table Chi-square value = 16.81 (alpha = 0.01) Table Chi-square value = 12.59 (alpha = 0.05)
Average df used in calculation ==s df (avg n - 1) = 2.00 Used for Chi-square table value ==s df (#groups-1) = 6 . . . . . . . . . . . . . . . . . . . . . . . . . . . . . . . . . . . . . . . . . . . . . . . . . . . . . . . . . . . . . . . . . . . . . . . . . . . . . .
Data PASS homogeneity test at 0.01 level. Continue analysis.
NOTE: If groups have unequal replicate sizes the average replicate size is used to calculate the B statistic (see above).
development rate File: 7013d Transform: NO TRANSFORM
t-test of Solvent and Blank Controls Ho:GRPl MEAN = GRP2 MEAN . . . . . . . . . . . . . . . . . . . . . . . . . . . . . . . . . . . . . . . . . . . . . . . . . . . . . . . . . . . . . . . . . . . . . . . . . . . . . . -
GRPl (SOLVENT CRTL) MEAN = 8.3749 CALCULATED t VALUE = 1.2095
DP Barcode: 367525 MRID No.: 478070-13
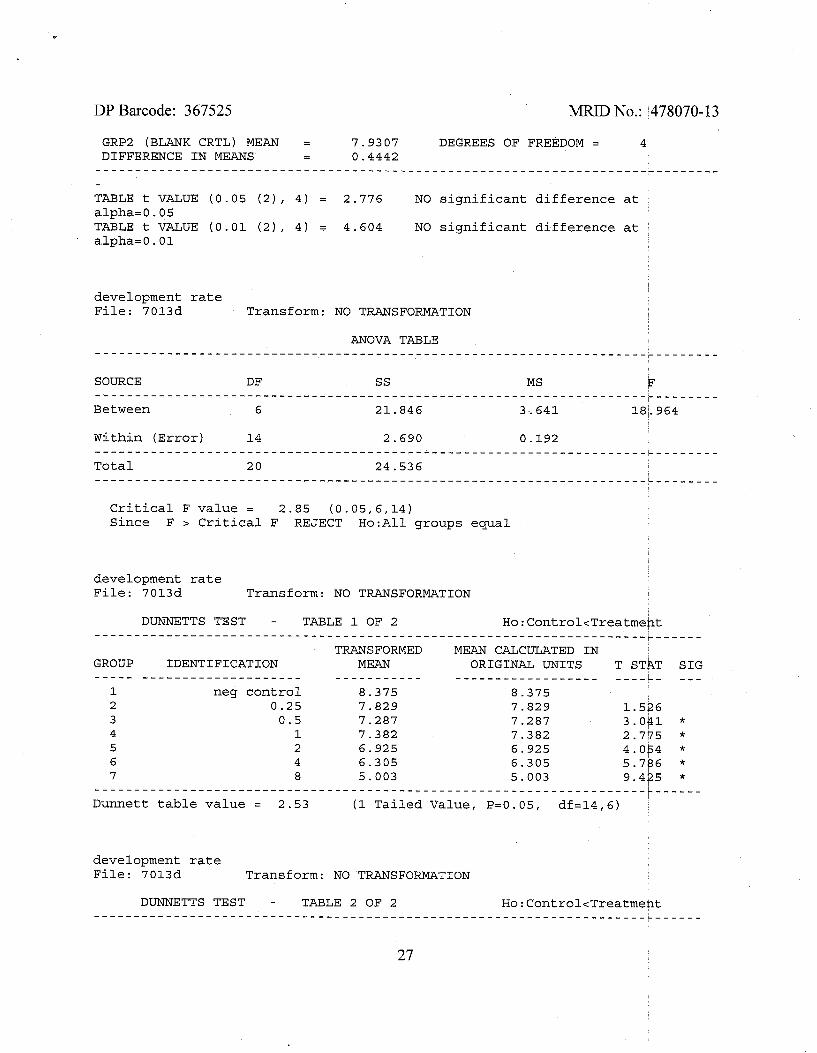
GRP2 (BLANK CRTL) MEAN = 7.9307 DEGREES OF FREEDOM = 4 DIFFERENCE IN MEANS - - 0.4442
. . . . . . . . . . . . . . . . . . . . . . . . . . . . . . . . . . . . . . . . . . . . . . . . . . . . . . . . . . . . . . . . . . . . . . . . . . . . . .
TABLE t VALUE (0.05 (2), 4) = 2.776 NO significant difference at alpha=0.05 TABLE t VALUE (0.01 (21, 4) = 4.604 NO significant difference at alpha=0.01
development rate File: 7013d Transform: NO TRANSFORMATION
ANOVA TABLE . . . . . . . . . . . . . . . . . . . . . . . . . . . . . . . . . . . . . . . . . . . . . . . . . . . . . . . . . . . . . . . . . . . . . . . . . . . . . .
SOURCE DF S S MS F . . . . . . . . . . . . . . . . . . . . . . . . . . . . . . . . . . . . . . . . . . . . . . . . . . . . . . . . . . . . . . . . . . . . .
I- - - - - - - - - Between 6 21.846 3.641 181.964
Within (Error) 14 2.690 0.192 . . . . . . . . . . . . . . . . . . . . . . . . . . . . . . . . . . . . . . . . . . . . . . . . . . . . . . . . . . . . . . . . . . . . . . . . . . . . . . Total 2 0 24.536 . . . . . . . . . . . . . . . . . . . . . . . . . . . . . . . . . . . . . . . . . . . . . . . . . . . . . . . . . . . . . . . . . . . . . . . . . . . . . .
Critical F value = 2.85, (0.05,6,14) Since F > Critical F REJECT Ho:A11 groups equal
development rate File: 7013d Transform: NO TRANSFORMATION
DUNNETTS TEST - TABLE 1 OF 2 Ho : ~ontrol<~reatmebt
TRANSFORMED MEAN CALCULATED IN GROUP IDENTIFICATION MEAN ORIGINAL UNITS T STAT SIG
1 neg control 8.375 2 0.25 7.829 3 0.5 7.287 4 1 7.382 5 2 6.925 6 4 6.305 7 8 5.003
. . . . . . . . . . . . . . . . . . . . . . . . . . . . . . . . . . . . . . . . . . Dunnett table value = 2.53 (1 Tailed Value, P=0.05, df=14,6)
development rate File: 7013d Transform: NO TRANSFORMATION
DUNNETTS TEST - TABLE 2 OF 2 Ho:ControlcTreatment - _ _ _ _ _ - - - - - - - - - - - - - - - - - - - - - - - - - - - - - - - - - - - - - - - - - - - - - - - - - - - - - - - - - - - - - - - L - - - - - -
DP Barcode: 367525 MRID No.: 478070-13
NUM OF Minimum Sig Diff % of DIFFERENCE GROUP IDENTIFICATION REPS (IN ORIG. UNITS) CONTROL FROM CONTROL
. . . . . . . . . . . . . . . . . . . . neg control
0.25 0.5 1 2 4 8
. . . . . . . . . . . . . . . . . . . .
development rate File: 7013d Transform: NO TRANSFORMATION
WILLIAMS TEST (Isotonic regression model) TABLE 1 OF 2
GROUP ORIGINAL TRANSFORMED ISOTONIZED IDENTIFICATION N MEAN MEAN MEAN
control 0.25 0.5
development rate File: 7013d Transform: NO TRANSFORMATION
WILLIAMS TEST (Isotonic regression model) TABLE 2 OF 2 . . . . . . . . . . . . . . . . . . . . . . . . . . . . . . . . . . . . . . . . . . . . . . . . . . . . . . . . . . . . . . . . . . . . . . . . . . . .
ISOTONIZED CALC. S IG TABLE DEGREES OF IDENTIFICATION MEAN WILLIAMS P= .05 WILLIAMS FREEDOM
neg control 8.375 0.25 7.829 1.525 1.76 k= 1, v=14 0.5 7.335 2.907 * 1.85 k= 2, v=14 1 7.335 2.907 x 1.88 k= 3, v=14 2 6.925 4.052 x 1.89 k= 4, v=14 4 6.305 5.784 x 1.90 k= 5, v=14 8 5.003 9.422 * 1.91 k= 6, v=14
s = 0.438 Note: df used for table values are approximate when v > 20
DP Barcode: 367525 MRID No.: 478070-1 3
APPENDIX 11: COPY OF REVIEWER'S TWA CALCULATIONS (USING EXCEL):
OVERLYING WATER I
Nominal Conc. mg ai1L Time (Day)
SEDIMENT
Measured Conc. (mg ai1L) Biological Vessels
Measured Conc. (mg Nominal Conc. ailvessel)
mg ai/L Time (Day) Surrogate Vessels
TWA (mg ai1L)
TWA (mg ailvess~l)
When necessary, half of the LOD was used for calculation purposes.
DP Barcode: 367525 MRID No.: 478070-13
APPENDIX 111: COPY OF REVIEWER'S MEAN EMERGENCE RATE AND DEVELOPMENT RATE CALCULATIONS (USING EXCEL):
MEAN EMERGENCE RATE
Nominal Conc. ARCsin-transformed emergence rate mg/L Rep. 1 Rep. 2 Rep. 3 Mean
Neg. control Sol. Control
0.25 0.5
1 2 4 8
MEAN DEVELOPMENT RATE
Nominal Conc. mg/L Rep. 1 Rep. 2 Rep. 3 Mean
Neg. control Sol. Control
0.25 0.5
1 2 4 8