Embed Size (px)
Citation preview
������������
����������� ���� ������� ��������� ��������������� �
��������������
��
��
��
��
��
�
��
��
��
��
�
���������������
��� ������� ��� �����
�������� ��� ��� �����
�� �����
�����������
The World Distribution of Income
and Income Inequality
Almas Heshmati MTT Economic Research
and IZA Bonn
Discussion Paper No. 1267 August 2004
IZA
P.O. Box 7240 53072 Bonn
Germany
Phone: +49-228-3894-0 Fax: +49-228-3894-180
Email: [email protected]
Any opinions expressed here are those of the author(s) and not those of the institute. Research disseminated by IZA may include views on policy, but the institute itself takes no institutional policy positions. The Institute for the Study of Labor (IZA) in Bonn is a local and virtual international research center and a place of communication between science, politics and business. IZA is an independent nonprofit company supported by Deutsche Post World Net. The center is associated with the University of Bonn and offers a stimulating research environment through its research networks, research support, and visitors and doctoral programs. IZA engages in (i) original and internationally competitive research in all fields of labor economics, (ii) development of policy concepts, and (iii) dissemination of research results and concepts to the interested public. IZA Discussion Papers often represent preliminary work and are circulated to encourage discussion. Citation of such a paper should account for its provisional character. A revised version may be available directly from the author.
IZA Discussion Paper No. 1267 August 2004
ABSTRACT
The World Distribution of Income and Income Inequality∗
This review covers a range of measures and methods frequently employed in empirical analysis of global income inequality and global income distribution. Different determinant factors along with quantification of their impacts and empirical results from different case studies are presented. These results are further contrasted to those obtained based on the World Income Inequality Database. A number of issues crucial to the studies of global income inequality are addressed. These are the concepts, measurement and decomposition of inequality, the world distribution of income and inequality measured at different levels of aggregation: global, international and intra-national. We analyse income at each of the three levels, discuss the benefit and limitations of each approach and present empirical results found in the literature and compare it with those based on the World Income Inequality Database. Research on the world income inequality supports increased awareness of the problem, its measurement and quantification, identification of causal factors and of policy measures to affect global income inequality. JEL Classification: C10, D31, D63, I30, N30 Keywords: global income inequality, income distribution, inequality indices Almas Heshmati MTT Economic Research Luutnantintie 13 00410 Helsinki Finland Email: [email protected]
∗ An earlier version of this paper was completed while I was working at the World Institute for Development Economic Research, UNU/WIDER. I am grateful to Farideh Ramjerdi for her valuable comments and suggestions on an earlier draft of this paper.
1
1. INTRODUCTION Inequality can have many dimensions. Economists are concerned specifically with the monetarily measurable dimension related to individual or household incomes. However, this is just one perspective and inequality can be linked to inequality in skills, education, opportunities, happiness, health, life expectancy, welfare, assets and social mobility.1 Here income inequality refers to the inequality of the distribution of individuals, household or some per capita measure of income. Lorenz Curve is a standard approach used for analysing the size distribution of income and measures of inequality and poverty. It plots the cumulative share of total income against the cumulative proportion of income receiving units. The divergence of a Lorenz curve for a given income distribution to Lorenz curve for perfect equality is measured by some index of inequality. The most widely used index of inequality is the Gini coefficient. Among the other measures of inequality are: the range, the variance, the squared coefficient of variation, the variance of log incomes, the absolute and relative mean deviations, and Theil’s two inequality indices. There are three basic properties that one would expect that the above indices to satisfy: mean or scale independence, population size independence and the Pigou-Dalton condition. The Gini coefficient, the squared coefficient of variation and the two Theil’s measures satisfy each of the three properties (see Anand 1997). For reviews of inequality see Subramanian (1997), Cowell (2000) and Heshmati (2004a).
The literature on economic inequality is growing as a result of increasing interest in measuring and understanding the level, causes and development of income inequality and poverty. In 1990s there was a shift in research previously focused on economic growth, identification of the determinants of economic growth and convergence in per capita incomes across countries to analysis of distribution of income, its development over time and identification of factors determining the distribution of income and poverty reductions.2 This shift is among others a reflection of changes in technology and increased awareness of the growing disparity and importance of redistribution and poverty reductions. The growing disparity calls for analysis of various aspects of income inequality and poverty including their measurement, decomposition, causal factors, inequality reduction, poverty elimination and redistribution policies.
The extensive literature emerging in recent years has focused on the study of how the distribution of incomes across countries and globally has developed over time. Two empirical regularities identified in the distribution of income are the tendency for income per capita to converge, and an increase in inequality in the distribution of personal income in many countries. The increased interest in studies of income inequality may be both cause and effect of the availability of income distribution data. 1 Heshmati (2004a) reviews the recent advances in the measurement of inequality and gives attention to the interrelationship between income and non-income dimensions of inequality. 2 For a selection of studies of growth and convergence in per capita incomes see: Barro (1991), Barro and Sala-i-Martin (1995), Islam (1995), Mankiew, Romer and Weil (1992), and Quah (1996). Quah (2002), Ravallion (2003), Sala-i-Martin (2002a) analysed convergence in income inequality, while Acemoglu and Ventura (2002), Atkinson (1997), Bourguignon and Morrisson (2002), Gottschalk and Smeeding (1997) and Milanovic (2002a) focus on the distribution of income. Acemoglu (2002), Caminada and Goudswaard (2001), Cornia and Kiiski (2001), Gotthschalk and Smeeding (2000), Milanovic (2002a), O’Rourke (2001), Park (2001), Sala-i-Martin (2002b) and Schultz (1998) studied trends in income inequality.
2
Availability of household surveys has been improved and several standardized databases have been created. These allow analysis of income distribution at the most disaggregate individual or per capita household levels. Income distribution is otherwise often analyzed at three levels of aggregation, namely global, international and intra-national3. It can also be measured at the continental and sub-continental levels where one examines inequality both between and within economic or geographic regions. There is evidence that poverty and inequality has developed differently between and within regions. The regional inequality is beyond the scope of this paper. This issue is reviewed in Heshmati (2004b).
There are two empirical regularities in the distribution of income: the tendency for income per capita to converge (decrease in inequality), and the increase in inequality in the distribution of personal income in many countries (Schultz 1998). Inequality increased in Western countries in the 1980s and in transition countries in the 1990s. The reasons for increased interest in income inequality are the theoretical development and the availability of income distribution data (Milanovic 2002a). The theoretical reasons are the better incorporation of inequality in economic theory, the growth–inequality relationship and the link between inequality and political economy. Availability of household surveys has improved in the former Soviet Union, Eastern Europe and Africa. Several standardized databases have been created, often based on experiences gained from the Luxembourg Income Study (LIS), and now include the Household Expenditure and Income Data for Transition Economies (HEIDE), Africa Poverty Monitoring (APM), and the World Bank’s Living Standards Measurement Study Household Surveys (LSMS). In several studies based on these databases inequality and poverty are related to a number of determinant factors. Due to the availability of data, the empirical results are mainly based on the second half of the twentieth century. We aim to cover a range of measures and methods frequently employed in empirical analysis of global income inequality and income distribution. Different determinant factors along with quantification of their impacts together with empirical results from different case studies are presented. These results are further contrasted to those obtained based on the World Income Inequality Database (WIID) covering almost the same period and group of countries.
This review addresses a number of issues crucial to the studies of global income inequality. These are the concepts, measurement and decomposition of inequality, the world distribution of income and inequality measured at different levels of aggregation: global, international and intra-national. In this paper we analyse income at each of the three levels, and discuss the benefit and limitations of each approach and present empirical results found in the literature and those based on the World Income Inequality Database (WIID). Research on the world income inequality contributes to the increased awareness of the problem, its measurement and quantification, identification of causal factors and of policy measures to affect global inequality.
3 Global or world income inequality refers to inequality differences between all individuals in the world Milanovic 2002a; Schultz 1998; Quah 1999; Bourguignon and Morrisson 2002; Sala-i-Martin 2002a), while international income inequality refers to the economic disparity between countries (Acemoglu 2002; Cornia and Kiiski 2001; Gothscalk and Smeeding 1997; and Milanovic 2001). At the intra-national level inequality refers to the distribution of income among people within individual countries (Cameron 2000; Cowell, Ferreira and Lichtfield 1998; Gustafsson and Shi 2002; Liebbrandt, Woolard and Woolard 2000).
3
Rest of the paper is organised as follows. In section 2 we review alternative approaches examining the distribution of income among representative world individuals and present some critiques on the approaches used. Section 3 is on the international level where the focus is on between country inequality, its convergence and factors affecting the level and its development over time. The findings of trend are compared with those based on WIID database. In section 4 the intra-national inequality is reviewed. Section 5 explores the factors affecting the shape of the world distribution of income. The factors include trade, education, growth, redistribution policies and globalisation. Section 6 is on the redistribution of the world income. The final section summarises.
2. DISTRIBUTION OF INCOME AMONG THE WORLD INDIVIDUALS An analysis of the dynamics of distribution of income across people worldwide would ideally be based on data on individual incomes accruing over time. One could then estimate the entire income distribution across individuals and characterize its dynamics through time. Such data representative of populations, consistent over time and across countries is not available and is very unlikely to be produced globally anytime soon. A similar data but at smaller scale for the OECD and transition countries, the LIS and the HEIDE, is available. There are however major differences in for instance defining various income components pre- and post-taxes and transfers by countries and over time.
Despite the above problems, the LIS could serve as an example in the creation of a World Income Study (WIS) database. Ideally this database would allow testing alternative distributional hypotheses, a variety of concepts and measurements and to uncover different characteristics of income inequality.
In the absence of a WIS database or other appropriate databases, several researchers have attempted to develop alternative empirical frameworks based on aggregative statistics of the underlying data to serve in different ways as a substitute in the analysis of global income distribution and income inequality. A brief description of these data sets together with the outcomes is given below and in Heshmati (2004c).
Alternative approaches to the analysis of the world distribution of income There are a number of ways to estimate income distribution and global income inequality and to construct world indices of income distribution. One procedure is to use national household income (or expenditure) surveys collected mainly since the mid 1980s providing direct income information by quintiles and deciles for individual countries to construct world income distributions over time (Milanovic 2002a). A short AND UNBALANCED time period is among the limitations of this approach.
A second approach is to use the mean income or GDP per capita for individual countries complemented by Gini coefficient or standard deviation as the measures of income dispersion within the country and make an assumption of log-normality to construct income distribution for individual countries (Schultz 1998 and Quah 1999).
A third approximation is to use known actual income distribution of representative countries and apply it to other countries with geographical and economic similarities but with missing data (Bourguignon and Morrisson 2002). Among the limitations of this
4
approach are variations in intertemporal patterns of income distribution and changing counterfactual countries over time.
A fourth way is to use aggregate GDP data and within-country income share to assign a level of income to each person in the world to estimate income distribution and global income inequality using different indices (Berry, Bourguignon and Morrrisson 1983 and Sala-i-Martin 2002b). The second and fourth alternatives are similar in the use of per capita GDP but they differ by additional information on within-country income share used.
A fifth, and quite a simple approach, is to divide the global population into percentiles in terms of per capita income. In this approach, introduced by Park (2001), global income inequality refers to inequality among the global population. This method is similar to the second approach. Recently Dikhanov and Ward (2002) combined micro and macro approaches to reconstruct the world’s income distribution.
It is to be noted that the first alternative with direct income information at the individual (or household level) is the preferred approach. It allows analysis and comparison of inequality and distribution by subgroups, sectors, locations and household attributes across countries. Below we describe briefly each alternative to estimate the world income distribution.
Studies of the world distribution of income The world income or expenditure distribution classified based on the first approach at the individual level was derived by Milanovic (2002a)4. This study is based on household surveys from 91 countries for 1988 and 19935. Income and expenditure are adjusted for purchasing power parity (PPP) between countries. Inequality measured by the Gini coefficient increased from 0.63 in 1988 to 0.66 in 1993. The change is robust to changes in the sample of countries, PPP adjustment and inequality measure (Gini coefficient and Theil). Inequality for each of the five regions (African; Asian; Latin American; Eastern Europe and FSU; and Western Europe, North America and Oceania) is decomposed. Using a Pyatt (1976) type decomposition, the overall inequality is decomposed into within-country (W), between-country (B) and overlapping (L) components. The decomposition formula for the Gini coefficient is:
(1) ∑∑∑= >=
+−+=++=n
i
n
ijijiij
n
iiiiiii LppyypGiniLBWGini
11)(1
µπ
where iy is the mean income of country i, iGini is the Gini coefficient for country i,
iπ is the income share of the total income in the region, ip is the population share of country i and µ the mean income of the region. Results show that the increase was driven by between-country rather than within-country differences in mean income. The main reason for low within-country inequality is the low and crowded per capita mean 4 This paper is methodologically similar to those by Ravallion, Datt and van der Walle (1991) and Chen, Datt and Ravallion (1994). These are also based on household surveys, but limited to developing countries and focus on changes in world poverty, not on inequality. 5 In addition to the common sample (91), a number of countries are observed only in 1988 (10) and only in 1993 (28), or not included in either year (61). The common sample is extended in Milanovic (2001) to 126 countries.
5
income. Results based on only two years of observation might be sensitive to different developments of business cycles in major countries or non-random (outlier) year differences. Furthermore, the uneven survey quality and differences in survey definition of income and expenditure are two potential problems. The assumption of equality of individuals within each decile, the problem of mixing income and expenditure, and the use of a single and PPP exchange rate may bias the overall inequality and its decomposition. Milanovic aims to establish the benchmark for world inequality in 1988 and 1993.
In analysing inequality in distribution of personal income in the world Schultz (1998) uses four different types of data; population estimates, PPP prices adjusted GDP per capita incomes, national estimates of the size distribution of household incomes, and intra-household gender differences in education inequality. Three indicators of income inequality are computed. The variance of logarithm of income, Gini concentration ratio, and the Theil mean log deviation are estimated based on the cumulative shares of income received by the quintile shares of the income units. The variance in the logarithms of per capita GDP in PPP prices increased in the world from 1960 to 1968 and has decreased since the mid 1970s. In the latter period the convergence in inter-country incomes offsets any increase in within-country income inequality. The variance measure is decomposed into between-country, within-country and within-household log income variance components. About two-thirds of overall inequality is due to the inter-country and one-third is from the intra-country component. The inter-household inequality and gender differences in education are the main contributors to the within-country inequality. The results are sensitive to changes in the sample size and the quality of the data underlying the inter-household component. If China is excluded from the sample the decline in world inequality after 1975 is not anymore evident.
In another study using a similar approach as Schultz (1998), Quah (1999) combines distribution dynamics for per capita incomes across countries, with personal income distributions within countries over time. The result is expected to produce a picture of the worldwide income distribution dynamics across people. Given that information on actual distributions for economies in a number of periods are available, then the worldwide income distribution is obtained using the country and the world population sizes. The results based on country data from 1980-92 show that macroeconomic factors determine cross-country patterns of growth and convergence determine world inequalities. However, the relation between a country’s growth and its within-country inequality plays a small role in global inequality dynamics. The positive effect of economic growth on individual incomes and reductions in poverty overwhelms any potential negative impacts like increases in inequality. The increase in inequality between 1980 and 1992 is entirely due to the between-country inequality and derived from macroeconomic growth, not from microeconomic changes in within-country inequalities. Some numbers on inequality and poverty changes in India and China during the period 1980-92 are presented without much detail of the method used and underlying data. The advantage here is a sequence of annual observations for individual countries. However, the manuscript is incomplete and results are far from the final.
Bourguignon and Morrisson (2002) attempt at estimating the world inequality of personal income and its evolution over time since 1820. Since data covering such a long period is sparsely available, the countries are divided into 33 groups of single and multiple countries. The groups of countries are in turn aggregated into 6 blocks defined
6
on a geographical, economic or historical basis. From the early nineteenth century to the eve of the First World War, the Gini coefficient increased from 0.50 to 0.61. After a deceleration period between the two world wars, it increased to 0.64 in 1950. It had, however, stabilized during the latter half of the twentieth century. The increase in the Gini coefficient was 30 percent between 1820 and 1992, while the Theil index increased by 60 percent in the same period. The process of strong convergence in economic growth among industrialized countries and divergence between groups of countries together with the take off of China in the beginning of the 1980s have been significant factors in determining the evolution of the world inequality.
In estimating the distribution of income among individuals rather than countries, Bourguignon and Morrisson rely on real GDP per capita, population and the distribution of income summarized by 9 decile income shares and the top two vintile shares. They use quintile shares multiplied by PPP adjusted per capita GDP to derive the world income distribution. They acknowledge the importance of taking into account for demographic weights in shaping the evolution of the world distribution of income. Hence, this paper's contribution lies in quantifying the importance of aggregate economic growth, population growth, and the structure of domestic income inequalities in explaining the evolution of the world distribution of income. Inequality is measured by the Gini coefficient, the Theil index, the mean logarithmic deviation and the standard deviation of logarithm. The limitation of such two-century studies lies however in the fact that the entire first century and the first half of the second century are based on very few observations on a few industrialized countries and is a poor representation of the world’s population or incomes. Also a country observed within a region can be a poor proxy for other countries with missing observation that are located in the same region. A third issue is the low comparability and quality of the data over time.
In addition to the income dimension, Bourguignon and Morrisson consider non-income dimensions such as life expectancy in analysing the inequality in (economic) well-being. The average life expectancy has increased from 26.5 years in 1820 to 61.1 in 1992. Differences in the economic growth, the demographic growth and changes in the domestic income distribution are factors contributing to the world income inequality. The disequalising factors are: the high economic performance of the European countries and its divergence to Anglo-Saxon, poor growth performances of the rural China and India combined with their size effects, and the slow growth of Africa post 1950s. The main equalizing factors are: income equalisation within the European countries, catching up of the European countries over the US after the Second World War and the high growth performances of the Asian Tigers and the urban China since the 1980s. The result of analysis of inequality among world citizens is summarised as follows. First, the world income inequality exploded since the early 19th century. Second, the increase is because of inequality among countries or regions rather than within countries. Third, inequality is not increasing but poverty concentration is increasing in some regions. Fourth, the international disparity in life expectancy is increasing.
According to the fourth approach Sala-i-Martin (2002a) uses aggregate GDP data and within-country income shares, although in some cases estimated income shares for the period 1970-1998 to assign a level of income to each person in the world. He then estimates the kernel density function for the worldwide distribution of income, computes poverty rates for individual countries, and finally estimates global income
7
inequality using seven different inequality indices.6 The overall inequality is decomposed into within and between-country inequality components. The results show a reduction in the global inequality between 1980 and 1998. Using the same data he estimates the poverty rates and headcounts for 125 countries (Sala-i-Martin 2002b). Assuming $1/day and $2/day poverty lines he finds that the overall poverty rates declined during the last 20 years. While it declined in Asia and in Latin America in 1980, it increased in Africa. A total of nine indices7 of income inequality were estimated. The results indicate substantial reductions in global income inequality during the 1980s and 1990s.
In a smaller regional scale Londono and Szekely (2000) expand the Deininger and Squire (1996) data to assess the changes in aggregate poverty and inequality in Latin America. Their empirical results are based on data from 13 Latin America countries observed during 1970 to 1995. Despite the differences in levels across countries, inequality and poverty in most of the countries follow similar trends. Aggregate inequality increased during the 1970s, deteriorated during the 1980s and remained around the level registered in 1990 level during the 1990s. The excess inequality (defined as the ratio of observed to expected inequality) is 25% and increasing over time. Lack of improvement in the inequality is related to the non-pro-poor distribution of growth.
Park (2001) examines trends in the global distribution of income defined as the real GDP per capita in 133 countries over the period 1960-1992 using data from the Penn World Tables. The global population is divided into percentiles in terms of per capita income and he estimates the share of global income accruing to each percentile. The income shares are then used to estimate a global Gini coefficient for the 20 and 10 percentiles of the global population. The global income inequality here refers to the inequality among the nations of the world rather than the individuals of the world. It accounts for the population size of countries but neglect PPP. The key restrictive assumption is that all individuals of a country earn the same level of income and that all countries constitute a single world economy. Results show that while the global distribution of income has not been more equal during the period of study as a whole, it has been declined during 1976-92.
Recently Dikhanov and Ward (2002) in an attempt to reconstruct the complex nature of the global income distribution during the later part of the twentieth century employed an intermediate aggregation approach labelled as quasi-exact interpolation technique. A combined micro (survey) and macro (national accounts) approach along with PPP is used to reconstruct the World’s income distribution. The technique allows for analysis of the global income distribution taking into consideration both within and between-country inequalities, and thus measuring inequality between representative average individuals. In analysing the structure of global distribution and its regional composition and distributional changes over time a small sample of 45 countries for the selected
6 The indices include: the Gini coefficient, the variance of log-income, two Atkinson’s indexes, the mean logarithmic deviation, the Theil index and the squared coefficient of variation. 7 In addition to the seven indices of income inequality listed in the previous footnote, the ratio of the average income of top 20 per cent of the distribution to the bottom 20 per cent, and the ratio of income of the persons located at the bottom of the top quintile divided by the income of the persons located at the top of the bottom quintile are estimated.
8
periods 1970, 1980, 1990 and 1999 is used. The results show that the partial global distribution has twin peaks: one concentrating around China, India and Africa, and another around the OECD indicating absent of a middle class among the citizens of the world.
Some critiques on the above approaches Results based on a few yearly observations are likely sensitive to the changing economic situation of countries. The uneven survey quality, the differences in the survey’s definitions of income and expenditure, the assumption of equality of individuals within each decile, the problem of mixing of income and expenditure, and the use of a single PPP exchange rate affect the quality of analysis. However, these studies might serve to establish the benchmark for world inequality.
Bourguignon and Morrisson (2002) find the treatment of world inequality in international studies, like many of those mentioned above, in general oversimplifying because all citizens in a country (or population shares) are considered as perfectly identical. As a consequence, the extent of inequality is underestimated by ignoring income disparity and the evolution of the distribution of income within countries (and income shares). The inference here is on international rather than world inequality biasing the view about the temporal patterns of world inequality. In the authors own approach the deciles represent individuals, i.e. instead of one representative individual ten representative individuals represent the country. The within decile variations are not accounted for.
The results in Dikhanov and Ward (2002) showed that the partial global distribution has twin-peaks indicating absent of a middle class among the citizens of the world. Regardless of the partition level Milanovic and Yotzhaki (2001) using the national income/expenditure distribution data from 119 countries find the world lack middle class. A similar twin-peaks was also observed earlier by Quah (1996). Sala-i-Martin (2002b) using income shares from 97 countries from 1970 to 1998 show that by 1998 the twin-peaks vanished giving rise to a large middle class when one instead of the aggregate country data uses the individual income data. Over the 39 years period the acute absolute poverty declined while under the broader definition of poverty, the number of poor increased, and the global inequality has increased.
A limitation of Dikhanov and Ward (2002) study compared with Milanovic (2002a) is the small sample size. Very little information about the micro-level data, its coverage, consistency and the interpolation technique used is given. Capeau and Decoster (2003) explain the driving forces behind the differences in the two extreme positions on whether inequality fell (Sala-i-Martin 2002a and 2002b) or rose (Milanovic 2002a and 2002b). They relate the diverging tendencies among others to three key factors including: GDP per capita versus budget survey income measures used, the population weighted inequality measures and the inequality among citizens irrespective of location.
Summary of the world individuals’ income inequality
There are a limited number of ways to construct world indices of income distribution and to measure global income inequality reflecting both inequalities between countries and within countries. For a summary of several studies of global inequality see Table 4. A combined micro and macro approach is often used. These studies differ largely by the extent and variations in the quality of the micro data part. Mean income per capita
9
complemented with Gini coefficient, the standard deviation as measure of income dispersion, or the direct information from household surveys by quintiles and deciles for individual countries and the demographic information is the standard data requirement to construct world income distribution. Empirical results show that the world inequality measured as Gini coefficient increased from 0.50 in 1920 to 0.66 in 1992. Poverty measured as headcount (percent) during the same period decreased from 94.4 to 51.3. The inequality based on shorter period but with a better quality of data increased from 0.625 in 1988 to 0.659 in 1993.
Economic growth, population growth, life expectancy, and changes in the structure of income inequality are important factors in determining the evolution of the world income distribution. Empirical results show also evidence of disparity in the development of life expectancy and economic growth. The inequality within individual countries is not increasing but the inequality between countries and regions is increasing and as well the poverty concentration is increasing in some regions. A limitation of these studies is the short time period and the lack of income surveys with a satisfactory country population and a continuous time period coverage. Results are often based on a few observations and sensitive to various data and the estimation method. Despite their limitations these studies can serve to establish benchmark for the world income inequality and poverty.
3. INTER-NATIONAL DISTRIBUTION OF INCOME The inter-national inequality refers to the distribution of income between countries. The common approach is to use the mean income or GDP per capita for individual countries complemented by the Gini coefficient or the standard deviation as measures of income dispersion within the country and within-country income shares to construct income distribution for individual countries. In the following a brief review of the literature is presented and results are compared with those obtained from the WIID data.
Between-country disparities As previously shown there is a comprehensive literature on the measurement of inter-national inequality focusing on disparity between nations and its relation with economic growth. Sala-i-Martin (2002a) uses aggregate GDP data and within-country income shares to estimates the worldwide distribution of income, computes poverty rates and estimates the global income inequality for the period 1970-1998. The poverty rates of $1/day and $2/day have fallen during the period of study from 20 to 5 percent and from 44 to 18 percent, respectively. The poverty reduction corresponds to 300 to 500 millions people in 1998. Inequality is decomposed into within and between-country inequality components. In contrast to several studies reviewed previously, the results show also a reduction in the global inequality between 1980 and 1998. Most global disparities are of cross-country rather than within country character. The main source of between-country reductions is due to the growth in the Chinese economy. The within-country inequality has slightly increased. The lack of growth in the African economies might cause further divergence and increase in the global inequality.
Unlike in Sala-i-Martin the results by Maddison (2001) show evidence of rising disparities in the world economy due to the divergence in economic performance across regions and countries over time. Bourguignon and Morrisson (1999) study showed that
10
the increase in total inequality during the entire period of 1820-1990 is driven by a rise in inequality between countries. The inequality between countries is one dominating factor in the evolution of the world income inequality. Milanovic (2002a) in a comparison of income in 1988 and 1993 show that between 75-88 per cent of inequality is attributed to differences in the mean income between countries and only 12-25 per cent is explained by the inequality within countries. As mentioned previously, Capeau and Decoster (2003) explain the driving forces behind the differences in the two extreme positions on whether inequality fell or rose. They relate the diverging tendencies to income measures, the use of weights and the assumption of inequality among citizens irrespective of the location.
Stability and convergence of income inequality Li, Squire and Zou (1998) explore the issues of the relative stability of income inequality within countries over time and the significant variability among countries. The results suggest that inequality is largely determined by factors that change slowly within countries but are quite different across countries. The Gini coefficients are clearly different across countries and there is no evidence of a time trend in 65 per cent of the unbalanced panel of 49 countries used. The stability in the intertemporal variation in inequality is associated with political economy arguments (civil liberties and the initial level of secondary schooling), while the international variation predicted to be determined by the capital market imperfection (financial dept and the initial distribution of land). The regression analysis of the variance of the Gini coefficient shows that after an adjustment for the differences in income definitions more than 92 per cent of the total variation is explained by country-specific effect.
Jones (1997) in characterising the evolution of the world income distribution uses three different techniques. First, he uses a standard growth model and given 1980’s conditions, to project the current dynamics of the income distribution forward. Results indicate small changes in the top of the income distribution. Second, following the insights from the cross-country growth literature, he interprets the variation in growth rates around the world as reflecting how far countries are from their steady state positions and predicts where countries are headed. Third, Jones considers how steady states are themselves changing over time. The increasing relative frequency of growth miracles indicates that the fraction of poor countries is falling and he projects that the long-run world income distribution involves substantial improvements in the incomes of many countries. Using a similar approach as in the frontier literature the changes in the income distribution or distances to the steady state could easily be disaggregated into changes in the distribution of income over time and changes in the steady state to estimate the country-specific catch up rates.
There are several studies on the convergence in income inequality. It is applicable for instance to studies of convergence in inequality among countries within an integrated economic region or members of an economic union. The concept of convergence in income inequality (Benabou 1996) follows that of the conditional convergence of per capita incomes (e.g. Mankiew, Romer and Weil 1992). Iacoviello (1998) using LIS data investigated whether inequality converges to a steady state level of inequality during the process of income growth. Results showed that shocks to income yield short-run effects on the income distribution. A reversal link from inequality to income was not observed. Acemoglu and Robinson (2000) in their analysis of the development and dispersion of
11
the world income distribution show that the increased openness to international trade and specialisation leads to a stable world income distribution.
Factors affecting inter-national income inequality Several factors have been identified and attempts have been made to quantify their impacts on the inter-national income inequality. In the following we review a number of recent studies investigating the inequality effects of population weights on the Gini coefficient, the regional cost of living, openness, technology spillovers, specialization in production, economic growth, initial condition, skill-biased technology and wages, supply and demand of human capital and redistributive policies.
Inter-national distribution of income based on the Gini coefficients of national per capita GDP for the period 1950 to 1998 and 120 countries computed by Milanovic (2001). The temporal patterns of inequality differ by whether the Gini coefficient is weighted by population or not. The unweighted Gini coefficient shows a declining inequality between 1965 and 1978 and an increasing trend in inter-national inequality after 1978. The increased inequality in Latin America, the jump in the inequality in Eastern Europe and the former USSR and the low performance of the African countries has contributed to the increased unweighted global inequality. The picture differs if the Gini coefficients are computed by weighting the GDP per capita by regional population shares. The weighted results show a declining world inequality due to the faster growth in the Indian and Chinese economies than the world economy. However, the rapid economic growth has increased the within country inequality in both countries. The increases in inequality are found to be sensitive when market-based valuation methods are used and allowances are made for the regional cost-of-living differences (Ravallion and Chen (1999), and Ravallion and Datt (2000)).
Acemoglu and Robinson (2000) use the log of income per worker relative to the world average in 1990 against its 1960 value to analyse the development and the dispersion of the world income distribution. Despite the large differences in income across countries, the dispersion of the world income distribution has been relatively stable. They show that even in the absence of diminishing returns in production and technological spillovers, degree of openness to the international trade and the extent of specialisation lead to a stable world income distribution. However, Milanovic (2002b) using data on $PPP incomes from 90 countries around 1988 and 1993 shows that the effect of openness on a country’s income distribution depends on the country’s initial income level. Openness makes the income distribution worse before making it better.
Acemoglu (2002) reviews the faster increase in supply of skills in Europe and their labour market institutions which prevented wage inequality from increasing as the two most popular explanations for different inequality trends in the US and UK over the past decades. He identifies an additional factor to be the differences in the relative demand for skills. In Europe investment in technologies is encouraged by the states increasing the productivity of less-skilled workers, reducing skill-biased technical change in Europe than in the US. Eicher and Garcia-Penalosa (2001) argue that stock of educated workers in an economy determines both the degree of income inequality and the rate of growth. They identify parameters that are central to the supply and demand of human
12
capital8 that are crucial for inequality changes. Democratisation and political reforms through redistributive programs prevented widespread social unrest and revolution in Western societies in the nineteenth century with implications for the dynamics of growth and the fall in inequality (Acemoglu and Robinson 2000). However, the traditional public finance concern about the excess burden of the within-country redistribution cannot explain why there is so little world redistribution (Kopczuk, Slemrod and Yitzhaki 2002).
In the early 1980s a number of factors have contributed to the increased interest to changes in the distributional issues in the US in general and cross-national comparisons in particular. Gottschalk and Smeeding (1997) names three major factors: (i) studies showing the rising inequality of labour market income and their transformation into a greater inequality in the distribution of total family income, (ii) cross-national micro data became available for a variety of rich OECD countries, and (iii) the debate in the public policy arena over the fairness issue and the distributive effects of changes in government policies. In their review of the literature, they lay out a number of stylized facts and present summaries for both level and trend in earnings and income inequality. There are wide differences in inequality across countries, over time and gender. Countries with centralized wage bargaining are more equal. Wage inequality is increasing over time and the trends differ across countries. It is affected by demand for skills, returns to education and experience and institutional constraints on wages. Post-tax and transfers disposable income is more equally distributed, but inequality (has) increased over time in most countries. The increased receipt of capital income and demographic and social changes played roles in accounting for the rise in inequality in the OECD countries. Gottschalk and Smeeding search for a better structural model of income distribution and redistribution that can be applied across nations. It is concluded that an ideal model is a simultaneous model of generation of all sources of income and the formation of income sharing units.
The WIID data The data used here are obtained from the UNU-WIDER World Income Inequality Database (WIID) which is an expanded version of the Deininger and Squire (1996) database. The WIID contains information on income inequality, income shares, and a number of variables indicating the source and the quality of data for 146 countries. The countries are observed on an irregular basis mainly during the period 1950 to 1998. To avoid distortions for graphing the trend in global income inequality over time the lower part of the data at 1950 is truncated. The number of excluded observations covering 1867-1949 is only 25 or 1.5 per cent of the sample. A statistical summary of the WIID data is presented in Table 1. For a description of WIID and other databases see Heshmati (2004c).
The Gini coefficient is measured in percentage points. It is the mean of multiple observations for a country in a given year. The multiplicity of observations is due to differences in income definitions, data sources, reference units, and the population coverage. In construction of global inequality we have adjusted the Gini coefficient for population as: 8 Here changes in inequality depend on externalities in education, evolution of direct cost of education, the elasticity of substitution in production between skilled and unskilled, and the relative productivity and costs of learning by doing versus R&D.
13
(2) ∑∑==
==N
iitit
N
iittitt GinipsGinipoppopGini
11)/(
where itpop is the population of country i in period t, itps is the corresponding population share. Aggregate population in a given year )( tpop is the reference population for the global population. However, since our sample does not cover all countries in the world in every year, it should be noted that the population adjusted Gini measure based on the partial sample of countries is very sensitive to the exit and entry of countries with a large population like China and India.
To provide a better picture of the distribution of the world inequality and its development over time we report the unweighted mean, median, standard deviation and populations weighted mean Gini coefficient in Table 2 and also in Figure 1. The decile observations are transformed to quintile income shares to make the income distribution comparable across countries and over time. In Figure 2 the mean quintile income shares over time are presented. As an alternative measure of inequality the ratio of the highest to the lowest quintiles is computed (see Table 3). The annual percentage changes in the unweighted mean Gini coefficient are also calculated and shown in Table 2. The development of the latter two measures is also shown in Figure 3.
The global trend in inequality based on the WIID data Simple descriptive statistics based on the WIID database are presented in Table 1. The summary statistics of the Gini coefficient for observations with and without income share distributions are given both separately and as well as jointly. The mean Gini coefficient for observations with income shares (36.43) is lower than for those without (38.11) income shares. There is a large variation in the distribution of income among the countries and over time. The income share of the poorest 20 percent varies in the interval 0.016 and 0.157, with mean and standard deviation, 0.069 and 0.036. The income share of the richest 20 per cent is 0.441 with relatively small standard deviation, 0.082. The disparity in income shares results in a Q5/Q1 ratio with a mean of 8.175 and a standard deviation of 5.758. The range varies in the interval 2.035 and 40.812.
There is a large disparity in inequality over time (see Table 2). It is to be noted that the numbers here reflect average of multiple observations for countries in a given year. The choice of measurement and the units of observation are not accounted for here. Therefore, the data lack uniform quality criteria and contains inconsistencies in distributions, definitions, sources, levels and coverage across countries and over time.
The median value of Gini coefficient (37.74 per cent) is on the average 1.5 per cent lower than the mean value (39.02 per cent). The mean, median, standard deviation, minimum, maximum and range of unweighted and mean weighted Gini coefficient for the period 1950 to 1998 are presented in Table 2. There is a higher concentration of observations in the 1990s. Figure 1 shows that the mean and the median inequality follow the same pattern and are declining over time. The dispersion in inequality declines after 1958.
The highest mean inequality values exceeding 55 per cent is found among the African countries (Central African Republic, Gabon, Kenya, Lesotho, Sierra Leone, Swaziland and Zimbabwe) and some Latin American countries exceeding 50 per cent (Bolivia, Brazil, Chile, Colombia and Honduras). The average range between maximum and
14
minimum values observed for a country over time is 37.43 per cent and the standard deviation 10.09 per cent. A number of countries show quite large range of percentage variations, among others China, Brazil, Cuba, Guatemala, Jamaica, Morocco, Zimbabwe, Georgia, Finland, Netherlands, Spain, and UK.
In the measurement of global or regional inequality it is a common standard to weight inequality by population. The population-weighted mean Gini coefficient is much lower (35.65 per cent) than the non-weighted (39.02 per cent). The drop is caused by the inclusion of countries with large populations and relatively low inequalities. Though India and China are frequently observed, the weighing procedure is not reliable, as the flow of population is very irregular over time. The average change in the Gini coefficient is 0.50 per cent indicating a small positive trend in non-weighted inequality over time. The change in Gini coefficient varies in the interval –7.76 (1952/1953) to +6.62 (1963/1964) per cent (see Figure 3 and Table 2). The shifts in the temporal patterns of Gini coefficient over the recent 50 years show that a simple time trend is not an appropriate way of modelling global trends in income inequality.
The distribution of income measured by quintile shares shows a large variation across countries and over time. The mean income quintile shares are 0.069, 0.112, 0.157, 0.220 and 0.441 (see Table 3). The lowest quintile share shows constant pattern prior to 1990 but increasing patterns post the 1990 period. The highest 3 quintiles show on the other hand variations before 1970 but a decreasing patterns post 1970 (see Figure 2). This resulted into a stable and continuously increasing inequality change over time combined with a declining Q5/Q1 ratio (see Figure 2). The highest ratios are associated with countries involved in (domestic) conflicts like Iraq, Lebanon, Paraguay, Central African Republic, Guinea, Sierra Leone, South Africa and Georgia, while the lowest are associated with Egypt, Lao, Belarus and Luxembourg.
Considering the global trends, due to the strong influence of the highest quintile income share, the inequality is volatile prior to 1970 and more stable and increasing during the period post 1986. There is evidence of the convergence in the mean, median and population weighted means over time (see Figure 1). In sum based on the WIID data, applied measurement methods and data irregularities, there is no convincing sign of a significant increasing or decreasing global trend in income inequality over the last 50 years. It should be noted that the inequality here is based on only within-country inequality but pooled and weighted to reflect international inequality. The trend accounting for between-country inequality may be different.
Summary of inter-national income inequality
Inter-national inequality refers to economic disparity between countries of the world. Table 5 shows a summary of several studies of inter-national income inequality. Inter-national distribution of income is often based on Gini coefficient of national per capita GDP. The temporal patterns of inequality differ by whether Gini is weighted by the population or not. The results from a weighted Gini coefficient shows that world inequality has declined due to the faster growth in India and China than the world economy but at the cost of an increased within-country inequality. The long run world income distribution involves substantial improvements in the income of many countries. Divergence in economic performance across regions and economies over time raises disparity in the world economy. Lack of growth in the African economies causes divergence and increase in the global inequality. In sum the total inequality is driven by
15
a rise in inequality between countries affecting the evolution of world income inequality. Important factors affecting the convergence or divergence in the inter-national income gap are mass migration, barriers to migration, trade and capital flow Political economy arguments affect the intertemporal variations, while the capital market imperfections affect the inter-national variations.
Considering the global trends in the income inequality results based on the WIID database shows that, the inequality is volatile prior to 1970 and more stable and increasing post 1986. The overall pattern is very much similar with the patterns of the highest quintile income share. However, there is no convincing sign of a significant global trend in income inequality over the last 50 years. The inequality measure here is based on only the within-country inequality. The trend in the between-country inequality may be different. The cross-section of time-series data on inequality and income distribution using the Pyatt-type decomposition approach (Equation 1) described above could be used to decompose the overall inequality into within-country, between-country and overlapping components as was done by Milanovic (2002a).
4. INTRA-NATIONAL DISTRIBUTION OF INCOME The measurement of income distribution at the national level discussed here is based on aggregate data. A number of inter-national studies are reviewed below. Within-country or intra-national inequality based on micro household data for the reason of the limited space is not discussed in this section. For results of within-country inequality in selected large countries see Heshmati (2004d).
As shown in the previous two sub-sections most of the research analysing changes in income distribution during the post World War II period concluded that income inequality within countries tends to be stable over time, while the between-country inequality variable and deriving the level and temporal patterns of the world income inequality. This is interpreted as the lack of a strong association between growth and within-country inequality making poverty reduction through growth oriented policies more possible than redistributive policies. This view is challenged by Cornia (1999) and associates in a number of studies by referring to the declined inequality in several nations between the 1950s and 1970s and increased inequality in two-third of the countries (77) during the last twenty years. Cornia suggests that the factors explaining the rise in income inequality are related to: shifts towards skill-intensive technologies, liberalization of domestic and international markets, decline in labour share during structural adjustment, trade liberalization, rise in financial rents, privatization of state assets, distribution of industrial assets, changes in labour institutions, and changes in the tax and transfer systems.
In a related study Cornia and Court (2001) in a policy brief using the WIID inequality database report changes in within-country income inequality over time and discuss the link between poverty, inequality and growth. In addition to the traditional common factors causing inequality such as land concentration, urban bias and inequality in education, a number of new causes of inequality9 are discussed and policy measures to 9 In discussing major new causes of inequality they account for trade liberalisation, technological change, stabilisation and adjustment programmes in developing countries, financial liberalisation, privatisation and the distribution of industrial assets, changes in the labour market institutions, tax and transfer system.
16
counteract inequality are provided. De Gregorio and Lee (2002) present empirical evidence on how education is related to a country’s income distribution. The findings suggest that higher educational attainment and a more equal distribution of education makes income distribution more equal. Commander, Tolstopiateniko and Yetmove (1999) point to wealth transfers through privatization programme, change in government expenditure, growth in earnings dispersion, shift in the structure of income as the deriving forces behind the increase in inequality in Russia. Fan, Overland and Spagat (1999) propose an early implementation of restructuring the education system in Russia and simultaneously reducing inequality.
Several studies show that between-country inequality explains a bigger share of inequality. Cornia and Kiiski (2001) advocate that from a policy perspective it is more important to focus on within-country inequality because the former is path-dependent and takes several generations to modify, while in the later case policy decisions to affect inequality are taken at the national level. Lindert and Williamson (2001) find that inequality has been driven by between countries rather than within countries income differences. However, heterogeneity in the magnitude of within-country effect is due to the factors of land and labour and the participant country’s policies to exploit the benefits of globalization. During the interwar period the inequality between countries accelerated.
In sum the analysis of within-country income inequality is best studied based on representative micro household surveys. These are not discussed here. It is much easier to influence the within-country inequality by policy decisions than between-country inter-national inequality. The traditional common factors causing within-country inequality are identified in general to be land concentration, urban biased development, the ageing population and inequality in education. The last two factors are more important in developed economies context. During a transition period wealth transfers during privatization programmes, changes in government expenditure and shift in the structure of income may also increase inequality. The major new causes of inequality associated with external relations are trade and financial liberalisation, technological change, stabilisation and adjustment programmes. However, the increase in inequality following the above changes may be transitory in nature. The degree of persistency in increased inequality will to the some extent depend on how active the counties studied are in their (tax and transfer) redistributive policies.
5. FACTORS AFFECTING THE WORLD DISTRIBUTION OF INCOME The literature on the distribution of income and income inequality identifies a number of factors important for the evolutions of the world income distribution. A summary of factors affecting the shape of the world distribution of income found in the literature is given in Table 6. In this section we briefly introduce the arguments and empirical results on factors such as inheritance, wage inequality, supply of skills, labour market institutions, mobility, redistributive policies, growth, globalization, democracy, geography and institutions.
The initial inequality related to parents and family environment affects education, opportunities, welfare and success rate of individuals in their life. The study by Bowles and Gintis (2002) is one recent example where they show evidence from the contribution of environmental, genetic and wealth effects to intergenerational
17
transmission of economic position. For instance Americans parental income and wealth are strong predictors of the likely economic status of the next generation. However, in the following we focus on the factors affecting inequality at more aggregate level than individuals, household or sub-groups of population.
Trade liberalization Wage inequality has increased less in Europe than in the US and the UK for the same period (Lindert and Williamson 2001). The non-uniform increase in wage inequality among industrialised countries suggests that labour market policy matter. The ‘transatlantic consensus’ (Atkinson 1999) sees rising inequality as the product of exogenous inevitable events. Wage inequality in OECD countries or unemployment is increasing on account of technical change biased against unskilled workers or on account of the liberalization of international trade and the increased competition from the newly industrializing countries. Technology and reforms may change the size of the wage gap.
The Atkinson’s alternative approach sees inequality in part socially generated related to wage/productivity relationship and changes in the labour markets, rather than trade or technology factors. Atkinson view about rising inequality is in contrast to the widely held belief that it is an unavoidable consequence of the present revolution in information technology or the globalisation of trade and finance. Government redistributive policy measures counteract the rise in the market income inequality.
The two most popular explanations for these differential trends are that: the relative supply of skills increased faster in Europe, and that the European labour market institutions in different ways prevented inequality from increasing. In relation with the effects of trade liberalization Fischer (2001) presents a general framework for the analysis of the evolution of the personal income distribution following trade liberalization. Here wages and interest rate determine the short-run and long-run evolutions of inequality, respectively. Production factors and type of export determine the effects of liberalization on inequality.
Wood and Ridao-Cano (1999) using data from 90 countries during 1960-90 find that greater openness tends to cause divergence of secondary and tertiary enrolment rate between more-educated and less-educated (land-abundant such as sub-Saharan African) countries.
Skills and earnings
Acemoglu (2002) finds that the two traditional explanations (supply of skills and labour market institutions) to the different trends in inequality do not provide an entirely satisfactory explanation. A third explanation is that the relative demand for skilled labour increased differently across countries (see also Williamson 1996). Creation of wage compression and the encouragement of more investment in technologies increased the productivity of less-skilled workers, implying a less skilled biased technical change in Europe than in the US.
In relation with analysis of inequality, economic growth and mobility Gottschalk (1997) presents some basic facts on how the distribution of earnings and employment has shifted. In a case with multi-period earnings, the inequality in each sub-period and the mobility across sub-periods would both impact the inequality of the permanent (or average) earnings of individuals. The relation incorporating discount factor indicates
18
that individual year variances (inequality) and cross year covariances (mobility) affect the variance of the average income. There is a controversy over the explanation of these patterns. In the US there has been an increase in demand for skilled labour and the relative price of skilled labour. Declines in the less skilled labours wages have resulted in unchanged average wages but the earnings inequality has increased. The earnings inequality has however increased less due to labour market institutions and redistribution policies in the Nordic and the northern European countries than in other developed countries.
Variations in the distribution of skills and earnings among the major English-speaking countries (US, UK and Canada) and the continental European Union countries raise the possibility that the differences in the distribution of skills determine income inequality. Empirical results by Devroye and Freeman (2001) based on data from eleven advanced countries show that skill inequality explains only 7% of the cross-country inequality differences. Most part of inequality is related to the within-skill groups generated from the pay mechanism, rather than the between-skill groups.
Growth and redistributive policies Acemoglu and Ventura (2002) offer an alternative framework to the new classical growth model for analysing the world income distribution. They show that even in the absence of diminishing returns in production and technological spillovers, international trade based on specialisation leads to a stable world income distribution. Specialisation in trade reduces prices and marginal product of capital and introduces diminishing returns. Concerning the role of institutions there is evidence that countries colonised by European powers that were relatively rich in 1500 are now relatively poor. This reversal is inconsistent with the geography view that links economic development to geographic factors, but consistent with the role of institutions in economic development. European intervention created an institutional reversion by encouraging investment in poor regions. The institutional reversal accounts for reversal in relative incomes during the 19th century. Diverging societies with good institutions for their economic development took advantage of industrialisation opportunities (Acemoglu, Johnson and Robinson 2002).
Atkinson (2000) has examined the redistributive impacts of the government budget in six OECD countries10 over the period from 1980 to the mid-1990s. All countries experienced a rise in inequality of market income but differed both across countries and over time with regards to the distribution of disposable income. In reviewing the actual government policy responses by taking unemployment benefits and personal income taxation as case studies, the changes to policy parameters differed in extent and even in direction. However, no clear pattern was found in the nature of the relationship between inequality and redistribution. In a global perspective inequality reflects both elements of the within and the between-country income inequality components. The within-country components can be affected through policy interventions, but policy interventions to affect the global income inequality have proved to be a difficult task to co-ordinate (Cornia and Court 2001).
Integration and its links to economic growth, poverty reduction and increasing inequality are important issues and often addressed. Quah (2001) addresses several 10 United Kingdom, Canada, West Germany, Finland, Sweden and the United States.
19
questions in his study of economic growth and income inequality. The two main questions asked are: how quantitatively important is the causal relation and why should that relation matter? Improvements in living standard overwhelm any deterioration due to increases in inequality. Other forces through their impacts on aggregate growth will also affect the poor – independently of inequality’s effect on the economic growth. Furthermore, the uses of the Gini coefficient might not reflect the true nature of inequality. Quah (2002) shows that neither these possibilities (growth causing inequality and poor might be disadvantaged) is empirically testable for China and India. The findings indicate that only under inconceivably high increases in inequality would economic growth not benefit the poor, and the way inequality causes growth is empirically irrelevant for determining outcomes for the individual income distributions. With reference to the Dollar and Kraay (2001) evidence on the gains and losses of growth to the poor, Ravallion (2001) finds large differences between and within countries on the impacts of growth on the poor. Ravallion expresses the need for a deeper micro empirical work on growth and distributional change to identify specific policies to complement the growth-oriented policies.
Globalization Globalization through integration of economies and societies has been considered as a powerful force for economic development and poverty reduction. Although integration presents opportunities to reduce poverty, it also contains significant risk of increasing negative effects like inequality, polarisation, shifting power, cultural dominance and uniformity (Dollar and Kraay 2001, and Dollar and Collier 2001).
The period of 1870-2000 is classified into: the first wave of globalization 1870-1913, the de-globalization period of 1913-1950, the golden age of 1950-1973, and the second wave of globalization of 1973 onwards (see O’Rourke and Williamson 2000, O’Rurke 2001, and Maddison 2001). The empirical evidence shows that during the first wave of globalization the convergence in per capita income and real wages took place within the Atlantic Economies due to an increase in international trade and massive international migration. The de-globalization period is characterised as a widening disparity between the richest and the poorest regions and among the Atlantic Economies. The golden age period is characterized as a period of rapid growth, relative stability and declining inequality.
In recent years, the research on the link between globalization and the world inequality has been intense. Three main approaches are distinguished (Wade 2001b). First, the neoclassical growth theory says that national economies will converge in their average productivity levels and average incomes because of the increased mobility of capital. Second, the endogenous growth theory states that diminishing returns to capital is offset by increasing returns to technological innovation in the developed countries. It is to be noted that the neoclassical theory predicts convergence (equality) while the endogenous theory predicts less convergence or divergence (inequality). Third, the dependency approach where convergence is less likely and divergence more likely because of the differential benefits from the economic integration and trade, the restricted free market relations, and the locked developing countries to produce certain commodities.
The channels through which globalization affects the world inequality are identified by Wade (2001b) to be: commodity price equalisation, factor price convergence due to international migration and capital mobility reducing wage inequality and differentials
20
in marginal products and rates of returns of capital among countries, and the dynamic convergence in per capital income growth where the growth rate is positively related to the distance to the steady state.
During the golden age period there was a considerable convergence among Western European economies and the OECD and a decline in the GDP gap in per capita income between the poorest and the richest regions (see Solimano 2001). In his survey of trends in both international economic integration and inequality over the past 150 years, O’Rurke (2001) distinguishes between the different dimensions of globalization and the within- and the between-country inequality. The 19th century globalization had large effects on the within-county income distribution, but also heterogeneous effects on inequality across countries making rich countries more unequal. The 20th century evidence on such link is however mixed.
Mahler (2001) studies the issues of economic globalization, domestic politics and income inequality in the developed countries in a pooled regression analysis using an unbalanced panel of LIS data on 14 countries where countries are observed between 1 to 3 periods during 1981-1992. This approach is different than the dependency approach of Wade11. The results show little evidence of a systematic relationship between any of the three main modes of economic globalization (trade, foreign direct investment and financial openness) and either of the distribution of disposable income or the earnings of households. The overall conclusion is that the integration into the world economy does not systematically lead to an egalitarian distribution of income or earnings across the entire economies. The modes of globalizations are weakly and positively related to the fiscal redistribution in the countries studied. Politics continues to play a critical role in determining the distributive outcomes in the developed world. Economic globalization is compatible with a wide variety of political interactions leading to a wide range of distributive outcomes.
With reference to a number of studies like Milanovic (2002a), and Dikhanov and Ward (2002), Wade (2001a and 2001b) argues that the global distribution of income is becoming ever more unequal. The inequality is increasing faster than hitherto suspected, and that governments should respond and be more proactive. In sum the studies reviewed here indicate that globalization has been a force for the between-country convergence. The unequal distribution of industrialization has been a divergence factor. For further discussion of globalization and its inequality effects see Williamson (1996).
Democracy and institutional structure of international society are also expected to have a relationship with income inequality. In a survey of the empirical relationship between democracy and inequality Gradstein (2002) based on results from the transition economies shows that there are some indications regarding a positive relation between democracy and inequality. Hurrell (2001) considers the link between the international institutions and the global economic justice. The institutional structure of the international society has developed but continues to constitute a deformed order. Hurrell
11 The dependent variable is defined in three different ways as: (i) the 90/10 ratio of size-adjusted disposable household income, (ii) the 90/10 ratio of earnings inequality, and (iii) fiscal distribution defined as social benefit expenditures as proportion of GDP. The independent variables include: trade openness, outbound investment, financial openness, left party balance, electoral turnout, union density, wage-setting institutions, and log absolute GDP.
21
examines why the international distributive justice remains so marginal to the current practice.
Heshmati (2003 and 2004e) presents measurement of a multidimensional index of globalization. The index is composed of four main components: economic integration, personal contact, technology, and political engagements, each developing differently over time. This breakdown of the index into major components provides possibilities to identify sources of globalization and associate it with economic policy measures to bring about desirable changes in national and international policies. In a regression analysis Heshmati investigates the relationship between income inequality, poverty and globalization. Results show that the globalization index explains only 7-11 per cent of the variations in income inequality, and 9 per cent of poverty among the countries. By decomposing the aggregate globalization index into four components, results show that personal contacts and technology transfers reduce income inequality, while economic integration increases income inequality. Political engagement is found to have no significant effects on income inequality. Economic globalization component increases poverty, while personal contact reduces poverty. When controlling for regional heterogeneity, we find that the regional variable plays an important role in the explanation of a variation in income inequality and poverty turning the globalization coefficient insignificant.
Summary of factors affecting the world income distribution The non-uniform increase in wage inequality, the technical change biased against unskilled workers and the government’s redistributive policies have resulted in the heterogeneous development of inequality among the industrialized countries. In addition to the geographic factors, the institutional structure and democracy play a role in economic development and inequality. The between-country inequality dominates the within-country component. The later can easier be affected through policy interventions. Growth is found to increase income inequality. However, several studies conclude that the benefit of growth exceeds the disadvantages to the poor. More evidence based on better data is needed to make inferences on growth and the within-country distributional changes. Further studies are also needed to investigate the channels through which globalization affect the world income inequality. Finally, the multidimensional links between the determinant factors (other than inequality growth and openness) has been neglected in the previous research.
6. REDISTRIBUTION OF THE WORLD INCOME The issue of why to measure inequality is analysed by Kaplow (2002). From a public finance perspective the problems of the global redistribution has the same structure as the problem that an individual country is facing, namely the trading off the efficiency costs of a progressive tax-transfer system against the more equal distribution of the welfare it achieves. The world redistribution (cross-border transfers) is small relative to the world inequality. Kopczuk, Slemrod and Yitzhaki (2002) investigate whether these minimal transfers are optimal, what the optimal transfers are, and consider the hypothetical case of an optimal linear world income tax that maximises a border-neutral social welfare function. Using data from 118 countries a drastic reduction in the world consumption inequality, a dropping of the Gini coefficient from 0.69 to 0.25, is obtained. However, a decentralised within-country redistribution has little impact on the
22
overall world inequality. The actual foreign aid transfers from the US and the other industrialized countries to the poor countries is a reflection of either placing a much lower value on the welfare of citizens of the poorest countries or else expect that a very significant fraction of cross-border transfers is wasted.
The relative stability of income inequality within countries over time and the significant variability among countries is determined by political factors (of liberties and schooling) and the capital market imperfection (financial dept and distribution of land), respectively (Li, Squire and Zou 1998). From the previous discussion of the inter-national and the intra-national inequality we can conclude that inequality is determined by factors that change slowly within countries but are quite different across countries. An optimal combination of cross-boarder transfers and the within-country redistributive policies may simultaneously reduce substantially both within and between-country inequalities.
Cornia and Court (2001) in a policy brief using the WIID database, covering the second wave of globalization, report changes in within-country income inequality and on the link between poverty, inequality and growth. The analysis highlights five main issues. First, inequality has risen since the early-mid 1980s. Second, the traditional common factors causing inequality such as land concentration, urban bias and the inequality in education are not responsible for worsening the situation. The new causes identified are the liberal economic policy regimes and the way in which economic reform policies have been carried out. Land reform, expanding education and active regional policy are recommended as measures to reduce inequality among areas, gender and regions. Third, the persistence of inequality at high levels makes poverty reduction difficult. There is a negative relationship between inequality and the poverty alleviation elasticity of growth (see also Cornia and Kiiski 2001). Fourth, high level of inequality can depress the rate of growth, affect the stability of the global economy and have undesirable political and social impacts putting the market and globalization model at risk of a political backlash (see also Birdsall, 1998). Fifth, the developments in Canada and Taiwan show that the low inequality can be maintained at fast growth.
Economic growth has often been given priority as an anti-poverty measure, but the negative link between growth and inequality often been ignored by policymakers. Rising inequality threatens growth and poverty reduction targets calling for more distributionally favourable pro-growth policies. Policies offsetting the inequality impact of new causes is designed and incorporated in a revised development approach ‘the Post-Washington Consensus’ (Stiglitz 1998). These policies include measures to offset the impacts of new technologies and trade, macroeconomic stability, careful financial liberalisation and regulation, equitable labour market policies, and innovative tax and transfer policies. Stiglitz conclude that the international community should include distribution issues in their policy advice, avoid distributive distortions, support to reduce output volatility and increase external budgetary support.
Caminada and Goudswaard (2001) study the association between international trends in income inequality and social policy. They investigate whether changes in the overall distribution of income in OECD countries during the last two decades can be attributed to social policy measures. For most countries they find a possible relationship between changing welfare policies and changing income inequality, especially in the UK and the Netherlands. Fundamental social security reforms have made the income distribution
23
less equal. Social transfers varied enormously across 15 EU countries in 1994. Heady, Mitrakos and Tsakloglou (2001) analyse the comparative effects of these transfers on inequality using the European Community Household Panel data (ECHP). The results show increasing distributional impacts of these transfers and the share of GDP spend on them (high in Denmark and Netherlands and low in Greece and Portugal). However, the extent of means testing (high in UK), the distribution of different funds and the degree of targeting for each transfer also affects their impacts.
Locations in combination with immobility of factors are important to incidence of poverty and justify regional targeting to reduce poverty. As an example Park, Wang and Wu (2002) evaluate the effectiveness of regional targeting in the China’s large scale rural poverty alleviation investment program that begun in 1986 using a panel of all counties in China for the period 1981-1995. A number of newly targeting gaps, targeting error measures describing weighted mistargeting are defined. The evidence suggests that political constraints are likely to undermine regional targeting programs at the country level or higher. Targeting township is the preferred level of targeting. There exist tradeoffs between targeting and other social objectives deviating optimal targets from the perfect ones.
In view of the above and from a public finance perspective the global redistribution has the same structure as that of an individual country. The world redistribution in form of cross border transfers is very small and not optimal relative to the world inequality. The within country redistribution has little impact on the global inequality. Political and capital market factors determine the stability, changes and levels of inequality across countries. Land reform, expanding education and active regional policy are found to be effective economic reform policy measures to reduce inequality. At a smaller regional scale, EU, the social security reforms show evidence of the positive impacts of taxes and targeting transfers on the distribution of income and inequality within and between the EU member countries. The political constraint and the level of targeting are important to the success of the regional targeting programs to reduce poverty.
7. SUMMARY A number of ways to construct world indices of income distribution and to measure global income inequality reflecting both between and within-country inequalities were presented. Few studies compare the world’s individuals’ distribution of income. A combined micro and macro approach is often used where mean income per capita complemented with some measures of income dispersion, or income shares from household surveys and demographic information is the standard data requirement to construct the world income distribution. Economic growth, population growth, life expectancy, and changes in the structure of income inequality are important factors determining the evolution of the world income distribution. Empirical results show that the world inequality measured as the Gini coefficient increased and poverty measured as headcount decreased. The inequality within individual countries is not increasing but the inequality between countries and regions is increasing and as well poverty concentration in some regions.
The inter-national distribution of income is often based on the Gini coefficient of national per capita GDP. The temporal patterns of inequality differ by whether the Gini coefficient is weighted by the population or not. The results from a weighted Gini
24
coefficient shows that world inequality has declined due to the faster growth in India and China than the world economy but at the cost of an increased within-country inequality. The total inequality is driven by a rise in inequality between countries affecting the evolution of world income inequality. Considering the global trends in income inequality results based on the WIID database shows that inequality is volatile prior to 1970 and more stable and increasing post 1986. We find no convincing sign of a significant global trend in income inequality over the last 50 years. The inequality is based only the within-country inequality but pooled and population weighted to capture international income inequality. The trend in the between-country inequality may be different.
Analysis of the within-country income inequality is best based on micro household surveys. It is much easier to influence the within-country inequality by policy decisions than the between-country inter-national inequality. The traditional common factors causing the within-country inequality are land concentration, urban biased development, the ageing population and the inequality in education. During a transition period wealth transfers through privatization programme was one main factor increasing inequality. The major new external causes of inequality are trade and financial liberalisation, technological change, stabilisation and adjustment programmes.
The non-uniform increases in wage inequality, technical change biased against unskilled workers and redistributive policies have resulted in the heterogeneous development of inequality among the developed countries. Geographic factors, institutional structure and democracy play a role in development and inequality. The between-country inequality dominates the within-country component. The latter is easier affected through policy interventions. Empirical results show that growth increase inequality. However, several studies conclude that the benefit of growth exceeds the disadvantages to the poor. By making economic growth pro-poor the inequality effects of growth can be reduced.
From a public finance perspective the global redistribution of income has the same structure as that of a country. The current level of world redistribution in form of cross border transfers is very small and not optimal relative to the world inequality and poverty. The within country redistribution has little impact on the global inequality. Political and capital market factors have more impacts on inequality across countries. Land reform, expanding education and active regional policy are found to be effective economic reform policy measures to reduce the within-country inequality. The social security reforms in EU show evidence of the positive impacts of taxes and targeting transfers on the distribution of income and inequality within the region. It can serve as a model for world redistribution of income.
25
REFERENCES Acemoglu D. (2002), Cross-country inequality trends, NBER Working Paper No. 8832.
Acemoglu D., S. Johnson and J.A. Robinson (2002), Reversal of fortune: geography and institutions in the making of the modern world income distribution, Quarterly Journal of Economics 117(4), 1231-1294.
Acemoglu D. and J.A. Robinson (2000), Why did the west extended the franchise? Democracy, inequality, and growth in historical perspective, The Quarterly Journal of Economics CXV, 1167-1199.
Acemoglu D. and J. Ventura (2002), The world income distribution, Quarterly Journal of Economics CXVII(2), 659-694.
Anand S. (1997), The measurement of income inequality, in: S. Subramanian (ed) Measurement of inequality and poverty, Oxford University Press, pp. 81-105.
Atkinson A.B. (1997), Bringing income distribution in from the cold, The Economic Journal 107, 297-321.
Atkinson A.B. (1999), Is rising inequality inevitable? A critique of the transatlantic consensus, The United Nations University, WIDER Annual Lectures 3, Helsinki: UNU/WIDER.
Atkinson A.B. (2000), Increased income inequality in OECD countries and the redistributive impact of the Government budget, WIDER Working Papers 2000/202, Helsinki: UNU/WIDER.
Barro R.J. (1991), Economic growth in a cross section of countries, Quarterly Journal of Economics 106, 406-443.
Barro R.J. and X. Sala-i-Martin (1995), Economic Growth, McGraw-Hill Inc.
Benabou R. (1996), Inequality and growth, in NBER Macroeconomics Annual, B.S. Bernanke and J. Rotemberg, eds., Canbridge MA: MIT Press.
Berry A., F. Bourguignon and C. Morrisson (1983), Changes in the world distribution of income between 1950 and 1977, Economic Journal 93(370), 331-350.
Birdsall N. (1998), Inequality and global coordination, Why inequality matters: the developing and transition economies, mimeo, Carnegie Endowment for International Peace, Washington D.C.
Bourguignon F. and C. Morrisson (1999), The size distribution of income among the world citizens, mimeo, DELTA, Paris.
Bourguignon F. and C. Morrisson (2002), Inequality among world citizens: 1820-1992, American Economic Reviews 92(4), 727-747.
Bowles S. and H. Gintis (2002), The inheritance of inequality, Journal of Economic Perspectives 6(3), 3-30.
Cameron L.A. (2000b), Poverty and inequality in Java: examining the impact of the changing age, educational and industrial structure, Journal of Development Economics 62, 149-180.
26
Caminada K. and K. Goudswaard (2001), International trends in income inequality and social policy, International Tax and Public Finance 8(4), 395-415.
Capeau B. and A. Decoster (2003), The rise or fall of world inequality: big issue or apparent controversy?, Unpublished manuscript.
Chen S., G. Datt and M. Ravallion (1994), Is poverty increasing in the developing world, Review of Income and Wealth 40(2), 359-376.
Commander A., A Tolstopiateniko and R. Yemtsov (1999), Chanells of redistribution: inequality and poverty in the Russian transition, Economics of Transition 7(2), 411-447.
Cornia G.A. (1999), Liberalization, globalization and income distribution, WIDER Working Paper 1999/157, Helsinki: UNU/WIDER.
Cornia G.A. and J. Court (2001), Inequality, growth and poverty in the era of liberalization and globalization, Policy Brief No. 4, Helsinki: UNU/WIDER.
Cornia G.A. and S. Kiiski (2001), Trends in income distribution in the post WWII period: evidence and interpretation, WIDER Discussion Paper 2001/89, Helsinki: UNU/WIDER.
Cowell F.A. (2000), Measurement of inequality, in Atkinson A.B. and Bourguignon F. (Eds), Handbook of Income Distribution, Volume 1, North Holland, chapter 2, 87-166.
Cowell F.A., F.H.G. Ferreira and J.A. Lichtfield (1998), Income distribution in Brazil 1981-1990: parametric and non-parametric approaches, Journal of Income Distribution 8(1), 63-76.
Datt G. and M. Ravallion (1992), Growth and redistribution components of changes in poverty measures: A decomposition with applications to Brazil and India in the 1980, Journal of Development Economics 38, 275-295.
De Gregorio J. and J-W. Lee (2002), Education and income inequality: New evidence from cross-country data, Review of Income and Wealth 48(3), 395-416.
Deininger K. and L. Squire (1996), A new data set measuring income inequality, World Bank Economic Review 10(3), 565-591.
Devroye D. and R. Freeman (2001), Does inequality in skills explain inequality of earnings across advanced countries? NBER Working Paper 8140.
Dikhanov Y. and M. Ward (2002), Evolution on the global distribution of income in 1970-99. Unpublished manuscript presented at the International Workshop on Income Distribution and Welfare, Bocconi May 30 to June 2 2002.
Dollar D. and P. Collier (2001), Globalization, growth and poverty: Building an inclusive World economy, Oxford University Press.
Dollar D. and A. Kraay (2001), Trade growth and poverty, Development Research Group, The World Bank.
Eicher T.S. and C. Garcia-Penalosa (2001), Inequality and growth: the dual role of human capital in development, Journal of Development Economics 66, 173-197.
27
Fan C.S., J. Overland and M. Spagat (1999), Human capital, growth and inequality in Russia, Journal of Comparative Economics 27(4), 618-643.
Fischer R.D. (2001), The evolution of inequality after trade liberalization, Journal of Development Economics 66, 555-579.
Gottschalk P. (1997), Inequality, income growth, and mobility: the basic facts, Journal of Economic Perspectives 11(2), 21-40.
Gottschalk P. and T.M Smeeding (1997), Cross-national comparisons of earnings and income inequality, Journal of Economic Literature 35, 633-687.
Gottschalk P. and T.M. Smeeding (2000), Empirical evidence on income inequality in industrialized countries, in Atkinson A.B. and Bourguignon F. (Eds), Handbook of Income Distribution, Volume 1, North Holland, chapter 5, pp.261-308.
Gradstein M. (2002), Does liberte=egalite? A survey of the empirical links between democracy and inequality with some evidence on the transition economies, WB PRWP 2002:2875.
Gustafsson B. and L. Shi (2002), Income inequality within and across counties in rural China 1988 and 1995, Journal of Development Economics 69(1), 179-204.
Heady C., T. Mitrakos and P. Tsakloglou (2001), The distributional impact of social transfers in the European Union: evidence from the ECHP, Fiscal Studies 22(4), 547-565.
Heshmati A. (2003), Measurement of a multidimentional index of globalization and its impact on income inequality, WIDER Discussion Paper 2003/69, Helsinki: UNU/WIDER.
Heshmati A. (2004a), Inequalities and their measurement, IZA Discussion Paper 2004:1219.
Heshmati A. (2004b), Continental and sub-continental income inequality, Unpublished manuscript.
Heshmati A. (2004c), Databases and data issues used in analysis of growth, poverty and economic inequality, Unpublished manuscript.
Heshmati A. (2004d), Regional income inequality in selected large countries, Unpublished manuscript.
Heshmati A. (2004e), The relationship between income inequality, poverty and globalization, Unpublished manuscript.
Hurrell A. (2001), Global inequality and international institutions, Metaphilosophy 32(1/2), 34-57.
Iacoviello M. (1998), Inequality Dynamics: evidence from some European countries, Working Paper No. 191, Maxwell School of Citizenship and Public Affairs, Syracuse University.
Islam N. (1995), Growth empirics: a panel data approach, The Quarterly Journal of Economics 110, 1127-1170.
Jones C.I. (1997), On the evolution of the world income distribution, Journal of Economic Perspectives 11(3), 19-36.
28
Kaplow L. (2002), Why measure inequality?, NBER Working Paper Series 2002:9342.
Kopezuk W., J. Slemrod and S. Yitzhaki (2002), Why world distribution fails, NBER Working Paper Series 2002:9186.
Li H., Squire L. and H. Zou (1998), Explaining international and intertemporal variations in income inequality, Economic Journal 108(466), 26-43.
Liebbrandt M., C. Woolard and I. Woolard (2000), The contribution of income components to income inequality in the rural former homelands of South Africa: a decomposable Gini analysis, Journal of African Economies 9(1), 79-99.
Lindert P.H. and J.G. Williamson (2001), Does globalization make the World more unequal?, NBER Working Paper 2001:8228.
LondoNo J.L. and M. Szekely (2000), Persistent poverty and excess inequality: Latin America, 1970-1995, Journal of Applied Economics III(1), 93-134.
Maddison A. (2001), The world economy: A millennial perspective, Development Centre Studies, Paris: OECD.
Mahler V.A. (2001), Economic globalization, domestic politics and income inequality in the developed countries: a cross-national analysis, Luxembourg Income Study Working Paper 273, Luxembourg.
Mankiew N.G., D. Romer and D.H. Weil (1992), A contribution to the empirics of economics growth, The Quarterly Journal of Economics 107, 407-438.
Milanovic B. (2001), World income inequality in the second half of the 20th century, World Bank, Development Research Group.
Milanovic B. (2002a), True world income distribution, 1988 and 1993: First calculation based on household surveys alone, Economic Journal 112(476), 51-92.
Milanovic B. (2002b), Can we discern the effect of globalization on income distribution? Evidence from household budget surveys, World Bank Policy Research Paper 2876, Washington DC: World Bank.
Milanovic B. and S. Yitzhaki (2001), Decomposing world income distribution: does the world have a middle class?, WB 2001:2562.
O’Rourke K.H. (2001), Globalization and inequality: historical trends, NBER Working Paper 8339, Cambridge MA: NBER.
O’Rourke K.H. and J.G. Williamson (2000), Globalization and history: the evolution of a nineteenth-century Atlantic economy, Cambridge MA: MIT Press (see Review Essay by A.G. Frank (2002), Journal of World-Systems Research 8(2), 276-290).
Park D. (2001), Recent trends in the global distribution of income, Journal of Policy Modeling 23, 497-501.
Park A., S. Wang and G. Wu (2002), Regional poverty targeting in China, Journal of Public Economics 86, 123-153.
Pyatt G. (1976), On the interpretation and disaggrgation of Gini coefficient, Economic Journal 86(342), 243-255.
29
Quah D. (1996), Empirics for economic growth and convergence, European Economic Review 40, 1353-1375.
Quah D. (1999), Some dynamics of global inequality and growth, London School of Economics, London School of Economics, mimeo.
Quah D. (2001), Some simple arithmetic on how income inequality and economic growth matter, Paper presented at WIDER conference on Growth and Poverty, 25-26 May 2001, Helsinki.
Quah D. (2002), One third of the world’s growth and inequality, Economics Department, CEPR Discussion Paper 2002:3316.
Ravallion M. (2001), Growth, inequality and poverty: looking beyond averages, World Development 29(11), 1803-1815.
Ravallion M. (2003), Inequality convergence, Economics Letters 80, 351-356.
Ravallion M. and S. Chen (1999), When economic reform is faster than statistical reform: measuring and explaining income inequality in Rural China, Oxford Bulletin of Economics and Statistics 61, 33-56.
Ravallion M. and G. Datt (2000), When growth is pro-poor? Evidence from the diverse experience of Indian states, World Bank Policy Research, WP 2263
Ravallion M., G. Datt and van der Walle (1991), Quantifying absolute poverty in the developing world, Review of Income and Wealth 37(4), 345-361.
Sala-i-Martin X. (2002a), The disturbing “Rise” of global income inequality, NBER Working Paper Series 8904.
Sala-i-Martin X. (2002b), The world distribution of income (estimated from individual country distribution), NBER Working Paper 8933.
Schultz T.P. (1998), Inequality in distribution of personal income in the world: how it is changing and why, Journal of Population Economics 11(3), 307-344.
Solimano A. (2001), The evolution of world income inequality: assessing the impact of globalization, Unpublished manuscript, ECLAC, CEPAL – Serie Macroeconomica del desarrollo No. 11, Santiago, Chile.
Stiglitz J.E. (1998), More instruments and broader goals: moving towards the Post-Washington consensus, WIDER Annual Lecture 2, Helsinki: UNU/WIDER.
Subramanian S. (1997), (ed.), Measurement of inequality and poverty, Readers in Economics, Oxford University Press.
Wade R.H. (2001a), Global inequality: Winners and losers, The Economist, April 28.
Wade R.H. (2001b), Is globalization making the world income distribution more equal?, Working Paper Series 01, London: LSE Development Studies Institute.
Williamson J.G. (1996), Globalization and inequality then and now: the late 19th and 20th centuries, NBER Paper 5491, Cambridge MA: NBER.
Wood A. and C. Ridao-Cano (1999), Skill, trade, and international inequality, Oxford Economic Papers 51, 89-119.
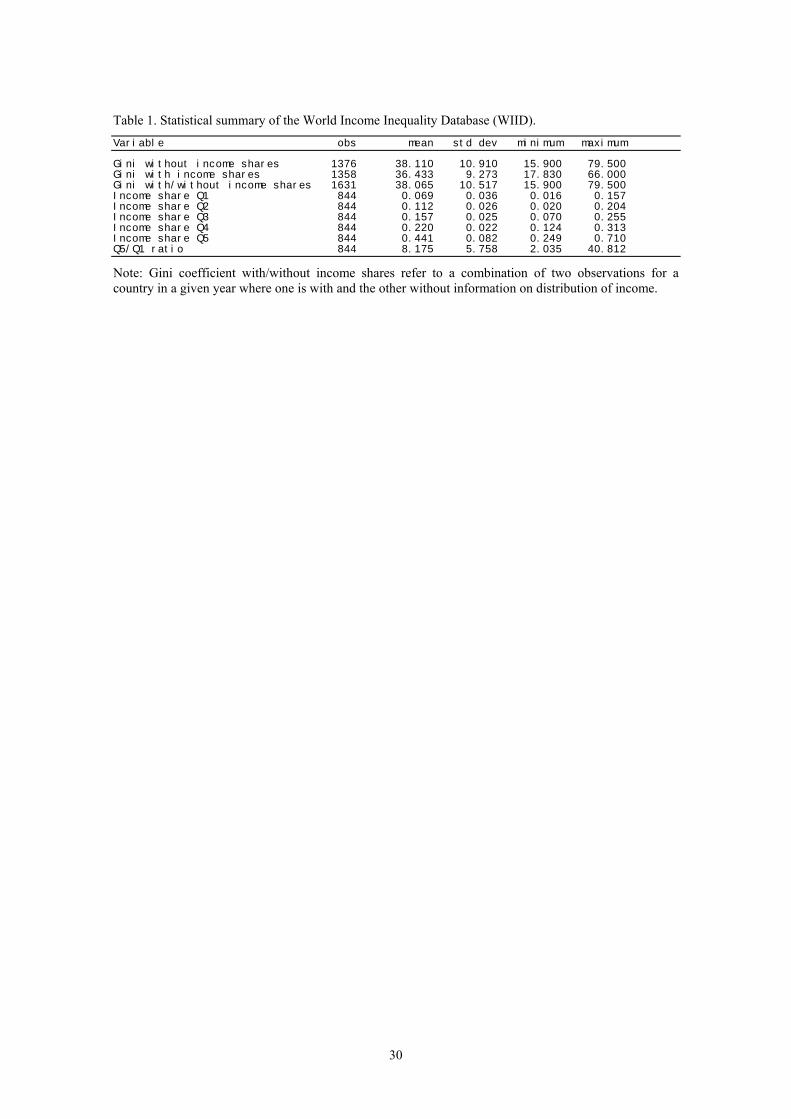
30
Table 1. Statistical summary of the World Income Inequality Database (WIID). Variable obs mean std dev minimum maximum
Gini without income shares 1376 38.110 10.910 15.900 79.500 Gini with income shares 1358 36.433 9.273 17.830 66.000 Gini with/without income shares 1631 38.065 10.517 15.900 79.500 Income share Q1 844 0.069 0.036 0.016 0.157 Income share Q2 844 0.112 0.026 0.020 0.204 Income share Q3 844 0.157 0.025 0.070 0.255 Income share Q4 844 0.220 0.022 0.124 0.313 Income share Q5 844 0.441 0.082 0.249 0.710 Q5/Q1 ratio 844 8.175 5.758 2.035 40.812
Note: Gini coefficient with/without income shares refer to a combination of two observations for a country in a given year where one is with and the other without information on distribution of income.
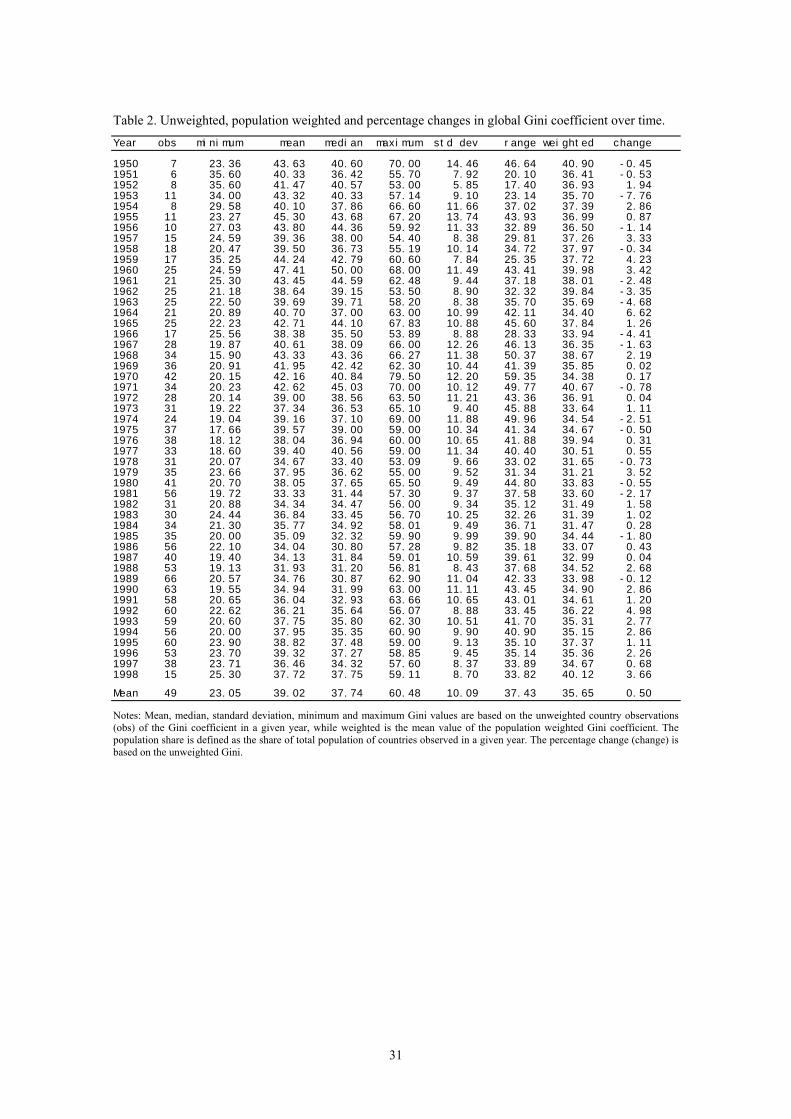
31
Table 2. Unweighted, population weighted and percentage changes in global Gini coefficient over time. Year obs minimum mean median maximum std dev range weighted change
1950 7 23.36 43.63 40.60 70.00 14.46 46.64 40.90 -0.45 1951 6 35.60 40.33 36.42 55.70 7.92 20.10 36.41 -0.53 1952 8 35.60 41.47 40.57 53.00 5.85 17.40 36.93 1.94 1953 11 34.00 43.32 40.33 57.14 9.10 23.14 35.70 -7.76 1954 8 29.58 40.10 37.86 66.60 11.66 37.02 37.39 2.86 1955 11 23.27 45.30 43.68 67.20 13.74 43.93 36.99 0.87 1956 10 27.03 43.80 44.36 59.92 11.33 32.89 36.50 -1.14 1957 15 24.59 39.36 38.00 54.40 8.38 29.81 37.26 3.33 1958 18 20.47 39.50 36.73 55.19 10.14 34.72 37.97 -0.34 1959 17 35.25 44.24 42.79 60.60 7.84 25.35 37.72 4.23 1960 25 24.59 47.41 50.00 68.00 11.49 43.41 39.98 3.42 1961 21 25.30 43.45 44.59 62.48 9.44 37.18 38.01 -2.48 1962 25 21.18 38.64 39.15 53.50 8.90 32.32 39.84 -3.35 1963 25 22.50 39.69 39.71 58.20 8.38 35.70 35.69 -4.68 1964 21 20.89 40.70 37.00 63.00 10.99 42.11 34.40 6.62 1965 25 22.23 42.71 44.10 67.83 10.88 45.60 37.84 1.26 1966 17 25.56 38.38 35.50 53.89 8.88 28.33 33.94 -4.41 1967 28 19.87 40.61 38.09 66.00 12.26 46.13 36.35 -1.63 1968 34 15.90 43.33 43.36 66.27 11.38 50.37 38.67 2.19 1969 36 20.91 41.95 42.42 62.30 10.44 41.39 35.85 0.02 1970 42 20.15 42.16 40.84 79.50 12.20 59.35 34.38 0.17 1971 34 20.23 42.62 45.03 70.00 10.12 49.77 40.67 -0.78 1972 28 20.14 39.00 38.56 63.50 11.21 43.36 36.91 0.04 1973 31 19.22 37.34 36.53 65.10 9.40 45.88 33.64 1.11 1974 24 19.04 39.16 37.10 69.00 11.88 49.96 34.54 -2.51 1975 37 17.66 39.57 39.00 59.00 10.34 41.34 34.67 -0.50 1976 38 18.12 38.04 36.94 60.00 10.65 41.88 39.94 0.31 1977 33 18.60 39.40 40.56 59.00 11.34 40.40 30.51 0.55 1978 31 20.07 34.67 33.40 53.09 9.66 33.02 31.65 -0.73 1979 35 23.66 37.95 36.62 55.00 9.52 31.34 31.21 3.52 1980 41 20.70 38.05 37.65 65.50 9.49 44.80 33.83 -0.55 1981 56 19.72 33.33 31.44 57.30 9.37 37.58 33.60 -2.17 1982 31 20.88 34.34 34.47 56.00 9.34 35.12 31.49 1.58 1983 30 24.44 36.84 33.45 56.70 10.25 32.26 31.39 1.02 1984 34 21.30 35.77 34.92 58.01 9.49 36.71 31.47 0.28 1985 35 20.00 35.09 32.32 59.90 9.99 39.90 34.44 -1.80 1986 56 22.10 34.04 30.80 57.28 9.82 35.18 33.07 0.43 1987 40 19.40 34.13 31.84 59.01 10.59 39.61 32.99 0.04 1988 53 19.13 31.93 31.20 56.81 8.43 37.68 34.52 2.68 1989 66 20.57 34.76 30.87 62.90 11.04 42.33 33.98 -0.12 1990 63 19.55 34.94 31.99 63.00 11.11 43.45 34.90 2.86 1991 58 20.65 36.04 32.93 63.66 10.65 43.01 34.61 1.20 1992 60 22.62 36.21 35.64 56.07 8.88 33.45 36.22 4.98 1993 59 20.60 37.75 35.80 62.30 10.51 41.70 35.31 2.77 1994 56 20.00 37.95 35.35 60.90 9.90 40.90 35.15 2.86 1995 60 23.90 38.82 37.48 59.00 9.13 35.10 37.37 1.11 1996 53 23.70 39.32 37.27 58.85 9.45 35.14 35.36 2.26 1997 38 23.71 36.46 34.32 57.60 8.37 33.89 34.67 0.68 1998 15 25.30 37.72 37.75 59.11 8.70 33.82 40.12 3.66
Mean 49 23.05 39.02 37.74 60.48 10.09 37.43 35.65 0.50
Notes: Mean, median, standard deviation, minimum and maximum Gini values are based on the unweighted country observations (obs) of the Gini coefficient in a given year, while weighted is the mean value of the population weighted Gini coefficient. The population share is defined as the share of total population of countries observed in a given year. The percentage change (change) is based on the unweighted Gini.
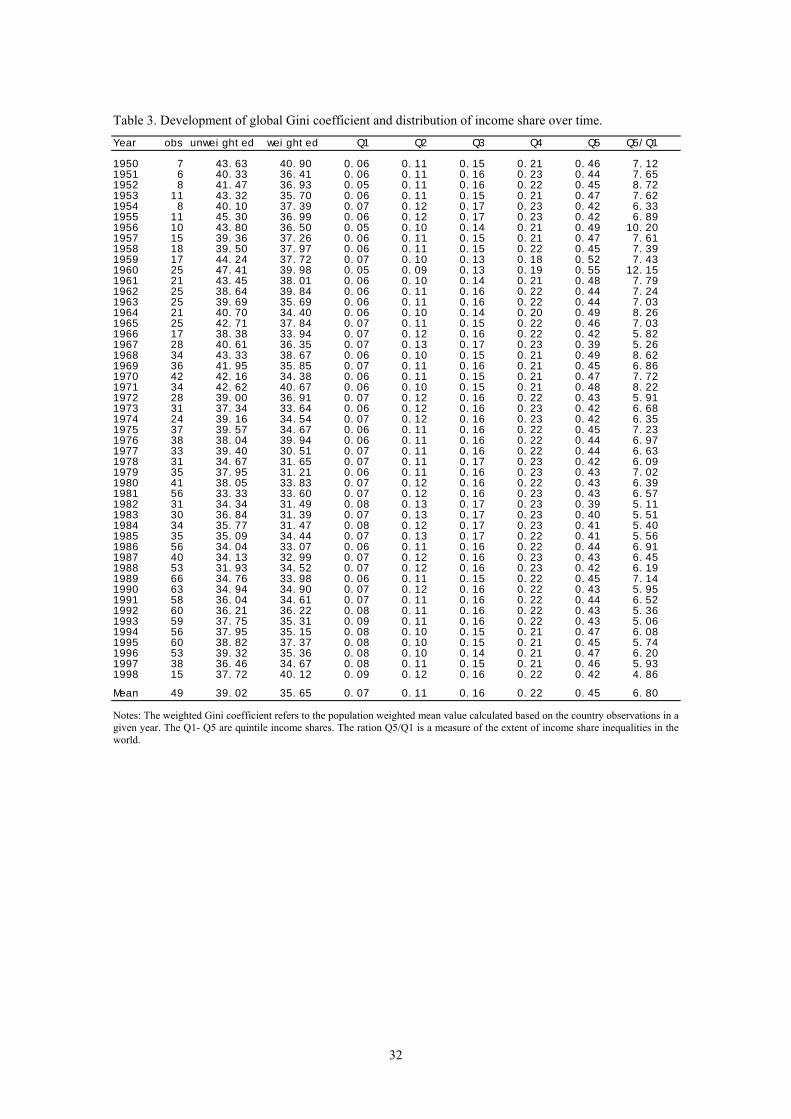
32
Table 3. Development of global Gini coefficient and distribution of income share over time. Year obs unweighted weighted Q1 Q2 Q3 Q4 Q5 Q5/Q1
1950 7 43.63 40.90 0.06 0.11 0.15 0.21 0.46 7.12 1951 6 40.33 36.41 0.06 0.11 0.16 0.23 0.44 7.65 1952 8 41.47 36.93 0.05 0.11 0.16 0.22 0.45 8.72 1953 11 43.32 35.70 0.06 0.11 0.15 0.21 0.47 7.62 1954 8 40.10 37.39 0.07 0.12 0.17 0.23 0.42 6.33 1955 11 45.30 36.99 0.06 0.12 0.17 0.23 0.42 6.89 1956 10 43.80 36.50 0.05 0.10 0.14 0.21 0.49 10.20 1957 15 39.36 37.26 0.06 0.11 0.15 0.21 0.47 7.61 1958 18 39.50 37.97 0.06 0.11 0.15 0.22 0.45 7.39 1959 17 44.24 37.72 0.07 0.10 0.13 0.18 0.52 7.43 1960 25 47.41 39.98 0.05 0.09 0.13 0.19 0.55 12.15 1961 21 43.45 38.01 0.06 0.10 0.14 0.21 0.48 7.79 1962 25 38.64 39.84 0.06 0.11 0.16 0.22 0.44 7.24 1963 25 39.69 35.69 0.06 0.11 0.16 0.22 0.44 7.03 1964 21 40.70 34.40 0.06 0.10 0.14 0.20 0.49 8.26 1965 25 42.71 37.84 0.07 0.11 0.15 0.22 0.46 7.03 1966 17 38.38 33.94 0.07 0.12 0.16 0.22 0.42 5.82 1967 28 40.61 36.35 0.07 0.13 0.17 0.23 0.39 5.26 1968 34 43.33 38.67 0.06 0.10 0.15 0.21 0.49 8.62 1969 36 41.95 35.85 0.07 0.11 0.16 0.21 0.45 6.86 1970 42 42.16 34.38 0.06 0.11 0.15 0.21 0.47 7.72 1971 34 42.62 40.67 0.06 0.10 0.15 0.21 0.48 8.22 1972 28 39.00 36.91 0.07 0.12 0.16 0.22 0.43 5.91 1973 31 37.34 33.64 0.06 0.12 0.16 0.23 0.42 6.68 1974 24 39.16 34.54 0.07 0.12 0.16 0.23 0.42 6.35 1975 37 39.57 34.67 0.06 0.11 0.16 0.22 0.45 7.23 1976 38 38.04 39.94 0.06 0.11 0.16 0.22 0.44 6.97 1977 33 39.40 30.51 0.07 0.11 0.16 0.22 0.44 6.63 1978 31 34.67 31.65 0.07 0.11 0.17 0.23 0.42 6.09 1979 35 37.95 31.21 0.06 0.11 0.16 0.23 0.43 7.02 1980 41 38.05 33.83 0.07 0.12 0.16 0.22 0.43 6.39 1981 56 33.33 33.60 0.07 0.12 0.16 0.23 0.43 6.57 1982 31 34.34 31.49 0.08 0.13 0.17 0.23 0.39 5.11 1983 30 36.84 31.39 0.07 0.13 0.17 0.23 0.40 5.51 1984 34 35.77 31.47 0.08 0.12 0.17 0.23 0.41 5.40 1985 35 35.09 34.44 0.07 0.13 0.17 0.22 0.41 5.56 1986 56 34.04 33.07 0.06 0.11 0.16 0.22 0.44 6.91 1987 40 34.13 32.99 0.07 0.12 0.16 0.23 0.43 6.45 1988 53 31.93 34.52 0.07 0.12 0.16 0.23 0.42 6.19 1989 66 34.76 33.98 0.06 0.11 0.15 0.22 0.45 7.14 1990 63 34.94 34.90 0.07 0.12 0.16 0.22 0.43 5.95 1991 58 36.04 34.61 0.07 0.11 0.16 0.22 0.44 6.52 1992 60 36.21 36.22 0.08 0.11 0.16 0.22 0.43 5.36 1993 59 37.75 35.31 0.09 0.11 0.16 0.22 0.43 5.06 1994 56 37.95 35.15 0.08 0.10 0.15 0.21 0.47 6.08 1995 60 38.82 37.37 0.08 0.10 0.15 0.21 0.45 5.74 1996 53 39.32 35.36 0.08 0.10 0.14 0.21 0.47 6.20 1997 38 36.46 34.67 0.08 0.11 0.15 0.21 0.46 5.93 1998 15 37.72 40.12 0.09 0.12 0.16 0.22 0.42 4.86
Mean 49 39.02 35.65 0.07 0.11 0.16 0.22 0.45 6.80
Notes: The weighted Gini coefficient refers to the population weighted mean value calculated based on the country observations in a given year. The Q1- Q5 are quintile income shares. The ration Q5/Q1 is a measure of the extent of income share inequalities in the world.
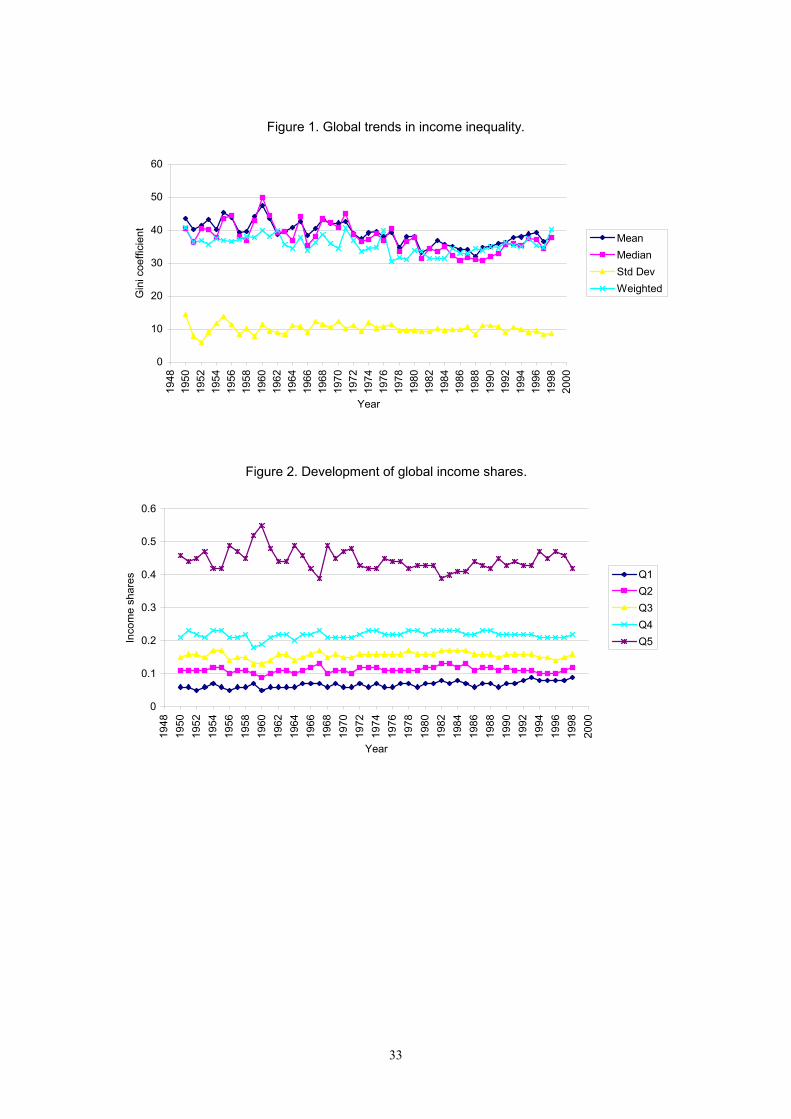
33
Figure 1. Global trends in income inequality.
0
10
20
30
40
50
6019
4819
5019
5219
5419
5619
5819
6019
6219
6419
6619
6819
7019
7219
7419
7619
7819
8019
8219
8419
8619
8819
9019
9219
9419
9619
9820
00
Year
Gin
i coe
ffici
ent
MeanMedianStd DevWeighted
Figure 2. Development of global income shares.
0
0.1
0.2
0.3
0.4
0.5
0.6
1948
1950
1952
1954
1956
1958
1960
1962
1964
1966
1968
1970
1972
1974
1976
1978
1980
1982
1984
1986
1988
1990
1992
1994
1996
1998
2000
Year
Inco
me
shar
es Q1Q2Q3Q4Q5
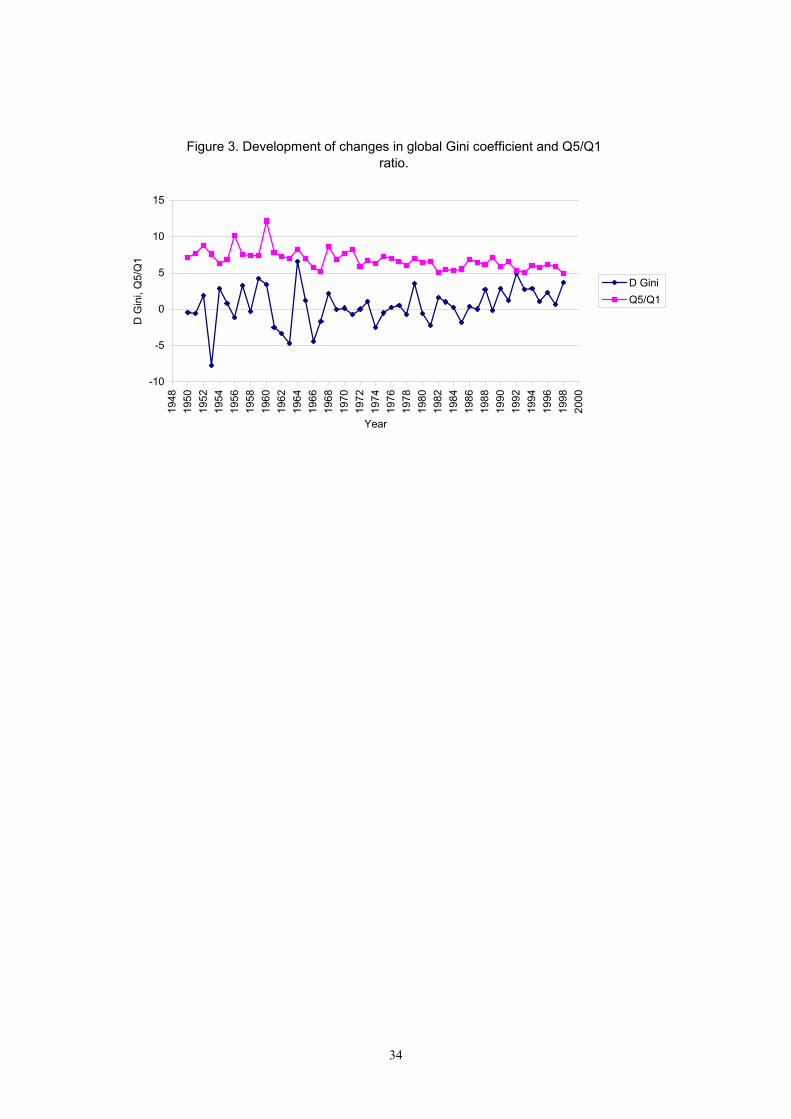
34
Figure 3. Development of changes in global Gini coefficient and Q5/Q1 ratio.
-10
-5
0
5
10
15
1948
1950
1952
1954
1956
1958
1960
1962
1964
1966
1968
1970
1972
1974
1976
1978
1980
1982
1984
1986
1988
1990
1992
1994
1996
1998
2000
Year
D G
ini,
Q5/
Q1
D GiniQ5/Q1
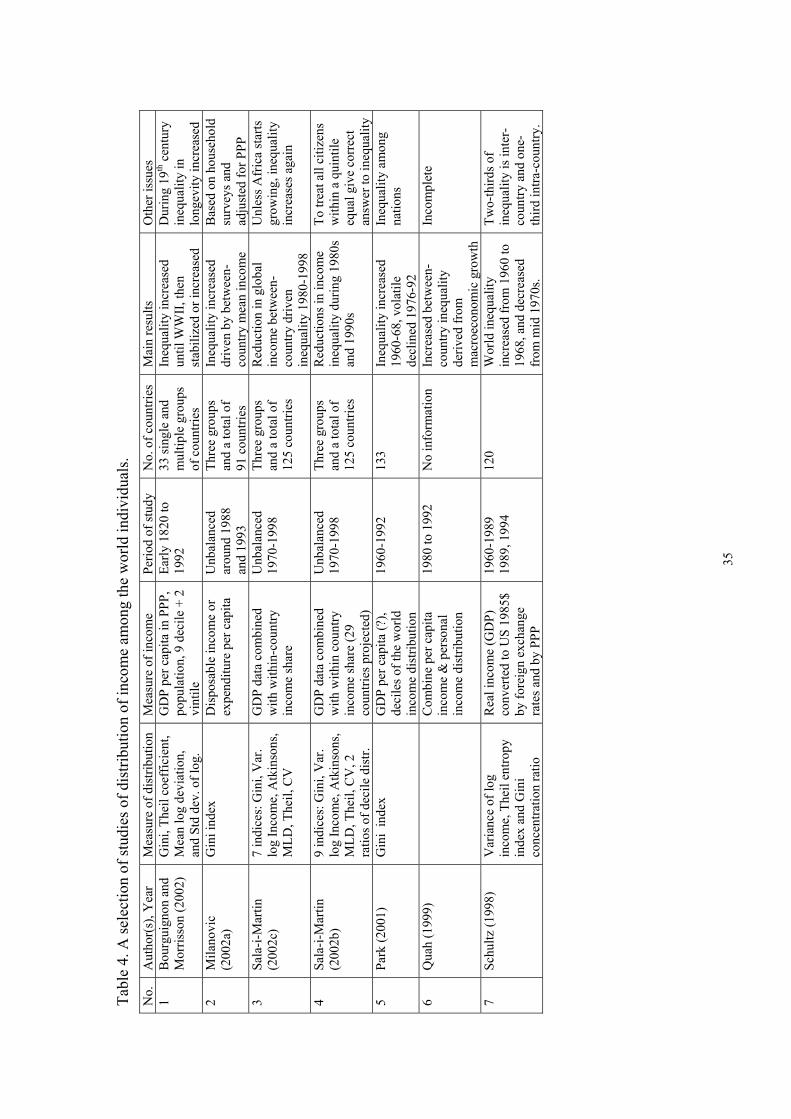
35
Tabl
e 4.
A se
lect
ion
of st
udie
s of d
istri
butio
n of
inco
me
amon
g th
e w
orld
indi
vidu
als.
No.
A
utho
r(s)
, Yea
r M
easu
re o
f dis
tribu
tion
Mea
sure
of i
ncom
e Pe
riod
of st
udy
No.
of c
ount
ries
Mai
n re
sults
O
ther
issu
es
1 B
ourg
uign
on a
nd
Mor
risso
n (2
002)
G
ini,
Thei
l coe
ffic
ient
, M
ean
log
devi
atio
n,
and
Std
dev.
of l
og.
GD
P pe
r cap
ita in
PPP
, po
pula
tion,
9 d
ecile
+ 2
vi
ntile
Early
182
0 to
19
92
33 si
ngle
and
m
ultip
le g
roup
s of
cou
ntrie
s
Ineq
ualit
y in
crea
sed
until
WW
II, t
hen
stab
ilize
d or
incr
ease
d
Dur
ing
19th
cen
tury
in
equa
lity
in
long
evity
incr
ease
d 2
Mila
novi
c (2
002a
) G
ini i
ndex
D
ispo
sabl
e in
com
e or
ex
pend
iture
per
cap
ita
Unb
alan
ced
arou
nd 1
988
and
1993
Thre
e gr
oups
an
d a
tota
l of
91 c
ount
ries
Ineq
ualit
y in
crea
sed
driv
en b
y be
twee
n-
coun
try m
ean
inco
me
Bas
ed o
n ho
useh
old
surv
eys a
nd
adju
sted
for P
PP
3 Sa
la-i-
Mar
tin
(200
2c)
7 in
dice
s: G
ini,
Var
. lo
g In
com
e, A
tkin
sons
, M
LD, T
heil,
CV
GD
P da
ta c
ombi
ned
with
with
in-c
ount
ry
inco
me
shar
e
Unb
alan
ced
1970
-199
8 Th
ree
grou
ps
and
a to
tal o
f 12
5 co
untri
es
Red
uctio
n in
glo
bal
inco
me
betw
een-
coun
try d
riven
in
equa
lity
1980
-199
8
Unl
ess A
fric
a st
arts
gr
owin
g, in
equa
lity
incr
ease
s aga
in
4 Sa
la-i-
Mar
tin
(200
2b)
9 in
dice
s: G
ini,
Var
. lo
g In
com
e, A
tkin
sons
, M
LD, T
heil,
CV
, 2
ratio
s of d
ecile
dis
tr.
GD
P da
ta c
ombi
ned
with
with
in c
ount
ry
inco
me
shar
e (2
9 co
untri
es p
roje
cted
)
Unb
alan
ced
1970
-199
8 Th
ree
grou
ps
and
a to
tal o
f 12
5 co
untri
es
Red
uctio
ns in
inco
me
ineq
ualit
y du
ring
1980
s an
d 19
90s
To tr
eat a
ll ci
tizen
s w
ithin
a q
uint
ile
equa
l giv
e co
rrec
t an
swer
to in
equa
lity
5
Park
(200
1)
Gin
i in
dex
GD
P pe
r cap
ita (?
), de
cile
s of t
he w
orld
in
com
e di
strib
utio
n
1960
-199
2 13
3 In
equa
lity
incr
ease
d 19
60-6
8, v
olat
ile
decl
ined
197
6-92
Ineq
ualit
y am
ong
natio
ns
6 Q
uah
(199
9)
C
ombi
ne p
er c
apita
in
com
e &
per
sona
l in
com
e di
strib
utio
n
1980
to 1
992
No
info
rmat
ion
Incr
ease
d be
twee
n-co
untry
ineq
ualit
y de
rived
from
m
acro
econ
omic
gro
wth
Inco
mpl
ete
7 Sc
hultz
(199
8)
Var
ianc
e of
log
inco
me,
The
il en
tropy
in
dex
and
Gin
i co
ncen
tratio
n ra
tio
Rea
l inc
ome
(GD
P)
conv
erte
d to
US
1985
$ by
fore
ign
exch
ange
ra
tes a
nd b
y PP
P
1960
-198
9 19
89, 1
994
120
Wor
ld in
equa
lity
incr
ease
d fr
om 1
960
to
1968
, and
dec
reas
ed
from
mid
197
0s.
Two-
third
s of
ineq
ualit
y is
inte
r-co
untry
and
one
-th
ird in
tra-c
ount
ry.
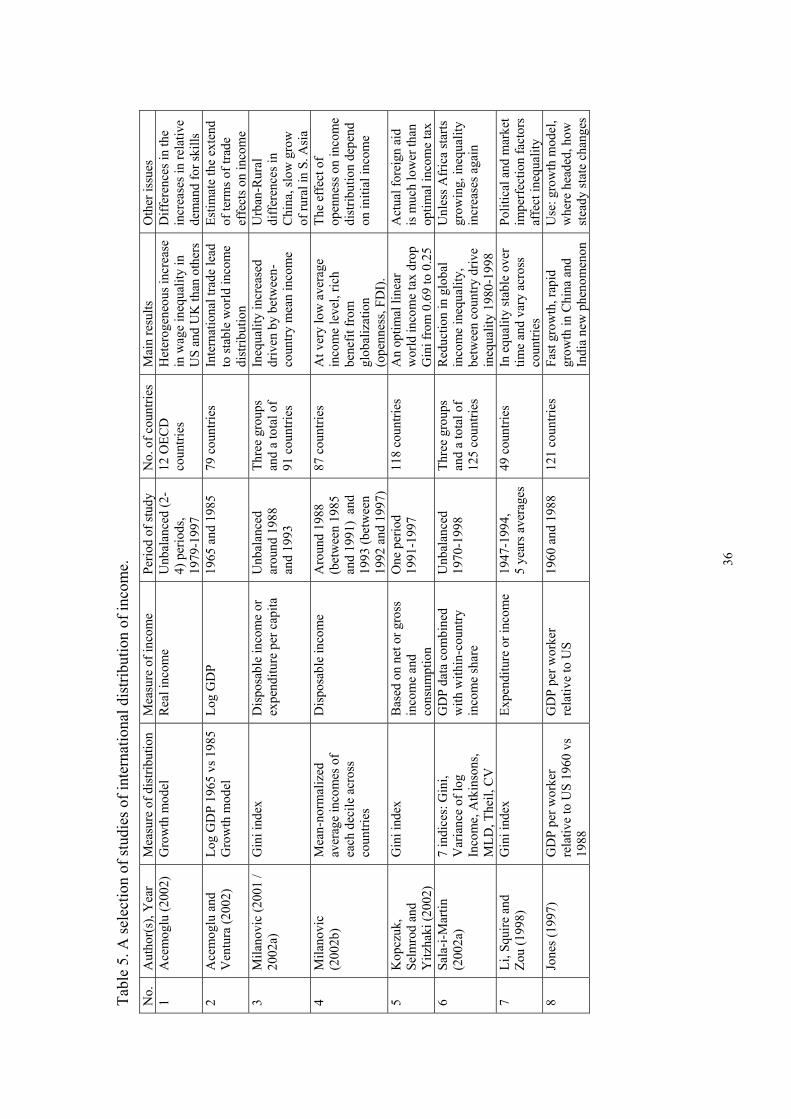
36
Tabl
e 5.
A se
lect
ion
of st
udie
s of i
nter
natio
nal d
istri
butio
n of
inco
me.
N
o.
Aut
hor(
s), Y
ear
Mea
sure
of d
istri
butio
n M
easu
re o
f inc
ome
Perio
d of
stud
y N
o. o
f cou
ntrie
s M
ain
resu
lts
Oth
er is
sues
1
Ace
mog
lu (2
002)
G
row
th m
odel
R
eal i
ncom
e U
nbal
ance
d (2
-4)
per
iods
, 19
79-1
997
12 O
ECD
co
untri
es
Het
erog
eneo
us in
crea
se
in w
age
ineq
ualit
y in
U
S an
d U
K th
an o
ther
s
Diff
eren
ces i
n th
e in
crea
ses i
n re
lativ
e de
man
d fo
r ski
lls
2 A
cem
oglu
and
V
entu
ra (2
002)
Lo
g G
DP
1965
vs 1
985
Gro
wth
mod
el
Log
GD
P
1965
and
198
5 79
cou
ntrie
s In
tern
atio
nal t
rade
lead
to
stab
le w
orld
inco
me
dist
ribut
ion
Estim
ate
the
exte
nd
of te
rms o
f tra
de
effe
cts o
n in
com
e 3
Mila
novi
c (2
001
/ 20
02a)
G
ini i
ndex
D
ispo
sabl
e in
com
e or
ex
pend
iture
per
cap
ita
Unb
alan
ced
ar
ound
198
8 an
d 19
93
Thre
e gr
oups
an
d a
tota
l of
91 c
ount
ries
Ineq
ualit
y in
crea
sed
driv
en b
y be
twee
n-co
untry
mea
n in
com
e
Urb
an-R
ural
di
ffer
ence
s in
Chi
na, s
low
gro
w
of ru
ral i
n S.
Asi
a 4
Mila
novi
c (2
002b
) M
ean-
norm
aliz
ed
aver
age
inco
mes
of
each
dec
ile a
cros
s co
untri
es
Dis
posa
ble
inco
me
A
roun
d 19
88
(bet
wee
n 19
85
and
1991
) an
d 19
93 (b
etw
een
1992
and
199
7)
87 c
ount
ries
At v
ery
low
ave
rage
in
com
e le
vel,
rich
bene
fit fr
om
glob
aliz
atio
n (o
penn
ess,
FDI)
.
The
effe
ct o
f op
enne
ss o
n in
com
e di
strib
utio
n de
pend
on
initi
al in
com
e
5 K
opcz
uk,
Selm
rod
and
Yitz
haki
(200
2)
Gin
i ind
ex
Bas
ed o
n ne
t or g
ross
in
com
e an
d co
nsum
ptio
n
One
per
iod
1991
-199
7 11
8 co
untri
es
An
optim
al li
near
w
orld
inco
me
tax
drop
G
ini f
rom
0.6
9 to
0.2
5
Act
ual f
orei
gn a
id
is m
uch
low
er th
an
optim
al in
com
e ta
x 6
Sala
-i-M
artin
(2
002a
) 7
indi
ces:
Gin
i, V
aria
nce
of lo
g In
com
e, A
tkin
sons
, M
LD, T
heil,
CV
GD
P da
ta c
ombi
ned
with
with
in-c
ount
ry
inco
me
shar
e
Unb
alan
ced
1970
-199
8 Th
ree
grou
ps
and
a to
tal o
f 12
5 co
untri
es
Red
uctio
n in
glo
bal
inco
me
ineq
ualit
y,
betw
een
coun
try d
rive
ineq
ualit
y 19
80-1
998
Unl
ess A
fric
a st
arts
gr
owin
g, in
equa
lity
incr
ease
s aga
in
7 Li
, Squ
ire a
nd
Zou
(199
8)
Gin
i ind
ex
Expe
nditu
re o
r inc
ome
1947
-199
4,
5 ye
ars a
vera
ges
49 c
ount
ries
In e
qual
ity st
able
ove
r tim
e an
d va
ry a
cros
s co
untri
es
Polit
ical
and
mar
ket
impe
rfec
tion
fact
ors
affe
ct in
equa
lity
8 Jo
nes (
1997
) G
DP
per w
orke
r re
lativ
e to
US
1960
vs
1988
GD
P pe
r wor
ker
rela
tive
to U
S 19
60 a
nd 1
988
121
coun
tries
Fa
st g
row
th, r
apid
gr
owth
in C
hina
and
In
dia
new
phe
nom
enon
Use
: gro
wth
mod
el,
whe
re h
eade
d, h
ow
stea
dy st
ate
chan
ges
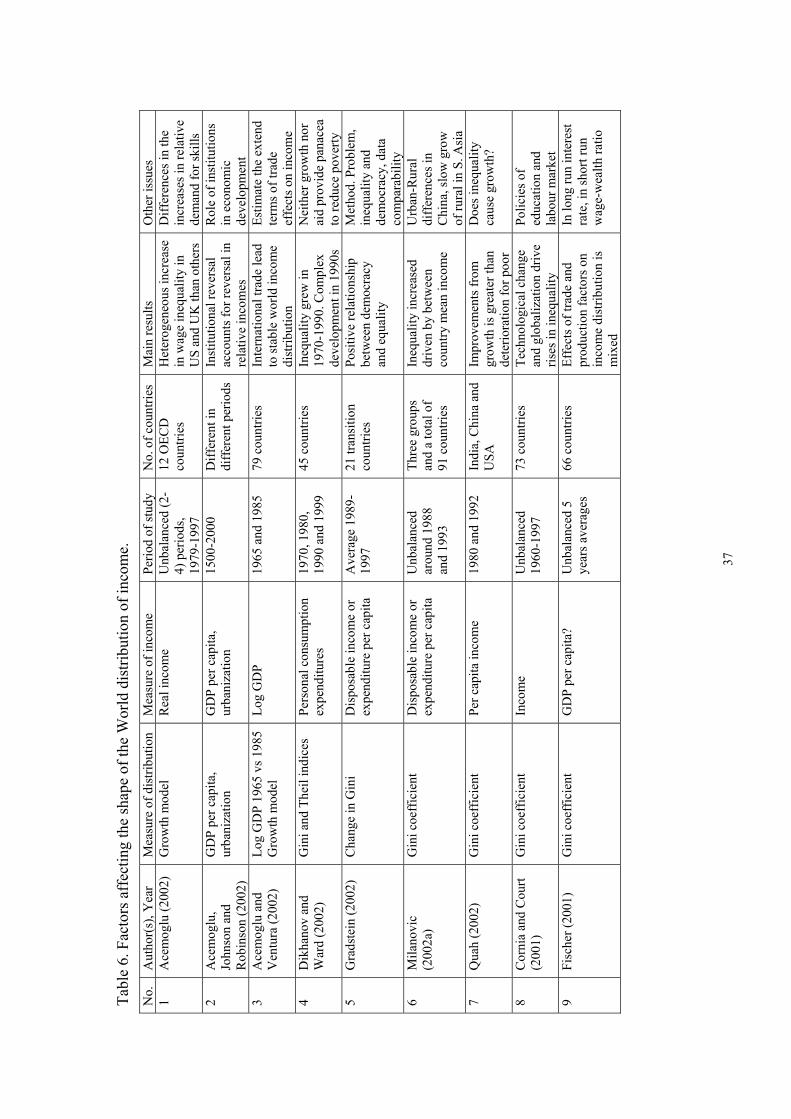
37
Tabl
e 6.
Fac
tors
aff
ectin
g th
e sh
ape
of th
e W
orld
dis
tribu
tion
of in
com
e.
No.
A
utho
r(s)
, Yea
r M
easu
re o
f dis
tribu
tion
Mea
sure
of i
ncom
e Pe
riod
of st
udy
No.
of c
ount
ries
Mai
n re
sults
O
ther
issu
es
1 A
cem
oglu
(200
2)
Gro
wth
mod
el
Rea
l inc
ome
Unb
alan
ced
(2-
4) p
erio
ds,
1979
-199
7
12 O
ECD
co
untri
es
Het
erog
eneo
us in
crea
se
in w
age
ineq
ualit
y in
U
S an
d U
K th
an o
ther
s
Diff
eren
ces i
n th
e in
crea
ses i
n re
lativ
e de
man
d fo
r ski
lls
2 A
cem
oglu
, Jo
hnso
n an
d R
obin
son
(200
2)
GD
P pe
r cap
ita,
urba
niza
tion
GD
P pe
r cap
ita,
urba
niza
tion
15
00-2
000
Diff
eren
t in
diff
eren
t per
iods
In
stitu
tiona
l rev
ersa
l ac
coun
ts fo
r rev
ersa
l in
rela
tive
inco
mes
Rol
e of
inst
itutio
ns
in e
cono
mic
de
velo
pmen
t 3
Ace
mog
lu a
nd
Ven
tura
(200
2)
Log
GD
P 19
65 v
s 198
5 G
row
th m
odel
Lo
g G
DP
19
65 a
nd 1
985
79 c
ount
ries
Inte
rnat
iona
l tra
de le
ad
to st
able
wor
ld in
com
e di
strib
utio
n
Estim
ate
the
exte
nd
term
s of t
rade
ef
fect
s on
inco
me
4 D
ikha
nov
and
War
d (2
002)
G
ini a
nd T
heil
indi
ces
Pers
onal
con
sum
ptio
n ex
pend
iture
s 19
70, 1
980,
19
90 a
nd 1
999
45 c
ount
ries
Ineq
ualit
y gr
ew in
19
70-1
990.
Com
plex
de
velo
pmen
t in
1990
s
Nei
ther
gro
wth
nor
ai
d pr
ovid
e pa
nace
a to
redu
ce p
over
ty
5 G
rads
tein
(200
2)
Cha
nge
in G
ini
Dis
posa
ble
inco
me
or
expe
nditu
re p
er c
apita
A
vera
ge 1
989-
1997
21
tran
sitio
n co
untri
es
Posi
tive
rela
tions
hip
betw
een
dem
ocra
cy
and
equa
lity
Met
hod.
Pro
blem
, in
equa
lity
and
dem
ocra
cy, d
ata
com
para
bilit
y 6
Mila
novi
c (2
002a
) G
ini c
oeff
icie
nt
Dis
posa
ble
inco
me
or
expe
nditu
re p
er c
apita
U
nbal
ance
d
arou
nd 1
988
and
1993
Thre
e gr
oups
an
d a
tota
l of
91 c
ount
ries
Ineq
ualit
y in
crea
sed
driv
en b
y be
twee
n co
untry
mea
n in
com
e
Urb
an-R
ural
di
ffer
ence
s in
Chi
na, s
low
gro
w
of ru
ral i
n S.
Asi
a 7
Qua
h (2
002)
G
ini c
oeff
icie
nt
Per c
apita
inco
me
1980
and
199
2 In
dia,
Chi
na a
nd
USA
Im
prov
emen
ts fr
om
grow
th is
gre
ater
than
de
terio
ratio
n fo
r poo
r
Doe
s ine
qual
ity
caus
e gr
owth
?
8 C
orni
a an
d C
ourt
(200
1)
Gin
i coe
ffic
ient
In
com
e U
nbal
ance
d 19
60-1
997
73 c
ount
ries
Tech
nolo
gica
l cha
nge
and
glob
aliz
atio
n dr
ive
rises
in in
equa
lity
Polic
ies o
f ed
ucat
ion
and
labo
ur m
arke
t 9
Fisc
her (
2001
) G
ini c
oeff
icie
nt
GD
P pe
r cap
ita?
Unb
alan
ced
5 ye
ars a
vera
ges
66 c
ount
ries
Effe
cts o
f tra
de a
nd
prod
uctio
n fa
ctor
s on
in
com
e di
strib
utio
n is
m
ixed
In lo
ng ru
n in
tere
st
rate
, in
shor
t run
w
age-
wea
lth ra
tio
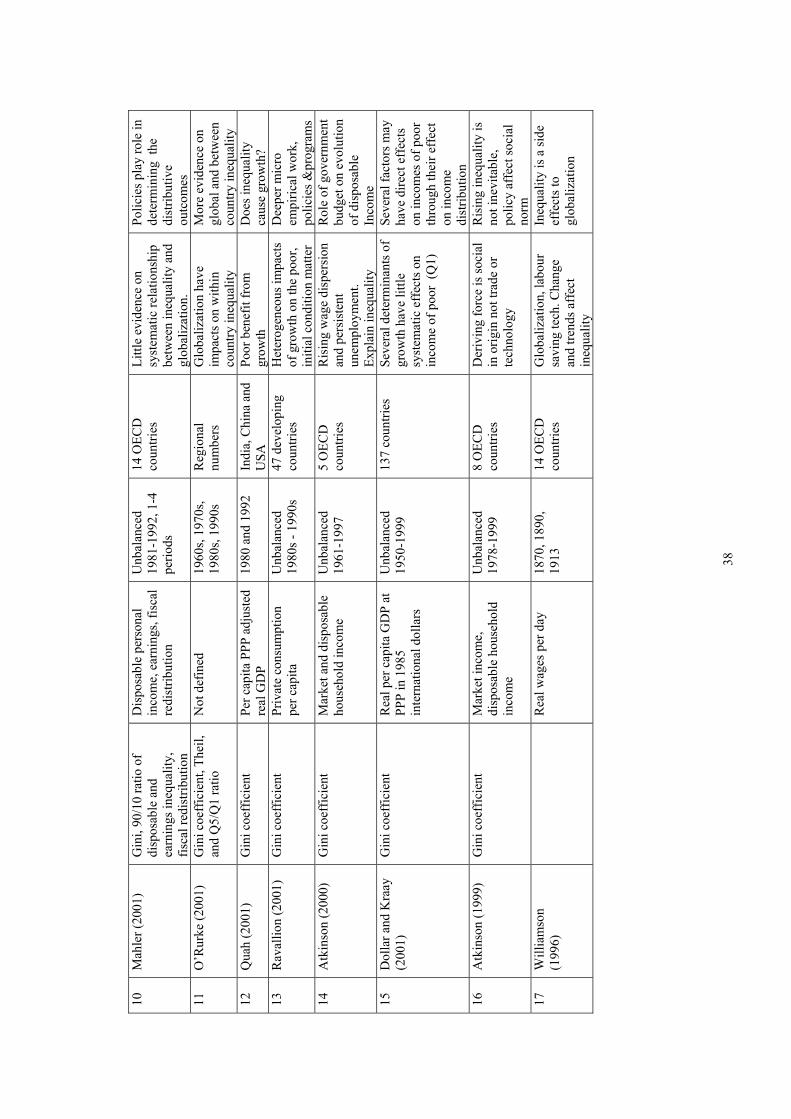
38
10
Mah
ler (
2001
) G
ini,
90/1
0 ra
tio o
f di
spos
able
and
ea
rnin
gs in
equa
lity,
fis
cal r
edis
tribu
tion
Dis
posa
ble
pers
onal
in
com
e, e
arni
ngs,
fisca
l re
dist
ribut
ion
Unb
alan
ced
1981
-199
2, 1
-4
perio
ds
14 O
ECD
co
untri
es
Littl
e ev
iden
ce o
n sy
stem
atic
rela
tions
hip
betw
een
ineq
ualit
y an
d gl
obal
izat
ion.
Polic
ies p
lay
role
in
dete
rmin
ing
the
dist
ribut
ive
outc
omes
11
O
’Rur
ke (2
001)
G
ini c
oeff
icie
nt, T
heil,
an
d Q
5/Q
1 ra
tio
Not
def
ined
19
60s,
1970
s, 19
80s,
1990
s R
egio
nal
num
bers
G
loba
lizat
ion
have
im
pact
s on
with
in
coun
try in
equa
lity
Mor
e ev
iden
ce o
n gl
obal
and
bet
wee
n co
untry
ineq
ualit
y 12
Q
uah
(200
1)
Gin
i coe
ffic
ient
Pe
r cap
ita P
PP a
djus
ted
real
GD
P 19
80 a
nd 1
992
Indi
a, C
hina
and
U
SA
Poor
ben
efit
from
gr
owth
D
oes i
nequ
ality
ca
use
grow
th?
13
Rav
allio
n (2
001)
G
ini c
oeff
icie
nt
Priv
ate
cons
umpt
ion
per c
apita
U
nbal
ance
d 19
80s -
199
0s
47 d
evel
opin
g co
untri
es
Het
erog
eneo
us im
pact
s of
gro
wth
on
the
poor
, in
itial
con
ditio
n m
atte
r
Dee
per m
icro
em
piric
al w
ork,
po
licie
s &pr
ogra
ms
14
Atk
inso
n (2
000)
G
ini c
oeff
icie
nt
Mar
ket a
nd d
ispo
sabl
e ho
useh
old
inco
me
Unb
alan
ced
1961
-199
7 5
OEC
D
coun
tries
R
isin
g w
age
disp
ersi
on
and
pers
iste
nt
unem
ploy
men
t. Ex
plai
n in
equa
lity
Rol
e of
gov
ernm
ent
budg
et o
n ev
olut
ion
of d
ispo
sabl
e In
com
e
15
Dol
lar a
nd K
raay
(2
001)
G
ini c
oeff
icie
nt
Rea
l per
cap
ita G
DP
at
PPP
in 1
985
inte
rnat
iona
l dol
lars
Unb
alan
ced
1950
-199
9 13
7 co
untri
es
Seve
ral d
eter
min
ants
of
grow
th h
ave
little
sy
stem
atic
eff
ects
on
in
com
e of
poo
r (Q
1)
Seve
ral f
acto
rs m
ay
have
dire
ct e
ffec
ts
on in
com
es o
f poo
r th
roug
h th
eir e
ffec
t on
inco
me
dist
ribut
ion
16
Atk
inso
n (1
999)
G
ini c
oeff
icie
nt
Mar
ket i
ncom
e,
disp
osab
le h
ouse
hold
in
com
e
Unb
alan
ced
1978
-199
9 8
OEC
D
coun
tries
D
eriv
ing
forc
e is
soci
al
in o
rigin
not
trad
e or
te
chno
logy
Ris
ing
ineq
ualit
y is
no
t ine
vita
ble,
po
licy
affe
ct so
cial
no
rm
17
Will
iam
son
(199
6)
R
eal w
ages
per
day
18
70, 1
890,
19
13
14 O
ECD
co
untri
es
Glo
baliz
atio
n, la
bour
sa
ving
tech
. Cha
nge
and
trend
s aff
ect
ineq
ualit
y
Ineq
ualit
y is
a si
de
effe
cts t
o
glob
aliz
atio
n