Embed Size (px)
Citation preview

1
Fully strained epitaxial Ti1−xMgxN(001) layers
Baiwei Wang and Daniel Gall
Department of Materials Science and Engineering, Rensselaer Polytechnic Institute, Troy, NY
12180, USA
Ti1−xMgxN(001) layers with 0.00 x 0.49 are deposited on MgO(001) by reactive
magnetron co-sputtering from titanium and magnesium targets in 5 mTorr pure N2 at 600 °C. X-
ray diffraction ω-2θ scans, ω-rocking curves, φ-scans, and high resolution reciprocal space maps
show that the Ti1−xMgxN layers are rock-salt structure single crystals with a cube-on-cube
epitaxial relationship with the substrates: (001)TiMgN║(001)MgO and [100]TiMgN║[100]MgO. Layers
with thickness d = 35-58 nm are fully strained, with an in-plane lattice parameter a|| = 4.212
0.001 Å matching that of the MgO substrate, while the out-of-plane lattice parameter a
increases with x from 4.251 Å for TiN(001) to 4.289 Å for Ti0.51Mg0.49N(001). This yields a
relaxed lattice parameter for Ti1−xMgxN(001) of ao = (1-x)aTiN + xaMgN – bx(1-x), where aTiN =
4.239 Å, aMgN = 4.345 Å, and the bowing parameter b = 0.113 Å. In contrast, thicker
Ti1−xMgxN(001) layers with d = 110-275 nm are partially (pure TiN) or fully (x = 0.37 and 0.49)
relaxed, indicating a critical thickness for relaxation of 50-100 nm. The in-plane x-ray coherence
length is large (100-400 nm) for fully strained layers with 0.00 x 0.45 but drops by an order
of magnitude for x = 0.49 as the composition approaches the phase stability limit. It is also an
order of magnitude smaller for thicker (d ≥ 110 nm) layers, which is attributed to strain
relaxation through the nucleation and growth of misfit dislocations facilitated by glide of
threading dislocations.
Keywords: TiMgN; epitaxy; coherent; TiN; MgN; relaxation; lattice constant; dislocation
I. Introduction Titanium magnesium nitride Ti1−xMgxN has gained recent interest because of two reasons:
Firstly, it is a promising material for hard wear-protective [1, 2], optical decorative [3, 4], and
bioimplant [5] coatings, as it shares the prominent physical properties of traditional transition
metal nitrides including high hardness, wear and corrosion resistance, and high temperature
stability [6-11]. Secondly, the stoichiometric Ti0.5Mg0.5N solid solution is a semiconductor with a
predicted 1.3 eV band gap [12], a measured negative temperature coefficient of resistivity [13]
and a negligible density of states at the Fermi level [14]. Therefore, Ti1−xMgxN layers with x ≤
0.5 have a tunable infrared plasmonic activity [15, 16] and are promising as, for example,
plasmonic solar heat transducers [17]. We envision that all these applications will benefit from a
better understanding of the Ti1−xMgxN growth process, including the interplay between
composition, strain, and stress relaxation. Studying the epitaxial growth process has the potential
to provide such understanding as it is a model system that effectively eliminates the confounding
effects from crystal orientation variations and grain boundaries that are present in polycrystalline
samples [18]. In addition, epitaxial Ti1−xMgxN(001) layers are also promising for plasmonic and
semiconductor applications as they minimize electronic losses due to crystalline defects that
deteriorate the plasmonic field enhancement [15] and cause carrier scattering and mid-gap traps
for the predicted Ti0.5Mg0.5N semiconductor [12]. Reactive magnetron sputtering in a N2
atmosphere is the most common approach for the deposition of epitaxial transition metal nitride
2
layers, and has been successfully employed to grow TiN(001) [8, 19-22], ScN(001) [21, 23-25],
CrN(001) [26-28], NbN(001) [29], MoN(001) [30], HfN(001) [31, 32], TaN(001) [33-36],
WN(001) [37, 38], and CeN(001) [39], as well as ternaries like Ti1−xWxN(001) [40],
Ti1−xScxN(001) [41], Sc1−xAlxN(001) [42-44], and NbC1−xNx(001) [45, 46]. These layers often
exhibit residual stress, which is due to multiple contributing effects including lattice misfit with
the substrate [19, 30, 38], energetic incident particles which may cause interstitial point defects
and/or vacancies [47-49], differential layer/substrate thermal contraction after deposition in
combination with a kinetic barrier for dislocation formation [45, 50], and atomic shadowing
leading to voids [51, 52]. Stress/strain relaxation in thin films is a fundamental process that
affects structural and morphological stabilities as well as electronic properties. It is therefore of
significant interest for device applications as well as for protective coatings since the adhesive
strength, hardness, fracture toughness, tribological properties, and resulting mechanical wear
and failures are strongly influenced by strain [53, 54], while lattice strain in semiconductor and
optoelectronic devices also provides opportunities to tune band gaps/alignments/degeneracy,
band curvatures and hence carrier effective masses [55], but may also lead to dislocations and
associated defect states that trap conduction electrons. Strain relaxation in epitaxial
Ti1−xMgxN(001) as a function of composition, layer thickness, and processing conditions is
completely unexplored, which motivates the present study.
In this paper, we report on the deposition of single crystal Ti1−xMgxN(001) layers (0.00
x 0.49) on MgO(001) by reactive magnetron co-sputtering from titanium and magnesium
targets in 5 mTorr pure N2 at 600 °C. X-ray diffraction ω-2θ scans, ω-rocking curves, φ-scans,
and high resolution reciprocal space maps show that rock-salt Ti1−xMgxN layers are epitaxial
single crystals. Layers with thickness 35 nm d 58 nm are fully strained, while thicker layers
with d = 110 – 275 nm are nearly (x = 0) or completely (x 0.37) relaxed, suggesting that
relaxation occurs above a critical thickness for the formation of misfit dislocations. The in-plane
x-ray coherence length for fully strained layers with 0.00 x 0.45 is 100-400 nm, but drops to
20 - 44 nm for relaxed layers. Similarly, the out-of-plane x-ray coherence length matches the
layer thickness for strained layers but is reduced to 35 - 47 nm for relaxed layers, which is
attributed to strain fields associated with misfit and threading dislocations. Increasing x to 0.49
causes a decrease in both correlation lengths, which is attributed to local strain variations as the
alloy approaches a composition for phase separation.
II. Experimental Procedure
Ti1−xMgxN layers were deposited by reactive magnetron co-sputtering in a load-locked
ultra-high vacuum deposition system with a base pressure of 10-9 Torr [42]. Double-side polished
10×10×0.5 mm3 single-crystal magnesium oxide MgO(001) substrates were cleaned in
sequential ultrasonic baths of tri-chloroethylene, acetone, and isopropyl alcohol, for 20 min each,
rinsed in de-ionized water, blown dry with nitrogen, mounted onto a Mo substrate holder using
silver paint, and inserted into the deposition system. Prior to deposition, substrates were degassed
for 1 hour at 1000 °C using a radiative pyrolytic graphite heater. Subsequently, the heater current
was adjusted to reach the desired substrate temperature of 600 °C, as measured by a
thermocouple underneath the substrate holder that was cross-calibrated with a pyrometer focused
on the substrate surface. 99.999% pure N2, which was further purified with a MicroTorr purifier,
was introduced into the chamber with a needle valve to reach a constant pressure of 5 mTorr, as
measured with a capacitance manometer. 5-cm-diamter nominally 99.99% pure Ti and Mg
targets were positioned 9 and 23 cm from the substrate surface with 45° and 0° tilt angles,

3
respectively. Before deposition, the Ti and Mg targets were sputter etched for 5 min using 100 W
on each magnetron with a shutter shielding the substrate. The two magnetrons were
simultaneously operated with separate DC power supplies, keeping the power to the Ti target
constant at 100 W for all layers while varying the power to the Mg target from 0 to 350 W to
achieve samples with different Ti-to-Mg compositions. The substrate was continuously rotated at
60 rpm to ensure composition and thickness uniformity. The potential to the Ti target (-455±4 V)
was unaffected by the power to the Mg target, suggesting that the plasmas from the two
deposition sources have a negligible interaction such that the Ti flux to the substrate is expected
to be the same for all layers, corresponding to a constant TiN deposition rate of 1.4 nm/min. The
deposition time for each sample was adjusted according to the Mg power, in order to obtain
comparable film thicknesses of approximately 50 nm, as determined by X-ray reflectivity (XRR).
A second set of Ti1−xMgxN layers with larger thicknesses of 110-275 nm were deposited in 15
mTorr N2 for 1 hour, with Ti and Mg targets facing the substrate at the same distance of 9 cm
and ±45° tilts as described in Ref. [13], keeping the power to the Ti target constant at 100 W to
achieve a TiN deposition rate of 1.8 nm/min and adjusting the power to the Mg target from 0 to
200 W, resulting a set of samples with various compositions.
X-ray photoelectron spectroscopy (XPS) spectra were acquired using Al Kα radiation
(1486.7 eV) in a PHI 5000 VersaprobeTM with a hemispherical analyzer and an 8-channel
detector. The samples were analyzed after exposure to air but without any sputter cleaning of
their surfaces, such that the XPS results are not affected by preferential sputtering [56, 57].
Rutherford Backscattering Spectroscopy (RBS) was done using 2 MeV 4He+ ions incident at an
angle of 6 relative to the sample surface normal, and a total scattering angle of 166.2 between
incident beam and detector. RBS spectra were analyzed using the XRUMP simulation program.
X-ray diffraction was done with a Panalytical X’Pert PRO MPD system with a Cu Kα
source and a hybrid mirror with a two-bounce two-crystal Ge(220) monochromator, yielding a
parallel incident beam with a wavelength λKα1 = 1.5406 Å, a divergence of 0.0068°, and a width
of 0.3 mm. Sample alignment included height adjustment as well as correction of the ω and χ tilt
angles by maximizing the substrate peak intensity. Symmetric ω-2θ scans were obtained using a
0.04 radian Soller slit in front of a PIXcel solid-state line detector operated in receiving mode
with a 0.165 mm active length, corresponding to a 2θ opening of less than 0.04°. ω-rocking
curves were obtained using constant 2θ angles corresponding to Ti1-xMgxN 002 reflections and
using the same parallel beam geometry as used for ω-2θ scans. Asymmetric high-resolution
reciprocal space maps (HR RSM) around 113 reflections were obtained using a small angle (10-
14°) between the sample surface and the diffracted beam to cause beam narrowing which
increases the 2θ resolution and therefore facilitates fast high-resolution reciprocal space mapping
by taking advantage of parallel acquisition with all 255 channels of a line detector operated in
scanning mode. XRD φ scans were obtained using a point focus optics with a poly-capillary x-
ray lens that provides a quasi-parallel Cu Kα beam with a divergence of less than 0.3° to
minimize defocusing effects associated with the non-uniform sample height due to the tilt of the
sample surface normal out of the plane defined by incoming and diffracted beams. In addition,
ω-2θ scans with a divergent beam Bragg-Brentano geometry were acquired over a large 2θ range
from 5-85° in order to detect small inclusions of possible secondary phases or misoriented grains.
III. Results and Discussion
The Mg-content x in the Ti1-xMgxN layers measured by XPS is zero for pure TiN and
increases to x = 0.12, 0.19, 0.26, 0.39, 0.45 and 0.49 for deposition with an increasing power to

4
the Mg target PMg = 20, 40, 65, 100, 150 and 350 W while keeping the Ti flux constant. We note
that x increases less than linearly with PMg. This is most pronounced at high x where an increase
in PMg by more than a factor of two from 150 to 350 W leads to only a 9% increase in x from
0.45 to 0.49. This is attributed to a reduced Mg incorporation and Mg loss due to evaporation
from the sample surface during deposition for layers with a large Mg content [13]. RBS
compositional analyses for the same sample set yields x = 0.07, 0.14, 0.16, 0.40, 0.43 and 0.45.
That is, they agree to within 8% with the XPS measurements for samples with PMg 100 W but
underestimate the Mg-content for PMg 65 W. This is caused by the challenge in uniquely fitting
RBS data due to the Mg signal from the MgO substrate which results in a particularly large
uncertainty for layers with small Mg content. Thus, in the remainder of the paper, we use x
values determined by XPS which we believe is more accurate in determining the Mg-to-Ti ratio.
In contrast, RBS is more accurate in measuring the N-to-metal ratio, because XPS is strongly
affected by N-containing surface contaminations and sputter cleaning is ineffective as it causes
considerable compositional deviations due to preferential sputtering [56, 57]. The N-to-metal
ratio in the Ti1-xMgxN layers determined by RBS ranges from 0.96 0.04 for x 0.39 to 0.90
0.04 for x 0.45, indicating that most layers are stoichiometric within experimental uncertainty,
but that the layers with the highest Mg-content may be N deficient. This is consistent with
expectations since the most stable pure magnesium nitride phase (Mg3N2) has a N-to-metal ratio
of 0.67. It is also consistent with previous first-principles simulations [12] and experimental data
[13] suggesting an under-stoichiometric N concentration for Mg-rich layers. We note however,
that the experimental uncertainty in determining the N-to-metal ratio is relatively large, due to
the low RBS scattering cross section for light elements like N. We discuss in the following the
results from two sets of samples, as also mentioned in Section II. More specifically, the first set
of relatively thin (≤ 58 nm) layers have thicknesses determined by XRR of d = 54.4, 49.0, 43.3,
52.0, 57.5, 44.5 and 35.0 nm for PMg = 0, 20, 40, 65, 100, 150 and 350 W, respectively, and
compositions as stated above. The second set of samples have larger thicknesses (d ≥ 110 nm)
which are measured by scanning electron microscopy as previously reported in Ref. [13] and are
d = 110, 150, and 275 nm for x = 0.00, 0.37, and 0.49, respectively.
Figure 1(a) shows sections of typical x-ray diffraction ω-2θ patterns over the 2θ = 41.4°-
43.5° range from 35.0 – 57.5 nm thick Ti1-xMgxN layers with x = 0-0.49, as labeled. The intensity
is plotted on a logarithmic scale and the scans are offset vertically for clarity purposes. All
patterns exhibit a Ti1-xMgxN 002 peak at 2θ = 42.1° - 42.5° and a MgO 002 substrate peak at 2θ
= 42.91°, corresponding to a lattice constant ao = 4.212 Å which is in agreement with the
published value from bulk MgO crystals [58]. All samples exhibit only these two peaks over the
entire measured 2θ = 10-85 range, indicating strong preferred 001 orientation of the Ti1-xMgxN
layers. The pattern from the TiN layer (x = 0.00) has a peak at 42.50°, corresponding to an out-
of-plane lattice constant a = 4.251 Å. This value is within the range of previously reported
values of 4.233-4.277 Å for epitaxial TiN/MgO(001) layers [8, 19-21, 41, 59, 60], with the
majority of values within a narrower range of 4.240-4.249 Å. We attribute the relatively large
out-of-plane lattice constant here to residual biaxial compressive stress which is affected by the
growth temperature and layer thickness, as discussed in detail below. The pattern also exhibits
Laue oscillations (layer thickness fringes) which indicate a relatively high crystalline quality and
provide a value for the TiN layer thickness of 55 nm, determined using <D>Laue = /(2sinθi+1 –
2sinθi ), where is the x-ray wavelength and θi+1 and θi are angles of two adjacent maxima or
minima [61]. This thickness value is in good agreement with d = 54.4 nm obtained from XRR
measurements. The alloy film with x = 0.12 yields a similar XRD pattern as for pure TiN. The

5
layer peak is slightly shifted to the left to 2θ = 42.47, corresponding to a lattice parameter in the
growth direction of a = 4.253 Å, and the Laue oscillations indicate a thickness of 47 nm, in
reasonable agreement with 49.0 nm from XRR. Increasing the Mg concentration further to x =
0.19, 0.26, 0.39, 0.45 and 0.49 leads to a continuous peak shift to smaller 2θ-values of 42.41°,
42.36°, 42.25°, 42.16°, and 42.10°, corresponding to an increasing a = 4.259, 4.264, 4.274,
4.284, and 4.289 Å, respectively. This increase is expected based on the predicted lattice
constant of rock-salt structure MgN (4.34-4.44 Å) which is 2-4% larger than that for TiN [62], as
discussed more quantitatively below. The Laue oscillations are well developed for x 0.26,
have a reduced amplitude for x = 0.39, and cannot be resolved for x = 0.45 and 0.49. In addition,
the layers with a large Mg content also have a broader and less intense Ti1-xMgxN 002 peak.
More specifically, the peak intensity from layers with x = 0.39, 0.45 and 0.49 is 2.7, 17 and 41
times weaker than that for pure TiN, respectively, and the peak full-width at half-maximum
(FWHM) increases from 2 = 0.15° for x = 0.39 to 2 = 0.19° and 0.32° for x = 0.45 and 0.49,
indicating a decreasing crystalline quality which is attributed to a decreasing phase stability as
the Mg-to-Ti ratio approaches unity [13].
Figure 1(b) shows a typical XRD ω rocking curve for the 002 reflection from the
Ti0.55Mg0.45N layer, which is obtained using a constant 2θ = 42.16°. Its FWHM of ω = 0.08° is
quite small in comparison to other epitaxial rock-salt structure nitrides with reported values
ranging from 0.14 – 2.20° [21, 23, 28-30, 34, 38, 42], indicating strong crystalline alignment of
the Ti0.55Mg0.45N 001 planes. The rocking curve width remains relatively small for all layers with
x ≤ 0.45, with ω = 0.06°, 0.07°, 0.04°, 0.03°, 0.06°, and 0.08° for x = 0, 0.12, 0.19, 0.26, 0.39,
and 0.45, respectively. The smallest ω value in this list is from the Ti0.74Mg0.26N layer which
correspondingly also exhibits the largest peak intensity in Fig. 1(a). In contrast, the Ti0.51Mg0.49N
layer has a much larger ω = 0.50°, indicating lattice distorting strain fields in this layer which
has a composition close to the phase separation limit [12, 13], which is attributed to rock-salt
structure MgN not being a thermodynamically stable phase such that an increasing x causes
compositional variations and/or the nucleation of alternative phases. The general trend of a
decreasing crystalline quality for Mg rich layers is also consistent with the increasing 2 shown
in Fig. 1(a).
Figure 1(c) shows a typical XRD φ-scan of the asymmetric 111 reflections from a
Ti0.55Mg0.45N layer. It is acquired using a 54.74° offset in χ and fixed 2θ = 36.30° and ω = 18.15°
to detect 111 reflections of the Ti0.55Mg0.45N layer by recording the reflected intensity as a
function of the azimuthal angle φ. The plot shows four equally spaced peaks labeled as 111, 111,
1 1, and 1, indicating that the layer has a single in-plane orientation. Fig. 1(c) also includes a
φ-scan from the same sample, however, with ω and 2θ adjusted to detect the substrate MgO 111
reflections. This scan exhibits four peaks that are 102 times more intense but occur at the same φ
values as for the Ti0.55Mg0.45N 111 reflections. This shows, in combination with the results from
Figs. 1(a) and (b), that the Ti0.55Mg0.45N layer exhibits a cube-on-cube epitaxial relationship with
the substrate: (001)TiMgN ||(001)MgO and [100]TiMgN ||[100]MgO. Similar XRD φ-scans were
obtained also for the other samples, confirming that all layers in this study are epitaxial single
crystals.
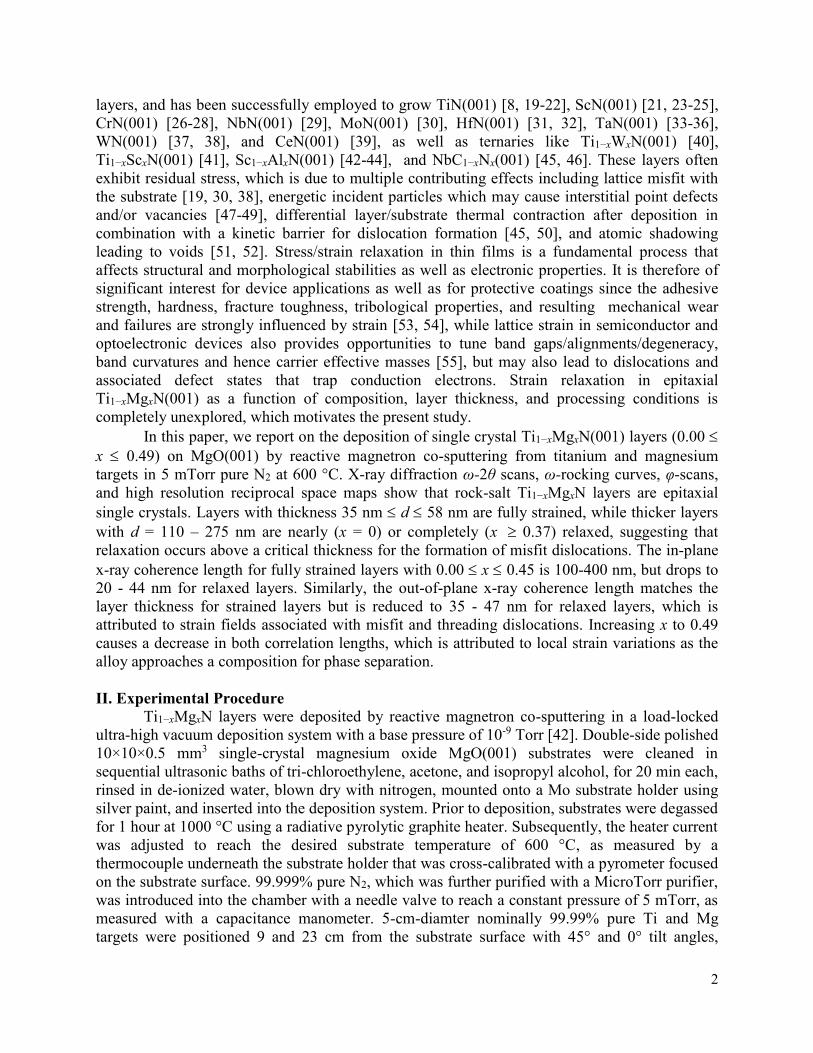
Figure 2 shows three typical high-resolution XRD reciprocal space maps acquired about
asymmetric 113 reflections from Ti1−xMgxN(001)/MgO(001) layers with x = 0.00, 0.26, and 0.39
and thickness d = 54.4, 52.0, and 57.5 nm, respectively. The plot shows color filled iso-intensity
contour maps in a logarithmic scale, plotted within k-space where k = 2sinθcos(ω-θ)/λ and k|| =
1 11
6
2sinθsin(ω-θ)/λ correspond to directions perpendicular and parallel to the substrate surface along
perpendicular [001] and [110] directions, respectively, as indicated by the labeled arrows. The
plot also includes a scale bar in units of reciprocal length and arrows indicating the experimental
ω-2θ and ω scan directions. The strong peaks labeled “MgO” are due to MgO 113 substrate
reflections, while the lower peaks are from Ti1−xMgxN 113. Some of the MgO 113 reflections
indicate double or triple peaks and/or shoulders which originate from different domains in the
substrates and are common for commercially available magnesium oxide single crystals [63]. We
also note that the broadening of the MgO 113 peak along the ω-direction is associated with
small-angle grain boundaries in the single crystal substrates while the elongation from the top-
left toward the bottom-right are intrinsic resolution streaks coming from the Ge(220) crystals in
the hybrid monochromator [64].
The out-of-plane a and in-plane a|| lattice constants are determined from the peak
positions with k = 7.122 nm-1 and k|| = 3.357 nm-1 for the MgO substrate and k = 7.053 nm-1 and
k|| = 3.358 nm-1 for the pure TiN (x = 0.00) layer, yielding a = a|| = 4.212 0.001 Å for MgO
and a = 3/k = 4.254 0.001 Å and a|| = 2 /k|| = 4.211 0.001 Å for the TiN layer. Those
values are consistent with the out-of-plane lattice parameters of 4.212 0.001 Å and 4.251
0.001 Å for MgO and TiN respectively, determined from ω-2θ scans shown in Fig. 1. The TiN
in-plane lattice parameter matches, within the experimental uncertainty, the MgO lattice constant.
This indicates that the TiN layer is fully strained, that is, its lattice is coherent with that of the
substrate, which is also directly evident from the vertical alignment of the MgO and TiN 113
reflections in Fig. 2(a), indicating the same k|| value for MgO and TiN. The elliptical shape of the
TiN 113 reflection in reciprocal space can be described by peak broadening along the two
primary directions k and k||, which are rotated by 25.24 from the experimental ω-2θ and ω
scanning directions. The broadening along k is attributed to local strain variations along the
growth direction as well as the finite layer thickness, while broadening along k|| is primarily due
to the mosaic spread, that is, the misalignment of crystallites which are single crystal blocks
within the epitaxial TiN layer. The full-width at half-maximum peak widths are Δk = 0.018
nm-1 and Δk|| = 0.006 nm-1. These values are in excellent agreement with Δk = 2 cosθ/ =
0.017 nm-1 and Δk|| = 2ωsinθ/ = 0.005 nm-1, determined using the peak width 2 and ω from
the symmetric ω-2θ and ω rocking curve scans of the TiN 002 reflection (Fig. 1).
The reciprocal space maps in the middle and right of Fig. 2 are from a Ti0.74Mg0.26N and a
Ti0.61Mg0.39N layer, respectively. Their Ti1−xMgxN 113 peaks are straight below the MgO 113
substrate peaks. This vertical alignment indicates that these layers are coherent with the substrate,
that is, they are fully strained with a|| = aMgO, like for the case of the pure TiN layer. However,
their Ti1−xMgxN 113 peaks are shifted downwards, indicating an increasing out-of-plane lattice
constant a which is attributed to an increasing relaxed lattice constant with increasing x, as
discussed below. The Ti1−xMgxN 113 peaks are vertically elongated, which is primarily attributed
to the finite layer thickness of 52.0 nm and 57.5 nm for the Ti0.74Mg0.26N and the Ti0.61Mg0.39N
layers, respectively. In addition, particularly the peak at the right bottom in Fig. 2 from the
Ti0.61Mg0.39N 113 reflection is also elongated along the ω direction. This is attributed to the
mosaicity of the substrate, as evident by the MgO 113 substrate reflection from this sample,
showing a prominent multi-peak feature. The reciprocal space maps for all seven samples with x
= 0.0-0.49 and d = 35.0-57.5 nm are qualitatively similar to those shown in Fig. 2. They indicate
fully strained Ti1−xMgxN layers and show a continuous downwards shift of the Ti1−xMgxN 113
peak with increasing x, indicating an increasing a, as summarized further below.

7
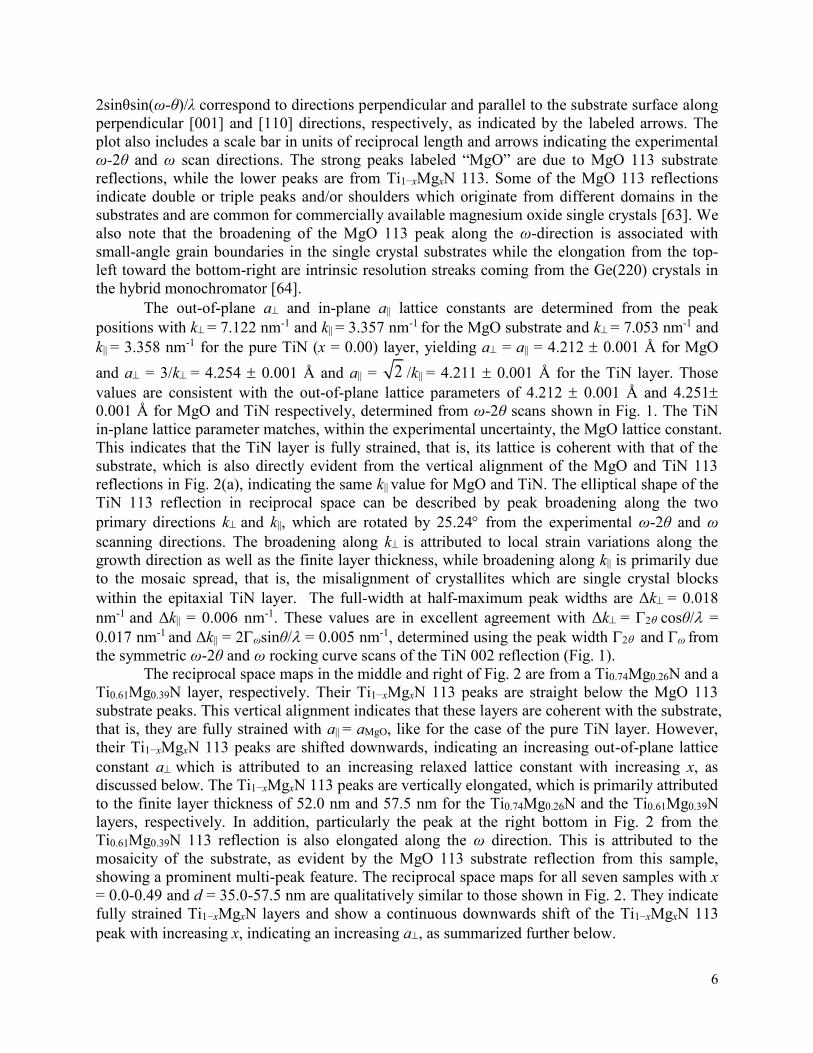
Reciprocal space maps from considerably thicker epitaxial Ti1−xMgxN(001) layers with d
= 110, 150, and 275 nm and x = 0.00, 0.37, and 0.49 are shown in Figure 3. The dashed lines
indicate 113 directions which extended from the origin to the upper right in the plot and
correspond to the experimental ω-2θ directions. Therefore, peaks which are centered on this line
emanate from a perfectly cubic crystal with identical perpendicular and parallel lattice constants
(a = a||). All MgO peaks are on the 113 lines, consistent with strain-free substrates, as expected.
In contrast, the center of the 113 peak from the TiN (x = 0) layer in the left panel of Fig. 3 is
slightly to the right of the 113 line, indicating that the layer is strained with a > a||. More
specifically, the peak position provides values for a|| = 4.219 ± 0.008 Å and a = 4.243 ± 0.006 Å,
suggesting a mild compressive strain || = (a||/ao - 1) = -0.34%, where the relaxed lattice constant
ao is determined using ao = (a - νa + 2νa||)/(1 + ν) = 4.234 Å and ν is the Poisson’s ratio which
is assumed to be a composition-independent constant of 0.22 [46, 60]. This assumption has a
negligible effect on the plotted data since a change in ν from 0.22 to, for example, 0.25 causes a
correction in ao of only 0.02%. In addition, the TiN 113 peak is to the left of the MgO 113 peak,
indicating that a|| > aMgO. This is distinctly different from the map shown in Fig. 2 from the
thinner TiN(001) layer with d = 54.4 nm for which the 113 peak is vertically aligned with the
substrate peak, indicating a fully strained layer with a|| = aMgO. Thus, the 110-nm-thick TiN(001)
layer is partially relaxed, where the degree of relaxation R = (a|| - aMgO)/( ao - aMgO) = 31 %. We
note that the uncertainties in a|| and a are larger than for the d = 54.4 nm layer (Fig. 2), which is
due to the difficulty in accurately determining the center of the 113 reflection in the reciprocal
space map. The largest peak broadening is along the rocking-curve direction, which is
primarily attributed to the mosaic spread, that is, the misalignment of the single crystal blocks
within the TiN layer. The peak width ω = 0.27 can also be used to estimate an upper limit for
the total dislocation density disl ω2/(2ln2b2) = 6 109 cm-2 assuming uncorrelated
(randomly distributed) dislocations [65, 66] where b = aTiN/ 2 = 0.300 nm is the Burgers vector
along close-packed <110> directions in TiN.
The maps from the Ti1−xMgxN alloy layers with x = 0.37 and 0.49 in the middle and right
panels of Fig. 3 show that both the substrate and layer peaks are centered on the dashed 113 lines.
That is, these layers are fully relaxed (a = a||) within the experimental uncertainty. Analyzing the
peak positions yields a|| = 4.254 ± 0.005 Å and a = 4.259 ± 0.005 Å for the Ti0.63Mg0.37N layer
and a|| = 4.268 ± 0.005 Å and a = 4.275 ± 0.005 Å for the Ti0.51Mg0.49N layer. The a values
here agree well with 4.260 and 4.279 Å determined from XRD symmetric ω-2θ scans for layers
with x = 0.37 and 0.49, respectively [13]. These two peaks are broader than the 113 peak from
the TiN layer, indicating a larger mosaic spread. The measured ω = 0.60 and 0.73 yields an
estimated upper bound for the dislocation density of 3 1010 and 4 1010 cm-2 for x = 0.37 and
0.49, respectively. These values are approximately five times larger than for the TiN (x = 0) layer,
which we attribute to the larger lattice misfit with the substrate and a correspondingly larger
misfit dislocation density. The increasing misfit is evident in Fig. 3 from the increasing distance
between layer and substrate peaks with increasing x = 0 to 0.37 to 0.49, indicating an increasing
relaxed lattice constant for Ti1−xMgxN alloys, as discussed in the following.
Figure 4 is a plot of the out-of-plane a, in-plane a||, and relaxed ao lattice constants vs x =
0.0-0.49 in Ti1−xMgxN, as determined from XRD RSMs and ω-2θ scans from epitaxial layers
with d = 35-58 nm represented by circles and diamonds, and d = 110-275 nm represented by
triangles. The plot includes two datasets for a. The open diamond symbols indicate the values
obtained from the 002 peak position in ω-2θ scans as shown in Fig. 1(a), while the solid circles

8
are determined from the k values of the 113 reflection measured using RSMs such as those
shown in Fig. 2. There is good overall agreement between these two distinct measurements from
the same sample set with deviations of only 0.01-0.15%. The a values increase with increasing
x, indicating an increasing lattice constant with increasing Mg content, as mentioned above and
discussed below. In contrast, the plotted a|| is independent of x within the experimental
uncertainty, ranging from 4.211-4.214 Å. That is, the measured a|| is identical (± 0.03% variation)
to the lattice constant of the substrate aMgO = 4.211 Å, consistent with these layers being fully
strained. The in-plane biaxial compressive strain || = (a||/ao)-1 increases from -0.64% for TiN, to
|| =-0.65%, -0.69%, -0.78%, -0.85%, -1.1%, and -1.3% for layers with x = 0.12, 0.19, 0.26, 0.39,
0.45, and 0.49, respectively.
The plotted blue circles in Fig. 4 represent the ao values of the fully strained 35-58 nm
thick layers, while the triangles are from the d = 110-275 nm layers. The ao continuously
increases from 4.238 Å for TiN to ao = 4.241, 4.242, 4.247, 4.250, 4.258 and 4.265 Å for the thin
layers with x = 0.12, 0.19, 0.26, 0.39, 0.45 and 0.49, respectively, and from 4.234 to 4.257 to
4.273 Å for the thicker layers with x = 0, 0.37 and 0.49. The two data sets are in good agreement,
with small deviations of 0.11-0.24 % which approximately match the experimental uncertainty
associated with both XRD measurements and compositional analyses. They indicate a positive
curvature of ao vs x. This trend is quantified by fitting ao with a bowing expression ao = (1-x)aTiN
+ xaMgN – bx(1-x), as shown as dashed line in Fig. 4, indicating a negative deviation from
Vegard’s law as previously reported for Ti1−xMgxN [13]. The fitting yields a bowing parameter b
= 0.113 Å, and lattice constants for the binaries of aTiN = 4.239 Å and aMgN = 4.345 Å. The
former value is in good agreement with 4.2386 and 4.2397 Å, the reported lattice parameter from
epitaxial TiN(001)/MgO(001) deposited by reactive magnetron sputtering at low temperature and
700 °C, respectively [48, 60], while our extrapolated value of 4.345 Å for the rocksalt-structure
MgN is in the range 4.34-4.46 Å from theoretical predictions [12, 62]. The plotted ao from the
Ti1−xMgxN alloys with 0 ≤ x ≤ 0.49 are 0.4 to 1.2 % smaller than predictions from first principles
calculations [12], which is primarily attributed to overestimated lattice constants in the
simulations caused by the generalized gradient approximation. Our values are also 0.3 to 0.6%
smaller than the out-of-plane lattice constants reported by Fenker et al [1], and 0.5 to 0.9%
smaller than the values by Balzer et al [2], indicating that the polycrystalline Ti1−xMgxN layers in
these studies may have been in a state of compressive strain.
Figure 5 shows plots of the out-of-plane and in-plane || x-ray coherence lengths as a
function of x in Ti1−xMgxN(001) layers. The plotted coherence lengths are from both sample sets,
distinguished by red and blue symbols for thin and thick layers, respectively, and determined
from symmetric 002 and asymmetric 113 reflections indicated by circles and diamonds. More
specifically, the full-width at half-maximum peak intensities and 2 from Ti1−xMgxN 002
reflections along the rocking curve and -2 scan directions yield coherence lengths || =
/(2 sin) and = /(2 cos), while the peak widths k|| and k of Ti1−xMgxN 113
reflections in the reciprocal space maps yield alternative coherence length values determined
using || = 1/k|| and = 1/k. The two independent methods are in excellent agreement, as
indicated by the overlapping circles and diamonds, with deviations of 0-15% for all layers with x
≤ 0.39 but larger deviations for x = 0.45 and 0.49 due to the experimental uncertainty (see error
bars) associated with weaker x-ray diffraction peaks for the layers with a large Mg content.
The plotted coherence length along the growth direction from the fully stained layers
(d ≤ 58 nm) has values ranging from 30-63 nm and nearly perfectly replicates the layer thickness
which is also plotted in Fig. 5(a) as open triangles. This shows that is limited by the layer

9
thickness and that effects from possible crystalline defects and strain variations along the growth
direction are below the detection limit [50]. A quantitative comparison of from both methods
and d indicates that is slightly higher (4% to 22%) than d, except for the sample with the
highest Mg-content x = 0.49, for which is 18% below d. This suggests a decreasing crystalline
quality as x approaches the critical composition for phase separation, as stated above and
consistent with the decreasing XRD peak intensity in Fig. 1(a). This becomes more evident from
the || vs x plot for the strained layers: || shows no clear trend as a function of composition, with
values ranging from 100-400 nm for x ≤ 0.45, indicating no reduction in the crystalline quality as
Mg is added to TiN. However, || drops by an order of magnitude to 30 nm for x = 0.49,
suggesting a fast reduction in the distance between threading and misfit dislocations and
confirming the deterioration of the crystalline quality as x approaches 0.5. The x-ray coherence
lengths of thick layers are considerably smaller than of the thin layers: [blue symbols in Fig.
5(a)] is 1.4, 3.2 and 7.9 times smaller than d (blue open triangles) for x = 0.0, 0.37 and 0.49,
respectively, while || = 44, 23, and 20 nm [blue symbols in Fig. 5(b)] are by up to an order of
magnitude smaller than for the corresponding thin layers. This is directly attributed to the
relaxation of the thick layers, which introduces misfit and associated threading dislocations
which reduce the measured x-ray coherence lengths.
As a last point, we discuss the distinct differences between the thin (d ≤ 58 nm) and thick
(d ≥ 110 nm) layers, that is, the transition from fully strained to relaxed layers with increasing d.
Relaxation is facilitated by threading dislocation glide, which causes an increase in the average
misfit dislocation line length as well as possible dislocation multiplications. It is well known that
thin epitaxial layers are expected to grow fully coherent with the substrate if their strain energy is
smaller than the energy of the misfit dislocations that would be required to relax the strain [67,
68]. The total elastic energy for a given strain is proportional to the film thickness d, resulting in
an increasing driving force for strain relaxation with increasing d. Correspondingly, there is a
critical minimum thickness hc for relaxation as defined by the Matthew-Blakeslee formula [69]
ln 18 (1 )
cc
f
b hh
b
, (1)
where the magnitude of the Burgers vector along the close-packed <110> directions in
Ti1−xMgxN is b = ao/ 2 = 3.00 Å, and the Poission’s ratio of Ti1−xMgxN can be approximated
as ν = 0.22, based on the reported value for TiN [46, 60]. For pure TiN (x = 0), the lattice
mismatch with the MgO substrate f = aTiN/aMgO - 1 = 0.68%, calculated from the measured and
reported room-temperature aTiN = 4.240 Å [70] and aMgO = 4.2112 Å [71]. This mismatch
decreases with increasing temperature, reaching just 0.23% at the growth temperature Ts = 600 ±
50 °C, as determined using the thermal expansion coefficients of 9.35×10⁻⁶ K-1 for TiN [70] and
13×10-6 K-1 for MgO [71]. Applying Eq. (1) yields then hc = 23 nm for TiN/MgO at 600 °C.
However, hc decreases to 5.6 nm when the sample is cooled to room temperature, consistent with
a previously reported value of 6.5 nm [72]. Our TiN(001) layer with d = 54.4 nm is fully strained
and the thicker layer with d = 110 nm is partially relaxed, as shown in Figs. 2 and 3. This
suggests that the experimental hc for TiN is somewhere between 54 and 110 nm, which is larger
than the hc estimates from Eq. (1). We attribute this disagreement to kinetic barriers for
dislocation formation. More specifically, TiN grows fully coherent on MgO(001) at 600 °C, even
if its thickness is approximately twice the estimated critical thickness hc = 23 nm. During
subsequent cooling, hc decreases to 5.6 nm which is 10 times smaller than d. Nevertheless, the

10
layer remains fully strained. We attribute this to the limited growth temperature (26% of the TiN
melting point of 3222 K [20]) and the even lower temperature during cooling, which are
insufficient to nucleate and grow misfit dislocations. This argument is consistent with reports
showing that 300-nm-thick epitaxial TiN/MgO(001) layers are fully strained if deposited at low
temperature ( 420 °C) using high-flux low-energy ion irradiation during growth [48], while TiN
layers grown at elevated temperatures with equivalent thickness are either partially relaxed (Ts =
700 °C) [60] or fully relaxed (Ts = 700-850 °C) [48]. Increasing x in Ti1-xMgxN alloys from 0 to
0.49 causes an increase in the room-temperature lattice misfit with MgO from f = 0.68% to
1.1%. Correspondingly, the estimate for hc decreases from 5.6 to 2.9 nm. These values are well
below d = 35-58 nm of all fully strained layers in our study. Thus, similar to the argument above,
we attribute the suppression of relaxation to kinetic barriers for misfit dislocation formation
and/or growth. In addition to the kinetic barriers present in TiN, the random distribution of
cations in the Ti1-xMgxN alloy layers and the associated strain fields may contribute to the
suppression of easy glide of threading dislocations which, in turn, inhibits the growth of misfit
dislocations and layer relaxation, despite the increasing strain energy with increasing x. Thus, in
summary, the experimentally determined critical thickness for relaxation of epitaxial
Ti1−xMgxN(001)/MgO(001) is between 35 and 110 nm, which is 10-20 times larger than 2.9-5.6
nm estimated using the Matthew-Blakeslee formula. This is attributed to kinetic barriers where
the limited growth/cooling temperatures and possible strain fields in the alloy delay/inhibit stress
relaxation through dislocation nucleation and glide.
IⅤ. Conclusions Ti1−xMgxN layers deposited on MgO(001) by reactive magnetron co-sputtering at 600 °C
are epitaxial single crystals with a cube-on-cube relationship with their substrates:
(001)TiMgN║(001)MgO and [100]TiMgN║[100]MgO. Layers with thickness 35-58 nm are fully
strained, while layers with d ≥ 110 nm are partially (x = 0) or fully (x = 0.37 and 0.49) relaxed.
This indicates a critical thickness for relaxation between 35 and 110 nm, which is an order of
magnitude larger than equilibrium predictions of 2.9-5.6 nm, suggesting kinetic barriers for
misfit dislocation nucleation and/or growth that limits relaxation during layer growth at 600 °C
and during subsequent cooling to room temperature. The relaxed lattice parameter determined
from XRD RSMs is in good agreement between the thin and thick layers and increases according
to ao = (1-x)aTiN + xaMgN – bx(1-x), where aTiN = 4.239 Å, aMgN = 4.345 Å, and the bowing
parameter b = 0.113 Å. The in-plane x-ray coherence length of fully strained layers is large (100
nm || 400 nm) for 0.00 x 0.45 but drops to || = 30 nm for x = 0.49, while is 4-22%
larger than d for 0.00 x 0.45 but 18% smaller than d for x = 0.49. This indicates local strain
variations and a decreasing crystalline quality as x approaches the critical composition for phase
separation. Relaxed layers with d ≥ 110 nm also exhibit an approximately 10-fold reduced ||
which is attributed to strain relaxation that results in misfit and associated threading dislocations.
Acknowledgements
The authors acknowledge financial support by the National Science Foundation under
Grant Nos. 1712752 and 1629230.

11
Figures
Figure 1: X-ray diffraction (a) ω-2θ scans, (b) ω rocking curve of the 002 reflection, and (c) φ-
scan of 111 reflections from Ti1−xMgxN(001) layers grown on MgO(001) with thickness d = 35-
58 nm.

12
Figure 2: Representative RSMs about asymmetric 113 reflections from three 52 to 58 nm thick
Ti1−xMgxN(001) layers with x = 0, 0.26 and 0.39.
Figure 3: Representative RSMs about asymmetric 113 reflections from three 100 nm thick
Ti1−xMgxN(001) layers with x = 0, 0.37 and 0.49.

13
Figure 4: Out-of-plane aꞱ, in-plane a||, and relaxed ao lattice constants obtaining from RSMs (red,
magenta and blue circles) and aꞱ obtained from ω-2θ scans (red open diamonds) vs Mg content x
in fully-strained Ti1−xMgxN(001) layers grown on MgO(001) with d ≤ 58 nm. The blue triangles
show ao from relaxed Ti1−xMgxN(001) layers with d ≥ 110 nm.

14
Figure 5: The (a) out-of-plane and (b) in-plane || x-ray coherence lengths from fully stained
(red) and relaxed (blue) Ti1−xMgxN(001) layers grown on MgO(001), determined from ω-2θ and
ω scans of 002 reflections (circles) and from RSMs of 113 reflections (diamonds). The layer
thickness is indicated by triangles in (a).

15
References [1] M. Fenker, M. Balzer, H. Kappl, O. Banakh, Some properties of (Ti,Mg)N thin films
deposited by reactive dc magnetron sputtering, Surf. Coat. Technol. 200 (2005) 227-231,
http://dx.doi.org/10.1016/j.surfcoat.2005.01.075.
[2] M. Balzer, M. Fenker, H. Kappl, T. Müller, A. Heyn, A. Heiss, A. Richter, Corrosion
protection of steel substrates by magnetron sputtered TiMgN hard coatings: Structure,
mechanical properties and growth defect related salt spray test results, Surf. Coat. Technol. 349
(2018) 82-92, https://doi.org/10.1016/j.surfcoat.2018.05.037.
[3] A. Hodroj, O. Chaix-Pluchery, P. Steyer, J.F. Pierson, Oxidation resistance of decorative
(Ti,Mg)N coatings deposited by hybrid cathodic arc evaporation-magnetron sputtering process,
Surf. Coat. Technol. 205 (2011) 4547-4553, http://dx.doi.org/10.1016/j.surfcoat.2011.03.116.
[4] M. Fenker, M. Balzer, H. Kappl, Corrosion behaviour of decorative and wear resistant
coatings on steel deposited by reactive magnetron sputtering – Tests and improvements, Thin
Solid Films 515 (2006) 27-32, http://dx.doi.org/10.1016/j.tsf.2005.12.020.
[5] S. Onder, F.N. Kok, K. Kazmanli, M. Urgen, Magnesium substituted hydroxyapatite
formation on (Ti,Mg)N coatings produced by cathodic arc PVD technique, Mater. Sci. Eng. C 33
(2013) 4337-4342, http://dx.doi.org/10.1016/j.msec.2013.06.027.
[6] J.E. Sundgren, Structure and properties of TiN coatings, Thin Solid Films 128 (1985) 21-44,
http://dx.doi.org/10.1016/0040-6090(85)90333-5.
[7] J. Musil, Hard and superhard nanocomposite coatings, Surf. Coat. Technol. 125 (2000) 322-
330, http://dx.doi.org/10.1016/S0257-8972(99)00586-1.
[8] C.-S. Shin, D. Gall, N. Hellgren, J. Patscheider, I. Petrov, J.E. Greene, Vacancy hardening in
single-crystal TiNx(001) layers, J. Appl. Phys. 93 (2003) 6025-6028,
https://doi.org/10.1063/1.1568521.
[9] K. Balasubramanian, S.V. Khare, D. Gall, Valence electron concentration as an indicator for
mechanical properties in rocksalt structure nitrides, carbides and carbonitrides, Acta Mater. 152
(2018) 175-185, https://doi.org/10.1016/j.actamat.2018.04.033.
[10] Z.T.Y. Liu, X. Zhou, S.V. Khare, D. Gall, Structural, mechanical and electronic properties
of 3d transition metal nitrides in cubic zincblende, rocksalt and cesium chloride structures: a
first-principles investigation, J. Phys. Condensed Matter 26 (2014) 025404,
https://doi.org/10.1088/0953-8984/26/2/025404.
[11] Z.T.Y. Liu, D. Gall, S.V. Khare, Electronic and bonding analysis of hardness in pyrite-type
transition-metal pernitrides, Phys. Rev. B 90 (2014) 134102,
https://doi.org/10.1103/PhysRevB.90.134102.
[12] B. Alling, Metal to semiconductor transition and phase stability of Ti(1-x)Mg(x)Ny alloys
investigated by first-principles calculations, Phys. Rev. B 89 (2014) 085112,
https://doi.org/10.1103/PhysRevB.89.085112.
[13] B. Wang, S. Kerdsongpanya, M.E. McGahay, E. Milosevic, P. Patsalas, D. Gall, Growth
and properties of epitaxial Ti1−xMgxN(001) layers, J. Vac. Sci. Technol. A 36 (2018) 061501,
https://doi.org/10.1116/1.5049957.
[14] B. Wang, D. Gall, A new semiconductor: Ti0.5Mg0.5N(001), 2018 IEEE Nanotechnology
Symposium (ANTS), Albany, NY, 2018. https://doi.org/10.1109/NANOTECH.2018.8653564.
[15] C. Metaxa, S. Kassavetis, J.F. Pierson, D. Gall, P. Patsalas, Infrared Plasmonics with
Conductive Ternary Nitrides, ACS Appl. Mater. Interfaces 9 (2017) 10825-10834,
https://doi.org/10.1021/acsami.6b16343.

16
[16] S. Kassavetis, A. Hodroj, C. Metaxa, S. Logothetidis, J.F. Pierson, P. Patsalas, Optical and
electronic properties of conductive ternary nitrides with rare- or alkaline-earth elements, J. Appl.
Phys. 120 (2016) 225106, https://doi.org/10.1063/1.4971407.
[17] S. Ishii, R.P. Sugavaneshwar, T. Nagao, Titanium Nitride Nanoparticles as Plasmonic Solar
Heat Transducers, J. Phys. Chem. C 120 (2016) 2343-2348,
https://doi.org/10.1021/acs.jpcc.5b09604.
[18] R. Koch, Intrinsic stress of ultrathin epitaxial films, Appl. Phys. A 69 (1999) 529-536,
https://doi.org/10.1007/s003390051462.
[19] J.S. Chawla, X.Y. Zhang, D. Gall, Epitaxial TiN(001) wetting layer for growth of thin
single-crystal Cu(001), J. Appl. Phys. 110 (2011) 043714, https://doi.org/10.1063/1.3624773.
[20] M.A. Wall, D.G. Cahill, I. Petrov, D. Gall, J.E. Greene, Nucleation kinetics during
homoepitaxial growth of TiN(001) by reactive magnetron sputtering, Phys. Rev. B 70 (2004)
035413, https://doi.org/10.1103/PhysRevB.70.035413.
[21] D. Gall, I. Petrov, P. Desjardins, J.E. Greene, Microstructural evolution and Poisson ratio of
epitaxial ScN grown on TiN(001)/MgO(001) by ultrahigh vacuum reactive magnetron sputter
deposition, J. Appl. Phys. 86 (1999) 5524-5529, https://doi.org/10.1063/1.371555.
[22] B.O. Johansson, J.E. Sundgren, J.E. Greene, A. Rockett, S.A. Barnett, Growth and
properties of single crystal TiN films deposited by reactive magnetron sputtering, J. Vac. Sci.
Technol. A 3 (1985) 303-307, https://doi.org/10.1116/1.573255.
[23] R. Deng, B.D. Ozsdolay, P.Y. Zheng, S.V. Khare, D. Gall, Optical and transport
measurement and first-principles determination of the ScN band gap, Phys. Rev. B 91 (2015)
045104, https://doi.org/10.1103/PhysRevB.91.045104.
[24] H.A. Al-Brithen, A.R. Smith, D. Gall, Surface and bulk electronic structure of ScN(001)
investigated by scanning tunneling microscopy/spectroscopy and optical absorption spectroscopy,
Phys. Rev. B 70 (2004) 045303, https://doi.org/10.1103/PhysRevB.70.045303.
[25] D. Gall, I. Petrov, L.D. Madsen, J.-E. Sundgren, J.E. Greene, Microstructure and electronic
properties of the refractory semiconductor ScN grown on MgO(001) by ultra-high-vacuum
reactive magnetron sputter deposition, J. Vac. Sci. Technol. A 16 (1998) 2411-2417,
https://doi.org/10.1116/1.581360.
[26] X.Y. Zhang, D. Gall, CrN electronic structure and vibrational modes: An optical analysis,
Phys. Rev. B 82 (2010) 045116, https://doi.org/10.1103/PhysRevB.82.045116.
[27] D. Gall, C.-S. Shin, T. Spila, M. Odén, M.J.H. Senna, J.E. Greene, I. Petrov, Growth of
single-crystal CrN on MgO(001): Effects of low-energy ion-irradiation on surface morphological
evolution and physical properties, J. Appl. Phys. 91 (2002) 3589-3597,
https://doi.org/10.1063/1.1446239.
[28] D. Gall, C.-S. Shin, R.T. Haasch, I. Petrov, J.E. Greene, Band gap in epitaxial NaCl-
structure CrN(001) layers, J. Appl. Phys. 91 (2002) 5882-5886,
https://doi.org/10.1063/1.1466528.
[29] K. Zhang, K. Balasubramanian, B.D. Ozsdolay, C.P. Mulligan, S.V. Khare, W.T. Zheng, D.
Gall, Growth and mechanical properties of epitaxial NbN(001) films on MgO(001), Surf. Coat.
Technol. 288 (2016) 105-114, https://doi.org/10.1016/j.surfcoat.2016.01.009.
[30] B.D. Ozsdolay, X. Shen, K. Balasubramanian, G. Scannell, L. Huang, M. Yamaguchi, D.
Gall, Elastic constants of epitaxial cubic MoNx(001) layers, Surf. Coat. Technol. 325 (2017)
572-578, http://dx.doi.org/10.1016/j.surfcoat.2017.07.015.

17
[31] H.-S. Seo, T.-Y. Lee, J.G. Wen, I. Petrov, J.E. Greene, D. Gall, Growth and physical
properties of epitaxial HfN layers on MgO(001), J. Appl. Phys. 96 (2004) 878-884,
https://doi.org/10.1063/1.1759783.
[32] H.-S. Seo, T.-Y. Lee, I. Petrov, J.E. Greene, D. Gall, Epitaxial and polycrystalline HfNx
(0.8⩽x⩽1.5) layers on MgO(001): Film growth and physical properties, J. Appl. Phys. 97 (2005)
083521, https://doi.org/10.1063/1.1870097.
[33] C.-S. Shin, Y.-W. Kim, N. Hellgren, D. Gall, I. Petrov, J.E. Greene, Epitaxial growth of
metastable δ-TaN layers on MgO(001) using low-energy, high-flux ion irradiation during
ultrahigh vacuum reactive magnetron sputtering, J. Vac. Sci. Technol. A 20 (2002) 2007-2017,
https://doi.org/10.1116/1.1513639.
[34] C.-S. Shin, D. Gall, Y.-W. Kim, P. Desjardins, I. Petrov, J.E. Greene, M. Odén, L. Hultman,
Epitaxial NaCl structure δ-TaNx(001): Electronic transport properties, elastic modulus, and
hardness versus N/Ta ratio, J. Appl. Phys. 90 (2001) 2879-2885,
https://doi.org/10.1063/1.1391214.
[35] C.-S. Shin, D. Gall, P. Desjardins, A. Vailionis, H. Kim, I. Petrov, J.E. Greene, M. Odén,
Growth and physical properties of epitaxial metastable cubic TaN(001), Appl. Phys. Lett. 75
(1999) 3808-3810, https://doi.org/10.1063/1.125463.
[36] C.S. Shin, Y.W. Kim, D. Gall, J.E. Greene, I. Petrov, Phase composition and microstructure
of polycrystalline and epitaxial TaNx layers grown on oxidized Si(001) and MgO(001) by
reactive magnetron sputter deposition, Thin Solid Films 402 (2002) 172-182,
https://doi.org/10.1016/S0040-6090(01)01618-2.
[37] C. Metaxa, B.D. Ozsdolay, T. Zorba, K. Paraskevopoulos, D. Gall, P. Patsalas, Electronic
and optical properties of rocksalt-phase tungsten nitride (B1-WN), J. Vac. Sci. Technol. A 35
(2017) 031501, https://doi.org/10.1116/1.4978030.
[38] B.D. Ozsdolay, C.P. Mulligan, M. Guerette, L. Huang, D. Gall, Epitaxial growth and
properties of cubic WN on MgO(001), MgO(111), and Al2O3(0001), Thin Solid Films 590
(2015) 276-283, https://doi.org/10.1016/j.tsf.2015.08.002.
[39] T.-Y. Lee, D. Gall, C.-S. Shin, N. Hellgren, I. Petrov, J.E. Greene, Growth and physical
properties of epitaxial CeN layers on MgO(001), J. Appl. Phys. 94 (2003) 921-927,
https://doi.org/10.1063/1.1579113.
[40] F. Tian, J. D’Arcy-Gall, T.-Y. Lee, M. Sardela, D. Gall, I. Petrov, J.E. Greene, Epitaxial
Ti1-xWxN alloys grown on MgO(001) by ultrahigh vacuum reactive magnetron sputtering:
Electronic properties and long-range cation ordering, J. Vac. Sci. Technol. A 21 (2003) 140-146,
http://dx.doi.org/10.1116/1.1525818.
[41] D. Gall, I. Petrov, J.E. Greene, Epitaxial Sc1−xTixN(001): Optical and electronic transport
properties, J. Appl. Phys. 89 (2001) 401-409, https://doi.org/10.1063/1.1329348.
[42] R. Deng, P.Y. Zheng, D. Gall, Optical and electron transport properties of rock-salt
Sc1−xAlxN, J. Appl. Phys. 118 (2015) 015706, http://dx.doi.org/10.1063/1.4923429.
[43] R. Deng, K. Jiang, D. Gall, Optical phonon modes in Al1−xScxN, J. Appl. Phys. 115 (2014)
013506, https://doi.org/10.1063/1.4861034.
[44] R. Deng, S.R. Evans, D. Gall, Bandgap in Al(1-x)ScxN, Appl. Phys. Lett. 102 (2013)
112103, https://doi.org/10.1063/1.4795784.
[45] K. Zhang, K. Balasubramanian, B.D. Ozsdolay, C.P. Mulligan, S.V. Khare, W.T. Zheng, D.
Gall, Epitaxial NbCxN1−x(001) layers: Growth, mechanical properties, and electrical resistivity,
Surf. Coat. Technol. 277 (2015) 136-143, http://dx.doi.org/10.1016/j.surfcoat.2015.07.025.

18
[46] K. Zhang, M. Wen, S. Wang, R.P. Deng, D. Gall, W.T. Zheng, Sputter deposited NbCxNy
films: Effect of nitrogen content on structure and mechanical and tribological properties, Surf.
Coat. Technol. 258 (2014) 746-753, http://dx.doi.org/10.1016/j.surfcoat.2014.07.086.
[47] R. Daniel, K.J. Martinschitz, J. Keckes, C. Mitterer, The origin of stresses in magnetron-
sputtered thin films with zone T structures, Acta Mater. 58 (2010) 2621-2633,
https://doi.org/10.1016/j.actamat.2009.12.048.
[48] T. Lee, H. Seo, H. Hwang, B. Howe, S. Kodambaka, J.E. Greene, I. Petrov, Fully strained
low-temperature epitaxy of TiN/MgO(001) layers using high-flux, low-energy ion irradiation
during reactive magnetron sputter deposition, Thin Solid Films 518 (2010) 5169-5172,
https://doi.org/10.1016/j.tsf.2010.04.028.
[49] K. Balasubramanian, S.V. Khare, D. Gall, Energetics of point defects in rocksalt structure
transition metal nitrides: Thermodynamic reasons for deviations from stoichiometry, Acta Mater.
159 (2018) 77-88, https://doi.org/10.1016/j.actamat.2018.07.074.
[50] P. Zheng, B.D. Ozsdolay, D. Gall, Epitaxial growth of tungsten layers on MgO(001), J. Vac.
Sci. Technol. A 33 (2015) 061505, https://doi.org/10.1116/1.4928409.
[51] C.M. Zhou, D. Gall, The structure of Ta nanopillars grown by glancing angle deposition,
Thin Solid Films 515 (2006) 1223-1227, https://doi.org/10.1016/j.tsf.2006.07.136.
[52] I. Petrov, P.B. Barna, L. Hultman, J.E. Greene, Microstructural evolution during film
growth, J. Vac. Sci. Technol. A 21 (2003) S117-S128, https://doi.org/10.1116/1.1601610.
[53] Y. Xi, K. Gao, X. Pang, H. Yang, X. Xiong, H. Li, A.A. Volinsky, Film thickness effect on
texture and residual stress sign transition in sputtered TiN thin films, Ceram. Int. 43 (2017)
11992-11997, https://doi.org/10.1016/j.ceramint.2017.06.050.
[54] G. Abadias, Y.Y. Tse, Determination of intrinsic stresses in textured and epitaxial TiN thin
films deposited by dual ion beam sputtering, Surf. Coat. Technol. 180-181 (2004) 33-40,
https://doi.org/10.1016/j.surfcoat.2003.10.137.
[55] V. Bellani, C. Bocchi, T. Ciabattoni, S. Franchi, P. Frigeri, P. Galinetto, M. Geddo, F.
Germini, G. Guizzetti, L. Nasi, M. Patrini, L. Seravalli, G. Trevisi, Residual strain measurements
in InGaAs metamorphic buffer layers on GaAs, Eur. Phys. J. B 56 (2007) 217-222,
https://doi.org/10.1140/epjb/e2007-00105-8.
[56] R.T. Haasch, T.-Y. Lee, D. Gall, J.E. Greene, I. Petrov, Epitaxial TiN(001) Grown and
Analyzed In situ by XPS and UPS. II. Analysis of Ar+ Sputter Etched Layers, Surf. Sci. Spectra
7 (2000) 204-212, https://doi.org/10.1116/1.1367596.
[57] N. Finnegan, R.T. Haasch, D. Gall, S. Kodambaka, J.E. Greene, I. Petrov, A Comparison of
Auger Electron Spectra from Stoichiometric Epitaxial TiN(001) After (1) UHV Cleaving and (2)
Ar+ Sputter Etching, Surf. Sci. Spectra 7 (2000) 93-100, https://doi.org/10.1116/1.1288178.
[58] D.K. Smith, H.R. Leider, Low-temperature thermal expansion of LiH, MgO and CaO, J.
Appl. Crystallogr. 1 (1968) 246-249, https://doi.org/10.1107/S0021889868005418.
[59] J.S. Chawla, X.Y. Zhang, D. Gall, Effective electron mean free path in TiN(001), J. Appl.
Phys. 113 (2013) 063704, https://doi.org/10.1063/1.4790136.
[60] C.-S. Shin, S. Rudenja, D. Gall, N. Hellgren, T.-Y. Lee, I. Petrov, J.E. Greene, Growth,
surface morphology, and electrical resistivity of fully strained substoichiometric epitaxial TiNx
(0.67⩽x<1.0) layers on MgO(001), J. Appl. Phys. 95 (2004) 356-362,
https://doi.org/10.1063/1.1629155.
[61] A.S. Ingason, F. Magnus, S. Olafsson, J.T. Gudmundsson, Morphology of TiN thin films
grown on MgO(001) by reactive dc magnetron sputtering, J. Vac. Sci. Technol. A 28 (2010) 912-
915, https://doi.org/10.1116/1.3357303.

19
[62] A. Droghetti, N. Baadji, S. Sanvito, MgN: A possible material for spintronic applications,
Phys. Rev. B 80 (2009) 235310, https://doi.org/10.1103/PhysRevB.80.235310.
[63] J.L. Schroeder, A.S. Ingason, J. Rosén, J. Birch, Beware of poor-quality MgO substrates: A
study of MgO substrate quality and its effect on thin film quality, J. Cryst. Growth 420 (2015)
22-31, https://doi.org/10.1016/j.jcrysgro.2015.03.010.
[64] A.B. Mei, M. Tuteja, D.G. Sangiovanni, R.T. Haasch, A. Rockett, L. Hultman, I. Petrov, J.E.
Greene, Growth, nanostructure, and optical properties of epitaxial VNx/MgO(001) (0.80 [less-
than-or-equal] x [less-than-or-equal] 1.00) layers deposited by reactive magnetron sputtering, J.
Mater. Chem. C 4 (2016) 7924-7938, https://doi.org/10.1039/C6TC02289H.
[65] M.A. Moram, M.E. Vickers, X-ray diffraction of III-nitrides, Rep. Prog. Phys. 72 (2009)
036502, https://doi.org/10.1088/0034-4885/72/3/036502.
[66] C.G. Dunn, E.F. Kogh, Comparison of dislocation densities of primary and secondary
recrystallization grains of Si-Fe, Acta Metall. 5 (1957) 548-554, https://doi.org/10.1016/0001-
6160(57)90122-0.
[67] R. Koch, The intrinsic stress of polycrystalline and epitaxial thin metal films, J. Phys.
Condensed Matter 6 (1994) 9519, https://doi.org/10.1088/0953-8984/6/45/005.
[68] M. Murakami, Deformation in thin films by thermal strain, J. Vac. Sci. Technol. A 9 (1991)
2469-2476, https://doi.org/10.1116/1.577258.
[69] J.W. Matthews, A.E. Blakeslee, Defects in epitaxial multilayers: I. Misfit dislocations, J.
Cryst. Growth 27 (1974) 118-125, https://doi.org/10.1016/S0022-0248(74)80055-2.
[70] K. Aigner, W. Lengauer, D. Rafaja, P. Ettmayer, Lattice parameters and thermal expansion
of Ti(CxN1−x), Zr(CxN1−x), Hf(CxN1−x) and TiN1−x from 298 to 1473 K as investigated by
high-temperature X-ray diffraction, J. Alloys. Compd. 215 (1994) 121-126,
https://doi.org/10.1016/0925-8388(94)90828-1.
[71] N.D. Landolt-Bornstein, Functional Relationships in Science and Technology, Group III 17
(1982)
[72] L. Hultman, M. Shinn, P.B. Mirkarimi, S.A. Barnett, Characterization of misfit dislocations
in epitaxial (001)-oriented TiN, NbN, VN, and (Ti,Nb) N film heterostructures by transmission
electron microscopy, J. Cryst. Growth 135 (1994) 309-317, https://doi.org/10.1016/0022-
0248(94)90757-9.