Embed Size (px)
Citation preview
Report Price: US$ 1250 (Single User)
Future of the Indian Defense Industry –
Market Attractiveness, Competitive
Landscape and Forecasts to 2020
Future of the Indian Defense Industry – Market Attractiveness, Competitive Landscape and Forecasts to 2020
2
Summary
“Future of the Indian Defense Industry – Market Attractiveness, Competitive Landscape and Forecasts to
2020” report offers the reader detailed analysis of the defense budget over the next five years. Alongside it
offers insights into the market opportunities and entry strategies adopted by foreign OEMs (original
equipment manufacturers) to gain a market share in the Indian defense industry.
The report provides detailed analysis of the current industry size and growth expectations during 2016-2020,
including highlights of the key growth stimulators. It also benchmarks the industry against key global markets
and provides detailed understanding of emerging opportunities in specific areas.
Key Findings
Between 2011 and 2015, the Indian defense budget increased at a CAGR of XX%, and is expected to
increase significantly, at a CAGR of XX% during the forecast period, to reach a value of US$XX billion by
2020. Prolonged unresolved border issues and rising tension with two neighboring nations, China and
Pakistan, is expected to fuel the defense budget in the coming years; in addition to the country’s need to
replace the aging and outdated military hardware and technology. The defense capital expenditure is
expected to increase from US$XX billion in 2015 to US$XX billion in 2019, at a CAGR of XX%.
Key Features and Benefits
The report provides detailed analysis of the Indian defense industry during 2011–2020, including the factors
that influence the military expenditure. It provides detailed expectations of growth rates and projected total
expenditure.
It provides the manufacturers with insights on market opportunities along with industry structure and
dynamics prevalent in the country. In addition, the report focuses on the regulations governing the Indian
defense industry and the potential market entry strategies with an expert analysis of the competitive
structure.
Future of the Indian Defense Industry – Market Attractiveness, Competitive Landscape and Forecasts to 2020
3
1. Market Attractiveness and Emerging Opportunities
1.1. Defense Market Size Historical and Forecast
1.1.1. Indian defense budget expected to be US$XX billion cumulatively over 2016-2020
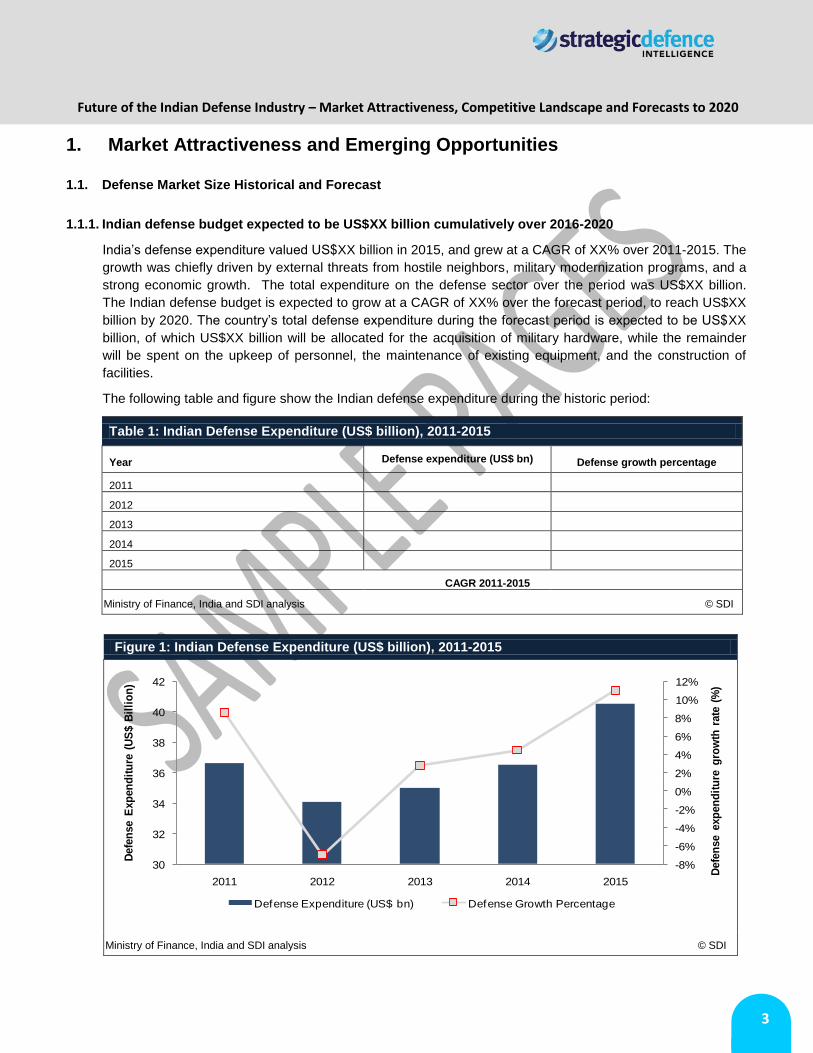
India’s defense expenditure valued US$XX billion in 2015, and grew at a CAGR of XX% over 2011-2015. The
growth was chiefly driven by external threats from hostile neighbors, military modernization programs, and a
strong economic growth. The total expenditure on the defense sector over the period was US$XX billion.
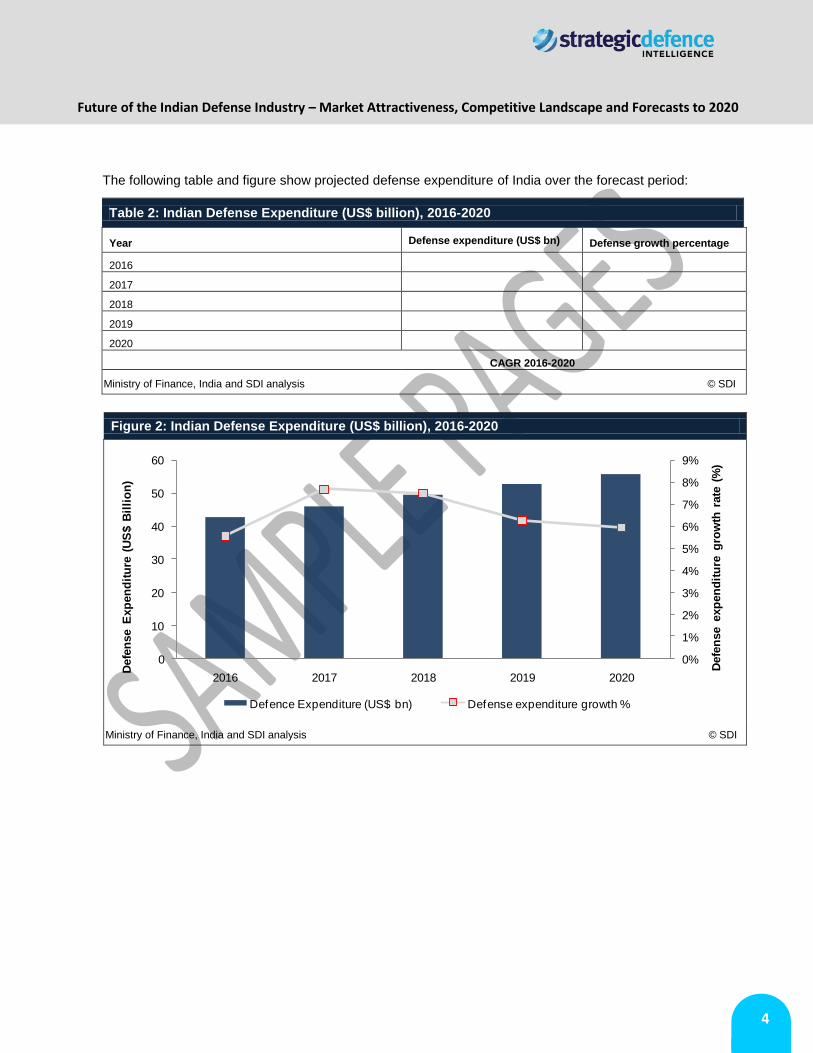
The Indian defense budget is expected to grow at a CAGR of XX% over the forecast period, to reach US$XX
billion by 2020. The country’s total defense expenditure during the forecast period is expected to be US$XX
billion, of which US$XX billion will be allocated for the acquisition of military hardware, while the remainder
will be spent on the upkeep of personnel, the maintenance of existing equipment, and the construction of
facilities.
The following table and figure show the Indian defense expenditure during the historic period:
Table 1: Indian Defense Expenditure (US$ billion), 2011-2015
Year Defense expenditure (US$ bn)
Defense growth percentage
2011
2012
2013
2014
2015
CAGR 2011-2015
Ministry of Finance, India and SDI analysis © SDI
Figure 1: Indian Defense Expenditure (US$ billion), 2011-2015
Ministry of Finance, India and SDI analysis © SDI
-8%
-6%
-4%
-2%
0%
2%
4%
6%
8%
10%
12%
30
32
34
36
38
40
42
2011 2012 2013 2014 2015
Defe
nse e
xp
en
dit
ure
gro
wth
rate
(%
)
Defe
nse E
xp
en
dit
ure
(U
S$ B
illi
on
)
Defense Expenditure (US$ bn) Defense Growth Percentage
Future of the Indian Defense Industry – Market Attractiveness, Competitive Landscape and Forecasts to 2020
4
The following table and figure show projected defense expenditure of India over the forecast period:
Table 2: Indian Defense Expenditure (US$ billion), 2016-2020
Year Defense expenditure (US$ bn)
Defense growth percentage
2016
2017
2018
2019
2020
CAGR 2016-2020
Ministry of Finance, India and SDI analysis © SDI
Figure 2: Indian Defense Expenditure (US$ billion), 2016-2020
Ministry of Finance, India and SDI analysis © SDI
0%
1%
2%
3%
4%
5%
6%
7%
8%
9%
0
10
20
30
40
50
60
2016 2017 2018 2019 2020
Defe
nse e
xp
en
dit
ure
gro
wth
rate
(%
)
Defe
nse E
xp
en
dit
ure
(U
S$ B
illi
on
)
Defence Expenditure (US$ bn) Defense expenditure growth %
Future of the Indian Defense Industry – Market Attractiveness, Competitive Landscape and Forecasts to 2020
5
1.2. Analysis of Defense Budget Allocation
1.2.1. Capital expenditure allocation expected to increase during the forecast period
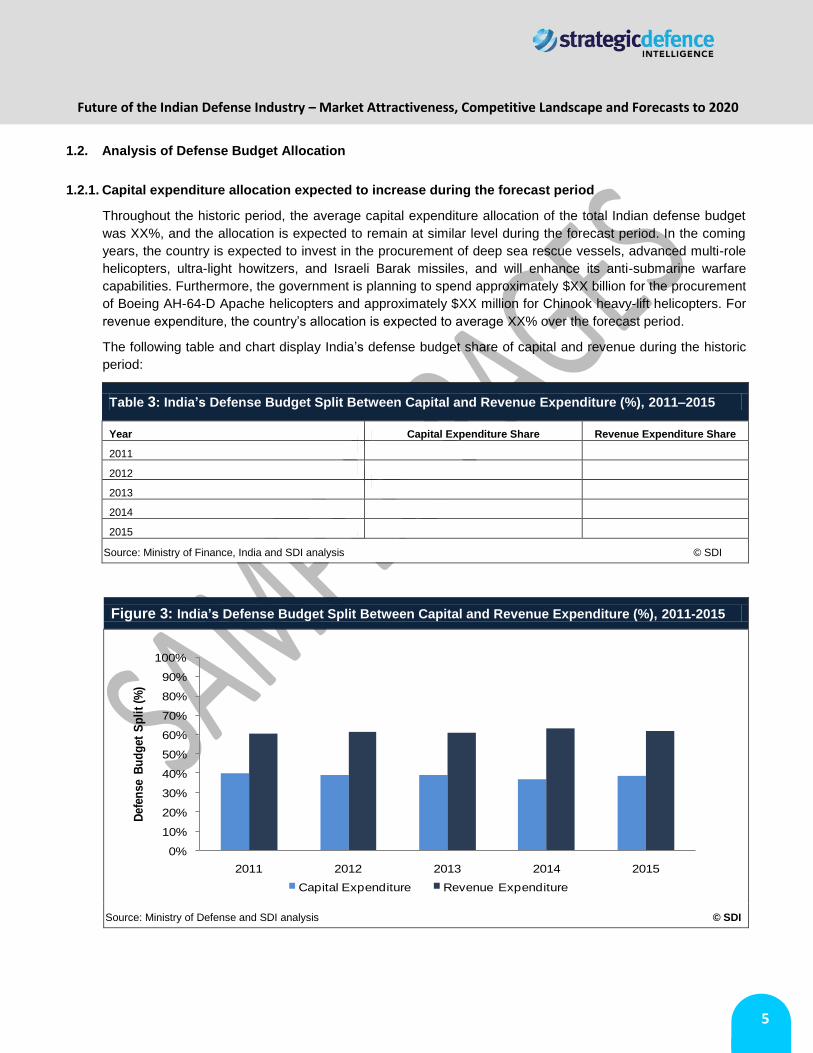
Throughout the historic period, the average capital expenditure allocation of the total Indian defense budget
was XX%, and the allocation is expected to remain at similar level during the forecast period. In the coming
years, the country is expected to invest in the procurement of deep sea rescue vessels, advanced multi-role
helicopters, ultra-light howitzers, and Israeli Barak missiles, and will enhance its anti-submarine warfare
capabilities. Furthermore, the government is planning to spend approximately $XX billion for the procurement
of Boeing AH-64-D Apache helicopters and approximately $XX million for Chinook heavy-lift helicopters. For
revenue expenditure, the country’s allocation is expected to average XX% over the forecast period.
The following table and chart display India’s defense budget share of capital and revenue during the historic
period:
Table 3: India’s Defense Budget Split Between Capital and Revenue Expenditure (%), 2011–2015
Year Capital Expenditure Share Revenue Expenditure Share
2011
2012
2013
2014
2015
Source: Ministry of Finance, India and SDI analysis © SDI
Figure 3: India’s Defense Budget Split Between Capital and Revenue Expenditure (%), 2011-2015
Source: Ministry of Defense and SDI analysis © SDI
0%
10%
20%
30%
40%
50%
60%
70%
80%
90%
100%
2011 2012 2013 2014 2015
Defe
nse B
ud
get
Sp
lit
(%)
Capital Expenditure Revenue Expenditure
Future of the Indian Defense Industry – Market Attractiveness, Competitive Landscape and Forecasts to 2020
6
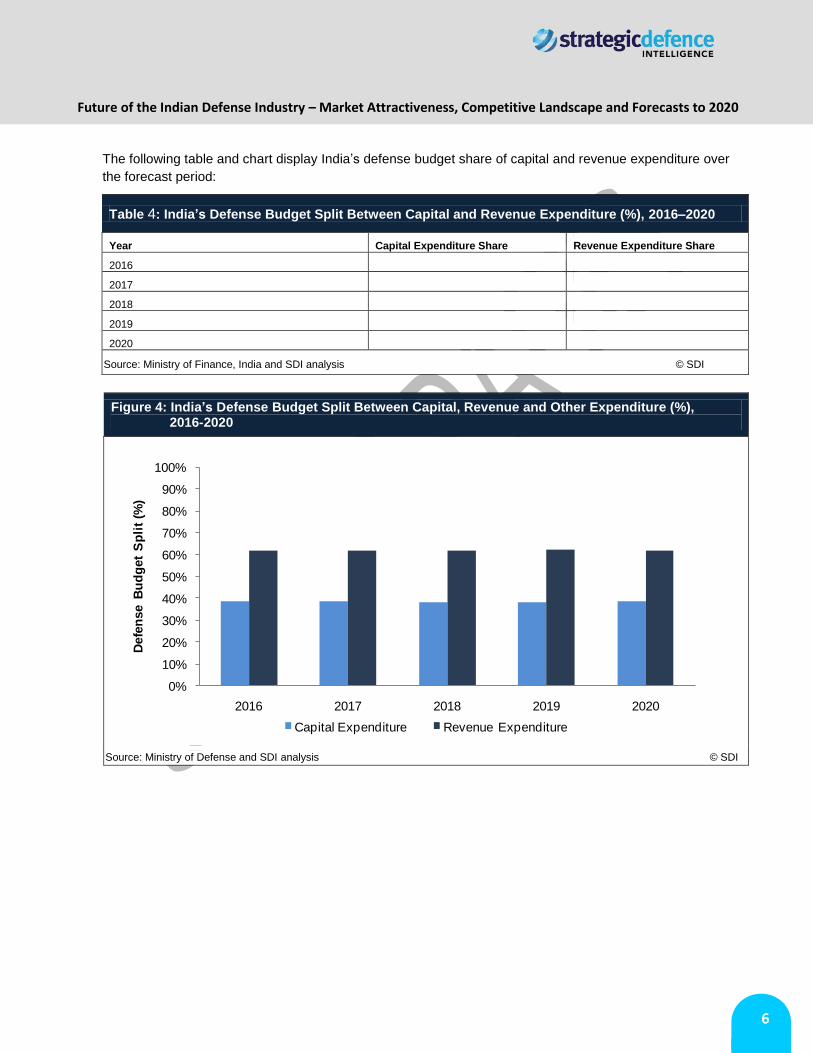
The following table and chart display India’s defense budget share of capital and revenue expenditure over
the forecast period:
Table 4: India’s Defense Budget Split Between Capital and Revenue Expenditure (%), 2016–2020
Year Capital Expenditure Share Revenue Expenditure Share
2016
2017
2018
2019
2020
Source: Ministry of Finance, India and SDI analysis © SDI
Figure 4: India’s Defense Budget Split Between Capital, Revenue and Other Expenditure (%), 2016-2020
Source: Ministry of Defense and SDI analysis © SDI
0%
10%
20%
30%
40%
50%
60%
70%
80%
90%
100%
2016 2017 2018 2019 2020
Defe
nse B
ud
get
Sp
lit
(%)
Capital Expenditure Revenue Expenditure
Future of the Indian Defense Industry – Market Attractiveness, Competitive Landscape and Forecasts to 2020
7
1.3. Homeland Security Market Size and Forecast
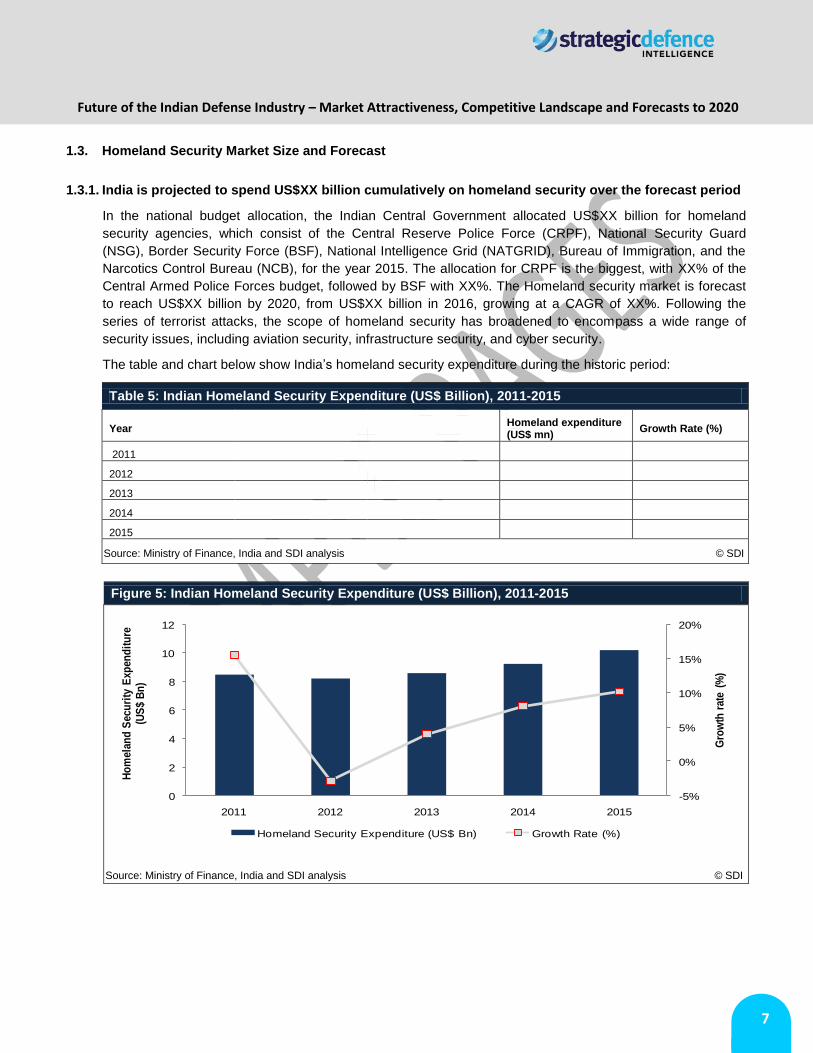
1.3.1. India is projected to spend US$XX billion cumulatively on homeland security over the forecast period
In the national budget allocation, the Indian Central Government allocated US$XX billion for homeland
security agencies, which consist of the Central Reserve Police Force (CRPF), National Security Guard
(NSG), Border Security Force (BSF), National Intelligence Grid (NATGRID), Bureau of Immigration, and the
Narcotics Control Bureau (NCB), for the year 2015. The allocation for CRPF is the biggest, with XX% of the
Central Armed Police Forces budget, followed by BSF with XX%. The Homeland security market is forecast
to reach US$XX billion by 2020, from US$XX billion in 2016, growing at a CAGR of XX%. Following the
series of terrorist attacks, the scope of homeland security has broadened to encompass a wide range of
security issues, including aviation security, infrastructure security, and cyber security.
The table and chart below show India’s homeland security expenditure during the historic period:
Table 5: Indian Homeland Security Expenditure (US$ Billion), 2011-2015
Year Homeland expenditure (US$ mn)
Growth Rate (%)
2011
2012
2013
2014
2015
Source: Ministry of Finance, India and SDI analysis © SDI
Figure 5: Indian Homeland Security Expenditure (US$ Billion), 2011-2015
Source: Ministry of Finance, India and SDI analysis © SDI
-5%
0%
5%
10%
15%
20%
0
2
4
6
8
10
12
2011 2012 2013 2014 2015
Gro
wth
rat
e (%
)
Ho
mel
and
Sec
uri
ty E
xpen
dit
ure
(U
S$
Bn
)
Homeland Security Expenditure (US$ Bn) Growth Rate (%)
Future of the Indian Defense Industry – Market Attractiveness, Competitive Landscape and Forecasts to 2020
8
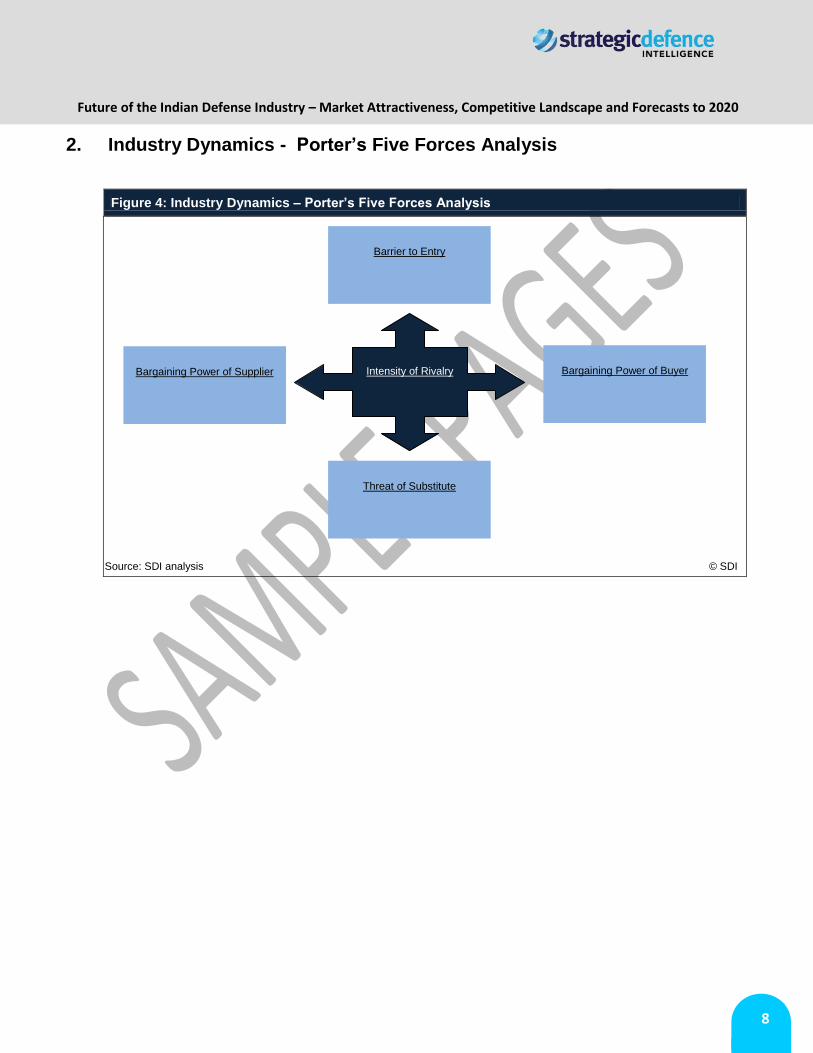
2. Industry Dynamics - Porter’s Five Forces Analysis
Figure 4: Industry Dynamics – Porter’s Five Forces Analysis
Source: SDI analysis © SDI
Intensity of Rivalry Bargaining Power of Supplier
Bargaining Power of Buyer
Barrier to Entry
Threat of Substitute
Future of the Indian Defense Industry – Market Attractiveness, Competitive Landscape and Forecasts to 2020
9
Report Methodology
SDI’s dedicated research and analysis teams consist of experienced professionals with a background in
industry research and consulting in the defense sector. The following research methodology is followed for all
databases and reports:
Secondary Research
The research process begins with exhaustive secondary research to source reliable qualitative and
quantitative information related to the defense market. The secondary research sources that are typically
referred to include, but are not limited to:
Industry associations
National government documents and statistical databases
Company websites, annual reports, financial reports, broker reports, investor presentations
Industry trade journals and other literature
Internal and external proprietary databases
News articles, press releases, and webcasts specific to the companies operating in the market
Primary Research
SDI conducts hundreds of primary interviews a year with industry participants and commentators in order to
validate its data and analysis. A typical research interview fulfills the following functions:
Provides first-hand information on market size, market trends, growth trends, competitive landscape,
and future outlook
Helps to validate and strengthen secondary research findings
Further develops the analysis team’s expertise and market understanding
Primary research involves e-mail interactions, telephone interviews, and face-to-face interviews for
each market category, division, and sub-division across geographies
The participants who typically take part in such a process include, but are not limited to:
Industry participants: CEOs, VPs, business development managers, market intelligence managers,
and national sales managers
External experts: investment bankers, valuation experts, research analysts, and key opinion leaders
specializing in defense markets
Conventions
Currency conversions are performed on the basis of average annual conversion rate format
calculations
All the values in tables, with the exception of compounded annual growth rate (CAGR) and
compounded annual rate of change (CARC), are displayed to one decimal place; therefore, due to
this rounding method, growth rates may appear inconsistent with absolute values
The forecasted values are projected on the basis of nominal values; the inflation was not taken into account
Future of the Indian Defense Industry – Market Attractiveness, Competitive Landscape and Forecasts to 2020
10
TABLE OF CONTENTS
1. Introduction ......................................................................................................................... 12
1.1. What is this Report About? ..........................................................................................................12
1.2. Definitions .....................................................................................................................................12
1.3. Summary Methodology .................................................................................................................14
1.4. SDI Terrorism Index ......................................................................................................................15
1.5. About Strategic Defence Intelligence ..........................................................................................15
2. Executive Summary ............................................................................................................ 16
3. Market Attractiveness and Emerging Opportunities ........................................................ 18
3.1. Defense Market Size Historical and Forecast..............................................................................19
3.1.1. Indian defense budget expected to be US$XX billion cumulatively over 2016-2020 ............................... 19
3.1.2. Modernization initiatives, hostile neighbors and territorial disputes will be the industry’s primary growth
drivers .................................................................................................................................................................. 23
3.1.3. Defense budget as a percentage of GDP will remain at an average of XX% over the forecast period ... 25
3.2. Analysis of Defense Budget Allocation .......................................................................................27
3.2.1. Capital expenditure allocation expected to increase over the forecast period ......................................... 27
3.2.2. Army continues to get the largest share of the defense budget ............................................................... 29
3.2.3. Defense ministry will spend US$XX billion on its army over the forecast period ..................................... 31
3.2.4. Indian MoD is projected to spend US$XX billion on its air force over the forecast period ....................... 35
3.2.5. Expenditure for the navy is expected to grow at a CAGR of XX% over the forecast period .................... 39
3.2.6. Per capita defense expenditure is expected to increase over the forecast period ................................... 43
3.3. Homeland Security Market Size and Forecast ............................................................................45
3.3.1. India is projected to spend US$XX billion cumulatively on homeland security over the forecast period . 45
3.3.2. Homeland security is expected to be driven by cross-border terrorism and domestic conflicts ............... 50
3.3.3. India falls under “worst affected” of terrorism category ............................................................................ 51
3.3.4. India has terrorism index score of 5.1 ...................................................................................................... 52
3.4. Benchmarking with Key Global Markets .....................................................................................53
3.4.1. India’s defense budget expected to grow at a CAGR of XX% ................................................................. 53
3.4.2. The US and China dominate the global defense industry ........................................................................ 55
3.4.3. India allocates a lower share of its GDP for defense than other Asian countries .................................... 56
3.4.4. India faces significant threat from foreign terrorist organizations ............................................................. 57
3.5. Market Opportunities: Key Trends and Growth Stimulators ......................................................59
3.5.1. Multi-role Aircraft ....................................................................................................................................... 59
3.5.2. Infrastructure Construction ....................................................................................................................... 61
3.5.3. Diesel electric Submarine ......................................................................................................................... 63
3.5.4. Surface to Air Missiles .............................................................................................................................. 64
Future of the Indian Defense Industry – Market Attractiveness, Competitive Landscape and Forecasts to 2020
11
3.5.5. Multi-mission and maritime helicopter ...................................................................................................... 66
4. Defense Procurement Market Dynamics ........................................................................... 68
4.1. Import Market Dynamics ...............................................................................................................69
4.1.1. India was the biggest arms importer during 2010–2014 .......................................................................... 69
4.1.2. Russia dominates Indian arms imports .................................................................................................... 70
4.1.3. Aircraft accounted for the majority of defense imports during 2010–2014 ............................................... 71
4.2. Export Market Dynamics ..............................................................................................................72
4.2.1. India’s low profile in defense exports is set to change over the forecast period ...................................... 72
4.2.2. Underdeveloped nations across Asia, Africa and Latin America are the main importers of Indian
defense goods ....................................................................................................................................................... 73
5. Industry Dynamics .............................................................................................................. 74
5.1. Five Forces Analysis.....................................................................................................................74
5.1.1. Bargaining power of supplier: low to high ................................................................................................. 75
5.1.2. Bargaining power of buyer: high ............................................................................................................... 75
5.1.3. Barrier to entry: medium to high ............................................................................................................... 76
5.1.4. Intensity of rivalry: high ............................................................................................................................. 76
5.1.5. Threat of substitution: medium to high ..................................................................................................... 76
6. Market Entry Strategy ......................................................................................................... 77
6.1. Market Regulation .........................................................................................................................77
6.1.1. Defense Procurement Procedure (DPP) - 2011: A significant improvement ........................................... 77
6.1.2. Offset policy to drive defense industrial modernization ............................................................................ 77
6.1.3. Main features of revised Defense Offset Guidelines (DOG) - 2012 ......................................................... 79
6.1.4. Private sectors permitted to produce arms and ammunition under the new Draft Arms and
Ammunitions Manufacturing Policy (DAAM) ......................................................................................................... 80
6.1.5. Payment to foreign technology partners does not require governmental approval .................................. 80
6.1.6. Foreign direct investment (FDI) increased to 49% in the Indian defense sector...................................... 80
6.2. Market Entry Route .......................................................................................................................82
6.2.1. Foreign OEMs are forming joint ventures in order to enter the market .................................................... 82
6.2.2. India emerges as a key outsourcing hub for global defense companies ................................................. 84
6.3. Key Challenges .............................................................................................................................85
6.3.1. Offset policy is biased towards the domestic public and private sectors ................................................. 85
6.3.2. Insufficient information and transparency on future plans ........................................................................ 85
6.3.3. Bureaucracy, corruption, and long project delays .................................................................................... 86
6.3.4. Developing advanced low-cost solutions is essential to gain market share ............................................. 86
7. Competitive landscape and Strategic Insights ................................................................. 87
7.1. Competitive landscape Overview .................................................................................................87
7.1.1. Domestic public companies have a strong presence in the Indian defense industry ............................... 87
Future of the Indian Defense Industry – Market Attractiveness, Competitive Landscape and Forecasts to 2020
12
7.2. Key Foreign Companies ...............................................................................................................90
7.2.1. Lockheed Martin Corporation – overview ................................................................................................. 90
7.2.2. Lockheed Martin Corporation – main products ........................................................................................ 90
7.2.3. Lockheed Martin Corporation – recent announcements and strategic initiatives ..................................... 91
7.2.4. Lockheed Martin Corporation – alliances ................................................................................................. 92
7.2.5. Lockheed Martin Corporation – recent contract wins ............................................................................... 93
7.2.6. BAE Systems Plc. – overview .................................................................................................................. 94
7.2.7. BAE Systems Plc. – main products and services ..................................................................................... 94
7.2.8. BAE Systems Plc. – recent announcements and strategic initiatives ...................................................... 95
7.2.9. BAE Systems Plc. – alliances ................................................................................................................... 95
7.2.10. BAE Systems Plc. – recent contract wins ................................................................................................. 96
7.2.11. Thales – overview ..................................................................................................................................... 97
7.2.12. Thales – main products and services ....................................................................................................... 97
7.2.13. Thales – recent announcements and strategic initiatives ......................................................................... 98
7.2.14. Thales – alliances ..................................................................................................................................... 98
7.2.15. Thales – recent contract wins ................................................................................................................... 99
7.2.16. Boeing – overview .................................................................................................................................. 100
7.2.17. Boeing – main products and services ..................................................................................................... 100
7.2.18. Boeing – recent announcements and strategic initiatives ...................................................................... 100
7.2.19. Boeing – alliances ................................................................................................................................... 101
7.2.20. Boeing – recent contract wins ................................................................................................................ 101
7.3. Key Public Sector Companies .................................................................................................... 102
7.3.1. Mazagon Docks Limited – overview ....................................................................................................... 102
7.3.2. Mazagon Docks Limited – main products and services ......................................................................... 102
7.3.3. Mazagon Docks Limited – recent announcements and strategic initiatives ........................................... 102
7.3.4. Mazagon Docks Limited – alliances ....................................................................................................... 103
7.3.5. Mazagon Docks Limited – recent contract wins ..................................................................................... 103
7.3.6. Mazagon Docks Limited – Financial analysis ......................................................................................... 104
7.3.7. Hindustan Aeronautics Limited – overview ............................................................................................. 106
7.3.8. Hindustan Aeronautics Limited – main products and services ............................................................... 106
7.3.9. Hindustan Aeronautics Limited – recent announcements and strategic initiatives ................................ 107
7.3.10. Hindustan Aeronautics Limited – alliances ............................................................................................. 108
7.3.11. Hindustan Aeronautics Limited – recent contract wins ........................................................................... 109
7.3.12. Hindustan Aeronautics Limited – Financial analysis .............................................................................. 110
7.3.13. Bharat Electronics Limited – overview .................................................................................................... 113
7.3.14. Bharat Electronics Limited – main products and services ...................................................................... 113
7.3.15. Bharat Electronics Limited – recent announcements and strategic initiatives ....................................... 114
7.3.16. Bharat Electronics Limited – alliances .................................................................................................... 115
Future of the Indian Defense Industry – Market Attractiveness, Competitive Landscape and Forecasts to 2020
13
7.3.17. Bharat Electronics Limited – recent contract wins .................................................................................. 116
7.3.18. Bharat Electronics Limited – Financial analysis ..................................................................................... 117
7.3.19. Bharat Dynamics Limited – overview ..................................................................................................... 119
7.3.20. Bharat Dynamics Limited – main products and services ........................................................................ 119
7.3.21. Bharat Dynamics Limited – recent announcements and strategic initiatives ......................................... 119
7.3.22. Bharat Dynamics Limited – alliances ...................................................................................................... 120
7.3.23. Bharat Dynamics Limited – recent contract wins ................................................................................... 120
7.3.24. Bharat Dynamics Limited – Financial analysis ....................................................................................... 121
7.3.25. Ordnance Factory Board – overview ...................................................................................................... 123
7.3.26. Ordinance Factory Board – main products and services ....................................................................... 123
7.3.27. Ordinance Factory Board – recent announcements and strategic initiatives ......................................... 123
7.3.28. Ordinance Factory Board – alliances ..................................................................................................... 124
7.3.29. Ordinance Factory Board – recent contract wins ................................................................................... 124
7.3.30. BEML – overview .................................................................................................................................... 125
7.3.31. BEML – main products and services ...................................................................................................... 125
7.3.32. BEML – recent announcements and strategic initiatives ........................................................................ 126
7.3.33. BEML – alliances .................................................................................................................................... 126
7.3.34. BEML – Financial analysis...................................................................................................................... 128
7.3.35. Goa Shipyard Limited – overview ........................................................................................................... 130
7.3.36. Goa Shipyard Limited – main products and services ............................................................................. 130
7.3.37. Goa Shipyard Limited – recent announcements and strategic initiatives ............................................... 131
7.3.38. Goa Shipyard Limited – alliances ........................................................................................................... 131
7.3.39. Goa Shipyard Limited – recent contract wins ......................................................................................... 131
7.3.40. Goa Shipyard Limited – Financial analysis............................................................................................. 133
7.4. Key Private Sector Companies .................................................................................................. 135
7.4.1. Tata Advanced Systems Limited – overview .......................................................................................... 135
7.4.2. Tata Advanced Systems Limited – main products and services ............................................................ 135
7.4.3. Tata Advanced Systems Limited – recent announcements and strategic initiatives ............................. 136
7.4.4. Tata Advanced Systems Limited – alliances .......................................................................................... 136
7.4.5. Tata Advanced Systems Limited – recent contract wins ........................................................................ 137
7.4.6. Mahindra Defence Systems – overview ................................................................................................. 138
7.4.7. Mahindra Defence Systems – main products and services ................................................................... 138
7.4.8. Mahindra Defence Systems – recent announcements and strategic initiatives ..................................... 138
7.4.9. Mahindra Defence Systems – alliances ................................................................................................. 139
8. Business Environment and Country Risk ....................................................................... 141
8.1. Demographics & Social Statistics .............................................................................................. 141
8.1.1. Population –Total rural population .......................................................................................................... 141
8.1.2. Population – Total urban population ....................................................................................................... 142
Future of the Indian Defense Industry – Market Attractiveness, Competitive Landscape and Forecasts to 2020
14
8.1.3. Population – Number of Households ...................................................................................................... 143
8.2. Economic Performance .............................................................................................................. 144
8.2.1. GDP Per Capita, USD ............................................................................................................................ 144
8.2.2. GDP (current USD Billion) ...................................................................................................................... 145
8.2.3. Exports of goods and services (current USD Billion) ............................................................................. 146
8.2.4. Imports of goods and services (current USD Billion) .............................................................................. 147
8.2.5. Gross National Disposable Income (USD Billion) .................................................................................. 148
8.2.6. Manufacturing Output (USD Billion) ....................................................................................................... 149
8.2.7. Consumer Price Index ............................................................................................................................ 150
8.2.8. Wholesale Price Index ............................................................................................................................ 151
8.2.9. LCU per USD (period average) .............................................................................................................. 152
8.2.10. LCU per EUR (period average) .............................................................................................................. 153
8.2.11. Lending Rate (%) .................................................................................................................................... 154
8.2.12. Real Interest Rate (%) ............................................................................................................................ 155
8.2.13. Market Capitalization of Listed Companies (USD Billion) ...................................................................... 156
8.2.14. Market Capitalization of Listed Companies (% of GDP) ......................................................................... 157
8.2.15. Total Government Cash Surplus/Deficit (LCU Billion) ............................................................................ 158
8.2.16. Total Government cash surplus/deficit as % of GDP (LCU) ................................................................... 159
8.2.17. Central Government Debt (LCU Billion) ................................................................................................. 160
8.2.18. Central Government Debt as a percentage of GDP (LCU) .................................................................... 161
8.2.19. Goods exports as a percentage of GDP................................................................................................. 162
8.2.20. Goods imports as a percentage of GDP................................................................................................. 163
8.2.21. Goods balance as a percentage of GDP ................................................................................................ 164
8.2.22. Services imports as a percentage of GDP ............................................................................................. 165
8.2.23. Services Exports as a percentage of GDP ............................................................................................. 166
8.2.24. Services balance as a percentage of GDP............................................................................................. 167
8.2.25. International reserves, including gold (USD Billion) ............................................................................... 168
8.2.26. External debt as percentage of GDP ...................................................................................................... 169
8.3. Energy and Utilities ..................................................................................................................... 170
8.3.1. Total Conventional Thermal Electricity Net Generation (Billion Kilowatt hours) ..................................... 170
8.3.2. Hydroelectricity Net Generation (Billion Kilowatt hours) ......................................................................... 171
8.3.3. Nuclear Electricity Net Generation (Billion Kilowatt hours) ..................................................................... 172
8.3.4. Total Conventional Thermal Electricity Installed Capacity (Million Kilowatts) ........................................ 173
8.3.5. Total Electricity Exports (Billion Kilowatt hours) ..................................................................................... 174
8.3.6. Total Electricity Imports (Billion Kilowatt hours) ..................................................................................... 175
8.3.7. Proved Reserves of Natural Gas (Trillion Cubic Feet) ........................................................................... 176
8.3.8. Total Petroleum Consumption (Thousand Barrels Per Day) .................................................................. 177
8.3.9. Crude Oil Proved Reserves (Billion Barrels) .......................................................................................... 178
Future of the Indian Defense Industry – Market Attractiveness, Competitive Landscape and Forecasts to 2020
15
8.3.10. Total Non-Hydro Renewable Electricity Net Generation (Billion Kilowatts) ............................................ 179
8.4. Infrastructure Quality and Availability ....................................................................................... 180
8.4.1. Rail lines (total route - km) ...................................................................................................................... 180
8.4.2. Air transport, freight (million ton-km) ...................................................................................................... 181
8.5. Minerals ....................................................................................................................................... 182
8.5.1. Mining, Manufacturing, and Utilities Output (USD Bn) ........................................................................... 182
8.6. Technology .................................................................................................................................. 183
8.6.1. Patents granted ...................................................................................................................................... 183
8.7. Telecommunication .................................................................................................................... 184
8.7.1. Telephone lines (In Mn) .......................................................................................................................... 184
8.7.2. Telephone Lines Penetration Rate (per 100 people) ............................................................................. 185
9. Appendix ............................................................................................................................ 186
9.1. About SDI ..................................................................................................................................... 186
9.2. Disclaimer .................................................................................................................................... 186
Future of the Indian Defense Industry – Market Attractiveness, Competitive Landscape and Forecasts to 2020
16
LIST OF FIGURES
Figure 1: Indian Defense Expenditure (US$ Billion), 2011-2015 ...................................................................................................................... 19 Figure 2: Indian Defense Expenditure (US$ Billion), 2016–2020 ...................................................................................................................... 20 Figure 3: Indian Defense Expenditure (INR Billion), 2011-2015 ....................................................................................................................... 21 Figure 4: Indian Defense Expenditure (INR Billion), 2016–2020 ...................................................................................................................... 22 Figure 5: Indian GDP Growth vs. Defense Expenditure Growth and Defense Expenditure as Percentage of GDP Growth, 2011-2015 ........... 25 Figure 6: Indian GDP Growth vs. Defense Expenditure Growth and Defense Expenditure as Percentage of GDP Growth, 2016–2020 ........... 26 Figure 7:Indian Defense Budget Split Between Capital and Revenue Expenditure (%), 2011-2015 ................................................................. 27 Figure 8: Indian Defense Budget Split Between Capital and Revenue Expenditure (%), 2016–2020 ............................................................... 28 Figure 9: Indian Defense Budget Split (%), 2011-2015 .................................................................................................................................... 29 Figure 10: Indian Defense Budget Split (%), 2016–2020 ................................................................................................................................. 30 Figure 11: Indian Defense Expenditure for Army (US$ Billion), 2011-2015 ...................................................................................................... 31 Figure 12: Indian Defense Expenditure for Army (US$ Billion), 2016–2020 ..................................................................................................... 32 Figure 13: Indian Defense Expenditure for Army (INR Billion), 2011-2015 ...................................................................................................... 33 Figure 14: Indian Defense Expenditure for Army (INR Billion), 2016–2020 ..................................................................................................... 34 Figure 15: Indian Defense Expenditure for Air Force (US$ Billion), 2011-2015 ................................................................................................ 35 Figure 16: Indian Defense Expenditure for Air Force (US$ Billion), 2016–2020 ............................................................................................... 36 Figure 17: Indian Defense Expenditure for Air Force (INR Billion), 2011-2015 ................................................................................................. 37 Figure 18: Indian Defense Expenditure for Air Force (INR Billion), 2016–2020 ................................................................................................ 38 Figure 19: Indian Defense Expenditure for Navy (US$ Billion), 2011-2015 ...................................................................................................... 39 Figure 20: Indian Defense Expenditure for Navy (US$ Billion), 2016–2020 ...................................................................................................... 40 Figure 21: Indian Expenditure for Navy (INR Billion), 2011-2015 ..................................................................................................................... 41 Figure 22: Indian Expenditure for Navy (INR Billion), 2016–2020 .................................................................................................................... 42 Figure 23: Indian Per Capita Defense Expenditure (US$), 2011-2015 ............................................................................................................. 43 Figure 24: Indian Per Capita Defense Expenditure (US$), 2016–2020 ............................................................................................................ 44 Figure 25: Indian Homeland Security Budget (US$ billion), 2011-2015 ............................................................................................................ 46 Figure 26: Indian Homeland Security Budget (US$ billion), 2016–2020 ........................................................................................................... 47 Figure 27: Indian Homeland Security Budget (INR Billion), 2011-2015 ............................................................................................................ 48 Figure 28: Indian Homeland Security Budget (INR Billion), 2016–2020............................................................................................................ 49 Figure 29: SDI Terrorism Heat Map, 2015 ....................................................................................................................................................... 51 Figure 30: SDI Terrorism Index ........................................................................................................................................................................ 52 Figure 31: Benchmarking with Key Markets – 2011-2015 vs. 2016–2020 ........................................................................................................ 54 Figure 32: Defense Expenditure of the World’s Largest Military Spenders (US$ Billion), 2015 and 2020 ......................................................... 55 Figure 33: Defense Expenditure as a Percentage of GDP of Largest Military Spenders (%), 2015 .................................................................. 56 Figure 34: Multi-role Aircraft Market Size (US$ Billion), 2015–2025 ................................................................................................................. 60 Figure 35: Infrastructure Construction Market Size (US$ Billion), 2015–2025 .................................................................................................. 62 Figure 36: Diesel Electric Submarine Market Size (US$ Billion), 2015–2025 ................................................................................................... 63 Figure 37: Surface to Air Missiles Market Size (US$ Billion), 2015–2025 ......................................................................................................... 65 Figure 38: Multi-mission and Maritime Helicopter Market Size (US$ Billion), 2015–2025 ................................................................................. 67 Figure 39: Indian Defense Import Trend (US$ Million), 2010–2014 (TIV values*) ............................................................................................ 69 Figure 40: Country-wise Break-up of Indian Defense Imports (%), 2010–2014 (TIV values*) ........................................................................... 70 Figure 41: Weapon Category Break-up of Indian Defense Imports (%), 2010–2014 (TIV values*) ................................................................... 71 Figure 42: Indian Defense Export Trend (US$ Million), 2010–2014 (TIV values*) ............................................................................................ 72 Figure 43: Country-wise Break-up of Indian Defense Exports (%), 2010-2014 (TIV values*) ........................................................................... 73 Figure 44: Industry Dynamics – Porter’s Five Forces Analysis ......................................................................................................................... 74 Figure 45: Mazagon Docks Limited – Revenue Trend Analysis (INR Billion), 2009–2013 .............................................................................. 104 Figure 46: Mazagon Docks Limited – Operating Profit Trend Analysis (INR Billion), 2009–2013 .................................................................... 104 Figure 47: Mazagon Docks Limited – Net Profit Trend Analysis (INR Billion), 2009–2013 .............................................................................. 105 Figure 48: Hindustan Aeronautics Limited (HAL) – Revenue Trend Analysis (INR Billion), 2010–2014 .......................................................... 110 Figure 49: Hindustan Aeronautics Limited (HAL) – Operating Profit Trend Analysis (INR Billion), 2010–2014 ............................................... 111 Figure 50: Hindustan Aeronautics Limited (HAL) – Net Profit Trend Analysis (INR Billion), 2010–2014 ......................................................... 111 Figure 51: Bharat Electronics Limited – Revenue Trend Analysis (INR Billion), 2009–2013 ........................................................................... 117 Figure 52: Bharat Electronics Limited – Operating Profit Trend Analysis (INR Billion), 2009–2013 ................................................................ 118 Figure 53: Bharat Electronics Limited – Net Profit Trend Analysis (INR Billion), 2009–2013 .......................................................................... 118 Figure 54: Bharat Dynamics Limited – Revenue Trend Analysis (INR Billion), 2009–2013 ............................................................................. 121
Future of the Indian Defense Industry – Market Attractiveness, Competitive Landscape and Forecasts to 2020
17
Figure 55: Bharat Dynamics Limited – Operating Profit Trend Analysis (INR Million), 2009–2013.................................................................. 122 Figure 56: Bharat Dynamics Limited – Net Profit Trend Analysis (INR Million), 2009–2013 ........................................................................... 122 Figure 57: BEML – Revenue Trend Analysis (INR Billion), 2009–2013 .......................................................................................................... 128 Figure 58: BEML – Operating Profit Trend Analysis (INR Million), 2009–2013 ............................................................................................... 129 Figure 59: BEML – Net Profit Trend Analysis (INR Million), 2009–2013 ......................................................................................................... 129 Figure 60: Goa Shipyard Limited – Revenue Trend Analysis (INR Billion), 2009–2013 .................................................................................. 133 Figure 61: Goa Shipyard Limited – Operating Profit Trend Analysis (INR Million), 2009–2013 ....................................................................... 134 Figure 62: Goa Shipyard Limited – Net Profit Trend Analysis (INR Million), 2009–2013 ................................................................................. 134 Figure 63: Indian Population – Rural Population (In Millions), 2015–2024 ...................................................................................................... 141 Figure 64: Indian Population – Urban Population (In Millions), 2015–2024 .................................................................................................... 142 Figure 65: Indian Population – Number of Households (In Millions), 2008–2017 ............................................................................................ 143 Figure 66: GDP Per Capita in USD, 2015–2024 ............................................................................................................................................ 144 Figure 67: GDP (current USD billion) 2015–2024 .......................................................................................................................................... 145 Figure 68: Exports of goods and services (current USD Billion) - 2004–2013 ................................................................................................ 146 Figure 69: Imports of goods and services (current USD Billion) - 2003–2012................................................................................................. 147 Figure 70: Gross National Disposable Income (USD Billion) - 2002–2010 ..................................................................................................... 148 Figure 71: Manufacturing Output (USD Billion) - 2003–2012 ......................................................................................................................... 149 Figure 72: Consumer Price Index - 2015–2024 .............................................................................................................................................. 150 Figure 73: Wholesale Price Index - 2003–2012 ............................................................................................................................................. 151 Figure 74: LCU per USD (period average) - 2015–2024 ................................................................................................................................ 152 Figure 75: LCU per USD (period average) - 2015–2024 ................................................................................................................................ 153 Figure 76: Lending Rate (%) - 2003–2012 ..................................................................................................................................................... 154 Figure 77: Real Interest Rate (%) - 2003–2012 .............................................................................................................................................. 155 Figure 78: Market Capitalization of Listed Companies - 2003–2012 ............................................................................................................... 156 Figure 79: Market Capitalization of Listed Companies (% of GDP)- 2003–2012 ............................................................................................. 157 Figure 80: Total Government Cash Surplus/Deficit (LCU Billion) 2003–2012 ................................................................................................. 158 Figure 81: Total Government Cash Surplus/Deficit as % of GDP (LCU) 2003–2012 ...................................................................................... 159 Figure 82: Central Government Debt (LCU Billion) - 2002–2011 .................................................................................................................... 160 Figure 83: Central Government Debt as a percentage of GDP - 2003–2012 .................................................................................................. 161 Figure 84: Goods exports as a percentage of GDP - 2003–2012 ................................................................................................................... 162 Figure 85: Goods imports as a percentage of GDP - 2003–2012 ................................................................................................................... 163 Figure 86: Goods balance as a percentage of GDP - 2003–2012 .................................................................................................................. 164 Figure 87: Service imports as a percentage of GDP - 2003–2012 ................................................................................................................. 165 Figure 88: Services exports as a percentage of GDP - 2003–2012 ................................................................................................................ 166 Figure 89: Services balance as a percentage of GDP - 2003–2012 ............................................................................................................... 167 Figure 90: International reserves, including gold (USD Billion) - 2002–2011 .................................................................................................. 168 Figure 91: External Debt as a percentage of GDP - 2001–2010 .................................................................................................................... 169 Figure 92: Total Conventional Thermal Electricity Net Generation (Billion Kilowatt hours) - 2002–2011 ......................................................... 170 Figure 93: Hydroelectricity Net Generation (Billion Kilowatt hours) - 2003–2012 ............................................................................................ 171 Figure 94: Nuclear Electricity Net Generation (Billion Kilowatt hours) - 2003–2012 ........................................................................................ 172 Figure 95: Total Conventional Thermal Electricity Installed Capacity (Million Kilowatts), 2001–2010 ............................................................. 173 Figure 96: Total Electricity Exports (Billion Kilowatt hours) - 2002–2011 ........................................................................................................ 174 Figure 97: Total Electricity Imports (Billion Kilowatt hours) - 2002–2011 ........................................................................................................ 175 Figure 98: The Proved Reserves of Natural Gas (Trillion Cubic Feet) - 2004–2014 ....................................................................................... 176 Figure 99: Total Petroleum Consumption (Thousand Barrels Per Day) - 2003–2012 ..................................................................................... 177 Figure 100: The Proved Reserves of Crude Oil (Billion Barrels) - 2005–2014 ................................................................................................ 178 Figure 101: Total Non-Hydro Renewable Electricity Net Generation (Billion Kilowatts) - 2002–2011 .............................................................. 179 Figure 102: Rail lines (total route - km) - 2003–2012 ..................................................................................................................................... 180 Figure 103: Air transport, freight (million ton-km) 2003–2012 ......................................................................................................................... 181 Figure 104: Mining, Manufacturing, Utilities Output (USD Bn), 2003–2012 .................................................................................................... 182 Figure 105: Patents granted - 2004–2013 ...................................................................................................................................................... 183 Figure 106: Telephone Lines (In Mn), 2003–2012 ......................................................................................................................................... 184 Figure 107: Telephone lines Penetration Rate (per 100 people) 2003–2012 .................................................................................................. 185
Future of the Indian Defense Industry – Market Attractiveness, Competitive Landscape and Forecasts to 2020
18
LIST OF TABLES
Table 1: Indian Defense Expenditure (US$ Billion), 2011-2015 ........................................................................................................................ 19 Table 2: Indian Defense Expenditure (US$ Billion), 2016–2020 ....................................................................................................................... 20 Table 3: Indian Defense Expenditure (INR Billion), 2011-2015 ........................................................................................................................ 21 Table 4: Indian Defense Expenditure (INR Billion), 2016–2020 ........................................................................................................................ 22 Table 5: Indian GDP Growth vs. Defense Expenditure Growth and Defense Expenditure as Percentage of GDP Growth, 2011-2015............. 25 Table 6: Indian GDP Growth vs. Defense Expenditure Growth and Defense Expenditure as Percentage of GDP Growth, 2016–2020 ............ 26 Table 7: Indian Defense Budget Split Between Capital and Revenue Expenditure (%), 2011-2015 ................................................................. 27 Table 8: Indian Defense Budget Split Between Capital and Revenue Expenditure (%), 2016–2020................................................................. 28 Table 9: Indian Defense Budget Split (%), 2011-2015 ..................................................................................................................................... 29 Table 10: Indian Defense Budget Split (%), 2016–2020 ................................................................................................................................... 30 Table 11: Indian Defense Expenditure for Army (US$ Billion), 2011-2015 ....................................................................................................... 31 Table 12: Indian Defense Expenditure for Army (US$ Billion), 2016–2020 ....................................................................................................... 32 Table 13: Indian Defense Expenditure for Army (INR Billion), 2011-2015 ....................................................................................................... 33 Table 14: Indian Defense Expenditure for Army (INR Billion), 2016–2020 ...................................................................................................... 34 Table 15: Indian Defense Expenditure for Air Force (US$ Billion), 2011-2015 ................................................................................................. 35 Table 16: Indian Defense Expenditure for Air Force (US$ Billion), 2016–2020 ................................................................................................. 36 Table 17: Indian Defense Expenditure for Air Force (INR Billion), 2011-2015 .................................................................................................. 37 Table 18: Indian Defense Expenditure for Air Force (INR Billion), 2016–2020 ................................................................................................. 38 Table 19: Indian Defense Expenditure for Navy (US$ Billion), 2011-2015 ........................................................................................................ 39 Table 20: Indian Defense Expenditure for Navy (US$ Billion), 2016–2020 ....................................................................................................... 40 Table 21: Indian Expenditure for Navy (INR Billion), 2011-2015 ...................................................................................................................... 41 Table 22: Indian Expenditure for Navy (INR Billion), 2016–2020 ...................................................................................................................... 42 Table 23: Indian Per Capita Defense Expenditure (US$), 2011-2015 .............................................................................................................. 43 Table 24: Indian Per Capita Defense Expenditure (US$), 2016–2020 .............................................................................................................. 44 Table 25: Indian Homeland Security Budget (US$ billion), 2011-2015 ............................................................................................................. 46 Table 26: Indian Homeland Security Budget (US$ billion), 2016–2020 ............................................................................................................ 47 Table 27: Indian Homeland Security Budget (INR Billion), 2011-2015 ............................................................................................................. 48 Table 28: Indian Homeland Security Budget (INR Billion), 2016–2020 ............................................................................................................. 49 Table 29:Benchmarking with Key Markets – 2011-2015 vs. 2016–2020 .......................................................................................................... 53 Table 30: SDI Research Terrorism Index ......................................................................................................................................................... 57 Table 31: Offset Policy in India ........................................................................................................................................................................ 78 Table 32: Market Entry Strategies and Key Objectives of Foreign Companies in the Indian Defense Sector ................................................... 82 Table 33: Key Players and their Operations in the Indian Defense Industry ..................................................................................................... 84 Table 34: Scale of Operations of Domestic Public Sector Companies in the Indian Defense Industry .............................................................. 87 Table 35: Lockheed Martin Corporation – Main Products................................................................................................................................. 90 Table 36: Lockheed Martin Corporation – Alliances ......................................................................................................................................... 92 Table 37: Lockheed Martin Corporation – Recent Contract Wins ..................................................................................................................... 93 Table 38: BAE Systems Plc. – Main Products and Services ............................................................................................................................ 94 Table 39: BAE Systems Plc. – Alliances .......................................................................................................................................................... 95 Table 40: BAE Systems Plc. – Recent Contract Wins ...................................................................................................................................... 96 Table 41: Thales – Main Products and Services ............................................................................................................................................. 97 Table 42: Thales – Alliances ............................................................................................................................................................................ 98 Table 43: Thales – Recent Contract Wins........................................................................................................................................................ 99 Table 44: Boeing – Main Products and Services ............................................................................................................................................ 100 Table 45: Boeing – Alliances ......................................................................................................................................................................... 101 Table 46: Boeing – Recent Contract Wins ..................................................................................................................................................... 101 Table 47: Mazagon Docks Limited – Main Products and Services ................................................................................................................. 102 Table 48: Mazagon Docks Limited – Alliances ............................................................................................................................................... 103 Table 49: Mazagon Docks Limited – Recent Contract Wins ........................................................................................................................... 103 Table 50: Hindustan Aeronautics Limited – Main Products and Services ....................................................................................................... 106 Table 51: Hindustan Aeronautics Limited – Alliances ..................................................................................................................................... 108 Table 52: Hindustan Aeronautics Limited – Recent Contract Wins................................................................................................................. 109 Table 53: Bharat Electronics Limited – Major Products and Services ............................................................................................................. 113 Table 54: Bharat Electronics Limited – Alliances ........................................................................................................................................... 115
Future of the Indian Defense Industry – Market Attractiveness, Competitive Landscape and Forecasts to 2020
19
Table 55: Bharat Electronics Limited – Recent Contract Wins ....................................................................................................................... 116 Table 56: Bharat Dynamics Limited – Main Products and Services................................................................................................................ 119 Table 57: Bharat Dynamics Limited – Alliances ............................................................................................................................................. 120 Table 58: Bharat Dynamics Limited – Recent Contract Wins ......................................................................................................................... 120 Table 59: Ordinance Factory Board – Main Products and Services ............................................................................................................... 123 Table 60: Ordinance Factory Board – Alliances ............................................................................................................................................. 124 Table 61: Ordinance Factory Board – Recent Contract Wins ......................................................................................................................... 124 Table 62: BEML – Main Products and Services ............................................................................................................................................. 125 Table 63: BEML – Alliances ........................................................................................................................................................................... 126 Table 64: Goa Shipyard Limited – Main Products and Services ..................................................................................................................... 130 Table 65: Goa Shipyard Limited – Alliances .................................................................................................................................................. 131 Table 66: Goa Shipyard Limited – Recent Contract Wins .............................................................................................................................. 131 Table 67: Tata Advanced Systems Limited – Main Products and Services .................................................................................................... 135 Table 68: Tata Advanced Systems Limited – Alliances .................................................................................................................................. 136 Table 69: Tata Advanced Systems Limited – Recent Contract Wins .............................................................................................................. 137 Table 70: Mahindra Defence Systems – Main Products and Services ........................................................................................................... 138 Table 71: Mahindra Defence Systems – Alliances ......................................................................................................................................... 139