Embed Size (px)
Citation preview
Appendix
Future Supply Chain2016
Serving Consumers in a Sustainable Way
introduction 3
leading practices: Details 4
example Supply Chains: as-is Scenarios 7
Calculation Models: Details 11
the integrated Model: From production to Consumer 15
Glossary of terms 19
Contents
© May 2008 Global Commerce initiative, Capgemini. all rights reserved.
�
Introduction
The report titled “Future Supply Chain 2016: Serving Consumers in a Sustainable Way,” published by the Global Commerce Initiative and Capgemini, provides an integrated model for a future supply chain that will be a more sustainable broad-based solution for the industry. The report offers a toolkit consisting of solution areas, leading practices, example supply chains and calculation models that will be needed to build the innovative future supply chain model, as well as the next steps to make it a reality.
Integrating the identified improvement solutions and collaboration concepts into a cohesive model will provide the future supply chain architecture necessary to bring new efficiency and cost reduction to the industry. The total impact of this supply chain redesign (even taking into account the usage of current transport and storage technology) could potentially reduce transport costs per pallet to the order of more than 30%, cut handling costs per pallet to the order of 20%, reduce lead time by 40% and
lower CO2 emissions per pallet to the order of 25%, while also improving on-shelf availability. This does not include additional energy cost savings stemming from more efficient assets such as green buildings and fuel-efficient/aerodynamic and jumbo trucks.
These benefits and others are expected to be achievable when all the elements of the future supply chain are in place. The future supply chain is expected to provide clear benefits for our society, for the industry, for individual companies, and ultimately for consumers and shoppers.
This separate, freestanding Appendix contains further details of leading practices, example supply chains, calculation models, the integrated model and a glossary of terms and is designed to accompany the main report. The full report can be downloaded at www.gci-net.org and www.capgemini.com.
�
Future Supply Chain 2016 APPENDIX
and Lustucru), one third-party logistics service provider (FM Logistics), six regional haulers and one major retailer (Carrefour). This shared multi-player approach is designed to enable more frequent deliveries and more full trucks. The three suppliers share the same externalised facilities for storage and picking with the retailer, requiring a single point of delivery and the same booking (location/day/hour).
The approach has resulted in the following significant benefits3:
Average delivery frequency increased by 34%.Average load per delivery increased by 115%.Average stock coverage in regional distribution centres (RDCs) decreased by 16% (minus three days with mutualisation).The service level was maintained to 99.6%.
Reverse Logistics Leading Practice: HP Recycling ProgrammesHP has made recycling a point of differentiation by implementing a number of reverse-logistics initiatives.4 For example, Braun/Gillette, Sony, Electrolux and HP founded the “European Recycling Platform” to ensure a competitive market for Waste Electrical and Electronic Equipment (WEEE). As a result, costs are expected to be reduced by more than 50%.
In addition, HP runs direct take-back programmes. For example, “Cash for Scrap” is a collaboration with German consumer electronics retailer Media Markt to sell out IT and has significantly increased take-back. HP also operates a collaborative donation programme with the municipality of Paris and a charitable organisation. Reusable products are taken out of the waste stream and are provided to low-income families.
°
°
°
°
Leading Practices: Details
The report identifies a number of examples of existing leading practices that are integrated into the model to show how they help to address the solutions areas. These leading practices make it clear that benefits are real and achievable. Following are descriptions of these leading practices.
In-Store Logistics Leading Practice: Schuitema and American Textile Technology SolutionsThe Dutch retailer Schuitema has extended its deployment of RFID technology to returnable plastic containers for ready-to-cook vegetables. Results show that the use of RFID has increased Schuitema’s sales by 10% to 12%. Since 2005 Schuitema has been testing RFID labels on crates with ready-to-cook vegetables through a project know as Vers Schakel (Fresh Link). Actual implementation of RFID will cost €12 million (US$16.6 million), according to Schuitema.1
American Textile Company (ATC) improved its use of POS data, providing the firm with a competitive edge as well as sales increases as high as 116%.2 The company now has the information power and leverage to:
Build stronger customer relationshipsIdentify and capitalise on opportunitiesImprove retailers’ sell throughEfficiently manage inventories Understand consumer buying patterns Produce more accurate forecasts
Collaborative Physical Logistics Leading Practice: A Multi-Player ApproachECR France’s collaborative infrastructure leading practice consists of collaboration among three independent manufacturers (Bénédicta, Nutrimaine
°
°
°
°
°
°
1 “C1000 claimt forse omzetgroei door rFiD,” www.elsevierretail.nl, november 7, 2007.2 http://www.ezedi.com/services/cs_american_textile_pos.htm.3 “Collaboration goes green,” eCr europe, eCr France and eCr uK.4 “take back of it products in europe—legislative burden or opportunity?” hp, October 12, 2007.
�
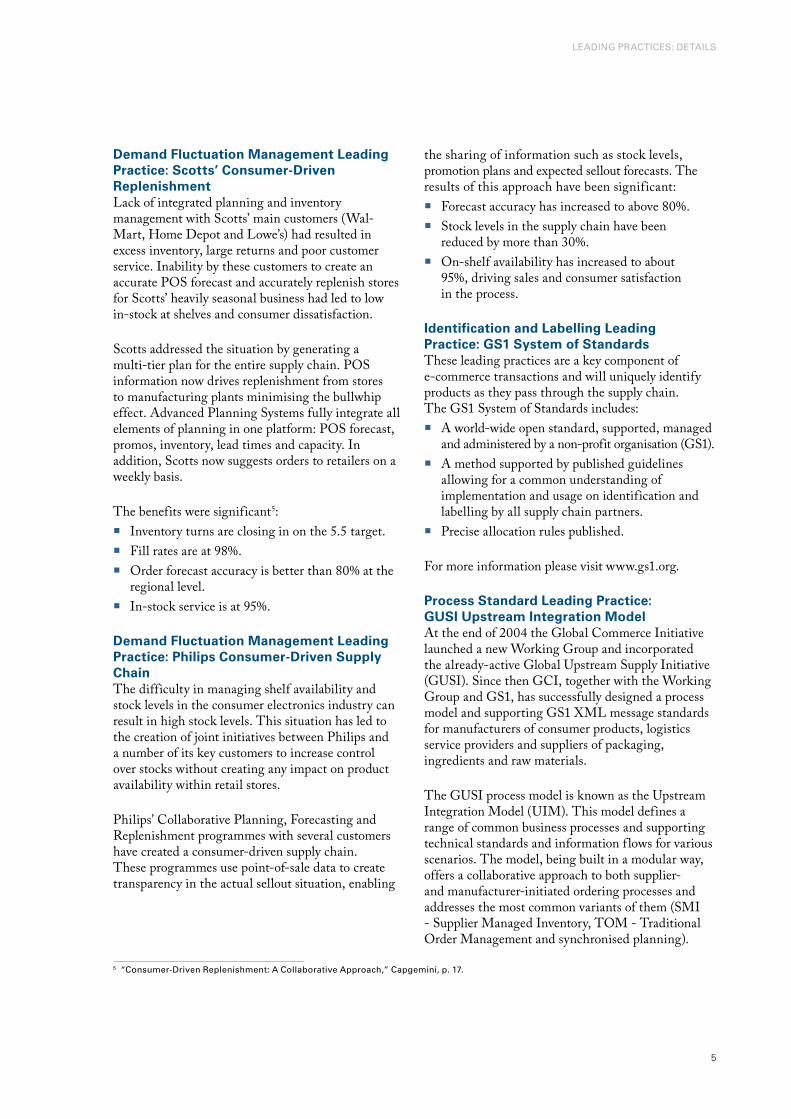
Demand Fluctuation Management Leading Practice: Scotts’ Consumer-Driven ReplenishmentLack of integrated planning and inventory management with Scotts’ main customers (Wal-Mart, Home Depot and Lowe’s) had resulted in excess inventory, large returns and poor customer service. Inability by these customers to create an accurate POS forecast and accurately replenish stores for Scotts’ heavily seasonal business had led to low in-stock at shelves and consumer dissatisfaction.
Scotts addressed the situation by generating a multi-tier plan for the entire supply chain. POS information now drives replenishment from stores to manufacturing plants minimising the bullwhip effect. Advanced Planning Systems fully integrate all elements of planning in one platform: POS forecast, promos, inventory, lead times and capacity. In addition, Scotts now suggests orders to retailers on a weekly basis.
The benefits were significant5:Inventory turns are closing in on the 5.5 target.Fill rates are at 98%.Order forecast accuracy is better than 80% at the regional level.In-stock service is at 95%.
Demand Fluctuation Management Leading Practice: Philips Consumer-Driven Supply ChainThe difficulty in managing shelf availability and stock levels in the consumer electronics industry can result in high stock levels. This situation has led to the creation of joint initiatives between Philips and a number of its key customers to increase control over stocks without creating any impact on product availability within retail stores.
Philips’ Collaborative Planning, Forecasting and Replenishment programmes with several customers have created a consumer-driven supply chain. These programmes use point-of-sale data to create transparency in the actual sellout situation, enabling
°
°
°
°
the sharing of information such as stock levels, promotion plans and expected sellout forecasts. The results of this approach have been significant:
Forecast accuracy has increased to above 80%.Stock levels in the supply chain have been reduced by more than 30%. On-shelf availability has increased to about 95%, driving sales and consumer satisfaction in the process.
Identification and Labelling Leading Practice: GS1 System of StandardsThese leading practices are a key component of e-commerce transactions and will uniquely identify products as they pass through the supply chain. The GS1 System of Standards includes:
A world-wide open standard, supported, managed and administered by a non-profit organisation (GS1).A method supported by published guidelines allowing for a common understanding of implementation and usage on identification and labelling by all supply chain partners.Precise allocation rules published.
For more information please visit www.gs1.org.
Process Standard Leading Practice: GUSI Upstream Integration ModelAt the end of 2004 the Global Commerce Initiative launched a new Working Group and incorporated the already-active Global Upstream Supply Initiative (GUSI). Since then GCI, together with the Working Group and GS1, has successfully designed a process model and supporting GS1 XML message standards for manufacturers of consumer products, logistics service providers and suppliers of packaging, ingredients and raw materials.
The GUSI process model is known as the Upstream Integration Model (UIM). This model defines a range of common business processes and supporting technical standards and information f lows for various scenarios. The model, being built in a modular way, offers a collaborative approach to both supplier- and manufacturer-initiated ordering processes and addresses the most common variants of them (SMI - Supplier Managed Inventory, TOM - Traditional Order Management and synchronised planning).
°
°
°
°
°
°
5 “Consumer-Driven replenishment: a Collaborative approach,” Capgemini, p. 17.
leaDinG praCtiCeS: DetailS
�
Future Supply Chain 2016 APPENDIX
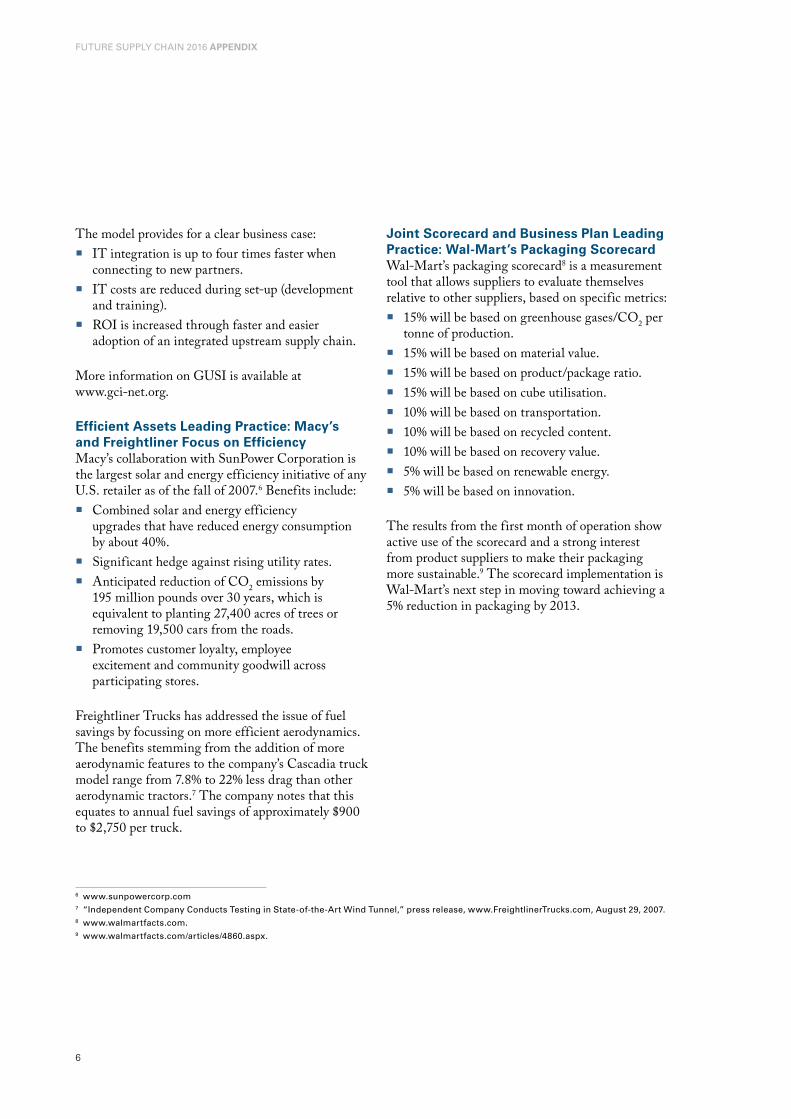
The model provides for a clear business case:IT integration is up to four times faster when connecting to new partners.IT costs are reduced during set-up (development and training).ROI is increased through faster and easier adoption of an integrated upstream supply chain.
More information on GUSI is available at www.gci-net.org.
Efficient Assets Leading Practice: Macy’s and Freightliner Focus on EfficiencyMacy’s collaboration with SunPower Corporation is the largest solar and energy efficiency initiative of any U.S. retailer as of the fall of 2007.6 Benefits include:
Combined solar and energy efficiency upgrades that have reduced energy consumption by about 40%.Significant hedge against rising utility rates.Anticipated reduction of CO2 emissions by 195 million pounds over 30 years, which is equivalent to planting 27,400 acres of trees or removing 19,500 cars from the roads.Promotes customer loyalty, employee excitement and community goodwill across participating stores.
Freightliner Trucks has addressed the issue of fuel savings by focussing on more efficient aerodynamics. The benefits stemming from the addition of more aerodynamic features to the company’s Cascadia truck model range from 7.8% to 22% less drag than other aerodynamic tractors.7 The company notes that this equates to annual fuel savings of approximately $900 to $2,750 per truck.
°
°
°
°
°
°
°
Joint Scorecard and Business Plan Leading Practice: Wal-Mart’s Packaging ScorecardWal-Mart’s packaging scorecard8 is a measurement tool that allows suppliers to evaluate themselves relative to other suppliers, based on specific metrics:
15% will be based on greenhouse gases/CO2 per tonne of production.15% will be based on material value.15% will be based on product/package ratio.15% will be based on cube utilisation.10% will be based on transportation.10% will be based on recycled content.10% will be based on recovery value.5% will be based on renewable energy.5% will be based on innovation.
The results from the first month of operation show active use of the scorecard and a strong interest from product suppliers to make their packaging more sustainable.9 The scorecard implementation is Wal-Mart’s next step in moving toward achieving a 5% reduction in packaging by 2013.
°
°
°
°
°
°
°
°
°
6 www.sunpowercorp.com7 “independent Company Conducts testing in State-of-the-art Wind tunnel,” press release, www.Freightlinertrucks.com, august 29, 2007.8 www.walmartfacts.com.9 www.walmartfacts.com/articles/4860.aspx.
Retailer RDC
Consumer
Store
Sourcing to Manufacturing Manufacturing to Distribution Centre DistributionCentre to Store
Sourcing Flour mill
3PL Cereal’s co-opinformational
system
Miller’s productioncontrol/ordering
system
Warehouse(cereals
cooperative)
Packaging Retailer DC
Cereal production
control/orderingsystem
Cereal processor
Lumber company
Other ingredient
Corrugatedpaper company
Labelmanufacturing
60% of the requirement comes from the farm (farm gate sourcing during
harvest season only )
Weekly delivery schedules
13 d
ay f
ore
cast
Wee
kly
ord
ers
Light trucks2–5 per day
Light trucks5–6 days in a
week
Converting flourto cereals
Heavy-duty truck delivery
during one week out of each year at harvest time (= 2 months)
2-3 trucks x 30 T5 days a week
Inst
anta
neou
sly
upda
ting
stoc
k le
vel
�
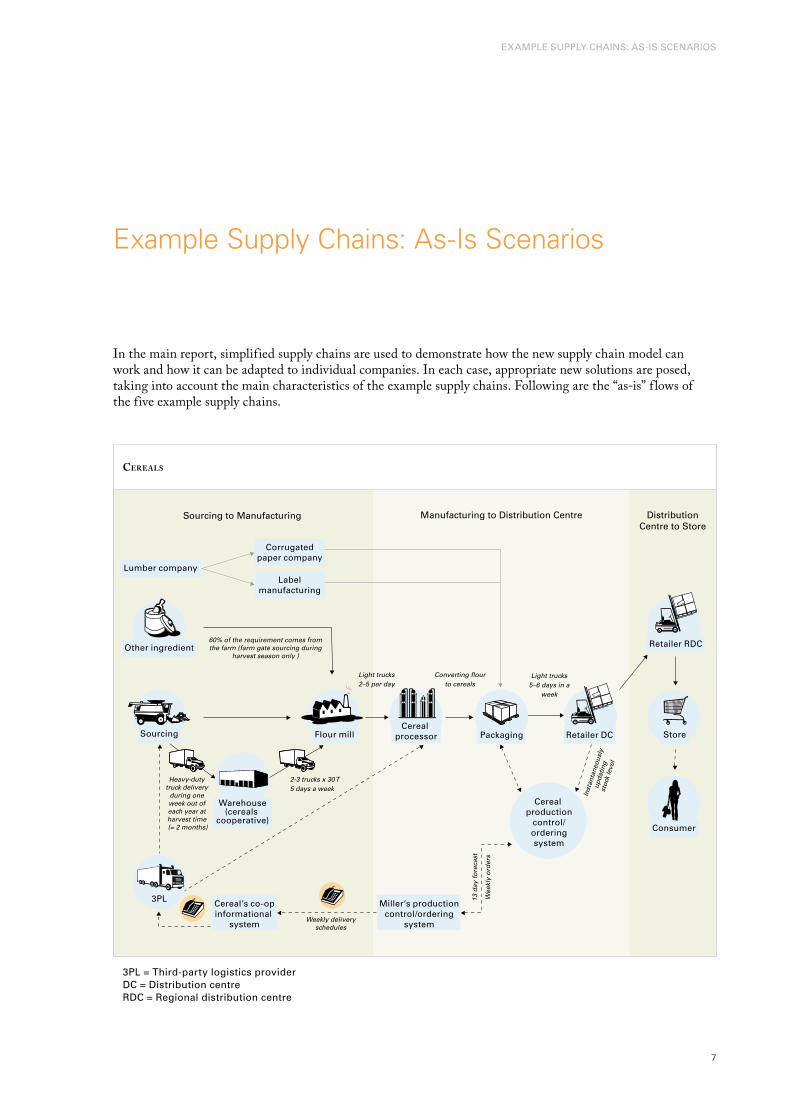
exaMple Supply ChainS: aS-iS SCenariOS
In the main report, simplified supply chains are used to demonstrate how the new supply chain model can work and how it can be adapted to individual companies. In each case, appropriate new solutions are posed, taking into account the main characteristics of the example supply chains. Following are the “as-is” f lows of the five example supply chains.
Cereals
3pl = third-party logistics providerDC = Distribution centrerDC = regional distribution centre
Example Supply Chains: As-Is Scenarios
Importing country
Sourcing to Manufacturing Manufacturing to Distribution Centre Distribution Centre to Store Final Mile to the Consumer
Local componentsourcing
Informationsystem
Technology sourcing
Cla
ss B
&C
+ s
pec
ific
A
R&D centre
Global componentsourcing
30–100 days
Class A + specific B&C
7–45
day
s
Exports
Manufacturing centre
Electronic product recycle chain
3–7 days
Sp
ares
Rem
ote
sal
es30
–10
0d
ays
Finished goods1–5 days
Service centre
Company regionalwarehouse
Localwarehouse
0.5 day1–5 days
1-2 days
Returns repairs cycle1–10 days
Retail warehouse
Retail outlet Home delivery
Recycling
Manufacturing to Distribution Centre
Consumer
Store
Retailer DC or RDC
Distribution
Co-packerPallets of crates or cartons
move in batches
Calls into a call centre
with order details
Carbon, hyflo and dried sludge sent to landfill
Production/bottling/recycling at local/regional level
Daily operation Distributionwarehouse
DistributionCentre
to Store
Productionwarehouse
Landfill
Production and forecasting scheduling
PET recycling plants
Sourcing to Manufacturing
Syrup from the concentrate plant is
weekly transported in Jerry cans/
cartons of 8, 10… 200 litres
Sugar fromcertified mills
Centralisedsourcing
Upstream inventory
Recycle cans
�
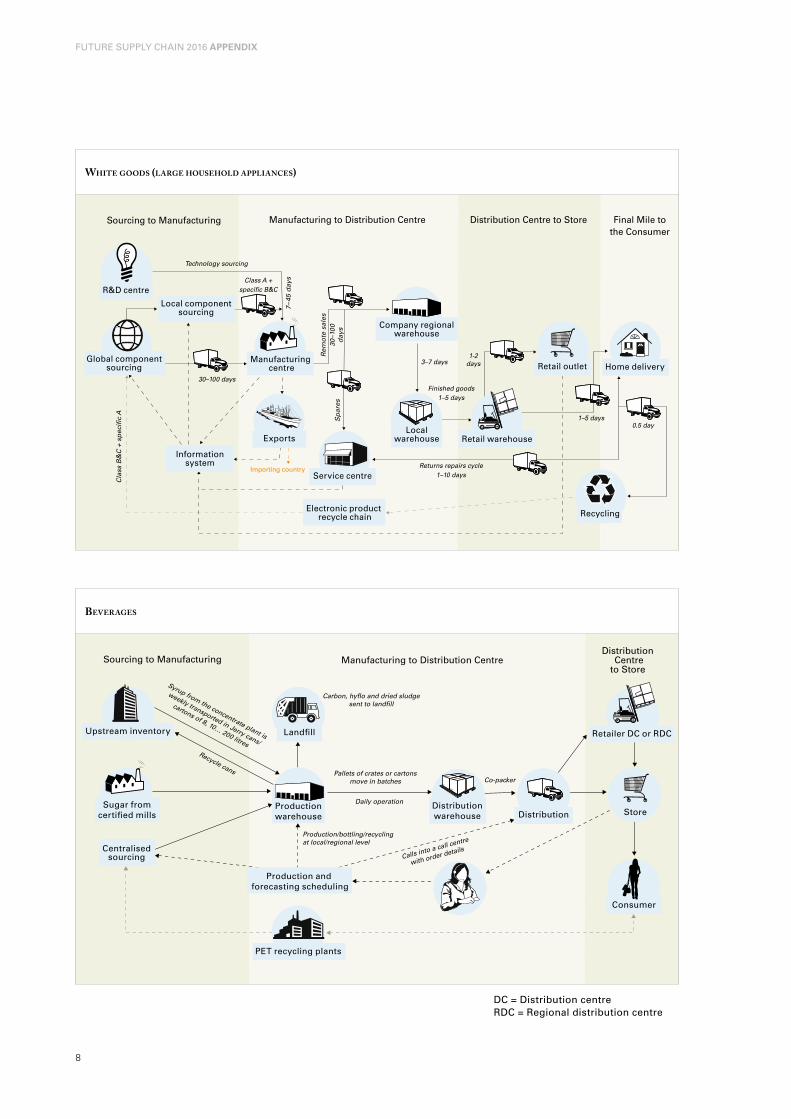
Future Supply Chain 2016 APPENDIX
White goods (large household applianCes)
Beverages
DC = Distribution centrerDC = regional distribution centre
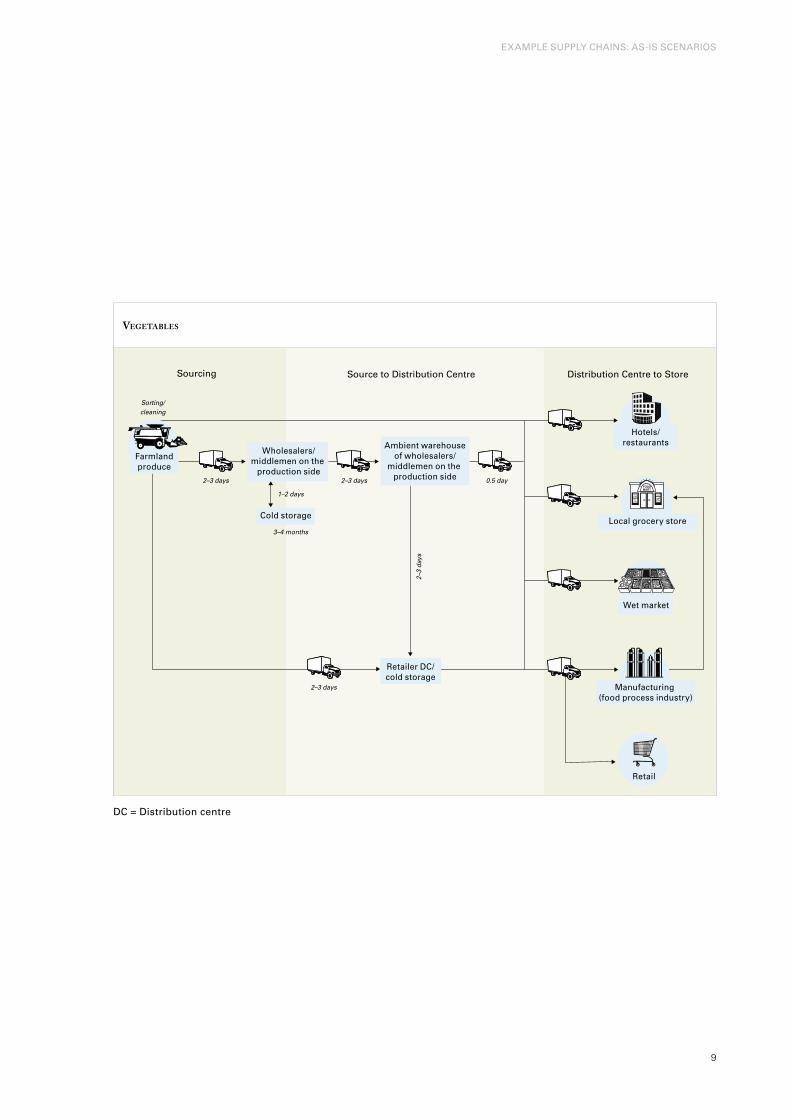
Hotels/restaurants
Wholesalers/middlemen on the
production side
Ambient warehouse of wholesalers/
middlemen on the production side
Retailer DC/cold storage
Sorting/cleaning
2–3 days
2–3 days
2–3
days
1–2 days
3–4 months
2–3 days 0.5 day
Retail
Sourcing Source to Distribution Centre Distribution Centre to Store
Manufacturing (food process industry)
Local grocery storeCold storage
Wet market
Farmlandproduce
�
exaMple Supply ChainS: aS-iS SCenariOS
vegetaBles
DC = Distribution centre
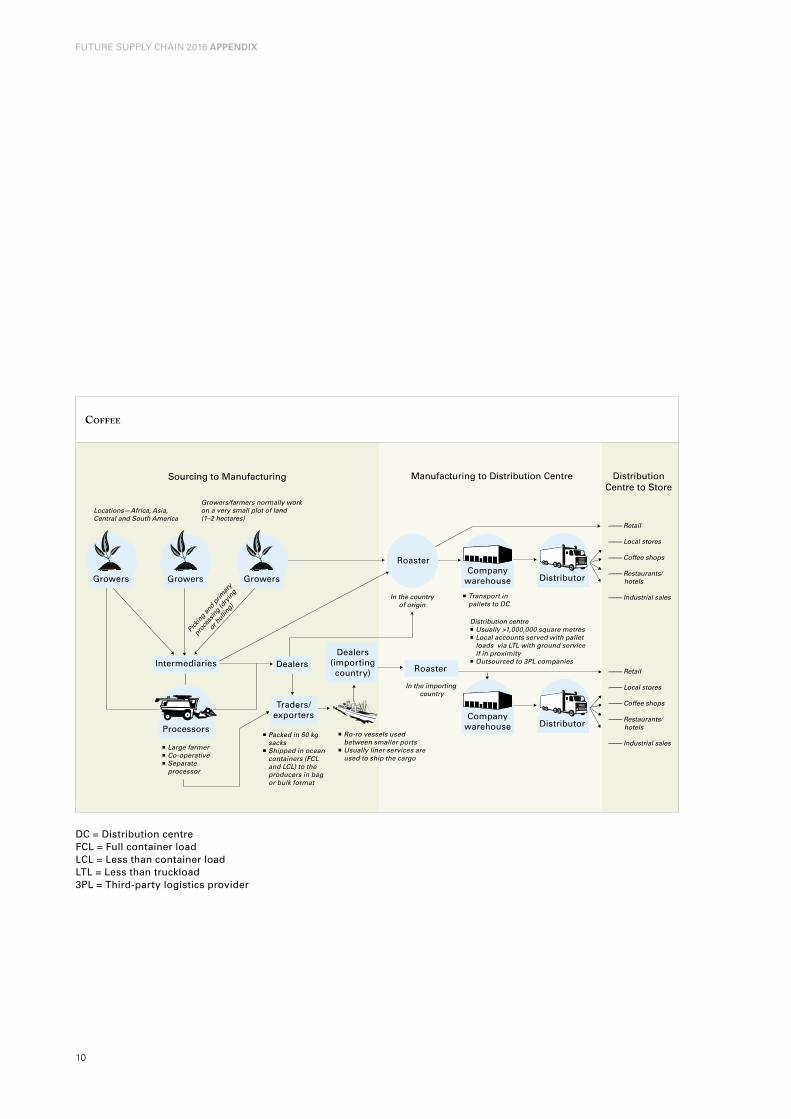
Locations—Africa, Asia, Central and South America
-–––– Retail
-–––– Local stores
-–––– Coffee shops
-–––– Restaurants/hotels
-–––– Industrial sales
-–––– Retail
-–––– Local stores
-–––– Coffee shops
-–––– Restaurants/hotels
-–––– Industrial sales
In the countryof origin
n Transport in pallets to DC
Distribution centren Usually >1,000,000 square metresn Local accounts served with pallet
loads via LTL with ground service if in proximity
n Outsourced to 3PL companies
Growers/farmers normally workon a very small plot of land(1–2 hectares)
Traders/exporters
Dealers(importingcountry)
Sourcing to Manufacturing Manufacturing to Distribution Centre DistributionCentre to Store
Roaster
RoasterDealers
CompanywarehouseGrowersGrowersGrowers Distributor
Companywarehouse Distributor
In the importing country
n Large farmern Co-operativen Separate
processor
n Ro-ro vessels used between smaller ports
n Usually liner services are used to ship the cargo
n Packed in 60 kgsacks
n Shipped in ocean containers (FCL and LCL) to the producers in bag or bulk format
Pick
ing
and
prim
ary
proc
essin
g (d
ryin
g
or h
ullin
g)
Intermediaries
Processors
10
Future Supply Chain 2016 APPENDIX
Coffee
DC = Distribution centreFCl = Full container loadlCl = less than container loadltl = less than truckload3pl = third-party logistics provider
11
CalCulatiOn MODelS: DetailS
The main report examines new ways to calculate the impact on the supply chain. These calculation models, using the new parameters such as energy consumption, CO2 emissions and traffic congestion, are an essential element of the future supply chain in determining the impact of the leading practices and solutions. The report examines the general characteristics of such calculation models; more detail on actual examples of these calculations follows.
Collaborative city replenishment: The issue of city replenishment will grow in the future as stricter regulations focussed on entering cities are implemented to combat increased traffic congestion. In London, for example, the toll area for entering the city centre is expanding. Future regulations may focus not only on entering cities but also on air quality.
An example from Amsterdam demonstrates how the benefits of a city replenishment solution might be calculated. Outside the city are three city hubs—distribution centres in which goods are cross-docked to containers. These containers are put on a tram that goes into the city. Small electric trucks bring the containers from a tram pick-up point to the store. The system has several benefits:
Reduced traffic congestion due to fewer trucks in the inner cityReduced CO2 emissions Lower energy usage Reduced noise pollution, less road maintenance
°
°
°
°
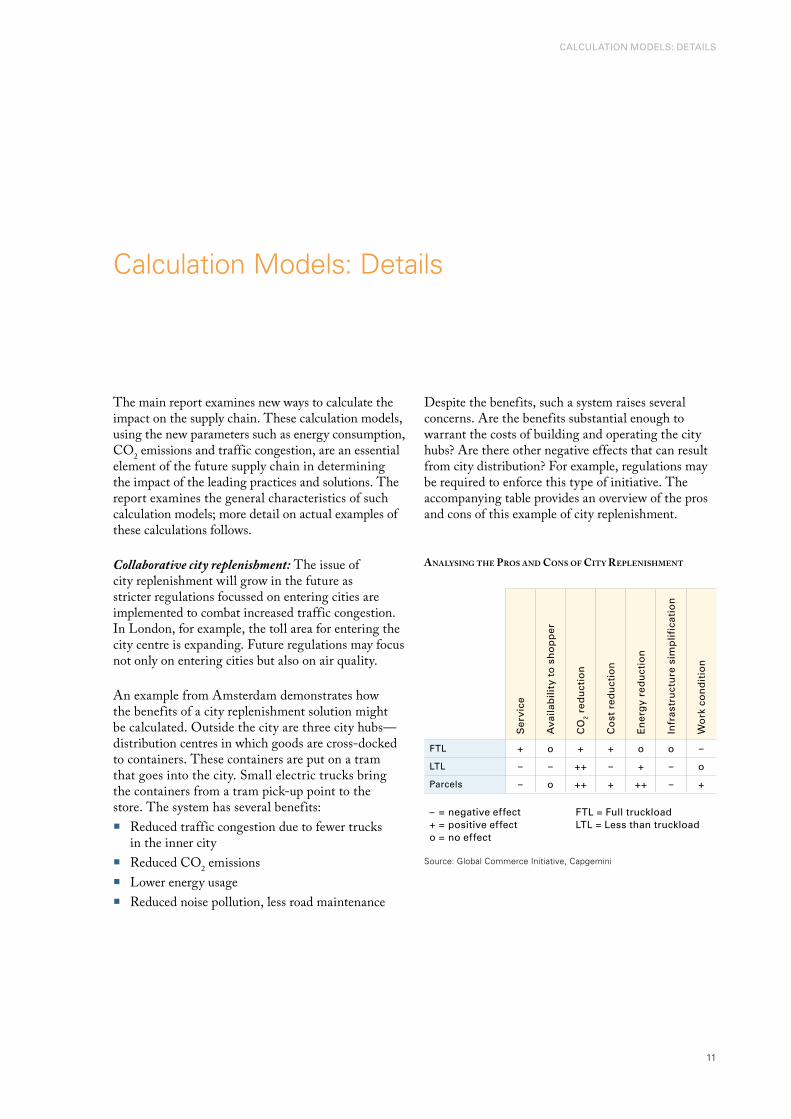
Despite the benefits, such a system raises several concerns. Are the benefits substantial enough to warrant the costs of building and operating the city hubs? Are there other negative effects that can result from city distribution? For example, regulations may be required to enforce this type of initiative. The accompanying table provides an overview of the pros and cons of this example of city replenishment.
Calculation Models: Details
analysing the pros and Cons of City replenishment
Ser
vice
ava
ilab
ility
to
sh
op
per
CO
2 re
du
ctio
n
Co
st r
edu
ctio
n
en
erg
y re
du
ctio
n
infr
astr
uct
ure
sim
plif
icat
ion
Wo
rk c
on
dit
ion
Ftl + o + + o o –
ltl – – ++ – + – o
parcels – o ++ + ++ – +
– = negative effect + = positive effect o = no effect
Ftl = Full truckloadltl = less than truckload
Source: Global Commerce Initiative, Capgemini
12
Future Supply Chain 2016 APPENDIX
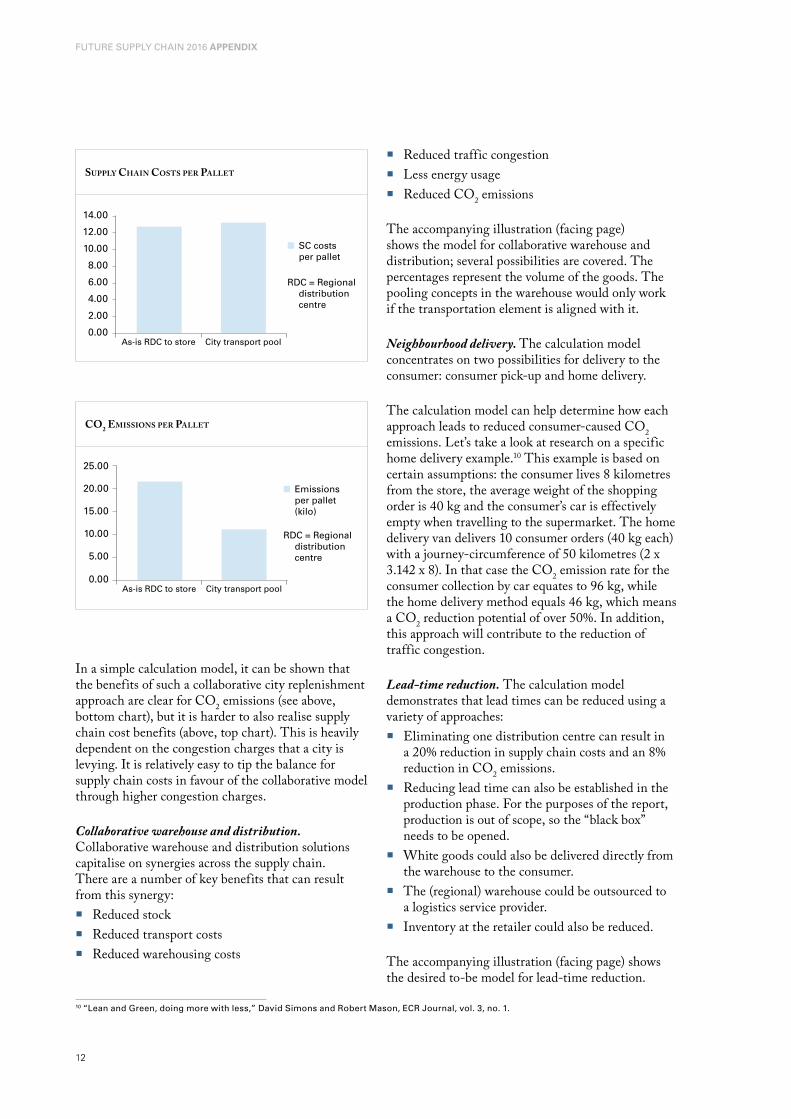
In a simple calculation model, it can be shown that the benefits of such a collaborative city replenishment approach are clear for CO2 emissions (see above, bottom chart), but it is harder to also realise supply chain cost benefits (above, top chart). This is heavily dependent on the congestion charges that a city is levying. It is relatively easy to tip the balance for supply chain costs in favour of the collaborative model through higher congestion charges.
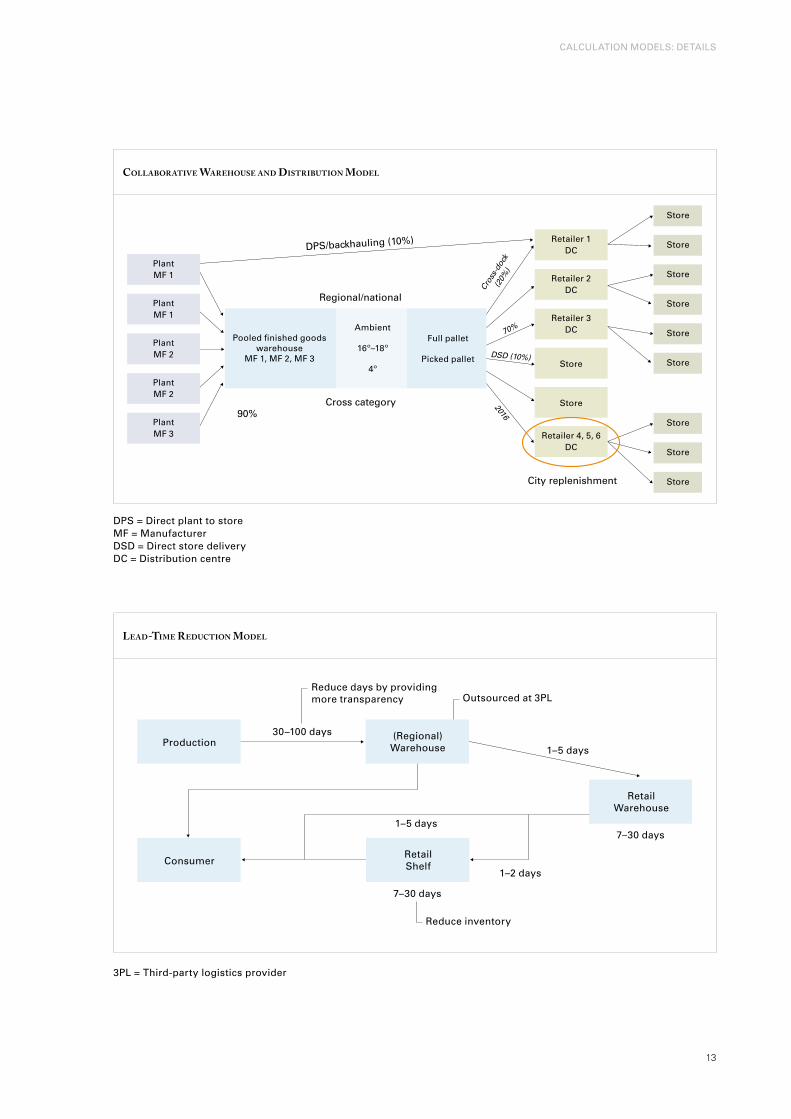
Collaborative warehouse and distribution. Collaborative warehouse and distribution solutions capitalise on synergies across the supply chain. There are a number of key benefits that can result from this synergy:
Reduced stockReduced transport costsReduced warehousing costs
°
°
°
supply Chain Costs per pallet
0.00As-is RDC to store City transport pool
2.00
4.00
6.00
8.00
10.00
12.00
14.00
SC costs per pallet
RDC = Regional distributioncentre
Co2 emissions per pallet
0.00As-is RDC to store City transport pool
25.00
20.00
15.00
10.00
5.00
Emissions per pallet (kilo)
RDC = Regional distributioncentre
Reduced traffic congestionLess energy usageReduced CO2 emissions
The accompanying illustration (facing page) shows the model for collaborative warehouse and distribution; several possibilities are covered. The percentages represent the volume of the goods. The pooling concepts in the warehouse would only work if the transportation element is aligned with it.
Neighbourhood delivery. The calculation model concentrates on two possibilities for delivery to the consumer: consumer pick-up and home delivery.
The calculation model can help determine how each approach leads to reduced consumer-caused CO2 emissions. Let’s take a look at research on a specific home delivery example.10 This example is based on certain assumptions: the consumer lives 8 kilometres from the store, the average weight of the shopping order is 40 kg and the consumer’s car is effectively empty when travelling to the supermarket. The home delivery van delivers 10 consumer orders (40 kg each) with a journey-circumference of 50 kilometres (2 x 3.142 x 8). In that case the CO2 emission rate for the consumer collection by car equates to 96 kg, while the home delivery method equals 46 kg, which means a CO2 reduction potential of over 50%. In addition, this approach will contribute to the reduction of traffic congestion.
Lead-time reduction. The calculation model demonstrates that lead times can be reduced using a variety of approaches:
Eliminating one distribution centre can result in a 20% reduction in supply chain costs and an 8% reduction in CO2 emissions. Reducing lead time can also be established in the production phase. For the purposes of the report, production is out of scope, so the “black box” needs to be opened. White goods could also be delivered directly from the warehouse to the consumer.The (regional) warehouse could be outsourced to a logistics service provider. Inventory at the retailer could also be reduced.
The accompanying illustration (facing page) shows the desired to-be model for lead-time reduction.
°
°
°
°
°
°
°
°
10 “lean and Green, doing more with less,” David Simons and robert Mason, eCr Journal, vol. 3, no. 1.
1�
CalCulatiOn MODelS: DetailS
CollaBorative Warehouse and distriBution model
Store
Store
Store
Store
Store
Store
Store
Store
Store
Retailer 1DC
Retailer 2DC
Retailer 3DC
Store
Store
Retailer 4, 5, 6DC
City replenishment
70%
DSD (10%)
2016
Cros
s-do
ck(2
0%)
Ambient
16º–18º
4º
Cross category90%
Regional/national
DPS/backhauling (10%)
Pooled finished goodswarehouse
MF 1, MF 2, MF 3
Full pallet
Picked pallet
PlantMF 1
PlantMF 1
PlantMF 2
PlantMF 2
PlantMF 3
DpS = Direct plant to storeMF = ManufacturerDSD = Direct store deliveryDC = Distribution centre
lead-time reduCtion model
Production
Outsourced at 3PLReduce days by providing more transparency
7–30 days
1–5 days
1–2 days
30–100 days
1–5 days
7–30 days
Consumer
(Regional)Warehouse
RetailWarehouse
RetailShelf
Reduce inventory
3pl = third-party logistics provider
1�
Future Supply Chain 2016 APPENDIX
Co2 emissions loCal sourCing model
China LocalPoland China (air)
Total Cost (€/kg product)
€10.00
€20.00
€30.00
€40.00
€50.00
€60.00
Inventorycosts
Emissionscosts
Transportcosts
Productcosts
China LocalPoland China (air)
CO2 Emissions (gr/kg product)
0
1000
2000
3000
4000
5000
6000
7000
8000
9000
TransportCO2
Source: Capgemini research
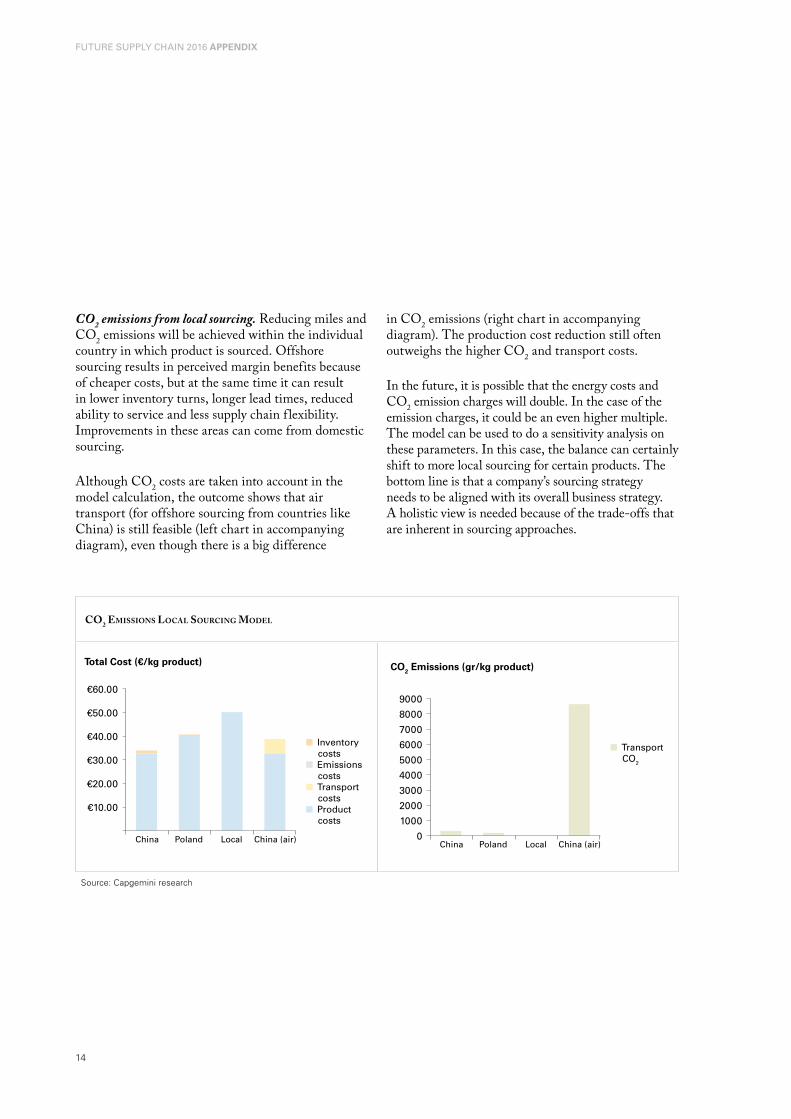
CO2 emissions from local sourcing. Reducing miles and CO2 emissions will be achieved within the individual country in which product is sourced. Offshore sourcing results in perceived margin benefits because of cheaper costs, but at the same time it can result in lower inventory turns, longer lead times, reduced ability to service and less supply chain f lexibility. Improvements in these areas can come from domestic sourcing.
Although CO2 costs are taken into account in the model calculation, the outcome shows that air transport (for offshore sourcing from countries like China) is still feasible (left chart in accompanying diagram), even though there is a big difference
in CO2 emissions (right chart in accompanying diagram). The production cost reduction still often outweighs the higher CO2 and transport costs.
In the future, it is possible that the energy costs and CO2 emission charges will double. In the case of the emission charges, it could be an even higher multiple. The model can be used to do a sensitivity analysis on these parameters. In this case, the balance can certainly shift to more local sourcing for certain products. The bottom line is that a company’s sourcing strategy needs to be aligned with its overall business strategy. A holistic view is needed because of the trade-offs that are inherent in sourcing approaches.
1�
the inteGrateD MODel: FrOM prODuCtiOn tO COnSuMer
To illustrate how all the improvements suggested in the main report can reinforce each other, the different calculation models have been combined into one integrated model, where the trade-offs between the various solutions are integrated in such a way that the impact on all of the chosen KPIs becomes positive.
The model takes a slice from the current f low of goods – from plant to store – and shows how a combination of shared warehousing, lead-time reduction, shared transport to urban areas and shared transport to non-urban areas can be combined in a favourable way.
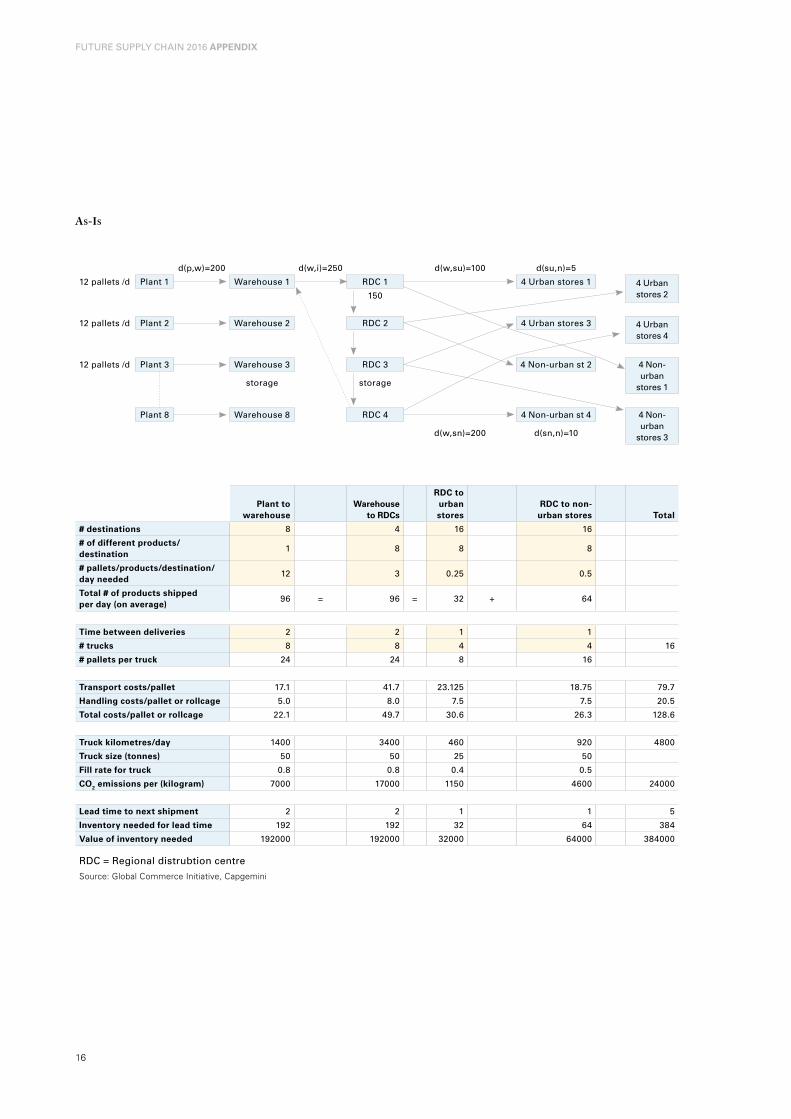
On the following page are the parameters that illustrate the current situation, which considers eight manufacturers delivering equal amounts of products per day to four different retailers. These eight manufacturers each have their own warehouse and the four retailers each have their own (regional) distribution centre. Delivery to the four urban stores and four non-urban stores is done by each retailer from its regional distribution centre (RDC) using different urban and non-urban routes.
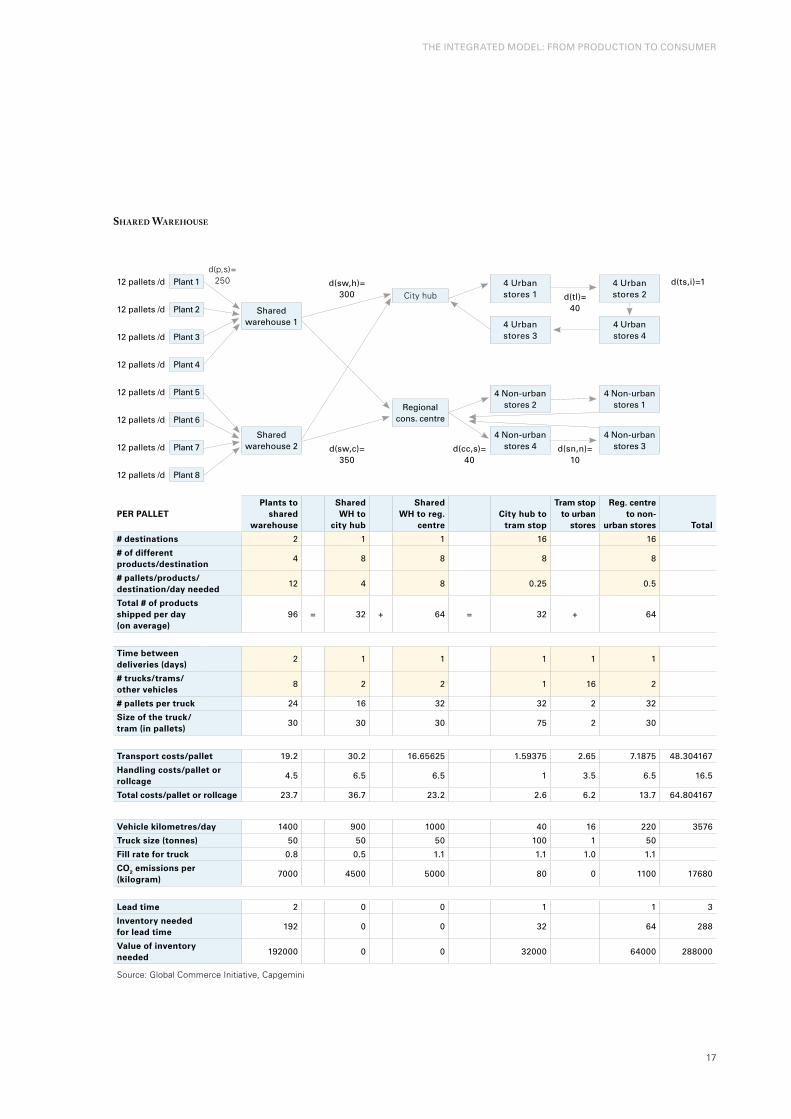
In the new integrated model (see page 17), the eight manufacturers are arranged into two groups of four, each running a collaborative warehouse. From these collaborative warehouses, store-picked orders are shipped in (fuller) truckloads to either a city hub or a regional consolidation centre, where the different streams are efficiently merged into store replenishment routes.
In the case of urban replenishment, alternative transport is used into the city, reducing not only the total number of city kilometres, but also reducing the CO2 emissions per city kilometre. In the case of non-urban replenishment, stores of different retailers are even consolidated into more efficient store replenishment, such as one route per village or municipality.
From this description, it should be clear that to realise this to-be model, all the collaborative concepts discussed in the report are needed, including the POS/on-shelf availability sharing to effectively plan such an integrated stream of products.
The Integrated Model: From Production to Consumer
1�
Future Supply Chain 2016 APPENDIX
as-is
d(p,w)=200 d(w,i)=250 d(w,su)=100 d(su,n)=5
12 pallets /d plant 1 Warehouse 1 rDC 1 4 urban stores 1 4 urban stores 2150
12 pallets /d plant 2 Warehouse 2 rDC 2 4 urban stores 3 4 urban stores 4
12 pallets /d plant 3 Warehouse 3 rDC 3 4 non-urban st 2 4 non- urban
stores 1storage storage
plant 8 Warehouse 8 rDC 4 4 non-urban st 4 4 non-urban
stores 3d(w,sn)=200 d(sn,n)=10
Plant to warehouse
Warehouse to RDCs
RDC to urban stores
RDC to non- urban stores Total
# destinations 8 4 16 16
# of different products/destination
1 8 8 8
# pallets/products/destination/day needed
12 3 0.25 0.5
Total # of products shipped per day (on average)
96 = 96 = 32 + 64
Time between deliveries 2 2 1 1
# trucks 8 8 4 4 16
# pallets per truck 24 24 8 16
Transport costs/pallet 17.1 41.7 23.125 18.75 79.7
Handling costs/pallet or rollcage 5.0 8.0 7.5 7.5 20.5
Total costs/pallet or rollcage 22.1 49.7 30.6 26.3 128.6
Truck kilometres/day 1400 3400 460 920 4800
Truck size (tonnes) 50 50 25 50
Fill rate for truck 0.8 0.8 0.4 0.5
CO2 emissions per (kilogram) 7000 17000 1150 4600 24000
Lead time to next shipment 2 2 1 1 5
Inventory needed for lead time 192 192 32 64 384
Value of inventory needed 192000 192000 32000 64000 384000
rDC = regional distrubtion centre
Source: Global Commerce Initiative, Capgemini
1�
shared Warehouse
d(p,s)= 2�012 pallets /d plant 1 d(sw,h)=
3004 urban stores 1
4 urban stores 2
d(ts,i)=1
City hub d(tl)= 4012 pallets /d plant 2 Shared
warehouse 1 4 urban stores 3
4 urban stores 412 pallets /d plant 3
12 pallets /d plant 4
12 pallets /d plant 5 4 non-urban stores 2
4 non-urban stores 1regional
cons. centre12 pallets /d plant 6
Shared warehouse 2
4 non-urban stores 4
4 non-urban stores 312 pallets /d plant 7 d(sw,c)=
350d(cc,s)=
40d(sn,n)=
10
12 pallets /d plant 8
PER PALLETPlants to
shared warehouse
Shared WH to
city hub
Shared WH to reg.
centreCity hub to
tram stop
Tram stop to urban
stores
Reg. centre to non-
urban stores Total
# destinations 2 1 1 16 16
# of different products/destination
4 8 8 8 8
# pallets/products/ destination/day needed
12 4 8 0.25 0.5
Total # of products shipped per day (on average)
96 = 32 + 64 = 32 + 64
Time between deliveries (days)
2 1 1 1 1 1
# trucks/trams/ other vehicles
8 2 2 1 16 2
# pallets per truck 24 16 32 32 2 32
Size of the truck/ tram (in pallets)
30 30 30 75 2 30
Transport costs/pallet 19.2 30.2 16.65625 1.59375 2.65 7.1875 48.304167
Handling costs/pallet or rollcage
4.5 6.5 6.5 1 3.5 6.5 16.5
Total costs/pallet or rollcage 23.7 36.7 23.2 2.6 6.2 13.7 64.804167
Vehicle kilometres/day 1400 900 1000 40 16 220 3576
Truck size (tonnes) 50 50 50 100 1 50
Fill rate for truck 0.8 0.5 1.1 1.1 1.0 1.1
CO2 emissions per (kilogram)
7000 4500 5000 80 0 1100 17680
Lead time 2 0 0 1 1 3
Inventory needed for lead time
192 0 0 32 64 288
Value of inventory needed
192000 0 0 32000 64000 288000
Source: Global Commerce Initiative, Capgemini
the inteGrateD MODel: FrOM prODuCtiOn tO COnSuMer
1�
Future Supply Chain 2016 APPENDIX
Cost and Cost improvement Comparison for different Kpis
0 10.00 20.00 30.00 40.00 50.00 60.00 70.00 80.00 90.00
Inventory cost forlead time/per pallet
Emissions offset perpallet
Handling costs perpallet
Transport costs perpallet
Cost comparison per pallet
Collaborative approach As-is plant to store
Source: Global Commerce Initiative, Capgemini
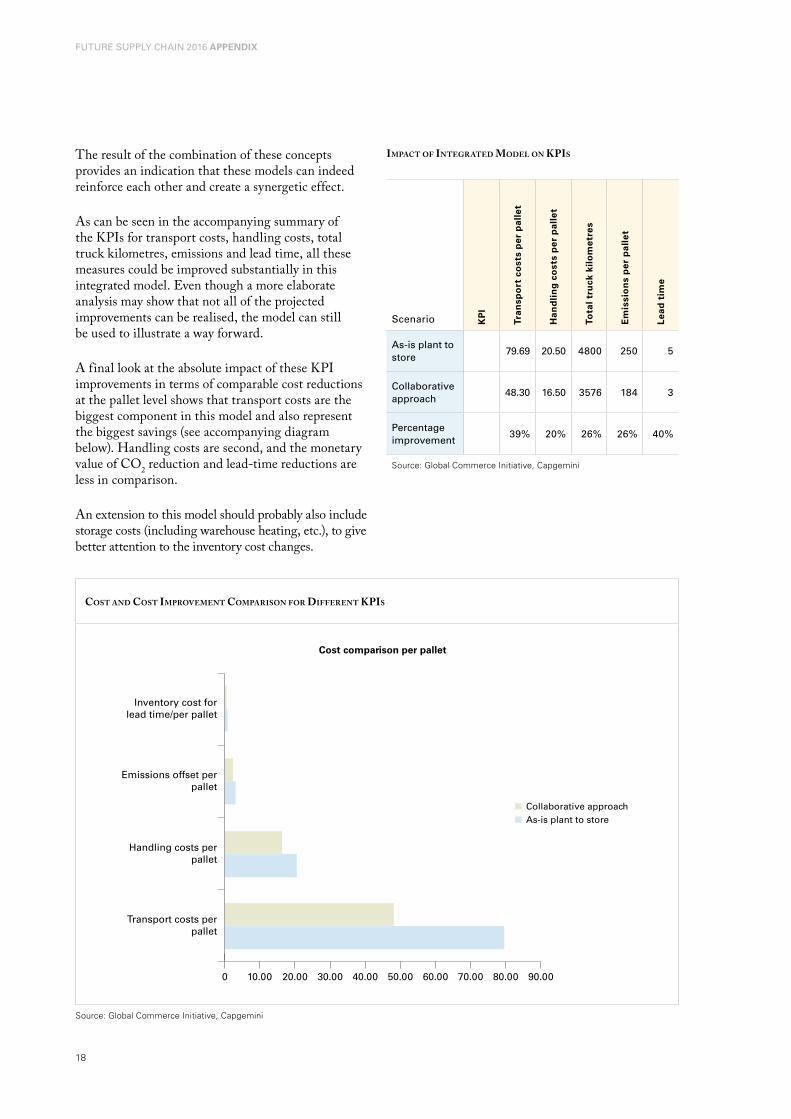
The result of the combination of these concepts provides an indication that these models can indeed reinforce each other and create a synergetic effect.
As can be seen in the accompanying summary of the KPIs for transport costs, handling costs, total truck kilometres, emissions and lead time, all these measures could be improved substantially in this integrated model. Even though a more elaborate analysis may show that not all of the projected improvements can be realised, the model can still be used to illustrate a way forward.
A final look at the absolute impact of these KPI improvements in terms of comparable cost reductions at the pallet level shows that transport costs are the biggest component in this model and also represent the biggest savings (see accompanying diagram below). Handling costs are second, and the monetary value of CO2 reduction and lead-time reductions are less in comparison.
An extension to this model should probably also include storage costs (including warehouse heating, etc.), to give better attention to the inventory cost changes.
impaCt of integrated model on Kpis
Scenario KP
I
Tran
spo
rt c
ost
s p
er p
alle
t
Han
dli
ng
co
sts
per
pal
let
Tota
l tru
ck k
ilo
met
res
Em
issi
on
s p
er p
alle
t
Lead
tim
e
as-is plant to store
79.69 20.50 4800 250 5
Collaborative approach
48.30 16.50 3576 184 3
percentage improvement
39% 20% 26% 26% 40%
Source: Global Commerce Initiative, Capgemini
1�
GlOSSary OF terMS
Global Scorecard a Capability assessment tool designed to give companies a detailed understanding of their eCr capability, which allows companies to check their conformance to specific GCi-endorsed standards and to highlight specific improvement opportunities for them. For more information please visit www.globalscorecard.net.
Global Trade Item Number (GTIN) Gtin is a 14- digit ean.uCC number used to identify products and services.
Greenhouse Effect the greenhouse effect is the process by which the emission of infrared radiation by the atmosphere warms a planet’s surface.
GS1 GS1 is a leading global organisation dedicated to the design and implementation of global standards and solutions to improve efficiency and visibility in supply and demand chains globally and across sectors. For more information please visit www.gs1.org.
Inventory the average level of stock in a given point of the supply chain at a given point in time.
Key Performance Indicator (KPI) Measures that are deemed essential in monitoring the performance of a business; e.g., service level, profitability.
Lead Time Cycle time between order placement and delivery of goods. lead times are usually expressed in days or hours.
Logistics Service Provider (LSP) Company that offers a range of transport, warehousing, distribution and related services to other companies in the supply chain. also called third-party distribution companies, 3pl or contract distribution companies. Currently a new generation of logistics service providers is emerging, so-called 4pl (fourth-party logistics) – these are companies that provide overall management of logistics networks and lSps on behalf of manufacturers and retailers.
Glossary of Terms
Biodegradable Packaging Biodegradable packaging consists of materials that will easily break down and disappear into the soil or the atmosphere, without causing damage to either.
Category a category is a distinct, manageable group of products/services that consumers perceive to be interrelated and/or substitutable in meeting a consumer need.
CO2 Carbon dioxide (chemical formula: CO2) is a chemical compound composed of two oxygen atoms covalently bonded to a single carbon atom. it is a gas at standard temperature and pressure and exists in earth’s atmosphere in this state. Carbon dioxide is an important greenhouse gas because it transmits visible light but absorbs strongly in the infrared.
Cross-Docking a product handling concept where stock for store orders is not put away into warehouse racking for later picking but is either processed into store orders, or arrive ready assembled. this can mean breaking down the inbound delivery into store-ready consignments or, if consignments are pallet sized, moving pallets across the docking areas (hence the name) for loading onto delivery vehicles.
ECR Europe eCr europe is a joint trade and industry body, launched in 1994 to make the grocery sector as a whole more responsive to consumer demand and promote the removal of unnecessary costs from the supply chain. For more information please visit www.ecrnet.org.
Efficient Consumer Response (ECR) a joint initiative by members of the supply chain to work to improve and optimise aspects of the supply chain and demand management to create benefits for the consumer; e.g., lower prices, more choice, better product availability. the mission of eCr europe is “to serve the consumer better, faster and at lower costs.”
Global Location Number (GLN) Gln is a 13-digit ean.uCC code that identifies a physical, functional or legal entity.
20
Future Supply Chain 2016 APPENDIX
Master Data any item and party data applicable across multi-business transactions; it can be neutral – constant across all trading partners (e.g., product size, name of manufacturer) – or relationship dependent (e.g., price).
National Distribution Centre (NDC) a large single stock holding point serving retailer regional distribution centres and other customers in either domestic or international markets.
New Product Introductions (NPI) the term that refers to the process of developing and launching a new product. alternatively known as new product Development (npD).
Point-of-Sale Data (POS Data) pOS data are all information captured at an identified point of sale (pOS) and generated by the act of purchase; this includes both product and consumer-related data. For the sake of manageability, the eCr pOS Data Management project has currently limited its scope to product data only.
Product Recycling product recycling focusses on the reprocessing of materials into new products. recycling consists of collecting used products, components and/or materials, disassembling them, separating them into categories and processing them into recycled products, components and/or materials.
Radio Frequency Identification (RFID) rFiD is a technology that uses radio frequency waves to transfer data between a reader and a tagged movable item to identify, track or locate that item. rFiD does not require physical sight or contact between the reader (scanner) and the tagged item. Broadly speaking all rFiD tags (also called intelligent tags or smart labels) comprise a semi-conductor chip with memory processing capability and a transmitter connected to an antenna. the advantage of rFiD over traditional barcode-based technologies is that it does not require line of sight and can read in bulk.
Recyclable Packaging recyclable packaging is made of materials that can be used again, usually after processing, for packaging or some another purpose. recyclable packaging materials include glass, metal, cardboard and paper.
Regional Distribution Centre (RDC) a distribution point operated by or on behalf of a retailer that serves a number of stores in an area with a range of products.
Return on Investment (ROI) in finance, rate of return (rOr) or return on investment (rOi), or sometimes just return, is the ratio of money gained or lost on an investment relative to the amount of money invested.
Reusable Packaging reusable packaging includes examples such as glass bottles, which can be cleaned and reused to distribute and store the same product or something else.
Reverse Logistics logistics designed to reprocess assets, materials, packaging, products or other components that can be recycled, reused or remanufactured.
Service Level the extent to which demand is met by availability of product. Service level is usually expressed as a percentage and can be measured at a number of points in the supply chain; e.g., 95% service levels means that the product is available 95% of the time or 95 out of 100 customers will be able to buy the product.
SSCC (Serial Shipping Container Code) the SSCC is the GS1 identification Key for an item of any composition established for transport and/or storage that needs to be managed through the supply chain.
Stock Keeping Unit (SKU) trading unit (e.g., case, tray, promotional shipper, pallet) that can be ordered by customers and handled in the supply chain. it is labelled with a uniquely identifiable trade item number. it may internally consist of consumer units (product package size as sold to consumers) or other trading units.
Synchronised Production Manufacturing aims to co-ordinate production to match demand for product. rather than manufacturing to build stock levels or to forecast, products are made to order not for inventory.
21
About the Global Commerce Initiative (GCI)
The Global Commerce Initiative (GCI) was established in October 1999 as a voluntary platform. Its mission is to lead global value chain collaboration through the identification of business needs and the implementation of best practices and standards to serve consumers better, faster and at less cost.
It is a network created by the member companies and sponsors to simplify global commerce and link the value chains to improve consumer value.
GCI operates through an Executive Board composed of senior representatives of more than 45 companies drawn equally from manufacturing and retailing that do business across continents or via global supply chains. It works closely with eight partner organisations – the regional ECR Initiatives and VICS, four trade associations (AIM, CIES, GMA and FMI) and the standards organisations GS1 and GS1US – representing more than 1 million companies in the world.
For more information about the Global Commerce Initiative and questions raised by this report, please contact:
Sabine RitterGlobal Commerce Initiative (GCI)+49 221 947 14 [email protected]
Ruediger HagedornGlobal Commerce Initiative (GCI)+49 221 947 14 [email protected]
or visit our website at www.gci-net.org.
About Capgemini and the Collaborative Business Experience
Capgemini, one of the world’s foremost providers of Consulting, Technology and Outsourcing services, has a unique way of working with its clients, called the Collaborative Business Experience. Backed by over three decades of industry and service experience, the Collaborative Business Experience is designed to help our clients achieve better, faster, more sustainable results through seamless access to our network of world-leading technology partners and collaboration-focussed methods and tools. Through commitment to mutual success and the achievement of tangible value, we help businesses implement growth strategies, leverage technology, and thrive through the power of collaboration. Capgemini employs approximately 83,500 people worldwide and reported 2007 global revenues of 8.7 billion euros.
More information about individual service lines, offices and research is available at www.capgemini.com.
For additional information please contact:
Kees JacobsCapgemini+31 6 53 292 [email protected]
Ard Jan VethmanCapgemini+31 6 533 94 [email protected]
Brian GirouardCapgemini+1 952 212 [email protected]
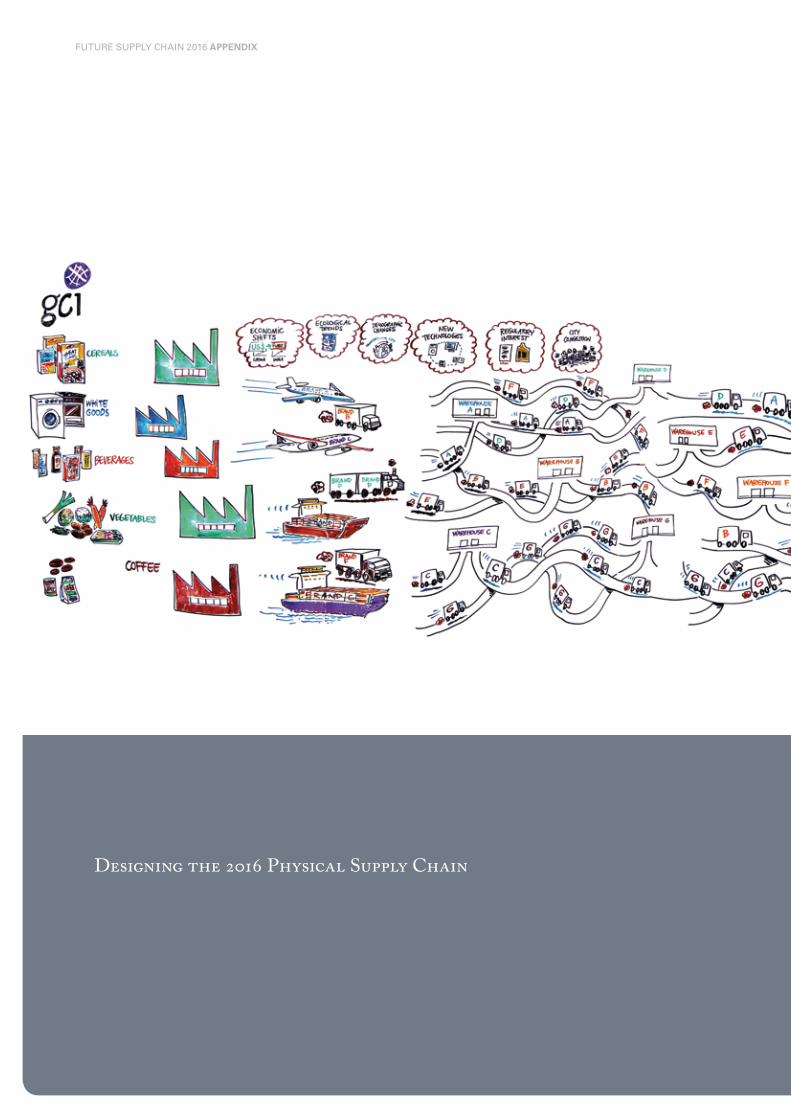
Designing the 2016 Physical Supply Chain
Future Supply Chain 2016 APPENDIX

www.gci-net.org
www.capgemini.com