Embed Size (px)
Citation preview

FY 2011
Portfolio of Goals
FY 2011
Portfolio of Goals

PORTFOLIO OF GOALS FY 2011
TABLE OF CONTENTS
Increased Safety
Measures Lead Page Commercial Air Carrier Fatality Rate …………………………………………………………………………
AVS
1
General Aviation Fatal Accident Rate…………………………………………………………………………
AVS
4
Alaska Accident Rate ………………………………………………………………………………………………
AVS
7
Runway Incursions (A&B) ………………………………………………………………………………………
ATO
10
Total Runway Incursions…………………………………………………………………………………………
ATO
12
Commercial Space Launch Accidents………………………………………………………………………
AST
14
System Risk Event Rate…………………………………………………………………………………………
ATO
16
Safety Management System……………………………………………………………………………………
AVS
18
Greater Capacity
Measures Lead Page Average Daily Airport Capacity (Core Airports)………………………………………………………
ATO
20
Average Daily Airport Capacity (7 Metro Areas)…………………………………………………………
ATO
22
Adjusted Operational Availability………………………………………………………………………………
ATO
24
NAS On-Time Arrivals………………………………………………………………………………………………
ATO
26
Noise Exposure………………………………………………………………………………………………………
APL
28
Aviation Fuel Efficiency……………………………………………………………………………………………
APL
32
International Leadership
Measures Lead Page Global Safety Enhancements ……………………………………………………………………………………
APL
35
International Aviation Development Projects ……………………………………………………………
APL
37
Aviation Leaders……………………………………………………………………………………………………
APL
39
NextGen Technologies……………………………………………………………………………………………
ATO
41
Organizational Excellence
Measures Lead Page OPM Hiring Standard ………………………………………………………………………………………………
AHR
44
Reduce Workplace Injuries………………………………………………………………………………………
AHR
46
Grievance Processing Time………………………………………………………………………………………
AHR
48
Air Traffic Controller Workforce Plan.…………………………………………………………………………
ATO
50
Aviation Safety Critical Positions Workforce Plan…………………………………………………………
AVS
52
Cost Control……………………………………………………………………………………………………………
ABA
54
Unqualified Audit Opinion…………………………………………………………………………………………
ABA
56
Critical Acquisitions on Budget…………………………………………………………………………………
ATO
58
Critical Acquisitions on Schedule………………………………………………………………………………
ATO
60
Information Security………………………………………………………………………………………………
AIO
62
Continuity of Operations …………………………………………………………………………………………
ASH
64
1
PORTFOLIO OF GOALS FY 2011 Methodology Report FAA Flight Plan Performance Measures
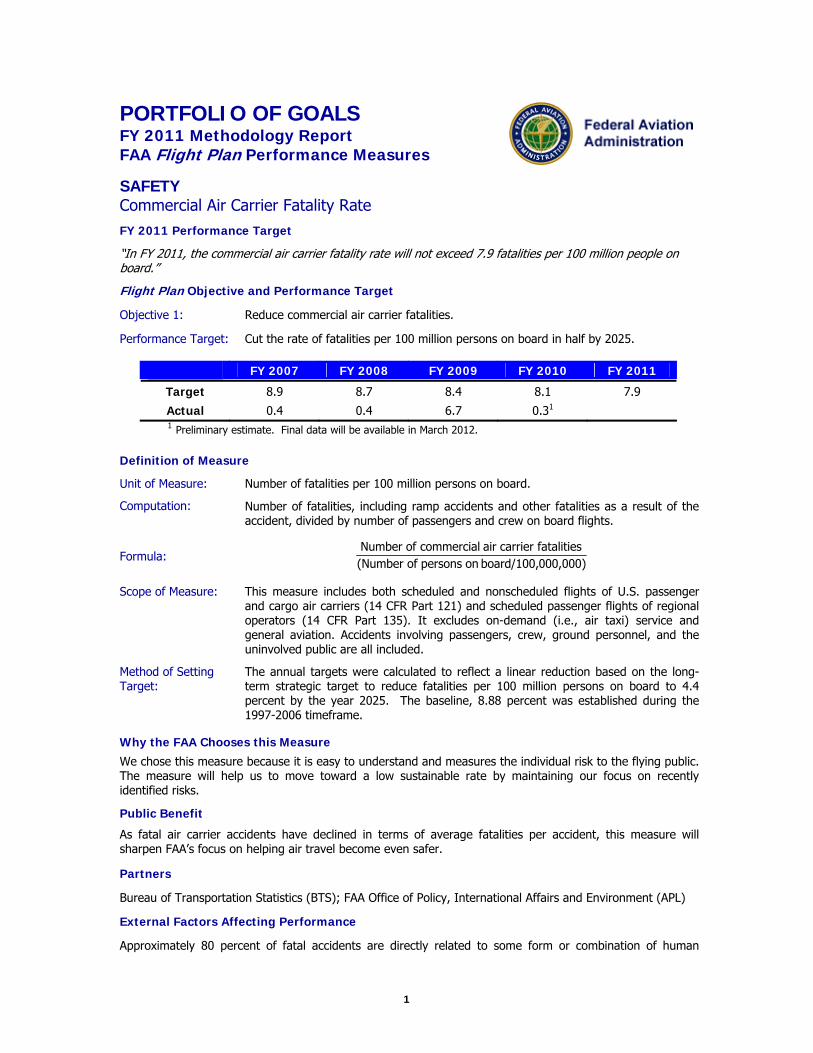
SAFETY Commercial Air Carrier Fatality Rate FY 2011 Performance Target “In FY 2011, the commercial air carrier fatality rate will not exceed 7.9 fatalities per 100 million people on board.”
Flight Plan Objective and Performance Target Objective 1: Reduce commercial air carrier fatalities.
Performance Target: Cut the rate of fatalities per 100 million persons on board in half by 2025.
1 Preliminary estimate. Final data will be available in March 2012.
FY 2007 FY 2008 FY 2009 FY 2010 FY 2011
Target 8.9 8.7 8.4 8.1 7.9
Actual 0.4 0.4 6.7 0.31
Definition of Measure
Unit of Measure: Number of fatalities per 100 million persons on board.
Computation: Number of fatalities, including ramp accidents and other fatalities as a result of the accident, divided by number of passengers and crew on board flights.
Formula: 000,000)board/100, on persons of(Number fatalitiescarrier air commercial ofNumber
Scope of Measure: This measure includes both scheduled and nonscheduled flights of U.S. passenger and cargo air carriers (14 CFR Part 121) and scheduled passenger flights of regional operators (14 CFR Part 135). It excludes on-demand (i.e., air taxi) service and general aviation. Accidents involving passengers, crew, ground personnel, and the uninvolved public are all included.
Method of Setting Target:
The annual targets were calculated to reflect a linear reduction based on the long-term strategic target to reduce fatalities per 100 million persons on board to 4.4 percent by the year 2025. The baseline, 8.88 percent was established during the 1997-2006 timeframe.
Why the FAA Chooses this Measure
We chose this measure because it is easy to understand and measures the individual risk to the flying public. The measure will help us to move toward a low sustainable rate by maintaining our focus on recently identified risks.
Public Benefit
As fatal air carrier accidents have declined in terms of average fatalities per accident, this measure will sharpen FAA’s focus on helping air travel become even safer.
Partners
Bureau of Transportation Statistics (BTS); FAA Office of Policy, International Affairs and Environment (APL)
External Factors Affecting Performance
Approximately 80 percent of fatal accidents are directly related to some form or combination of human
2
factors. These run the gamut of external organizational influences, inadequate supervision, personnel factors (such as self-imposed stress), to individual acts, such as, skill-based errors, misperception errors, judgment and decision-making errors, etc. While an accident’s causation can be thoroughly investigated and understood by FAA, as a practical matter, the agency’s ability to influence basic decisions by every pilot, every day, and in every circumstance to prevent the accidents becomes much more difficult.
Source of the Data
The data on commercial fatalities come from the National Transportation Safety Board’s (NTSB) Aviation Accident Database. All but a small share of the data for persons on board comes from the air carriers, who submit information for all passengers on board to the Office of Airline Information (OAI) within BTS. In addition, FAA estimates crew on board based on the distribution of aircraft departures by make and model, plus an average of 3.5 persons on board per Part 121 cargo flight.
Statistical Issues
Both accidents and passengers on board are censuses, having no sampling error. Crew on board is an estimate with a small range of variation for any given make and model. Departure data and enplanements for Part 121 are from the BTS. The crew estimate is based on fleet makeup and crew requirements per number of seats. For the current fleet, the number of crew is equal to about seven percent of all Part 121 enplanements. The average number of cargo crew on board is 3.5 per departure, based on data from subscription services such as Air Claims, a proprietary database used by insurers to obtain information such as fleet mix, accidents and claims. Cargo crews typically include two flight crew members, and occasionally another pilot or company rep, or two deadheading passengers. Part 135 data also comes from BTS and Air Claims databases, but is not as complete. AEP calls the operators where BTS data have gaps. Based on previous accident and incident reports, the average Part 135 enplanement is five per departure. Crew estimates for Part 135 are based on previous accident and incident data. Any error that might be introduced by estimating crew will be very small and will be overwhelmed by the passenger census. Also note that the fatality rate is small and could significantly fluctuate from year to year due to a single accident.
Completeness
The FAA does comparison checking of the departure data collected by BTS. This data is needed for crew estimates. However, FAA has no independent data sources against which to validate the numbers submitted to BTS. The FAA compares its list of carriers to the Department of Transportation list to validate completeness and places the carriers in the appropriate category (i.e., Part 121 or Part 135). The number of actual persons on board for any given period is considered preliminary for up to 18 months after the close of the reporting period. This is due to amended reports subsequently filed by the air carriers. Preliminary estimates are based on projections of the growth in departures developed by AEP. However, changes to the number of persons on board should rarely affect the annual fatality rate. NTSB and FAA's Office of Accident Investigation meet regularly to validate the accident and fatality count.
To overcome reporting delays of 60 to 90 days, FAA must rely on historical data, partial internal data sources, and Official Airline Guide (OAG) scheduling information to project at least part of the fiscal year activity data. The FAA uses OAG data until official BTS data are available. The final result for the air carrier fatality rate is not considered reliable until BTS provides preliminary numbers. Due to reporting procedures in place, it is unlikely that calculation of future fiscal year departure data will be markedly improved. This lack of complete historical data on a monthly basis and independent sources of verification increases the risk of error in the activity data.
NTSB and FAA’s Office of Accident Investigation meet regularly to validate information on the number of fatalities. Accident data are considered preliminary. NTSB usually completes investigations and issues reports on accidents that occur during any fiscal year by the end of the next fiscal year. Results are considered final when all those accidents have been reported in the NTSB press release published by March. FY 2011 results will therefore be final after the 2013 press release. In general, however, fatal and serious injury accident numbers are not likely to change significantly between the end of the fiscal year and the date they are finalized.
Reliability
Results are considered preliminary based on projected activity data. The FAA uses performance data extensively for program management, personnel evaluation, and accountability. Most accident investigations are a joint undertaking. NTSB has the statutory responsibility to determine probable cause, while FAA has

3
separate statutory authority to investigate accidents and incidents in order to ensure that FAA meets its broader responsibilities. The FAA’s own accident investigators and other FAA employees participate in all accident investigations led by NTSB investigators.
4
PORTFOLIO OF GOALS FY 2011 Methodology Report FAA Flight Plan Performance Measures
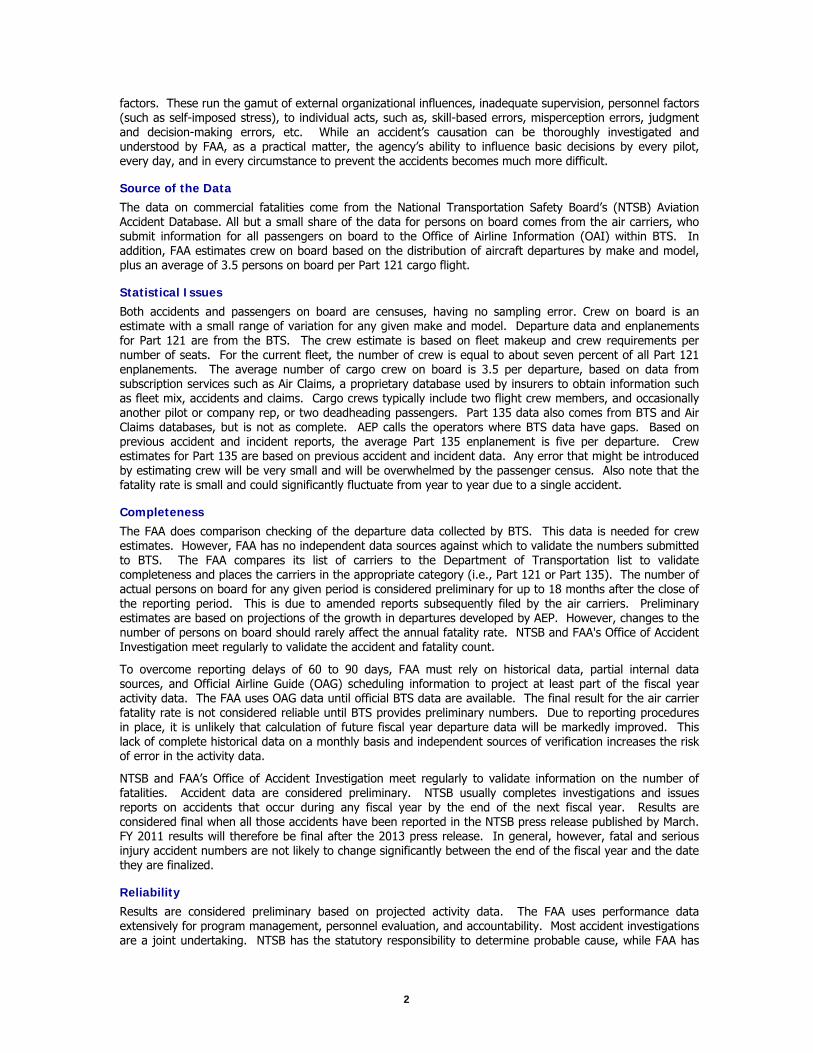
SAFETY General Aviation Fatal Accident Rate FY 2011 Performance Target “Limit the general aviation fatal accident rate to no more than 1.08 fatal accidents per 100,000 flight hours.”
Flight Plan Objective and Performance Target Objective 2: Reduce general aviation fatalities.
Performance Target:
Reduce the fatal accident rate per 100,000 flight hours by 10 percent over a 10-year period (2009-2018).
1 This was a new measure for FY 2009, replacing the general aviation fatal accident reduction measure, which was a number and not a rate.. No data are available for prior years. 2 Preliminary estimate. Final data will be available in March 2012.
FY 2007 FY 2008 FY 20091 FY 2010 FY 2011
Target N/A N/A 1.11 1.10 1.08
Actual N/A N/A 1.16 1.142
Definition of Measure
Unit of Measure: Number of fatal accidents per 100,000 flight hours.
Computation: The number of general aviation fatal accidents divided by the number of flight hours.
Formula: /100,000) hoursflight aviation general of(Number accidents fatal aviation general ofNumber
Scope of Measure: This measure includes on-demand (non-scheduled FAR Part 135) and general aviation flights. General aviation comprises a diverse range of aviation activities, from single-seat homebuilt aircraft, helicopters, balloons, single and multiple engine land and seaplanes, to highly sophisticated extended range turbojets.
Method of Setting Target:
The three safest years in general aviation history (June 2005 – May 2008) were used as the baseline. Government and industry consensus was to target a 10 percent reduction in 10 years from this baseline. Each year’s annual target is a linear reduction to achieve the overall 10 percent reduction in 10 years.
Why the FAA Chooses this Measure
The success of FAA and industry collaborative safety initiatives continues to drive the general aviation fatal accident rate lower. This measure was adopted in FY 2009 to replace the existing general aviation fatal accident measure. The FAA and the general aviation community have determined that a general aviation fatal accident rate rather than the number of fatal accidents is a better performance measure because the rate reflects fleet activity levels and their relationship to the number of fatal accidents. The performance measure is a true rate-based metric and tracks changes in the fatal accident rate for a fixed volume of flight hours (per 100,000).
The performance target baseline of 1.12 percent covers the 3-year period from June 2005 through May 2008. This period captures the safest years ever recorded for general aviation. The baseline is substantially more aggressive than the current Flight Plan performance target.
5
Public Benefit
By tracking the rate of fatal accidents per flight hours, FAA can more accurately pinpoint safety concerns or trends indicating potential safety concerns.
Partners
National Transportation Safety Board (NTSB); FAA Office of Planning and Performance (APO)
External Factors Affecting Performance
Approximately 80 percent of general aviation fatal accidents are directly related to some form or combination of human factors. These run the gamut of external organizational influences, inadequate supervision, personnel factors (such as self-imposed stress), to individual acts, such as, skill-based errors, misperception errors, judgment and decision-making errors, etc. These human factor influences are occurring in a broad spectrum of general aviation activities from more highly regulated on-demand air taxi service in sophisticated aircraft, to more loosely regulated recreational flying in homebuilt aircraft. While accidents causation can be thoroughly investigated and understood by FAA, as a practical matter, the FAA’s ability to influence basic decisions by every pilot, every day, and in every circumstance to prevent the accidents becomes much more difficult.
Source of the Data
The data for general aviation fatal accidents comes from the National Transportation Safety Board's (NTSB) Aviation Accident Database. Aviation accident investigators, under the auspices of the NTSB, develop the data.
Annual flight hours are derived from the FAA’s annual General Aviation and Part 135 Activity Survey. In order to derive FY 2009 flight hours, the most recent GA Survey hours (CY 2007) will be used as the basis. CY 2008 hours will be predicted based on the change in GA and Air Taxi tower counts from 2007 to 2008. The percent change in tower counts will be applied to the 2007 hours to predict 2008 hours. CY 2009 hours will be projected from 2008 based on APO forecasts. Annual hours will be distributed into monthly hours based on the 10-year average monthly distribution of towers counts. CY will be converted in FY based on the monthly hour distribution.
Statistical Issues
The NTSB determines the actual number of general aviation fatal accidents. Since this is a simple count of accidents, there are no statistical issues relevant to this data.
The survey data for activity are highly accurate with a percent-standard error of less than 1 percent. The general aviation community and the General Aviation Joint Steering Committee (GAJSC) of the Safer Skies initiative recommended development of a data collection program that will yield more accurate and relevant data on general aviation demographics and utilization. Improved survey and data collection methodologies have been developed.
As a result of these efforts, FAA, working with the General Aviation Manufacturers Association, the NTSB, and other aviation industry associations, has made many improvements to the survey. First, the sample size has significantly increased. Second, a reporting form has been created to make it much easier for organizations with large fleets to report. Third, the agency worked with the Aircraft Registry to improve the accuracy of contact information. As a result, an improved survey was completed in FY 2004. This survey created, for the first time, a statistically valid report of activity on which the general aviation community could agree. Each year since 2004, significant improvements have been made which, in turn, substantially improved the accuracy of the data.
The GAJSC General Aviation Data Improvement Team has worked closely with the general aviation community and industry to develop this performance measure and target. There is unanimous support and consensus for the measure and target.
Completeness
The number of general aviation fatal accidents, even when reported as preliminary, is very accurate. When final reports are issued, the number of fatal accidents does not change significantly. NTSB classifications are

6
considered final when the Board issues their annual press release. Accidents during a fiscal year are addressed in the NTSB press release issued at the end of the following year.
GA Survey calendar hours are finalized by October 31 of the following year. Hence, the fatal accident rate for FY 2011 will not be considered final/complete until October 2012.
Reliability
The FAA uses performance data extensively for program management, and personnel evaluation and accountability. Most accident investigations are a joint undertaking between FAA and NTSB. NTSB has the statutory responsibility, but, in fact, most of the accident investigations related to general aviation are conducted by FAA Aviation Safety Inspectors without NTSB direct involvement. The FAA’s own accident investigators and other FAA employees participate in all accident investigations led by NTSB investigators.
As mentioned above, the large sample for FAA’s activity survey, along with the ease of data collection, produce highly accurate flight hour data. The low standard error which results ensures the reliability of these data.
7
PORTFOLIO OF GOALS FY 2011 Methodology Report FAA Flight Plan Performance Measures
SAFETY Alaska Accident Rate
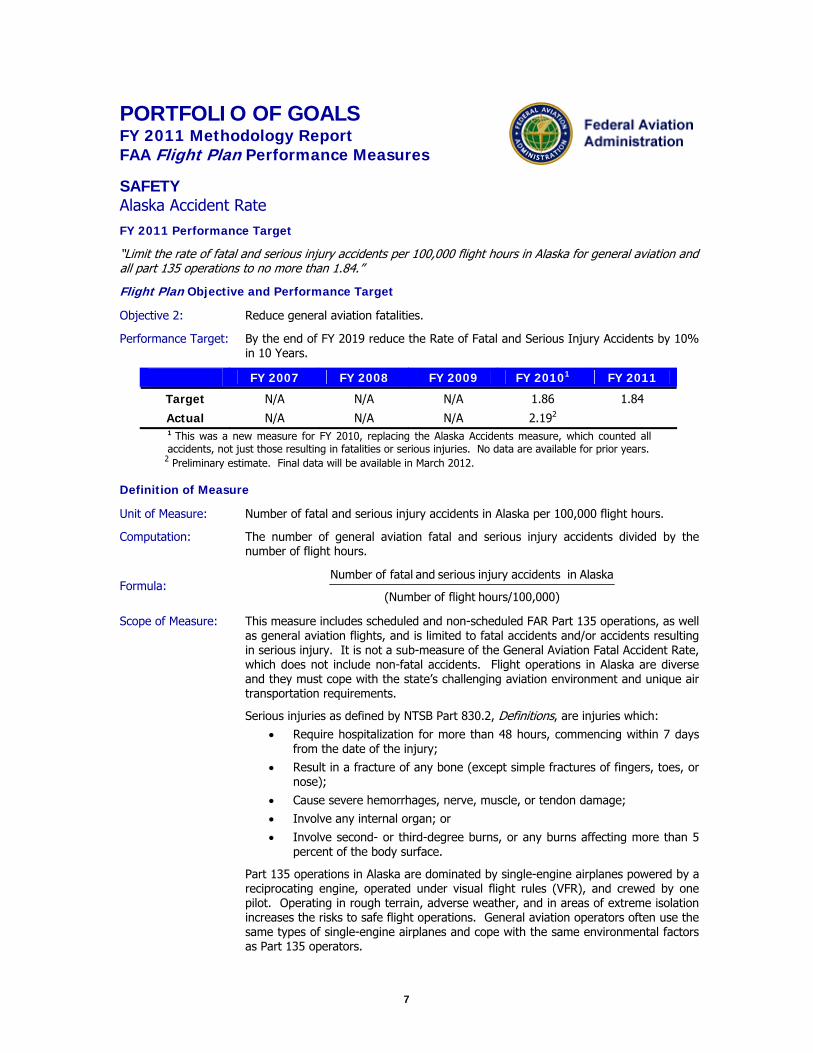
FY 2011 Performance Target “Limit the rate of fatal and serious injury accidents per 100,000 flight hours in Alaska for general aviation and all part 135 operations to no more than 1.84.” Flight Plan Objective and Performance Target Objective 2: Reduce general aviation fatalities. Performance Target: By the end of FY 2019 reduce the Rate of Fatal and Serious Injury Accidents by 10%
in 10 Years.
1 This was a new measure for FY 2010, replacing the Alaska Accidents measure, which counted all accidents, not just those resulting in fatalities or serious injuries. No data are available for prior years.
2 Preliminary estimate. Final data will be available in March 2012.
FY 2007 FY 2008 FY 2009 FY 20101 FY 2011
Target N/A N/A N/A 1.86 1.84
Actual N/A N/A N/A 2.192
Definition of Measure
Unit of Measure: Number of fatal and serious injury accidents in Alaska per 100,000 flight hours.
Computation:
The number of general aviation fatal and serious injury accidents divided by the number of flight hours.
Formula: 000)hours/100,flight of(Number
Alaskain accidentsinjury serious and fatal ofNumber
Scope of Measure: This measure includes scheduled and non-scheduled FAR Part 135 operations, as well as general aviation flights, and is limited to fatal accidents and/or accidents resulting in serious injury. It is not a sub-measure of the General Aviation Fatal Accident Rate, which does not include non-fatal accidents. Flight operations in Alaska are diverse and they must cope with the state’s challenging aviation environment and unique air transportation requirements.
Serious injuries as defined by NTSB Part 830.2, Definitions, are injuries which: Require hospitalization for more than 48 hours, commencing within 7 days
from the date of the injury; Result in a fracture of any bone (except simple fractures of fingers, toes, or
nose); Cause severe hemorrhages, nerve, muscle, or tendon damage; Involve any internal organ; or Involve second- or third-degree burns, or any burns affecting more than 5
percent of the body surface.
Part 135 operations in Alaska are dominated by single-engine airplanes powered by a reciprocating engine, operated under visual flight rules (VFR), and crewed by one pilot. Operating in rough terrain, adverse weather, and in areas of extreme isolation increases the risks to safe flight operations. General aviation operators often use the same types of single-engine airplanes and cope with the same environmental factors as Part 135 operators.
8
Method of Setting Target:
The baseline was determined by the three most recent years of available data, which were FY 2006-FY 2008. The average rate for that period was 1.88. Reducing the baseline rate by 10 percent in ten years was the unanimous consensus of the government/industry General Aviation Data Improvement Team (GADIT), is consistent with the overall general aviation fatal accident rate reduction goal, endorsed by all major associations (including Alaska chapters), and the Alaskan Region Administrator. The FY 2010 target of 1.86 is the first year of the 10-year linear reduction to 1.69 in FY 2019.
Why the FAA Chooses this Measure
Alaska relies heavily on air transportation in a difficult operating environment. This had led to a relatively high number of accidents, and in 2004, FAA adopted a performance target to reduce the number of accidents. In FY 2010, FAA replaced the original Alaska Accidents measure with the Alaska Accident Rate, which tracks changes in the fatal accident rate for a fixed volume of flight hours. This new measure reflects fleet activity levels and their relationship to the number of fatal and serious injury accidents.
The new measure also restricts the scope of the measure to accidents which result in fatalities and serious injury. While the overall number of accidents has decreased in recent years, the number of fatal and serious injury accidents has steadily increased since 2005. Simply converting the current metric to a rate retains the undesirable effects of keeping “fender-benders” in the metric, and masks the more significant issue of fatalities and serious injuries. Limiting the measure to fatal accidents, as the General Aviation Fatal Accident Rate does, will result in large fluctuations in the corresponding rate. Including serious injury accidents provides larger numbers for stability, and broadens the scope of the measure to cover the types of accidents FAA and the general aviation community aim to prevent.
Public Benefit
Aviation is the primary source of transportation for the majority of the residents in Alaska. However, the state’s topography and weather present unique safety challenges. This measure allows FAA to follow trends and focus risk mitigation efforts in Alaska. Therefore, FAA is improving safety for a great number of the residents in this state.
Partners
FAA continues to work jointly with the Alaska aviation community through a number of organizations and safety programs such as the Medallion Foundation, Circle of Safety, the FAA Safety Team, Alaska Air Carriers Association, Alaska Aviation Safety Foundation and Alaska Airman’s Association.
External Factors Affecting Performance
Approximately 80 percent of general aviation accidents are directly related to some form or combination of human factors. These run the gamut of external organizational influences, inadequate supervision, stress factors, skill-based errors, judgment and decision-making errors, etc. These human factor influences are occurring in a broad spectrum of general aviation activities from more highly regulated on-demand air taxi service in sophisticated aircraft, to more loosely regulated recreational flying in homebuilt aircraft. While accidents causation can be thoroughly investigated and understood by the FAA, as a practical matter, FAA’s ability to influence basic decisions by every pilot, every day, and in every circumstance to prevent the accidents becomes much more difficult.
Source of the Data
The data on Part 135 and general aviation accidents come from the National Transportation Safety Board’s (NTSB) Aviation Accident Database. Aviation accident investigators under the auspices of the NTSB develop the data. The NTSB determines the injury level. Serious injuries meeting the NTSB definition are determined by competent medical authorities.
Annual flight hours are derived from the FAA’s annual General Aviation and Part 135 Activity Survey. In order to derive FY 2011 flight hours, the most recent GA Survey hours for Alaska (CY 2009) will be used as the basis. CY 2010 and 2011 hours will be predicted based on previous trends pin Alaska’s GA and Air Taxi hours. Calendar years will be converted into fiscal years based on the previous 10-year average monthly fatal and serious injury accident distribution.
9
Statistical Issues
There is no major error in the accident counts. Random variation in air crashes results in a significant variation in the number of fatal accidents over time. The fatal and serious injury accident rate initiated in FY 2010 will take into account these variations in activity levels from year to year.
This metric includes public use aircraft which are counted in the accident rate, but the FAA has no regulatory authority to provide safety oversight. Also, unlike commercial aviation activity that is reported regularly to the Bureau of Transportation Statistics by carriers, general aviation flight hours are based on an annual survey conducted by the FAA. Response to the survey is voluntary. In 2003, the general aviation community and the General Aviation Joint Steering Committee of the Safer Skies initiative recommended development of a data collection program that would yield more accurate and relevant data on general aviation demographics and utilization than the survey then in use.
As a result of these efforts, FAA, working with the General Aviation Manufacturers Association, has made several improvements to the general aviation survey. First, the sample size has been significantly increased. Second, a reporting sheet has been created to make it much easier for organizations with large fleets to report. Third, the agency worked with the Aircraft Registry to improve the accuracy of contact information. Fourth, several general aviation segments, including Alaska, were sampled at 100 percent. As a result, a survey was completed in FY 2004 that, for the first time, created a statistically valid report of general aviation activity that the general aviation community could agree on. Each year since 2004, significant improvements have been made which in turn substantially improved the accuracy of the data.
Completeness
NTSB and FAA’s Office of Accident Investigation meet regularly to validate information on the number of accidents. Accident data are considered preliminary. NTSB usually completes investigations and issues reports on accidents that occur during any fiscal year by the end of the next fiscal year. Accident data are considered final when all those accidents have been reported in the NTSB press release published by March. FY 2011 results will therefore be final after the 2013 press release. In general, however, fatal and serious injury accident numbers are not likely to change significantly between the end of the fiscal year and the date they are finalized.
Flying hours from the general aviation survey lag the calendar by about ten months. FY 2011 results for flying hours will not be final until October 2012.
Reliability
FAA uses performance data extensively for program management and personnel evaluation and accountability. Most accident investigations are a joint undertaking between FAA and NTSB. NTSB has the statutory responsibility, but, in fact, most of the accident investigations related to general aviation are conducted by FAA Aviation Safety Inspectors without direct NTSB involvement. The FAA’s own accident investigators and other FAA employees participate in all accident investigations led by NTSB investigators.
10
PORTFOLIO OF GOALS FY 2011 Methodology Report FAA Flight Plan Performance Measures
SAFETY Runway Incursions (Category A & B)
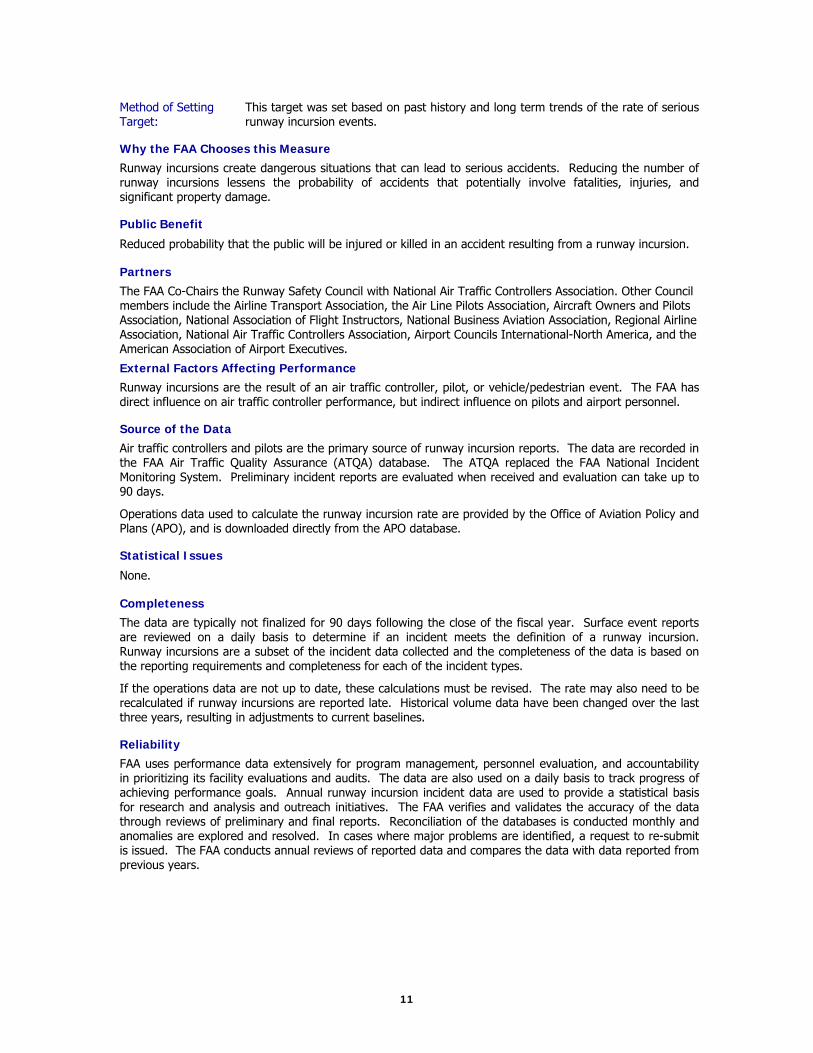
FY 2011 Performance Target “Limit Category A and B (most serious) runway incursions to a rate of no more than 0.450 per million operations.” Flight Plan Objective and Performance Target Objective 3: Reduce the risk of runway incursions. Performance Target:
By 2010, reduce Category A and B (most serious) runway incursions to a rate of no more than 0.45 per million operations, and maintain or improve through FY 2013.
1 Final result revised in FY 2011 from original actual of 0.427, reflecting slight change in final number of operations.
FY 2007 FY 2008 FY 2009 FY 2010 FY 2011
Target 0.530 0.509 0.472 0.450 0.450
Actual 0.393 0.4271 0.227 0.117
Definition of Measure
Unit of Measure: Rate of Category A & B (most serious) runway incursions per million operations.
Computation:
The total number of Category A and B runway incursions is divided by the sum of the number operations divided by 1 million.
Formula: 0,000)Count/1,00 s(Operation
Incursions B& AofNumber
Scope of Measure: A runway incursion is any occurrence at an aerodrome involving the incorrect presence of an aircraft, vehicle or person on the protected area of a surface designated for the landing and takeoff of aircraft. They are grouped in three general categories: air traffic, pilot, or vehicle/pedestrian events. Runway incursions are reported and tracked at airports that have an operational air traffic control tower. Operations are defined as total takeoffs and landings.
The FAA tracks four categories of runway incursions - A, B, C, D - but includes only those with the highest risk of collision, Category A and B incursions, in the measure.
Category A: Separation decreases to the point that participants take extreme action to narrowly avoid a collision.
Category B: Separation decreases, and there is a significant potential for a collision.
Category C: Separation decreases, but there is ample time and distance to avoid a collision.
Category D: There is little or no chance of collision, but the definition of a runway incursion is met.
In FY 2002 FAA changed the focus of measurement for runway incursions from all incursions to those incursions with measurable risk of collision, Categories A and B. Since Category C and D incursions were not likely to lead to an accident or a significant risk of an accident, their inclusion in the previous total tended to mask true safety risk. The new measure reflects the focus of FAA’s runway safety effort to reduce the rate of the incursions with demonstrable risk.
11
Method of Setting Target:
This target was set based on past history and long term trends of the rate of serious runway incursion events.
Why the FAA Chooses this Measure
Runway incursions create dangerous situations that can lead to serious accidents. Reducing the number of runway incursions lessens the probability of accidents that potentially involve fatalities, injuries, and significant property damage.
Public Benefit
Reduced probability that the public will be injured or killed in an accident resulting from a runway incursion.
Partners
The FAA Co-Chairs the Runway Safety Council with National Air Traffic Controllers Association. Other Council members include the Airline Transport Association, the Air Line Pilots Association, Aircraft Owners and Pilots Association, National Association of Flight Instructors, National Business Aviation Association, Regional Airline Association, National Air Traffic Controllers Association, Airport Councils International-North America, and the American Association of Airport Executives.
External Factors Affecting Performance
Runway incursions are the result of an air traffic controller, pilot, or vehicle/pedestrian event. The FAA has direct influence on air traffic controller performance, but indirect influence on pilots and airport personnel.
Source of the Data
Air traffic controllers and pilots are the primary source of runway incursion reports. The data are recorded in the FAA Air Traffic Quality Assurance (ATQA) database. The ATQA replaced the FAA National Incident Monitoring System. Preliminary incident reports are evaluated when received and evaluation can take up to 90 days.
Operations data used to calculate the runway incursion rate are provided by the Office of Aviation Policy and Plans (APO), and is downloaded directly from the APO database.
Statistical Issues
None.
Completeness
The data are typically not finalized for 90 days following the close of the fiscal year. Surface event reports are reviewed on a daily basis to determine if an incident meets the definition of a runway incursion. Runway incursions are a subset of the incident data collected and the completeness of the data is based on the reporting requirements and completeness for each of the incident types.
If the operations data are not up to date, these calculations must be revised. The rate may also need to be recalculated if runway incursions are reported late. Historical volume data have been changed over the last three years, resulting in adjustments to current baselines.
Reliability
FAA uses performance data extensively for program management, personnel evaluation, and accountability in prioritizing its facility evaluations and audits. The data are also used on a daily basis to track progress of achieving performance goals. Annual runway incursion incident data are used to provide a statistical basis for research and analysis and outreach initiatives. The FAA verifies and validates the accuracy of the data through reviews of preliminary and final reports. Reconciliation of the databases is conducted monthly and anomalies are explored and resolved. In cases where major problems are identified, a request to re-submit is issued. The FAA conducts annual reviews of reported data and compares the data with data reported from previous years.
12
PORTFOLIO OF GOALS FY 2011 Methodology Report FAA Flight Plan Performance Measures
SAFETY Total Runway Incursions
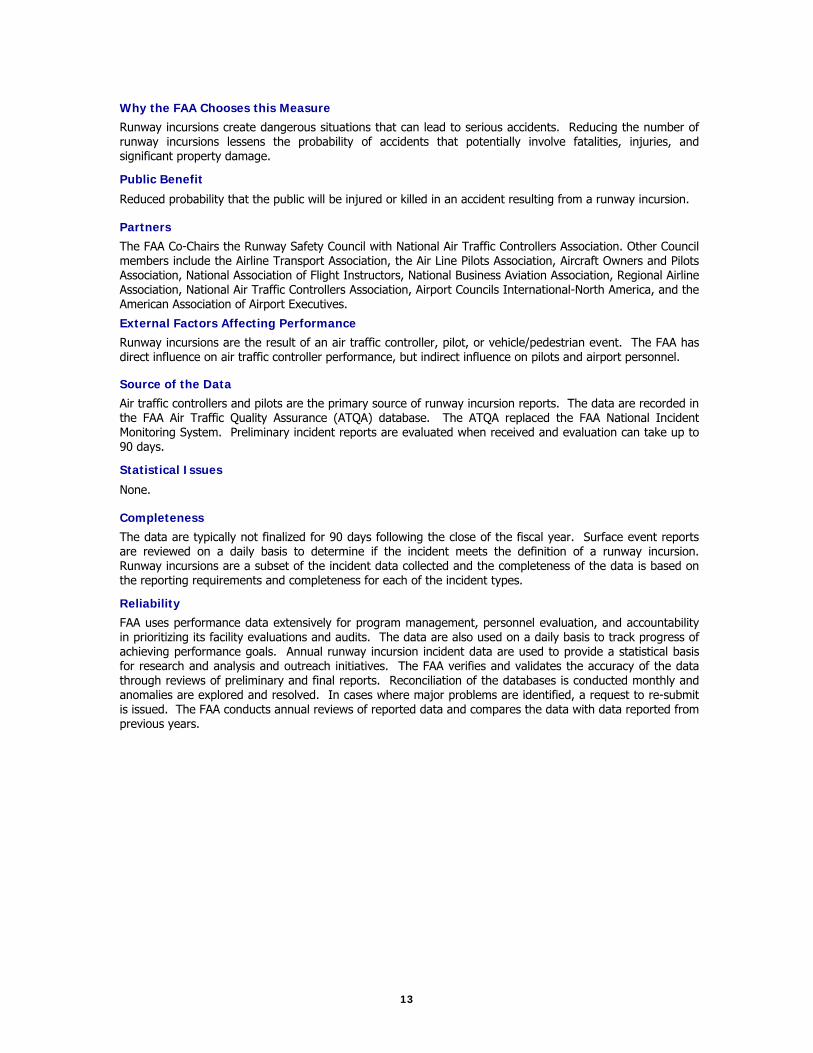
FY 2011 Performance Target "Reduce the number of total number of runway incursions to 959"
Flight Plan Objective and Performance Target Objective 3: Reduce the risk of runway incursions. Performance Target:
By the end of FY 2013, reduce total runway incursions by 10 percent to 909 from the FY 2008 baseline number of 1009.
1 This was a new measure for FY 2009. No data are available prior to FY 2008. For FY 2010, the original target for a cumulative percentage reduction each year from the FY 2008 baseline was revised to the actual number of runway incursions targeted. The target and result for FY 2009 of – 1% and – 5.75% have been restated here as the number of incursions. 2 Final result revised from preliminary estimate of 967.
FY 2007 FY 2008 FY 20091 FY 2010 FY 2011
Target N/A N/A 999 979 959
Actual N/A 1,009 951 9662
Definition of Measure
Unit of Measure: The total number of runway incursions for each year.
Computation: The number of runway incursions that occur during the fiscal year is summed.
Formula: A count of the number of runway incursions for the year.
Scope of Measure: A runway incursion is any occurrence at an aerodrome involving the incorrect presence of an aircraft, vehicle or person on the protected area of a surface designated for the landing and takeoff of aircraft. They are grouped in three general categories: air traffic, pilot, or vehicle/pedestrian events. Runway incursions are reported and tracked at airports that have an operational air traffic control tower. Operations are defined as total takeoffs and landings.
The FAA tracks four categories of runway incursions - A, B, C, D.
Category A: Separation decreases to the point that participants take extreme action to narrowly avoid a collision.
Category B: Separation decreases, and there is a significant potential for a collision.
Category C: Separation decreases, but there is ample time and distance to avoid a collision.
Category D: There is little or no chance of collision, but the definition of a runway incursion is met.
Method of Setting Target:
This target was set based on past history and long term trends of the total number of runway incursion events. For FY 2010, the original target for a cumulative reduction each year from the FY 2008 baseline was revised to an annual not-to-exceed limit for the number of runway incursions. ATO’s planners and the Office of Runway Safety believe these numerical targets will be easier for the general public to comprehend. Also, this measure has been designated as an FAA High Priority Performance Goal, and quarterly not-to-exceed limits have been set which will be reported on regularly to OMB and to DOT.
13
Why the FAA Chooses this Measure
Runway incursions create dangerous situations that can lead to serious accidents. Reducing the number of runway incursions lessens the probability of accidents that potentially involve fatalities, injuries, and significant property damage.
Public Benefit
Reduced probability that the public will be injured or killed in an accident resulting from a runway incursion.
Partners
The FAA Co-Chairs the Runway Safety Council with National Air Traffic Controllers Association. Other Council members include the Airline Transport Association, the Air Line Pilots Association, Aircraft Owners and Pilots Association, National Association of Flight Instructors, National Business Aviation Association, Regional Airline Association, National Air Traffic Controllers Association, Airport Councils International-North America, and the American Association of Airport Executives.
External Factors Affecting Performance
Runway incursions are the result of an air traffic controller, pilot, or vehicle/pedestrian event. The FAA has direct influence on air traffic controller performance, but indirect influence on pilots and airport personnel.
Source of the Data
Air traffic controllers and pilots are the primary source of runway incursion reports. The data are recorded in the FAA Air Traffic Quality Assurance (ATQA) database. The ATQA replaced the FAA National Incident Monitoring System. Preliminary incident reports are evaluated when received and evaluation can take up to 90 days.
Statistical Issues
None.
Completeness
The data are typically not finalized for 90 days following the close of the fiscal year. Surface event reports are reviewed on a daily basis to determine if the incident meets the definition of a runway incursion. Runway incursions are a subset of the incident data collected and the completeness of the data is based on the reporting requirements and completeness for each of the incident types.
Reliability
FAA uses performance data extensively for program management, personnel evaluation, and accountability in prioritizing its facility evaluations and audits. The data are also used on a daily basis to track progress of achieving performance goals. Annual runway incursion incident data are used to provide a statistical basis for research and analysis and outreach initiatives. The FAA verifies and validates the accuracy of the data through reviews of preliminary and final reports. Reconciliation of the databases is conducted monthly and anomalies are explored and resolved. In cases where major problems are identified, a request to re-submit is issued. The FAA conducts annual reviews of reported data and compares the data with data reported from previous years.
14
PORTFOLIO OF GOALS FY 2011 Methodology Report FAA Flight Plan Performance Measures
SAFETY Commercial Space Launch Accidents
FY 2011 Performance Target “No fatalities, serious injuries, or significant property damage to the uninvolved public during licensed or permitted space launch and reentry activities.” Flight Plan Objective and Performance Target Objective 4: Ensure the safety of commercial space launches. Performance Target: No fatalities, serious injuries, or significant property damage to the uninvolved public
during licensed or permitted space launch and reentry activities.
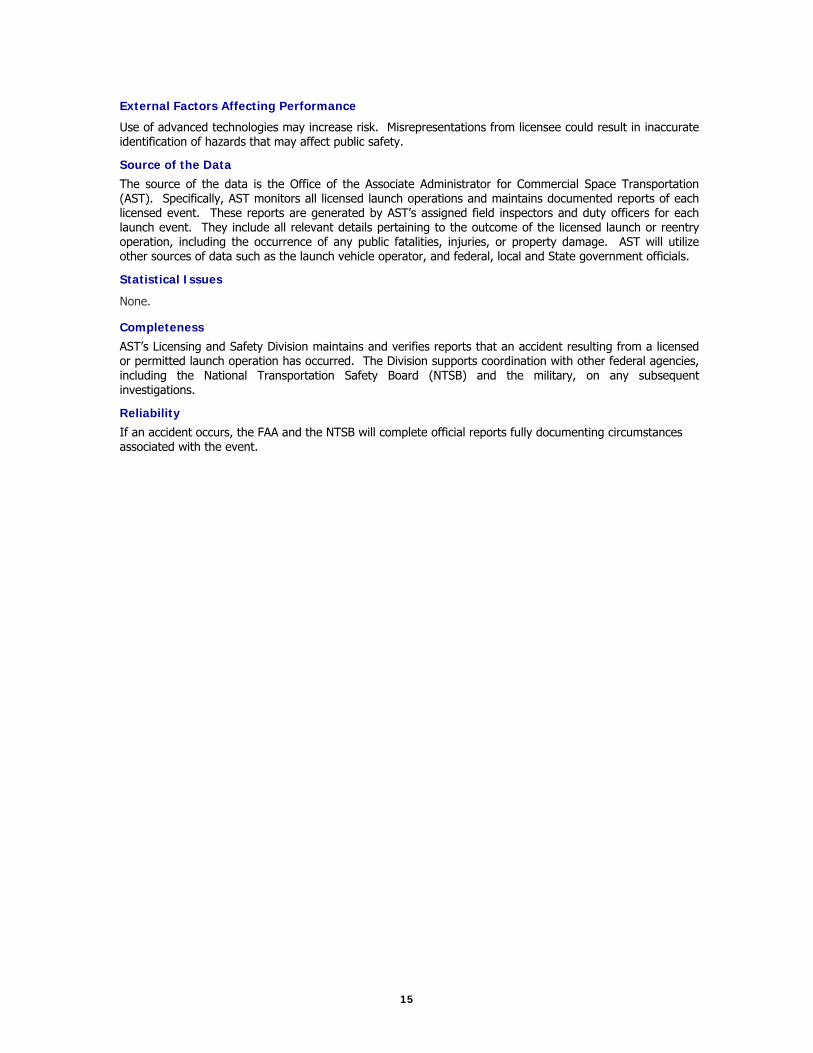
FY 2007 FY 2008 FY 2009 FY 2010 FY 2011
Target 0 0 0 0 0
Actual 0 0 0 0
Definition of Measure
Unit of Measure: Number of accidents resulting in fatalities, injuries, or significant property damage.
Computation: The number of accident occurrences is calculated.
Formula: Count of the number of occurrences.
Scope of Measure: This measure focuses only on commercial space launch or reentry activities licensed or permitted and monitored by the FAA. “Significant” property damage is defined as any damage estimated to exceed $25,000 to property not associated with flight. On board crew members and space flight participants are NOT considered “uninvolved” members of the public.
Method of Setting Target:
Space launch is inherently risky. Over the past 25 years there have been no fatalities, serious injuries or significant property damage. A target of zero was set to maintain that record.
Why the FAA Chooses this Measure
Protecting the uninvolved public during launch operations is an FAA safety mission objective. Commercial space transportation is the means by which payloads such as satellites and remote sensing devices are carried to orbit; these payloads have tremendous benefit to our society. Commercial space launch or reentry accidents can potentially have major catastrophic consequences, involving large losses of life and property. The uninvolved public expects to be protected from the potential dangers and hazards associated with commercial space launch and reentry activities. There has not been a single commercial space launch accident since the first DOT licensed launch took place in 1989, and DOT is working to keep this safety record perfect.
Public Benefit
AST’s oversight of the commercial space launch industry activities resulted in no loss of life or property damage to the uninvolved public.
Partners
Department of Defense, NASA and the commercial space industry. All entities work in partnership to ensure protection of the public, property and national security and foreign policy interests of the U.S.
15
External Factors Affecting Performance
Use of advanced technologies may increase risk. Misrepresentations from licensee could result in inaccurate identification of hazards that may affect public safety.
Source of the Data
The source of the data is the Office of the Associate Administrator for Commercial Space Transportation (AST). Specifically, AST monitors all licensed launch operations and maintains documented reports of each licensed event. These reports are generated by AST’s assigned field inspectors and duty officers for each launch event. They include all relevant details pertaining to the outcome of the licensed launch or reentry operation, including the occurrence of any public fatalities, injuries, or property damage. AST will utilize other sources of data such as the launch vehicle operator, and federal, local and State government officials.
Statistical Issues
None.
Completeness
AST’s Licensing and Safety Division maintains and verifies reports that an accident resulting from a licensed or permitted launch operation has occurred. The Division supports coordination with other federal agencies, including the National Transportation Safety Board (NTSB) and the military, on any subsequent investigations.
Reliability
If an accident occurs, the FAA and the NTSB will complete official reports fully documenting circumstances associated with the event.
16
PORTFOLIO OF GOALS FY 2011 Methodology Report FAA Flight Plan Performance Measures
SAFETY System Risk Event Rate
FY 2011 Performance Target “Limit the rate of the most serious losses of standard separation to 20 or fewer for every thousand (.02) losses of standard separation within the National Airspace System.”
Flight Plan Objective and Performance Target Objective 5: Enhance the safety of FAA’s air traffic systems. Performance Target: Reduce risks in flight by limiting the rate of the most serious losses of standard
separation to 20 or fewer for every thousand (.02) losses of standard separation within the National Airspace System.
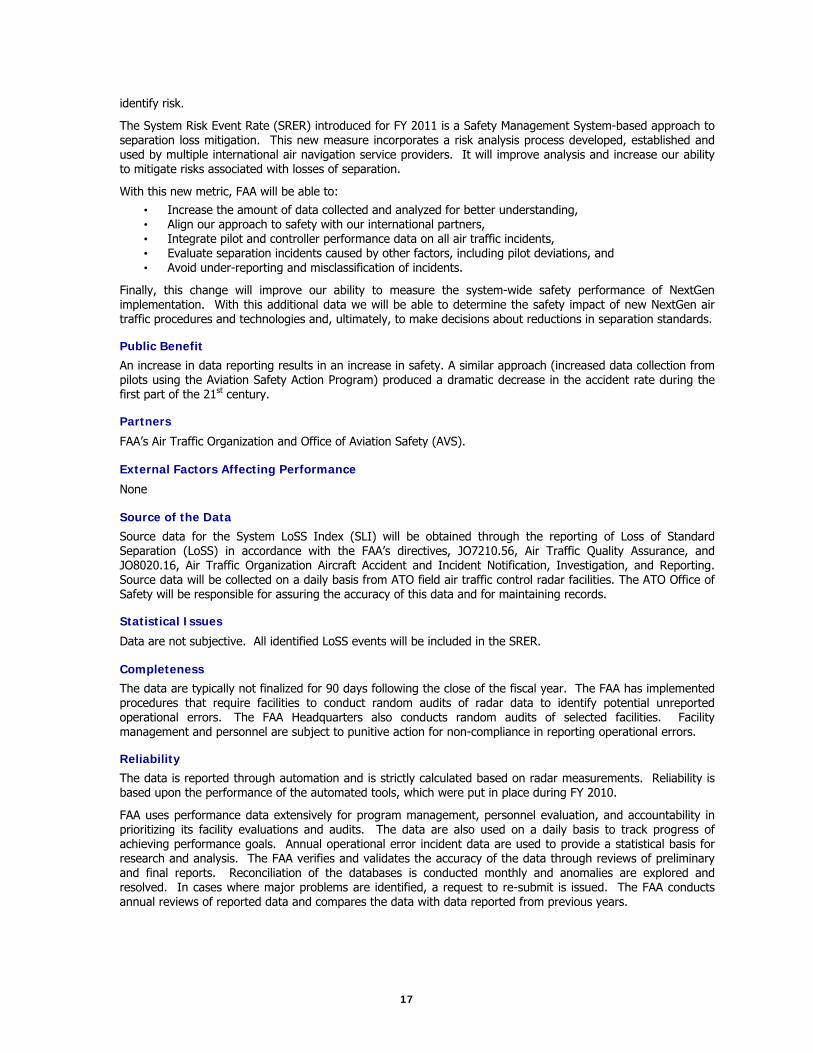
FY 2007 FY 2008 FY 2009 FY 2010 FY 20111
Target N/A N/A N/A N/A 20
Actual N/A N/A N/A N/A 1 This is a new target for FY 2011. No prior year results are available.
Definition of Measure
Unit of Measure: All instances of non-compliance with radar separation standards, termed Loss of Standard Separation, or LoSS..
Technical explanation for LoSS: The non-compliant application of a prescribed radar separation standard, as defined in FAA Order 7110.65 or other national directive, for an operation under ATO services, including a pilot deviation, which results in less than the applicable separation minima between two or more airborne aircraft.
System Risk Event Rate (SRER): The LoSS data will be compiled into the SRER, which is the rate of the most serious losses for every thousand losses of standard separation within the system.
Computation: Rolling 12-month rate of serious losses of standard separation per thousand losses of standard separation.
Formula: ∑(Serious Loss)/(Number of LoSS Events)*1,000
Scope of Measure: This metric will measure the separation compliance performance of radar controlled IFR flights. For FY 2009 this constituted approximately 26 million flights.
Method of Setting Target:
The initial target of 20 was set based on a projection of SRER from historical Operational Error and Pilot Deviation data. The current SRER continues to fluctuate around 20. The target of 20 set for FY 2011 through FY 2014 will establish a baseline while deploying improved analysis and loss detection equipment. It will set a minimum level of system performance that should be attainable while continuing an improving trend over historical performance.
Why the FAA Chooses this Measure
The Air Traffic Organization (ATO) ensures that aircraft flying within the National Airspace System maintain required separation. To control losses of separation, FAA needs an accurate picture of system safety performance. Until now, we have only measured a subset of system performance, which limits our ability to
17
identify risk.
The System Risk Event Rate (SRER) introduced for FY 2011 is a Safety Management System-based approach to separation loss mitigation. This new measure incorporates a risk analysis process developed, established and used by multiple international air navigation service providers. It will improve analysis and increase our ability to mitigate risks associated with losses of separation.
With this new metric, FAA will be able to: • Increase the amount of data collected and analyzed for better understanding, • Align our approach to safety with our international partners, • Integrate pilot and controller performance data on all air traffic incidents, • Evaluate separation incidents caused by other factors, including pilot deviations, and • Avoid under-reporting and misclassification of incidents.
Finally, this change will improve our ability to measure the system-wide safety performance of NextGen implementation. With this additional data we will be able to determine the safety impact of new NextGen air traffic procedures and technologies and, ultimately, to make decisions about reductions in separation standards.
Public Benefit
An increase in data reporting results in an increase in safety. A similar approach (increased data collection from pilots using the Aviation Safety Action Program) produced a dramatic decrease in the accident rate during the first part of the 21st century.
Partners
FAA’s Air Traffic Organization and Office of Aviation Safety (AVS).
External Factors Affecting Performance
None
Source of the Data
Source data for the System LoSS Index (SLI) will be obtained through the reporting of Loss of Standard Separation (LoSS) in accordance with the FAA’s directives, JO7210.56, Air Traffic Quality Assurance, and JO8020.16, Air Traffic Organization Aircraft Accident and Incident Notification, Investigation, and Reporting. Source data will be collected on a daily basis from ATO field air traffic control radar facilities. The ATO Office of Safety will be responsible for assuring the accuracy of this data and for maintaining records.
Statistical Issues
Data are not subjective. All identified LoSS events will be included in the SRER.
Completeness
The data are typically not finalized for 90 days following the close of the fiscal year. The FAA has implemented procedures that require facilities to conduct random audits of radar data to identify potential unreported operational errors. The FAA Headquarters also conducts random audits of selected facilities. Facility management and personnel are subject to punitive action for non-compliance in reporting operational errors.
Reliability
The data is reported through automation and is strictly calculated based on radar measurements. Reliability is based upon the performance of the automated tools, which were put in place during FY 2010.
FAA uses performance data extensively for program management, personnel evaluation, and accountability in prioritizing its facility evaluations and audits. The data are also used on a daily basis to track progress of achieving performance goals. Annual operational error incident data are used to provide a statistical basis for research and analysis. The FAA verifies and validates the accuracy of the data through reviews of preliminary and final reports. Reconciliation of the databases is conducted monthly and anomalies are explored and resolved. In cases where major problems are identified, a request to re-submit is issued. The FAA conducts annual reviews of reported data and compares the data with data reported from previous years.
18
PORTFOLIO OF GOALS FY 2011 Methodology Report FAA Flight Plan Performance Measures
SAFETY Safety Management System
FY 2011 Performance Target
“Complete key activities supporting integration of the Air Traffic Organization, Office of Aviation Safety, and Office of Airports into an interoperable, agency-wide SMS.”
Flight Plan Objective and Performance Target Objective 6: Implement a Safety Management System (SMS) for the FAA. Performance Target: Safety Management System -- In FY 2011, integrate Air Traffic Organization, Office of
Aviation Safety, and Office of Airports into an interoperable, agency-wide SMS. In FY 2012, implement SMS policy in all appropriate FAA organizations.
1 In FY 2008, the original Safety Risk Management (SRM) measure was modified, and the name was changed to Safety Management System. The SRM measure for FY 2005 – FY 2007 was the number of applications of SRM to significant changes in the NAS. This measure was kept in FY 2008, and was expected to continue in FY 2009. 2 In FY 2009, the measure was redefined as completion of the key activities required for implementation of SMS in ATO, AVS, and ARP in FY 2010. 3 For FY 2010, the measure is defined as the number of organizations implementing SMS. For FY 2011,the measure will be redefined again as the number of organizations completing the integration of SMS. Targets have been set by the three LOBs involved with key activities required for implementation and integration (see below for FY 2011 activities).
FY 2007 FY 20081 FY 2009 FY 2010 FY 2011
Target 3 SMS
Applications 6 SMS
Applications
9 SMS Activities Achieved2
SMS Implemented in 3 LOBs3
SMS Implemented in 3 LOBs3
Actual 3 SMS
Applications 6 SMS
Applications 9 SMS
Activities SMS
Implemented
Definition of Measure
Unit of Measure: For FY 2011, the unit of measure is completion of key activities that support the integration of the Air Traffic Organization (ATO), Office of Aviation Safety (AVS), and Office of Airports (ARP).
Computation: The total number of successfully completed key activities is calculated.
Formula: Count of key activities completed.
Scope of Measure:
Key activities selected by ATO, AVS, and ARP. (See list of key activities at the end of this portfolio page)
Method of Setting Target:
These targets are key to the integration of ATO, AVS, and ARP into an SMS system by September 30, 2011.
Why the FAA Chooses this Measure
The FAA Safety Management System is a formal, top-down business-like approach to managing safety risk. SMS relies on developing standardized language, processes, and tools to manage safety risk across the aviation industry. Successful implementation of SMS is critical to meeting the challenges of a rapidly changing and expanding aviation system. The traditional methods of analyzing the causes of an accident or incident, after the fact, are not enough. To achieve the next level of safety a more forward thinking approach is required to analyze trends, data, and systems to manage issues before they become incidents or accidents.
19
The SMS process ensures that safety-related changes are documented; risk is assessed, analyzed and mitigated; hazards are identified and tracked to resolution; and the performance of any change is monitored throughout its lifecycle. Applying SMS prior to implementing changes to the National Airspace System (NAS) will ensure that unacceptable risk is not introduced. It will also improve the documentation of the processes used to ensure the safety of the NAS.
In order to achieve the integration of it ATO, AVS and ARP in FY 2011, key activities must be completed. These activities represent the culmination of each LOB’s efforts, and will prepare the agency for wider implementation in FY 2012.
Public Benefit
Implementation of the SMS will assure ever-increasing levels of safety for the flying public as new systems and technologies are deployed into the National Airspace System moving toward NEXTGEN.
Partners
ARP and ATO
External Factors Affecting Performance
As with any major organizational change, funding and interfaces with industry are always a factor.
Source of the Data
In FY 2011 the critical activities and associated activity targets are included and defined in the FY 2011 Business Plans of ATO, AVS, and ARP. Status on each activity is reported by ARP/AVS/ATO program managers in the FAA’s performance management system and reviewed at the monthly FAA Administrator’s Flight Plan meeting.
Some examples of ATO documentation for FY 2011 will include the development of unmanned aircraft systems procedures in the NAS under 14 CFR regulations. ARP documentation will include draft interim Safety Risk Management (SRM) guidance, eLMS SMS training modules, SRM program guidance, internal tracking system for mitigation measures, and classroom training on SRM and facilitation. AVS documentation will include implementation plans from the LOBs, services and offices.
Statistical Issues
None.
Completeness
ATO, AVS, and ARP are each responsible for ensuring that the documentation of their activities is complete and accurate. The responsible program offices will collect all pertinent documentation related to the completion of this performance target, and then assesses if the performance target was successfully achieved.
Reliability
The program manager for each organization is responsible for attesting to the reliability of information reported and for maintaining backup documentation. They will monitor the key activities and validate the successful completion of this performance target.
The key SMS activities selected by ATO, AVS, and ARP for FY 2011 are:
Within AVS the activity is: 1) Harmonization of AVS SMS: each service and office will draft a plan that will roll up into the FAA Implementation Plan. Within ATO the activity is: 2) Develop policies, procedures, and approval processes to enable operation of unmanned aircraft system (UAS). Within ARP these activities are: 3) Design and implement SMS standards for Part 139 certificated airports. 4) Design and implement SMS for the Office of Airports internal SMS.
20
PORTFOLIO OF GOALS FY 2011 Methodology Report FAA Flight Plan Performance Measures
CAPACITY Average Daily Airport Capacity (Core Airports)
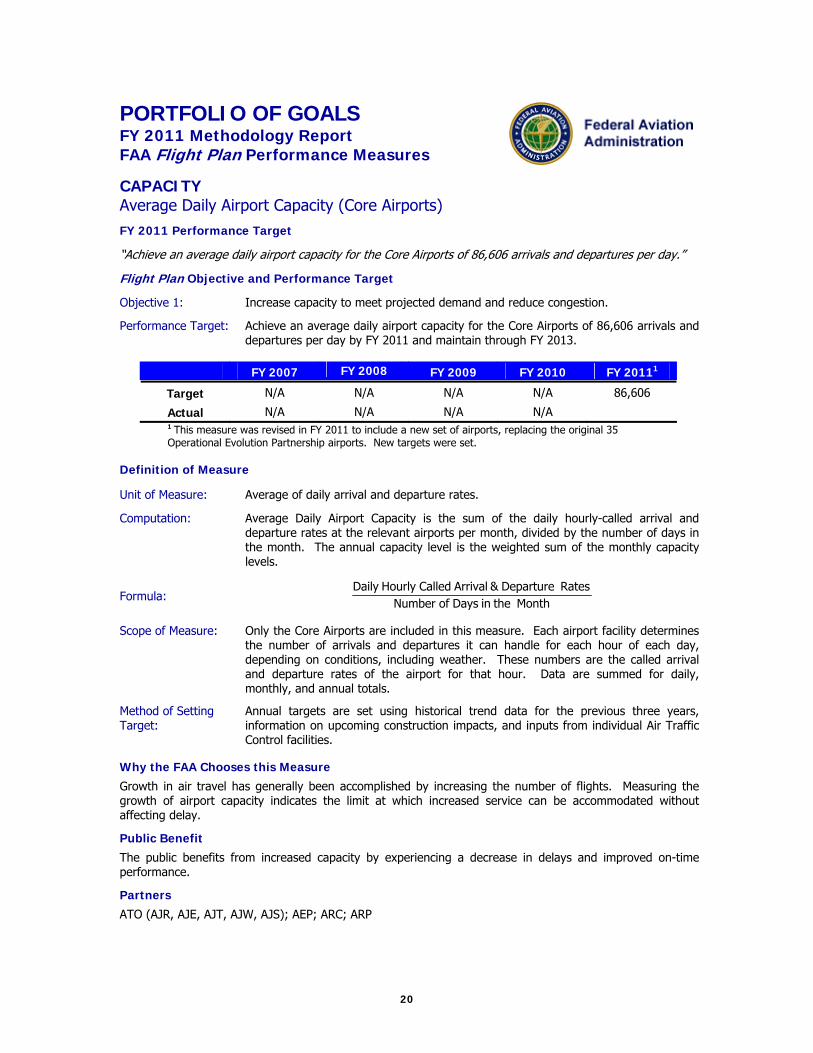
FY 2011 Performance Target “Achieve an average daily airport capacity for the Core Airports of 86,606 arrivals and departures per day.”
Flight Plan Objective and Performance Target Objective 1: Increase capacity to meet projected demand and reduce congestion. Performance Target:
Achieve an average daily airport capacity for the Core Airports of 86,606 arrivals and departures per day by FY 2011 and maintain through FY 2013.
1 This measure was revised in FY 2011 to include a new set of airports, replacing the original 35 Operational Evolution Partnership airports. New targets were set.
FY 2007 FY 2008 FY 2009 FY 2010 FY 20111
Target N/A N/A N/A N/A 86,606
Actual N/A N/A N/A N/A
Definition of Measure
Unit of Measure: Average of daily arrival and departure rates.
Computation: Average Daily Airport Capacity is the sum of the daily hourly-called arrival and departure rates at the relevant airports per month, divided by the number of days in the month. The annual capacity level is the weighted sum of the monthly capacity levels.
Formula: Month the in Days ofNumber Rates Departure & ArrivalCalledHourly Daily
Scope of Measure: Only the Core Airports are included in this measure. Each airport facility determines the number of arrivals and departures it can handle for each hour of each day, depending on conditions, including weather. These numbers are the called arrival and departure rates of the airport for that hour. Data are summed for daily, monthly, and annual totals.
Method of Setting Target:
Annual targets are set using historical trend data for the previous three years, information on upcoming construction impacts, and inputs from individual Air Traffic Control facilities.
Why the FAA Chooses this Measure
Growth in air travel has generally been accomplished by increasing the number of flights. Measuring the growth of airport capacity indicates the limit at which increased service can be accommodated without affecting delay.
Public Benefit
The public benefits from increased capacity by experiencing a decrease in delays and improved on-time performance.
Partners
ATO (AJR, AJE, AJT, AJW, AJS); AEP; ARC; ARP

21
External Factors Affecting Performance
Called rates at airports, which are adjusted in real time throughout the day, are primarily impacted by weather, construction/maintenance impacts, procedural changes, and equipment outages.
Source of the Data
The Aviation System Performance Metrics (ASPM) database, maintained by the FAA’s Office of Aviation Policy and Plans, provides the data for this metric. The individual air traffic facilities for the Core Airports provide arrival and departure rates. APO staff feed this information into the ASPM database.
Statistical Issues
None.
Completeness
Fiscal year data are finalized approximately 90 days after the close of the fiscal year.
Reliability
The reliability of ASPM is verified on a daily basis by the execution of a number of audit checks, comparison to other published data metrics, and through the use of ASPM by over 1,500 registered users.
22
PORTFOLIO OF GOALS FY 2011 Methodology Report FAA Flight Plan Performance Measures
CAPACITY Average Daily Airport Capacity (7 Metro Areas)
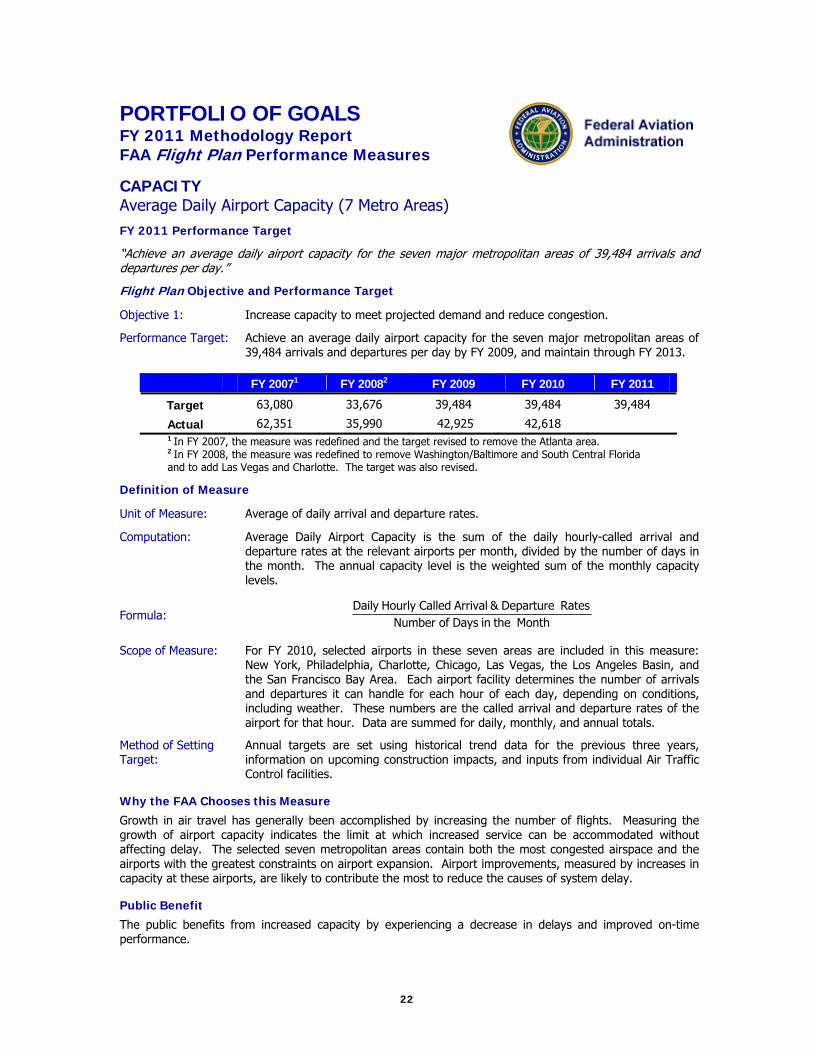
FY 2011 Performance Target “Achieve an average daily airport capacity for the seven major metropolitan areas of 39,484 arrivals and departures per day.” Flight Plan Objective and Performance Target Objective 1: Increase capacity to meet projected demand and reduce congestion. Performance Target:
Achieve an average daily airport capacity for the seven major metropolitan areas of 39,484 arrivals and departures per day by FY 2009, and maintain through FY 2013.
1 In FY 2007, the measure was redefined and the target revised to remove the Atlanta area. 2 In FY 2008, the measure was redefined to remove Washington/Baltimore and South Central Florida and to add Las Vegas and Charlotte. The target was also revised.
FY 20071 FY 20082 FY 2009 FY 2010 FY 2011
Target 63,080 33,676 39,484 39,484 39,484
Actual 62,351 35,990 42,925 42,618
Definition of Measure
Unit of Measure: Average of daily arrival and departure rates.
Computation: Average Daily Airport Capacity is the sum of the daily hourly-called arrival and departure rates at the relevant airports per month, divided by the number of days in the month. The annual capacity level is the weighted sum of the monthly capacity levels.
Formula: Month the in Days ofNumber Rates Departure & ArrivalCalledHourly Daily
Scope of Measure: For FY 2010, selected airports in these seven areas are included in this measure: New York, Philadelphia, Charlotte, Chicago, Las Vegas, the Los Angeles Basin, and the San Francisco Bay Area. Each airport facility determines the number of arrivals and departures it can handle for each hour of each day, depending on conditions, including weather. These numbers are the called arrival and departure rates of the airport for that hour. Data are summed for daily, monthly, and annual totals.
Method of Setting Target:
Annual targets are set using historical trend data for the previous three years, information on upcoming construction impacts, and inputs from individual Air Traffic Control facilities.
Why the FAA Chooses this Measure
Growth in air travel has generally been accomplished by increasing the number of flights. Measuring the growth of airport capacity indicates the limit at which increased service can be accommodated without affecting delay. The selected seven metropolitan areas contain both the most congested airspace and the airports with the greatest constraints on airport expansion. Airport improvements, measured by increases in capacity at these airports, are likely to contribute the most to reduce the causes of system delay.
Public Benefit
The public benefits from increased capacity by experiencing a decrease in delays and improved on-time performance.
23
Partners
ATO (AJR, AJT, AJE, AJW, AJS); AEP; ARP; ARC
External Factors Affecting Performance
Called rates at airports, which are adjusted in real time throughout the day, are primarily impacted by weather, construction/maintenance impacts, procedural changes, and equipment outages.
Source of the Data
The Aviation System Performance Metrics (ASPM) database, maintained by the FAA’s Office of Aviation Policy and Plans, provides the data for this metric. The individual air traffic facilities for the seven major metropolitan areas provide arrival and departure rates. APO staff feed this information into the ASPM database.
Statistical Issues
None.
Completeness
Fiscal year data is finalized approximately 90 days after the close of the fiscal year.
Reliability
The reliability of ASPM is verified on a daily basis by the execution of a number of audit checks, comparison to other published data metrics, and through the use of ASPM by over 1500 registered users.
24
PORTFOLIO OF GOALS FY 2011 Methodology Report FAA Flight Plan Performance Measures
CAPACITY Adjusted Operational Availability
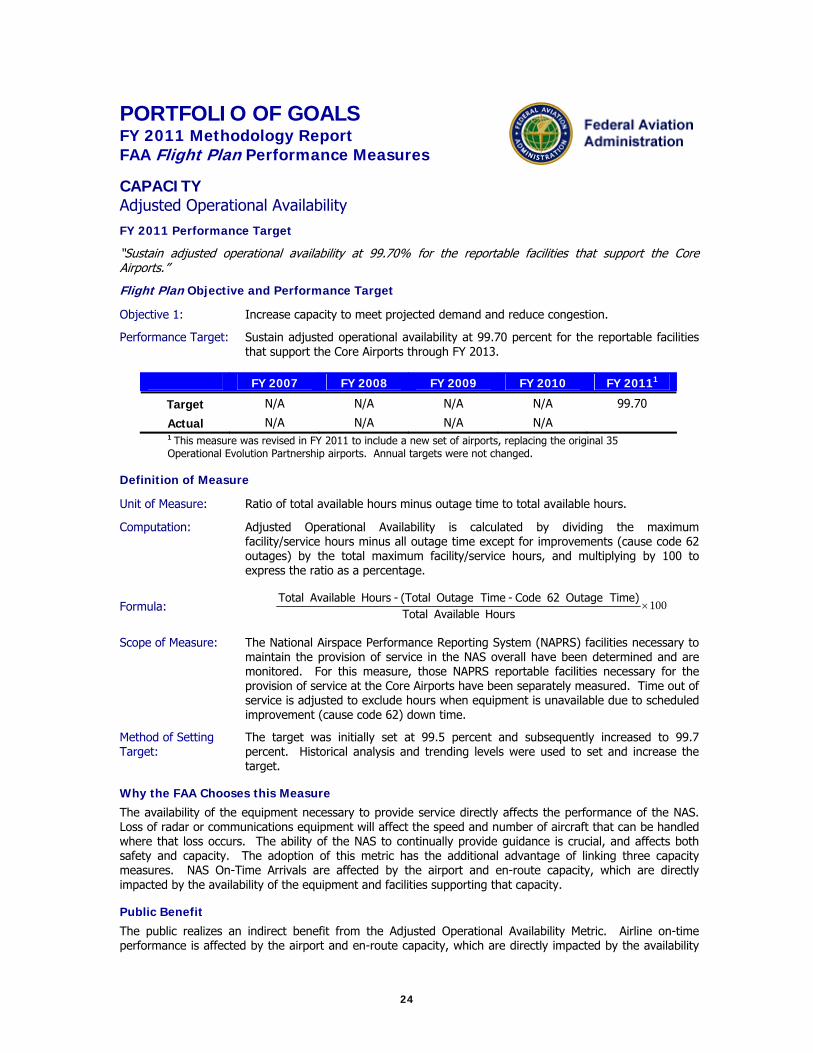
FY 2011 Performance Target “Sustain adjusted operational availability at 99.70% for the reportable facilities that support the Core Airports.” Flight Plan Objective and Performance Target Objective 1: Increase capacity to meet projected demand and reduce congestion. Performance Target:
Sustain adjusted operational availability at 99.70 percent for the reportable facilities that support the Core Airports through FY 2013.
1 This measure was revised in FY 2011 to include a new set of airports, replacing the original 35 Operational Evolution Partnership airports. Annual targets were not changed.
FY 2007 FY 2008 FY 2009 FY 2010 FY 20111
Target N/A N/A N/A N/A 99.70
Actual N/A N/A N/A N/A
Definition of Measure
Unit of Measure: Ratio of total available hours minus outage time to total available hours.
Computation: Adjusted Operational Availability is calculated by dividing the maximum facility/service hours minus all outage time except for improvements (cause code 62 outages) by the total maximum facility/service hours, and multiplying by 100 to express the ratio as a percentage.
Formula: 100Hours e AvailablTotal
Time) Outage 62 Code - Time Outage (Total - Hours e AvailablTotal
Scope of Measure: The National Airspace Performance Reporting System (NAPRS) facilities necessary to maintain the provision of service in the NAS overall have been determined and are monitored. For this measure, those NAPRS reportable facilities necessary for the provision of service at the Core Airports have been separately measured. Time out of service is adjusted to exclude hours when equipment is unavailable due to scheduled improvement (cause code 62) down time.
Method of Setting Target:
The target was initially set at 99.5 percent and subsequently increased to 99.7 percent. Historical analysis and trending levels were used to set and increase the target.
Why the FAA Chooses this Measure
The availability of the equipment necessary to provide service directly affects the performance of the NAS. Loss of radar or communications equipment will affect the speed and number of aircraft that can be handled where that loss occurs. The ability of the NAS to continually provide guidance is crucial, and affects both safety and capacity. The adoption of this metric has the additional advantage of linking three capacity measures. NAS On-Time Arrivals are affected by the airport and en-route capacity, which are directly impacted by the availability of the equipment and facilities supporting that capacity.
Public Benefit
The public realizes an indirect benefit from the Adjusted Operational Availability Metric. Airline on-time performance is affected by the airport and en-route capacity, which are directly impacted by the availability

25
of the equipment and facilities supporting that capacity. The safety of air travelers is dependent on navigational and communications equipment, and redundant back-up systems.
Partners
The Technical Operations Service Unit within the FAA’s Air Traffic Organization works with equipment vendors, En Route and Terminal Service Units to provide service to customers.
External Factors Affecting Performance
Several external factors may affect Adjusted Operational Availability. Funding levels may limit availability of maintenance personnel. Higher incidences of equipment failure, usually due to weather or natural disaster, may negatively affect the year-end average.
Source of the Data
The National Airspace System Performance Analysis System (NASPAS). NASPAS was developed to analyze outages of the Air Traffic Control Facilities in the NAS maintained by the FAA. NASPAS receives monthly updates of outage data from the National Outage Database (NODB). The Maintenance Management System (MMS) contains individual equipment outage data as recorded by the system specialist.
Statistical Issues
None.
Completeness
The FAA’s Quality Assurance and Performance Team, under ATO-W, conducts a monthly review of all Log Interrupt Reports (LIRs) that are entered into the MMS to ensure the data, which resides in the NODB, are as complete and accurate as possible.
Reliability
The National Airspace System Performance Analysis System is the official source of equipment and service performance data for the Federal Aviation Administration.
26
PORTFOLIO OF GOALS FY 2011 Methodology Report FAA Flight Plan Performance Measures
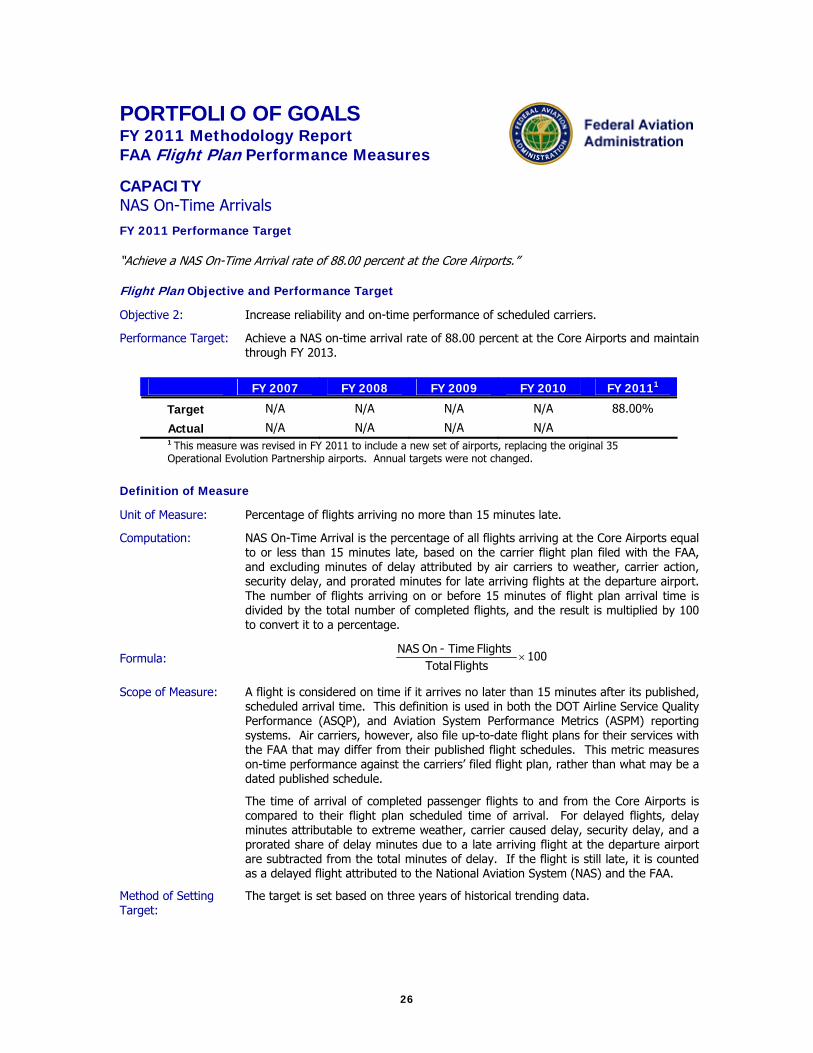
CAPACITY NAS On-Time Arrivals FY 2011 Performance Target
“Achieve a NAS On-Time Arrival rate of 88.00 percent at the Core Airports.”
Flight Plan Objective and Performance Target
Objective 2: Increase reliability and on-time performance of scheduled carriers.
Performance Target:
Achieve a NAS on-time arrival rate of 88.00 percent at the Core Airports and maintain through FY 2013.
FY 2007 FY 2008 FY 2009 FY 2010 FY 20111
Target N/A N/A N/A N/A 88.00%
Actual N/A N/A N/A N/A 1 This measure was revised in FY 2011 to include a new set of airports, replacing the original 35 Operational Evolution Partnership airports. Annual targets were not changed.
Definition of Measure
Unit of Measure: Percentage of flights arriving no more than 15 minutes late.
Computation: NAS On-Time Arrival is the percentage of all flights arriving at the Core Airports equal to or less than 15 minutes late, based on the carrier flight plan filed with the FAA, and excluding minutes of delay attributed by air carriers to weather, carrier action, security delay, and prorated minutes for late arriving flights at the departure airport. The number of flights arriving on or before 15 minutes of flight plan arrival time is divided by the total number of completed flights, and the result is multiplied by 100 to convert it to a percentage.
Formula: 100Flights Total
Flights Time-On NAS
Scope of Measure: A flight is considered on time if it arrives no later than 15 minutes after its published, scheduled arrival time. This definition is used in both the DOT Airline Service Quality Performance (ASQP), and Aviation System Performance Metrics (ASPM) reporting systems. Air carriers, however, also file up-to-date flight plans for their services with the FAA that may differ from their published flight schedules. This metric measures on-time performance against the carriers’ filed flight plan, rather than what may be a dated published schedule.
The time of arrival of completed passenger flights to and from the Core Airports is compared to their flight plan scheduled time of arrival. For delayed flights, delay minutes attributable to extreme weather, carrier caused delay, security delay, and a prorated share of delay minutes due to a late arriving flight at the departure airport are subtracted from the total minutes of delay. If the flight is still late, it is counted as a delayed flight attributed to the National Aviation System (NAS) and the FAA.
Method of Setting Target:
The target is set based on three years of historical trending data.
27
Why the FAA Chooses this Measure
On-Time performance is a measure of the ability of the FAA to deliver services. A major weakness of using air carrier scheduled on-time performance as a metric is that it contains flight delays caused by incidents outside the FAA’s control. However, the air carriers have supplied the causation of flight delay, by flight, since June 2003 under revised Part 234 instructions. Removal of delays not attributable to the FAA provides a more accurate and equitable method of measuring the FAA’s performance.
Public Benefit
This measure helps the flying public reach their intended destinations on time.
Partners
ATO (AJE, AJT, AJR, AJW, AJS); ARC; ARP; AEP; ATA; NBAA; airlines
External Factors Affecting Performance
Weather, airline scheduling practices, runway construction/maintenance, ramp/airport congestion.
Source of the Data
The ASPM database, maintained by the FAA’s Office of Aviation Policy and Plans, in conjunction with DOT’s ASQP causation database, provides the data for this metric. By agreement with DOT, certain major carriers file ASQP flight data for all flights to and from most large and medium hubs. Flight records contained in the Traffic Flow Management System (TFMS) and flight movement times provided by Aeronautical Radio, Inc. (ARINC) supplement the flight data.
Statistical Issues
Data are not reported for all carriers, only the 20 carriers reporting monthly into the ASQP reporting system.
Completeness
Fiscal year data are finalized approximately 90 days after the close of the fiscal year.
Reliability
The reliability of ASPM is verified on a daily basis by the execution of a number of audit checks, comparison to other published data metrics, and through the use of ASPM by over 1500 registered users. ASQP data is filed monthly with DOT under 14 CFR Part 234, Airline Service Quality Performance Reports, which separately requires reporting by major air carriers on flights to and from all large hubs.
28
PORTFOLIO OF GOALS FY 2011 Methodology Report FAA Flight Plan Performance Measures
CAPACITY Noise Exposure
FY 2011 Performance Target “Reduce the number of people exposed to significant noise to 19.28% below the calendar year 2005.
Flight Plan Objective and Performance Target Objective 3: Address environmental issues associated with capacity enhancements. Performance Target: Reduce the number of people exposed to significant noise by 4 percent compounded
annually through FY 2013 from the calendar year 2005.
FY 20071 FY 2008 FY 2009 FY 2010 FY 2011
Target - 4.96% - 8.76% -12.41% - 15.91% - 19.28%
Actual - 6.00% - 22.00% -42.53%2 - 43.79%3
1In FY 2010, this measure was revised from a 3-year average of the number exposed to noise to a single year's result, and the baseline was reset at FY 2005. Prior year targets and results have been recalculated. 2Revised from recalculated projection of -31%. 3Projection from trends, to be revised in May 2011.
Definition of Measure
Unit of Measure: Percent reduction in the number of people in the U.S. exposed to significant aircraft noise levels from the base year 2005. Significant aircraft noise levels as currently defined as values greater than or equal to 65 dB Day Night Sound Level (DNL). The previous target of 1 percent per year remained in effect from 2005 to 2006. The 4 percent compounded rate of reduction began in 2007.
Computation: The estimates of the number of people exposed to significant noise are calculated from the Model for Assessing Global Exposure to the Noise of Transport Aircraft (MAGENTA). The computational core of MAGENTA is FAA’s Integrated Noise Model (INM), the most widely used computer program for the calculation of aircraft noise around airports. Major assumptions on local traffic utilization come from obtaining INM datasets that were developed for an airport.
The MAGENTA model calculates individual DNL contours for the top 95 US airports using INM. To calculate the number of people within the DNL 65 dB contour at each airport, the contours are superimposed on year 2000 census population densities projected to the current year. For smaller airports, a procedure is used where contour area is calculated from airport operations data using a statistical relationship. The contours areas are then used to calculate people exposed using 2000 census population densities projected to the current year. The projection is used to account for population growth between 2000 and the current year. The individual airport exposure data is then summed to the national level. Finally, the number of people relocated through the Airport Improvement Program is subtracted from the total number of people exposed.
The U.S. MAGENTA incorporates INM Version 7.0. In addition, military operations for the KC-135 were updated based on more accurate information from the Air Force. Older, louder KC-135’s are being phased out of service, producing smaller contours at some airports.
29
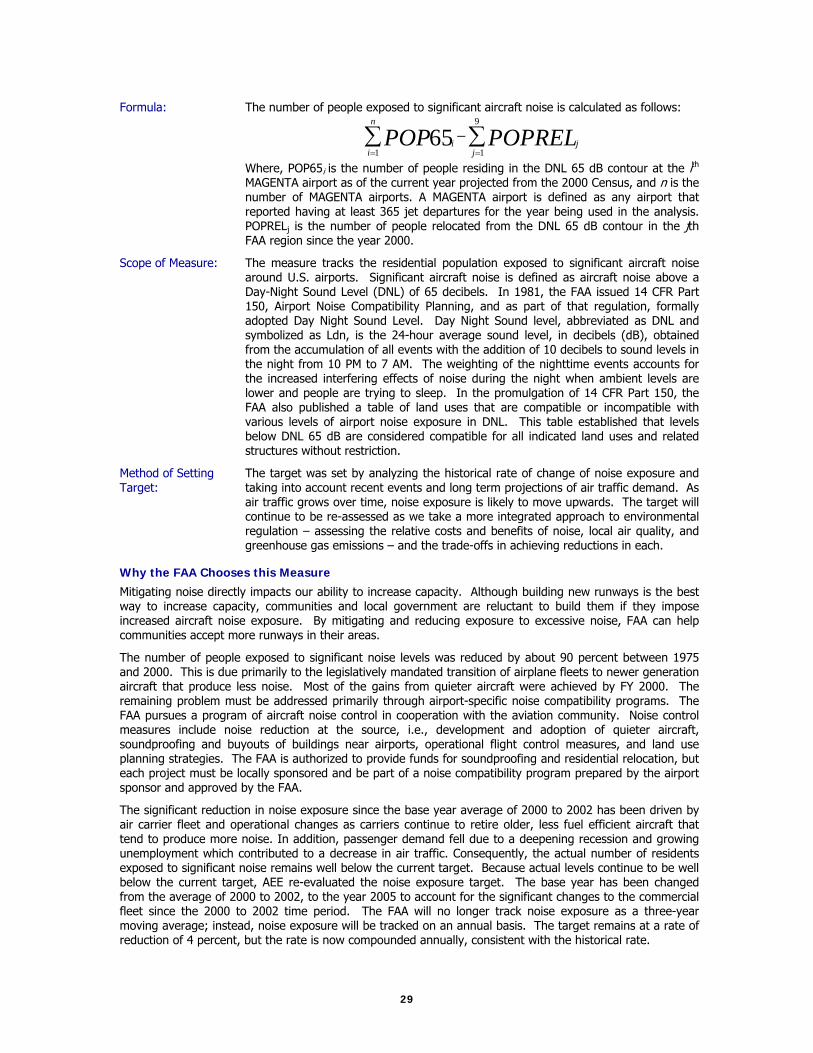
Formula: The number of people exposed to significant aircraft noise is calculated as follows:
9
1165
jj
n
ii POPRELPOP
Where, POP65i is the number of people residing in the DNL 65 dB contour at the ith MAGENTA airport as of the current year projected from the 2000 Census, and n is the number of MAGENTA airports. A MAGENTA airport is defined as any airport that reported having at least 365 jet departures for the year being used in the analysis. POPRELj is the number of people relocated from the DNL 65 dB contour in the jth FAA region since the year 2000.
Scope of Measure: The measure tracks the residential population exposed to significant aircraft noise around U.S. airports. Significant aircraft noise is defined as aircraft noise above a Day-Night Sound Level (DNL) of 65 decibels. In 1981, the FAA issued 14 CFR Part 150, Airport Noise Compatibility Planning, and as part of that regulation, formally adopted Day Night Sound Level. Day Night Sound level, abbreviated as DNL and symbolized as Ldn, is the 24-hour average sound level, in decibels (dB), obtained from the accumulation of all events with the addition of 10 decibels to sound levels in the night from 10 PM to 7 AM. The weighting of the nighttime events accounts for the increased interfering effects of noise during the night when ambient levels are lower and people are trying to sleep. In the promulgation of 14 CFR Part 150, the FAA also published a table of land uses that are compatible or incompatible with various levels of airport noise exposure in DNL. This table established that levels below DNL 65 dB are considered compatible for all indicated land uses and related structures without restriction.
Method of Setting Target:
The target was set by analyzing the historical rate of change of noise exposure and taking into account recent events and long term projections of air traffic demand. As air traffic grows over time, noise exposure is likely to move upwards. The target will continue to be re-assessed as we take a more integrated approach to environmental regulation – assessing the relative costs and benefits of noise, local air quality, and greenhouse gas emissions – and the trade-offs in achieving reductions in each.
Why the FAA Chooses this Measure
Mitigating noise directly impacts our ability to increase capacity. Although building new runways is the best way to increase capacity, communities and local government are reluctant to build them if they impose increased aircraft noise exposure. By mitigating and reducing exposure to excessive noise, FAA can help communities accept more runways in their areas.
The number of people exposed to significant noise levels was reduced by about 90 percent between 1975 and 2000. This is due primarily to the legislatively mandated transition of airplane fleets to newer generation aircraft that produce less noise. Most of the gains from quieter aircraft were achieved by FY 2000. The remaining problem must be addressed primarily through airport-specific noise compatibility programs. The FAA pursues a program of aircraft noise control in cooperation with the aviation community. Noise control measures include noise reduction at the source, i.e., development and adoption of quieter aircraft, soundproofing and buyouts of buildings near airports, operational flight control measures, and land use planning strategies. The FAA is authorized to provide funds for soundproofing and residential relocation, but each project must be locally sponsored and be part of a noise compatibility program prepared by the airport sponsor and approved by the FAA.
The significant reduction in noise exposure since the base year average of 2000 to 2002 has been driven by air carrier fleet and operational changes as carriers continue to retire older, less fuel efficient aircraft that tend to produce more noise. In addition, passenger demand fell due to a deepening recession and growing unemployment which contributed to a decrease in air traffic. Consequently, the actual number of residents exposed to significant noise remains well below the current target. Because actual levels continue to be well below the current target, AEE re-evaluated the noise exposure target. The base year has been changed from the average of 2000 to 2002, to the year 2005 to account for the significant changes to the commercial fleet since the 2000 to 2002 time period. The FAA will no longer track noise exposure as a three-year moving average; instead, noise exposure will be tracked on an annual basis. The target remains at a rate of reduction of 4 percent, but the rate is now compounded annually, consistent with the historical rate.
30
Environmental trends based on expansion of the U.S. air transportation system show that noise exposure is likely to move upwards as traffic growth continues – even taking into account forecasted fleet changes and implementation of beneficial new air traffic procedures. The agency’s ability to develop next generation technologies and have the broadest possible array of available noise mitigation approaches at its disposal will affect FAA’s ability to continue making significant improvements in aviation noise exposure.
Public Benefit
Public benefit is reduced exposure to unwanted aircraft noise and increased capacity, reducing airport congestion and delays.
Partners
Partners include government agencies worldwide and the aviation industry through the International Civil Aviation Organization (ICAO), who periodically update noise standards and methodologies. The FAA has also partnered with NASA in the development of continuous lower energy, emissions and noise (CLEEN) technologies for civil subsonic jet airplanes to help achieve NextGen goals to increase airspace system capacity by reducing significant community noise and air quality emissions impacts in absolute terms and limiting or reducing aviation greenhouse gas emissions impacts on the global climate.
External Factors Affecting Performance
The primary external factors affecting performance are market forces that drive changes in commercial aircraft fleets and operations. Other external factors include providing FAA the authority and funding to accelerate the implementation of new aircraft emissions and noise technology. These programs help foster the type of fleet and performance change required to meet either our current target or historic experience.
Source of the Data
The Model for Assessing Global Exposure form Noise of Transport Airplanes, MAGENTA, is used to track airport noise exposure. MAGENTA uses updated population data from the 2000 Census projected to the current year to account for population growth. The data source for airport traffic is the FAA Enhanced Traffic Management System (ETMS). This database has replaced the original source, the Official Airline Guide (OAG). Unlike the OAG, the ETMS database includes unscheduled air traffic, which allows for more accurate modeling of freight, general aviation, and military operations. The ETMS also provides more details on aircraft type for a more accurate distribution of aircraft fleet mix.
Since ETMS does not provide future data on flight operations, the FAA uses the Terminal Area Forecast (TAF). TAF provides current and accurate information on how operations will increase on an airport specific basis. Therefore, the current year’s result is classified as preliminary until the following year when projected data is finalized. Data on the number of people relocated through the Airport Improvement Program are collected from FAA regional offices. Local traffic utilization data are collected from individual airports and updated periodically.
A task group formed to develop MAGENTA by the Committee on Aviation Environmental Protection (CAEP) under the International Civil Aviation Organization (ICAO) has thoroughly reviewed the model’s population exposure methodology and has validated it for several airport specific cases. MAGENTA played an important role in the setting of new international aircraft noise standards by CAEP in 2001. CAEP has used MAGENTA to assess the benefits (reduction in number of people exposed to aircraft noise) of several noise stringency proposals.
Statistical Issues
This measure is derived from model estimates that are subject to errors in model specification. In 2004 the FAA replaced the actual number of people exposed to significant noise with the percent decrease in the number of people exposed. The move from actual numbers to percent helped avoid confusion over U.S. noise exposure trends caused by annual improvements to the noise exposure model. A major change to MAGENTA (Model for Assessing the Global Exposure of Noise because of Transport Airplanes) would result in a significant change in the estimate of the number of people exposed to significant noise levels around US airports. Improvements to the estimate of the number of people exposed to significant noise levels will continue as FAA plans to replace MAGENTA with the Aviation Environmental Design Tool (AEDT).

31
Completeness
No actual count is made of the number of people exposed to aircraft noise. Aircraft type and event level are current. However, some of the databases used to establish route and runway utilization were developed from 1990 to 1997. Changes in airport layout including expansions may not be reflected. The FAA continues to update these databases as they become available. The benefits of federally funded mitigation, such as buyout, are accounted for.
The noise studies obtained from U.S. airports have gone through a thorough public review process; either under the National Environmental Policy Act (NEPA) requirements or as part of a land use compatibility program.
Performance measure data for the current year (forecasted data) are calculated and reported during the period of July and August, and the data are finalized by May of the following reporting year.
Reliability
The Integrated Noise Model (the core of the MAGENTA model) has been validated with actual acoustic measurements at both airports and other environments such as areas under aircraft at altitude. External forecast data are from primary sources. The MAGENTA population exposure methodology has been thoroughly reviewed by an ICAO task group and was most recently validated for a sample of airport-specific cases.
32
PORTFOLIO OF GOALS FY 2011 Methodology Report FAA Flight Plan Performance Measures
CAPACITY Aviation Fuel Efficiency
FY 2011 Performance Target “Improve aviation fuel efficiency by 12 percent, as measured by the calendar year 2010 fuel burned per revenue mile flown, relative to the calendar year 2000 baseline.” Flight Plan Objective and Performance Target Objective 3: Address environmental issues associated with capacity enhancements. Performance Target: Improve aviation fuel efficiency by 2 percent per year, through FY 2015, as
measured by the calendar year 2010 fuel burned per revenue mile flown, relative to the calendar year 2000 baseline.
1 Targets were revised to reflect the change in measurement basis from three year moving average to yearly, and change in baseline from calendar years 2000-2002 (three year average) to calendar year 2000 (FY2001). 2 Actuals have been recalculated from the historical time series data to show yearly performance instead of three year moving average.
FY 2007 FY 2008 FY 2009 FY 2010 FY 2011
Target1 -7.00% -8.00% -9.00% -10.00% -12.00%
Actual2 -13.87% -13.52% -14.03% -15.25%
Definition of Measure
Unit of Measure: Cumulative reduction in fuel burned per mile flown.
Computation: Measuring and tracking fuel efficiency from commercial aircraft operations allows FAA to monitor improvements in aircraft/engine technology and operational procedures, as well as enhancements in the airspace transportation system. The FAA measures performance against this target using the Aviation Environmental Design Tool (AEDT)/System for assessing Aviation Global Emissions (SAGE). AEDT/SAGE is a FAA-developed computer model that estimates aircraft fuel burn and emissions for variable year emissions inventories and for operational, policy, and technology-related scenarios. For this target, AEDT/SAGE is used to generate annual fuel burn and total distance flown data for all U.S. commercial operations.
Formula: )kilometers of (billions Distance (Tg) Burned Fuel
(Fuel Burn values in Teragrams, Tg, where 1 Tg = 1012 g)
Scope of Measure: This measure focuses on all U.S. commercial operations.
Method of Setting Target:
This target was selected based upon knowledge of the factors that most accurately characterize commercial aircraft fleet fuel efficiency. The data that underlies this target can be assessed in terms of aircraft and engine technology, fleet turnover, and air traffic management procedures that influence routes and schedule.
Why the FAA Chooses this Measure
Measuring and tracking fuel efficiency from aircraft operations allows FAA to monitor improvements in aircraft/engine technology and operational procedures, and enhancements in the airspace transportation system. This information provides an assessment of their influence on reducing aviation’s emissions contribution.
33
Public Benefit
Today’s aircraft are up to 70 percent more efficient than early commercial jet aircraft. However there is growing concern over aviation’s impact on the environment and public health. Aviation is currently viewed as a relatively small contributor to those emissions that have the potential to influence air quality and global climate. Carbon dioxide (CO2) emissions are a primary greenhouse gas and are directly related to the fuel burned during the aircraft’s operation. As air traffic grows, this contribution will increase without improvements in technology and airspace management.
This measure supports the development of these improvements to reduce aviation’s impact on the environment and thereby improve public health and welfare. In addition, more fuel efficient aircraft should contribute to improving the financial well-being of commercial airlines and a growing economy.
Partners
The National Aeronautics and Space Administration (NASA) works with the FAA to conduct research and development in order to identify engine and airframe technologies that offer potential for reducing fuel burn and emissions. The Aerospace Industries Association works with the FAA and NASA to commercialize technologies from the research phase and develop operational procedures to address environmental impacts. The Air Transport Association works with the FAA to identify fleet and air traffic procedural changes that improve fuel efficiency.
External Factors Affecting Performance
Performance is heavily dependent on commercial airline operating procedures and day to day operational conditions. This includes the airline’s operating fleet and route assignments, air traffic conditions, weather, airport operating status, congestion in the system, and any disruptions that introduce delay in scheduled flights. For example, a major sustained disruption or enhancement in air traffic and/or a significant shift in commercial operations amongst airlines, including changes in fleet composition and missions could have a profound impact upon achieving the performance target.
Source of the Data
The AEDT/SAGE system uses radar-based data from the Enhanced Traffic Management System (ETMS) and Official Airline Guide (OAG) schedule information to generate annual inventories of fuel burn and total distance flown data for all U.S. commercial operations.
Statistical Issues
Potential seasonal variability and variability from year to year can be expected when analyzing air traffic data and commercial operations. The extent to which enhancements are incorporated to improve model accuracy, for example via more robust aerodynamic performance modeling algorithms and database of aircraft/engine fuel burn information, will impact the overall results and thus the performance target. This could create some statistical variability from year to year if not properly taken into account. In cases where such enhancements have the potential to create a significant shift in baseline, annual inventories may need to be re-processed and/or adjusted to ensure consistency and accuracy of results. The extent to which aircraft fleet improvements cannot be sufficiently modeled because of a lack of manufacturer proprietary data may also influence the performance target results. In this case, attempts will be made to characterize such aircraft with the best publicly available information, recognizing that newer aircraft types in the fleet will likely exist in significantly lesser numbers, thus minimizing the influence upon the results.
Completeness
Data used to measure performance against the target is assessed for quality control purposes. Input data for the AEDT/SAGE model are validated before proceeding with model runs. Radar data from the ETMS are assessed to remove any anomalies, check for completeness, and pre-processed for input to the AEDT/SAGE model. ETMS data are verified against the OAG information in order to avoid any duplication of flights in the annual inventory.
In some cases ETMS data lack appropriate fields to conduct quality control and in these cases the data is removed. Data from the AEDT/SAGE model is verified by comparing output from previous years and analyzing trends to ensure that they are consistent with expectations. In other cases monthly inventories may be analyzed to validate the results. Model output is subsequently post-processed using Excel
34
worksheets to perform the calculations for the performance target. Formulae and calculations are checked in order to ensure accuracy.
Full documentation of this target is determined when the annual inventories have been accomplished and the post-processing calculations have been completed, resulting in a percentage reduction in fuel efficiency relative to the baseline. The standard for this documentation is set by the FAA Office of Environment and Energy, which is separate from the organization (DOT Volpe National Transportation Systems Center) responsible for input and output associated with the AEDT/SAGE model runs and annual inventories.
Reliability
The measuring procedure used for this performance target is highly reliable. That is to say that the processing of data through the AEDT/SAGE model including the performance of algorithms is not subject to random factors that could influence the results. However, as mentioned above, this performance target is potentially influenced by factors outside the control of the FAA.
We do not expect increases in fuel burn or decreases in distance traveled or both to degrade the fleet fuel efficiency significantly. Further, we do not expect this to prevent us from meeting the FY 2011 target. However, we do expect that in the future, aircraft and engine technology improvements or air traffic management improvements or both may not be enough to offset traffic growth, congestion and delays. In addition, the current metric for measuring and tracking fuel efficiency may not adequately capture performance to the degree that would allow future decisions on technological and operational considerations. Thus, we are continuing to review the impact of improvements on air traffic management and changes in operational trends to assess whether we should use a revised performance metric for future targets.
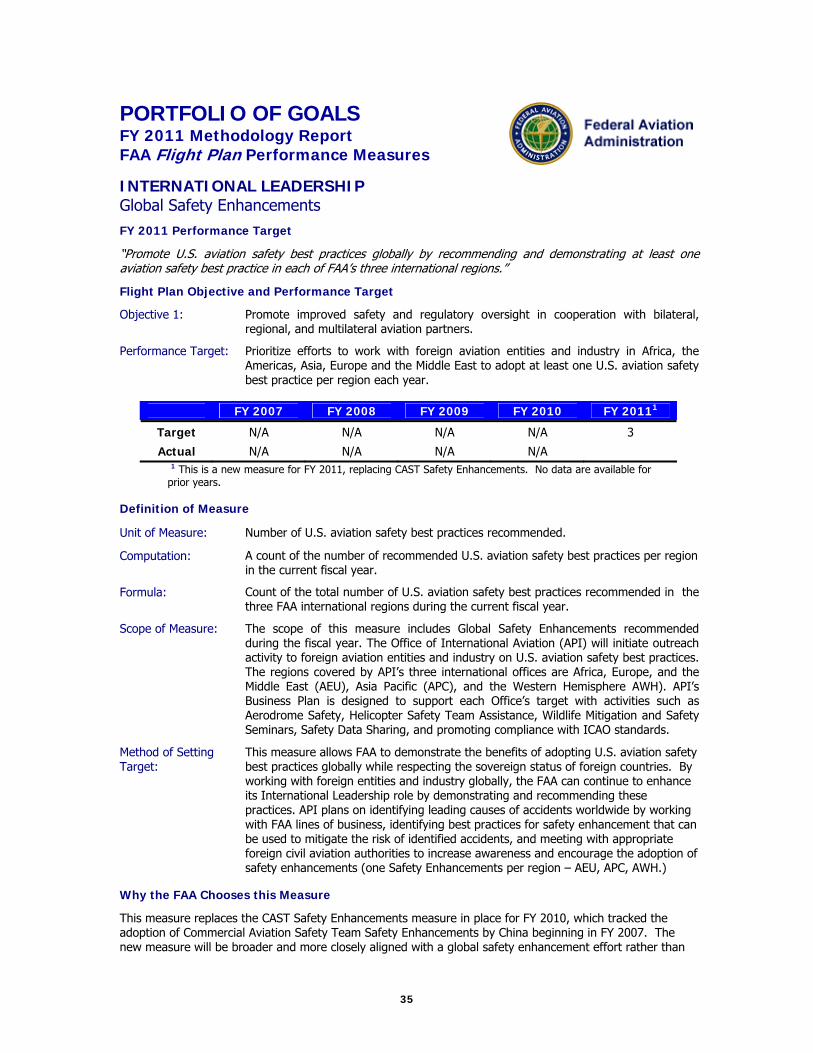
35
PORTFOLIO OF GOALS FY 2011 Methodology Report FAA Flight Plan Performance Measures
INTERNATIONAL LEADERSHIP Global Safety Enhancements FY 2011 Performance Target “Promote U.S. aviation safety best practices globally by recommending and demonstrating at least one aviation safety best practice in each of FAA’s three international regions.”
Flight Plan Objective and Performance Target Objective 1:
Promote improved safety and regulatory oversight in cooperation with bilateral, regional, and multilateral aviation partners.
Performance Target: Prioritize efforts to work with foreign aviation entities and industry in Africa, the Americas, Asia, Europe and the Middle East to adopt at least one U.S. aviation safety best practice per region each year.
1 This is a new measure for FY 2011, replacing CAST Safety Enhancements. No data are available for prior years.
FY 2007 FY 2008 FY 2009 FY 2010 FY 20111
Target N/A N/A N/A N/A 3
Actual N/A N/A N/A N/A
Definition of Measure
Unit of Measure: Number of U.S. aviation safety best practices recommended.
Computation: A count of the number of recommended U.S. aviation safety best practices per region in the current fiscal year.
Formula: Count of the total number of U.S. aviation safety best practices recommended in the three FAA international regions during the current fiscal year.
Scope of Measure: The scope of this measure includes Global Safety Enhancements recommended during the fiscal year. The Office of International Aviation (API) will initiate outreach activity to foreign aviation entities and industry on U.S. aviation safety best practices. The regions covered by API’s three international offices are Africa, Europe, and the Middle East (AEU), Asia Pacific (APC), and the Western Hemisphere AWH). API’s Business Plan is designed to support each Office’s target with activities such as Aerodrome Safety, Helicopter Safety Team Assistance, Wildlife Mitigation and Safety Seminars, Safety Data Sharing, and promoting compliance with ICAO standards.
Method of Setting Target:
This measure allows FAA to demonstrate the benefits of adopting U.S. aviation safety best practices globally while respecting the sovereign status of foreign countries. By working with foreign entities and industry globally, the FAA can continue to enhance its International Leadership role by demonstrating and recommending these practices. API plans on identifying leading causes of accidents worldwide by working with FAA lines of business, identifying best practices for safety enhancement that can be used to mitigate the risk of identified accidents, and meeting with appropriate foreign civil aviation authorities to increase awareness and encourage the adoption of safety enhancements (one Safety Enhancements per region – AEU, APC, AWH.)
Why the FAA Chooses this Measure
This measure replaces the CAST Safety Enhancements measure in place for FY 2010, which tracked the adoption of Commercial Aviation Safety Team Safety Enhancements by China beginning in FY 2007. The new measure will be broader and more closely aligned with a global safety enhancement effort rather than

36
the previous specific focus on only one country. The “three aviation safety best practices for safety enhancements” target per year is both a stretch and realistic goal. Each best practice requires coordination and cooperation from within FAA’s Lines of Business (LOB) and Staff Offices, the U.S. State Department, individual foreign governments, and the individual aviation authorities contained within those international entities.
Public Benefit
Improved safety and regulatory oversight in cooperation with bilateral, regional, and multilateral aviation partners. Safer foreign aviation system lowers the probability of harm to U.S. citizens traveling abroad, and supports U.S. economic interests across multiple industries related to aviation. Promoting the standardization of safety programs/rules enables all travelers and carries the advantage of operating on same standards.
Partners
FAA Lines of Business and other U.S. Government Agencies, foreign governments and aviation authorities within international entities.
External Factors Affecting Performance
External factors affecting performance of this measure are related to political will of foreign countries to participate in the aviation safety best practices activities and the funding available to participating countries and the FAA.
Source of the Data
Data will be collected to justify completeness and will come from a variety of sources within FAA’s organizations, including, but not limited to, agendas, press releases, speeches, talking points, briefing books, background papers, agreements, presentations, and discussions.
Statistical Issues
None.
Completeness
There are no completeness issues associated with this measure since it is a simple count of the number of recommended safety best practices completed.
Reliability
The Office of International Affairs will closely monitor recommended best safety practices activities, meet regularly with FAA lines of business to maintain reliable records of activities.
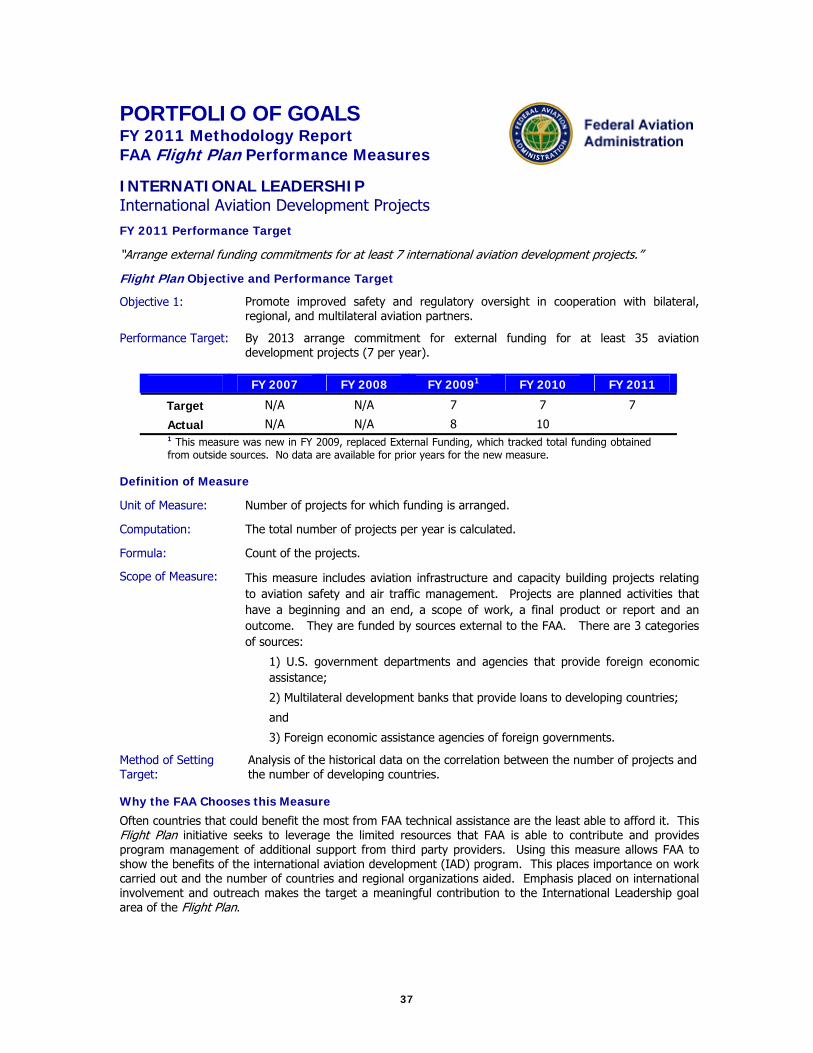
37
PORTFOLIO OF GOALS FY 2011 Methodology Report FAA Flight Plan Performance Measures
INTERNATIONAL LEADERSHIP International Aviation Development Projects
FY 2011 Performance Target “Arrange external funding commitments for at least 7 international aviation development projects.”
Flight Plan Objective and Performance Target Objective 1: Promote improved safety and regulatory oversight in cooperation with bilateral,
regional, and multilateral aviation partners.
Performance Target: By 2013 arrange commitment for external funding for at least 35 aviation development projects (7 per year).
1 This measure was new in FY 2009, replaced External Funding, which tracked total funding obtained from outside sources. No data are available for prior years for the new measure.
FY 2007 FY 2008 FY 20091 FY 2010 FY 2011
Target N/A N/A 7 7 7
Actual N/A N/A 8 10
Definition of Measure
Unit of Measure: Number of projects for which funding is arranged.
Computation: The total number of projects per year is calculated.
Formula: Count of the projects.
Scope of Measure: This measure includes aviation infrastructure and capacity building projects relating to aviation safety and air traffic management. Projects are planned activities that have a beginning and an end, a scope of work, a final product or report and an outcome. They are funded by sources external to the FAA. There are 3 categories of sources:
1) U.S. government departments and agencies that provide foreign economic assistance;
2) Multilateral development banks that provide loans to developing countries;
and
3) Foreign economic assistance agencies of foreign governments.
Method of Setting Target:
Analysis of the historical data on the correlation between the number of projects and the number of developing countries.
Why the FAA Chooses this Measure
Often countries that could benefit the most from FAA technical assistance are the least able to afford it. This Flight Plan initiative seeks to leverage the limited resources that FAA is able to contribute and provides program management of additional support from third party providers. Using this measure allows FAA to show the benefits of the international aviation development (IAD) program. This places importance on work carried out and the number of countries and regional organizations aided. Emphasis placed on international involvement and outreach makes the target a meaningful contribution to the International Leadership goal area of the Flight Plan.

38
Public Benefit
Promulgation of FAA safety and efficiency practices in the developing countries; leveraging of FAA expertise and resources; avoidance of duplication of assistance in the international aviation donor community; and increased safety for U.S. citizens whenever they travel.
Partners
U.S. Trade and Development Agency, U.S. Department of State, the World Bank, Millennium Challenge Corporation, and industry.
External Factors Affecting Performance
Ability and willingness of the foreign civil aviation authorities to accept and use grant funding expeditiously. Financial assistance earmarked for aviation infrastructure from U.S. government organizations, multilateral development banks, and industry.
Source of the Data
Sources of data will include correspondence with donor organizations, announcements, press releases, letters, contracts and memorandums of agreement.
Statistical Issues
None.
Completeness
Projects will be counted once funds are committed to fund the project with an agreement by all parties involved. Committed funds are not necessarily obligated.
Reliability
The Office of International Aviation will closely monitor projects, meet regularly with lines of business, program staff and funding organizations to maintain reliable records of IAD projects and their implementation.
39
PORTFOLIO OF GOALS FY 2011 Methodology Report FAA Flight Plan Performance Measures
INTERNATIONAL LEADERSHIP Aviation Leaders
FY 2011 Performance Target “Work with at least 3 countries to develop aviation leaders in FY 2011.”
Flight Plan Objective and Performance Target Objective 1: Promote improved safety and regulatory oversight in cooperation with bilateral,
regional, and multilateral aviation partners.
Performance Target: By 2013, work with at least 18 countries or regional organizations to develop aviation leaders to strengthen the global aviation infrastructure.
1 This was a new measure for FY 2009. No data are available for prior years.
FY 2007 FY 2008 FY 20091 FY 2010 FY 2011
Target N/A N/A 2 3 3
Actual N/A N/A 7 11
Definition of Measure
Unit of Measure: Number of countries or regional organizations that participate in training for leaders. A regional organization is a chartered organization that represents the aviation interests of a particular geographic region of the world.
Computation:
The total number of countries or regional organizations per year for five years is calculated.
Formula: Count of countries or regional organizations.
Scope of Measure:
The number of countries or regional organizations that participate in targeted developmental training in management, technical and organizational skills. A regional organization counts as one unit of measure; a country will count as one unit of measure. A country will not count if it has already been included in a training event with participants from a regional organization.
Method of Setting Target:
Analysis of the historical data on the number of programs created and the number of countries represented.
Why the FAA Chooses this Measure
To keep FAA’s strategic vision representative of our international aviation leadership, this Flight Plan measure showcases opportunities the Office of International Aviation (API) arranges for foreign civil aviation leaders to strengthen their aviation leadership skills through participation in specific programs. For example, the Department of State’s International Visitor Leadership Program, FAA’s Executive Management Development Training, and management courses at the FAA Academy are all venues providing developmental opportunities for potential and current civil aviation leaders. Working with foreign aviation professionals to develop solid aviation leadership skills is an integral component of development of civil aviation administrations worldwide.
Public Benefit
As foreign aviation leaders are exposed to FAA best practices, they are better able to effect improvements within their civil aviation authorities. Success in meeting this target allows FAA to dedicate its resources to working with countries that learn how to independently meet international aviation standards.
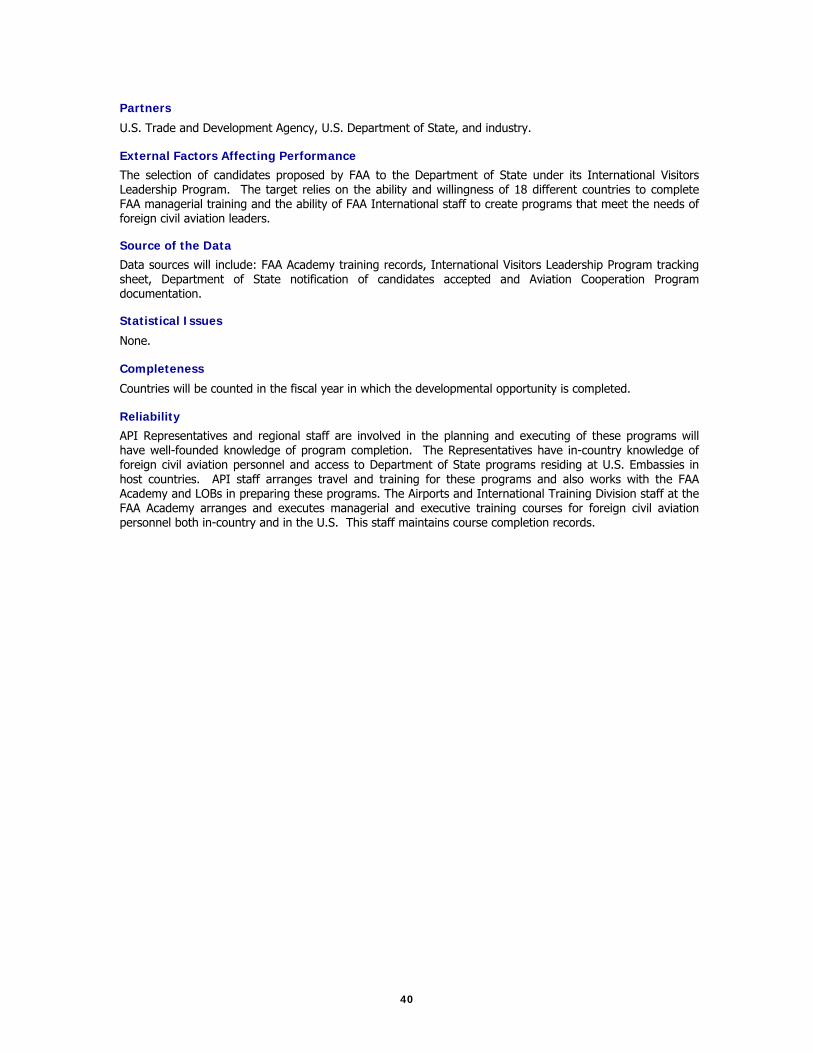
40
Partners
U.S. Trade and Development Agency, U.S. Department of State, and industry.
External Factors Affecting Performance
The selection of candidates proposed by FAA to the Department of State under its International Visitors Leadership Program. The target relies on the ability and willingness of 18 different countries to complete FAA managerial training and the ability of FAA International staff to create programs that meet the needs of foreign civil aviation leaders.
Source of the Data
Data sources will include: FAA Academy training records, International Visitors Leadership Program tracking sheet, Department of State notification of candidates accepted and Aviation Cooperation Program documentation.
Statistical Issues
None.
Completeness
Countries will be counted in the fiscal year in which the developmental opportunity is completed.
Reliability
API Representatives and regional staff are involved in the planning and executing of these programs will have well-founded knowledge of program completion. The Representatives have in-country knowledge of foreign civil aviation personnel and access to Department of State programs residing at U.S. Embassies in host countries. API staff arranges travel and training for these programs and also works with the FAA Academy and LOBs in preparing these programs. The Airports and International Training Division staff at the FAA Academy arranges and executes managerial and executive training courses for foreign civil aviation personnel both in-country and in the U.S. This staff maintains course completion records.
41
PORTFOLIO OF GOALS FY 2011 Methodology Report FAA Flight Plan Performance Measures
INTERNATIONAL LEADERSHIP NextGen Technologies
FY 2011 Performance Target “Expand the use of Next Generation Air Transportation System (NextGen) performance-based systems to one priority country.”
Flight Plan Objective and Performance Target Objective 2:
Promote seamless operations around the globe in cooperation with bilateral, regional, and multilateral aviation partners.
Performance Target:
By FY 2014, expand the use of NextGen performance-based systems and concepts to five priority countries.
FY 2007 FY 2008 FY 2009 FY 2010 FY 2011
Target 1 1 1 1 1
Actual 1 2 1 2
Definition of Measure
Unit of Measure: Total number of countries taking a significant step, as a result of FAA assistance and collaboration, to implement the operational use of NextGen technologies, procedures, or concepts.
Computation:
A count of the countries involved with FAA on technical assistance or general cooperation that have achieved significant implementation milestones on NextGen technologies, procedures, or concepts. Note that a single country could meet this performance target in different years as long as the specific NextGen technology, procedures or concept is different from what was accounted for in previous years.
Formula: Count of the countries.
Scope of Measure: Priority countries are those countries viewed by the FAA as strategic partners in global aviation. These countries include Canada, Mexico, Brazil, Japan, India, China, and Australia, just to name a few. NextGen supporting technologies include, but are not limited to, the basic GPS system and its capabilities, Wide and Local Area Augmentation Systems (WAAS/LAAS), Performance Based Navigation (RNAV/RNP), Performance Based Communications, Performance Based Surveillance, Automatic Dependent Surveillance - Broadcast (ADS-B), Air Traffic Flow Management (ATFM), Reduced Vertical Separation Minima (RVSM) and System Wide Information Management (SWIM).
Method of Setting Target:
Measuring success in the international leadership environment is very difficult and challenging compared with other FAA measures such as on-time departures and arrivals. Success is often the intangible result of a sustained international commitment and support program. Recognizing this, the Air Traffic Organization (ATO) provides a wide array of technical assistance and support to the international civil aviation community to promote NextGen and influence countries to take significant steps towards the implementation and operational use of NextGen technologies, procedures, and concepts. The original target of one country per year was selected as a reasonable of the effectiveness of the ATO’s NextGen outreach efforts. This measure is still a valid one since, although many international activities are ongoing throughout the year, only a small number reach the level of maturity that are required to meet this target. There are many operational and political
42
reasons that significant commitments towards NextGen are delayed, thus the target will remain at one country per year. Additionally, the ATO is in the process of re-organizing this performance target and supporting initiatives to align with the ATO International Strategy document that is now published annually.
Why the FAA Chooses this Measure
By working with international civil aviation authorities, organizations and states, the FAA can continue to enhance its international leadership role and ensure harmonization of U.S. NextGen technologies, procedures and concepts with global, regional and state-level air traffic management (ATM) modernization efforts. These same NextGen technologies, procedures, and concepts are currently being explored and implemented in the U.S. National Airspace System (NAS) and are critical to the success of the NextGen to handle the projected demands on the U.S. airspace system in the future. This global harmonization of aviation systems will increase the safety, capacity and efficiency of international aviation not only for U.S. carriers, but also for U.S. citizens traveling on foreign flag carriers.
Public Benefit
Global harmonization of NextGen components (influencing others to investigate NextGen solutions) will incrementally elevate global reliance on U.S. aviation ground and airborne technologies and procedures. This will in turn, over time, standardize a higher percentage of the global air traffic control system with that of the U.S. NAS. The result will be a more familiar, safe, efficient and environmentally friendly operating environment around the world for U.S. citizens traveling abroad on U.S. or foreign air carriers.
Partners
The NextGen Technologies performance target is a cumulative effort of the entire ATO. As stated previously, the ATO provides a wide array of technical assistance and international leadership to a variety of countries and international organizations, including the International Civil Aviation Organization (ICAO) and Civil Air Navigation Services Organization (CANSO), that cross-cut the many ATO service and business units. The ultimate success of this measure is not known at the outset, but determined mid-year based on the maturity of the NextGen-based support project and the willingness of the foreign government and/or international organization to commit to U.S. NextGen solutions. Thus, the entire ATO may contribute to the success of this target. In addition, FAA’s Office of International Aviation (API) provides assistance to the Lines of Business and can contribute significantly to the success of the NextGen performance target.
External Factors Affecting Performance
There is no budget associated with this performance target, as the global support that the ATO provides in support of NextGen is assumed by the specific program offices or paid for by international civil aviation authorities or air navigation service providers through the execution of reimbursable bilateral technical assistance agreements. However, political will, cultures, foreign policy, and other government budgets can be significant factors in the success of the NextGen performance target.
Source of the Data
The ATO Strategy and Performance - International Office manages and oversees ATO international cooperation via the ATO International Strategic Plan for FY 2011, and is also actively engaged in defining and managing the activities of the Joint Planning and Development Office (JPDO) NextGen Global Harmonization Working Group. As such, the ATO Strategy and Performance - International Office will monitor all activity progress underway related to NextGen supporting technologies, procedures and concepts, and determine which country/State cooperative activity will ultimately close out this performance target for FY 2011. Data will then be collected to justify completeness.
Statistical Issues
None.
Completeness
The ATO Strategy and Performance - International Office, as the owner of this initiative and performance target, is the office that monitors international activity throughout the fiscal year, collects all pertinent documentation related to the completion of this performance target, and then assesses if the performance target was successfully achieved.

43
Reliability
The FAA ATO Strategy and Performance - International Office will coordinate with other supporting offices related to the management, monitoring and close-out of this performance target, mainly the different ATO Service Units, the FAA Office of International Aviation, and the JPDO to cross-check and validate the successful completion of this performance target.
44
PORTFOLIO OF GOALS FY 2011 Methodology Report FAA Flight Plan Performance Measures
ORGANIZATIONAL EXCELLENCE OPM Hiring Standard
FY 2011 Performance Target
“By FY 2010, 80 percent of FAA external hires will be filled within OPM’s 45-day standard for government-wide hiring.”
Flight Plan Objective and Performance Target Objective 1: Implement human resource management practices to attract and retain a highly
skilled, diverse workforce and provide employees a safe, positive work environment. Performance Target:
By FY 2010, 80 percent of FAA external hires will be filled within OPM’s 45-day standard for government-wide hiring.
FY 2007 FY 2008 FY 2009 FY 2010 FY 2011
Target N/A 50.00% 65.00% 80.00% 80.00%
Actual N/A 79.00% 80.88% 82.00%
Definition of Measure
Unit of Measure:
The unit of measure is the percentage of external-hire job offers made within 45 business days
Computation: Using the Office Of Personnel Management (OPM) definition, OPM’s 45-day hiring process measure is defined as beginning one day after a vacancy announcement closes and ending the day a tentative job offer is made to an applicant.
Formula: 100offers job hire external ofnumber Total
standardday -45 the within made offers job hire external ofNumber
Scope of Measure: The measure assesses hiring time, defined as the percentage of external hire job offers made within the OPM 45-day standard. Air Traffic Controllers (2152s) and Executive Service positions are not included in this target, but are tracked separately.
Method of Setting Target:
The OPM Hiring Standard measure was new in FAA’s Flight Plan for FY 2008. The measure was developed by the Office of Personnel Management as a government-wide performance standard for HR hiring offices. In the FAA, the measure applies to all occupational series serviced through its on-line application system, the Automated Vacancy Information Access Tool for On-Line Referral (AVIATOR), except for Air Traffic Controller (2152) and Executive positions.
Why the FAA Chooses this Measure
Throughout government and industry, there is fierce competition to attract a skilled workforce. The FAA must hire adequate staff with the requisite competencies in a timely manner. Using the OPM 45-day hiring standard as an Organizational Excellence performance measure, the FAA will achieve greater efficiencies when it comes to hiring the agency’s most valuable asset, its people. In anticipation of the forthcoming retirement bubble, with more employees becoming retirement-eligible each year, it is in the agency’s best interest to ensure that the hiring process nets qualified individuals needed to achieve mission results and that the hiring is accomplished in a timely manner. Measuring hiring time is a critical step in improving this process.

45
Public Benefit
Timely applicant selections are being made for FAA jobs. By use of this standard the lengthy hiring process is decreased and applicants are notified timely of their hiring status with the FAA. Mission critical positions are filled with quality candidates who may otherwise be selected by private industry.
Partners
The Human Resource Offices and Lines of Business (LOB) work together to meet the hiring goal. Vacancy announcements are entered into the AVIATOR system by HR Specialists (HRS). After the announcement closes, the HRS reviews the applications, determines qualifications and issues referral lists to the LOB. The LOB interviews applicants on the referral lists and makes selection. The AVIATOR System tracks the number of business days from the closing date of the announcement to the date a tentative or firm offer is made.
External Factors Affecting Performance
There are several factors that can potentially influence hiring standard performance variability and impact results. Hiring fluctuation due to agency budget constraints, such as, a Continuing Resolution, etc., may significantly influence the hiring standard. Industry shifts and airline mergers may impact our ability to hire mission critical positions. The increased number of candidates applying for positions due to the economy may increase our workload and therefore may affect the processing time of applications. NextGen modernization of Air Traffic management overall is expected to impact hiring and define future needs. In addition, unexpected increased Congressional appropriation allowances would also affect performance.
Source of the Data
To compute hiring time, FAA uses data extracted from AVIATOR, which was developed by the agency to automate the application and hiring process. AHR staffing specialists across the country fill jobs through external sources using AVIATOR. The system tracks pertinent steps in the hiring process and can be used to record the time it takes to fill positions. This enables the office to locate delays in the process steps, as well as to examine how the FAA is doing.
Statistical Issues
None.
Completeness
AHR has implemented several practices to ensure the integrity of data in AVIATOR. For example, monthly teleconferences with regional staffing personnel have provided a forum for discussions around efficiencies in hiring processes, resulting in more standardization and streamlined practices. In addition, monthly and quarterly monitoring of the hiring standard ensures more proactive management of hiring processes.
Reliability
AVIATOR is a dynamic system, with hiring actions entered continually by field and headquarters staffing specialists. Because the system is constantly updated, monthly reports only reflect the data entered before the report’s cut-off date. The job offer data are finalized and stabilized for the year-end status report.

46
PORTFOLIO OF GOALS FY 2011 Methodology Report FAA Flight Plan Performance Measures
ORGANIZATIONAL EXCELLENCE Reduce Workplace Injuries
FY 2011 Performance Target “Reduce the total workplace injury and illness case rate to no more than 2.44 per 100 employees.” Flight Plan Objective and Performance Target Objective 1: Implement human resource management practices to attract and retain a highly
skilled, diverse workforce and provide employees a safe, positive work environment.
Performance Target:
Reduce the total workplace injury and illness case rate to no more than 2.44 per 100 employees by the end of FY 2011, and maintain through FY 2013.
1 FY 2010 actual result revised from projection of 1.69 per 100.
FY 2007 FY 2008 FY 2009 FY 2010 FY 2011
Target 2.76 per 100 2.68 per 100 2.60 per 100 2.52 per 100 2.44 per 100
Actual 2.43 per 100 2.10 per 100 1.66 per 100 1.64 per 1001
Definition of Measure
Unit of Measure: Rate of work-related injuries and illnesses per 100 employees.
Computation: The case rate is determined by dividing the total number of cases of work-related injuries and illnesses for the entire year by the total number of employees, and multiplying by 100. (The rate is expressed in cases per 100 employees). For the intermediate quarterly reporting, the targets are to have less than the following cumulative rates: 1st Quarter: 0.61 2nd Quarter: 1.22 3rd Quarter: 1.83
Formula: 100Employees ofNumber Total
Cases Total
Scope of Measure: This measure includes work-related injuries and illnesses to FAA employees only. It excludes off-duty, non-work-related incidents. It also excludes injuries or illnesses of aviation employees, passengers and the general public. Consistent with the Occupational Safety and Health Act (OSHA) initiatives, we will move toward using OSHA recordkeeping analysis, which is not identical to incidents reported under the Office of Workers’ Compensation Programs regulations.
Method of Setting Target:
The target was set consistent with the Safety, Health and Return to Employment (SHARE) Presidential Initiative. That initiative directed Federal agencies to reduce injury and illness case rates by 3 percent per year, relative to the 2003 baseline.
Why the FAA Chooses this Measure
The total case rate is a standard measure of safety program performance. We will continue to use the goal of reducing the total case rates by 3 percent per year, measured against the FY 2003 baseline. This measure shows progress in reducing workplace injuries and illnesses, which in turn leads to improved productivity and quality of life for the FAA workforce and lower costs for the FAA.
47
Public Benefit
Reducing injuries improves FAA workforce efficiency directly. Indirectly the public benefits since employee safety contributes to flying safety.
Partners
All FAA Lines of Business and Staff Offices partner with us for implementation of this initiative. Their roles include training employees to work safely, inspecting workplaces to identify hazards, correcting any hazards found, and conducting safety program evaluations with top management accountability. Labor and management partner together in the Occupational Safety, Health and Environmental Compliance Committees and in developing the AED program.
External Factors Affecting Performance
One external factor impacting performance was the emphasis on Automated External Defibrillators (ASD). We added this life saving tool, which drew from existing OSH resources while adding to the confidence of the workforce in the agency safety program.
Source of the Data
The data source for the number of cases is the Department of Labor (DOL) SHARE Initiative web site (currently http://www.osha.gov/dep/fap/fap-inj-ill-stats.html), or its successor in the Protecting Our Workers and Ensuring Reemployment (POWER) initiative. The web site summarizes injuries and illnesses reported by the various agencies. These data will be analyzed with a view toward determining OSHA recordability. Supplemental sources include the Workers’ Compensation Information System and the FAA Safety Management Information System (SMIS).
The data source for the number of employees is the Department of Transportation Workforce Demographics website (currently http://dothr.ost.dot.gov/workforceinfo/demographics.htm). The DOL website uses slightly different population counts. Those counts generally run slightly higher than the DOT counts. As a result, DOL generally reports slightly lower case rates than FAA. (FY 2008 was an exception, with the DOL population counts being lower. The case rate for FY-08 using the DOL population count was 2.14, still well below the not-to-exceed target.) The SHARE data reports are available quarterly, with an approximate two-month lag time. FAA will report the case rates quarterly, with the same approximate two-month lag time.
Statistical Issues
There may be delays in the submission of claims. Also, sometimes multiple claims may result from a single workplace incident such as, chemical vapors and odors. Because of this variability, FAA provides a 10 percent margin to declare the performance status as green for the intermediate reporting (Quarters 1-3), just as is used for aviation safety targets. Thus the effective intermediate targets are: 1st Quarter: 0.55 2nd Quarter: 1.10 3rd Quarter: 1.65 If there are major delays in filing claims with the Department of Labor, or if there are unforeseen incidents that injure large numbers of people, the performance measure could change suddenly. However, based on historical data, the magnitude of such changes would likely be small.
Completeness
Data quality is expected to be high, since the computation follows a well-established formula from the Department of Labor, and the primary data sources for each variable in the formula are federal departmental level databases.
Reliability
As noted in the Completeness section, data quality is expected to be high, since the computation follows a well-established formula from the Department of Labor, and the data sources for each variable in the formula are Federal Departmental level databases. The key source of possible inaccuracy in the data is the data entry for the injury and illness reports. FAA has consolidated Workers’ Compensation case management for Headquarters, Regions and both Centers, using employees with extensive specialized experience. One benefit of this consolidation should be increased data accuracy. In addition, some FAA safety professionals use the SMIS to cross-check mishap reports against Workers’ Compensation claims to improve data accuracy.
48
PORTFOLIO OF GOALS FY 2011 Methodology Report FAA Flight Plan Performance Measures
ORGANIZATIONAL EXCELLENCE Grievance Processing Time
FY 2011 Performance Target “Reduce average grievance processing time by 30 percent to 102 days from the 2006 baseline of 146 days.” Flight Plan Objective and Performance Target Objective 1: Implement human resource management practices to attract and retain a highly
skilled, diverse workforce and provide employees a safe, positive work environment.
Performance Target: Reduce grievance processing time by 30 percent (to an average of 102 days) by FY 2010 over the FY 2006 baseline of 146 days, and maintain the reduction through FY 2013.
FY 2007 FY 2008 FY 2009 FY 2010 FY 2011
Target - 10.00% - 15.00% - 25.00% - 30.00% - 30.00%
Actual - 61.64% - 63.69% - 73.97% - 57.00%
Definition of Measure
Unit of Measure: The average number of days to process a grievance.
Computation: Grievance processing time will be monitored and measured against the baseline (146 days) in FY 2007 through FY 2013. Incremental targets have been set for every fiscal year. Progress toward the overall 30 percent reduction in processing time is cumulative and should be evident in each of the 4 out years.
Formula: 100Baseline
BaselineTime Processing erageCurrent Av
Scope of Measure: All union grievances nationwide filed or in process during the fiscal year in question, except those grievances filed under the NATCA CPC contract with an incident date starting from September 3, 2006 onward that are procedurally-deficient because they were not filed under the correct contract and/or are pre-empted by the filing of unfair labor practices charges.
Method of Setting Target:
Estimated a significant reduction in processing time from baseline statistics.
Why the FAA Chooses this Measure
To ensure a consistent and corporate labor management program, the FAA focuses on providing effective and efficient processes to train managers and supervisors, and handle grievances, negotiations, and contract administration.
Public Benefit
Reducing grievance processing time not only is conducive to better labor-management relations, it also enables faster correction of non-compliance with FAA’s collective bargaining agreements, thus contributing to agency efficiency.
Partners
The Office of Employee and Labor Relations (AHL) and the regional HR Management Organizations.
49
External Factors Affecting Performance
Unions frustrated in collective bargaining sometimes retaliate by flooding the grievance channel with vexatious filings over trivial or redundant matters.
Source of the Data
Labor Employee Relations Information System (LERIS) is a web-based software application for tracking and processing grievances. The data are entered and updated by authorized users in regions, centers and headquarters. Personnel in the National Labor Relations Policy and Programs Division, AHL-400, manage the system.
Statistical Issues
LERIS is pre-programmed to calculate the number of days in process for each step in the grievance record. These data can then be sorted, totaled, and averaged for further analysis.
Completeness
Grievances are identified and tracked by way of a unique identifying number that is assigned by LERIS only after critical information is entered into the system. Similarly, to close a record requires the entry of a decision date. The National Policy and Program Support Division in the Office of Employee and Labor Relations (AHL-400) produces monthly reports for AHR management to use to verify completeness, accuracy, consistency, and timeliness of LERIS data.
Reliability
The LERIS database has built-in control elements that must be populated before a record can be accepted in the database. Completed records are not deleted. Both current records and completed records can be measured.
50
PORTFOLIO OF GOALS FY 2011 Methodology Report FAA Flight Plan Performance Measures
ORGANIZATIONAL EXCELLENCE Air Traffic Controller Workforce Plan
FY 2011 Performance Target “Maintain air traffic control workforce at, within two percent above or below the projected annual totals in the Air Traffic Controller Workforce Plan.”
Flight Plan Objective and Performance Target Objective 1: Implement human resource management practices to attract and retain a highly
skilled, diverse workforce and provide employees a safe, positive work environment.
Performance Target:
Maintain the air traffic control workforce at, within two percent above or below, the projected annual totals in the Air Traffic Controller Workforce Plan.
1 Target revised beginning in FY 2010.
FY 2007 FY 2008 FY 2009 FY 20101 FY 2011
Target 0% to 2%
over annual target
0% to 2% over annual
target
0% to 2% over annual
target
+/- 2% of annual target
+/- 2% of annual target
Actual 0.45%
over annual target
1.66% over annual
target
1.19% over annual
target
0.03% above annual target
Definition of Measure
Unit of Measure: Percentage variance of actual workforce level to Workforce Plan target published in the current ATC Workforce Plan at:
http://www.faa.gov/air_traffic/publications/controller_staffing/
Computation: The controller workforce level adherence to plan is calculated as the variance of actual controller workforce to target, expressed as a percentage. A two percent variance above or below the plan is acceptable.
Formula: 100Target Plan Workforce
Target Plan Workforce - Level Workforce Year ATC of End Actual
Scope: Air Traffic Controller workforce level for fiscal year.
Method of Setting Target:
The target is based on the annually updated Controller Workforce Plan. This update reflects changes in traffic forecasts, retirements and other factors. When this measure was established, the target was to meet or exceed the Workforce Plan goal by no more than two percent. While traffic has declined significantly since this performance measure was established, the FAA has exceeded its staffing target in each year. For FY 2010 this target was revised to allow hiring to be dialed back to a level below the Workforce Plan target.
Why the FAA Chooses this Measure
The FAA’s goal for maintaining the air traffic controller workforce was established after publication of the December 2004 report, A Plan for the Future: The Federal Aviation Administration’s 10-year Strategy for the Air Traffic Control Workforce, and subsequent annual updates. This report outlines the agency’s plan to hire, staff and train controllers to ensure an adequate air traffic control workforce to meet future requirements.

51
Public Benefit
This measure is used as a tool to help manage the dynamic staffing needs of the National Airspace System (NAS). This gives the FAA the ability to effectively handle system-wide air traffic demand and provide seamless service to the flying public.
Partners
Partners include Air Traffic – Collegiate Training Initiative (CTI) schools, University Aviation Association (nonprofit) and other minority recruitment partners.
External Factors Affecting Performance
The primary external factor affecting performance is the economy. The recent downturn has impacted the volume of air traffic as well as the number of retirements.
Source of the Data
Data on the total number of air traffic controllers are collected by the Financial Metrics Team within the Office of Finance for the Air Traffic Organization. The staffing targets are generated by the Financial Analysis and Process Re-engineering group within the Office of Finance for the Air Traffic Organization. The source of the ATO staffing data is the Office of Human Resources (AHR) Management Programs and Policies Office - Information Systems Division (AHP-100). The data are obtained from the AHR Federal Personnel and Payroll System Datamart.
Statistical Issues
None.
Completeness
The staffing data are collected and compiled monthly. Completeness is guaranteed by obtaining the data from the same source each month and validation of the reports generated from the AHR data.
Reliability
The reliability of these reports is ensured by 1) obtaining the staffing data from the same source each month; 2) the availability of resources in the Financial Metrics Team to produce reports when the data are available; and 3) a review of the staffing data to assure that all controllers are coded correctly and are included in the controller staffing level. Data fields requiring corrections are directed to the appropriate ATO Vice President for action.
52
PORTFOLIO OF GOALS FY 2011 Methodology Report FAA Flight Plan Performance Measures
ORGANIZATIONAL EXCELLENCE Aviation Safety Critical Positions Workforce Plan
FY 2011 Performance Target “Maintain the aviation safety workforce within one percent of the projected annual totals in the Aviation Safety Workforce Plan.”
Flight Plan Objective and Performance Target Objective 1: Implement human resource management practices to attract and retain a highly
skilled, diverse workforce and provide employees a safe, positive work environment.
Performance Target:
Maintain the aviation safety workforce within one percent of the projected annual totals in the Aviation Safety Workforce Plan.
1This measure was added in FY 2009. No prior year data are available.
FY 2007 FY 2008 FY 20091 FY 2010 FY 2011
Target N/A N/A +/- 1% of annual target
+/- 1% of annual target
+/- 1% of annual target
Actual N/A N/A 0.15% over annual target
0.95% over annual target N/A
Definition of Measure
Unit of Measure: Percentage variance of actual workforce level to workforce plan targets
Computation: The workforce level adherence to plan is calculated as the variance of the AVS workforce to their individual targets, expressed as a percentage.
Formula: 100Target Plan Workforce AVS
Target Plan Workforce AVS- Plan Workforce AVSActual
Scope: Aviation Safety workforce levels for fiscal year.
Method of Setting Target:
A percentage above or below the target, meets the target. The +/- 1% target was chosen to reflect our commitment to be a close as possible to that allocation. A zero percent to three percent variance on a monthly basis is acceptable but may not be above or below 1% at the end of the fiscal year. The ultimate goal is to meet the allocation that is appropriated by Congress.
Why the FAA Chooses this Measure
The FAA’s goal for maintaining the aviation safety workforce was established to ensure an adequate workforce to meet future requirements.
Public Benefit
By ensuring that we are hiring, training, and retaining a highly qualified, high-performing workforce, we are able to maintain and provide the safest aviation system in the world to the flying public.
Partners
Office of Human Resources (AHR), Management Programs and Policies Office, Information Systems Division (AHP-100)
53
External Factors Affecting Performance
Congressional requirements may affect meeting this target. The enactment of a budget in FY 2011 is necessary to establish end-of-year staffing targets or AVS will continue to maintain staffing around the FY 2010 enacted level.
Source of the Data
Data on the total number of aviation safety personnel is collected by the Finance and Budget Division within the Quality, Integration and Executive Service (AQS) for the Aviation Safety Organization. The aviation safety staffing targets are also generated by the Finance and Budget Division within the Quality, Integration and Executive Service (AQS). The source of the staffing data is the Office of Human Resources (AHR) Management Programs and Policies Office, Information Systems Division (AHP-100). The data are obtained from the Federal Personnel and Payroll System Datamart.
Statistical Issues
Calculations are based on bi-weekly data which can create fluctuations in months that contain three ending pay periods. Therefore, some months may have three ending pay periods while most months have two.
Completeness
The staffing data are collected and compiled monthly. Completeness is guaranteed by obtaining the data from the same source each month and validation of the reports generated from the Federal Personnel and Payroll System, Datamart.
Reliability
The reliability of these reports is ensured by 1) obtaining the staffing data from the same source each month; 2) the availability of resources in the Budget and Finance Division to produce reports when the data are available; and 3) a review of the staffing data to assure that all AVS personnel are coded correctly and are included in the staffing levels. Data fields requiring corrections are directed to the appropriate senior executive for action.
54
PORTFOLIO OF GOALS FY 2011 Methodology Report FAA Flight Plan Performance Measures
ORGANIZATIONAL EXCELLENCE Cost Control FY 2011 Performance Target “One activity per approved organization and achievement of 90% of targeted savings.”
Flight Plan Objective and Performance Target Objective 3: Improve financial management while delivering quality customer service.
Performance Target: Organizations throughout the agency will continue to implement cost efficiency initiatives such as: $20 million in savings for strategic sourcing for selected products and services; Reduction of $30 million in Information Technology operating costs in FY 2011
1For FY 2008 the target was revised to include the achievement of the four specific cost control targets listed in the Flight Plan. 2For FY 2009 the target was revised from achieving Flight Plan cost control targets only to the achievement of 90% agreed on targets.
FY 2007 FY 20081 FY 20092 FY 2010 FY 2011
Target 1 Activity per Organization
1 Activity per Approved Org. & Achievement
of Targeted Svgs.
1 Activity per Approved Org. & Achievement
of 90% of Targeted Svgs.
1 Activity per Approved Org. & Achievement
of 90% of Targeted Svgs.
1 Activity per Approved Org. & Achievement
of 90% of Targeted Svgs.
Actual 1 Activity per Organization
1 Activity and Savings
1 Activity and 123.38%
1 Activity and 151.51%
Definition of Measure
Unit of Measure:
Achievement of 90% of targeted savings. Savings target for FY 2011 was set September 30, 2010.
Computation: Actual savings are divided into the annual target and the result is multiplied by 100 to convert it to a percentage. For example, the FY 2011 target is 90% of $87.32M, or $78.59M.
Formula: 100SavingsYear Fiscal Targeted Total
SavingsYear Fiscal Targeted Total
Scope of Measure: Reduction or avoidance of costs associated with agreed upon actions (activities) that save money, avoid incurring additional costs or streamline a process. Examples include reduced staffing levels, reduced travel, reduction of contract support, contracts for acquisition of goods and services, and consolidation of similar activities that may have been performed at more than one location within the agency.
Method of Setting Target:
This target was chosen because of the maturity of the program and the ability of organizations to accurately project cost savings. Over the past few years this measure has progressed from an activity based measure to a savings based measure.
Why the FAA Chooses this Measure
FAA’s operating costs have increased significantly over the past decade and oversight authorities such as the Office of Inspector General and the Government Accountability Office have raised concerns regarding FAA’s
55
escalating costs. In addition, in some fiscal years the agency must fund tens of millions of dollars of unfunded pay raises and must often absorb millions more in unspecified budget cuts. To address these concerns, the agency is taking aggressive steps to stem the growth of operating costs. Cost Control is a centrally developed and managed initiative under the executive direction of FAA’s Chief Financial Officer. It provides the necessary impetus for implementing sustained and successful cost control activities. Organizations’ participation and progress is reported to the Administrator and the Executive Management Team at monthly Flight Plan meetings.
Public Benefit
The public benefit to this measure is that funds received by the FAA are being used in a more efficient and cost effective manner.
Partners
ABA partners with all FAA LOBs and SOs to create a team dedicated to savings throughout the agency.
External Factors Affecting Performance
External factors affecting performance of this measure are related to the ability of each LOB/SO to meet their individual targeted savings. Some of the factors that affect the LOBs/SOs are funding, need and timing.
Source of the Data
Lines of Business and Staff Offices utilize a financial template designed by the Office of Financial Services (ABA) to propose general or information technology-related cost saving and/or cost avoidance activities. Once submitted, the templates are reviewed by ABA analysts who validate the proposals and associated financial computations. Cost control activities are then tracked and reported on a monthly basis through an Excel spreadsheet maintained by ABA. Organizations provide monthly status updates on progress toward their annual goals.
Statistical Issues
None.
Completeness
Each completed template and monthly status spreadsheet is retained on an ABA shared drive.
Reliability
ABA verifies organizations’ activities, milestones, and dollars saved/avoided using a template completed by the organizations. In addition to ABA’s monthly financial tracking, individual organizations are responsible for maintaining files and spreadsheets containing supporting calculations and documentation on their activities to ensure verification by audit.
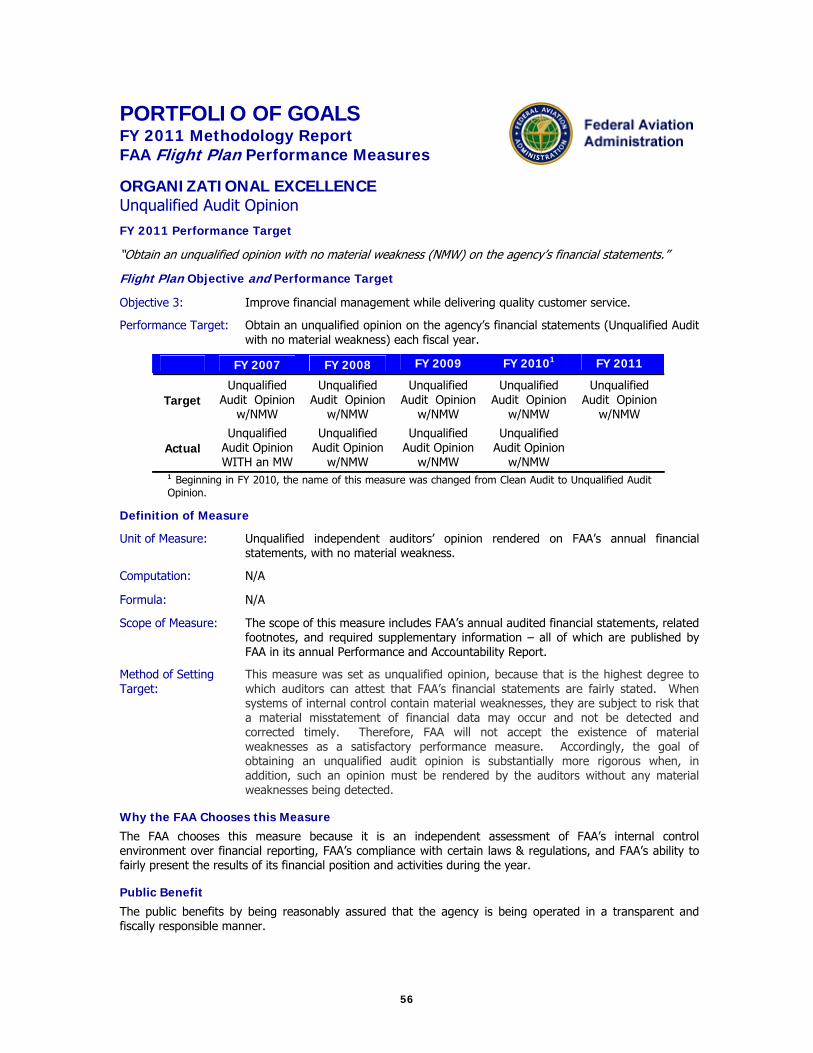
56
PORTFOLIO OF GOALS FY 2011 Methodology Report FAA Flight Plan Performance Measures
ORGANIZATIONAL EXCELLENCE Unqualified Audit Opinion
FY 2011 Performance Target “Obtain an unqualified opinion with no material weakness (NMW) on the agency’s financial statements.”
Flight Plan Objective and Performance Target Objective 3: Improve financial management while delivering quality customer service.
Performance Target:
Obtain an unqualified opinion on the agency’s financial statements (Unqualified Audit with no material weakness) each fiscal year.
1 Beginning in FY 2010, the name of this measure was changed from Clean Audit to Unqualified Audit Opinion.
FY 2007 FY 2008 FY 2009 FY 20101 FY 2011
Target Unqualified
Audit Opinion w/NMW
Unqualified Audit Opinion
w/NMW
Unqualified Audit Opinion
w/NMW
Unqualified Audit Opinion
w/NMW
Unqualified Audit Opinion
w/NMW
Actual Unqualified
Audit Opinion WITH an MW
Unqualified Audit Opinion
w/NMW
Unqualified Audit Opinion
w/NMW
Unqualified Audit Opinion
w/NMW
Definition of Measure
Unit of Measure:
Unqualified independent auditors’ opinion rendered on FAA’s annual financial statements, with no material weakness.
Computation: N/A
Formula: N/A
Scope of Measure: The scope of this measure includes FAA’s annual audited financial statements, related footnotes, and required supplementary information – all of which are published by FAA in its annual Performance and Accountability Report.
Method of Setting Target:
This measure was set as unqualified opinion, because that is the highest degree to which auditors can attest that FAA’s financial statements are fairly stated. When systems of internal control contain material weaknesses, they are subject to risk that a material misstatement of financial data may occur and not be detected and corrected timely. Therefore, FAA will not accept the existence of material weaknesses as a satisfactory performance measure. Accordingly, the goal of obtaining an unqualified audit opinion is substantially more rigorous when, in addition, such an opinion must be rendered by the auditors without any material weaknesses being detected.
Why the FAA Chooses this Measure
The FAA chooses this measure because it is an independent assessment of FAA’s internal control environment over financial reporting, FAA’s compliance with certain laws & regulations, and FAA’s ability to fairly present the results of its financial position and activities during the year.
Public Benefit
The public benefits by being reasonably assured that the agency is being operated in a transparent and fiscally responsible manner.

57
Partners
All FAA organizations are responsible for following accounting policy properly, and for entering accurate source data into the accounting system,. These are essential ingredients to achieving an unqualified audit with no material weaknesses.
External Factors Affecting Performance
External factors that can affect FAA’s results include the fact that certain financial data, such as excise tax revenue of the Airport and Airway Trust Fund (AATF) are collected and attributed to the AATF by the Department of Treasury (Treasury). While FAA analyzes this data to ensure reasonableness, FAA must rely, to some degree, upon various Treasury bureaus for the accuracy of these amounts which are reported in FAA’s financial statements.
Source of the Data
The data used to evaluate FAA’s measure against this target comes from the independent auditors’ report, issued at the conclusion of their audit of FAA’s annual financial statements. The auditors’ report is published annually in FAA’s Performance and Accountability Report.
Statistical Issues
None.
Completeness
N/A
Reliability
N/A
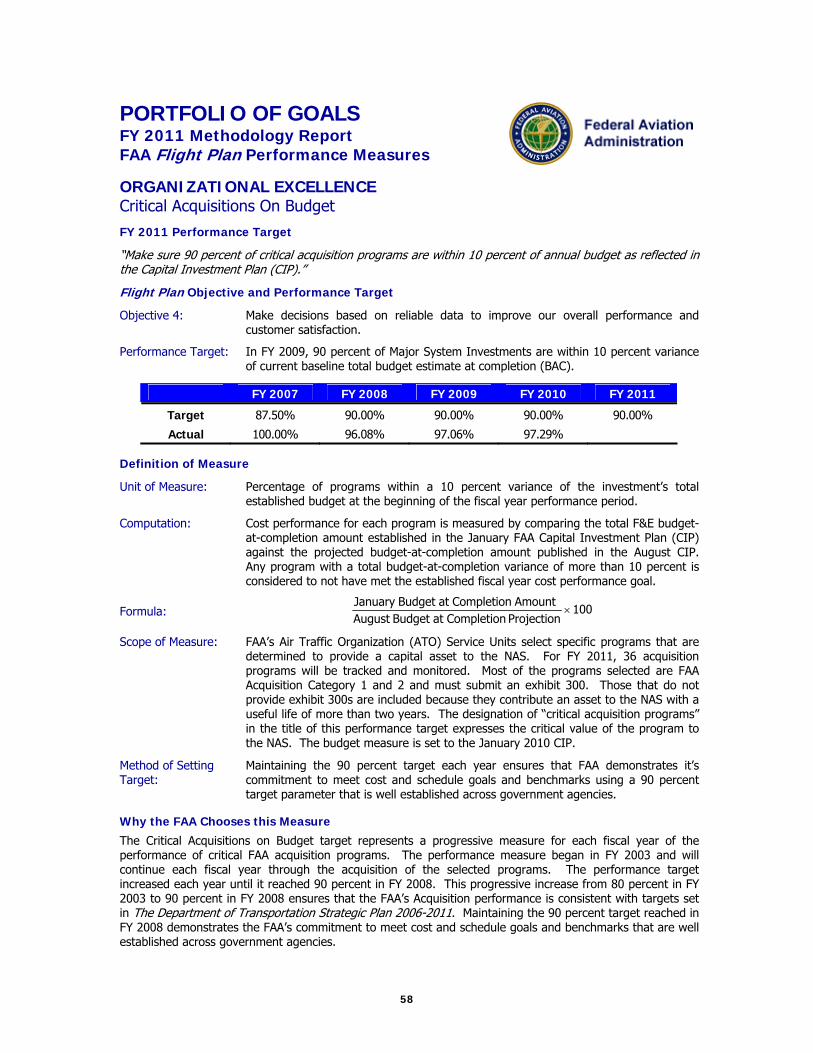
58
PORTFOLIO OF GOALS FY 2011 Methodology Report FAA Flight Plan Performance Measures
ORGANIZATIONAL EXCELLENCE Critical Acquisitions On Budget FY 2011 Performance Target “Make sure 90 percent of critical acquisition programs are within 10 percent of annual budget as reflected in the Capital Investment Plan (CIP).” Flight Plan Objective and Performance Target Objective 4:
Make decisions based on reliable data to improve our overall performance and customer satisfaction.
Performance Target:
In FY 2009, 90 percent of Major System Investments are within 10 percent variance of current baseline total budget estimate at completion (BAC).
FY 2007 FY 2008 FY 2009 FY 2010 FY 2011
Target 87.50% 90.00% 90.00% 90.00% 90.00%
Actual 100.00% 96.08% 97.06% 97.29%
Definition of Measure
Unit of Measure:
Percentage of programs within a 10 percent variance of the investment’s total established budget at the beginning of the fiscal year performance period.
Computation: Cost performance for each program is measured by comparing the total F&E budget-at-completion amount established in the January FAA Capital Investment Plan (CIP) against the projected budget-at-completion amount published in the August CIP. Any program with a total budget-at-completion variance of more than 10 percent is considered to not have met the established fiscal year cost performance goal.
Formula: 100Projection Completionat Budget August Amount Completionat Budget January
Scope of Measure: FAA’s Air Traffic Organization (ATO) Service Units select specific programs that are determined to provide a capital asset to the NAS. For FY 2011, 36 acquisition programs will be tracked and monitored. Most of the programs selected are FAA Acquisition Category 1 and 2 and must submit an exhibit 300. Those that do not provide exhibit 300s are included because they contribute an asset to the NAS with a useful life of more than two years. The designation of “critical acquisition programs” in the title of this performance target expresses the critical value of the program to the NAS. The budget measure is set to the January 2010 CIP.
Method of Setting Target:
Maintaining the 90 percent target each year ensures that FAA demonstrates it’s commitment to meet cost and schedule goals and benchmarks using a 90 percent target parameter that is well established across government agencies.
Why the FAA Chooses this Measure
The Critical Acquisitions on Budget target represents a progressive measure for each fiscal year of the performance of critical FAA acquisition programs. The performance measure began in FY 2003 and will continue each fiscal year through the acquisition of the selected programs. The performance target increased each year until it reached 90 percent in FY 2008. This progressive increase from 80 percent in FY 2003 to 90 percent in FY 2008 ensures that the FAA’s Acquisition performance is consistent with targets set in The Department of Transportation Strategic Plan 2006-2011. Maintaining the 90 percent target reached in FY 2008 demonstrates the FAA’s commitment to meet cost and schedule goals and benchmarks that are well established across government agencies.
59
Public Benefit
FAA’s ability to keep acquisitions within budget and schedule will allow for a timely transition of NextGen programs The transition to NextGen involves acquiring numerous systems to support precision satellite navigation, digital networked communications, integrated weather information, and layered adaptive security.
Partners
ATO Service Units
External Factors Affecting Performance
None.
Source of the Data
ATO tracks and reports status of all schedule and cost performance targets using an automated database. ATO Service Units provide a monthly Red, Yellow, or Green assessment that indicates their confidence level in meeting their established milestones. Comments are provided monthly that detail problems, issues, and corrective actions, ensure milestones and cost are maintained within the established performance target. The performance status is reported monthly to the FAA Administrator through FAA Flight Plan meetings.
Statistical Issues
The programs that are selected each fiscal year represent a cross section of programs within the ATO. They include programs that have an Exhibit 300 as well as programs referred to as “variable quantity” programs. The latter are typically not required to undergo a standard acquisition life cycle process. The amount of equipment/systems procured or replaced with these programs is determined by the amount of funding available each fiscal year.
Completeness
This measure is current with no missing data. Each DOT organization maintains its own quality control checks for cost, schedule, and technical performance data of each major systems acquisition in accordance with OMB Circulars A-11, A-109, and A-130, Federal Acquisition Regulations, and Departmental orders implementing those directives and regulations.
Reliability
Each DOT organization having major system acquisitions uses the data during periodic acquisition program reviews, for determining resource requests. They are also used during the annual budget preparation process, for reporting progress made in the President’s budget and for making key program management decisions. The monthly status is reported through the SPIRE database and included in monthly high-level management reviews. Once the program is selected and approved for tracking purposes it is reported on with detailed commentary each month, and assigned a Red, Yellow, or Green Confidence indicator that the cost is within the 10 percent threshold. These detailed reports are reviewed at all levels of the appropriate Service Unit, Executive levels within the ATO, and the FAA Administrator.
60
PORTFOLIO OF GOALS FY 2011 Methodology Report FAA Flight Plan Performance Measures
ORGANIZATIONAL EXCELLENCE Critical Acquisitions on Schedule FY 2011 Performance Target
“Make sure 90 percent of critical acquisition programs are on schedule. “ Flight Plan Objective and Performance Target Objective 4:
Make decisions based on reliable data to improve our overall performance and customer satisfaction.
Performance Target:
In FY 2009, 90 percent of Major System Investments selected annual milestones are achieved.
FY 2007 FY 2008 FY 2009 FY 2010 FY 2011
Target 87.50% 90.00% 90.00% 90.00% 90.00%
Actual 97.00% 93.88% 93.75% 90.74%
Definition of Measure
Unit of Measure: Percentage of programs meeting 90 percent of milestones.
Computation: Schedule performance is measured by dividing the total number of milestones for the current fiscal year that actually met their scheduled dates by the total number of milestones planned for the current fiscal year. The total number of milestones that can be missed and remain within the 90.0 percent performance measure will vary each fiscal year.
Formula: 100 Tracked Milestones ofNumber Total
Met Milestones ofNumber Total
Scope of Measure: FAA’s Air Traffic Organization (ATO) Service Units select specific milestones and completion dates against programs that are determined to provide a capital asset to the NAS. For FY 2011, 54 selected critical milestones will be tracked against 36 acquisition programs. Forty-nine milestones must meet their targeted date to be within 90 percent of the performance goal. Most of the programs selected are FAA Acquisition Category 1 and 2 and must submit an Exhibit 300. Those that do not provide Exhibit 300’s are included because they provide an asset to the NAS with a useful life of more than two years. The designation of “critical acquisition programs” in the title of the performance target expresses the critical value of the program to the NAS. The schedule measure is set to only those milestones selected at the beginning of the current fiscal year. Once the selected milestones are approved, no milestones are added or deleted during the year. In FY 2009, the FAA National Airspace System Capital Investment Plan began assessing program performance against the total program acquisition baseline. These reports document the agency’s performance in compliance with the Federal Aviation Reauthorization Act of 1996, PL 104-264, Section 252 - Air Traffic Control Modernization Reviews.
Method of Setting Target:
Maintaining the 90 percent target each year ensures that FAA demonstrates it's commitment to meet cost and schedule goals and benchmarks using a 90 percent target parameter that is well established across government agencies.
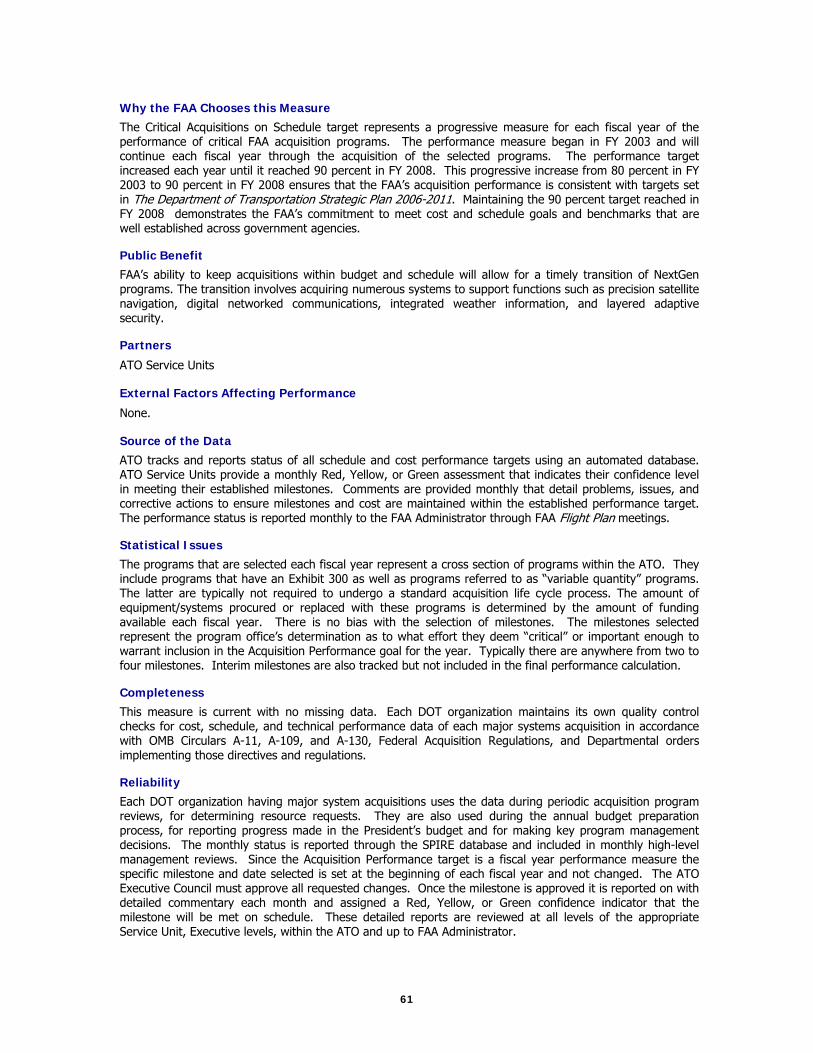
61
Why the FAA Chooses this Measure
The Critical Acquisitions on Schedule target represents a progressive measure for each fiscal year of the performance of critical FAA acquisition programs. The performance measure began in FY 2003 and will continue each fiscal year through the acquisition of the selected programs. The performance target increased each year until it reached 90 percent in FY 2008. This progressive increase from 80 percent in FY 2003 to 90 percent in FY 2008 ensures that the FAA’s acquisition performance is consistent with targets set in The Department of Transportation Strategic Plan 2006-2011. Maintaining the 90 percent target reached in FY 2008 demonstrates the FAA’s commitment to meet cost and schedule goals and benchmarks that are well established across government agencies.
Public Benefit
FAA’s ability to keep acquisitions within budget and schedule will allow for a timely transition of NextGen programs. The transition involves acquiring numerous systems to support functions such as precision satellite navigation, digital networked communications, integrated weather information, and layered adaptive security.
Partners
ATO Service Units
External Factors Affecting Performance
None.
Source of the Data
ATO tracks and reports status of all schedule and cost performance targets using an automated database. ATO Service Units provide a monthly Red, Yellow, or Green assessment that indicates their confidence level in meeting their established milestones. Comments are provided monthly that detail problems, issues, and corrective actions to ensure milestones and cost are maintained within the established performance target. The performance status is reported monthly to the FAA Administrator through FAA Flight Plan meetings.
Statistical Issues
The programs that are selected each fiscal year represent a cross section of programs within the ATO. They include programs that have an Exhibit 300 as well as programs referred to as “variable quantity” programs. The latter are typically not required to undergo a standard acquisition life cycle process. The amount of equipment/systems procured or replaced with these programs is determined by the amount of funding available each fiscal year. There is no bias with the selection of milestones. The milestones selected represent the program office’s determination as to what effort they deem “critical” or important enough to warrant inclusion in the Acquisition Performance goal for the year. Typically there are anywhere from two to four milestones. Interim milestones are also tracked but not included in the final performance calculation.
Completeness
This measure is current with no missing data. Each DOT organization maintains its own quality control checks for cost, schedule, and technical performance data of each major systems acquisition in accordance with OMB Circulars A-11, A-109, and A-130, Federal Acquisition Regulations, and Departmental orders implementing those directives and regulations.
Reliability
Each DOT organization having major system acquisitions uses the data during periodic acquisition program reviews, for determining resource requests. They are also used during the annual budget preparation process, for reporting progress made in the President’s budget and for making key program management decisions. The monthly status is reported through the SPIRE database and included in monthly high-level management reviews. Since the Acquisition Performance target is a fiscal year performance measure the specific milestone and date selected is set at the beginning of each fiscal year and not changed. The ATO Executive Council must approve all requested changes. Once the milestone is approved it is reported on with detailed commentary each month and assigned a Red, Yellow, or Green confidence indicator that the milestone will be met on schedule. These detailed reports are reviewed at all levels of the appropriate Service Unit, Executive levels, within the ATO and up to FAA Administrator.
62
PORTFOLIO OF GOALS FY 2011 Methodology Report FAA Flight Plan Performance Measures
ORGANIZATIONAL EXCELLENCE Information Security
FY 2011 Performance Target “Zero cyber-security events that significantly degrade FAA mission critical Line of Business systems.” Flight Plan Objective and Performance Target Objective 4: Make decisions based on reliable data to improve our overall performance and
customer satisfaction.
Performance Target: Achieve zero cyber security events that disable or significantly degrade FAA mission critical Line of Business systems.
1 The description of the target was revised for FY 2011 from events that degrade “FAA services”. The scope of the measure remains essentially unchanged, although it is now more specifically described.
FY 2007 FY 2008 FY 2009 FY 2010 FY 2011
Target 1 0 0 0 0 0
Actual 0 0 0 0
Definition of Measure
Unit of Measure:
Number of successful cyber attacks as determined by DOT/FAA’s Cyber Security Management Center (CSMC) in collaboration with FAA’s internal partners.
Computation: The sum of the number of successful cyber-attacks in the current fiscal year is calculated.
Formula: Count of successful cyber-attacks.
Scope of Measure: The measure is applicable to the DOT/FAA Information Technology assets, defined by TCP/IP systems, which contribute to the delivery of FAA mission critical Line of Business systems.
The FAA’s information security infrastructure protects the agency’s IT assets in accordance with numerous executive and legal requirements, including the Computer Security Act, Executive Order 13231, and the Federal Information Security Management Act (FISMA), as well as in accordance with DOT and FAA policy.
Method of Setting Target:
The target was selected based upon the maturity level of the Information Systems Security Program and the expertise of the Cyber Security Management Center.
Why the FAA Chooses this Measure
Hackers seek to disrupt or exploit critical infrastructure across the United States. One critical infrastructure, as identified by the President in Homeland Security Presidential Directive/ HSPD-7, is our transportation system, including aviation. Accordingly, the FAA, whose mission is to ensure the safe and efficient movement of aircraft, must be protected against the threat of cyber-attacks. The Office of Information Services (AIO) has the agency lead for ensuring that these attacks do not significantly degrade FAA mission critical Line of Business systems.
Public Benefit
The benefit to the public is a safe and secure National Airspace System with no disruption of service due to cyber events.
63
Partners
The external partners who work with the agency to achieve this goal are common off the shelf (COTS) software and hardware vendors, including Oracle, Microsoft, IBM, CISCO. These suppliers with their development and support staff keep our operating systems software used in the agency up to date and secure. In addition, our internal Line of Business partners administer and maintain the specific IT systems that are deemed to be critical. The CSMC will monitor these IT systems and will report to the internal partners that they have been attacked. Both the CSMC and internal partners will work together to determine the extent of any disruption to critical systems.
External Factors Affecting Performance
Hackers seeking to disrupt, or exploit software or infrastructure flaws.
Source of the Data
The data on cyber-security attacks are collected by the DOT/FAA Cyber Security Management Center (CSMC), which is part of AIO.
Statistical Issues
None.
Completeness
The DOT/FAA CSMC works collaboratively to validate cyber incidents on FAA and departmental systems. This process provides the most accurate and up-to-date measure. The FAA and DOT use current and historical data to validate trends, which indicate an increase in the number and complexity of cyber-attacks.
AIO has sensors on DOT and FAA networks. AIO is the primary focal point of incident reporting to the DOT and USCERT.
Reliability
The DOT/FAA CSMC collaborates with other ISS components in the federal government. The CSMC has the responsibility, as outlined in FAA Order 1370.82A, as the focal point for all cyber incidents in the FAA.
64
PORTFOLIO OF GOALS FY 2011 Methodology Report FAA Flight Plan Performance Measures
ORGANIZATIONAL EXCELLENCE Continuity of Operations
FY 2011 Performance Target “Exceed Federal Emergency Management Agency (FEMA) continuity readiness levels by 5 percent.” Flight Plan Objective and Performance Target Objective 5: Enhance our ability to respond to crises rapidly and effectively, including security-
related threats and natural disasters.
Performance Target:
Exceed Federal Emergency Management Agency continuity readiness levels by 5 percent.
1 New measure in FY 2009. No data are available for prior years.
FY 2007 FY 2008 FY 20091 FY 2010 FY 2011
Target N/A N/A 5% ahead of requirements
5% ahead of requirements
5% ahead of requirements
Actual N/A N/A 8.33% ahead of requirements
84% ahead of requirements
Definition of Measure
Unit of Measure: This measure tracks FEMA continuity readiness levels as measured by activation response time. The unit of measure is the number of hours within which the FAA is fully operational at the continuity facility after notification of a FEMA readiness level change. If required, this measure will also include the number of hours within which, after achieving a readiness level change, the FAA must attain the next higher readiness level.
Computation: The amount of time in which the FAA achieves readiness levels ahead of FEMA requirements is expressed as the percentage difference between the actual time and the requirements. The number of hours within which the FAA becomes fully operational, based on a readiness level in response to an event, is subtracted from the FEMA target, and the difference is then divided by the target. The result is then multiplied by 100 to convert it to a percentage.
Formula: 100TargetFEMA
ReadinessFAA Achieveto Time Actual-Target FEMA
Scope of Measure: This measure tracks responses to changes in continuity readiness levels in the National Capital Region, only, as ordered by FEMA. To maintain proficiency, it also includes training and drills.
Method of Setting Target:
The target was based on a desire/need to identify a metric that was clear and easy to understand. Historically, FAA has attained its required readiness level. As the Continuity program has matured so has the FAA efficiency resulting in an ability to exceed the requirement.
Why the FAA Chooses this Measure
Achieving readiness levels earlier than FEMA requires demonstrates to other federal agencies and the public that the FAA stands ready to respond in a timely fashion to any issue or event. Use of this measure provides a clear measurable objective for the FAA.
Readiness levels are established and designed to place departments and agencies in a readiness posture that will ensure minimal disruptions, if any, in functions that are essential to its mission.
65
Public Benefit
The ability of FAA to achieve continuity of operations quickly in response to a variety of incidents and/or disasters ensures that the national airspace remains operational.
Partners
All FAA LOBs and SOs are partners in achieving FAA’s readiness level during any emergency. All LOBs and SOs participate in exercises and real events to develop and maintain their continuity readiness levels.
External Factors Affecting Performance
Funding may impact performance. As risk assessments are performed on the Continuity program, the program that allows for the attainment of this measure, if the necessary funding to mitigate or eliminate identified risks is not made available the program will reside outside of compliance with federal directives and will not be fully capable of mission performance.
Source of the Data
Readiness level attainment results are recorded in a timeline table that is maintained by the Office of Emergency Operations (AEO-200) at FAA Headquarters and at the continuity facility. The timetable records participation in attaining readiness levels by AEO-200, the Lines Of Business (LOBs), and other Staff Offices (SO). The timeline for receipt of information is based on the readiness level attainment requirement timeline as defined by AEO-200. Data reports are available daily or as required. Once readiness levels have been achieved a readiness level report is sent to the appropriate internal or external department, organization, or agency. The documentation (timeline table) for this measure is obtained from AEO-200. AEO-200 is responsible for maintaining and ensuring completeness of the records.
Statistical Issues
No obvious statistical issues are identified. Reporting is strictly based on physical presence, email, and/or telephonic reporting on the specific time of achievement of identified objectives. No known external factors impact measurement results.
Completeness
The collected data defines whether or not a readiness level has been achieved. AEO-200 establishes a specific timeline for achievement of objectives then polls/observes/records, via checklists and/or sign-in sheets, LOB and SO arrival times (if appropriate for readiness level) at the continuity facility and/or task completions times. If a required LOB or SO does not arrive at the facility and/or complete a required task, within the specified timeframe, a member from AEO-200, prior to expiration of allotted timeframe, contacts the appropriate LOB for a status update on progress or for corrective action. The achievement objective responses on the checklists are simple yes or no; the objective was either achieved or not achieved.
To fully document achievement or non-achievement of objectives, findings are recorded by name, organization of participant, and time of arrival or completion of tasks. Possible limitations to data collection and achievement results are directly tied to AEO-200, LOB’s, and SO’s. However, to ensure accuracy and to fairly depict achievement or non-achievement of objectives, if a participant organization fails to report to the facility and/or complete a required task and AEO-200 is unable to contact the participant organization to resolve the issue, that objective is not achieved and the agency does not attain the desired readiness level. Once readiness levels have been achieved a readiness level report is sent to the appropriate internal or external department, organization, or agency.
Reliability
Measures are reliable and random factors are removed through use of simplified response requirements. Objectives are clearly defined and responses to inquiry about achievement of objectives are simple yes or no answers. This approach eliminates subjectivity.