Embed Size (px)
Citation preview
VTT RESEA
RCH N
OTES 2344G
asification of shredder residue
ISBN 951–38–6800–1 (URL: http://www.vtt.fi/inf/pdf/)ISSN 1455–0865 (URL: http://www.vtt.fi/inf/pdf/)
ESPOO 2006 VTT RESEARCH NOTES 2344
VTT Tiedotteita – Research Notes
2324 Kivisaari, Sirkku & Saranummi, Niilo. Terveydenhuollon systeemiset innovaatiotvuorovaikutteisen kehittämisen kohteena. Case Pro Viisikko. 2006. 77 s. + liitt. 4 s.
2325 Häkkinen, Tarja, Rauhala, Kari & Huovila, Pekka. Rakennetun ympäristönkestävän kehityksen kriteerit ja indikaattorit. 2006. 89 s. + liitt. 29 s.
2327 Security-tutkimuksen roadmap. Mika Naumanen & Veikko Rouhiainen (toim.).2006. 69 s.
2329 Heimonen, Ismo & Hemmilä, Kari. Tuloilmaikkunan energiatehokkuus. 2006. 65 s.+ liitt. 41 s.
2330 Apilo, Tiina & Taskinen, Tapani. Innovaatioiden johtaminen. 2006. 112 s. + liitt. 10 s.
2331 Niskanen, Antti. Työkalu luotettavuuden mallipohjaiseen analysointiin. 2006. 58 s.
2332 Kutinlahti, Pirjo, Lähteenmäki-Smith, Kaisa & Konttinen, Jari. Vaikuttavaatutkimusta. Arviointikäytäntöjä julkisissa tutkimusorganisaatioissa: Helia jaSAMK. 2006. 131 s. + liitt. 6 s.
2333 Hyytinen, Kirsi & Konttinen, Jari. Vaikuttavaa tutkimusta. Arviointikäytäntöjäjulkisissa tutkimusorganisaatioissa: Puolustusvoimien Teknillinen TutkimuslaitosPVTT. 2006. 77 p. + app. 5 p.
2334 Lähteenmäki-Smith, Kaisa & Hyytinen, Kirsi. Vaikuttavaa tutkimusta.Arviointikäytäntöjä julkisissa tutkimusorganisaatioissa: Maa- ja elintarvike-talouden tutkimuskeskus MTT. 2006. 89 s. + liitt. 1 s.
2335 SHOPS – Smart Home Payment Services. Towards the liberalisation of Europe'sutilities industry. 2006. 35 p.
2336 Lähteenmäki-Smith, Kaisa, Hyytinen, Kirsi, Kutinlahti, Pirjo & Konttinen, Jari.Research with an impact. Evaluation practises in public research organisations.2006. 79 p.
2337 The Finnish Research Programme on Nuclear Waste Management (KYT) 2002–2005.Final Report. Kari Rasilainen (ed.). 2006. 246 p. + app. 45 p.
2338 Martikainen, Antti. Ilmastonmuutoksen vaikutus sähköverkkoliiketoimintaan.2006. 74 s. + liitt. 5 s.
2339 Takasuo, Eveliina. Modeling of Pressurizer Using APROS and TRACE ThermalHydraulic Codes. 2006. 99 p. + app. 4 p.
2340 Modelling of multiphase chemical reactors (ModCheR). Final report. Manninen,Mikko (ed.). 2006. 181 p.
2341 Kara, Mikko. Electricity and emission allowance markets from Finnish viewpoint.Stydy. 2006. 105 p.
2342 Häkkinen, Tarja & Wirtanen, Leif. Metlan Joensuun tutkimuskeskuksen ympäristö-ja elinkaarinäkökohtien arviointi. 2006. 29 s.
2343 Alanen, Jarmo, Haataja, Kari, Laurila, Otto, Peltola, Jukka & Aho, Isto. Diagnosticsof mobile work machines. 2006. 123 p.
2344 Nieminen, Matti, Suomalainen, Marjut & Mäkinen, Tuula. Gasification of shredderresidue. 2006. 46 p. + app. 2 p.
2345 Lahti, Maria, Kantola, Kristiina, Kinnunen, Timo, Kivinen, Tuomo, Koivisto, Juha-Pekka, Kortekangas, Atte, Ollikainen, Ville, Virtanen, Tytti, Koskela, Hanna,Noppari, Elina & Sirkkunen, Esa. "Kato, nyt sää oot telkkarissa." DigitaalinenLähiTV paikallisyhteisöjen viestinnässä. 2006. 160 s. + liitt. 57 s.
Matti Nieminen, Marjut Suomalainen &Tuula Mäkinen
Gasification of shredder residue
VTT VTT VTTPL 1000 PB 1000 P.O. Box 1000
02044 VTT 02044 VTT FI-02044 VTT, FinlandPuh. 020 722 4404 Tel. 020 722 4404 Phone internat. + 358 20 722 4404Faksi 020 722 4374 Fax 020 722 4374 Fax + 358 20 722 4374


VTT TIEDOTTEITA � RESEARCH NOTES 2344
Gasification of shredder residue
Matti Nieminen, Marjut Suomalainen & Tuula Mäkinen
ISBN 951�38�6800�1 (URL: http://www.vtt.fi/publications/index.jsp) ISSN 1455�0865 (URL: http://www.vtt.fi/publications/index.jsp) Copyright © VTT 2006
JULKAISIJA � UTGIVARE � PUBLISHER
VTT, Vuorimiehentie 3, PL 1000, 02044 VTT puh. vaihde 020 722 111, faksi 020 722 4374
VTT, Bergsmansvägen 3, PB 1000, 02044 VTT tel. växel 020 722 111, fax 020 722 4374
VTT Technical Research Centre of Finland, Vuorimiehentie 3, P.O.Box 1000, FI-02044 VTT, Finland phone internat. +358 20 722 111, fax +358 20 722 4374
VTT, Biologinkuja 5, PL 1000, 02044 VTT puh. vaihde 020 722 111, faksi 020 722 7048
VTT, Biologgränden 5, PB 1000, 02044 VTT tel. växel 020 722 111, fax 020 722 7048
VTT Technical Research Centre of Finland, Biologinkuja 5, P.O. Box 1000, FI-02044 VTT, Finland phone internat. +358 20 722 111, fax +358 20 722 7048
Technical editing Anni Kääriäinen
3
Nieminen, Matti, Suomalainen, Marjut & Mäkinen, Tuula. Gasification of shredder residue. Espoo 2006. VTT Tiedotteita � Research Notes 2344. 46 p. + app. 2 p.
Keywords residues, schredder residues, thermal conversion, fluidized bed gasification, energy production, plastics, metals recovery, emissions, hot gas cleaning, heavy metals
Abstract At present, disposal of shredder residue (SR) is most commonly based on landfilling in Europe. However, landfilling will not be favoured in the near future and alternative methods have to be sought. This is due to the tightening regulations related to the increased need to recover materials and energy, and to mandatory targets on reducing landfilling. SR contains a significant portion of inorganic material and metals, as well as plastic with a high energy content.
Air-blown fluidised-bed gasification is a potential technology for the efficient utilisation of SR for energy production and for the improvement of metal recovery. The fluidised-bed gasification process does not significantly oxidise metals, which enables efficient metal recovery. However, SR material is a challenging feedstock with a high ash content, a wide range of heavy metals and usually a relatively high chlorine content.
This project has focused on the assessment of the technical feasibility of air-blown fluidised-bed gasification for the thermal treatment of SR. The project�s tasks were research and development of fluidised-bed gasification, gas cleaning, and metal recovery from solid residues, culminating in the evaluation of the economics of the process.
The results of the project showed that air-blown fluidised-bed gasification is a very economic alternative when applied to the efficient thermal conversion of shredder residue. Efficient hot gas cleaning is capable of removing chlorine and heavy metals (excluding mercury) efficiently enough to meet the regulations regarding waste incineration. Mercury might need an additional cleaning stage after the gas combustion if the feedstock contains a significant concentration of mercury. Although the process concept seems very promising, some further development is still needed, especially to avoid deposit formation in the bottom of the gasifier. There might be a risk of deposits, especially when chlorine and calcium-rich SR is gasified. Most probably this can be avoided on a large scale by clever design of the air distributor.
Additional metal recovery from the bottom ash was shown to be a realistic alternative for increasing the degree of material recovery, as well as for reducing the disposal costs
4
of the ash. The feasibility of this additional metal recovery is most probably shredder dependent and this option has to be assessed case by case.
Assessment of the economic feasibility showed that gasification of SR seems economically very suitable, especially for those countries in which landfilling is not allowed or is expensive (�90...120/t). In addition, the feasibility always depends on local conditions and therefore no universal assessment can be done.
5
Preface
This publication summarises the results of the work carried out in the R&D project �Gasification of Shredder Residue� at VTT between April 2003 and April 2005.
The project was partly financed by the STREAMS research program of Tekes/Finland. Other financiers were APME/PlasticsEurope/Belgium, Autotuojat r.y./Finland, Boliden Mineral Ab/Sweden, Borealis Polymers Oy/Finland, Elsam A/S/Denmark, Energi E2 A/S/Denmark, Foster Wheeler Energia Oy/Finland, H.J. Hansen/Denmark, Jylhän Metalliromu Oy/Finland, Maxit/Optiroc Oy Ab/Finland and VTT/Finland.
Espoo, 4 May 2006
Authors
6
Contents
Abstract..............................................................................................................................3
Preface ...............................................................................................................................5
1. Background and objectives ..........................................................................................7
2. CFB gasification test trials...........................................................................................8 2.1 Feedstock............................................................................................................8 2.2 Test facility.......................................................................................................10 2.3 Test trials ..........................................................................................................13 2.4 Results ..............................................................................................................16
2.4.1 Carbon conversion and gas quality ......................................................16 2.4.2 Nitrogen compounds ............................................................................19 2.4.3 Sulphur compounds..............................................................................20 2.4.4 Halogens...............................................................................................20 2.4.5 Heavy metals........................................................................................23
3. Utilisation/disposal of solid residues .........................................................................26
4. Economic basis of SR gasification ............................................................................30 4.1 Conditions ........................................................................................................30 4.2 Evaluated process concepts ..............................................................................31 4.3 Definition of conditions....................................................................................32 4.4 Results ..............................................................................................................36
4.4.1 Large-scale gasification (50 MWth) connected to a PC boiler .............36 4.4.2 Small-scale gasification (8.5 MWth) connected to an industrial kiln .....39 4.4.3 Conclusions ..........................................................................................42
5. Overall conclusions and recommendations ...............................................................44
References .......................................................................................................................46
Appendix 1: Individual feedstock analyses for each CFB set point
7
1. Background and objectives
Scrap metal recovery has a long commercial history. Today, collected metal waste like cars and metal waste from other sources are shredded in huge hammer mills, and the output is separated into several fractions by magnets, sieves and other machinery. About 20�30% of the output is non-metallic material called shredder residue (SR) or automotive shredder residue (ASR) in the case that the input is only end-of-life vehicles (ELV). Several European Directives set increasing recovery targets for end-of-life products, e.g. the ELV Directive and, at the same time, there are increasing restrictions on the landfilling of organic waste. Therefore, new eco-efficient recovery solutions have to be developed.
Utilising the energy content of waste that cannot otherwise sensibly be recycled is a part of the European strategies for resource efficiency and the security of supply. Air-blown gasification of complex waste streams with hot product gas cleaning is a promising and economically attractive method of utilising the energy content of shredder residue. The cleaned gas can be used in coal-fired boilers or industrial kilns. In gasification of SR, additional metal recovery can take place from the solid gasification residues.
The primary objective of this project was to develop an air-blown fluidised-bed gasification process with efficient hot gas cleaning for the thermal treatment of shredder residue. The technical and economic feasibility of the process concept was also evaluated, as well as the possibility of metal recovery from gasification ash. The final target was to produce fuel gas clean enough to be used as a replacement for other fuels in large-scale coal-fired boilers, industrial kilns or other applications. The existing alternatives (oxygen-blown gasification, pressurised processes, multistage incineration processes) are technically capable of handling shredder residue, but they require a high level of capital investment and can be feasible only on a very large scale.
8
2. CFB gasification test trials
2.1 Feedstock
All experimental work for the project was carried out with authentic SR (shredder residue) delivered by project partners, the shredders Jylhän Metalliromu Oy and H.J. Hansen. SR samples were characterised in order to make a preliminary definition of optimal gasification and gas cleaning conditions, and to assess the variation of fuel properties and the composition of different SR materials. The total number of characterised samples was too low to make any reliable conclusions about the quality of SR, but it was large enough to show that the quality can vary over a wide range depending on feedstock and the practices of the shredder.
Feedstocks were crushed and sieved below 20 mm particle size to ensure trouble-free feeding into the PDU-scale gasifier. However, the test trials showed that metal wires can cause severe problems in a relatively small test rig, and therefore most of the metal wires were manually separated from the feedstock for the last test trial. Sampling of the materials was carried out during crushing. Several samples were taken during crushing to attain representative samples from heterogeneous materials.
The inert content of characterised samples varied from 31 to 70%. This variation was primarily based on the different raw materials and processes of the shredding plants. The carbon content of the samples varied from 19 to 53%. The lowest carbon content was analysed from the SR samples with the highest inert material content. All samples were rich in chlorine, varying from 0.9 to 3.0%. The highest chlorine content was analysed from the samples having the lowest inert content. A high chlorine content increases the risk of corrosion and the costs of gas cleaning. The mercury content of the SR samples was relatively low (0.8�2.8 mg/kg) compared to the values presented for SR/ASR in literature. Feedstocks having a lower inert content had a higher LHV (Lower Heating Value).
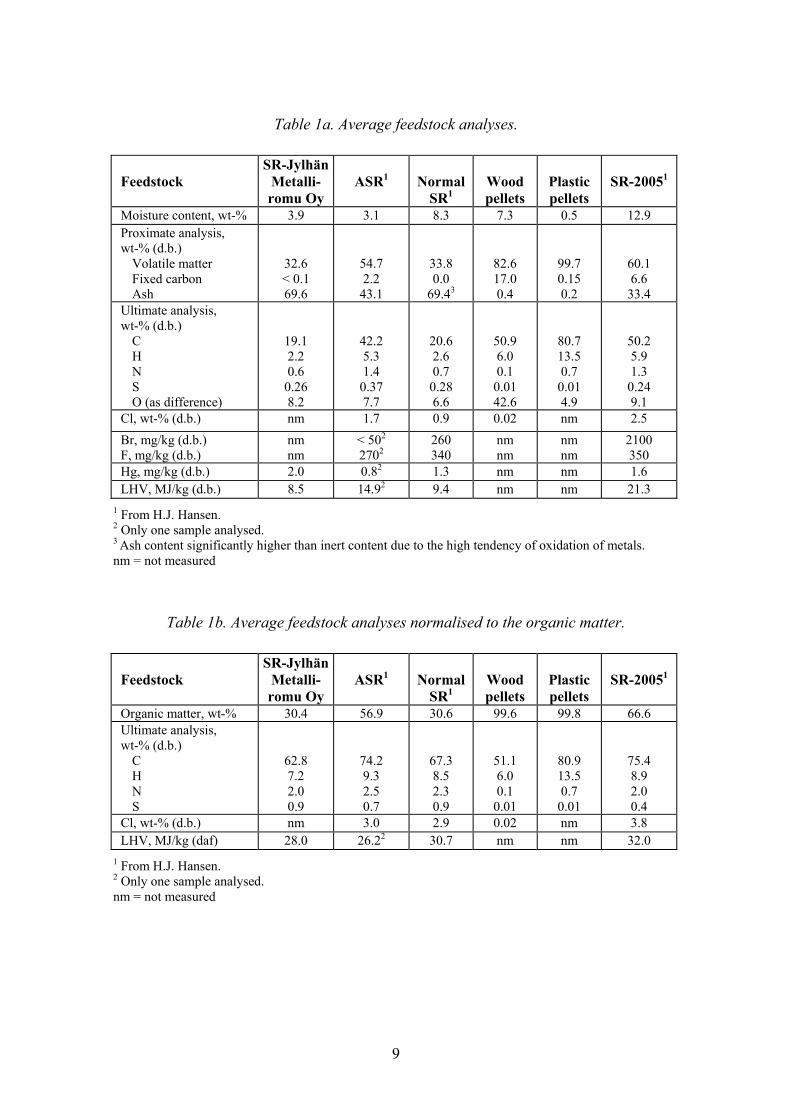
Some of the gasification test trials were carried out using only SR/ASR as a fuel, and some tests with a supporting fuel such as wood and plastic waste to stabilise the gasification process. The average feedstock analyses are presented in Table 1a, and the individual analyses for each CFB set point are shown in Appendix 1. The analyses are shown also as normalised to the organic matter (Table 1b). The organic fraction is rather similar in all cases regardless of input, and it is precisely the organic fraction that yields the amount of fuel gas that has to be cleaned.
The metal content varied according to the raw material as well as the shredder process. Figure 1 presents the average metal content of four feedstocks.
9
Table 1a. Average feedstock analyses.
Feedstock
SR-Jylhän Metalli- romu Oy
ASR1
Normal
SR1
Wood pellets
Plastic pellets
SR-20051
Moisture content, wt-% 3.9 3.1 8.3 7.3 0.5 12.9 Proximate analysis, wt-% (d.b.)
Volatile matter Fixed carbon Ash
32.6 < 0.1 69.6
54.7 2.2
43.1
33.8 0.0
69.43
82.6 17.0 0.4
99.7 0.15 0.2
60.1 6.6
33.4 Ultimate analysis, wt-% (d.b.)
C H N S O (as difference)
19.1 2.2 0.6
0.26 8.2
42.2 5.3 1.4
0.37 7.7
20.6 2.6 0.7
0.28 6.6
50.9 6.0 0.1
0.01 42.6
80.7 13.5 0.7
0.01 4.9
50.2 5.9 1.3
0.24 9.1
Cl, wt-% (d.b.) nm 1.7 0.9 0.02 nm 2.5 Br, mg/kg (d.b.) F, mg/kg (d.b.)
nm nm
< 502
2702 260 340
nm nm
nm nm
2100 350
Hg, mg/kg (d.b.) 2.0 0.82 1.3 nm nm 1.6 LHV, MJ/kg (d.b.) 8.5 14.92 9.4 nm nm 21.3
1 From H.J. Hansen. 2 Only one sample analysed. 3 Ash content significantly higher than inert content due to the high tendency of oxidation of metals. nm = not measured
Table 1b. Average feedstock analyses normalised to the organic matter.
Feedstock
SR-Jylhän Metalli- romu Oy
ASR1
Normal
SR1
Wood pellets
Plastic pellets
SR-20051
Organic matter, wt-% 30.4 56.9 30.6 99.6 99.8 66.6 Ultimate analysis, wt-% (d.b.)
C H N S
62.8 7.2 2.0 0.9
74.2 9.3 2.5 0.7
67.3 8.5 2.3 0.9
51.1 6.0 0.1
0.01
80.9 13.5 0.7
0.01
75.4 8.9 2.0 0.4
Cl, wt-% (d.b.) nm 3.0 2.9 0.02 nm 3.8 LHV, MJ/kg (daf) 28.0 26.22 30.7 nm nm 32.0
1 From H.J. Hansen. 2 Only one sample analysed. nm = not measured
10
0
2
4
6
8
10
12
14
16
18
Na Mg Al Si P K Ca Ti Cr Mn Fe Cu Zn Ba Pb
Con
tent
, wt-
%SR of Jylhän Metalliromu OyASRNormal SRSR-2005 (low inert containing)
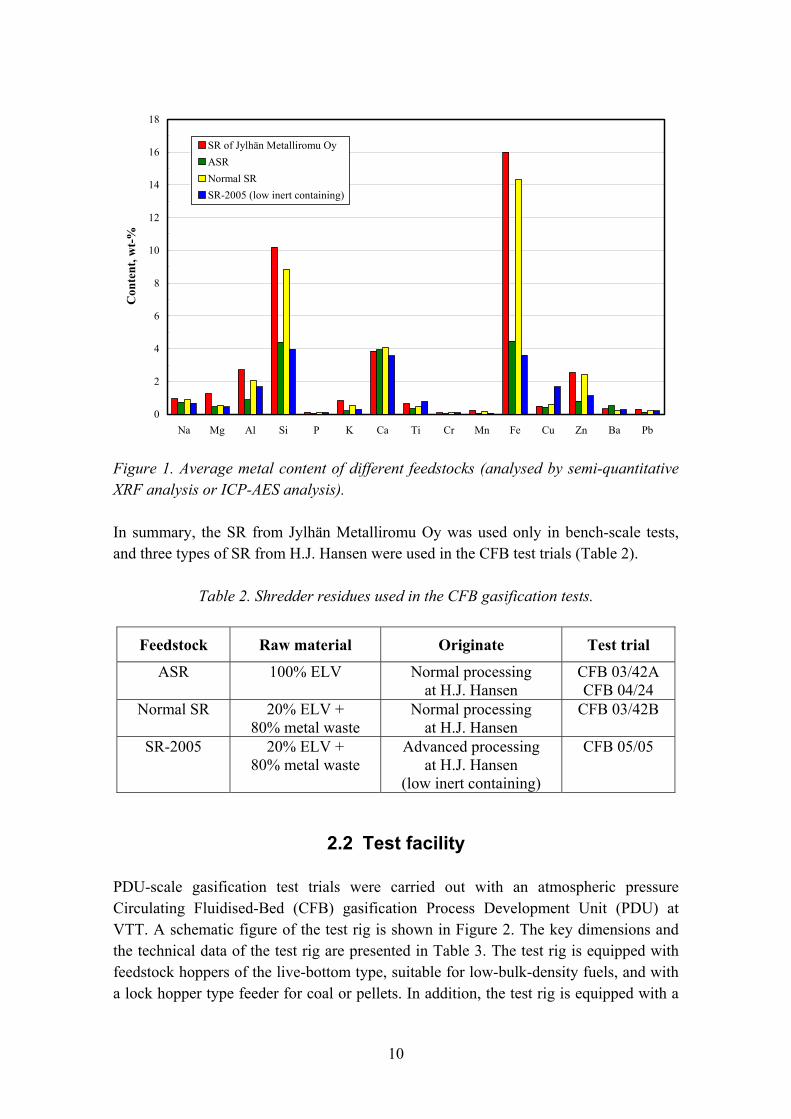
Figure 1. Average metal content of different feedstocks (analysed by semi-quantitative XRF analysis or ICP-AES analysis).
In summary, the SR from Jylhän Metalliromu Oy was used only in bench-scale tests, and three types of SR from H.J. Hansen were used in the CFB test trials (Table 2).
Table 2. Shredder residues used in the CFB gasification tests.
Feedstock Raw material Originate Test trial
ASR 100% ELV Normal processing at H.J. Hansen
CFB 03/42A CFB 04/24
Normal SR 20% ELV + 80% metal waste
Normal processing at H.J. Hansen
CFB 03/42B
SR-2005 20% ELV + 80% metal waste
Advanced processing at H.J. Hansen
(low inert containing)
CFB 05/05
2.2 Test facility
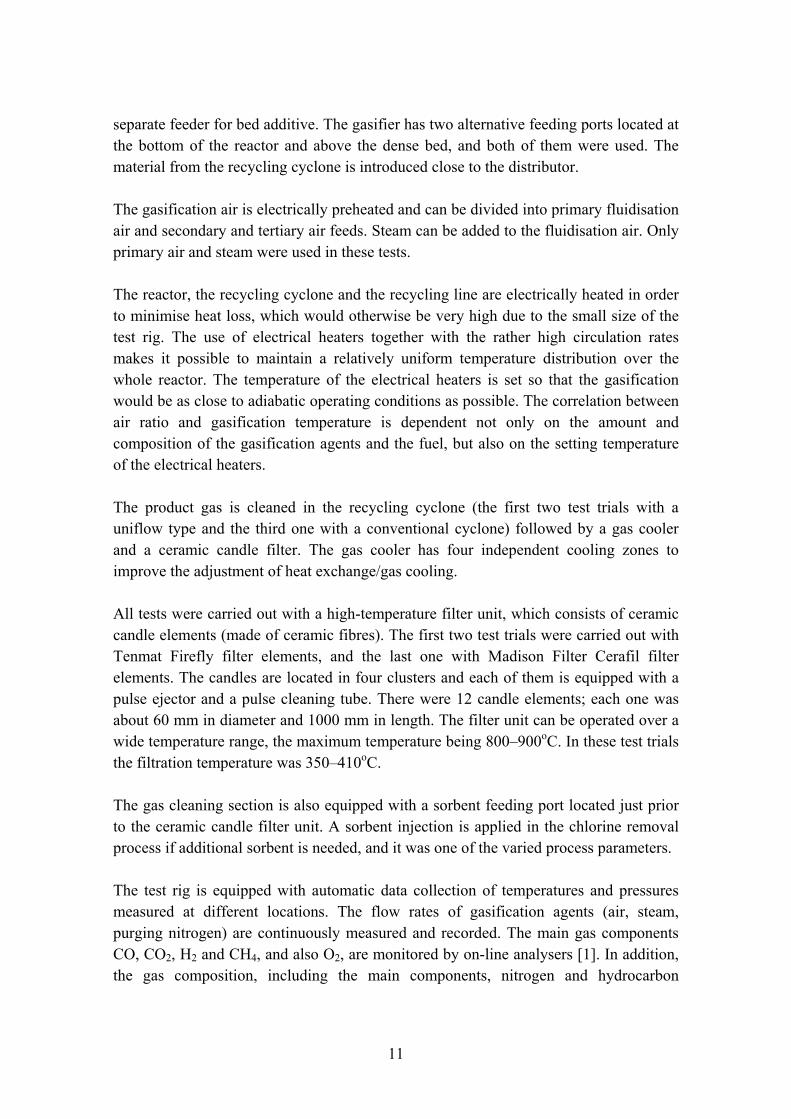
PDU-scale gasification test trials were carried out with an atmospheric pressure Circulating Fluidised-Bed (CFB) gasification Process Development Unit (PDU) at VTT. A schematic figure of the test rig is shown in Figure 2. The key dimensions and the technical data of the test rig are presented in Table 3. The test rig is equipped with feedstock hoppers of the live-bottom type, suitable for low-bulk-density fuels, and with a lock hopper type feeder for coal or pellets. In addition, the test rig is equipped with a
11
separate feeder for bed additive. The gasifier has two alternative feeding ports located at the bottom of the reactor and above the dense bed, and both of them were used. The material from the recycling cyclone is introduced close to the distributor.
The gasification air is electrically preheated and can be divided into primary fluidisation air and secondary and tertiary air feeds. Steam can be added to the fluidisation air. Only primary air and steam were used in these tests.
The reactor, the recycling cyclone and the recycling line are electrically heated in order to minimise heat loss, which would otherwise be very high due to the small size of the test rig. The use of electrical heaters together with the rather high circulation rates makes it possible to maintain a relatively uniform temperature distribution over the whole reactor. The temperature of the electrical heaters is set so that the gasification would be as close to adiabatic operating conditions as possible. The correlation between air ratio and gasification temperature is dependent not only on the amount and composition of the gasification agents and the fuel, but also on the setting temperature of the electrical heaters.
The product gas is cleaned in the recycling cyclone (the first two test trials with a uniflow type and the third one with a conventional cyclone) followed by a gas cooler and a ceramic candle filter. The gas cooler has four independent cooling zones to improve the adjustment of heat exchange/gas cooling.
All tests were carried out with a high-temperature filter unit, which consists of ceramic candle elements (made of ceramic fibres). The first two test trials were carried out with Tenmat Firefly filter elements, and the last one with Madison Filter Cerafil filter elements. The candles are located in four clusters and each of them is equipped with a pulse ejector and a pulse cleaning tube. There were 12 candle elements; each one was about 60 mm in diameter and 1000 mm in length. The filter unit can be operated over a wide temperature range, the maximum temperature being 800�900oC. In these test trials the filtration temperature was 350�410oC.
The gas cleaning section is also equipped with a sorbent feeding port located just prior to the ceramic candle filter unit. A sorbent injection is applied in the chlorine removal process if additional sorbent is needed, and it was one of the varied process parameters.
The test rig is equipped with automatic data collection of temperatures and pressures measured at different locations. The flow rates of gasification agents (air, steam, purging nitrogen) are continuously measured and recorded. The main gas components CO, CO2, H2 and CH4, and also O2, are monitored by on-line analysers [1]. In addition, the gas composition, including the main components, nitrogen and hydrocarbon
12
components (C2�C5Hy), are automatically analysed on an hourly basis by process gas chromatography. Some gas samples were also analysed by the laboratory GC to confirm the other gas analyses.
All mass streams were measured except product gas, which was calculated based on the other mass streams and product gas composition. All solid residues were collected and characterised (ash, C, H, N, S, XRF analysis). Sampling and analysing systems used for the feedstocks and solid output streams are described in [1]. Light tar (organic condensable compounds of molecular weight 79�200 g/mol) and benzene measurement was carried according to the Tar Guideline [2]. Gaseous impurities (nitrogen, sulphur and halogen compounds) were measured and determined by the methods described by Ståhlberg et al. [3].
FILTER
PREHEATER
GASIFIER
AIR PREHEATER
SORBENTFEEDER
CFB
FUEL FEEDER
Additive feeder
AIRSTEAM
FILTER
PREHEATER
GASIFIER
AIR PREHEATER
SORBENTFEEDER
CFB
FUEL FEEDER
Additive feeder
AIRSTEAM
Figure 2. Schematic figure of VTT�s Circulating Fluidised-Bed (CFB) gasification test rig (Process Development Unit, PDU).
13
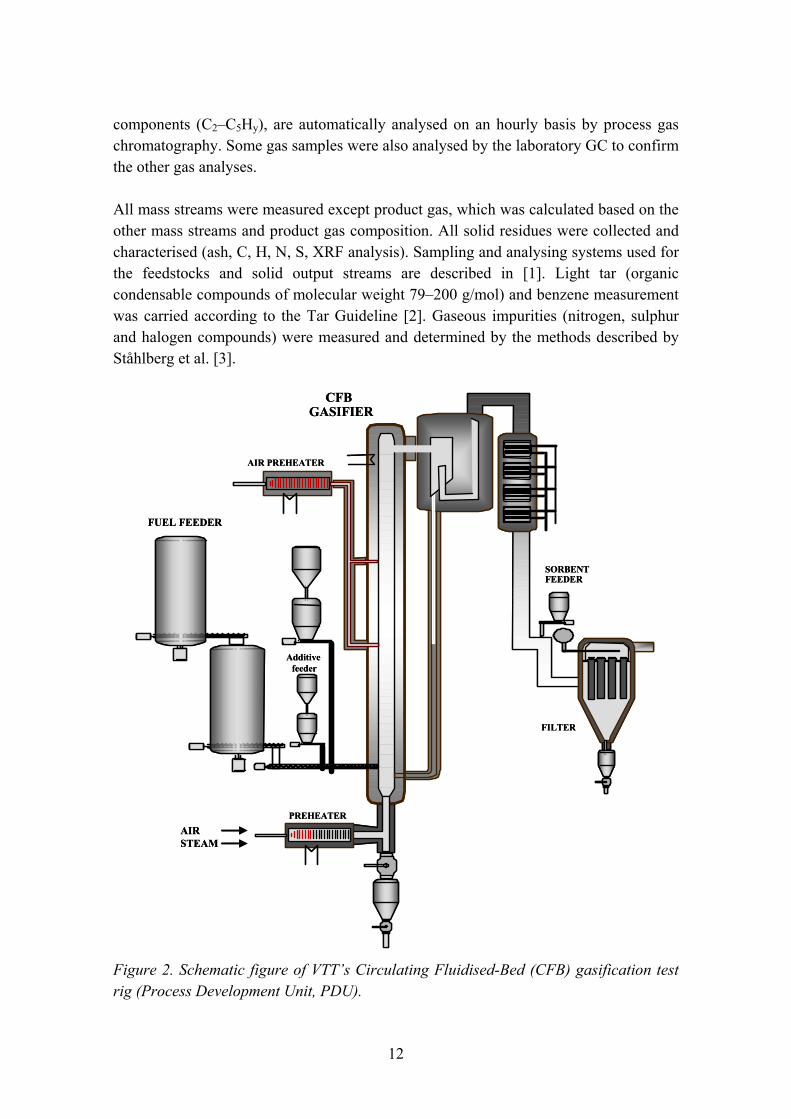
Table 3. Technical data on VTT�s CFB gasification test rig.
Reactor diameter Reactor height
154 mm 7.9 m
Operating temperature Superficial gas flow rate in the reactor Operating pressure Maximum fuel feed rate Maximum thermal capacity Gas cleaning equipment Research applications
600�1 000°C 1�5 m/s 1.0�1.3 bar (abs) 80 kg/h about 350 kW recycling cyclone, 2nd cyclone (optional) ceramic candle filter (12 elements) optional: bag filter (maximum 16 bags) Gasification, combustion, heat treatment
2.3 Test trials
Experimental gasification test trials were started by carrying out bench-scale gasification tests in order to estimate optimal gasification conditions for further fluidised-bed gasification test trials.
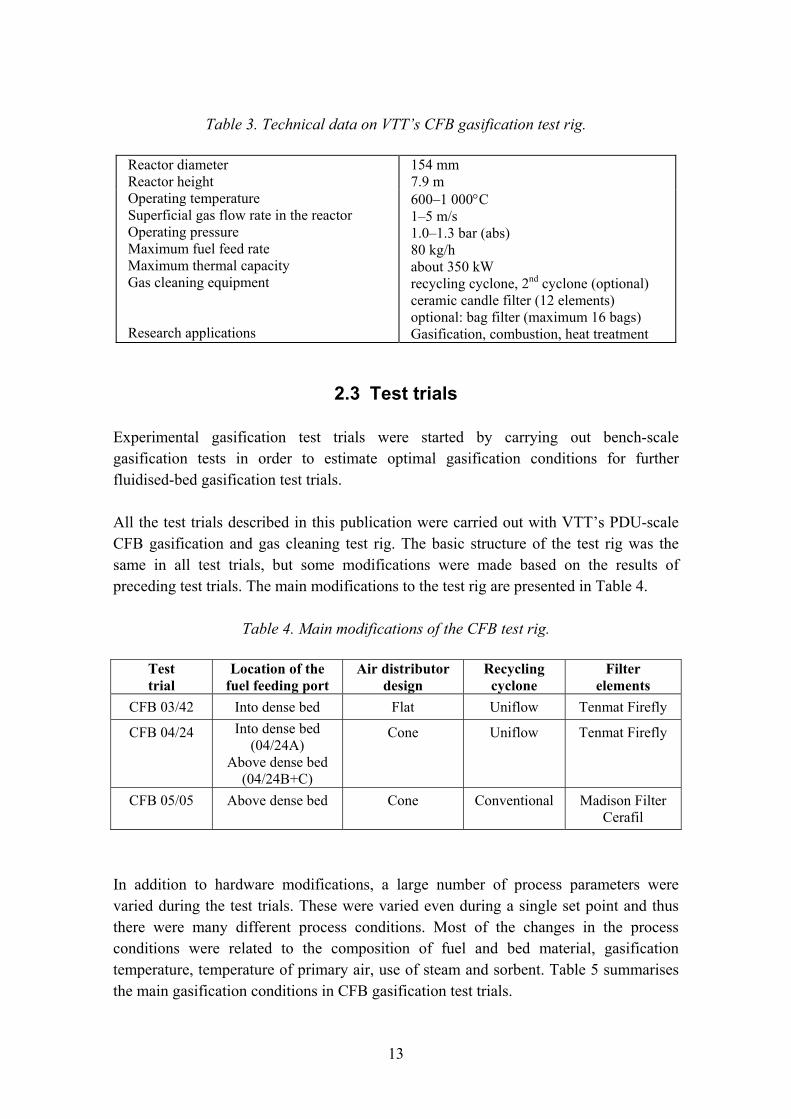
All the test trials described in this publication were carried out with VTT�s PDU-scale CFB gasification and gas cleaning test rig. The basic structure of the test rig was the same in all test trials, but some modifications were made based on the results of preceding test trials. The main modifications to the test rig are presented in Table 4.
Table 4. Main modifications of the CFB test rig.
Test trial
Location of the fuel feeding port
Air distributor design
Recycling cyclone
Filter elements
CFB 03/42 Into dense bed Flat Uniflow Tenmat Firefly
CFB 04/24 Into dense bed (04/24A)
Above dense bed (04/24B+C)
Cone Uniflow Tenmat Firefly
CFB 05/05 Above dense bed Cone Conventional Madison Filter Cerafil
In addition to hardware modifications, a large number of process parameters were varied during the test trials. These were varied even during a single set point and thus there were many different process conditions. Most of the changes in the process conditions were related to the composition of fuel and bed material, gasification temperature, temperature of primary air, use of steam and sorbent. Table 5 summarises the main gasification conditions in CFB gasification test trials.
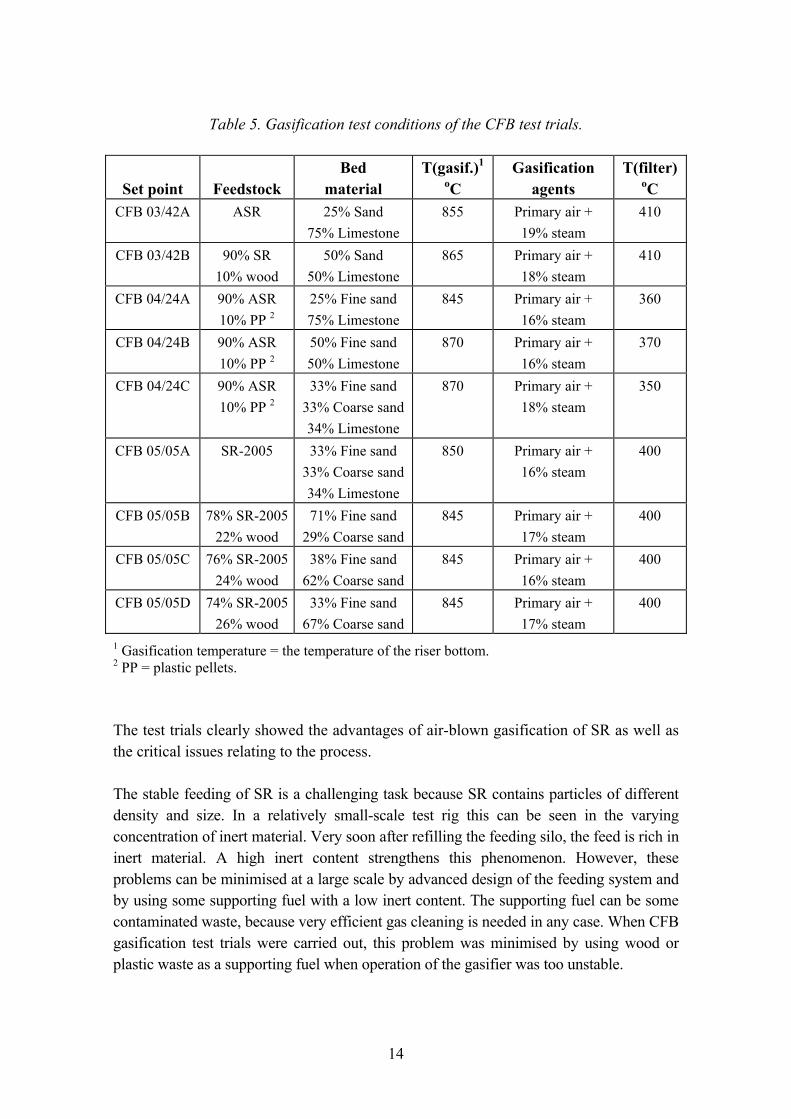
14
Table 5. Gasification test conditions of the CFB test trials.
Set point
Feedstock
Bed material
T(gasif.)1
oC Gasification
agents T(filter)
oC CFB 03/42A ASR 25% Sand
75% Limestone 855 Primary air +
19% steam 410
CFB 03/42B 90% SR 10% wood
50% Sand 50% Limestone
865 Primary air + 18% steam
410
CFB 04/24A 90% ASR 10% PP 2
25% Fine sand 75% Limestone
845 Primary air + 16% steam
360
CFB 04/24B 90% ASR 10% PP 2
50% Fine sand 50% Limestone
870 Primary air + 16% steam
370
CFB 04/24C 90% ASR 10% PP 2
33% Fine sand 33% Coarse sand 34% Limestone
870 Primary air + 18% steam
350
CFB 05/05A SR-2005 33% Fine sand 33% Coarse sand 34% Limestone
850 Primary air + 16% steam
400
CFB 05/05B 78% SR-2005 22% wood
71% Fine sand 29% Coarse sand
845 Primary air + 17% steam
400
CFB 05/05C 76% SR-2005 24% wood
38% Fine sand 62% Coarse sand
845 Primary air + 16% steam
400
CFB 05/05D 74% SR-2005 26% wood
33% Fine sand 67% Coarse sand
845 Primary air + 17% steam
400
1 Gasification temperature = the temperature of the riser bottom. 2 PP = plastic pellets.
The test trials clearly showed the advantages of air-blown gasification of SR as well as the critical issues relating to the process.
The stable feeding of SR is a challenging task because SR contains particles of different density and size. In a relatively small-scale test rig this can be seen in the varying concentration of inert material. Very soon after refilling the feeding silo, the feed is rich in inert material. A high inert content strengthens this phenomenon. However, these problems can be minimised at a large scale by advanced design of the feeding system and by using some supporting fuel with a low inert content. The supporting fuel can be some contaminated waste, because very efficient gas cleaning is needed in any case. When CFB gasification test trials were carried out, this problem was minimised by using wood or plastic waste as a supporting fuel when operation of the gasifier was too unstable.
15
The most serious identified technical problem was related to the deposit formation around the air distributor�s air nozzles. The bed material did not show any significant tendency to sintering but gasification tests were temporarily aborted several times in order to remove deposits from the air distributor. The formation of the deposits on the air distributor seemed to be related to the high chlorine and calcium content of the bed. To eliminate this problem, re-design of the air distributor and varying the composition of the bed material were tried, but the problem could not be avoided completely. The first test trial was carried out with a flat air distributor, which allows heavy metal pieces to lay on the surface of the distributor. The second and third test trials were carried out with a new conical distributor but this did not prevent the problem. The addition of coarse sand into the bed had some positive effect, but not strong enough to eliminate the problem. The best results were detected when no limestone was used as the bed additive. However, reduction of the calcium content of the bed was not complete because the feedstock was also very rich in calcium (and chlorine). Most probably this problem can be avoided at a large scale by clever design of the grid, as well as by optimising the operation of the gasifier. However, this is an issue which needs further research and development. Another alternative is to lower the chlorine content of SR by mechanical separation prior feeding it into the gasifier.
Some instability of the gasifier was caused by metal wires, which accumulated on the bottom of recycling cyclone when a uniflow-type cyclone was used. However, this problem was avoided in the PDU-scale test trials by separating some of the metal wires manually during the pre-treatment phase and by using a conventional recycling cyclone. It may be not be an issue at a large scale, when the dimensions of the cyclone are much larger.
No significant deposits were detected in the riser or in the gas cooler. Some deposits were found on the surface of high temperature gas lines, but these can be considered as normal.
Gas cleaning was based on gas cooling, chlorine removal sorbent injection and gas filtration at about 400oC. The feeding rate of chlorine removal sorbent, Ca(OH)2, depends on the chlorine content of the feedstock and the availability of the other potential chlorine removal compounds in a filter cake. Calcium and alkali metals from the feedstock as well as the bed material take part in chlorine capture, decreasing the need for additional sorbent. All heavy metals, excluding mercury, can also be removed by this gas cleaning procedure. In general, gas cleaning worked as expected. The target was to produce gas which can be co-combusted in a large-scale boiler equipped with DeSOx and DeNOx systems, and operated under the regulations of the Waste Incineration Directive.
16
2.4 Results
2.4.1 Carbon conversion and gas quality
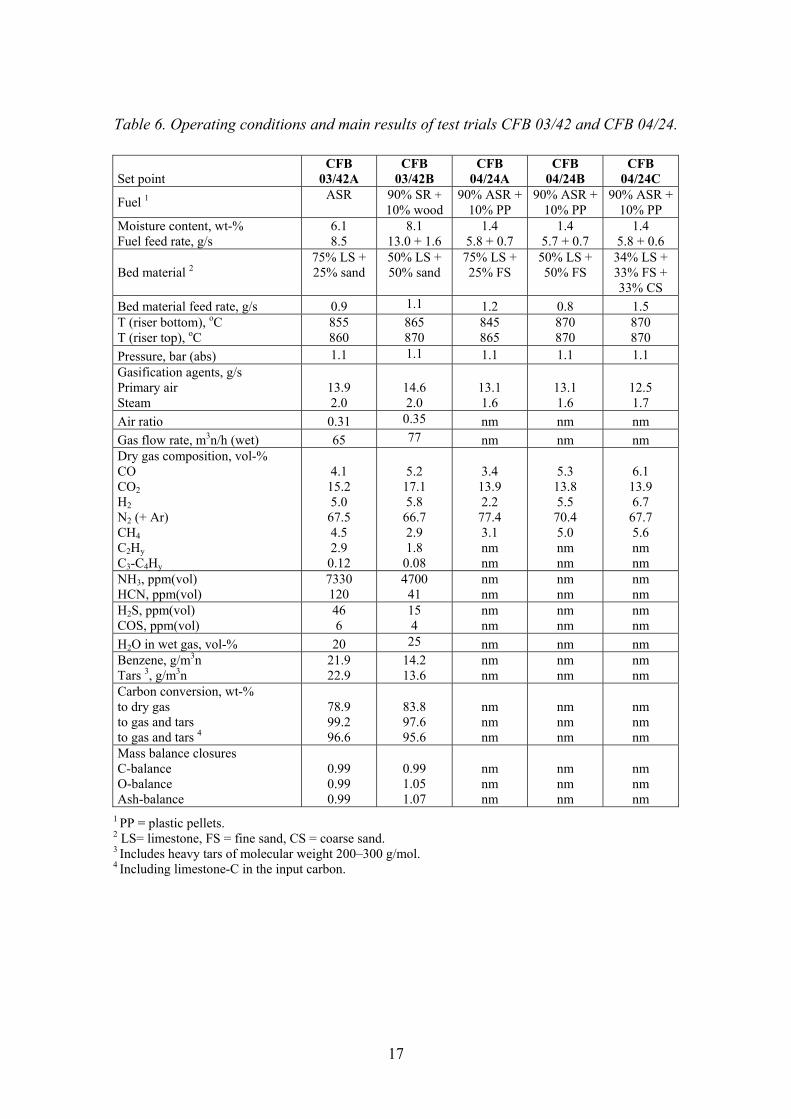
The operating conditions and the main results of the test trials are summarised in Tables 6 and 7. Due to the technical problems, there was no steady state period long enough for a good set point in test trial CFB 04/24. Thus, only a reduced number of measurements were carried out and no calculations of the carbon conversion or other data describing the test period were done.
17
Table 6. Operating conditions and main results of test trials CFB 03/42 and CFB 04/24.
Set point CFB
03/42A CFB
03/42B CFB
04/24A CFB
04/24B CFB
04/24C
Fuel 1 ASR
90% SR + 10% wood
90% ASR + 10% PP
90% ASR + 10% PP
90% ASR + 10% PP
Moisture content, wt-% Fuel feed rate, g/s
6.1 8.5
8.1 13.0 + 1.6
1.4 5.8 + 0.7
1.4 5.7 + 0.7
1.4 5.8 + 0.6
Bed material 2 75% LS + 25% sand
50% LS + 50% sand
75% LS + 25% FS
50% LS + 50% FS
34% LS + 33% FS + 33% CS
Bed material feed rate, g/s 0.9 1.1 1.2 0.8 1.5 T (riser bottom), oC T (riser top), oC
855 860
865 870
845 865
870 870
870 870
Pressure, bar (abs) 1.1 1.1 1.1 1.1 1.1 Gasification agents, g/s Primary air Steam
13.9 2.0
14.6 2.0
13.1 1.6
13.1 1.6
12.5 1.7
Air ratio 0.31 0.35 nm nm nm Gas flow rate, m3n/h (wet) 65 77 nm nm nm Dry gas composition, vol-% CO CO2 H2 N2 (+ Ar) CH4 C2Hy C3-C4Hy
4.1 15.2 5.0
67.5 4.5 2.9
0.12
5.2
17.1 5.8
66.7 2.9 1.8
0.08
3.4 13.9 2.2
77.4 3.1 nm nm
5.3 13.8 5.5
70.4 5.0 nm nm
6.1 13.9 6.7
67.7 5.6 nm nm
NH3, ppm(vol) HCN, ppm(vol)
7330 120
4700 41
nm nm
nm nm
nm nm
H2S, ppm(vol) COS, ppm(vol)
46 6
15 4
nm nm
nm nm
nm nm
H2O in wet gas, vol-% 20 25 nm nm nm Benzene, g/m3n Tars 3, g/m3n
21.9 22.9
14.2 13.6
nm nm
nm nm
nm nm
Carbon conversion, wt-% to dry gas to gas and tars to gas and tars 4
78.9 99.2 96.6
83.8 97.6 95.6
nm nm nm
nm nm nm
nm nm nm
Mass balance closures C-balance O-balance Ash-balance
0.99 0.99 0.99
0.99 1.05 1.07
nm nm nm
nm nm nm
nm nm nm
1 PP = plastic pellets. 2 LS= limestone, FS = fine sand, CS = coarse sand. 3 Includes heavy tars of molecular weight 200�300 g/mol. 4 Including limestone-C in the input carbon.
18
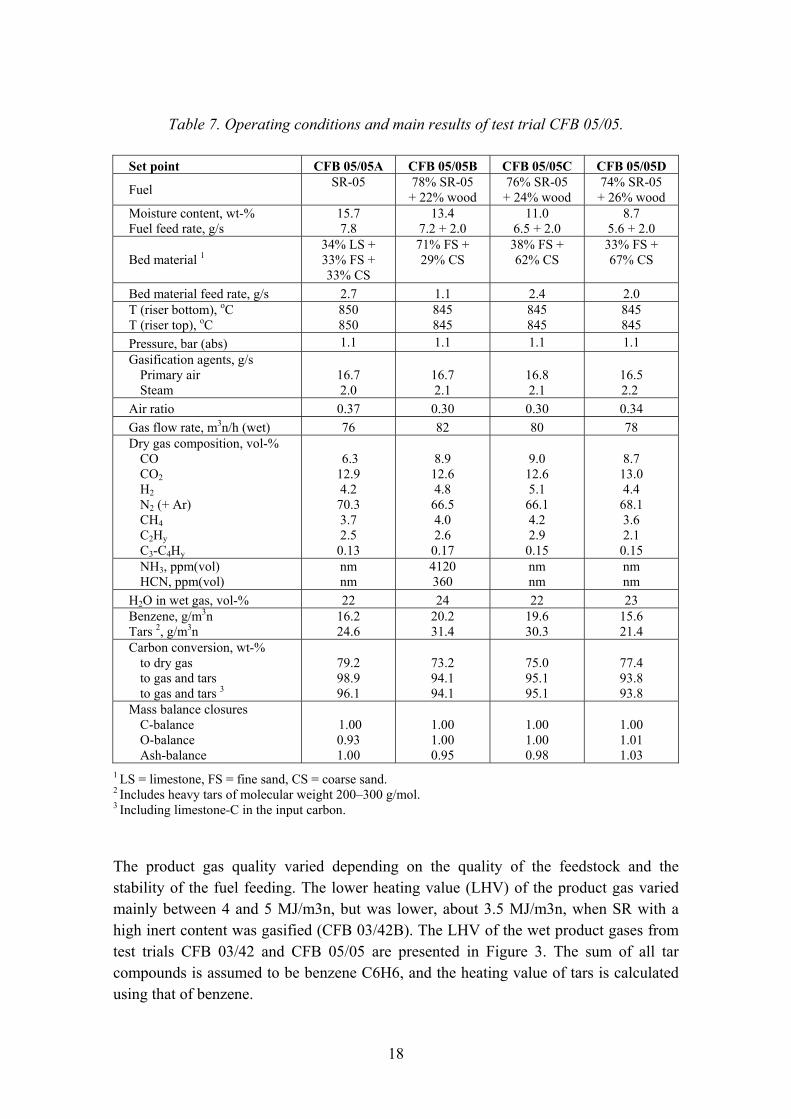
Table 7. Operating conditions and main results of test trial CFB 05/05.
Set point CFB 05/05A CFB 05/05B CFB 05/05C CFB 05/05D
Fuel SR-05
78% SR-05 + 22% wood
76% SR-05 + 24% wood
74% SR-05 + 26% wood
Moisture content, wt-% Fuel feed rate, g/s
15.7 7.8
13.4 7.2 + 2.0
11.0 6.5 + 2.0
8.7 5.6 + 2.0
Bed material 1 34% LS + 33% FS + 33% CS
71% FS + 29% CS
38% FS + 62% CS
33% FS + 67% CS
Bed material feed rate, g/s 2.7 1.1 2.4 2.0 T (riser bottom), oC T (riser top), oC
850 850
845 845
845 845
845 845
Pressure, bar (abs) 1.1 1.1 1.1 1.1 Gasification agents, g/s
Primary air Steam
16.7 2.0
16.7 2.1
16.8 2.1
16.5 2.2
Air ratio 0.37 0.30 0.30 0.34 Gas flow rate, m3n/h (wet) 76 82 80 78 Dry gas composition, vol-%
CO CO2 H2 N2 (+ Ar) CH4 C2Hy C3-C4Hy
6.3 12.9 4.2
70.3 3.7 2.5
0.13
8.9 12.6 4.8
66.5 4.0 2.6
0.17
9.0 12.6 5.1
66.1 4.2 2.9
0.15
8.7 13.0 4.4
68.1 3.6 2.1
0.15 NH3, ppm(vol) HCN, ppm(vol)
nm nm
4120 360
nm nm
nm nm
H2O in wet gas, vol-% 22 24 22 23 Benzene, g/m3n Tars 2, g/m3n
16.2 24.6
20.2 31.4
19.6 30.3
15.6 21.4
Carbon conversion, wt-% to dry gas to gas and tars to gas and tars 3
79.2 98.9 96.1
73.2 94.1 94.1
75.0 95.1 95.1
77.4 93.8 93.8
Mass balance closures C-balance O-balance Ash-balance
1.00 0.93 1.00
1.00 1.00 0.95
1.00 1.00 0.98
1.00 1.01 1.03
1 LS = limestone, FS = fine sand, CS = coarse sand. 2 Includes heavy tars of molecular weight 200�300 g/mol. 3 Including limestone-C in the input carbon.
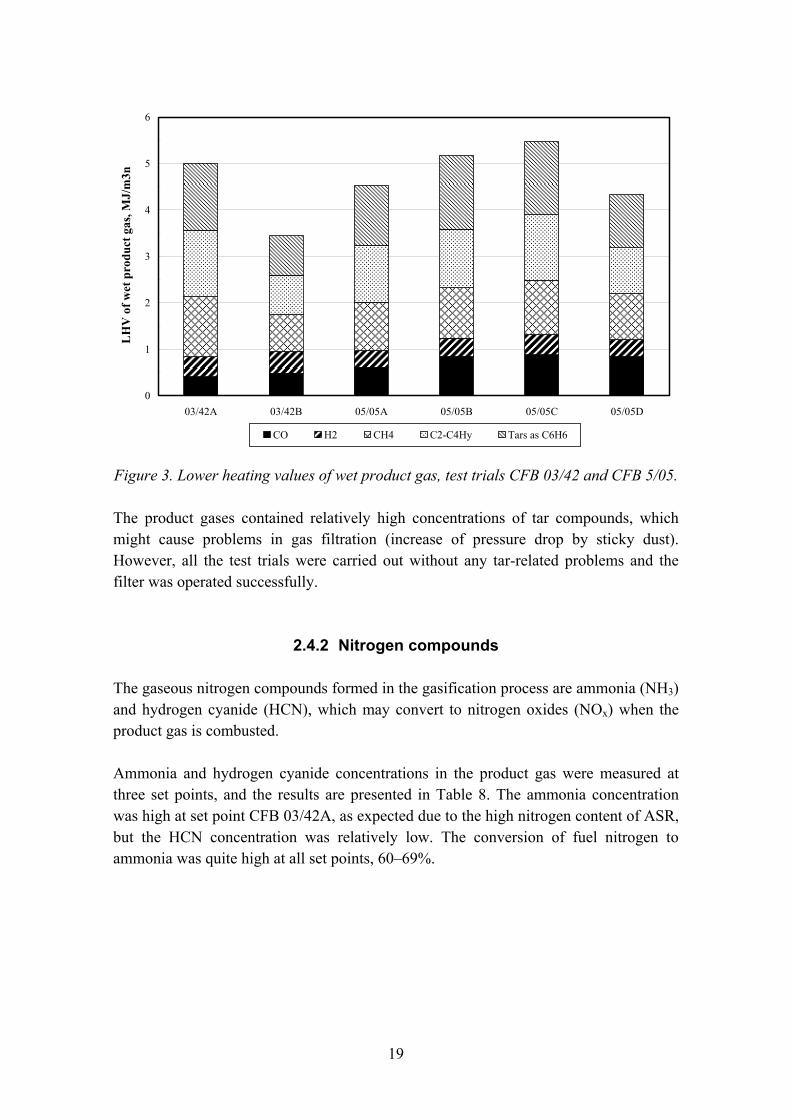
The product gas quality varied depending on the quality of the feedstock and the stability of the fuel feeding. The lower heating value (LHV) of the product gas varied mainly between 4 and 5 MJ/m3n, but was lower, about 3.5 MJ/m3n, when SR with a high inert content was gasified (CFB 03/42B). The LHV of the wet product gases from test trials CFB 03/42 and CFB 05/05 are presented in Figure 3. The sum of all tar compounds is assumed to be benzene C6H6, and the heating value of tars is calculated using that of benzene.
19
0
1
2
3
4
5
6
03/42A 03/42B 05/05A 05/05B 05/05C 05/05D
LH
V o
f wet
pro
duct
gas
, MJ/
m3n
CO H2 CH4 C2-C4Hy Tars as C6H6
Figure 3. Lower heating values of wet product gas, test trials CFB 03/42 and CFB 5/05.
The product gases contained relatively high concentrations of tar compounds, which might cause problems in gas filtration (increase of pressure drop by sticky dust). However, all the test trials were carried out without any tar-related problems and the filter was operated successfully.
2.4.2 Nitrogen compounds
The gaseous nitrogen compounds formed in the gasification process are ammonia (NH3) and hydrogen cyanide (HCN), which may convert to nitrogen oxides (NOx) when the product gas is combusted.
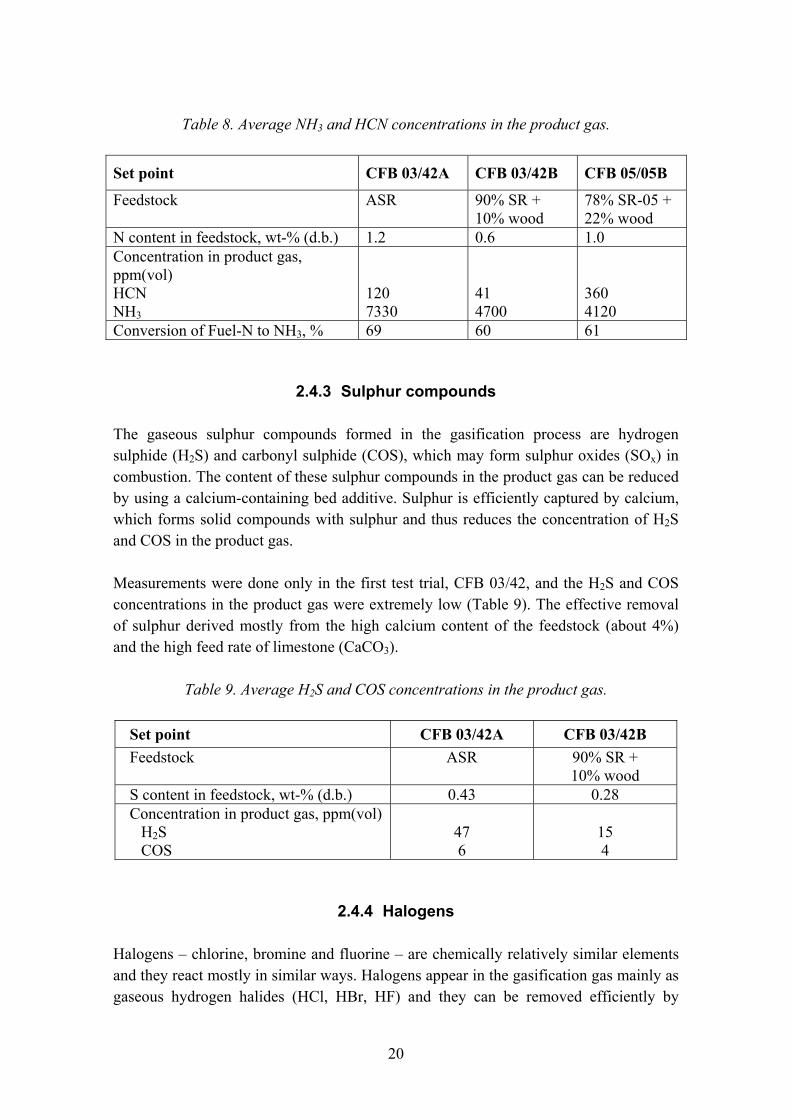
Ammonia and hydrogen cyanide concentrations in the product gas were measured at three set points, and the results are presented in Table 8. The ammonia concentration was high at set point CFB 03/42A, as expected due to the high nitrogen content of ASR, but the HCN concentration was relatively low. The conversion of fuel nitrogen to ammonia was quite high at all set points, 60�69%.
20
Table 8. Average NH3 and HCN concentrations in the product gas.
Set point CFB 03/42A CFB 03/42B CFB 05/05B
Feedstock ASR 90% SR + 10% wood
78% SR-05 + 22% wood
N content in feedstock, wt-% (d.b.) 1.2 0.6 1.0 Concentration in product gas, ppm(vol) HCN NH3
120 7330
41 4700
360 4120
Conversion of Fuel-N to NH3, % 69 60 61
2.4.3 Sulphur compounds
The gaseous sulphur compounds formed in the gasification process are hydrogen sulphide (H2S) and carbonyl sulphide (COS), which may form sulphur oxides (SOx) in combustion. The content of these sulphur compounds in the product gas can be reduced by using a calcium-containing bed additive. Sulphur is efficiently captured by calcium, which forms solid compounds with sulphur and thus reduces the concentration of H2S and COS in the product gas.
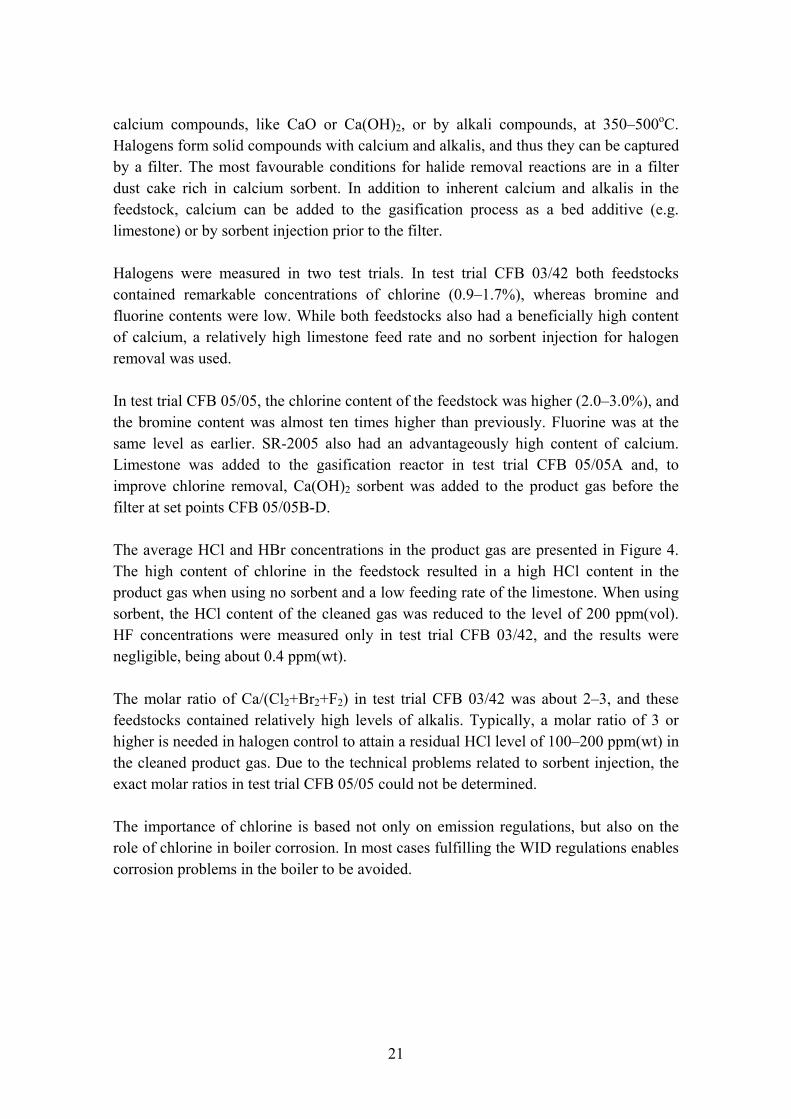
Measurements were done only in the first test trial, CFB 03/42, and the H2S and COS concentrations in the product gas were extremely low (Table 9). The effective removal of sulphur derived mostly from the high calcium content of the feedstock (about 4%) and the high feed rate of limestone (CaCO3).
Table 9. Average H2S and COS concentrations in the product gas.
Set point CFB 03/42A CFB 03/42B Feedstock ASR 90% SR +
10% wood S content in feedstock, wt-% (d.b.) 0.43 0.28 Concentration in product gas, ppm(vol)
H2S COS
47 6
15 4
2.4.4 Halogens
Halogens � chlorine, bromine and fluorine � are chemically relatively similar elements and they react mostly in similar ways. Halogens appear in the gasification gas mainly as gaseous hydrogen halides (HCl, HBr, HF) and they can be removed efficiently by
21
calcium compounds, like CaO or Ca(OH)2, or by alkali compounds, at 350�500oC. Halogens form solid compounds with calcium and alkalis, and thus they can be captured by a filter. The most favourable conditions for halide removal reactions are in a filter dust cake rich in calcium sorbent. In addition to inherent calcium and alkalis in the feedstock, calcium can be added to the gasification process as a bed additive (e.g. limestone) or by sorbent injection prior to the filter.
Halogens were measured in two test trials. In test trial CFB 03/42 both feedstocks contained remarkable concentrations of chlorine (0.9�1.7%), whereas bromine and fluorine contents were low. While both feedstocks also had a beneficially high content of calcium, a relatively high limestone feed rate and no sorbent injection for halogen removal was used.
In test trial CFB 05/05, the chlorine content of the feedstock was higher (2.0�3.0%), and the bromine content was almost ten times higher than previously. Fluorine was at the same level as earlier. SR-2005 also had an advantageously high content of calcium. Limestone was added to the gasification reactor in test trial CFB 05/05A and, to improve chlorine removal, Ca(OH)2 sorbent was added to the product gas before the filter at set points CFB 05/05B-D.
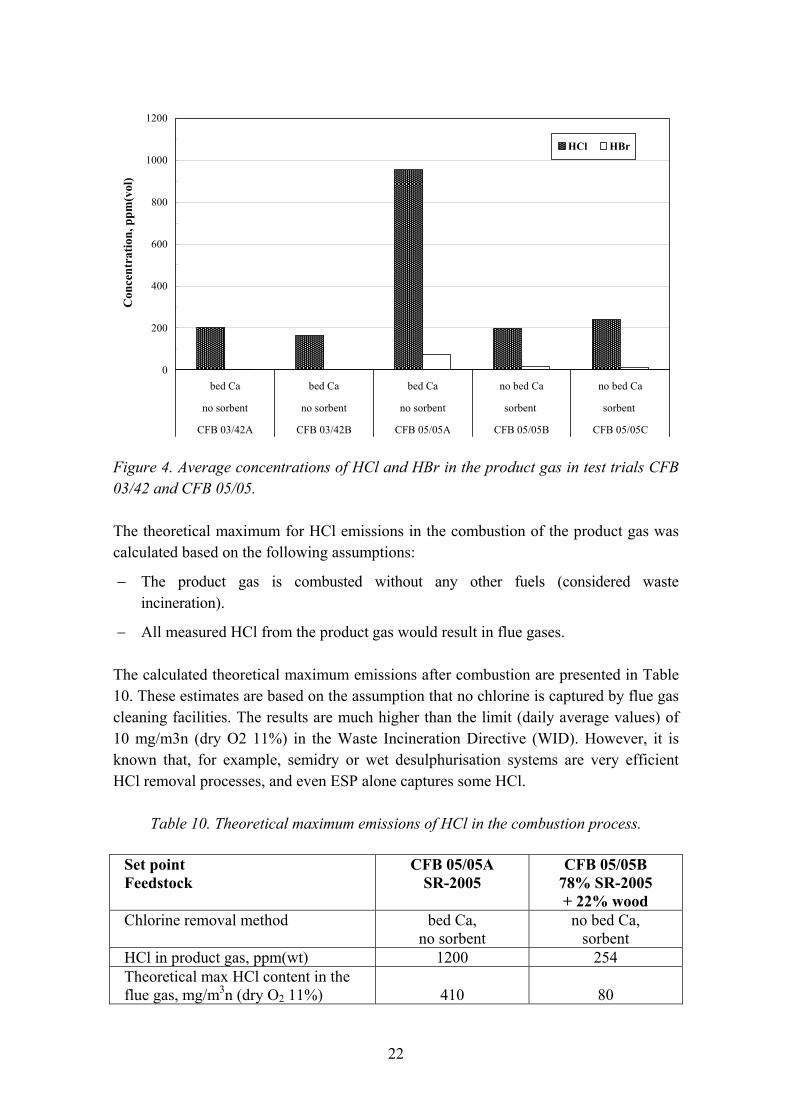
The average HCl and HBr concentrations in the product gas are presented in Figure 4. The high content of chlorine in the feedstock resulted in a high HCl content in the product gas when using no sorbent and a low feeding rate of the limestone. When using sorbent, the HCl content of the cleaned gas was reduced to the level of 200 ppm(vol). HF concentrations were measured only in test trial CFB 03/42, and the results were negligible, being about 0.4 ppm(wt).
The molar ratio of Ca/(Cl2+Br2+F2) in test trial CFB 03/42 was about 2�3, and these feedstocks contained relatively high levels of alkalis. Typically, a molar ratio of 3 or higher is needed in halogen control to attain a residual HCl level of 100�200 ppm(wt) in the cleaned product gas. Due to the technical problems related to sorbent injection, the exact molar ratios in test trial CFB 05/05 could not be determined.
The importance of chlorine is based not only on emission regulations, but also on the role of chlorine in boiler corrosion. In most cases fulfilling the WID regulations enables corrosion problems in the boiler to be avoided.
22
0
200
400
600
800
1000
1200
bed Ca bed Ca bed Ca no bed Ca no bed Ca
no sorbent no sorbent no sorbent sorbent sorbent
CFB 03/42A CFB 03/42B CFB 05/05A CFB 05/05B CFB 05/05C
Con
cent
ratio
n, p
pm(v
ol)
HCl HBr
Figure 4. Average concentrations of HCl and HBr in the product gas in test trials CFB 03/42 and CFB 05/05.
The theoretical maximum for HCl emissions in the combustion of the product gas was calculated based on the following assumptions:
− The product gas is combusted without any other fuels (considered waste incineration).
− All measured HCl from the product gas would result in flue gases.
The calculated theoretical maximum emissions after combustion are presented in Table 10. These estimates are based on the assumption that no chlorine is captured by flue gas cleaning facilities. The results are much higher than the limit (daily average values) of 10 mg/m3n (dry O2 11%) in the Waste Incineration Directive (WID). However, it is known that, for example, semidry or wet desulphurisation systems are very efficient HCl removal processes, and even ESP alone captures some HCl.
Table 10. Theoretical maximum emissions of HCl in the combustion process.
Set point Feedstock
CFB 05/05A SR-2005
CFB 05/05B 78% SR-2005 + 22% wood
Chlorine removal method bed Ca, no sorbent
no bed Ca, sorbent
HCl in product gas, ppm(wt) 1200 254 Theoretical max HCl content in the flue gas, mg/m3n (dry O2 11%)
410
80
23
2.4.5 Heavy metals
The heavy metals listed in the Waste Incineration Directive (WID), excluding mercury, were measured in the product gas after the gas cleaning in test trials CFB 03/42 and CFB 05/05. Heavy metal sampling was carried out by leading the product gas through a quartz probe connected to a series of impinger bottles in an ice water bath. The first three impinger bottles contained 10 wt-% of HNO3 to capture most of the gas-phase heavy metals. After each sampling, the HNO3 solution in the three first impinger bottles was collected in a sample bottle. The probe and impinger bottles were washed with HNO3 solution and the washing solution was combined with the sample. The heavy metals in the sample solution were analysed by ICP-MS or ICP-AES.
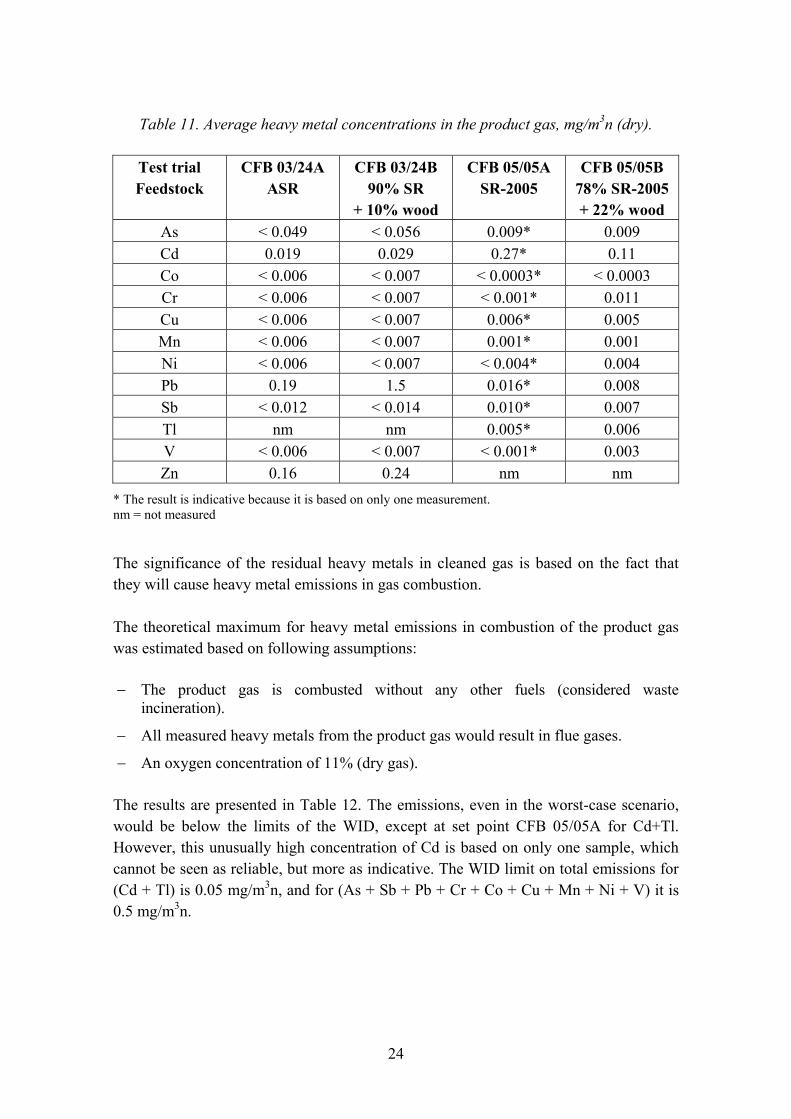
The measured heavy metal concentrations in the product gas are presented in Table 11. The sampling point was located after the filter. Heavy metals, excluding mercury, are typically captured efficiently by a filter at temperatures below 450oC, and in these test trials the filter temperature was 400�410oC.
The cadmium content varied in the three parallel samples of CFB 05/05B, although the content of the other heavy metals was at the same level in all three samples. The concentration of cadmium increased twofold when the temperature of the gas before the filter increased by 50�100oC. This indicates that the gas entering the filter may have been too hot (over 450oC) to attain good cadmium removal efficiency. Cadmium is known to be very sensitive to the filtration temperature, and cadmium emission increases significantly when the filtration temperature rises above 500oC.
However, when comparing the metal concentrations in the product gas at different set points, it should be remembered that the measured metal content of the feedstock is always only an average value of a larger quantity, but the measured vapour phase concentration always represents the actual concentration during the sampling period (typically 1�3 h/sample).
24
Table 11. Average heavy metal concentrations in the product gas, mg/m3n (dry).
Test trial Feedstock
CFB 03/24A ASR
CFB 03/24B 90% SR
+ 10% wood
CFB 05/05A SR-2005
CFB 05/05B 78% SR-2005 + 22% wood
As < 0.049 < 0.056 0.009* 0.009 Cd 0.019 0.029 0.27* 0.11 Co < 0.006 < 0.007 < 0.0003* < 0.0003 Cr < 0.006 < 0.007 < 0.001* 0.011 Cu < 0.006 < 0.007 0.006* 0.005 Mn < 0.006 < 0.007 0.001* 0.001 Ni < 0.006 < 0.007 < 0.004* 0.004 Pb 0.19 1.5 0.016* 0.008 Sb < 0.012 < 0.014 0.010* 0.007 Tl nm nm 0.005* 0.006 V < 0.006 < 0.007 < 0.001* 0.003 Zn 0.16 0.24 nm nm
* The result is indicative because it is based on only one measurement. nm = not measured
The significance of the residual heavy metals in cleaned gas is based on the fact that they will cause heavy metal emissions in gas combustion.
The theoretical maximum for heavy metal emissions in combustion of the product gas was estimated based on following assumptions:
− The product gas is combusted without any other fuels (considered waste incineration).
− All measured heavy metals from the product gas would result in flue gases.
− An oxygen concentration of 11% (dry gas).
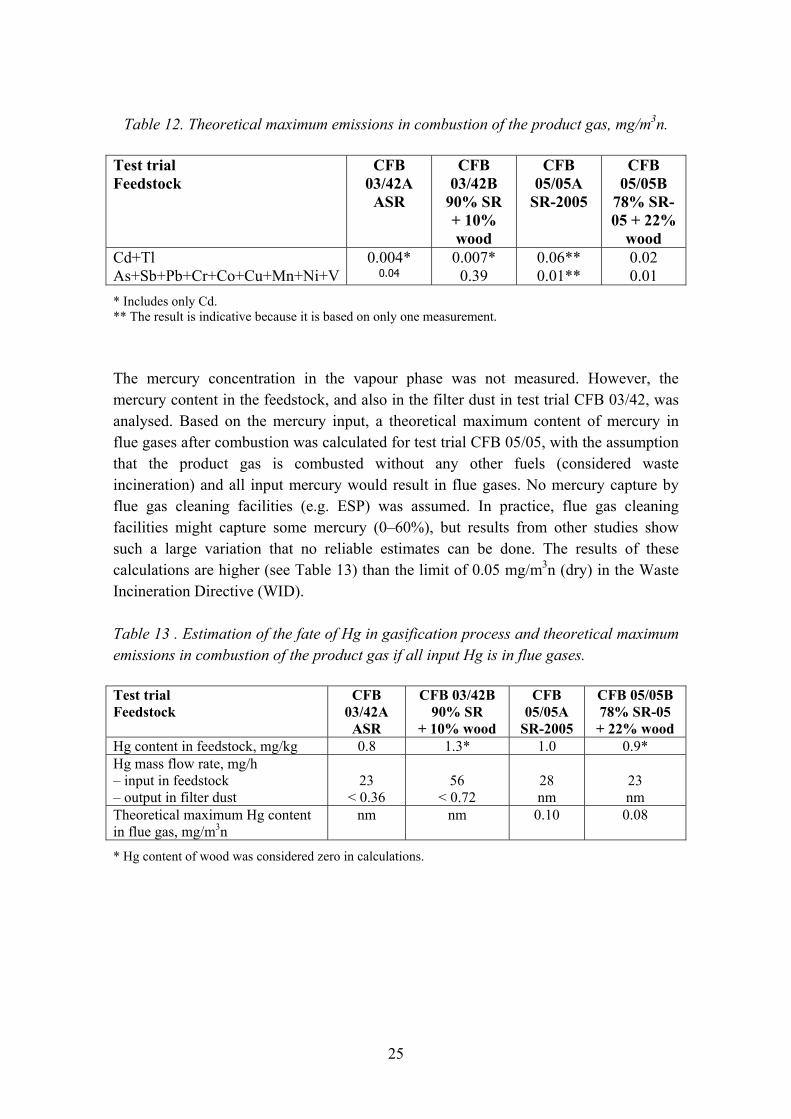
The results are presented in Table 12. The emissions, even in the worst-case scenario, would be below the limits of the WID, except at set point CFB 05/05A for Cd+Tl. However, this unusually high concentration of Cd is based on only one sample, which cannot be seen as reliable, but more as indicative. The WID limit on total emissions for (Cd + Tl) is 0.05 mg/m3n, and for (As + Sb + Pb + Cr + Co + Cu + Mn + Ni + V) it is 0.5 mg/m3n.
25
Table 12. Theoretical maximum emissions in combustion of the product gas, mg/m3n.
Test trial Feedstock
CFB 03/42A
ASR
CFB 03/42B
90% SR + 10% wood
CFB 05/05A
SR-2005
CFB 05/05B
78% SR-05 + 22%
wood Cd+Tl As+Sb+Pb+Cr+Co+Cu+Mn+Ni+V
0.004* 0.04
0.007* 0.39
0.06** 0.01**
0.02 0.01
* Includes only Cd. ** The result is indicative because it is based on only one measurement.
The mercury concentration in the vapour phase was not measured. However, the mercury content in the feedstock, and also in the filter dust in test trial CFB 03/42, was analysed. Based on the mercury input, a theoretical maximum content of mercury in flue gases after combustion was calculated for test trial CFB 05/05, with the assumption that the product gas is combusted without any other fuels (considered waste incineration) and all input mercury would result in flue gases. No mercury capture by flue gas cleaning facilities (e.g. ESP) was assumed. In practice, flue gas cleaning facilities might capture some mercury (0�60%), but results from other studies show such a large variation that no reliable estimates can be done. The results of these calculations are higher (see Table 13) than the limit of 0.05 mg/m3n (dry) in the Waste Incineration Directive (WID).
Table 13 . Estimation of the fate of Hg in gasification process and theoretical maximum emissions in combustion of the product gas if all input Hg is in flue gases.
Test trial Feedstock
CFB 03/42A
ASR
CFB 03/42B 90% SR
+ 10% wood
CFB 05/05A
SR-2005
CFB 05/05B 78% SR-05 + 22% wood
Hg content in feedstock, mg/kg 0.8 1.3* 1.0 0.9* Hg mass flow rate, mg/h � input in feedstock � output in filter dust
23
< 0.36
56
< 0.72
28 nm
23 nm
Theoretical maximum Hg content in flue gas, mg/m3n
nm nm 0.10 0.08
* Hg content of wood was considered zero in calculations.
26
3. Utilisation/disposal of solid residues
SR contains significant concentrations of harmful compounds which can cause emission problems, as well as valuable metals. In the gasification and gas cleaning process, impurities including valuable metals are enriched into two solid mass streams: bottom ash and filter dust.
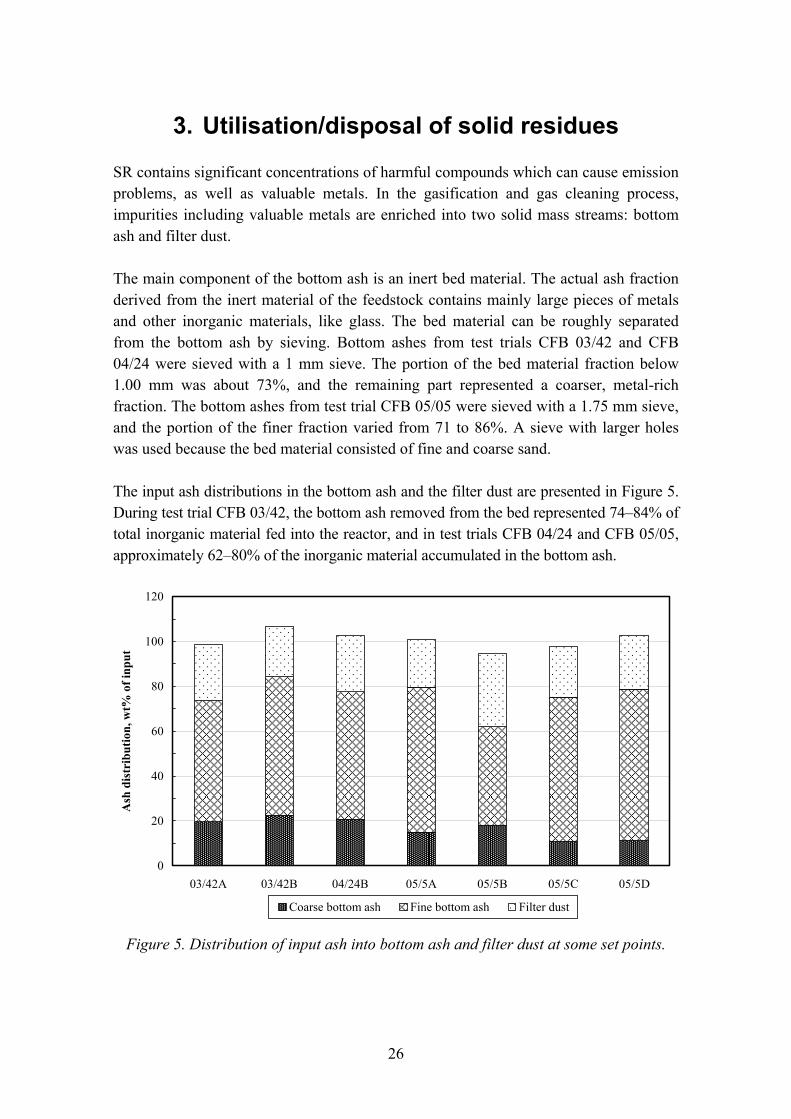
The main component of the bottom ash is an inert bed material. The actual ash fraction derived from the inert material of the feedstock contains mainly large pieces of metals and other inorganic materials, like glass. The bed material can be roughly separated from the bottom ash by sieving. Bottom ashes from test trials CFB 03/42 and CFB 04/24 were sieved with a 1 mm sieve. The portion of the bed material fraction below 1.00 mm was about 73%, and the remaining part represented a coarser, metal-rich fraction. The bottom ashes from test trial CFB 05/05 were sieved with a 1.75 mm sieve, and the portion of the finer fraction varied from 71 to 86%. A sieve with larger holes was used because the bed material consisted of fine and coarse sand.
The input ash distributions in the bottom ash and the filter dust are presented in Figure 5. During test trial CFB 03/42, the bottom ash removed from the bed represented 74�84% of total inorganic material fed into the reactor, and in test trials CFB 04/24 and CFB 05/05, approximately 62�80% of the inorganic material accumulated in the bottom ash.
0
20
40
60
80
100
120
03/42A 03/42B 04/24B 05/5A 05/5B 05/5C 05/5D
Ash
dis
trib
utio
n, w
t% o
f inp
ut
Coarse bottom ash Fine bottom ash Filter dust
Figure 5. Distribution of input ash into bottom ash and filter dust at some set points.
27
Filter dust contains primarily unconverted carbon (char), the finest fraction of the bed material and inert matter of the feedstock and chlorine removal sorbent. Chlorine is also enriched into the filter dust. In practice, filter dust is a mixture of all the impurities of the original feedstock. Filter dust does not usually contain significant concentrations of any valuable components which could be recovered in an economically feasible way. The final disposal methods of the filter dust are restricted by the carbon content, PAH compounds, heavy metals and especially by the high leachability of the chlorine in the filter dust. The carbon and PAH content can be reduced by oxidation (combustion) of the filter dust, but soluble chloride requires specific processing. Chlorides and other soluble components can be reduced by washing the filter dust. Thermal treatment and washing increase ash-related costs, but the alternative could be an even more expensive disposal route. In any case, the volume of the filter dust has to be minimised in order to reduce overall operating costs.
The mass flows of the metals can be estimated based on the mass balance calculations, but the reliability of these estimations is not very good due to the heterogeneous composition of SR. However, these estimates illustrate the potential for metal recovery combined to industrial processes. The following results have been estimated for set point CFB 05/05B. The presented amount of each metal can be expected to be found in the coarse fraction (> 1.75 mm) of the bottom ash when 100 kg of SR is gasified:
Cu 1.4 kg/100 kg of gasified SR Al 0.25 kg/100 kg of gasified SR Zn 250 g/100 kg of gasified SR Ni 70 g/100 kg of gasified SR Pb 37 g/100 kg of gasified SR The coarse fraction of the bottom ash represented only 29% of all bottom ash. However, most of the fraction below 1.75 mm (71% of the bottom ash) consists of sand and bed additives, which reduces the feasibility of the metal recovery from this fine fraction.
At the industrial scale these figures have a significant positive influence on the economics of the plant. For example, when 100 000 t/a of SR is gasified (capacity of the gasifier at 80 MWth, lower heating value of SR at 20 MJ/kg, and 7000 annual operating hours) the annual recovery of copper would be 1400 t/a. The exact value of this copper can not be presented because it depends on impurities in the copper-containing coarse fraction of the bottom ash.
Most of the metals are enriched into the coarser fraction together with some other larger inert particles. This metal-rich fraction can be processed further with relatively simple separation techniques in order to recover metals. In SR-derived bottom ash, the most
28
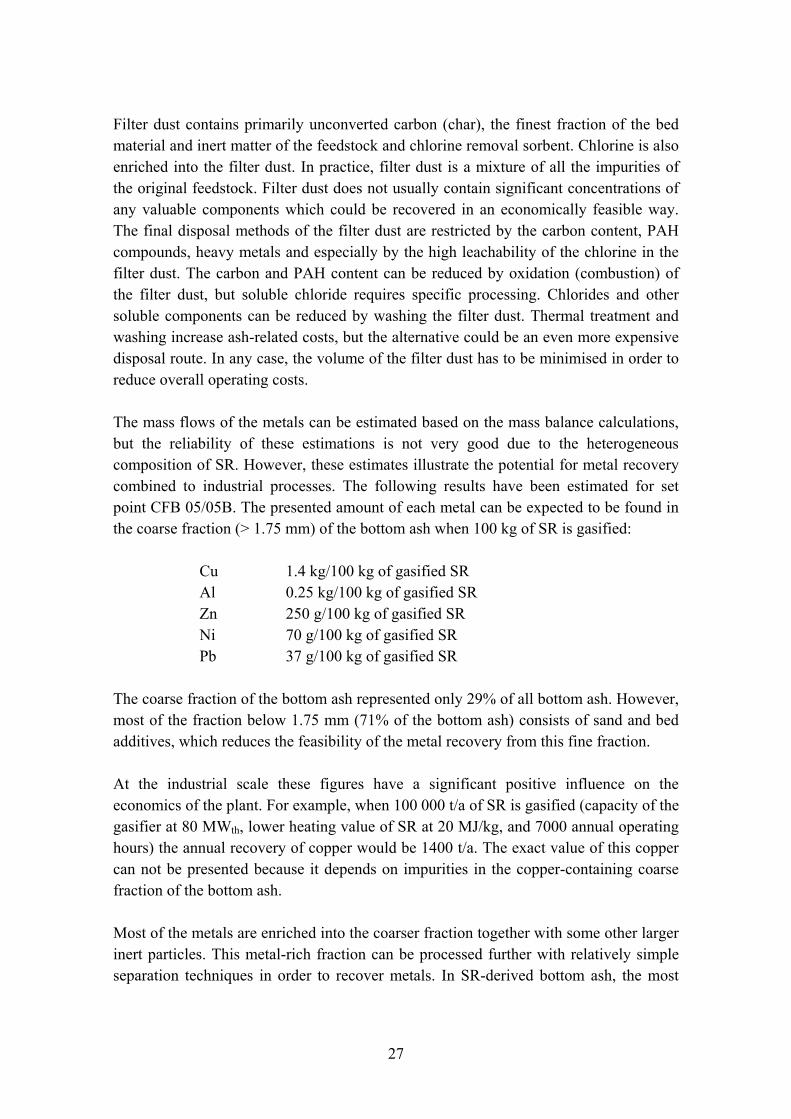
valuable metal is copper, which can be enriched by sieving to 8�15% concentration, depending on the copper content of the feedstock (Table 14). Enrichment can be continued further, for example by magnetic separation. The portion of the magnetic fraction of the coarse part of the bottom ash typically varied between 25 and 50%. For example, the coarse fraction of the bottom ash (Figure 6) at set point CFB 05/05B contained 15.5% of Cu. Removing the magnetic fraction (25.1%) enriched the Cu content in the non-magnetic fraction to 20.7%. Besides copper, the bottom ash contains a significant concentration of iron, which can also be separated magnetically. Examples of the actual mass flows of the main elements are shown in Table 15.
Metal recovery from the bottom ash looks very attractive. This is based on the increased degree of overall material recovery as well as on the reduction of disposal costs. It is expected that in the near future all material recycling and recovery will be favoured by the authorities, which will improve the economy of metal recovery from the bottom ash.
Table 14. Elemental composition of bottom ash in different fractions (wt-%) determined by ICP-MS, ICP-AES or semi-quantitative XRF (nd = not determined).
Set point Fraction
CFB 04/24A < 1 mm
CFB 04/24B< 1 mm
CFB 04/24 > 1 mm
CFB 05/05B < 1.75 mm
CFB 05/05B> 1.75 mm
Ag < 0.01 < 0.01 0.01 < 0.01 nd Al 3.0 3.7 4.6 5.4 2.8 Ba 0.52 0.55 0.5 0.27 nd Ca 22 13 4.0 4.7 nd Cr 0.01 0.03 0.3 0.09 nd Cu 1.8 1.5 8.3 2.1 15.5 Fe 6.4 8.2 nd 4.6 nd K 0.80 0.92 0.3 1.7 nd
Mg 0.79 0.71 0.9 0.55 nd Mn 0.06 0.09 0.1 0.07 nd Ni 0.01 0.02 0.3 0.05 0.78 Pb 0.01 0.02 0.06 0.12 0.41 Sb 0.01 0.01 0.01 0.03 nd Si 21 24 nd 28 nd Sn 0.01 0.02 0.05 0.009 nd Ti 0.26 0.35 nd 0.37 nd Zn 0.50 0.85 1.2 0.53 2.7
29
Figure 6. Coarse fraction of the bottom ash at set point CFB 05/05B.
Table 15. Actual mass flows of the main elements at set point CFB 05/05B.
Element Al Ca Cu Fe Si Zn
Input, mg/s Feedstock Bed material Sorbent
Total input
104.7 45.5 nd
150.3
240.3 24.4 228.6 493.3
135.0 0.0 nd
135.0
240.3 26.6 nd
266.9
289.6 455.1
nd 744.7
86.3 0.0 nd
86.3 Output, mg/s Bottom ash (< 1.75 mm) Bottom ash (> 1.75 mm) Filter dust
Total output
87.0 18.4 87.5 192.9
75.7 nd
328.0 403.8
34.6 102.0 52.9 189.6
74.1 nd
75.0 149.1
451.3
nd 78.1 529.4
8.5 17.8 26.6 52.9
30
4. Economic basis of SR gasification
4.1 Conditions
Shredder residue is a poor-quality fuel compared to conventional fuels, which means that energy recovery from SR is a significantly more demanding application than conventional energy production. This results in higher investment and operating costs for the thermal conversion process of SR. On the other hand, there are not too many alternative treatment or disposal routes for SR, and each of them requires a gate fee. The size of the gate fee depends on national and local conditions and so far it varies widely around Europe. However, several EU directives regulate the disposal of SR, which will be seen in decreased landfilling and increased further treatment of SR. Directives having a direct influence on the utilisation of SR for energy recovery are especially related to end-of-life vehicles, landfilling and waste incineration.
One of the key objectives of this project was to assess the technical possibilities of applying air-blown gasification for the treatment of shredder residue, and the economic feasibility of this process concept. The technical feasibility was evaluated based on the experimental gasification test trials with authentic shredder residues reported in Chapter 2. The economic feasibility was assessed based on the technical evaluation and previous experience at VTT.
The economic evaluation was focused on the following applications:
− CFB-gasifier, gas cleaning, co-combustion in a large-scale boiler − Fixed-bed gasifier, gas cleaning, co-combustion in an industrial kiln.
The CFB-process concept was defined based on the results of the circulating fluidised-bed gasification test trials carried out at VTT in 2003�2005. The definition of a smaller-scale process concept was based on the previous experience of VTT, the characterisation of different qualities of shredder residue, and the results of the fluidised-bed gasification test trials. No experimental fixed-bed gasification work was carried out with SR.
The gasification test trials were short-term tests and they focused on the identification of potential problems related to the gasification of shredder residue, and on the preliminary evaluation of the technical feasibility of the process concept. Short-term gasification test trials do not give a reliable picture of the long-term operation of the process. However, this preliminary economic evaluation gives an indication of the feasibility of the studied applications.
31
4.2 Evaluated process concepts
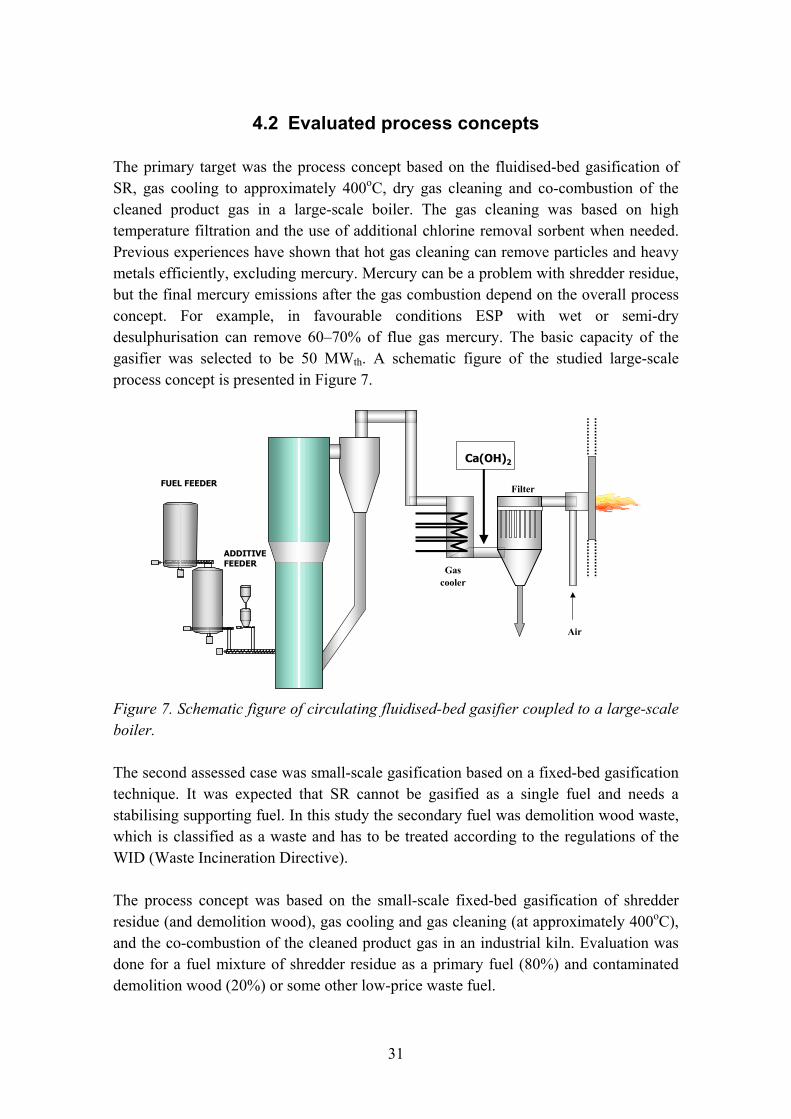
The primary target was the process concept based on the fluidised-bed gasification of SR, gas cooling to approximately 400oC, dry gas cleaning and co-combustion of the cleaned product gas in a large-scale boiler. The gas cleaning was based on high temperature filtration and the use of additional chlorine removal sorbent when needed. Previous experiences have shown that hot gas cleaning can remove particles and heavy metals efficiently, excluding mercury. Mercury can be a problem with shredder residue, but the final mercury emissions after the gas combustion depend on the overall process concept. For example, in favourable conditions ESP with wet or semi-dry desulphurisation can remove 60�70% of flue gas mercury. The basic capacity of the gasifier was selected to be 50 MWth. A schematic figure of the studied large-scale process concept is presented in Figure 7.
FUEL FEEDER
ADDITIVEFEEDER
Filter
Ca(OH)2
Gascooler
Air
Figure 7. Schematic figure of circulating fluidised-bed gasifier coupled to a large-scale boiler.
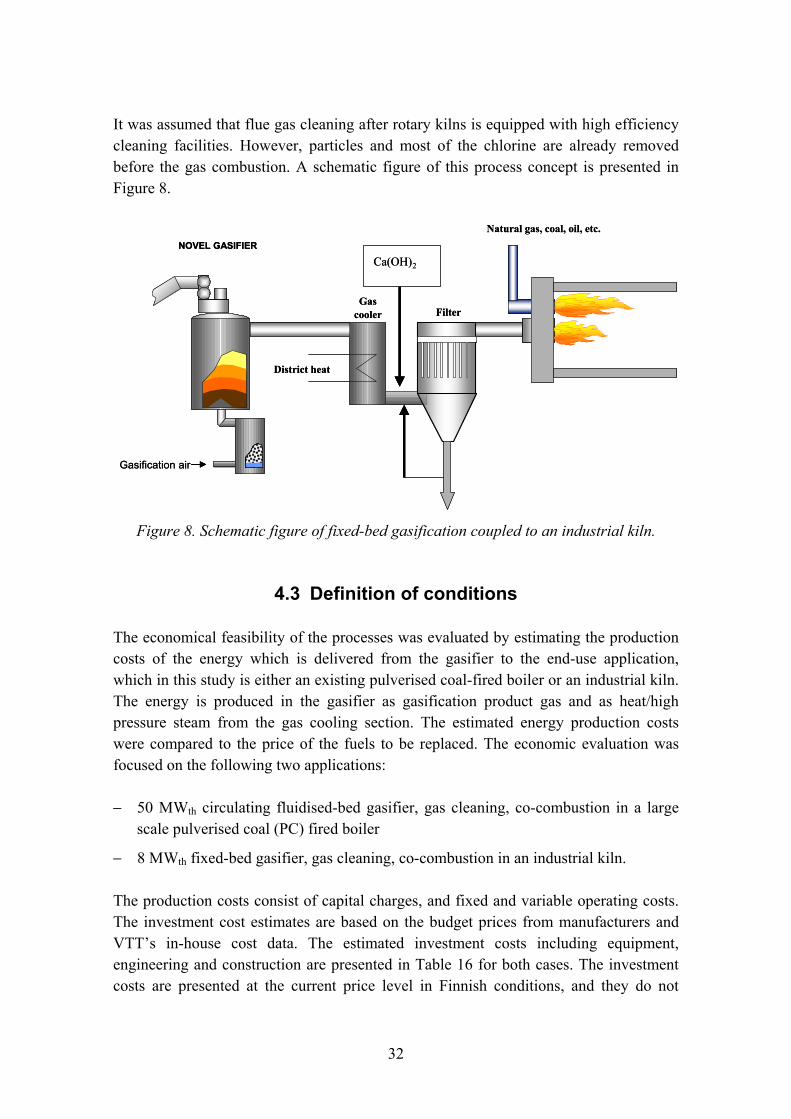
The second assessed case was small-scale gasification based on a fixed-bed gasification technique. It was expected that SR cannot be gasified as a single fuel and needs a stabilising supporting fuel. In this study the secondary fuel was demolition wood waste, which is classified as a waste and has to be treated according to the regulations of the WID (Waste Incineration Directive).
The process concept was based on the small-scale fixed-bed gasification of shredder residue (and demolition wood), gas cooling and gas cleaning (at approximately 400oC), and the co-combustion of the cleaned product gas in an industrial kiln. Evaluation was done for a fuel mixture of shredder residue as a primary fuel (80%) and contaminated demolition wood (20%) or some other low-price waste fuel.
32
It was assumed that flue gas cleaning after rotary kilns is equipped with high efficiency cleaning facilities. However, particles and most of the chlorine are already removed before the gas combustion. A schematic figure of this process concept is presented in Figure 8.
Gasification air
NOVEL GASIFIER
Filter
Ca(OH)2
Gascooler
District heat
Natural gas, coal, oil, etc.
Gasification air
NOVEL GASIFIER
Filter
Ca(OH)2
Gascooler
District heat
Natural gas, coal, oil, etc.
Figure 8. Schematic figure of fixed-bed gasification coupled to an industrial kiln.
4.3 Definition of conditions
The economical feasibility of the processes was evaluated by estimating the production costs of the energy which is delivered from the gasifier to the end-use application, which in this study is either an existing pulverised coal-fired boiler or an industrial kiln. The energy is produced in the gasifier as gasification product gas and as heat/high pressure steam from the gas cooling section. The estimated energy production costs were compared to the price of the fuels to be replaced. The economic evaluation was focused on the following two applications:
− 50 MWth circulating fluidised-bed gasifier, gas cleaning, co-combustion in a large scale pulverised coal (PC) fired boiler
− 8 MWth fixed-bed gasifier, gas cleaning, co-combustion in an industrial kiln.
The production costs consist of capital charges, and fixed and variable operating costs. The investment cost estimates are based on the budget prices from manufacturers and VTT�s in-house cost data. The estimated investment costs including equipment, engineering and construction are presented in Table 16 for both cases. The investment costs are presented at the current price level in Finnish conditions, and they do not
33
include taxes, contingencies, and interest during the construction period. The investment costs include the following items (as an extension to the main power plant system): equipment, automation, instrumentation, electrification, buildings and civil works, piping and valves, auxiliary equipment, balance of the plant, design and engineering, commissioning and start-up, and project management.
It should be noted that these preliminary feasibility assessments are meant to be general, while in practise the site conditions may have a strong impact on the required investment costs. The following local requirements may especially affect the total investment:
− fuel properties (the content of inert material), fuel handling requirements
− the space of the site and the distance between the fuel storage and the gasifier, as well as the distance between the gasifier and the boiler/kiln
− the required level of gas cleaning, which depends on the fuel quality, boiler/kiln design, existing flue gas cleaning facilities and the allowed emission limits.
Mass and energy balances and the operating costs of the studied process concepts are based on the results of the project�s other tasks and on VTT�s knowledge. The larger-scale process concept was defined based on the results of the circulating fluidised-bed gasification test trials carried out at VTT in this project.
The basic fuel properties used in this assessment are presented in Table 17. The shredder residues used in the gasification test trials contained a very high concentration of inert material. Separation of the inert material before gasification would result in improved fuel properties of the residual combustible fraction. In addition to the high inert content basic fuel, some assessment was also done using the properties of low inert content SR. The fuel properties for low inert content SR were taken from test trial CFB 05/05 (inert content approximately 35%). The effects of lower inert content on the process mass streams were taken into account respectively.
The basis for the evaluation was that the plants fulfil the requirements of the new EU Waste Incineration Directive (WID). The effects of the directive on costs were taken into account as follows: The additional annual measuring costs were estimated to be �60 000 per year. The investment costs of the measuring system, about �170 000, are included in the investment costs.
The EU Commission�s Decision of 3 May 2000, establishing the list of waste and hazardous waste, also defines the categories of the waste from waste treatment facilities. Fly ashes from waste combustion will be treated as a so-called mirror-entry action, which means that fly ashes will be categorised as ordinary waste or hazardous waste
34
based on the impurity composition of the material. The bottom ashes are not categorised as hazardous waste.
The fly ash disposal costs were estimated to be �150/t, and the bottom ash disposal costs �50/t. Some portion of the bottom ashes might also be recyclable and therefore worth some income.
The updated gasifier investment was estimated to be �26.1M. The investment costs are based on the following estimates: (1) project management and engineering �3.6M, (2) gasifier section �4.0M, (3) gas cooling and filtration section �3.8M, (4) PC boiler modifications and gas burners �0.9M, (5) electrification, instrumentation and automation �3.6M, (6) building and civil works �5.3M and (7) construction and commissioning �4.8M. Although the investment can be broken down into smaller pieces, gasifier, gas cooling, gas cleaning and connection to the boiler are technically strongly linked to each other and they cannot be separated into independent components.
35
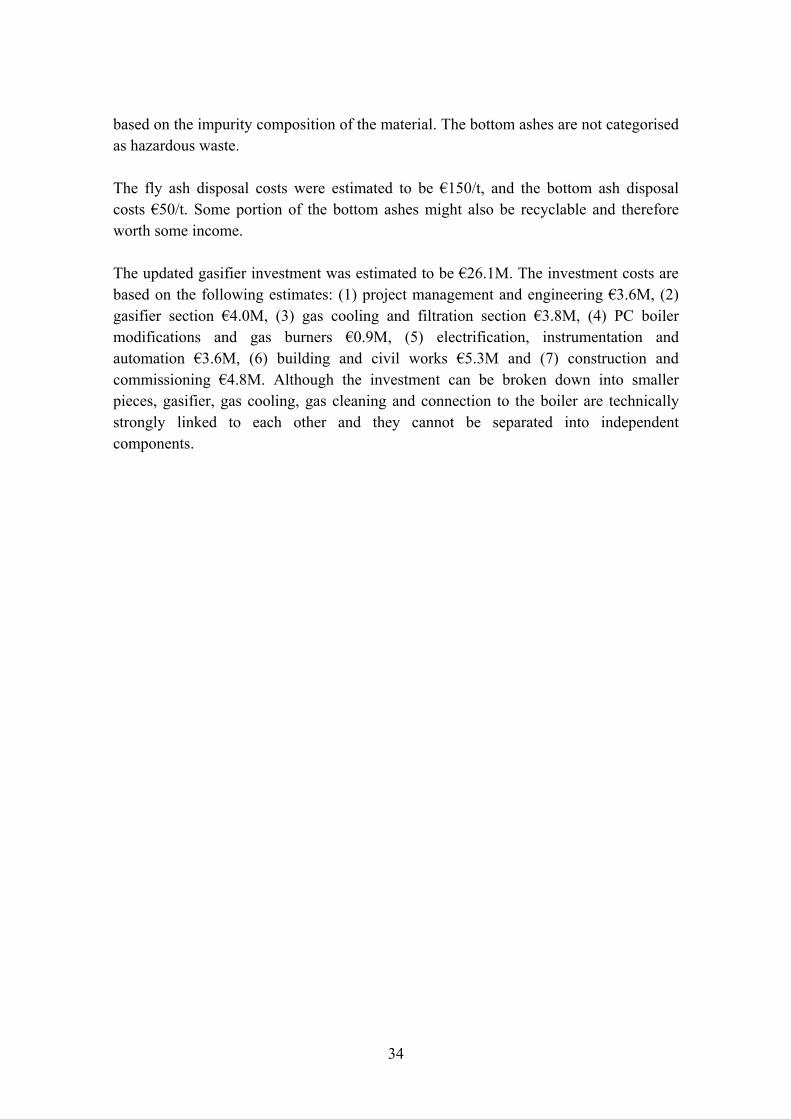
Table 16. Main factors and their values in the feasibility assessment.
Process concept CFB gasifier + PC boiler
Novel gasifier + industrial kiln
Gasifier capacity, MWfuel 50 (65 000�90 000 t/a annual
operation hours 5000�7000 )
8 (8 000�13 000 t/a annual
operation hours 5000�7000) Fuel 100% SR 80% SR (energy basis)
20% demolition wood Gasifier investment, � M 26.1 3.5 Plant life, a 15 15 Interest rate, % 5 5 SR gate fee, �/t 0�150 0�150 Demolition wood, �/MWh 0 Income from produced district heat, �/MWh
201
Fixed operating costs Labour costs/person, �/a 45 000 45 000 Additional personnel, persons 3 1 Maintenance & insurances, % of FCI2
2.5 2.5
Emission measurement costs (WID), �/a
60 000 60 000
Variable operating costs Operating time, h/a 5 500 7 920 Utilities � bed material, sorbents, nitrogen3
� internal power consumption4 � others, �/MWhfuel
0.05
0.05 Disposal costs of bottom ash, �/t 50 50 Disposal costs of fly ash, �/t 150 150 1 Based on the current average price of heavy fuel oil in Finland. 2 FCI = Fixed Capital Investment. 3 Bed material (based on the actual composition of the bed material in the Lahti gasifier, 2�2.5% of fuel), sorbents and nitrogen based on consumption in gasification tests. 4 Internal power consumption taken into account in the net efficiency of the system.
Table 17. Properties of SR used in the preliminary feasibility assessment.
Property Value Moisture content, wt-% 6.1 Ash content, wt-% 49.8 Lower heating value (dry), MJ/kg 14.9 Lower heating value (as received), MJ/kg 13.8
36
4.4 Results
4.4.1 Large-scale gasification (50 MWth) connected to a PC boiler
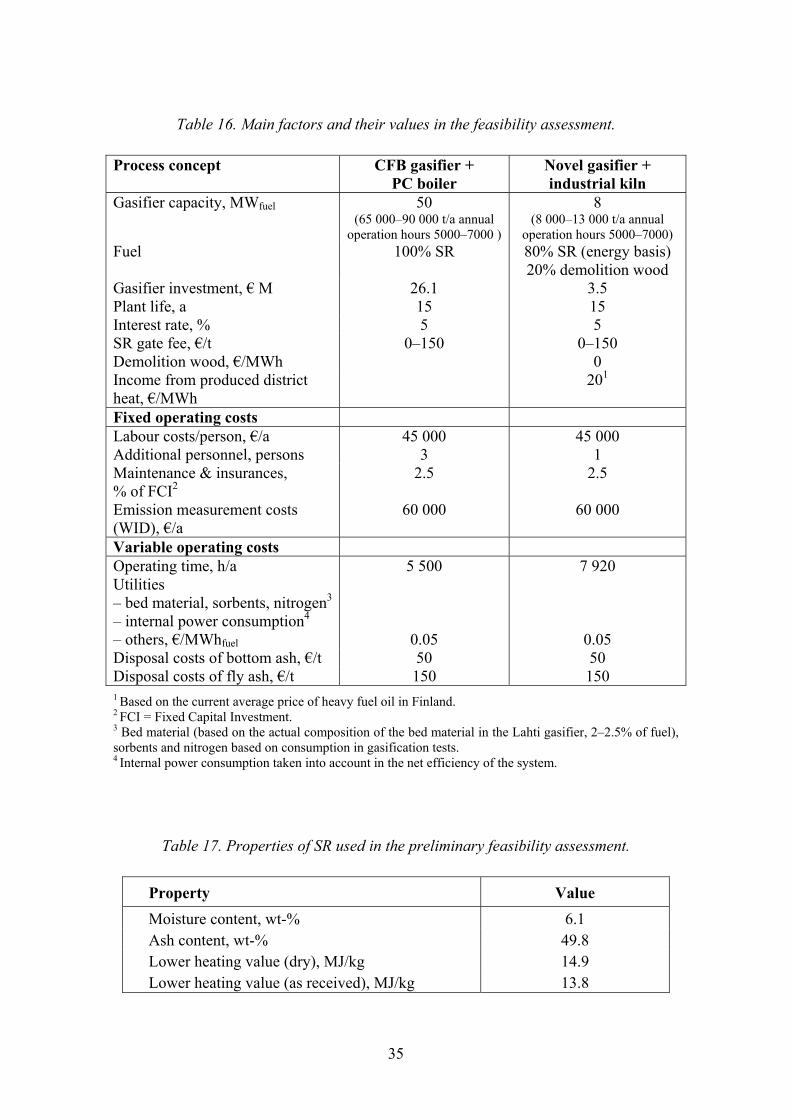
The primary process concept studied was CFB gasification of SR, the co-combustion of the produced fuel gas in an existing PC boiler, and the utilisation of the steam produced in the gas cooling section in the steam cycle of the existing power plant. A schematic picture of the process is presented in Figure 9.
SR�0-150/t
Bed material
Air Bottom ash disposal
CFB50 MWfuel
Sorbents
PC boiler
η =
Fly ash disposal
Heat from gas cooling utilisedas steam to steam cycle
Fuel gas + steam,
η = 95%
Coal
�/MWh
SR�0-150/t
Bed material
Air Bottom ash disposal
CFB50 MWfuel
Sorbents
PC boiler
η =
Fly ash disposal
Heat from gas cooling utilisedas steam to steam cycle
Fuel gas + steam,
η = 95%
Coal
�/MWh
Figure 9. Schematic flow sheet of the CFB gasifier connected to a coal PC boiler.
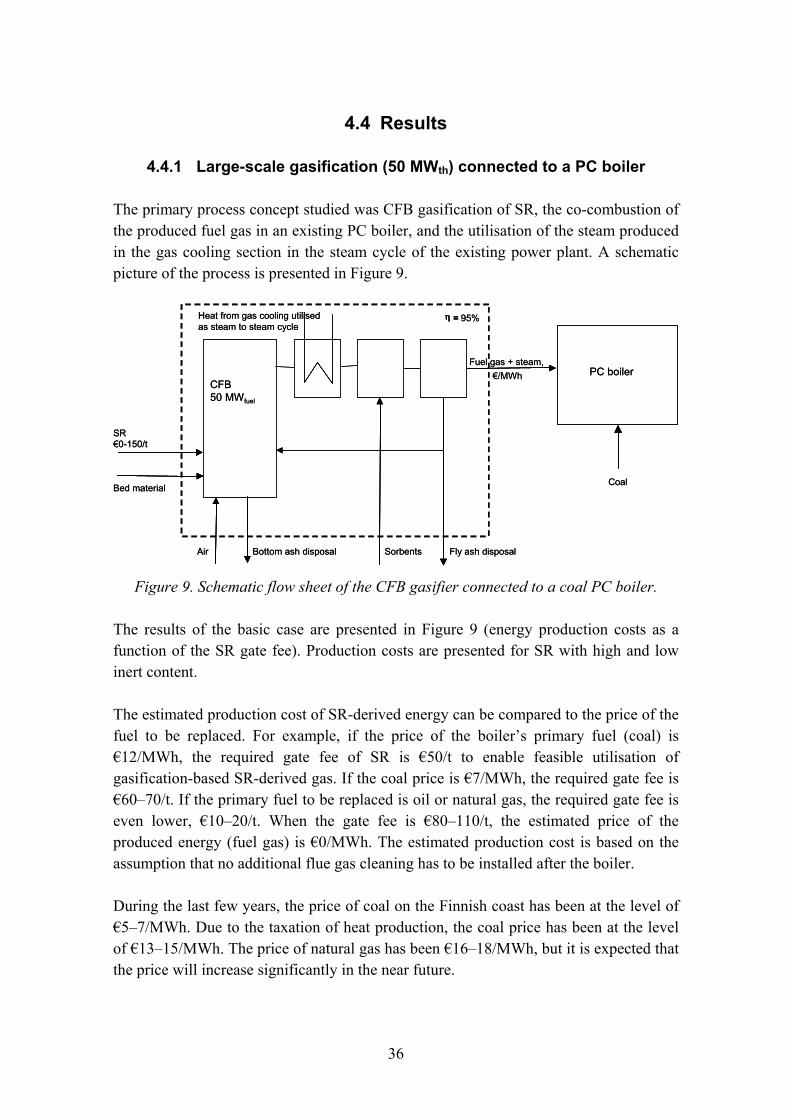
The results of the basic case are presented in Figure 9 (energy production costs as a function of the SR gate fee). Production costs are presented for SR with high and low inert content.
The estimated production cost of SR-derived energy can be compared to the price of the fuel to be replaced. For example, if the price of the boiler�s primary fuel (coal) is �12/MWh, the required gate fee of SR is �50/t to enable feasible utilisation of gasification-based SR-derived gas. If the coal price is �7/MWh, the required gate fee is �60�70/t. If the primary fuel to be replaced is oil or natural gas, the required gate fee is even lower, �10�20/t. When the gate fee is �80�110/t, the estimated price of the produced energy (fuel gas) is �0/MWh. The estimated production cost is based on the assumption that no additional flue gas cleaning has to be installed after the boiler.
During the last few years, the price of coal on the Finnish coast has been at the level of �5�7/MWh. Due to the taxation of heat production, the coal price has been at the level of �13�15/MWh. The price of natural gas has been �16�18/MWh, but it is expected that the price will increase significantly in the near future.
37
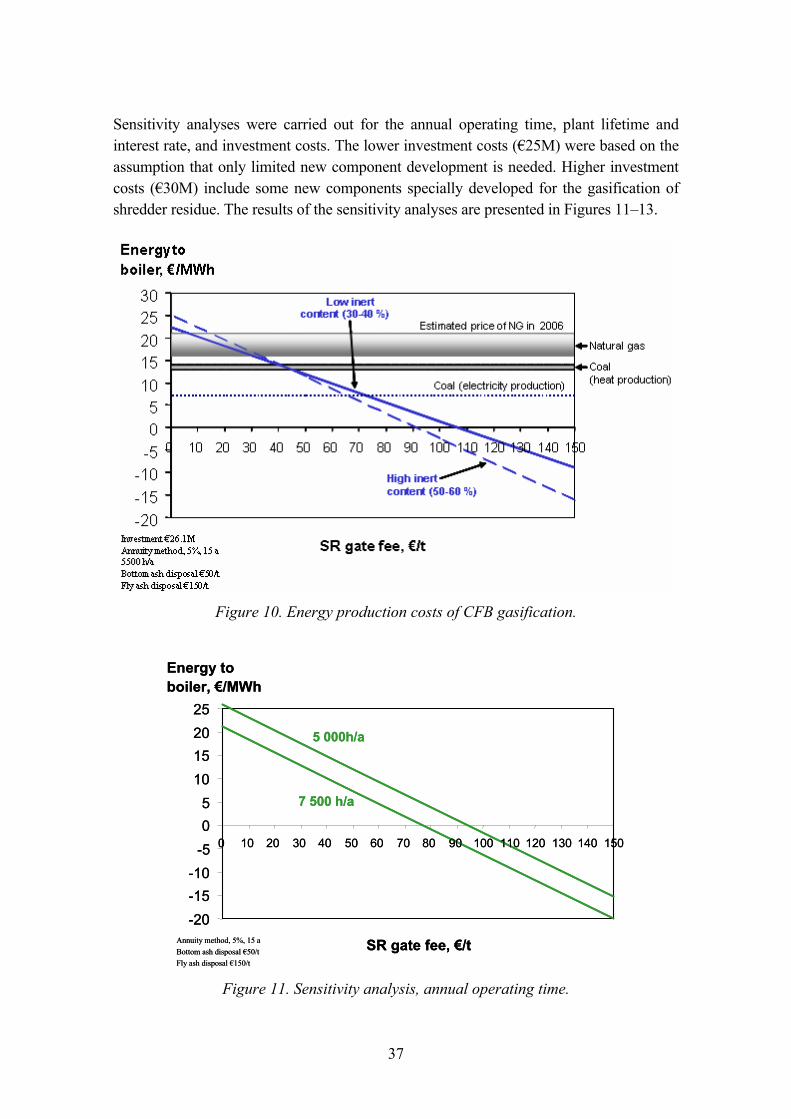
Sensitivity analyses were carried out for the annual operating time, plant lifetime and interest rate, and investment costs. The lower investment costs (�25M) were based on the assumption that only limited new component development is needed. Higher investment costs (�30M) include some new components specially developed for the gasification of shredder residue. The results of the sensitivity analyses are presented in Figures 11�13.
Figure 10. Energy production costs of CFB gasification.
-20-15-10
-505
10152025
0 10 20 30 40 50 60 70 80 90 100 110 120 130 140 150
SR gate fee, �/t
Energy to boiler, �/MWh
7 500 h/a
Annuity method, 5%, 15 aBottom ash disposal �50/tFly ash disposal �150/t
5 000h/a
-20-15-10
-505
10152025
0 10 20 30 40 50 60 70 80 90 100 110 120 130 140 150
SR gate fee, �/t
Energy to boiler, �/MWh
7 500 h/a
Annuity method, 5%, 15 aBottom ash disposal �50/tFly ash disposal �150/t
5 000h/a
Figure 11. Sensitivity analysis, annual operating time.
38
-20-15-10-505
10152025
10 20 30 40 50 60 70 80 90 100 110 120 130 140
Energy to boiler, �/MWh
10 a, 7%10 a, 5%
5500 h/a
15 a, 5%
-20-15-10-505
10152025
10 20 30 40 50 60 70 80 90 100 110 120 130 140
SR gate fee, �/t
Energy to boiler, �/MWh
10 a, 7%10 a, 5%
Annuity method
Bottom ash disposal �50/tFly ash disposal �150/t
15 a, 5%
-20-15-10-505
10152025
10 20 30 40 50 60 70 80 90 100 110 120 130 140
Energy to boiler, �/MWh
10 a, 7%10 a, 5%
5500 h/a
15 a, 5%
-20-15-10-505
10152025
10 20 30 40 50 60 70 80 90 100 110 120 130 140
SR gate fee, �/t
Energy to boiler, �/MWh
10 a, 7%10 a, 5%
Annuity method
Bottom ash disposal �50/tFly ash disposal �150/t
15 a, 5%
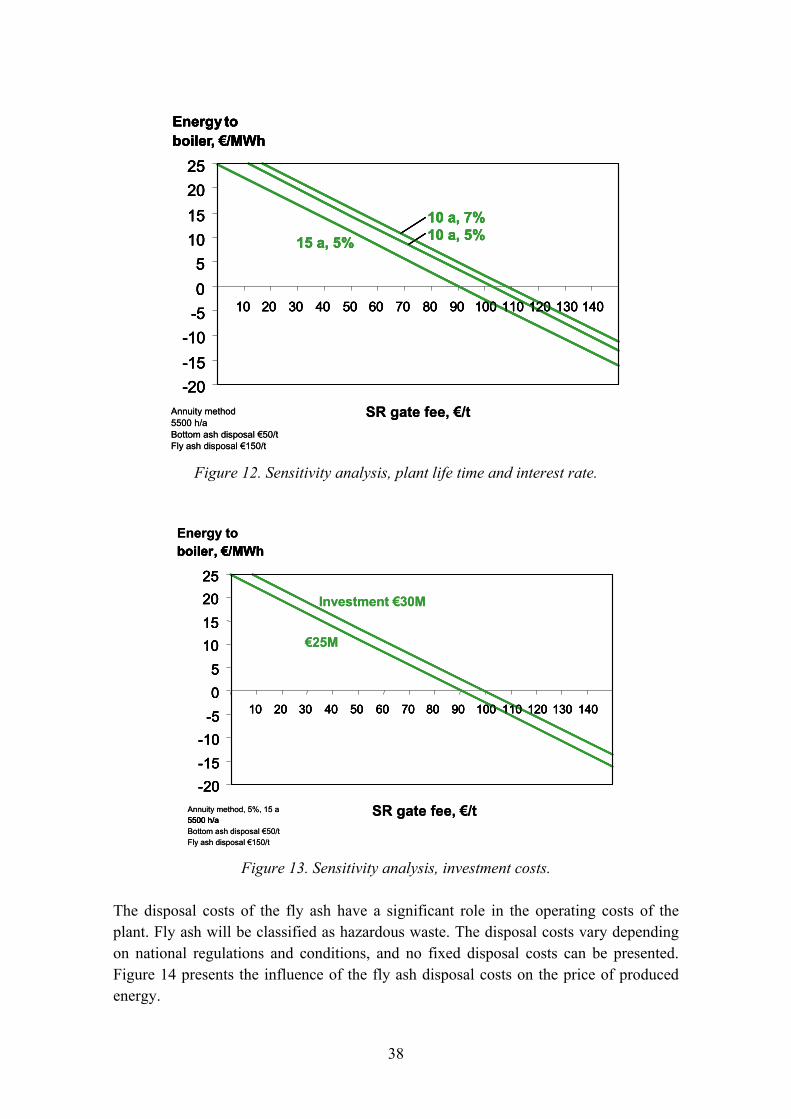
Figure 12. Sensitivity analysis, plant life time and interest rate.
-20-15-10
-505
10152025
10 20 30 40 50 60 70 80 90 100 110 120 130 140
boiler, �/MWh
5500 h/a
-20-15-10
-505
10152025
10 20 30 40 50 60 70 80 90 100 110 120 130 140
SR gate fee, �/t
Energy toboiler, �/MWh
�25M
Investment �30M
Annuity method, 5%, 15 a5500 h/aBottom ash disposal �50/tFly ash disposal �150/t
-20-15-10
-505
10152025
10 20 30 40 50 60 70 80 90 100 110 120 130 140
boiler, �/MWh
5500 h/a
-20-15-10
-505
10152025
10 20 30 40 50 60 70 80 90 100 110 120 130 140
SR gate fee, �/t
Energy toboiler, �/MWh
�25M
Investment �30M
Annuity method, 5%, 15 a5500 h/aBottom ash disposal �50/tFly ash disposal �150/t
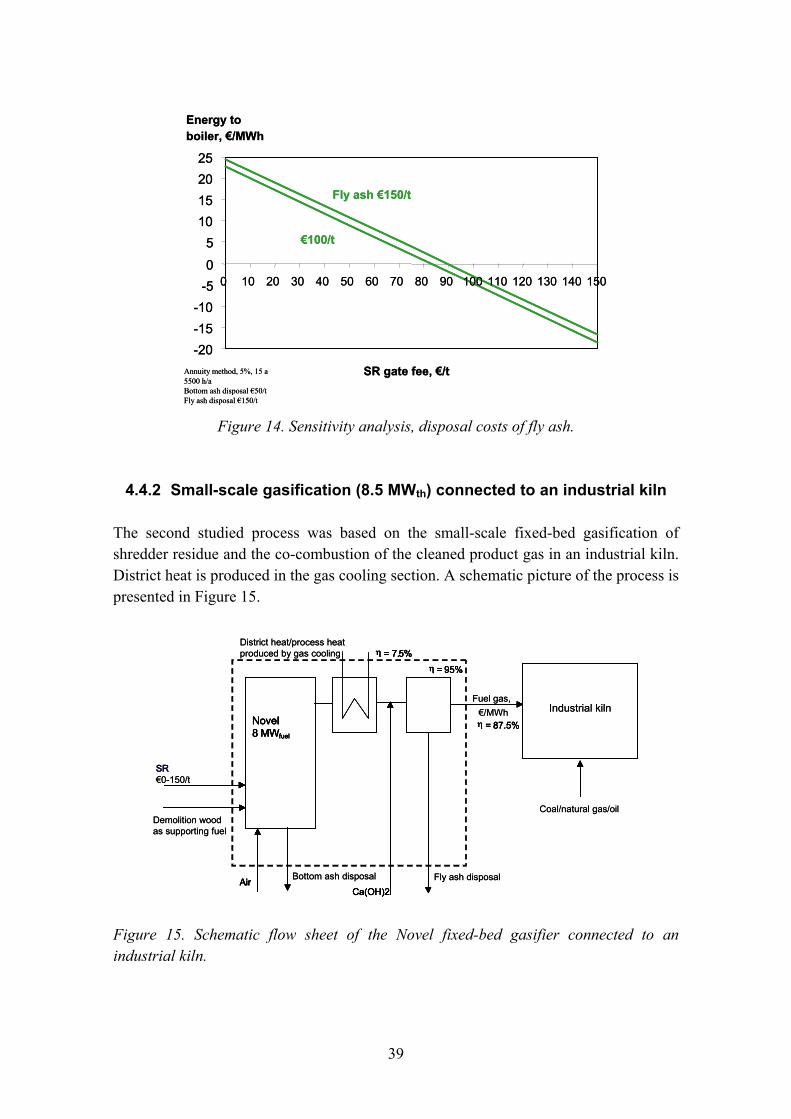
Figure 13. Sensitivity analysis, investment costs.
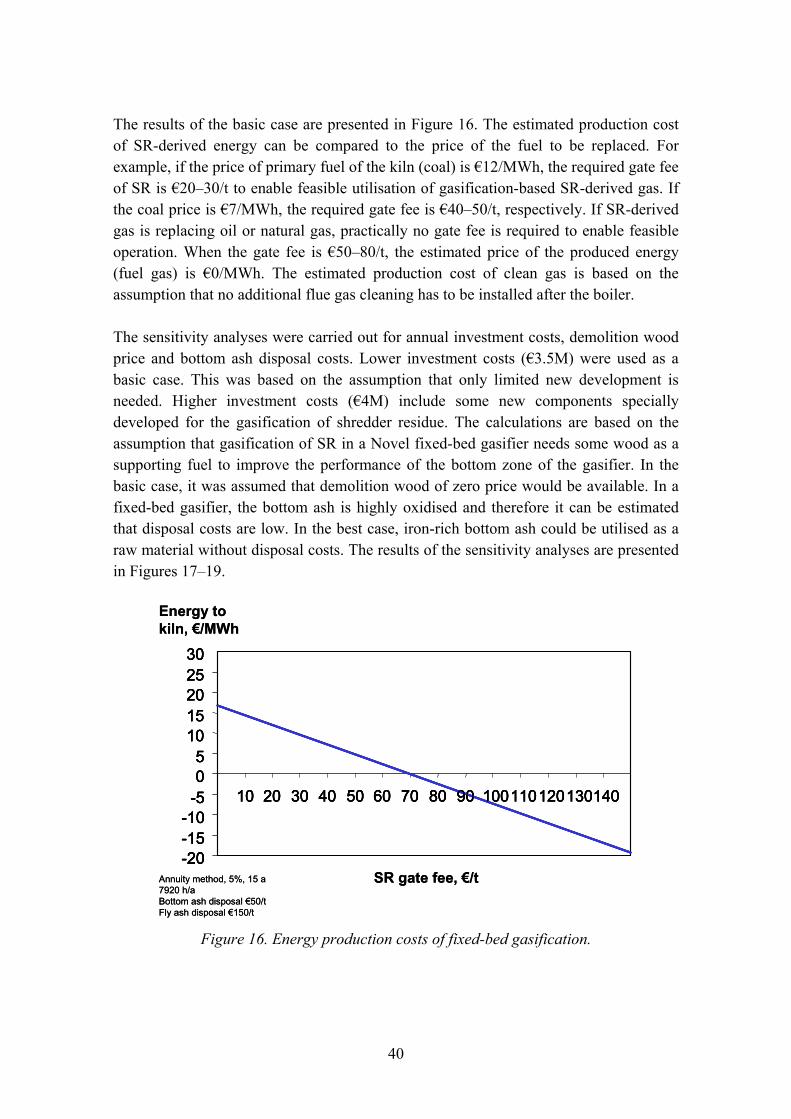
The disposal costs of the fly ash have a significant role in the operating costs of the plant. Fly ash will be classified as hazardous waste. The disposal costs vary depending on national regulations and conditions, and no fixed disposal costs can be presented. Figure 14 presents the influence of the fly ash disposal costs on the price of produced energy.
39
-20-15-10
-505
10152025
0 10 20 30 40 50 60 70 80 90 100 110 120 130 140 150
SR gate fee, �/t
Energy to boiler, �/MWh
�100/t
Fly ash �150/t
Annuity method, 5%, 15 a5500 h/aBottom ash disposal �50/tFly ash disposal �150/t
-20-15-10
-505
10152025
0 10 20 30 40 50 60 70 80 90 100 110 120 130 140 150
SR gate fee, �/t
Energy to boiler, �/MWh
�100/t
Fly ash �150/t
Annuity method, 5%, 15 a5500 h/aBottom ash disposal �50/tFly ash disposal �150/t
Figure 14. Sensitivity analysis, disposal costs of fly ash.
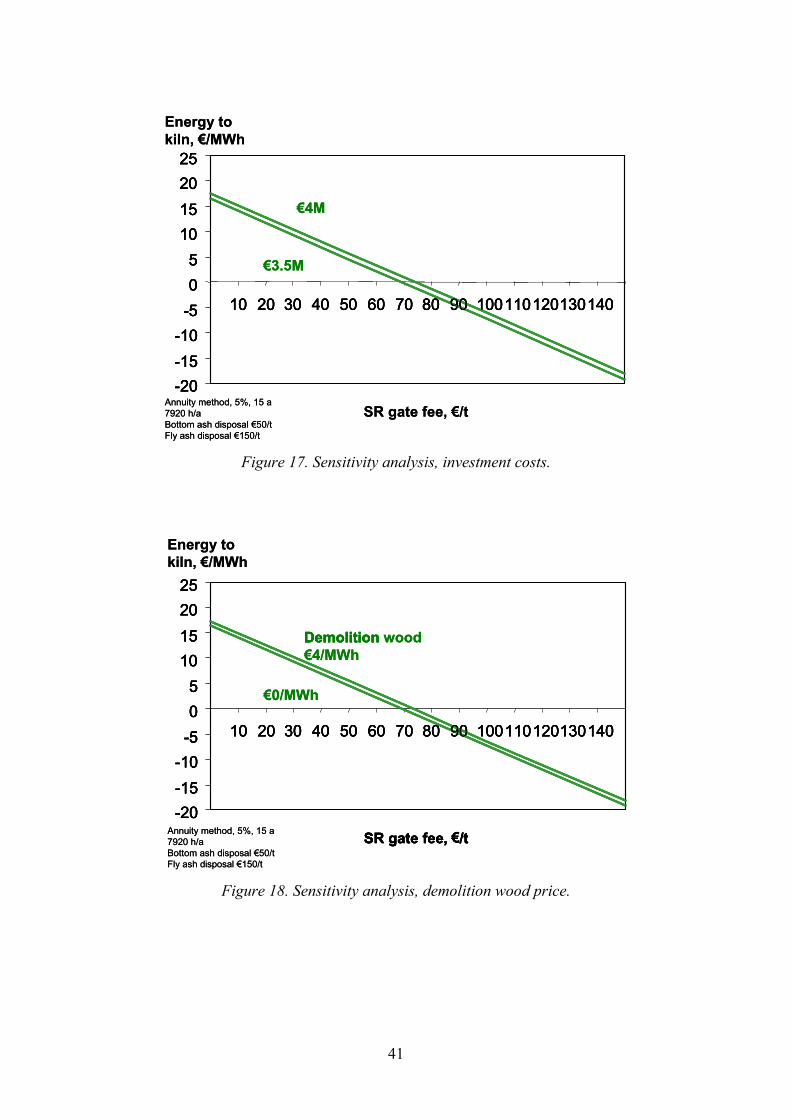
4.4.2 Small-scale gasification (8.5 MWth) connected to an industrial kiln
The second studied process was based on the small-scale fixed-bed gasification of shredder residue and the co-combustion of the cleaned product gas in an industrial kiln. District heat is produced in the gas cooling section. A schematic picture of the process is presented in Figure 15.
SR
Air
Novel8 MWfuel
�/MWh
η = 95%
η = 87.5%
η = 7.5%
Ca(OH)2
SR�0-150/t
Demolition woodas supporting fuel
Air Bottom ash disposal
Novel8 MWfuel
Fly ash disposal
Industrial kiln
District heat/process heatproduced by gas cooling
Fuel gas,
η = 95%
η = 87.5%
η = 7.5%
Ca(OH)2
Coal/natural gas/oil
SR
Air
Novel8 MWfuel
�/MWh
η = 95%
η = 87.5%
η = 7.5%
Ca(OH)2
SR�0-150/t
Demolition woodas supporting fuel
Air Bottom ash disposal
Novel8 MWfuel
Fly ash disposal
Industrial kiln
District heat/process heatproduced by gas cooling
Fuel gas,
η = 95%
η = 87.5%
η = 7.5%
Ca(OH)2
Coal/natural gas/oil
Figure 15. Schematic flow sheet of the Novel fixed-bed gasifier connected to an industrial kiln.
40
The results of the basic case are presented in Figure 16. The estimated production cost of SR-derived energy can be compared to the price of the fuel to be replaced. For example, if the price of primary fuel of the kiln (coal) is �12/MWh, the required gate fee of SR is �20�30/t to enable feasible utilisation of gasification-based SR-derived gas. If the coal price is �7/MWh, the required gate fee is �40�50/t, respectively. If SR-derived gas is replacing oil or natural gas, practically no gate fee is required to enable feasible operation. When the gate fee is �50�80/t, the estimated price of the produced energy (fuel gas) is �0/MWh. The estimated production cost of clean gas is based on the assumption that no additional flue gas cleaning has to be installed after the boiler.
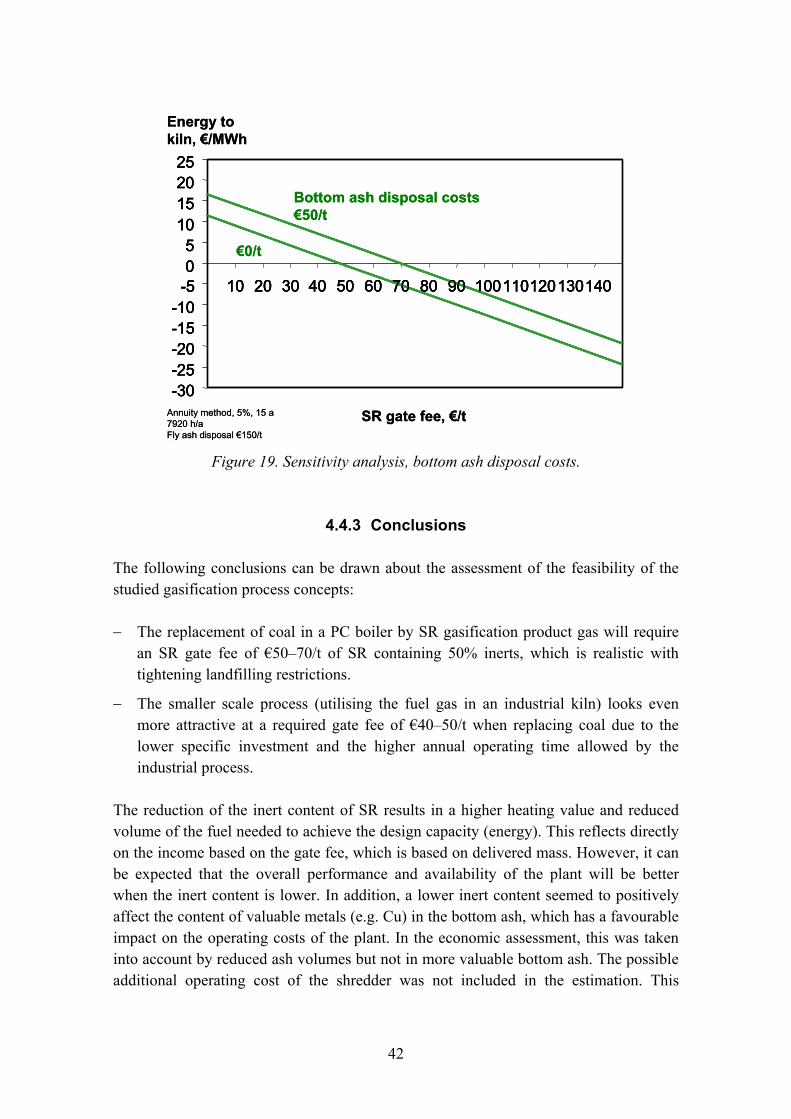
The sensitivity analyses were carried out for annual investment costs, demolition wood price and bottom ash disposal costs. Lower investment costs (�3.5M) were used as a basic case. This was based on the assumption that only limited new development is needed. Higher investment costs (�4M) include some new components specially developed for the gasification of shredder residue. The calculations are based on the assumption that gasification of SR in a Novel fixed-bed gasifier needs some wood as a supporting fuel to improve the performance of the bottom zone of the gasifier. In the basic case, it was assumed that demolition wood of zero price would be available. In a fixed-bed gasifier, the bottom ash is highly oxidised and therefore it can be estimated that disposal costs are low. In the best case, iron-rich bottom ash could be utilised as a raw material without disposal costs. The results of the sensitivity analyses are presented in Figures 17�19.
-20-15-10
-505
1015202530
10 20 30 40 50 60 70 80 90 100110120130140
-20-15-10
-505
1015202530
10 20 30 40 50 60 70 80 90 100110120130140
Energy tokiln, �/MWh
Annuity method, 5%, 15 a7920 h/aBottom ash disposal �50/tFly ash disposal �150/t
SR gate fee, �/t-20-15-10
-505
1015202530
10 20 30 40 50 60 70 80 90 100110120130140
-20-15-10
-505
1015202530
10 20 30 40 50 60 70 80 90 100110120130140
Energy tokiln, �/MWh
Annuity method, 5%, 15 a7920 h/aBottom ash disposal �50/tFly ash disposal �150/t
SR gate fee, �/t
Figure 16. Energy production costs of fixed-bed gasification.
41
-20-15-10
-505
10152025
10 20 30 40 50 60 70 80 90 100110120130140
-20-15-10
-505
10152025
10 20 30 40 50 60 70 80 90 100110120130140
SR gate fee, �/t
�3.5M
�4M
Annuity method, 5%, 15 a7920 h/aBottom ash disposal �50/tFly ash disposal �150/t
Energy tokiln, �/MWh
-20-15-10
-505
10152025
10 20 30 40 50 60 70 80 90 100110120130140
-20-15-10
-505
10152025
10 20 30 40 50 60 70 80 90 100110120130140
SR gate fee, �/t
�3.5M
�4M
Annuity method, 5%, 15 a7920 h/aBottom ash disposal �50/tFly ash disposal �150/t
Energy tokiln, �/MWh
Figure 17. Sensitivity analysis, investment costs.
-20-15-10
-505
10152025
10 20 30 40 50 60 70 80 90 100110120130140
SR gate fee, �/t
Demolition
-20-15-10
-505
10152025
10 20 30 40 50 60 70 80 90 100110120130140
SR gate fee, �/t
Demolition wood�4/MWh
�0/MWh
Annuity method, 5%, 15 a7920 h/aBottom ash disposal �50/tFly ash disposal �150/t
Energy tokiln, �/MWh
-20-15-10
-505
10152025
10 20 30 40 50 60 70 80 90 100110120130140
SR gate fee, �/t
Demolition
-20-15-10
-505
10152025
10 20 30 40 50 60 70 80 90 100110120130140
SR gate fee, �/t
Demolition wood�4/MWh
�0/MWh
Annuity method, 5%, 15 a7920 h/aBottom ash disposal �50/tFly ash disposal �150/t
Energy tokiln, �/MWh
Figure 18. Sensitivity analysis, demolition wood price.
42
-30-25-20-15-10
-505
10152025
10 20 30 40 50 60 70 80 90 100110120130140
-30-25-20-15-10
-505
10152025
10 20 30 40 50 60 70 80 90 100110120130140
SR gate fee, �/t
�0/t
Bottom ash disposal costs�50/t
Annuity method, 5%, 15 a7920 h/aFly ash disposal �150/t
Energy tokiln, �/MWh
-30-25-20-15-10
-505
10152025
10 20 30 40 50 60 70 80 90 100110120130140
-30-25-20-15-10
-505
10152025
10 20 30 40 50 60 70 80 90 100110120130140
SR gate fee, �/t
�0/t
Bottom ash disposal costs�50/t
Annuity method, 5%, 15 a7920 h/aFly ash disposal �150/t
Energy tokiln, �/MWh
Figure 19. Sensitivity analysis, bottom ash disposal costs.
4.4.3 Conclusions
The following conclusions can be drawn about the assessment of the feasibility of the studied gasification process concepts:
− The replacement of coal in a PC boiler by SR gasification product gas will require an SR gate fee of �50�70/t of SR containing 50% inerts, which is realistic with tightening landfilling restrictions.
− The smaller scale process (utilising the fuel gas in an industrial kiln) looks even more attractive at a required gate fee of �40�50/t when replacing coal due to the lower specific investment and the higher annual operating time allowed by the industrial process.
The reduction of the inert content of SR results in a higher heating value and reduced volume of the fuel needed to achieve the design capacity (energy). This reflects directly on the income based on the gate fee, which is based on delivered mass. However, it can be expected that the overall performance and availability of the plant will be better when the inert content is lower. In addition, a lower inert content seemed to positively affect the content of valuable metals (e.g. Cu) in the bottom ash, which has a favourable impact on the operating costs of the plant. In the economic assessment, this was taken into account by reduced ash volumes but not in more valuable bottom ash. The possible additional operating cost of the shredder was not included in the estimation. This
43
additional cost is difficult to estimate, because while reducing the inert content the degree of metal recovery is increased. Improved metal recovery and reduction of the mass of reject material (SR) has a positive impact on the economy of the shredder.
Mercury cannot be removed with hot gas cleaning and therefore it needs specific attention. Mercury can be removed with flue gas cleaning facilities after the combustion of the product gas. The costs of mercury removal are not included in this economic evaluation.
44
5. Overall conclusions and recommendations
At present, the disposal of shredder residue (SR) is most commonly based on landfilling. However, landfilling will not be favoured in the near future and alternative methods have to be sought. This is caused by the tightening regulations related to the increased need to recover materials and energy, and stringent targets to reduce landfilling. SR contains a significant portion of inorganic material and plastic with a high energy content.
Air-blown fluidised-bed gasification is a potentially very useful technique to be applied for energy recovery from SR. The objectives of this project were to develop air-blown fluidised-bed gasification and gas cleaning for SR, to recover materials from gasification residues, and finally, to assess the feasibility and the economics of the process concept.
Experimental gasification test trials showed that SR can be gasified, but some critical issues were also identified. A high chlorine content together with calcium and alkali metals might result in deposit formation. This was detected on the air distributor of the test rig. However, the CFB gasification test rig was relatively small and it is expected that these problems could be solved in large-scale applications. Further research and development is needed to confirm this assumption.
The quality of the product gas was more or less as expected or even better, especially when low inert containing SR was gasified. Gas cleaning was efficient enough to remove the bulk of chlorine and almost all heavy metals. This dry gas cleaning technique is based on previous research and development at VTT and experiences from the gasification of different waste fractions (Solid Recovered Fuel/Refused Derived Fuel, sewage sludge, etc.) [4]. Metal recovery, especially from the bottom ash, seems technically feasible as well.
The economics of the two different process concepts was assessed, and both were shown to be feasible when a realistic gate fee for SR is applied. Feasibility is case�dependent, and therefore one universal value for a required gate fee cannot be defined. In the most favourable conditions, when SR-derived gas is replacing natural gas and process is equipped with efficient exhaust gas cleaning the need for gate fee is relatively low. The results of the economic assessment showed that, in favourable conditions, the feasible investment and operation of large-scale (50 MW) gasification of SR requires roughly �20�80/t gate fee, and at a small scale, roughly �20�50/t, depending on the price of the replaced fuel.
45
Although the results of the project were very promising some further research and development is still needed to apply this technology in large and commercial scale. The most critical questions are related to the air distributor and chlorine content of SR. Chlorine seems to have a significant role in the deposit formation but it also has a negative impact on economics of the whole process. A high chlorine content leads to an increased need for chlorine removal sorbent, which results in increased costs of sorbent, as well as in increased volumes and disposal costs of the filter dust. In practice, disposal or further utilisation of the filter dust is very expensive, primarily because of high leachability. Chlorides represent the most soluble components of the filter dust. The high leachability of chlorine is not the only impurity limiting landfilling of the fly ash. The carbon content, PAH compounds and heavy metals also have to be controlled.
Further development of this process concept should focus on avoiding these, primarily chlorine-related, problems. Many problems could be avoided if the chlorine could be removed or reduced from SR before feeding it into the gasifier. A reduced chlorine content also has a positive influence on the avoiding of corrosion in the gasification and gas cleaning sections. This development should be done in close co-operation with shredders, who produce SR. In addition to further research and development of pre-treatment, SR gasification and gas cleaning, as well as metal recovery from bottom ash, should be demonstrated, at least at pilot-scale. Pilot-scale demonstration is a favourable way to carry out the final research and development without too large financial and environmental risks.
46
References
1. Kurkela, E., Laatikainen, J. & Ståhlberg, P. Pressurized fluidized-bed gasification experiments with wood, peat and coal at VTT in 1991�1992. Part 1. Test facilities and gasification experiments with sawdust. Espoo 1993. Technical Research Centre of Finland, VTT Publications 161. 55 p. + app. 2 p. ISBN 951-38-4399-8.
2. Neeft, J. P. A., Knoef, H. A. M., Zielke, U., Sjöström, K., Hasler, P., Simell, P. A., Dorrington, M. A., Thomas, L., Abatzoglou, N., Deutsch, S., Greil, C., Buffinga, G. J., Brage, C. & Suomalainen, M. Guideline for Sampling and Analysis of Tar and Particles in Biomass Producer Gases. Version 3.3.2002.
3. Ståhlberg, P., Lappi, M., Kurkela, E., Simell, P. Oesch, P. & Nieminen, M. Sampling of contaminants from the product gas of biomass gasifiers. Espoo 1998. Technical Research Centre of Finland, VTT Research Notes 1903. ISBN 951-38-5297-0; 951-38-5298-9. http://virtual.vtt.fi/inf/pdf/tiedotteet/1998/T1903.pdf.
4. Nieminen, M. & Kurkela, E. Filtration of biomass and waste derived gasification product gas. Paper presented in Conf. Science in Thermal and Chemical Biomass Conversion. Vancouver, Canada, 30.8.�2.9.2004.
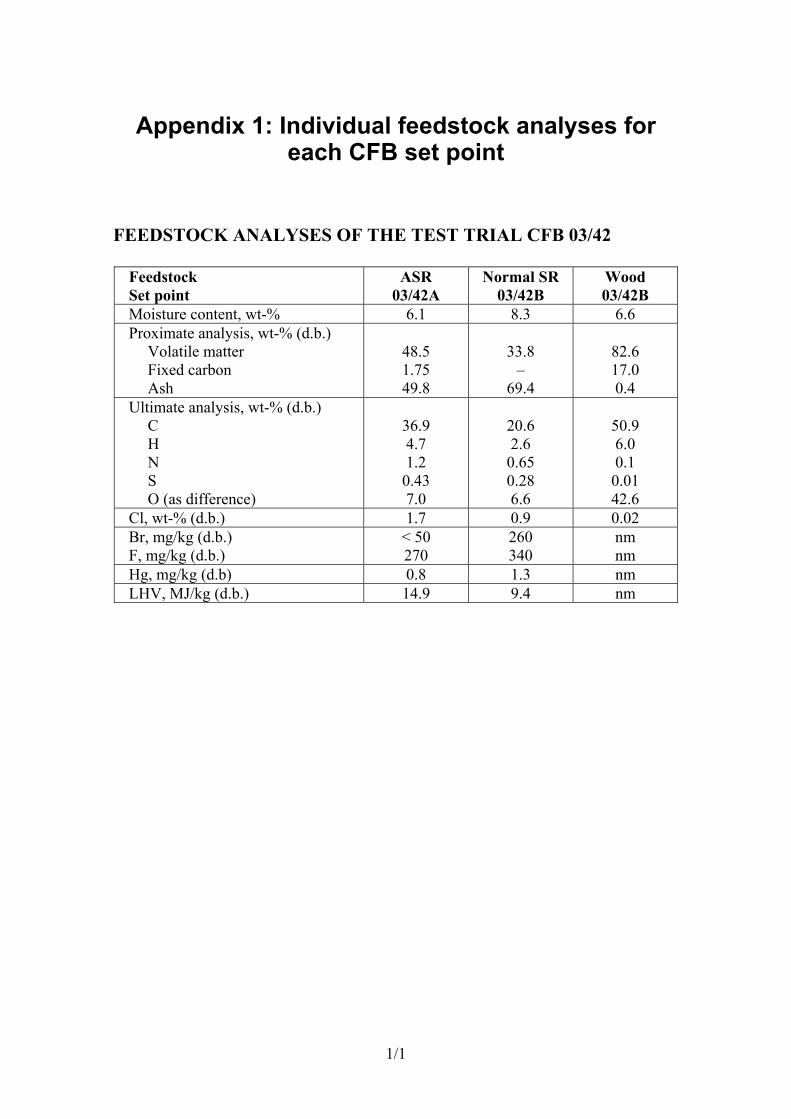
1/1
Appendix 1: Individual feedstock analyses for each CFB set point
FEEDSTOCK ANALYSES OF THE TEST TRIAL CFB 03/42
Feedstock Set point
ASR 03/42A
Normal SR 03/42B
Wood 03/42B
Moisture content, wt-% 6.1 8.3 6.6 Proximate analysis, wt-% (d.b.)
Volatile matter Fixed carbon Ash
48.5 1.75 49.8
33.8
� 69.4
82.6 17.0 0.4
Ultimate analysis, wt-% (d.b.) C H N S O (as difference)
36.9 4.7 1.2 0.43 7.0
20.6 2.6 0.65 0.28 6.6
50.9 6.0 0.1 0.01 42.6
Cl, wt-% (d.b.) 1.7 0.9 0.02 Br, mg/kg (d.b.) F, mg/kg (d.b.)
< 50 270
260 340
nm nm
Hg, mg/kg (d.b) 0.8 1.3 nm LHV, MJ/kg (d.b.) 14.9 9.4 nm
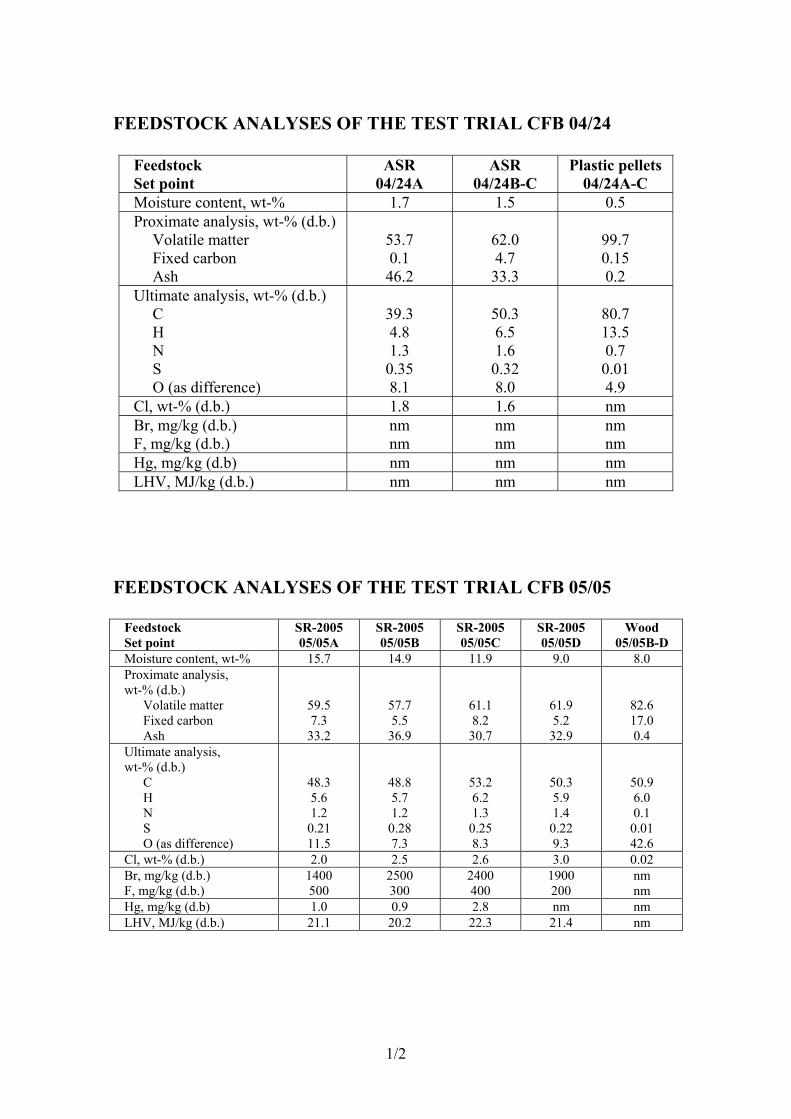
1/2
FEEDSTOCK ANALYSES OF THE TEST TRIAL CFB 04/24
Feedstock Set point
ASR 04/24A
ASR 04/24B-C
Plastic pellets 04/24A-C
Moisture content, wt-% 1.7 1.5 0.5 Proximate analysis, wt-% (d.b.)
Volatile matter Fixed carbon Ash
53.7 0.1 46.2
62.0 4.7 33.3
99.7 0.15 0.2
Ultimate analysis, wt-% (d.b.) C H N S O (as difference)
39.3 4.8 1.3 0.35 8.1
50.3 6.5 1.6 0.32 8.0
80.7 13.5 0.7 0.01 4.9
Cl, wt-% (d.b.) 1.8 1.6 nm Br, mg/kg (d.b.) F, mg/kg (d.b.)
nm nm
nm nm
nm nm
Hg, mg/kg (d.b) nm nm nm LHV, MJ/kg (d.b.) nm nm nm
FEEDSTOCK ANALYSES OF THE TEST TRIAL CFB 05/05
Feedstock Set point
SR-2005 05/05A
SR-2005 05/05B
SR-2005 05/05C
SR-2005 05/05D
Wood 05/05B-D
Moisture content, wt-% 15.7 14.9 11.9 9.0 8.0 Proximate analysis, wt-% (d.b.)
Volatile matter Fixed carbon Ash
59.5 7.3
33.2
57.7 5.5
36.9
61.1 8.2
30.7
61.9 5.2
32.9
82.6 17.0 0.4
Ultimate analysis, wt-% (d.b.)
C H N S O (as difference)
48.3 5.6 1.2
0.21 11.5
48.8 5.7 1.2
0.28 7.3
53.2 6.2 1.3
0.25 8.3
50.3 5.9 1.4
0.22 9.3
50.9 6.0 0.1
0.01 42.6
Cl, wt-% (d.b.) 2.0 2.5 2.6 3.0 0.02 Br, mg/kg (d.b.) F, mg/kg (d.b.)
1400 500
2500 300
2400 400
1900 200
nm nm
Hg, mg/kg (d.b) 1.0 0.9 2.8 nm nm LHV, MJ/kg (d.b.) 21.1 20.2 22.3 21.4 nm
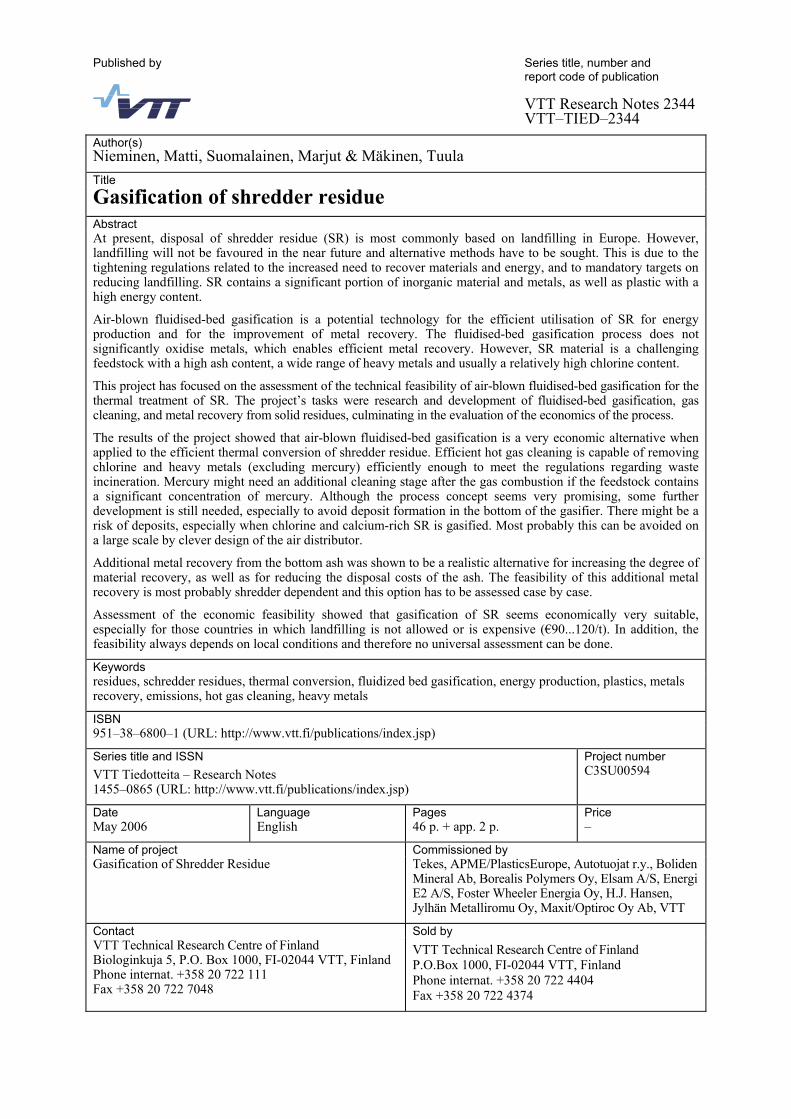
Published by
Series title, number and report code of publication
VTT Research Notes 2344VTT�TIED�2344
Author(s) Nieminen, Matti, Suomalainen, Marjut & Mäkinen, Tuula Title Gasification of shredder residue
Abstract At present, disposal of shredder residue (SR) is most commonly based on landfilling in Europe. However, landfilling will not be favoured in the near future and alternative methods have to be sought. This is due to the tightening regulations related to the increased need to recover materials and energy, and to mandatory targets on reducing landfilling. SR contains a significant portion of inorganic material and metals, as well as plastic with a high energy content.
Air-blown fluidised-bed gasification is a potential technology for the efficient utilisation of SR for energy production and for the improvement of metal recovery. The fluidised-bed gasification process does not significantly oxidise metals, which enables efficient metal recovery. However, SR material is a challenging feedstock with a high ash content, a wide range of heavy metals and usually a relatively high chlorine content.
This project has focused on the assessment of the technical feasibility of air-blown fluidised-bed gasification for the thermal treatment of SR. The project�s tasks were research and development of fluidised-bed gasification, gas cleaning, and metal recovery from solid residues, culminating in the evaluation of the economics of the process.
The results of the project showed that air-blown fluidised-bed gasification is a very economic alternative when applied to the efficient thermal conversion of shredder residue. Efficient hot gas cleaning is capable of removing chlorine and heavy metals (excluding mercury) efficiently enough to meet the regulations regarding waste incineration. Mercury might need an additional cleaning stage after the gas combustion if the feedstock contains a significant concentration of mercury. Although the process concept seems very promising, some further development is still needed, especially to avoid deposit formation in the bottom of the gasifier. There might be a risk of deposits, especially when chlorine and calcium-rich SR is gasified. Most probably this can be avoided on a large scale by clever design of the air distributor.
Additional metal recovery from the bottom ash was shown to be a realistic alternative for increasing the degree of material recovery, as well as for reducing the disposal costs of the ash. The feasibility of this additional metal recovery is most probably shredder dependent and this option has to be assessed case by case.
Assessment of the economic feasibility showed that gasification of SR seems economically very suitable, especially for those countries in which landfilling is not allowed or is expensive (�90...120/t). In addition, the feasibility always depends on local conditions and therefore no universal assessment can be done.
Keywords residues, schredder residues, thermal conversion, fluidized bed gasification, energy production, plastics, metals recovery, emissions, hot gas cleaning, heavy metals
ISBN 951�38�6800�1 (URL: http://www.vtt.fi/publications/index.jsp)
Series title and ISSN Project number VTT Tiedotteita � Research Notes 1455�0865 (URL: http://www.vtt.fi/publications/index.jsp)
C3SU00594
Date Language Pages Price May 2006 English 46 p. + app. 2 p. �
Name of project Commissioned by Gasification of Shredder Residue Tekes, APME/PlasticsEurope, Autotuojat r.y., Boliden
Mineral Ab, Borealis Polymers Oy, Elsam A/S, Energi E2 A/S, Foster Wheeler Energia Oy, H.J. Hansen, Jylhän Metalliromu Oy, Maxit/Optiroc Oy Ab, VTT
Contact Sold by VTT Technical Research Centre of Finland Biologinkuja 5, P.O. Box 1000, FI-02044 VTT, Finland Phone internat. +358 20 722 111 Fax +358 20 722 7048
VTT Technical Research Centre of Finland P.O.Box 1000, FI-02044 VTT, Finland Phone internat. +358 20 722 4404 Fax +358 20 722 4374
VTT RESEA
RCH N
OTES 2344G
asification of shredder residue
ISBN 951–38–6800–1 (URL: http://www.vtt.fi/inf/pdf/)ISSN 1455–0865 (URL: http://www.vtt.fi/inf/pdf/)
ESPOO 2006 VTT RESEARCH NOTES 2344
VTT Tiedotteita – Research Notes
2324 Kivisaari, Sirkku & Saranummi, Niilo. Terveydenhuollon systeemiset innovaatiotvuorovaikutteisen kehittämisen kohteena. Case Pro Viisikko. 2006. 77 s. + liitt. 4 s.
2325 Häkkinen, Tarja, Rauhala, Kari & Huovila, Pekka. Rakennetun ympäristönkestävän kehityksen kriteerit ja indikaattorit. 2006. 89 s. + liitt. 29 s.
2327 Security-tutkimuksen roadmap. Mika Naumanen & Veikko Rouhiainen (toim.).2006. 69 s.
2329 Heimonen, Ismo & Hemmilä, Kari. Tuloilmaikkunan energiatehokkuus. 2006. 65 s.+ liitt. 41 s.
2330 Apilo, Tiina & Taskinen, Tapani. Innovaatioiden johtaminen. 2006. 112 s. + liitt. 10 s.
2331 Niskanen, Antti. Työkalu luotettavuuden mallipohjaiseen analysointiin. 2006. 58 s.
2332 Kutinlahti, Pirjo, Lähteenmäki-Smith, Kaisa & Konttinen, Jari. Vaikuttavaatutkimusta. Arviointikäytäntöjä julkisissa tutkimusorganisaatioissa: Helia jaSAMK. 2006. 131 s. + liitt. 6 s.
2333 Hyytinen, Kirsi & Konttinen, Jari. Vaikuttavaa tutkimusta. Arviointikäytäntöjäjulkisissa tutkimusorganisaatioissa: Puolustusvoimien Teknillinen TutkimuslaitosPVTT. 2006. 77 p. + app. 5 p.
2334 Lähteenmäki-Smith, Kaisa & Hyytinen, Kirsi. Vaikuttavaa tutkimusta.Arviointikäytäntöjä julkisissa tutkimusorganisaatioissa: Maa- ja elintarvike-talouden tutkimuskeskus MTT. 2006. 89 s. + liitt. 1 s.
2335 SHOPS – Smart Home Payment Services. Towards the liberalisation of Europe'sutilities industry. 2006. 35 p.
2336 Lähteenmäki-Smith, Kaisa, Hyytinen, Kirsi, Kutinlahti, Pirjo & Konttinen, Jari.Research with an impact. Evaluation practises in public research organisations.2006. 79 p.
2337 The Finnish Research Programme on Nuclear Waste Management (KYT) 2002–2005.Final Report. Kari Rasilainen (ed.). 2006. 246 p. + app. 45 p.
2338 Martikainen, Antti. Ilmastonmuutoksen vaikutus sähköverkkoliiketoimintaan.2006. 74 s. + liitt. 5 s.
2339 Takasuo, Eveliina. Modeling of Pressurizer Using APROS and TRACE ThermalHydraulic Codes. 2006. 99 p. + app. 4 p.
2340 Modelling of multiphase chemical reactors (ModCheR). Final report. Manninen,Mikko (ed.). 2006. 181 p.
2341 Kara, Mikko. Electricity and emission allowance markets from Finnish viewpoint.Stydy. 2006. 105 p.
2342 Häkkinen, Tarja & Wirtanen, Leif. Metlan Joensuun tutkimuskeskuksen ympäristö-ja elinkaarinäkökohtien arviointi. 2006. 29 s.
2343 Alanen, Jarmo, Haataja, Kari, Laurila, Otto, Peltola, Jukka & Aho, Isto. Diagnosticsof mobile work machines. 2006. 123 p.
2344 Nieminen, Matti, Suomalainen, Marjut & Mäkinen, Tuula. Gasification of shredderresidue. 2006. 46 p. + app. 2 p.
2345 Lahti, Maria, Kantola, Kristiina, Kinnunen, Timo, Kivinen, Tuomo, Koivisto, Juha-Pekka, Kortekangas, Atte, Ollikainen, Ville, Virtanen, Tytti, Koskela, Hanna,Noppari, Elina & Sirkkunen, Esa. "Kato, nyt sää oot telkkarissa." DigitaalinenLähiTV paikallisyhteisöjen viestinnässä. 2006. 160 s. + liitt. 57 s.
Matti Nieminen, Marjut Suomalainen &Tuula Mäkinen
Gasification of shredder residue
VTT VTT VTTPL 1000 PB 1000 P.O. Box 1000
02044 VTT 02044 VTT FI-02044 VTT, FinlandPuh. 020 722 4404 Tel. 020 722 4404 Phone internat. + 358 20 722 4404Faksi 020 722 4374 Fax 020 722 4374 Fax + 358 20 722 4374