Embed Size (px)
Citation preview
TNC201031 May – 3 June, 2010 2
Carbon footprint?
the ‘carbon footprint’ measures the total greenhouse gas (GHG) emissions caused directly and indirectly by a person, organization, event or product
TNC201031 May – 3 June, 2010 3
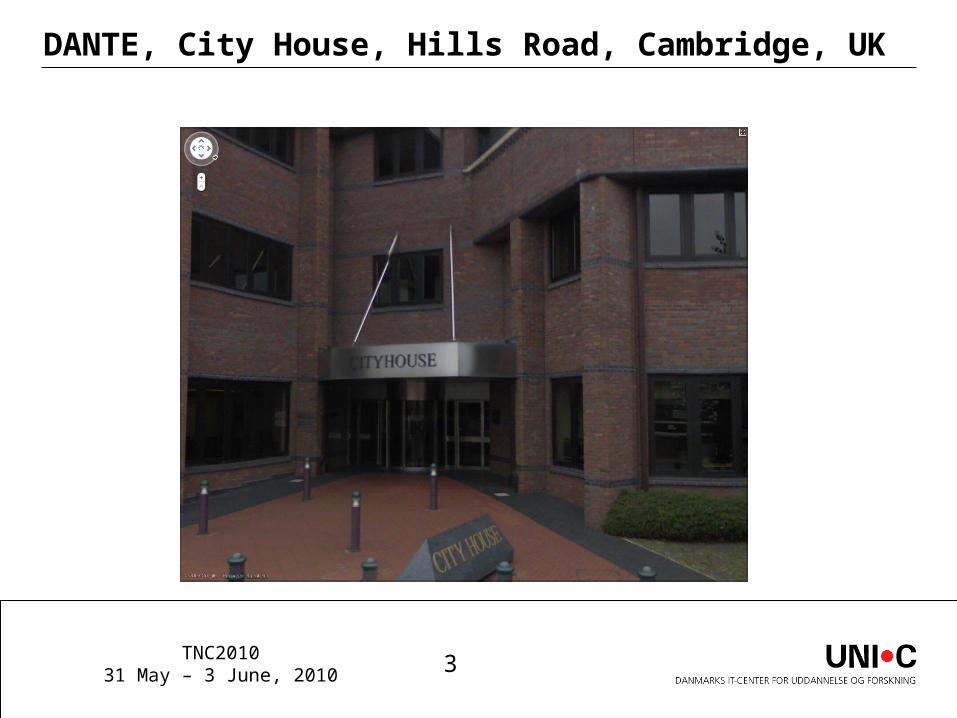
DANTE, City House, Hills Road, Cambridge, UK
TNC201031 May – 3 June, 2010 4
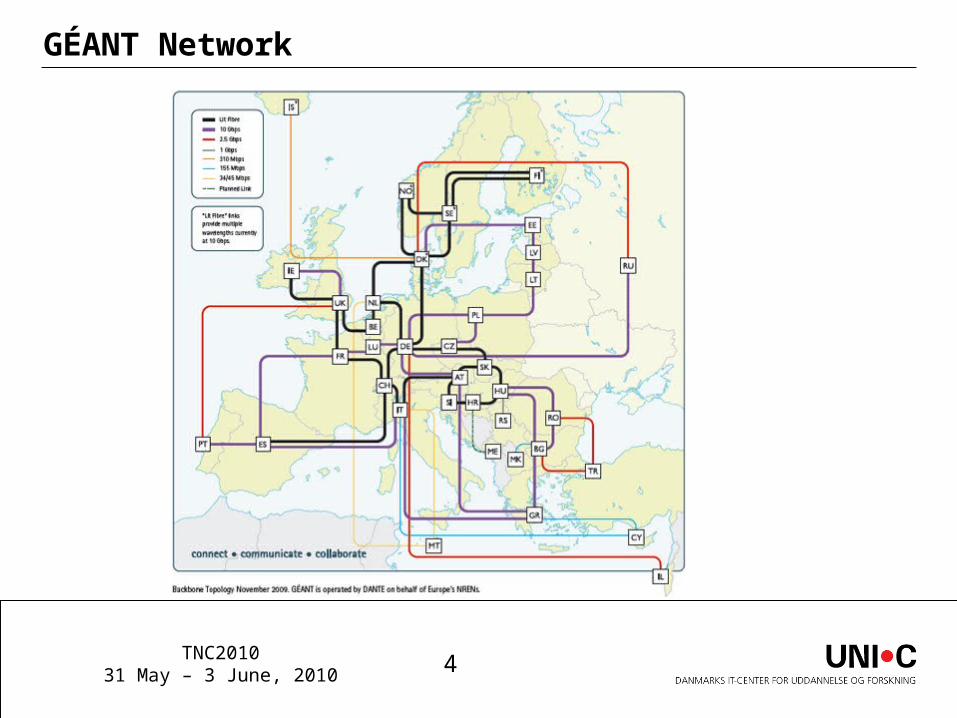
GÉANT Network
TNC201031 May – 3 June, 2010 5
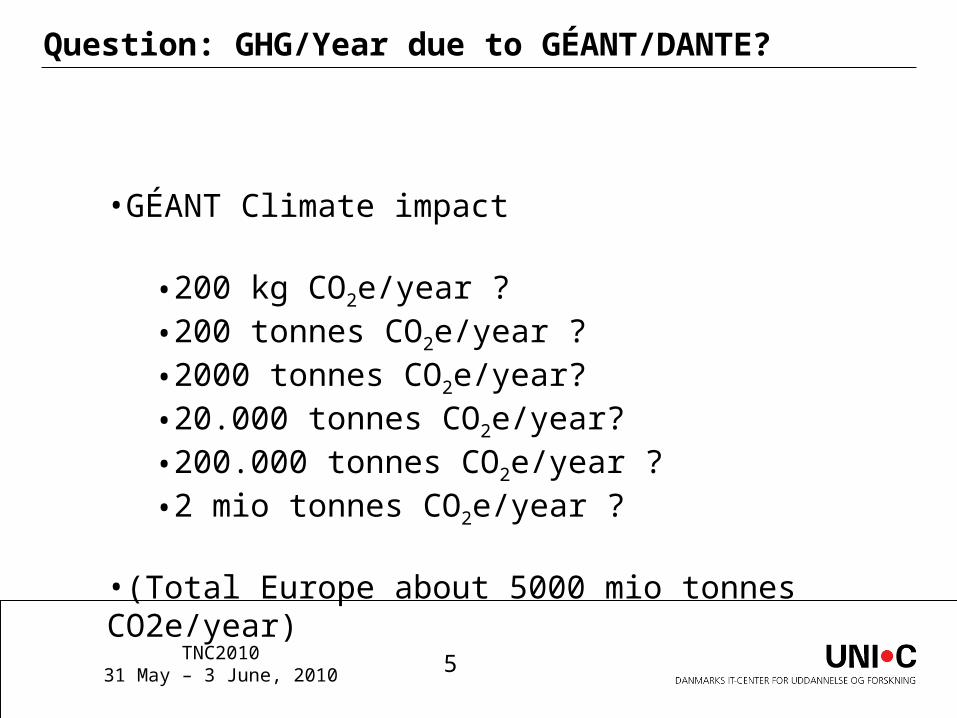
Question: GHG/Year due to GÉANT/DANTE?
•GÉANT Climate impact
•200 kg CO2e/year ?•200 tonnes CO2e/year ?•2000 tonnes CO2e/year?•20.000 tonnes CO2e/year?•200.000 tonnes CO2e/year ?•2 mio tonnes CO2e/year ?
•(Total Europe about 5000 mio tonnes CO2e/year)
TNC201031 May – 3 June, 2010 6
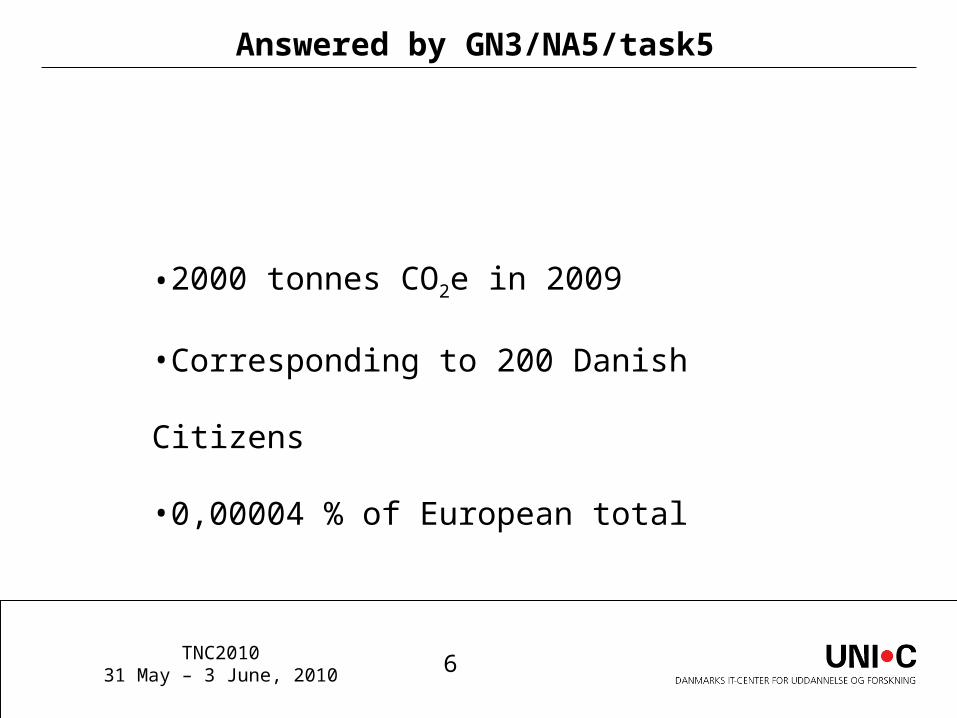
Answered by GN3/NA5/task5
•2000 tonnes CO2e in 2009
•Corresponding to 200 Danish Citizens
•0,00004 % of European total
TNC201031 May – 3 June, 2010 7
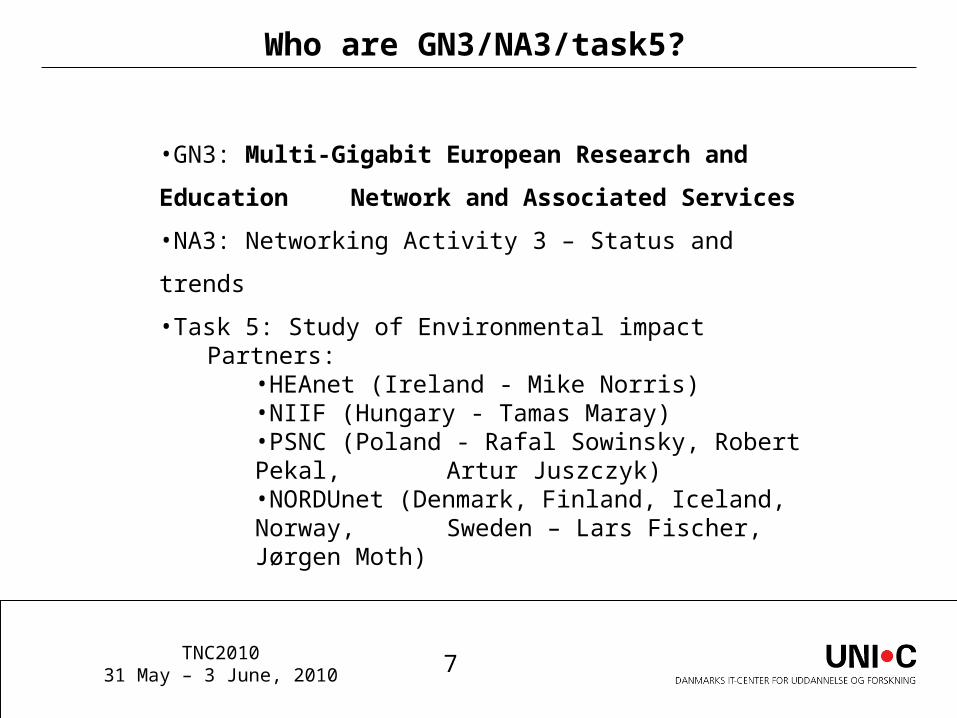
Who are GN3/NA3/task5?
•GN3: Multi-Gigabit European Research and Education
Network and Associated Services
•NA3: Networking Activity 3 – Status and trends
•Task 5: Study of Environmental impactPartners:
•HEAnet (Ireland - Mike Norris)•NIIF (Hungary - Tamas Maray)•PSNC (Poland - Rafal Sowinsky, Robert Pekal,
Artur Juszczyk)•NORDUnet (Denmark, Finland, Iceland, Norway,
Sweden – Lars Fischer, Jørgen Moth)

TNC201031 May – 3 June, 2010 8
GN3 Budget (Mio EURO)
0,8
181
NA3/task5 GN3
TNC201031 May – 3 June, 2010 9
How to calculate and report?
Use the ISO 14064 standard
TNC201031 May – 3 June, 2010 10
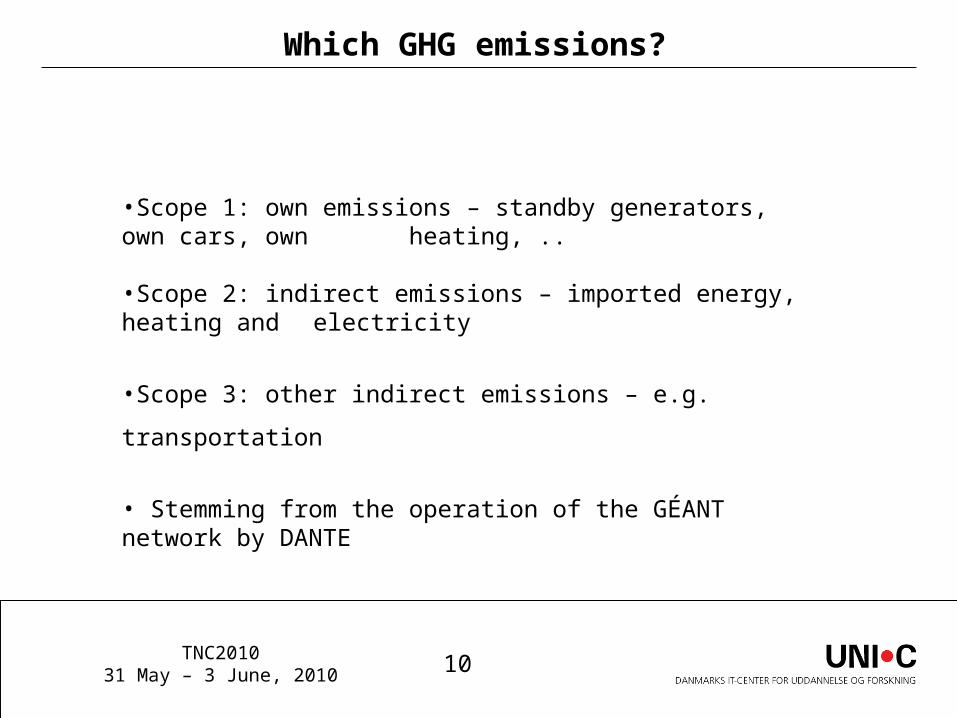
Which GHG emissions?
•Scope 1: own emissions – standby generators, own cars, own heating, ..
•Scope 2: indirect emissions – imported energy, heating and electricity
•Scope 3: other indirect emissions – e.g. transportation
• Stemming from the operation of the GÉANT network by DANTE
TNC201031 May – 3 June, 2010 11
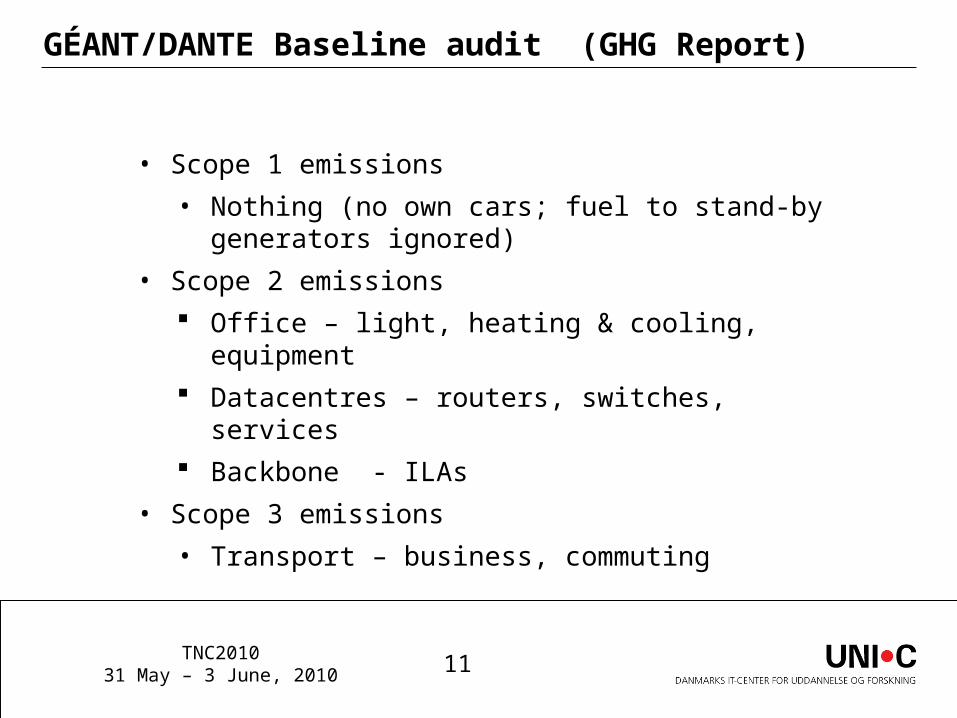
GÉANT/DANTE Baseline audit (GHG Report)
• Scope 1 emissions
• Nothing (no own cars; fuel to stand-by generators ignored)
• Scope 2 emissions
Office – light, heating & cooling, equipment
Datacentres – routers, switches, services
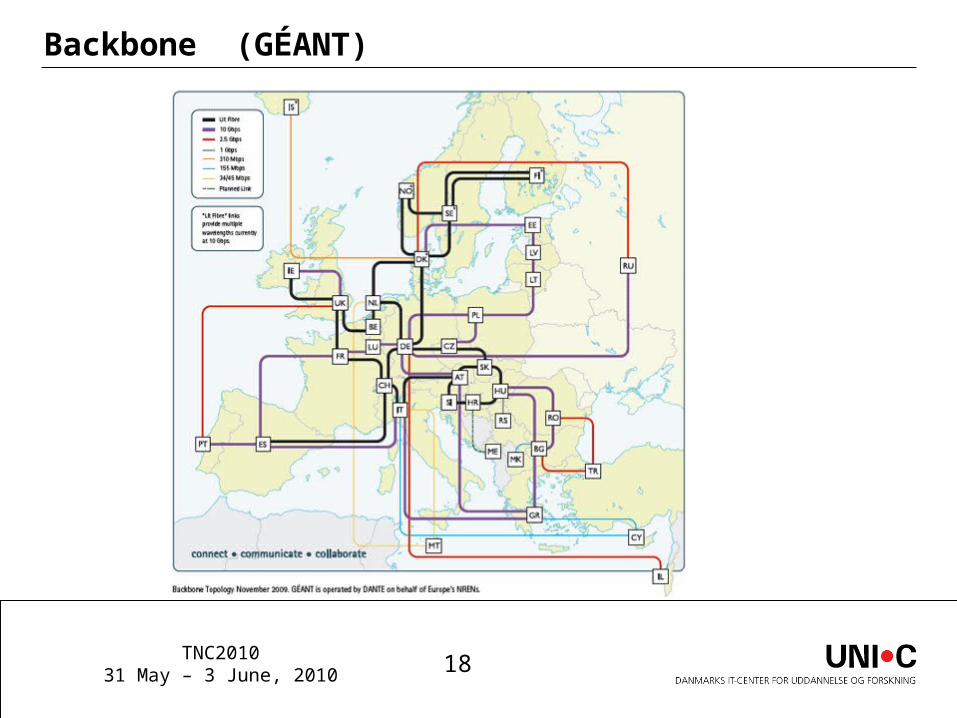
Backbone - ILAs
• Scope 3 emissions
• Transport – business, commuting
TNC201031 May – 3 June, 2010 12
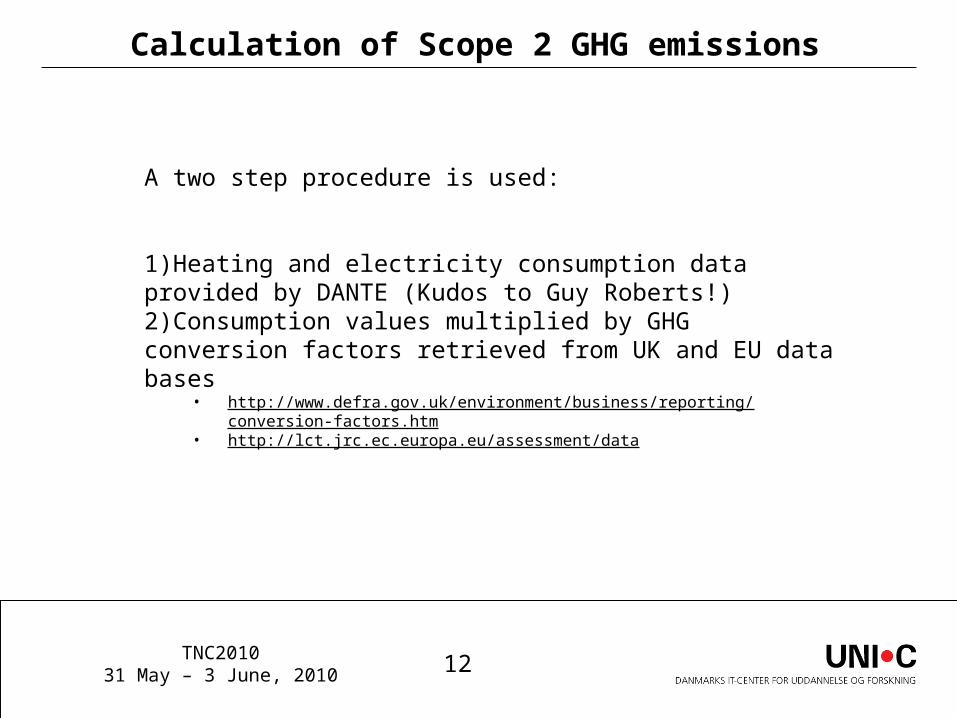
Calculation of Scope 2 GHG emissions
A two step procedure is used:
1)Heating and electricity consumption data provided by DANTE (Kudos to Guy Roberts!)2)Consumption values multiplied by GHG conversion factors retrieved from UK and EU data bases
• http://www.defra.gov.uk/environment/business/reporting/conversion-factors.htm• http://lct.jrc.ec.europa.eu/assessment/data
TNC201031 May – 3 June, 2010 13
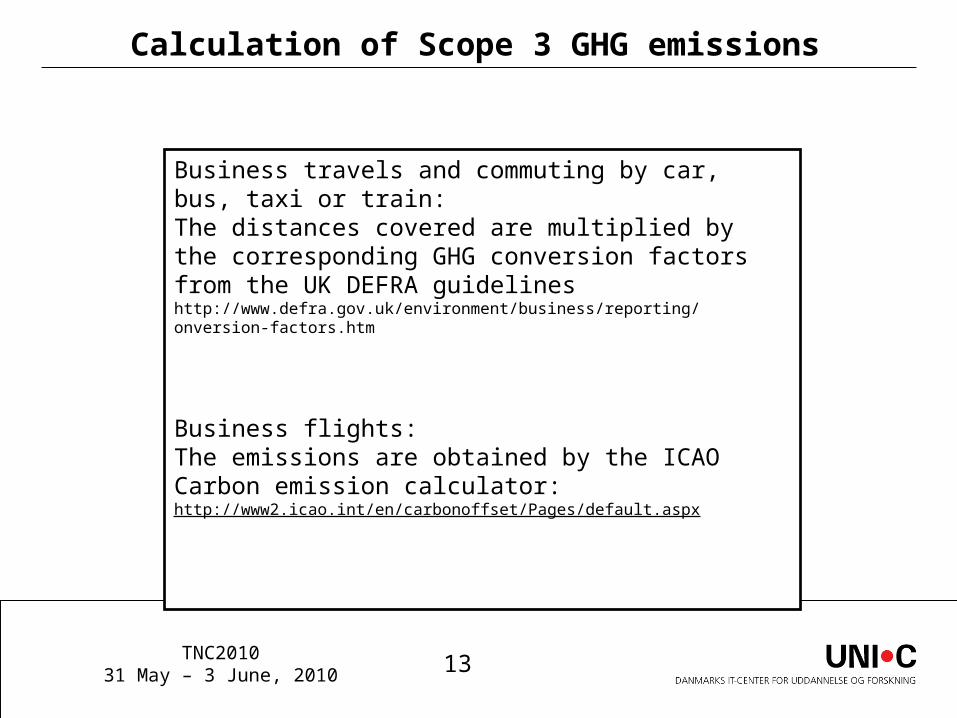
Calculation of Scope 3 GHG emissions
Business travels and commuting by car, bus, taxi or train:The distances covered are multiplied by the corresponding GHG conversion factors from the UK DEFRA guidelineshttp://www.defra.gov.uk/environment/business/reporting/ onversion-factors.htm
Business flights:The emissions are obtained by the ICAO Carbon emission calculator: http://www2.icao.int/en/carbonoffset/Pages/default.aspx

TNC201031 May – 3 June, 2010 14
Office
TNC201031 May – 3 June, 2010 15
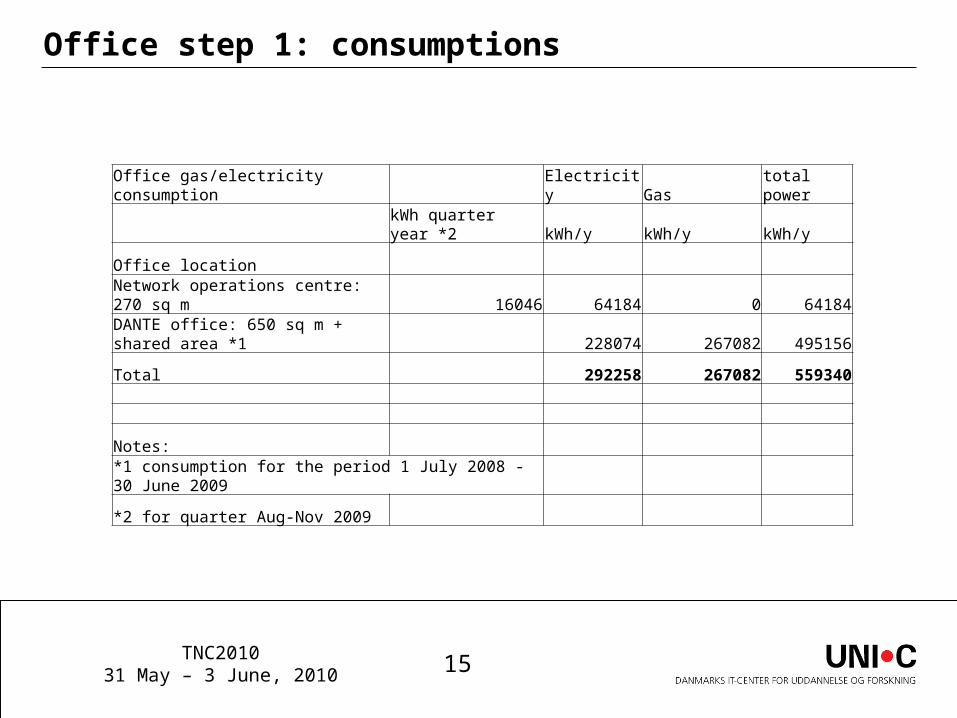
Office step 1: consumptions
Office gas/electricity consumption Electricity Gas total power
kWh quarter year *2 kWh/y kWh/y kWh/y
Office location
Network operations centre: 270 sq m 16046 64184 0 64184
DANTE office: 650 sq m + shared area *1 228074 267082 495156
Total 292258 267082 559340
Notes:
*1 consumption for the period 1 July 2008 - 30 June 2009
*2 for quarter Aug-Nov 2009
TNC201031 May – 3 June, 2010 16
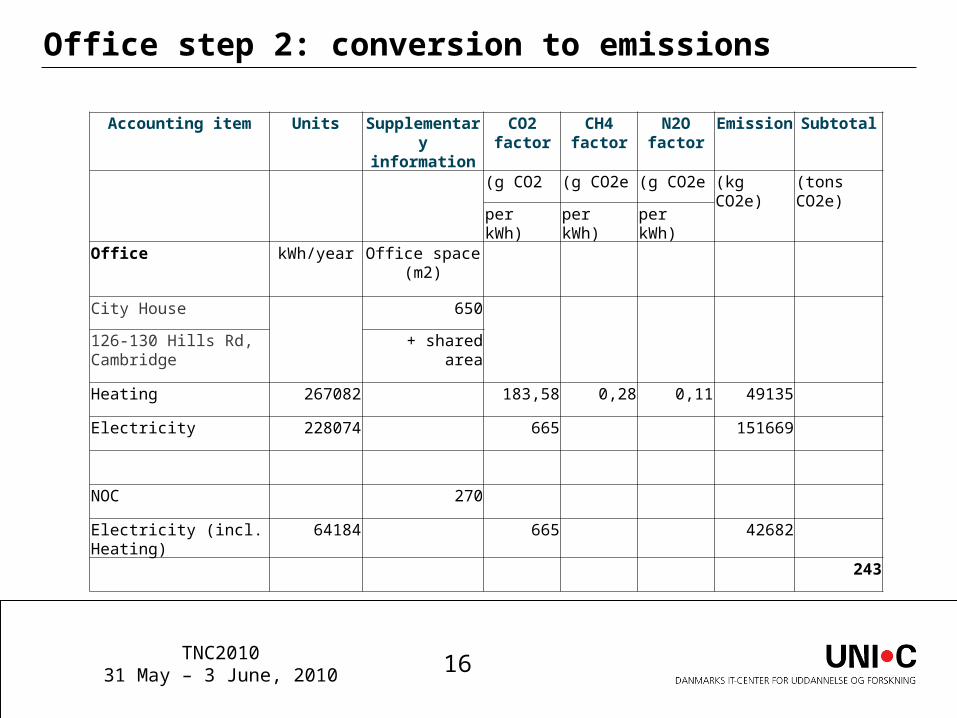
Office step 2: conversion to emissions
Accounting item Units Supplementary information
CO2 factor
CH4 factor
N2O factor
Emission Subtotal
(g CO2 (g CO2e (g CO2e (kg CO2e) (tons CO2e)
per kWh) per kWh) per kWh)
Office kWh/year Office space (m2)
City House 650
126-130 Hills Rd, Cambridge
+ shared area
Heating 267082 183,58 0,28 0,11 49135
Electricity 228074 665 151669
NOC 270
Electricity (incl. Heating) 64184 665 42682
243
TNC201031 May – 3 June, 2010 17
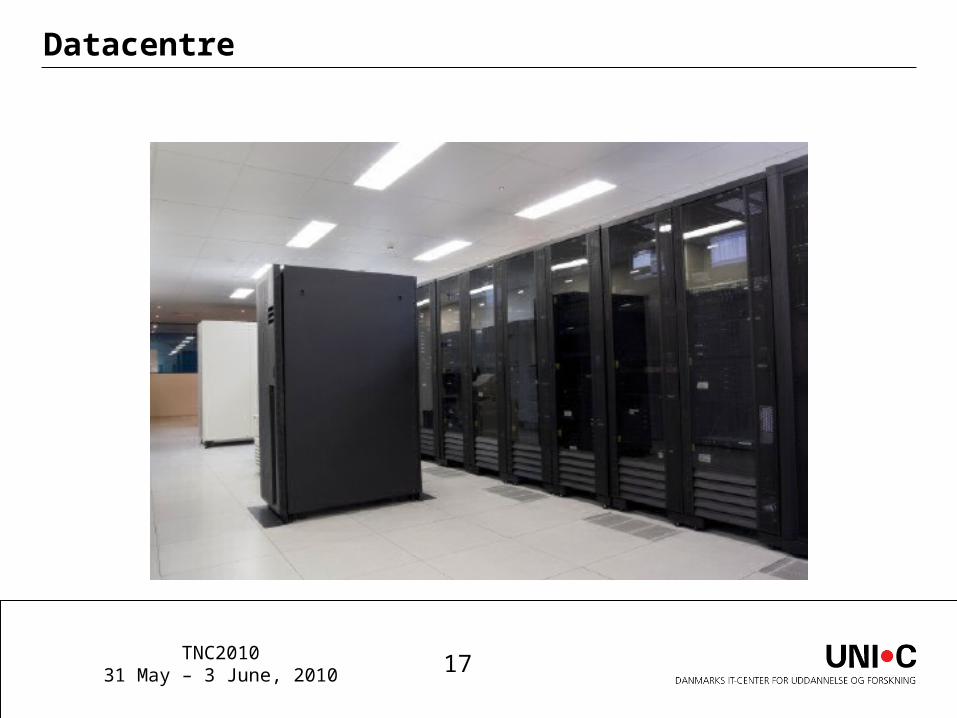
Datacentre
TNC201031 May – 3 June, 2010 18
Backbone (GÉANT)
TNC201031 May – 3 June, 2010 19
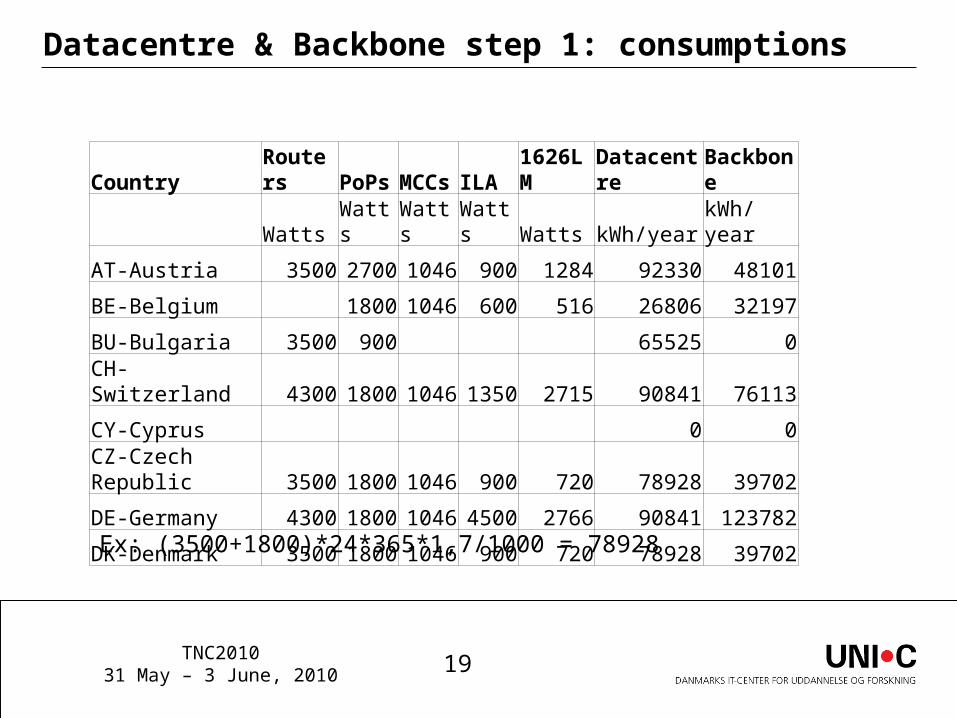
Datacentre & Backbone step 1: consumptions
Country Routers PoPs MCCs ILA 1626LM Datacentre Backbone
Watts Watts Watts Watts Watts kWh/year kWh/year
AT-Austria 3500 2700 1046 900 1284 92330 48101
BE-Belgium 1800 1046 600 516 26806 32197
BU-Bulgaria 3500 900 65525 0
CH-Switzerland 4300 1800 1046 1350 2715 90841 76113
CY-Cyprus 0 0
CZ-Czech Republic 3500 1800 1046 900 720 78928 39702
DE-Germany 4300 1800 1046 4500 2766 90841 123782
DK-Denmark 3500 1800 1046 900 720 78928 39702
Ex: (3500+1800)*24*365*1,7/1000 = 78928
TNC201031 May – 3 June, 2010 20
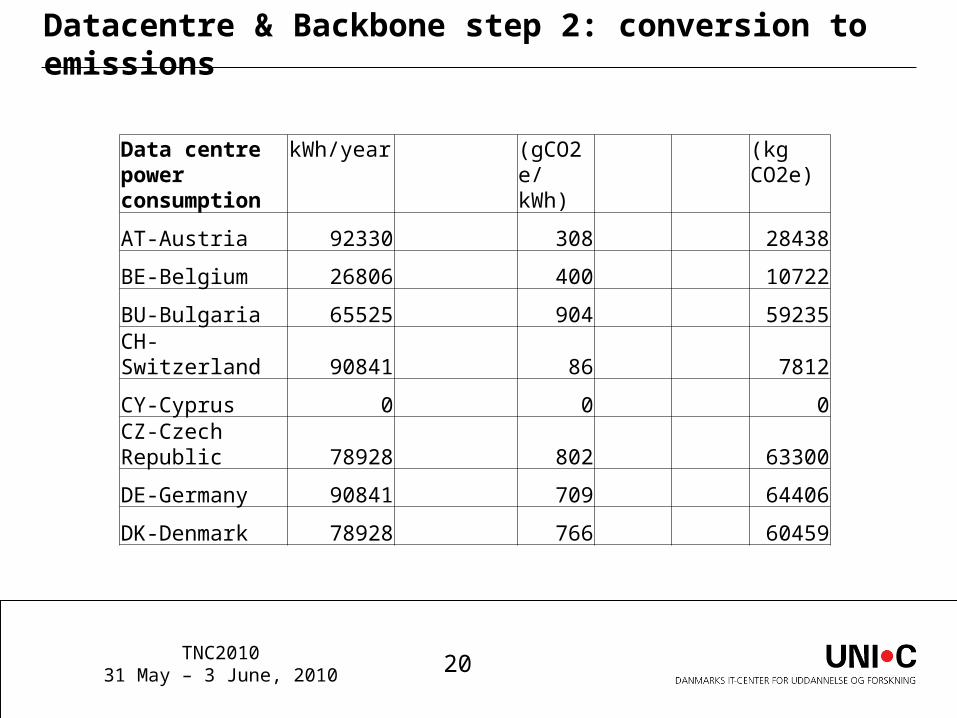
Datacentre & Backbone step 2: conversion to emissions
Data centre power consumption
kWh/year (gCO2e/kWh)
(kg CO2e)
AT-Austria 92330 308 28438
BE-Belgium 26806 400 10722
BU-Bulgaria 65525 904 59235
CH-Switzerland 90841 86 7812
CY-Cyprus 0 0 0
CZ-Czech Republic 78928 802 63300
DE-Germany 90841 709 64406
DK-Denmark 78928 766 60459
TNC201031 May – 3 June, 2010 21
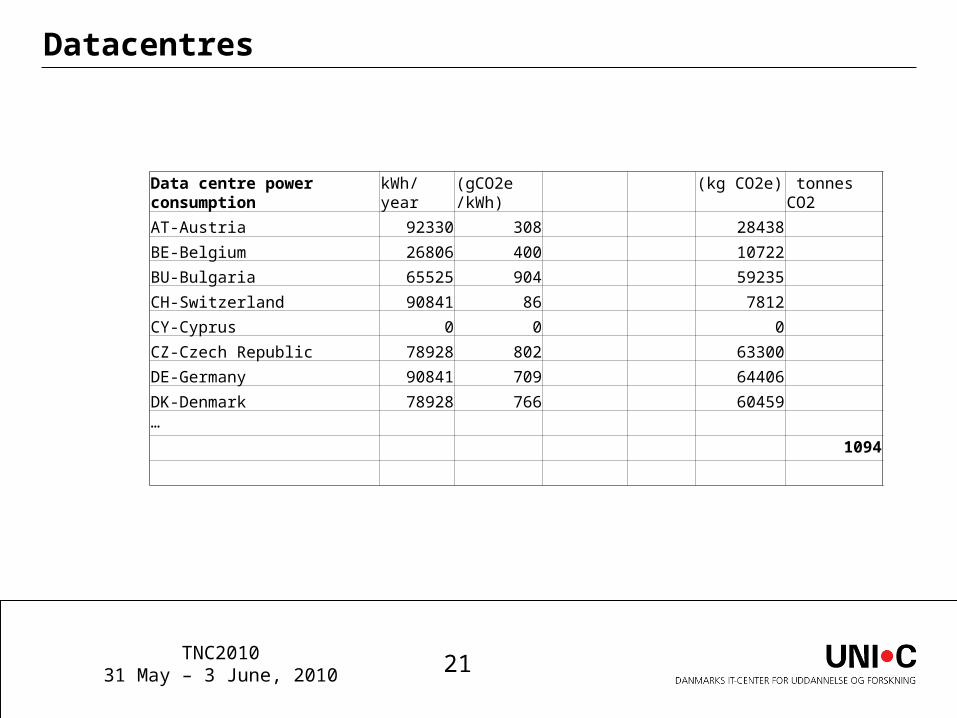
Datacentres
Data centre power consumption
kWh/year (gCO2e/kWh)
(kg CO2e) tonnes CO2
AT-Austria 92330 308 28438
BE-Belgium 26806 400 10722
BU-Bulgaria 65525 904 59235
CH-Switzerland 90841 86 7812
CY-Cyprus 0 0 0
CZ-Czech Republic 78928 802 63300
DE-Germany 90841 709 64406
DK-Denmark 78928 766 60459
…
1094
TNC201031 May – 3 June, 2010 22
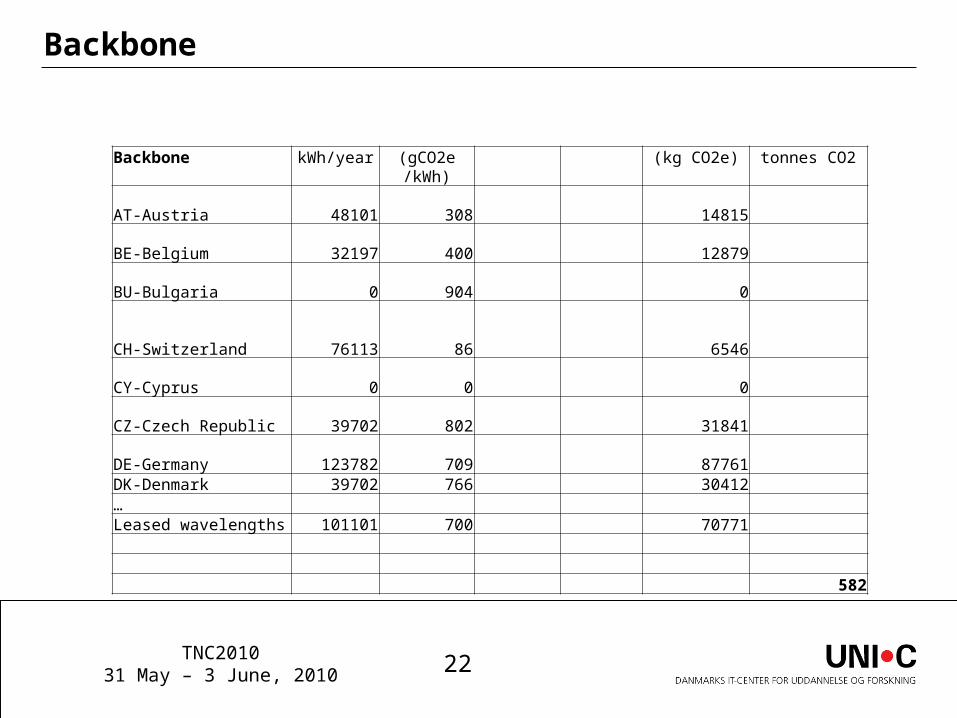
Backbone
Backbone kWh/year (gCO2e/kWh)
(kg CO2e) tonnes CO2
AT-Austria 48101 308
14815
BE-Belgium 32197 400
12879
BU-Bulgaria 0 904
0
CH-Switzerland 76113 86
6546
CY-Cyprus 0 0
0
CZ-Czech Republic 39702 802
31841
DE-Germany 123782 709
87761
DK-Denmark 39702 766 30412 … Leased wavelengths 101101 700 70771 582
TNC201031 May – 3 June, 2010 23
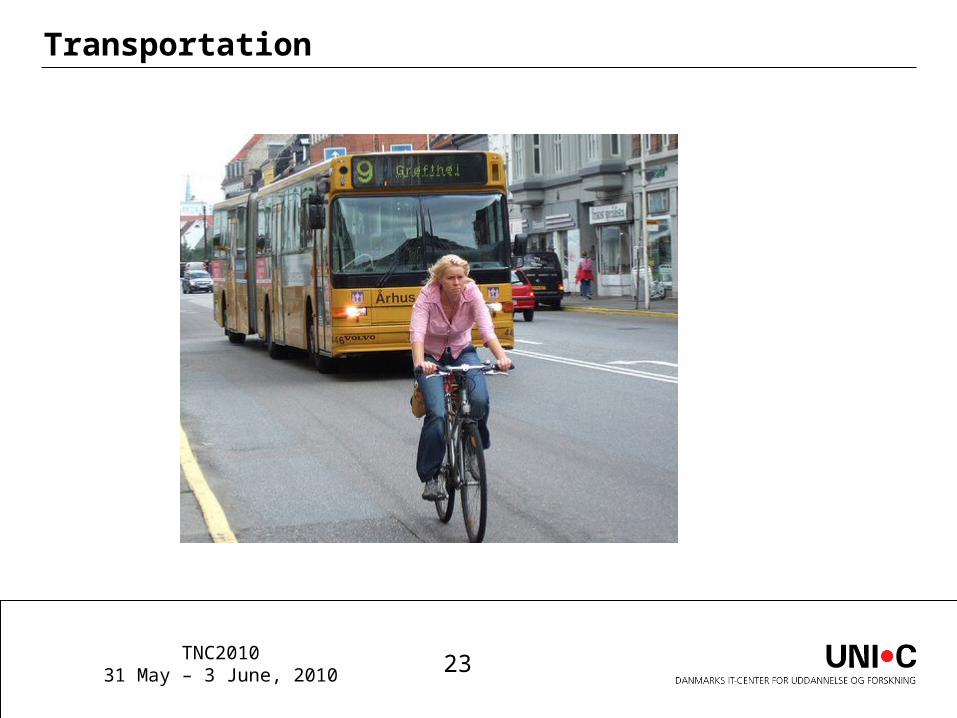
Transportation
TNC201031 May – 3 June, 2010 24
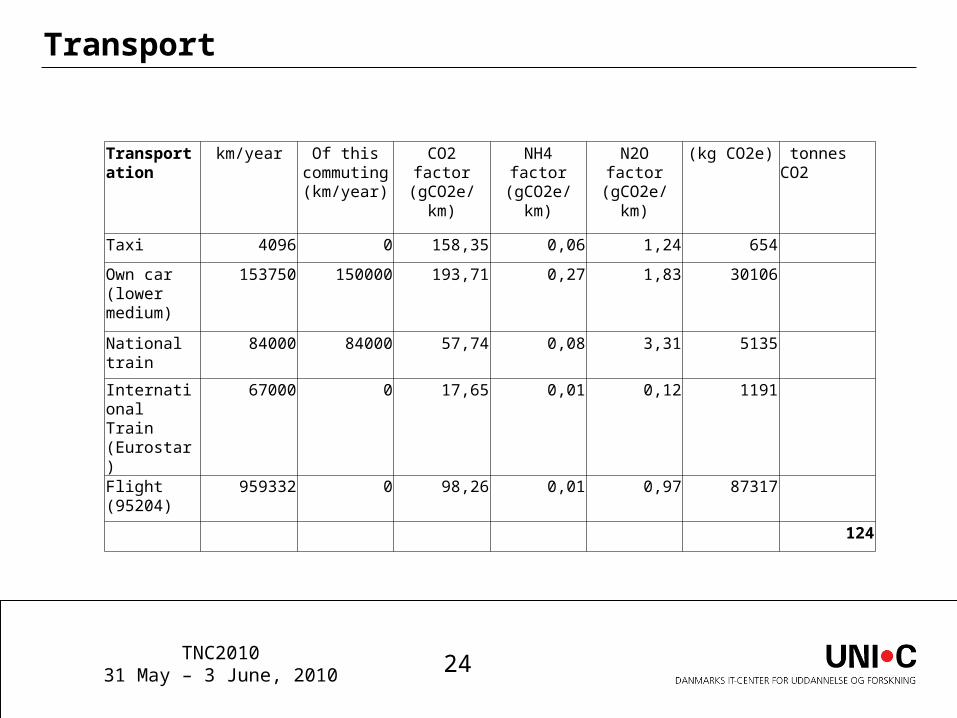
Transport
Transportation
km/year Of this commuting (km/year)
CO2 factor(gCO2e/km)
NH4 factor(gCO2e/km)
N2O factor(gCO2e/km)
(kg CO2e) tonnes CO2
Taxi 4096 0 158,35 0,06 1,24 654
Own car (lower medium)
153750 150000 193,71 0,27 1,83 30106
National train
84000 84000 57,74 0,08 3,31 5135
International Train (Eurostar)
67000 0 17,65 0,01 0,12 1191
Flight (95204)
959332 0 98,26 0,01 0,97 87317
124
TNC201031 May – 3 June, 2010 25
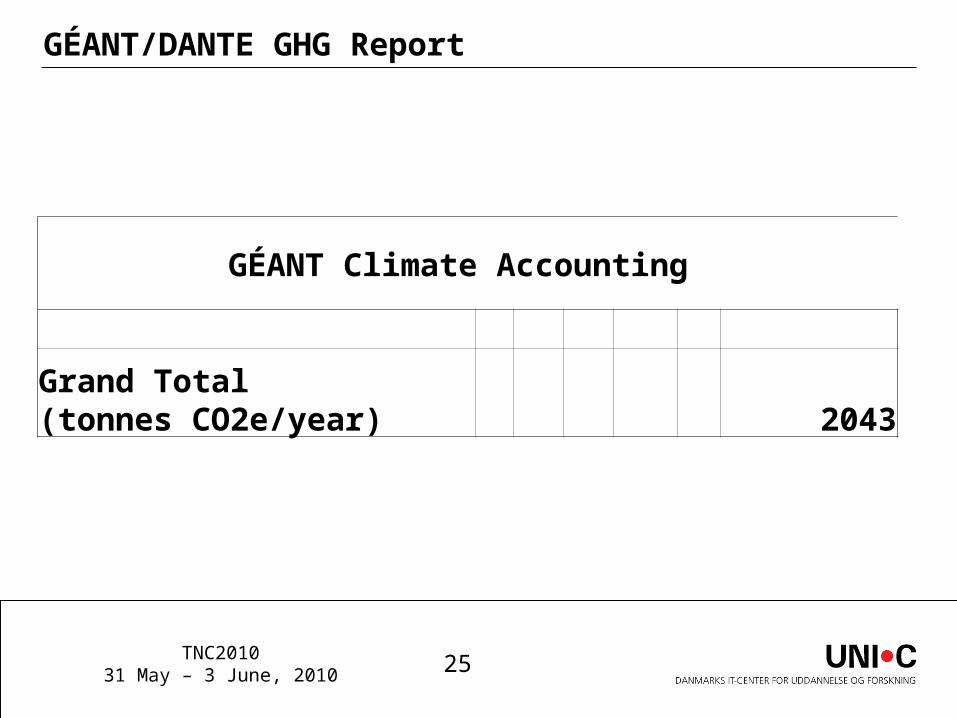
GÉANT/DANTE GHG Report
GÉANT Climate Accounting
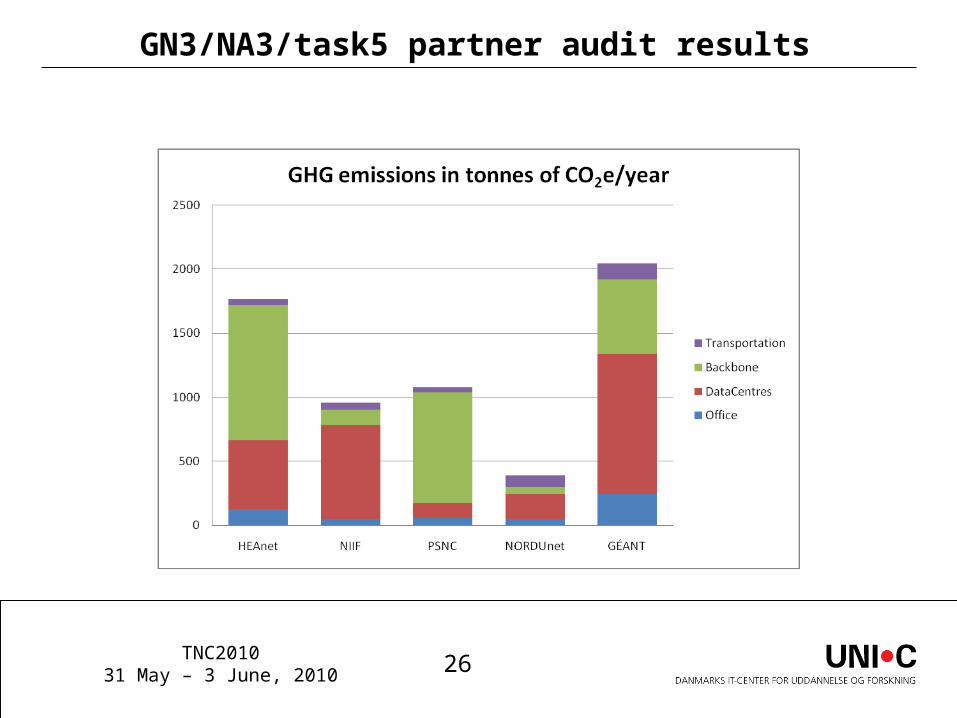
Grand Total (tonnes CO2e/year) 2043
TNC201031 May – 3 June, 2010 26
GN3/NA3/task5 partner audit results
GHG abatement by GÉANT and other networks
TNC201031 May – 3 June, 2010 28
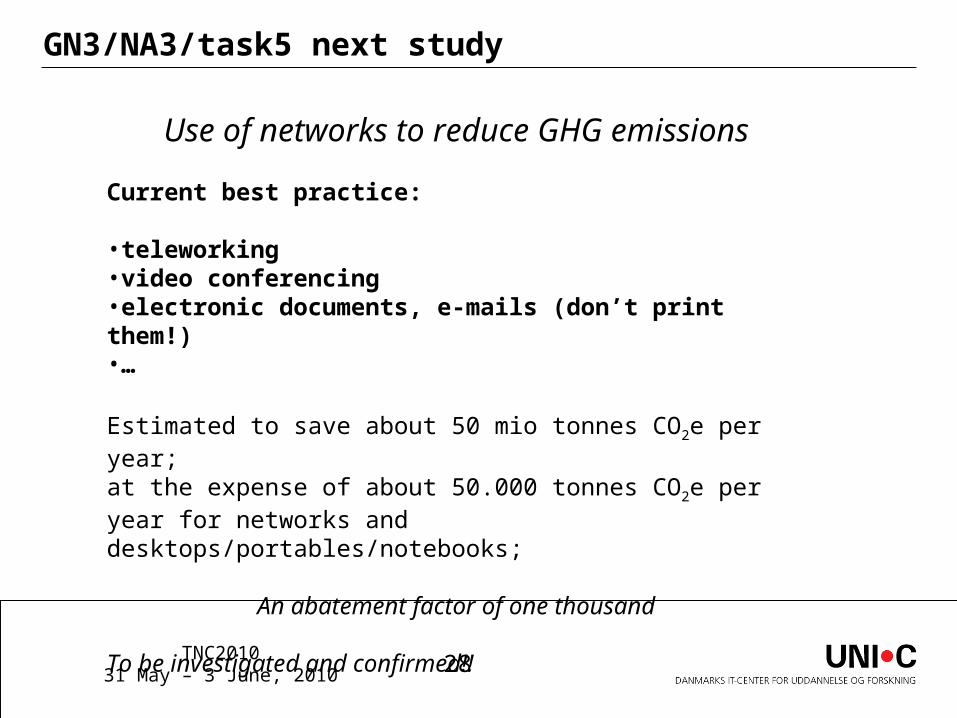
GN3/NA3/task5 next study
Use of networks to reduce GHG emissions
Current best practice:
•teleworking•video conferencing•electronic documents, e-mails (don’t print them!)•…
Estimated to save about 50 mio tonnes CO2e per year;at the expense of about 50.000 tonnes CO2e per year for networks and desktops/portables/notebooks;
An abatement factor of one thousand
To be investigated and confirmed!!

TNC201031 May – 3 June, 2010 29
Other examples and new ideas
Please share your ideas and proposals with us!

Questions?