Embed Size (px)
Citation preview
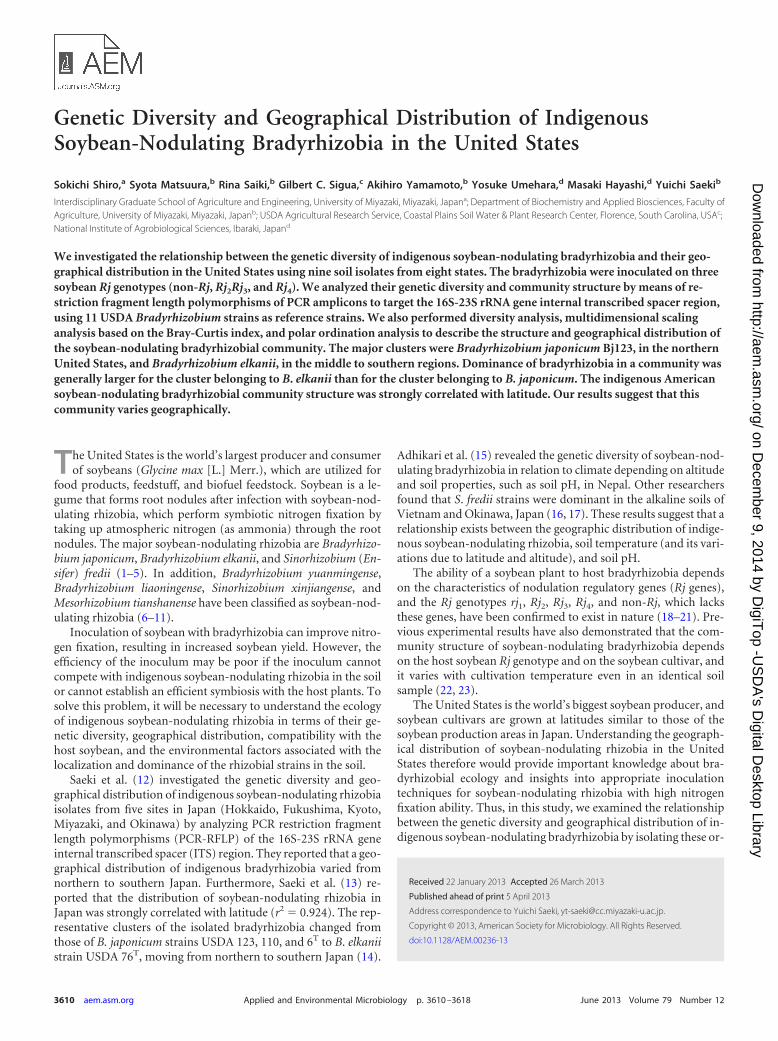
Genetic Diversity and Geographical Distribution of IndigenousSoybean-Nodulating Bradyrhizobia in the United States
Sokichi Shiro,a Syota Matsuura,b Rina Saiki,b Gilbert C. Sigua,c Akihiro Yamamoto,b Yosuke Umehara,d Masaki Hayashi,d Yuichi Saekib
Interdisciplinary Graduate School of Agriculture and Engineering, University of Miyazaki, Miyazaki, Japana; Department of Biochemistry and Applied Biosciences, Faculty ofAgriculture, University of Miyazaki, Miyazaki, Japanb; USDA Agricultural Research Service, Coastal Plains Soil Water & Plant Research Center, Florence, South Carolina, USAc;National Institute of Agrobiological Sciences, Ibaraki, Japand
We investigated the relationship between the genetic diversity of indigenous soybean-nodulating bradyrhizobia and their geo-graphical distribution in the United States using nine soil isolates from eight states. The bradyrhizobia were inoculated on threesoybean Rj genotypes (non-Rj, Rj2Rj3, and Rj4). We analyzed their genetic diversity and community structure by means of re-striction fragment length polymorphisms of PCR amplicons to target the 16S-23S rRNA gene internal transcribed spacer region,using 11 USDA Bradyrhizobium strains as reference strains. We also performed diversity analysis, multidimensional scalinganalysis based on the Bray-Curtis index, and polar ordination analysis to describe the structure and geographical distribution ofthe soybean-nodulating bradyrhizobial community. The major clusters were Bradyrhizobium japonicum Bj123, in the northernUnited States, and Bradyrhizobium elkanii, in the middle to southern regions. Dominance of bradyrhizobia in a community wasgenerally larger for the cluster belonging to B. elkanii than for the cluster belonging to B. japonicum. The indigenous Americansoybean-nodulating bradyrhizobial community structure was strongly correlated with latitude. Our results suggest that thiscommunity varies geographically.
The United States is the world’s largest producer and consumerof soybeans (Glycine max [L.] Merr.), which are utilized for
food products, feedstuff, and biofuel feedstock. Soybean is a le-gume that forms root nodules after infection with soybean-nod-ulating rhizobia, which perform symbiotic nitrogen fixation bytaking up atmospheric nitrogen (as ammonia) through the rootnodules. The major soybean-nodulating rhizobia are Bradyrhizo-bium japonicum, Bradyrhizobium elkanii, and Sinorhizobium (En-sifer) fredii (1–5). In addition, Bradyrhizobium yuanmingense,Bradyrhizobium liaoningense, Sinorhizobium xinjiangense, andMesorhizobium tianshanense have been classified as soybean-nod-ulating rhizobia (6–11).
Inoculation of soybean with bradyrhizobia can improve nitro-gen fixation, resulting in increased soybean yield. However, theefficiency of the inoculum may be poor if the inoculum cannotcompete with indigenous soybean-nodulating rhizobia in the soilor cannot establish an efficient symbiosis with the host plants. Tosolve this problem, it will be necessary to understand the ecologyof indigenous soybean-nodulating rhizobia in terms of their ge-netic diversity, geographical distribution, compatibility with thehost soybean, and the environmental factors associated with thelocalization and dominance of the rhizobial strains in the soil.
Saeki et al. (12) investigated the genetic diversity and geo-graphical distribution of indigenous soybean-nodulating rhizobiaisolates from five sites in Japan (Hokkaido, Fukushima, Kyoto,Miyazaki, and Okinawa) by analyzing PCR restriction fragmentlength polymorphisms (PCR-RFLP) of the 16S-23S rRNA geneinternal transcribed spacer (ITS) region. They reported that a geo-graphical distribution of indigenous bradyrhizobia varied fromnorthern to southern Japan. Furthermore, Saeki et al. (13) re-ported that the distribution of soybean-nodulating rhizobia inJapan was strongly correlated with latitude (r2 � 0.924). The rep-resentative clusters of the isolated bradyrhizobia changed fromthose of B. japonicum strains USDA 123, 110, and 6T to B. elkaniistrain USDA 76T, moving from northern to southern Japan (14).
Adhikari et al. (15) revealed the genetic diversity of soybean-nod-ulating bradyrhizobia in relation to climate depending on altitudeand soil properties, such as soil pH, in Nepal. Other researchersfound that S. fredii strains were dominant in the alkaline soils ofVietnam and Okinawa, Japan (16, 17). These results suggest that arelationship exists between the geographic distribution of indige-nous soybean-nodulating rhizobia, soil temperature (and its vari-ations due to latitude and altitude), and soil pH.
The ability of a soybean plant to host bradyrhizobia dependson the characteristics of nodulation regulatory genes (Rj genes),and the Rj genotypes rj1, Rj2, Rj3, Rj4, and non-Rj, which lacksthese genes, have been confirmed to exist in nature (18–21). Pre-vious experimental results have also demonstrated that the com-munity structure of soybean-nodulating bradyrhizobia dependson the host soybean Rj genotype and on the soybean cultivar, andit varies with cultivation temperature even in an identical soilsample (22, 23).
The United States is the world’s biggest soybean producer, andsoybean cultivars are grown at latitudes similar to those of thesoybean production areas in Japan. Understanding the geograph-ical distribution of soybean-nodulating rhizobia in the UnitedStates therefore would provide important knowledge about bra-dyrhizobial ecology and insights into appropriate inoculationtechniques for soybean-nodulating rhizobia with high nitrogenfixation ability. Thus, in this study, we examined the relationshipbetween the genetic diversity and geographical distribution of in-digenous soybean-nodulating bradyrhizobia by isolating these or-
Received 22 January 2013 Accepted 26 March 2013
Published ahead of print 5 April 2013
Address correspondence to Yuichi Saeki, [email protected].
Copyright © 2013, American Society for Microbiology. All Rights Reserved.
doi:10.1128/AEM.00236-13
3610 aem.asm.org Applied and Environmental Microbiology p. 3610–3618 June 2013 Volume 79 Number 12
on Decem
ber 9, 2014 by DigiT
op -US
DA
's Digital D
esktop Libraryhttp://aem
.asm.org/
Dow
nloaded from
ganisms using three Rj genotype soybean cultivars from nine soilsamples of American soybean fields. Our objectives were toinvestigate the genetic diversity, community structure, andgeographic distribution of the bradyrhizobia by means of PCR-RFLP analysis of the 16S-23S rRNA gene ITS region. In addi-tion, we described the community structure and geographicaldistribution of the bradyrhizobia using several tools frommathematical ecology.
MATERIALS AND METHODSSoil samples. We obtained soil samples for isolation of soybean-nodulat-ing bradyrhizobia from nine experimental fields and farm fields in eightAmerican states (Michigan, Ohio, Kentucky, North Carolina, Alabama,Georgia, Florida, and Louisiana) in August 2010 (Table 1). Three samples
(each at least 200 cm3) were obtained from each field, to a depth of 10 cm,after removal of the surface litter. The samples were homogenized toproduce a single composite sample. The Alabama soil sample was col-lected from two separate soybean fields, which we designated Alabama1and Alabama2. Table 1 summarizes the location, soil pH, electrical con-ductivity (EC), total carbon (C) and total nitrogen (N) contents, and C/Nratio at these sites.
Isolation of the indigenous bradyrhizobia. To isolate indigenoussoybean-nodulating bradyrhizobia, we used three soybean cultivars ofthree Rj genotypes, Bragg as non-Rj, CNS as Rj2Rj3, and Hill as Rj4, andplanted each soybean cultivar in 1-liter culture pots (n � 3 plants percultivar). The culture pots were filled with vermiculite containing N-freenutrient solution (24) at 40% (vol/vol) water content and then were au-toclaved at 121°C for 20 min. Soybean seeds were sterilized by beingsoaked in 70% ethanol for 30 s and in a dilute sodium hypochlorite solu-
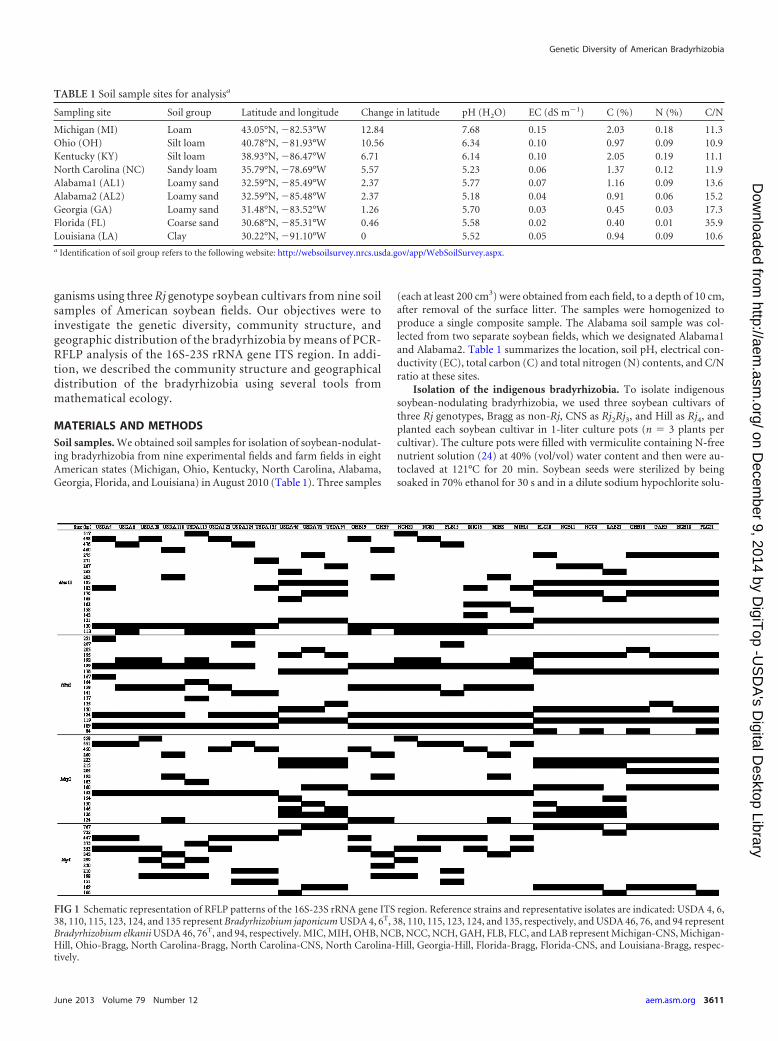
FIG 1 Schematic representation of RFLP patterns of the 16S-23S rRNA gene ITS region. Reference strains and representative isolates are indicated: USDA 4, 6,38, 110, 115, 123, 124, and 135 represent Bradyrhizobium japonicum USDA 4, 6T, 38, 110, 115, 123, 124, and 135, respectively, and USDA 46, 76, and 94 representBradyrhizobium elkanii USDA 46, 76T, and 94, respectively. MIC, MIH, OHB, NCB, NCC, NCH, GAH, FLB, FLC, and LAB represent Michigan-CNS, Michigan-Hill, Ohio-Bragg, North Carolina-Bragg, North Carolina-CNS, North Carolina-Hill, Georgia-Hill, Florida-Bragg, Florida-CNS, and Louisiana-Bragg, respec-tively.
TABLE 1 Soil sample sites for analysisa
Sampling site Soil group Latitude and longitude Change in latitude pH (H2O) EC (dS m�1) C (%) N (%) C/N
Michigan (MI) Loam 43.05°N, �82.53°W 12.84 7.68 0.15 2.03 0.18 11.3Ohio (OH) Silt loam 40.78°N, �81.93°W 10.56 6.34 0.10 0.97 0.09 10.9Kentucky (KY) Silt loam 38.93°N, �86.47°W 6.71 6.14 0.10 2.05 0.19 11.1North Carolina (NC) Sandy loam 35.79°N, �78.69°W 5.57 5.23 0.06 1.37 0.12 11.9Alabama1 (AL1) Loamy sand 32.59°N, �85.49°W 2.37 5.77 0.07 1.16 0.09 13.6Alabama2 (AL2) Loamy sand 32.59°N, �85.48°W 2.37 5.18 0.04 0.91 0.06 15.2Georgia (GA) Loamy sand 31.48°N, �83.52°W 1.26 5.70 0.03 0.45 0.03 17.3Florida (FL) Coarse sand 30.68°N, �85.31°W 0.46 5.58 0.02 0.40 0.01 35.9Louisiana (LA) Clay 30.22°N, �91.10°W 0 5.52 0.05 0.94 0.09 10.6a Identification of soil group refers to the following website: http://websoilsurvey.nrcs.usda.gov/app/WebSoilSurvey.aspx.
Genetic Diversity of American Bradyrhizobia
June 2013 Volume 79 Number 12 aem.asm.org 3611
on Decem
ber 9, 2014 by DigiT
op -US
DA
's Digital D
esktop Libraryhttp://aem
.asm.org/
Dow
nloaded from
tion (0.25% available chlorine) for 3 min. They were then washed withsterile distilled water. A soil sample (2 to 3 g) was placed in the vermiculiteat a depth of 2 to 3 cm, the soybean seeds were sown on the soil, and thenthe pot weight was measured. The plants were grown for 4 weeks in agrowth chamber (day, 28°C for 16 h; night, 23°C for 8 h), and steriledistilled water was supplied weekly until it reached the initial pot weight.
After 4 weeks, 23 to 24 nodules were randomly collected from thesoybean roots and sterilized by soaking them in 70% ethanol for 3 min andin a diluted sodium hypochlorite solution (0.25% available chlorine) for30 min; they were then washed with sterile distilled water. Each nodulewas homogenized in sterile distilled water, streaked onto a yeast extract-mannitol agar (YMA) (25) plate medium, and incubated for 5 to 7 days inthe dark at 28°C. To determine the genus of the isolates, a single colonywas streaked onto YMA plate medium containing 0.002% (wt/wt) bro-mothymol blue (26) and incubated as described above. After incubation,each isolate was maintained on YMA slant medium at 4°C for furtheranalysis. Sixy-nine to 72 isolates per soil sample were used to represent thesoybean-nodulating bradyrhizobial community; we obtained a total of645 isolates from the nine soybean fields and used them in the diversityanalysis and multidimensional scaling (MDS) analysis described below.
Representative isolates in each operational taxonomic unit (OTU) ofthe dendrogram were confirmed for their nodulation capability on hostsoybean by inoculation test. Each isolate was cultured in yeast extract-mannitol broth culture (25) for 6 days at 28°C, and the cultures were thendiluted with sterile distilled water to approximately 106 cells ml�1. The
soybean seeds were sown into 500-ml prepared culture pots without soil,as described above, and inoculated with a 1-ml aliquot of each isolate perseed, with two or three replicates. We assessed nodule formation after 3weeks in a growth chamber under the conditions described above.
PCR-RFLP analysis of the 16S-23S rRNA gene ITS region. For DNAextraction, we cultured each isolate in 1.5 ml of HEPES-morpho-lineethanesulfonic acid (MES) medium (27) supplemented with 0.1%L-arabinose (28) for 5 days at 28°C. Total DNA was extracted from theisolates using BL extraction buffer, as described previously (22), based onthe method reported by Hiraishi et al. (29). As reference strains, we used B.japonicum USDA strains 4, 6T, 38, 110, 115, 123, 124, and 135 and B.elkanii USDA strains 46, 76T, and 94 (30). Total DNAs of the referencestrains were extracted by means of the same procedure as that used for theisolates.
The PCR amplification for the 16S-23S rRNA gene ITS region wascarried out using Ex Taq DNA polymerase (TaKaRa Bio, Otsu, Shiga,Japan) and a previously developed ITS primer set (BraITS-F, 5=-GACTGGGGTGAAGTCGTAAC-3=; BraITS-R, 5=-ACGTCCTTCATCGCCTC-3=) (12). The PCR cycle consisted of a prerun at 94°C for 5 min, 30 cyclesof denaturation at 94°C for 30 s, annealing at 55°C for 30 s, and extensionat 72°C for 1 min, with a final postrun extension at 72°C for 10 min.
The RFLP analysis of the ITS region was investigated using the restric-tion enzymes HaeIII, HhaI, MspI, and XspI (TaKaRa Bio). A 5-�l aliquotof the PCR product was digested with the restriction enzymes at 37°C for16 h in a 20-�l reaction mixture. The restriction fragments were separated
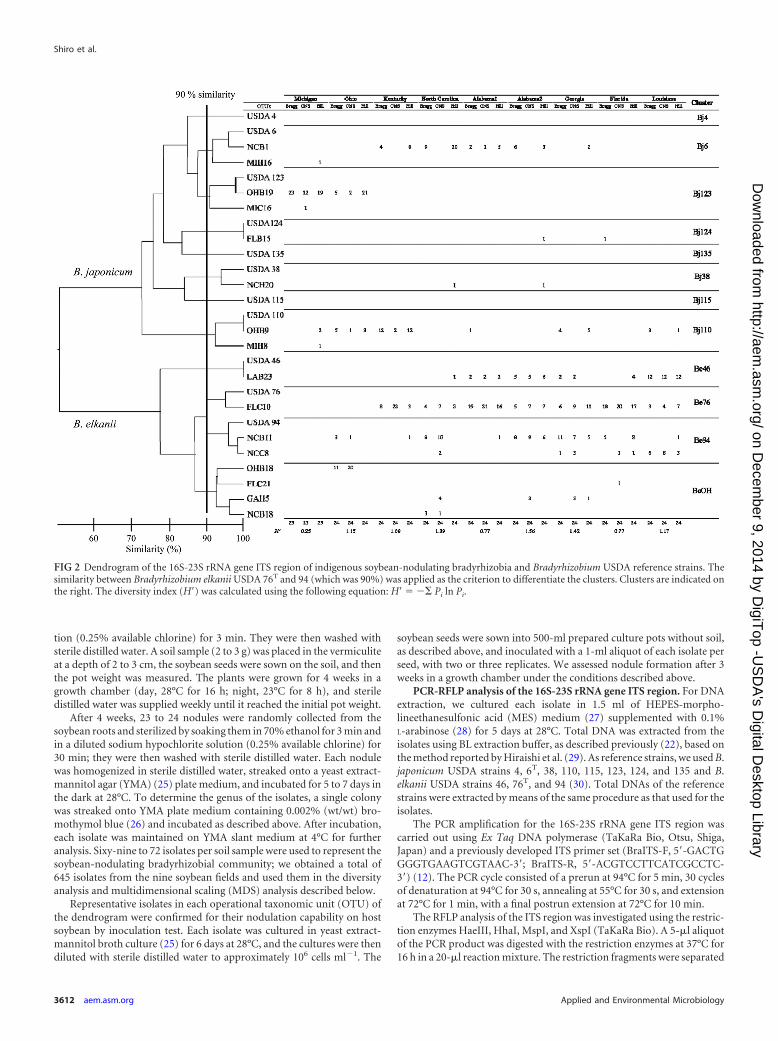
FIG 2 Dendrogram of the 16S-23S rRNA gene ITS region of indigenous soybean-nodulating bradyrhizobia and Bradyrhizobium USDA reference strains. Thesimilarity between Bradyrhizobium elkanii USDA 76T and 94 (which was 90%) was applied as the criterion to differentiate the clusters. Clusters are indicated onthe right. The diversity index (H=) was calculated using the following equation: H= � �� Pi ln Pi.
Shiro et al.
3612 aem.asm.org Applied and Environmental Microbiology
on Decem
ber 9, 2014 by DigiT
op -US
DA
's Digital D
esktop Libraryhttp://aem
.asm.org/
Dow
nloaded from
on 3 or 4% agarose gels by means of electrophoresis and visualized withethidium bromide.
Cluster analysis of the indigenous soybean-nodulating rhizobia.The fragment sizes on the electrophoresis gels were measured using a50-bp reference ladder marker (TaKaRa Bio) and the fragment sizes fromthe sequences of the reference strains. All reproducible fragments longerthan 50 bp were used for the cluster analysis (described below), and someirreproducible fragments were excluded. The genetic distance betweenpairs of isolates (D) was determined using the equation DAB � 1 � [2NAB/(NA � NB)], where NAB represents the number of RFLP bands shared bystrains A and B and NA and NB represent the numbers of RFLP bandsfound only in strains A and B, respectively (31, 32). The cluster analysiswas carried out using the unweighted pair-group method using averagelinkages (UPGMA). The dendrograms were constructed using version3.69 of the PHYLIP software (J. Felsenstein, University of Washington,Seattle, WA; http://evolution.genetics.washington.edu/phylip.html).
Diversity analysis for the bradyrhizobial communities. To estimatethe diversity of the bradyrhizobial communities in the United States thatwe isolated from the host soybeans, we used the Shannon-Wiener diver-sity index (13, 33, 34), H= � �� Pi ln Pi, where Pi is the dominance ofdendrogram cluster i, defined as ni/N, where N is the total number ofisolates (n � 69 or 72) and ni is the total number of tested isolates belong-ing to dendrogram cluster i. We also calculated the alpha diversity (H=�),beta diversity (H=�), and gamma diversity (H=�) to estimate the differ-ences in the bradyrhizobial communities between pairs of soil samples(35, 36). The H=� index represents a weighted average of the diversityindices of two bradyrhizobial communities, the H=� index represents thedifferences between the bradyrhizobial communities from two soil sam-ples (i.e., differences between sites), and the H=� index represents thediversity of the total isolate communities from the two soil samples (n �141 or 144). The relationship among these indices is H=� � H=� � H=�.
We also estimated the differences among the compositions of the bra-dyrhizobial communities by comparing the ratio of beta to gamma diver-
sity (H=�/H=�), taking into consideration the difference in gamma diver-sity in each pairwise comparison of bradyrhizobial communities.
Multidimensional scaling analysis, cluster analysis, and polar ordina-tion analysis. To describe the characteristics of the bradyrhizobial com-munities and the differences among field sample sites, we performed anMDS analysis based on the Bray-Curtis similarity measure. The Bray-Curtis similarity measure has a robust monotonic relationship with eco-logical distance and a robust linear relationship with ecological distanceuntil large values of the distance. Thus, the Bray-Curtis similarity measure(BC) is one of the indices that best reflect the properties between commu-nities (37). The Bray-Curtis similarity measure was calculated using theequation BCAB � � nA � nB/� (nA � nB), where BCAB is the dissimilar-ity between communities A and B and nA and nB represent the total num-ber of strains in a particular cluster for communities A and B, respectively(38, 39). The three-dimensional MDS analysis and the UPGMA analysisbased on the Bray-Curtis similarity measure were conducted using ver-sion 2.15.1 of the R software (http://www.r-project.org/). Furthermore,UPGMA analysis was conducted as described above for all communitiesas OTUs with Bray-Curtis similarity to obtain the objective index for theclustering of MDS plots.
To determine the relative distances among the diversities of the bra-dyrhizobial communities based on the three-dimensional MDS plots as afunction of latitude (°N), we calculated the Euclidean distances betweenthe bradyrhizobial communities. The distances between the MDS plotwere calculated using the coordinates on the x, y, and z axes as the Euclid-ean distance (Ed) using the equation EdAB � (XA � XB2 � YA � YB2 �ZA � ZB2)1/2, where EdAB is the linear distance between communities Aand B in the MDS plot and XA and XB, YA and YB, and ZA and ZB representthe x, y, and z coordinates of communities A and B, respectively. Thedistances from each pole were converted into percent differences, D1 andD2, from the two polar communities (i.e., the Michigan and Louisianasites, which were considered to have a 100% difference).
Polar ordination was conducted to determine the coordinates of com-
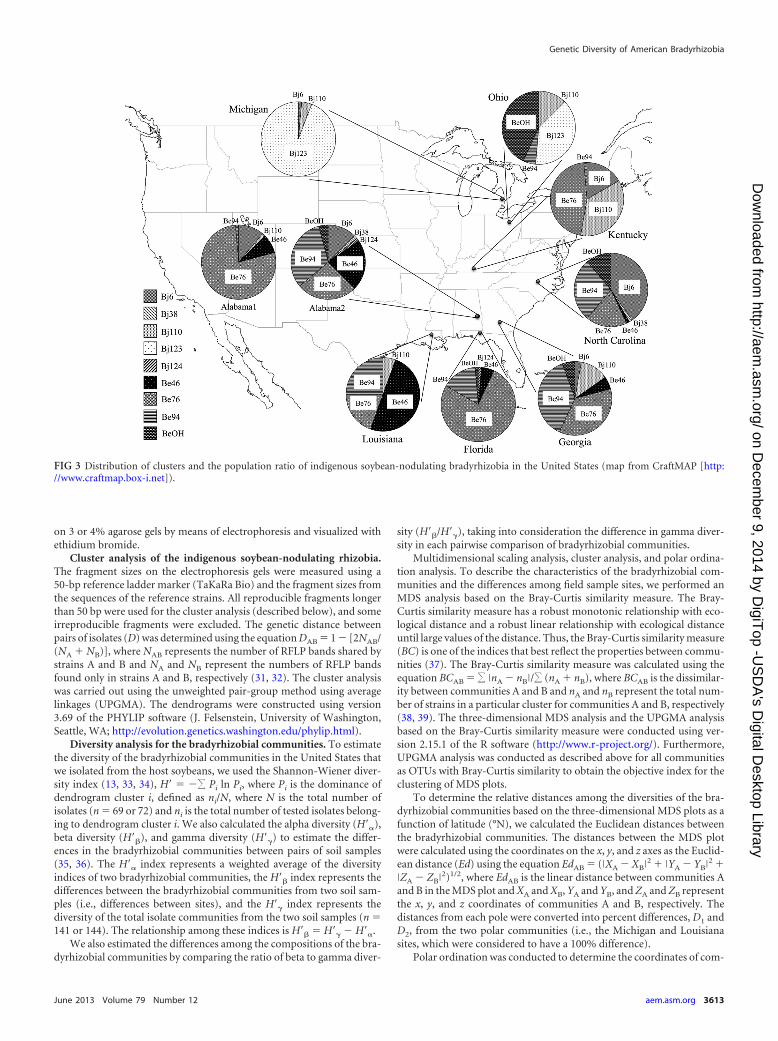
FIG 3 Distribution of clusters and the population ratio of indigenous soybean-nodulating bradyrhizobia in the United States (map from CraftMAP [http://www.craftmap.box-i.net]).
Genetic Diversity of American Bradyrhizobia
June 2013 Volume 79 Number 12 aem.asm.org 3613
on Decem
ber 9, 2014 by DigiT
op -US
DA
's Digital D
esktop Libraryhttp://aem
.asm.org/
Dow
nloaded from
munities on the axis between communities of the Michigan and Loui-siana sites using the Pythagorean theorem (13, 35, 40). We constructedsimultaneous equations from the trigonometric figure using the Py-thagorean theorem as described previously (13). Parameter Pd repre-sents the polar difference (%) from the 0% pole (the bradyrhizobialcommunity of Louisiana) and is calculated as Pd � (L2 � D1
2 �D2
2)/2L, where D1 and D2 are the percent differences between a par-ticular bradyrhizobial community and the communities at Louisianaand Michigan, respectively (40). The parameter L represents the totallength of the polar axis (i.e., 100%).
RESULTSIsolation of indigenous soybean-nodulating bradyrhizobia. Weobtained 23 or 24 isolates from each Rj soybean genotype and atotal of 645 indigenous soybean-nodulating bradyrhizobia thatcould be used for further analysis. The indigenous bradyrhizobiaisolated from each soil sample plus host soybean cultivar combi-nation were labeled using a combination of the site abbreviation,an abbreviation for the three cultivars (B, Bragg; C, CNS; and H,Hill), and the number of the isolate (1-23 or 1-24) (e.g., for Mich-igan, MIB1-23, MIC1-23, and MIH1-23). The YMA cultures of allisolates turned blue as a result of the presence of bromothymolblue, indicating that all isolates belonged to the genus Bradyrhizo-bium (2). Representative isolates indicated their nodulation capa-bility on the host soybean by the inoculation test.
PCR-RFLP analysis of the 16S-23S rRNA gene ITS region.PCR products of the amplified 16S-23S rRNA gene ITS region ofisolates were digested using four restriction enzymes, and the re-striction fragments were separated by gel electrophoresis. Figure 1provides a schematic representation of the restriction fragmentpatterns for each enzyme. The dendrogram was constructed basedon the differences in fragment size and pattern shown in Fig. 1.
Figure 2 presents the results of the cluster analysis based on PCR-RFLP data. We detected a total of 24 OTUs containing 11 refer-ence strains (Fig. 2). The maximum similarity between the OTUsand the reference strains was 90%, and it occurred between OTUsUSDA 76 and USDA 94. These results were then applied as thecriterion for distinguishing clusters in the dendrogram, whichproduced 12 clusters, 11 of which included 1 of the referencestrains. All indigenous bradyrhizobia were classified into 9 clus-ters: Bj6, Bj38, Bj110, Bj123, Bj124, Be46, Be76, Be94, and BeOH(Fig. 2). Three of the clusters included only a single referencestrain and no indigenous bradyrhizobia. Bj6, Bj38, Bj110, Bj123,and Bj124 showed RFLP patterns identical or similar to those of B.japonicum strains USDA 6T, 38, 110, 115, 123, and 124, respec-tively. Be46, Be76, and Be94 showed RFLP patterns identical orsimilar to those of B. elkanii strains USDA 46, 76T, and 94, respec-tively. Cluster BeOH consisted of isolates from five sites and wasindependent from those of the reference strains.
Figure 3 shows the geographical distribution of the soybean-nodulating bradyrhizobial isolates that belonged to each cluster.The isolates belonging to Bj123 were isolated from northern re-gions (Michigan and Ohio), whereas those belonging to Bj6 werefound in the middle regions (Kentucky, North Carolina, and Al-abama), and those belonging to Be46 were found in southern re-gions (Georgia, Florida, and Louisiana). Furthermore, the south-ern sites were dominated by B. elkanii isolates belonging toclusters Be46, Be76, and Be94. The dominance of B. elkanii ex-ceeded the dominance of B. japonicum in the middle to southernregions (Fig. 2 and 3).
Diversity analysis for the indigenous bradyrhizobial com-munities. The differences in the indigenous bradyrhizobial com-munities among the nine sample sites were estimated based on the
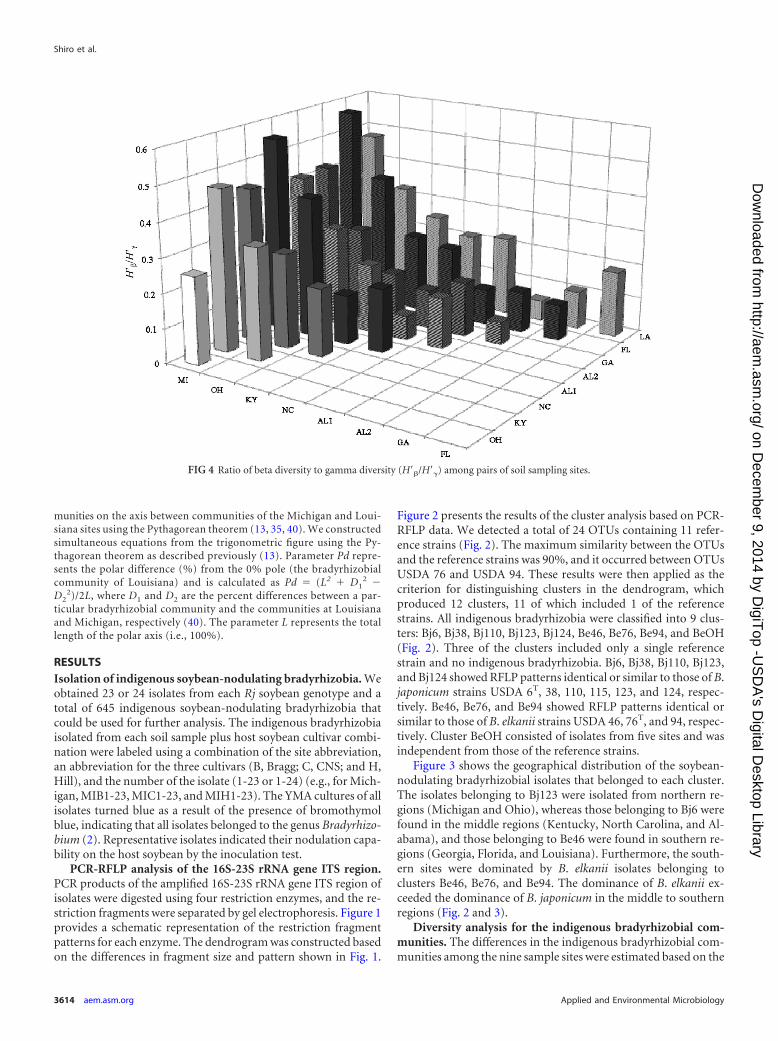
FIG 4 Ratio of beta diversity to gamma diversity (H=�/H=�) among pairs of soil sampling sites.
Shiro et al.
3614 aem.asm.org Applied and Environmental Microbiology
on Decem
ber 9, 2014 by DigiT
op -US
DA
's Digital D
esktop Libraryhttp://aem
.asm.org/
Dow
nloaded from
H=�/H=� ratio. The diversity index (H=) values are indicated at thebottom of Fig. 2, and the beta diversity ratio (H=�/H=�) at each fieldsite is shown in Fig. 4. As shown in Fig. 2, in the indigenous Americanbradyrhizobial communities, Alabama2 had the highest H= value(1.56), whereas Michigan had the lowest diversity index (0.25). Thevalues of H=�/H=� were largest for comparisons of the northern re-gions (Michigan and Ohio) to the other field sites (Fig. 4).
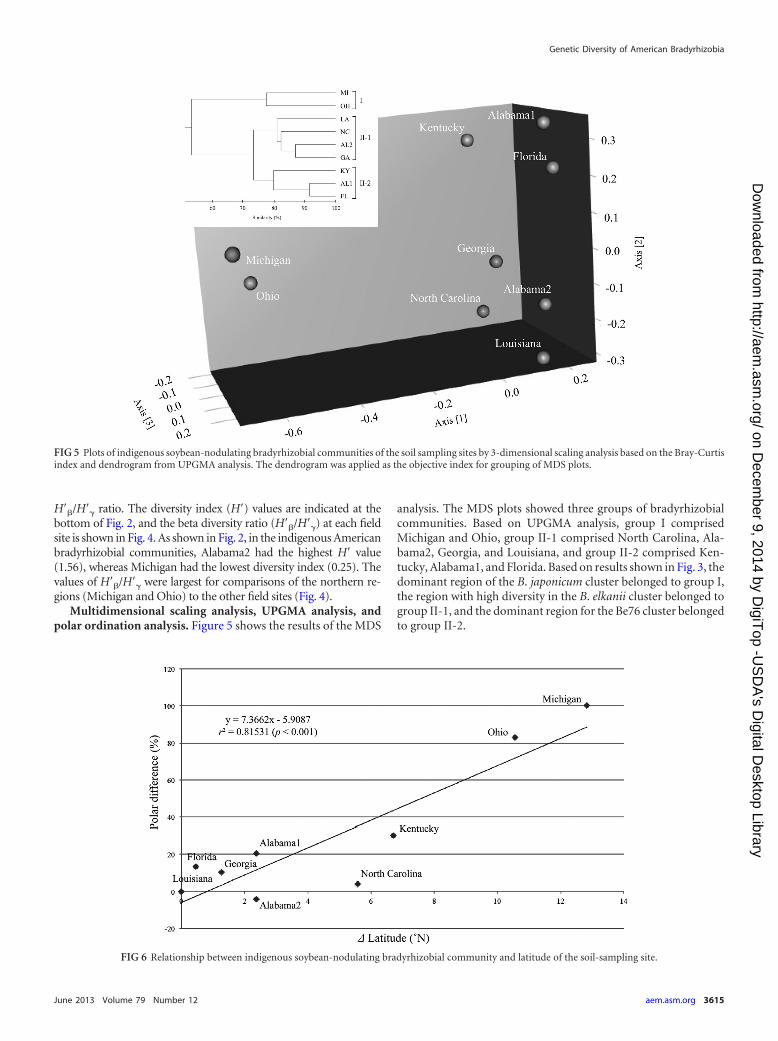
Multidimensional scaling analysis, UPGMA analysis, andpolar ordination analysis. Figure 5 shows the results of the MDS
analysis. The MDS plots showed three groups of bradyrhizobialcommunities. Based on UPGMA analysis, group I comprisedMichigan and Ohio, group II-1 comprised North Carolina, Ala-bama2, Georgia, and Louisiana, and group II-2 comprised Ken-tucky, Alabama1, and Florida. Based on results shown in Fig. 3, thedominant region of the B. japonicum cluster belonged to group I,the region with high diversity in the B. elkanii cluster belonged togroup II-1, and the dominant region for the Be76 cluster belongedto group II-2.
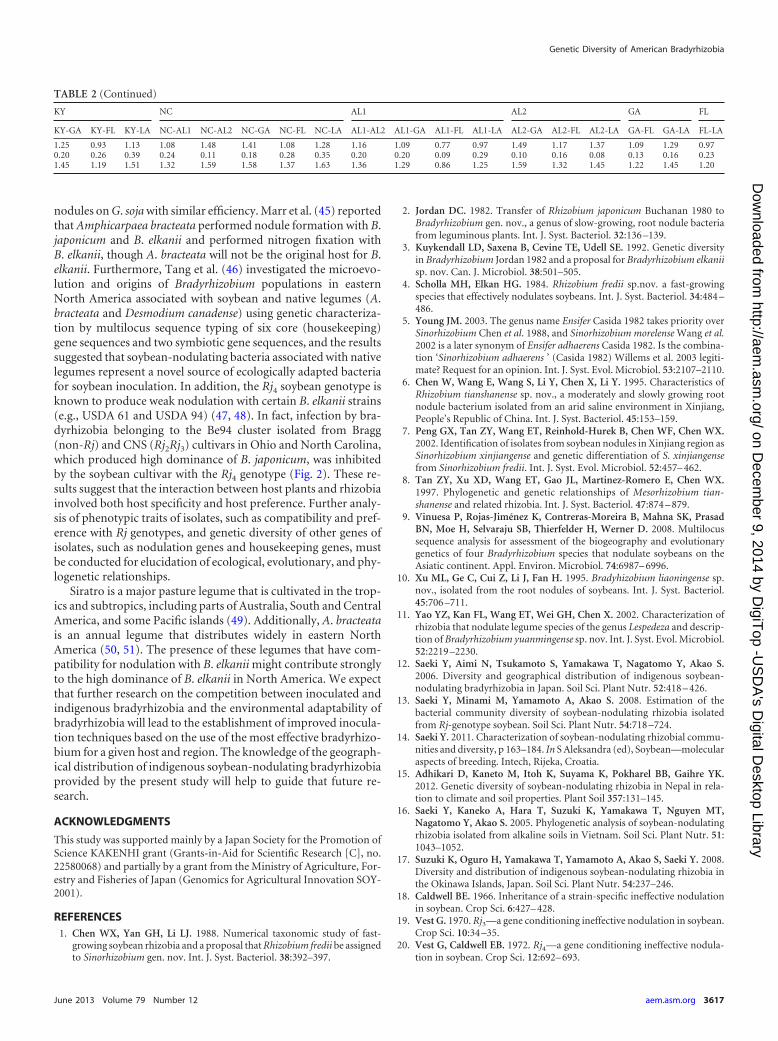
FIG 6 Relationship between indigenous soybean-nodulating bradyrhizobial community and latitude of the soil-sampling site.
FIG 5 Plots of indigenous soybean-nodulating bradyrhizobial communities of the soil sampling sites by 3-dimensional scaling analysis based on the Bray-Curtisindex and dendrogram from UPGMA analysis. The dendrogram was applied as the objective index for grouping of MDS plots.
Genetic Diversity of American Bradyrhizobia
June 2013 Volume 79 Number 12 aem.asm.org 3615
on Decem
ber 9, 2014 by DigiT
op -US
DA
's Digital D
esktop Libraryhttp://aem
.asm.org/
Dow
nloaded from
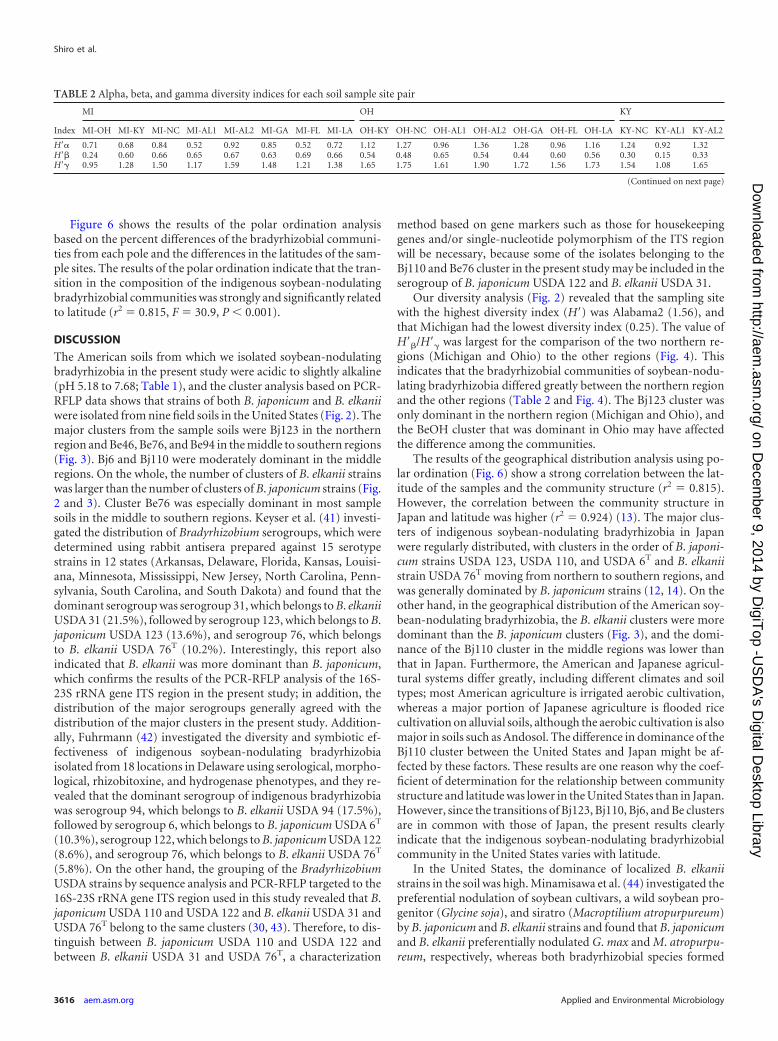
Figure 6 shows the results of the polar ordination analysisbased on the percent differences of the bradyrhizobial communi-ties from each pole and the differences in the latitudes of the sam-ple sites. The results of the polar ordination indicate that the tran-sition in the composition of the indigenous soybean-nodulatingbradyrhizobial communities was strongly and significantly relatedto latitude (r2 � 0.815, F � 30.9, P 0.001).
DISCUSSION
The American soils from which we isolated soybean-nodulatingbradyrhizobia in the present study were acidic to slightly alkaline(pH 5.18 to 7.68; Table 1), and the cluster analysis based on PCR-RFLP data shows that strains of both B. japonicum and B. elkaniiwere isolated from nine field soils in the United States (Fig. 2). Themajor clusters from the sample soils were Bj123 in the northernregion and Be46, Be76, and Be94 in the middle to southern regions(Fig. 3). Bj6 and Bj110 were moderately dominant in the middleregions. On the whole, the number of clusters of B. elkanii strainswas larger than the number of clusters of B. japonicum strains (Fig.2 and 3). Cluster Be76 was especially dominant in most samplesoils in the middle to southern regions. Keyser et al. (41) investi-gated the distribution of Bradyrhizobium serogroups, which weredetermined using rabbit antisera prepared against 15 serotypestrains in 12 states (Arkansas, Delaware, Florida, Kansas, Louisi-ana, Minnesota, Mississippi, New Jersey, North Carolina, Penn-sylvania, South Carolina, and South Dakota) and found that thedominant serogroup was serogroup 31, which belongs to B. elkaniiUSDA 31 (21.5%), followed by serogroup 123, which belongs to B.japonicum USDA 123 (13.6%), and serogroup 76, which belongsto B. elkanii USDA 76T (10.2%). Interestingly, this report alsoindicated that B. elkanii was more dominant than B. japonicum,which confirms the results of the PCR-RFLP analysis of the 16S-23S rRNA gene ITS region in the present study; in addition, thedistribution of the major serogroups generally agreed with thedistribution of the major clusters in the present study. Addition-ally, Fuhrmann (42) investigated the diversity and symbiotic ef-fectiveness of indigenous soybean-nodulating bradyrhizobiaisolated from 18 locations in Delaware using serological, morpho-logical, rhizobitoxine, and hydrogenase phenotypes, and they re-vealed that the dominant serogroup of indigenous bradyrhizobiawas serogroup 94, which belongs to B. elkanii USDA 94 (17.5%),followed by serogroup 6, which belongs to B. japonicum USDA 6T
(10.3%), serogroup 122, which belongs to B. japonicum USDA 122(8.6%), and serogroup 76, which belongs to B. elkanii USDA 76T
(5.8%). On the other hand, the grouping of the BradyrhizobiumUSDA strains by sequence analysis and PCR-RFLP targeted to the16S-23S rRNA gene ITS region used in this study revealed that B.japonicum USDA 110 and USDA 122 and B. elkanii USDA 31 andUSDA 76T belong to the same clusters (30, 43). Therefore, to dis-tinguish between B. japonicum USDA 110 and USDA 122 andbetween B. elkanii USDA 31 and USDA 76T, a characterization
method based on gene markers such as those for housekeepinggenes and/or single-nucleotide polymorphism of the ITS regionwill be necessary, because some of the isolates belonging to theBj110 and Be76 cluster in the present study may be included in theserogroup of B. japonicum USDA 122 and B. elkanii USDA 31.
Our diversity analysis (Fig. 2) revealed that the sampling sitewith the highest diversity index (H=) was Alabama2 (1.56), andthat Michigan had the lowest diversity index (0.25). The value ofH=�/H=� was largest for the comparison of the two northern re-gions (Michigan and Ohio) to the other regions (Fig. 4). Thisindicates that the bradyrhizobial communities of soybean-nodu-lating bradyrhizobia differed greatly between the northern regionand the other regions (Table 2 and Fig. 4). The Bj123 cluster wasonly dominant in the northern region (Michigan and Ohio), andthe BeOH cluster that was dominant in Ohio may have affectedthe difference among the communities.
The results of the geographical distribution analysis using po-lar ordination (Fig. 6) show a strong correlation between the lat-itude of the samples and the community structure (r2 � 0.815).However, the correlation between the community structure inJapan and latitude was higher (r2 � 0.924) (13). The major clus-ters of indigenous soybean-nodulating bradyrhizobia in Japanwere regularly distributed, with clusters in the order of B. japoni-cum strains USDA 123, USDA 110, and USDA 6T and B. elkaniistrain USDA 76T moving from northern to southern regions, andwas generally dominated by B. japonicum strains (12, 14). On theother hand, in the geographical distribution of the American soy-bean-nodulating bradyrhizobia, the B. elkanii clusters were moredominant than the B. japonicum clusters (Fig. 3), and the domi-nance of the Bj110 cluster in the middle regions was lower thanthat in Japan. Furthermore, the American and Japanese agricul-tural systems differ greatly, including different climates and soiltypes; most American agriculture is irrigated aerobic cultivation,whereas a major portion of Japanese agriculture is flooded ricecultivation on alluvial soils, although the aerobic cultivation is alsomajor in soils such as Andosol. The difference in dominance of theBj110 cluster between the United States and Japan might be af-fected by these factors. These results are one reason why the coef-ficient of determination for the relationship between communitystructure and latitude was lower in the United States than in Japan.However, since the transitions of Bj123, Bj110, Bj6, and Be clustersare in common with those of Japan, the present results clearlyindicate that the indigenous soybean-nodulating bradyrhizobialcommunity in the United States varies with latitude.
In the United States, the dominance of localized B. elkaniistrains in the soil was high. Minamisawa et al. (44) investigated thepreferential nodulation of soybean cultivars, a wild soybean pro-genitor (Glycine soja), and siratro (Macroptilium atropurpureum)by B. japonicum and B. elkanii strains and found that B. japonicumand B. elkanii preferentially nodulated G. max and M. atropurpu-reum, respectively, whereas both bradyrhizobial species formed
TABLE 2 Alpha, beta, and gamma diversity indices for each soil sample site pair
Index
MI OH KY
MI-OH MI-KY MI-NC MI-AL1 MI-AL2 MI-GA MI-FL MI-LA OH-KY OH-NC OH-AL1 OH-AL2 OH-GA OH-FL OH-LA KY-NC KY-AL1 KY-AL2
H=� 0.71 0.68 0.84 0.52 0.92 0.85 0.52 0.72 1.12 1.27 0.96 1.36 1.28 0.96 1.16 1.24 0.92 1.32H=� 0.24 0.60 0.66 0.65 0.67 0.63 0.69 0.66 0.54 0.48 0.65 0.54 0.44 0.60 0.56 0.30 0.15 0.33H=� 0.95 1.28 1.50 1.17 1.59 1.48 1.21 1.38 1.65 1.75 1.61 1.90 1.72 1.56 1.73 1.54 1.08 1.65
(Continued on next page)
Shiro et al.
3616 aem.asm.org Applied and Environmental Microbiology
on Decem
ber 9, 2014 by DigiT
op -US
DA
's Digital D
esktop Libraryhttp://aem
.asm.org/
Dow
nloaded from
nodules on G. soja with similar efficiency. Marr et al. (45) reportedthat Amphicarpaea bracteata performed nodule formation with B.japonicum and B. elkanii and performed nitrogen fixation withB. elkanii, though A. bracteata will not be the original host for B.elkanii. Furthermore, Tang et al. (46) investigated the microevo-lution and origins of Bradyrhizobium populations in easternNorth America associated with soybean and native legumes (A.bracteata and Desmodium canadense) using genetic characteriza-tion by multilocus sequence typing of six core (housekeeping)gene sequences and two symbiotic gene sequences, and the resultssuggested that soybean-nodulating bacteria associated with nativelegumes represent a novel source of ecologically adapted bacteriafor soybean inoculation. In addition, the Rj4 soybean genotype isknown to produce weak nodulation with certain B. elkanii strains(e.g., USDA 61 and USDA 94) (47, 48). In fact, infection by bra-dyrhizobia belonging to the Be94 cluster isolated from Bragg(non-Rj) and CNS (Rj2Rj3) cultivars in Ohio and North Carolina,which produced high dominance of B. japonicum, was inhibitedby the soybean cultivar with the Rj4 genotype (Fig. 2). These re-sults suggest that the interaction between host plants and rhizobiainvolved both host specificity and host preference. Further analy-sis of phenotypic traits of isolates, such as compatibility and pref-erence with Rj genotypes, and genetic diversity of other genes ofisolates, such as nodulation genes and housekeeping genes, mustbe conducted for elucidation of ecological, evolutionary, and phy-logenetic relationships.
Siratro is a major pasture legume that is cultivated in the trop-ics and subtropics, including parts of Australia, South and CentralAmerica, and some Pacific islands (49). Additionally, A. bracteatais an annual legume that distributes widely in eastern NorthAmerica (50, 51). The presence of these legumes that have com-patibility for nodulation with B. elkanii might contribute stronglyto the high dominance of B. elkanii in North America. We expectthat further research on the competition between inoculated andindigenous bradyrhizobia and the environmental adaptability ofbradyrhizobia will lead to the establishment of improved inocula-tion techniques based on the use of the most effective bradyrhizo-bium for a given host and region. The knowledge of the geograph-ical distribution of indigenous soybean-nodulating bradyrhizobiaprovided by the present study will help to guide that future re-search.
ACKNOWLEDGMENTS
This study was supported mainly by a Japan Society for the Promotion ofScience KAKENHI grant (Grants-in-Aid for Scientific Research [C], no.22580068) and partially by a grant from the Ministry of Agriculture, For-estry and Fisheries of Japan (Genomics for Agricultural Innovation SOY-2001).
REFERENCES1. Chen WX, Yan GH, Li LJ. 1988. Numerical taxonomic study of fast-
growing soybean rhizobia and a proposal that Rhizobium fredii be assignedto Sinorhizobium gen. nov. Int. J. Syst. Bacteriol. 38:392–397.
2. Jordan DC. 1982. Transfer of Rhizobium japonicum Buchanan 1980 toBradyrhizobium gen. nov., a genus of slow-growing, root nodule bacteriafrom leguminous plants. Int. J. Syst. Bacteriol. 32:136 –139.
3. Kuykendall LD, Saxena B, Cevine TE, Udell SE. 1992. Genetic diversityin Bradyrhizobium Jordan 1982 and a proposal for Bradyrhizobium elkaniisp. nov. Can. J. Microbiol. 38:501–505.
4. Scholla MH, Elkan HG. 1984. Rhizobium fredii sp.nov. a fast-growingspecies that effectively nodulates soybeans. Int. J. Syst. Bacteriol. 34:484 –486.
5. Young JM. 2003. The genus name Ensifer Casida 1982 takes priority overSinorhizobium Chen et al. 1988, and Sinorhizobium morelense Wang et al.2002 is a later synonym of Ensifer adhaerens Casida 1982. Is the combina-tion ‘Sinorhizobium adhaerens ’ (Casida 1982) Willems et al. 2003 legiti-mate? Request for an opinion. Int. J. Syst. Evol. Microbiol. 53:2107–2110.
6. Chen W, Wang E, Wang S, Li Y, Chen X, Li Y. 1995. Characteristics ofRhizobium tianshanense sp. nov., a moderately and slowly growing rootnodule bacterium isolated from an arid saline environment in Xinjiang,People’s Republic of China. Int. J. Syst. Bacteriol. 45:153–159.
7. Peng GX, Tan ZY, Wang ET, Reinhold-Hurek B, Chen WF, Chen WX.2002. Identification of isolates from soybean nodules in Xinjiang region asSinorhizobium xinjiangense and genetic differentiation of S. xinjiangensefrom Sinorhizobium fredii. Int. J. Syst. Evol. Microbiol. 52:457– 462.
8. Tan ZY, Xu XD, Wang ET, Gao JL, Martinez-Romero E, Chen WX.1997. Phylogenetic and genetic relationships of Mesorhizobium tian-shanense and related rhizobia. Int. J. Syst. Bacteriol. 47:874 – 879.
9. Vinuesa P, Rojas-Jiménez K, Contreras-Moreira B, Mahna SK, PrasadBN, Moe H, Selvaraju SB, Thierfelder H, Werner D. 2008. Multilocussequence analysis for assessment of the biogeography and evolutionarygenetics of four Bradyrhizobium species that nodulate soybeans on theAsiatic continent. Appl. Environ. Microbiol. 74:6987– 6996.
10. Xu ML, Ge C, Cui Z, Li J, Fan H. 1995. Bradyhizobium liaoningense sp.nov., isolated from the root nodules of soybeans. Int. J. Syst. Bacteriol.45:706 –711.
11. Yao YZ, Kan FL, Wang ET, Wei GH, Chen X. 2002. Characterization ofrhizobia that nodulate legume species of the genus Lespedeza and descrip-tion of Bradyrhizobium yuanmingense sp. nov. Int. J. Syst. Evol. Microbiol.52:2219 –2230.
12. Saeki Y, Aimi N, Tsukamoto S, Yamakawa T, Nagatomo Y, Akao S.2006. Diversity and geographical distribution of indigenous soybean-nodulating bradyrhizobia in Japan. Soil Sci. Plant Nutr. 52:418 – 426.
13. Saeki Y, Minami M, Yamamoto A, Akao S. 2008. Estimation of thebacterial community diversity of soybean-nodulating rhizobia isolatedfrom Rj-genotype soybean. Soil Sci. Plant Nutr. 54:718 –724.
14. Saeki Y. 2011. Characterization of soybean-nodulating rhizobial commu-nities and diversity, p 163–184. In S Aleksandra (ed), Soybean—molecularaspects of breeding. Intech, Rijeka, Croatia.
15. Adhikari D, Kaneto M, Itoh K, Suyama K, Pokharel BB, Gaihre YK.2012. Genetic diversity of soybean-nodulating rhizobia in Nepal in rela-tion to climate and soil properties. Plant Soil 357:131–145.
16. Saeki Y, Kaneko A, Hara T, Suzuki K, Yamakawa T, Nguyen MT,Nagatomo Y, Akao S. 2005. Phylogenetic analysis of soybean-nodulatingrhizobia isolated from alkaline soils in Vietnam. Soil Sci. Plant Nutr. 51:1043–1052.
17. Suzuki K, Oguro H, Yamakawa T, Yamamoto A, Akao S, Saeki Y. 2008.Diversity and distribution of indigenous soybean-nodulating rhizobia inthe Okinawa Islands, Japan. Soil Sci. Plant Nutr. 54:237–246.
18. Caldwell BE. 1966. Inheritance of a strain-specific ineffective nodulationin soybean. Crop Sci. 6:427– 428.
19. Vest G. 1970. Rj3—a gene conditioning ineffective nodulation in soybean.Crop Sci. 10:34 –35.
20. Vest G, Caldwell EB. 1972. Rj4—a gene conditioning ineffective nodula-tion in soybean. Crop Sci. 12:692– 693.
TABLE 2 (Continued)
KY NC AL1 AL2 GA FL
KY-GA KY-FL KY-LA NC-AL1 NC-AL2 NC-GA NC-FL NC-LA AL1-AL2 AL1-GA AL1-FL AL1-LA AL2-GA AL2-FL AL2-LA GA-FL GA-LA FL-LA
1.25 0.93 1.13 1.08 1.48 1.41 1.08 1.28 1.16 1.09 0.77 0.97 1.49 1.17 1.37 1.09 1.29 0.970.20 0.26 0.39 0.24 0.11 0.18 0.28 0.35 0.20 0.20 0.09 0.29 0.10 0.16 0.08 0.13 0.16 0.231.45 1.19 1.51 1.32 1.59 1.58 1.37 1.63 1.36 1.29 0.86 1.25 1.59 1.32 1.45 1.22 1.45 1.20
Genetic Diversity of American Bradyrhizobia
June 2013 Volume 79 Number 12 aem.asm.org 3617
on Decem
ber 9, 2014 by DigiT
op -US
DA
's Digital D
esktop Libraryhttp://aem
.asm.org/
Dow
nloaded from
21. Williams LF, Lynch LD. 1954. Inheritance of a non-nodulating characterin the soybean. Agron. J. 46:28 –29.
22. Minami M, Yamakawa T, Yamamoto A, Akao S, Saeki Y. 2009. Esti-mation of nodulation tendency among Rj-genotype soybeans using thebradyrhizobial community isolated from an Andosol. Soil Sci. Plant Nutr.55:65–72.
23. Shiro S, Yamamoto A, Umehara Y, Hayashi M, Yoshida N, NishiwakiA, Yamakawa T, Saeki Y. 2012. Effect of Rj genotype and cultivationtemperature on the community structure of soybean-nodulating brady-rhizobia. Appl. Environ. Microbiol. 78:1243–1250.
24. Saeki Y, Akagi I, Takaki H, Nagatomo Y. 2000. Diversity of indigenousBradyrhizobium strains isolated from three different Rj-soybean cultivarsin terms of randomly amplified polymorphic DNA and intrinsic antibioticresistance. Soil Sci. Plant Nutr. 46:917–926.
25. Vincent JM. 1970. A manual for the practical study of the root-nodulebacteria. International Biological Program. Blackwell Scientific, Oxford,United Kingdom.
26. Keyser HH, Bohlool BB, Hu TS, Weber DF. 1982. Fast-growing rhizobiaisolated from root nodules of soybean. Science 215:1631–1632.
27. Cole MA, Elkan GH. 1973. Transmissible resistance to penicillin G, neo-mycin & chloramphenicol in Rhizobium japonicum. Antimicrob. AgentsChemother. 4:248 –253.
28. Sameshima R, Iwasa T, Sadowsky MJ, Hamada T, Kasai H, ShutsrirungA, Mitsui H, Minamisawa K. 2003. Phylogeny and distribution of extra-slow-growing Bradyrhizobium japonicum harboring high copy numbersof RS�, RS� and IS1631. FEMS Microbiol. Ecol. 44:191–202.
29. Hiraishi A, Kamagata Y, Nakamura K. 1995. Polymerase chain reactionamplification and restriction fragment length polymorphism analysis of16S rRNA genes from methanogens. J. Ferment. Bioeng. 79:523–529.
30. Saeki Y, Aimi N, Hashimoto M, Tsukamoto S, Kaneko A, Yoshida N,Nagatomo Y, Akao S. 2004. Grouping of Bradyrhizobium USDA strainsby sequence analysis of 16S rDNA and 16S–23S rDNA internal transcribedspacer region. Soil Sci. Plant Nutr. 50:517–525.
31. Nei M, Li HW. 1979. Mathematical model for studying genetic variationin terms of restriction endonucleases. Proc. Natl. Acad. Sci. U. S. A. 76:5269 –5273.
32. Sakai M, Futamata H, Kim SJ, Matuguchi T. 1998. Effect of soil salinityon population structure of fluorescent pseudomonads in spinach rhizo-sphere. Soil Sci. Plant Nutr. 44:701–705.
33. MacArthur RH. 1965. Patterns of species diversity. Biol. Rev. 40:510 –533.34. Pielou EC. 1969. Ecological diversity and its measurement. An introduc-
tion to mathematical ecology, p 221–235. Wiley Interscience, New York,NY.
35. Kobayashi S. 1995. Multivariate analysis of biological communities. SojuShobo, Tokyo, Japan.
36. Whittaker RH. 1972. Evolution and measurement of species diversity.Taxon 21:213–251.
37. Faith PD, Minchin PR, Belbin L. 1987. Compositional dissimilarity as arobust measure of ecological distance. Vegetatio 69:57– 68.
38. Bray JR, Curtis TJ. 1957. An ordination of the upland forest communitiesof southern Wisconsin. Ecol. Monogr. 27:325–349.
39. Michie GM. 1982. Use of the Bray-Curtis similarity measure in clusteranalysis of foraminiferal date. Math. Geol. 14:661– 667.
40. Whittaker RH. 1967. Gradient analysis of vegetation. Biol. Rev. 49:207–264.
41. Keyser HH, Weber DF, Uratsu SL. 1984. Rhizobium japonicum sero-group and hydrogenase phenotype distribution in 12 states. Appl. Envi-ron. Microbiol. 47:613– 615.
42. Fuhrmann J. 1990. Symbiotic effectiveness of indigenous soybean brady-rhizobia as related to serological, morphological, rhizobitoxine, and hy-drogenase phenotypes. Appl. Environ. Microbiol. 56:224 –229.
43. van Berkum P, Fuhrmann JJ. 2000. Evolutionary relationships amongthe soybean bradyrhizobia reconstructed from 16S rRNA gene and inter-nally transcribed spacer region sequence divergence. Int. J. Syst. Evol.Microbiol. 50:2165–2172.
44. Minamisawa K, Onodera S, Tanimura Y, Kobayashi N, Yuhashi K,Kubota M. 1997. Preferential nodulation of Glycine max, Glycine soja andMacroptilium atropurpureum by two Bradyrhizobium species japonicumand elkanii. FEMS Microbiol. Ecol. 24:49 –56.
45. Marr DL, Devine TE, Parker MA. 1997. Nodulation restrictive genotypesof Glycine and Amphicarpaea: a comparative analysis. Plant Soil 189:181–188.
46. Tang J, Bromfield ESP, Rodrigue N, Cloutier S, Tambong JT. 2012.Microevolution of symbiotic Bradyrhizobium populations associated withsoybeans in east North America. Ecol. Evol. 2:2943–2961.
47. Devine ET, Kuykendall LD. 1996. Host genetic control of symbiosis insoybean (Glycine max L.). Plant Soil. 186:173–187.
48. Devine ET, Kuykendall LD, O’Neill JJ. 1990. The Rj4 allele in soybeanrepresses nodulation by chlorosis-inducing bradyrhizobia classified asDNA homology group II by antibiotic resistance profiles. Theor. Appl.Genet. 80:33–37.
49. Shaw HN, Whiteman PC. 1977. Siratro—a success story in breeding atropical pasture legume. Trop. Grassl. 11:7–14.
50. Parker MA. 1991. Local genetic differentiation for disease resistance in aselfing annual. Biol. J. Linn. Soc. 42:337–349.
51. Turner BL, Fearing OS. 1964. A taxonomic study of the genus Amphi-carpaea (Leguminosae). Southwest. Nat. 9:207–218.
Shiro et al.
3618 aem.asm.org Applied and Environmental Microbiology
on Decem
ber 9, 2014 by DigiT
op -US
DA
's Digital D
esktop Libraryhttp://aem
.asm.org/
Dow
nloaded from