Embed Size (px)
Citation preview
Research ArticleGenetic Markers Can Predict Chondrogenic DifferentiationPotential in Bone Marrow-Derived Mesenchymal Stromal Cells
Masami Kanawa,1 Akira Igarashi,2,3 Katsumi Fujimoto ,3,4 Yukihito Higashi,5
Hidemi Kurihara,6 Masaru Sugiyama,7 Tania Saskianti,3,8 Yukio Kato ,3
and Takeshi Kawamoto 3,9
1Natural Science Center for Basic Research and Development, Hiroshima University, Hiroshima 734-8533, Japan2Department of Advanced Technology and Development, BML, Inc., Saitama 350-1101, Japan3Department of Dental and Medical Biochemistry, Graduate School of Biomedical & Health Sciences, Hiroshima University,Hiroshima 734-8533, Japan4Department of Molecular Biology and Biochemistry, Graduate School of Biomedical & Health Sciences, Hiroshima University,Hiroshima 734-8533, Japan5Research Center for Radiation Genome Medicine, Research Institute for Radiation Biology and Medicine, Hiroshima University,Hiroshima 734-8533, Japan6Departments of Periodontal Medicine, Graduate School of Biomedical & Health Sciences, Hiroshima University,Hiroshima 734-8533, Japan7Departments of Public Oral Health, Graduate School of Biomedical & Health Sciences, Hiroshima University,Hiroshima 734-8533, Japan8Department of Pediatric Dentistry, Faculty of Dental Medicine, Universitas Airlangga, Surabaya 60132, Indonesia9Writing Center, Hiroshima University, Higashi-Hiroshima 739-8512, Japan
Correspondence should be addressed to Takeshi Kawamoto; [email protected]
Received 29 May 2018; Accepted 27 August 2018; Published 10 October 2018
Academic Editor: Stan Gronthos
Copyright © 2018Masami Kanawa et al. This is an open access article distributed under the Creative Commons Attribution License,which permits unrestricted use, distribution, and reproduction in any medium, provided the original work is properly cited.
The precise predictions of the differentiation direction and potential of mesenchymal stromal cells (MSCs) are an important key tothe success of regenerative medicine. The expression levels of fate-determining genes may provide tools for predictingdifferentiation potential. The expression levels of 95 candidate marker genes and glycosaminoglycan (GAG) contents afterchondrogenic induction in 10 undifferentiated ilium and 5 jaw MSC cultures were determined, and their correlations wereanalyzed. The expression levels of eight genes before the induction of chondrogenic MSC differentiation were significantlycorrelated with the GAG levels after induction. Based on correlation patterns, the eight genes were classified into two groups:group 1 genes (AURKB, E2F1, CDKN2D, LIF, and ACLY), related to cell cycle regulation, and group 2 genes (CD74, EFEMP1,and TGM2), involved in chondrogenesis. The expression levels of the group 2 genes were significantly correlated with the agesof the cell donors. The expression levels of CDKN2D, CD74, and TGM2 were >10-fold higher in highly potent MSCs (iliumMSCs) than in MSCs with limited potential (jaw MSCs). Three-dimensional (3D) scatter plot analyses of the expression levels ofthese genes showed reduced variability between donors and confirmed predictive potential. These data suggest that group 2genes are involved in age-dependent decreases in the chondrogenic differentiation potential of MSCs, and combined 3Danalyses of the expression profiles of three genes, including two group 2 genes, were predictive of MSC differentiation potential.
1. Introduction
Mesenchymal stromal cells (MSCs) can differentiate intovarious cell types, including osteoblasts, chondrocytes, or
adipocytes; therefore, they are promising as regenerativemedicine [1–4]. MSCs are usually obtained using bone mar-row aspirated from the iliac crest. Recently, we developedanother method to obtain MSCs from jaw bone marrow
HindawiStem Cells InternationalVolume 2018, Article ID 9530932, 9 pageshttps://doi.org/10.1155/2018/9530932
collected during wisdom tooth extraction [5], a surgery thatseveral young adults undergo. The differentiation potentialof MSCs varies depending on the tissue sources and the phys-ical conditions of donors [6–9]. Accordingly, we previouslydemonstrated that MSCs from jaw bone marrow have poorchondrogenic differentiation capacity, although they havehigh osteogenic differentiation capacity, as seen in iliumMSCs [5]. In another study, we showed that chondrogenicdifferentiation potential of MSCs from ilium bone marrowdepends on the age of cell donors [10].
Predicting the differentiation direction of MSCs is a cru-cial determinant of clinical outcomes of regenerative medi-cine, and several cell surface markers have been identifiedas predictors of such capabilities. CD105+, CD146+,CD271+, or ROR2+ MSCs have enhanced capacity for chon-drogenic differentiation [11–14]. CD146+ MSCs also havegreater therapeutic potential than CD146− cells [15]. How-ever, the utility of these cell surface markers has not yet beenestablished. Hence, in addition to cell surface markers, geneexpression patterns may provide a strategy for predictingthe differentiation potential of MSCs.
Recently, we produced a TaqMan low-density array com-prising real-time PCR probes and the primers for 95 markercandidate genes that were selected from microarray analysesof 17,703 genes [16]. Because these 95 genes showed higherexpression levels in MSCs than in fibroblasts, we predictedthat some of these genes may serve as MSC markers foridentifying cells having high potential for differentiation intospecific cell types such as chondrocytes.
In the present study, we aimed to find prediction markersto select potent MSCs by comparing gene expression profilesand differentiation levels. Accordingly, we determined theexpression levels of 95 marker candidate genes in undiffer-entiated MSCs from various donors and analyzed the cor-relation between the expression and glycosaminoglycan(GAG) protein levels in MSCs after induction of chondro-genic differentiation. The mRNA levels of eight genes werestrongly correlated with MSC potency, as indicated byGAG production.
2. Materials and Methods
2.1. Cells. Human bone marrow MSCs were isolated frompatients at the Hiroshima University Hospital and were
cultured with the approval of the Hiroshima UniversityEthics Committee, as described previously [10, 16]. IliumMSCs were isolated from 10 patients aged 25, 39, 53, 55,59, 61, 63, 64, 65, and 81 years, and jaw MSCs were col-lected from 5 patients aged 20, 28, 36, 36, and 63 years[10, 16]. The donor ID numbers and ages are listed inTable S1 in Supplementary Materials.
2.2. Chondrogenic Differentiation of MSCs. MSCs fromfourth-passage cultures were seeded at 2.5× 10⁵ cells in15mL centrifuge tubes for pellet culture in a chondrogenicdifferentiation medium and were maintained for 28 days asdescribed previously [10, 17]. The GAG contents were thenmeasured using a sulfated GAG assay kit (Biocolor), accord-ing to the manufacturer’s instructions. Data were normalizedby the amounts of genomic DNA determined using Pico-Green fluorescence assays (Invitrogen).
2.3. Quantitative RT-PCR. Total RNA was isolated fromconfluent third-passage cultures using the RNeasy Mini Kit(Qiagen) as described previously [16]. First-strand cDNAwas synthesized using ReverTra Ace-α (Toyobo), and real-time quantitative PCR was performed using the ABI Prism7900 Sequence Detection System (Applied Biosystems) witha TaqMan low-density array (Applied Biosystems), whichcontains TaqMan probe and primer sets (TaqMan GeneExpression Assays) for 95 genes. The 95 genes were selectedbecause their expression levels in ilium or jaw MSCs weremore than two-fold higher than those in fibroblasts onmicroarray analyses [16]. The probe set IDs of TaqManprobe and primer sets for ACLY, AURKB, CD74, CDKN2D,E2F1, EFEMP1, LIF, and TGM2 are provided in Table 1.The genes examined in this study are listed in Table S1 inSupplementary Materials with their mRNA expression levelsrelative to that of β-actin.
2.4. Statistical Analysis. Statistical analyses were performedusing SPSS Statistics forWindows, version 24.0. (IBMCorp.).Comparisons were made using Student’s t-tests whencomparing two experimental groups; correlations betweenmRNA expression levels and GAG contents, donor ages, orthe mRNA expression levels of other genes were identifiedusing Pearson correlation coefficients. The coefficientbetween the mRNA levels of group 2 genes and donor ages
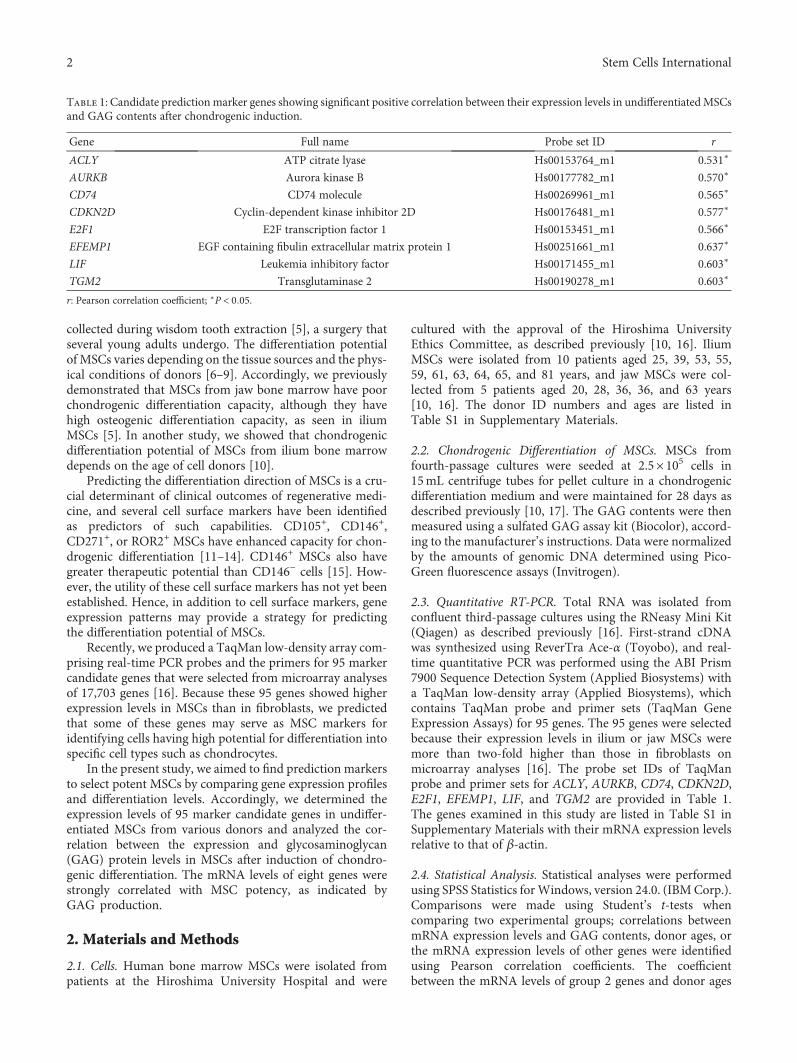
Table 1: Candidate prediction marker genes showing significant positive correlation between their expression levels in undifferentiatedMSCsand GAG contents after chondrogenic induction.
Gene Full name Probe set ID r
ACLY ATP citrate lyase Hs00153764_m1 0.531∗
AURKB Aurora kinase B Hs00177782_m1 0.570∗
CD74 CD74 molecule Hs00269961_m1 0.565∗
CDKN2D Cyclin-dependent kinase inhibitor 2D Hs00176481_m1 0.577∗
E2F1 E2F transcription factor 1 Hs00153451_m1 0.566∗
EFEMP1 EGF containing fibulin extracellular matrix protein 1 Hs00251661_m1 0.637∗
LIF Leukemia inhibitory factor Hs00171455_m1 0.603∗
TGM2 Transglutaminase 2 Hs00190278_m1 0.603∗
r: Pearson correlation coefficient; ∗P < 0 05.
2 Stem Cells International
were calculated by linear regression analysis. Differences andcorrelations were considered significant when P < 0 05.
2.5. Cluster Analysis. Correlations between the mRNAexpression levels of ACLY, AURKB, CD74, CDKN2D, E2F1,EFEMP1, LIF, and TGM2 were evaluated using hierarchicalcluster analyses with the nearest-neighbor algorithm andare presented in a dendrogram that was generated using SPSSversion 24.0.
2.6. Three-Dimensional (3D) Scatter Plot Analysis. 3D scatterplots were constructed using SPSS version 24.0. In this analysis,the relative mRNA expression levels of CDKN2D, CD74, andTGM2 in MSCs from 15 donors were recalculated relative tomaximum values of 100 for each gene, and the distancesbetween each point and the origin were then calculated.
3. Results
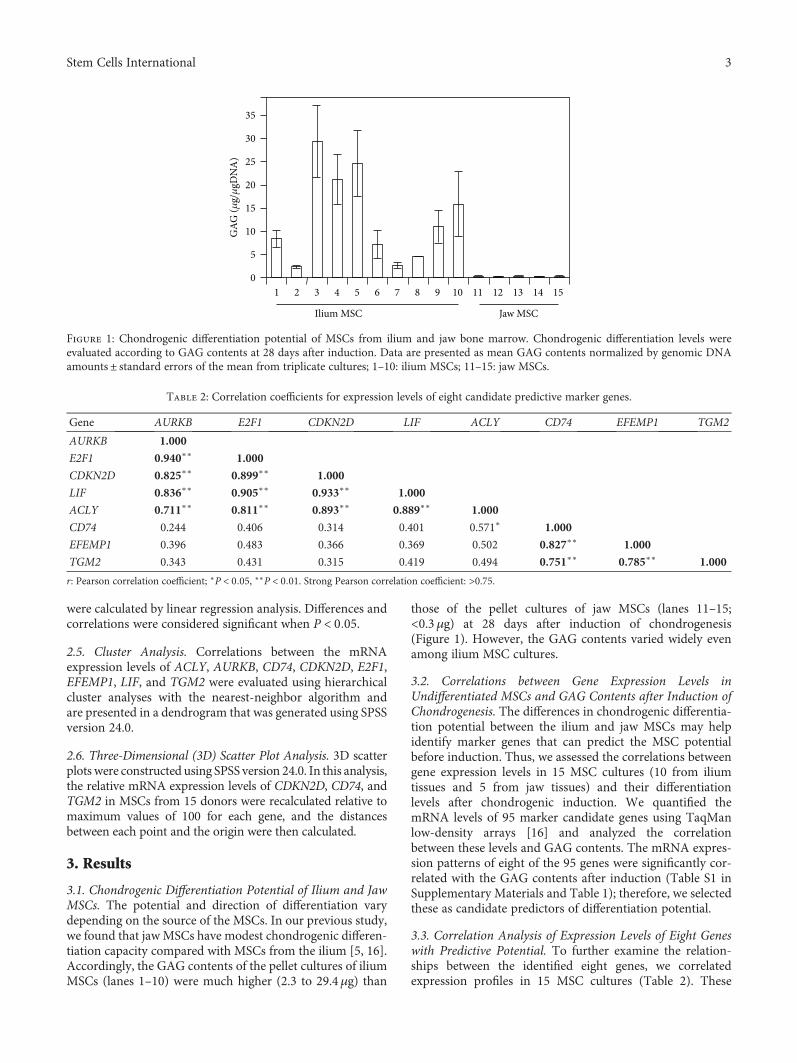
3.1. Chondrogenic Differentiation Potential of Ilium and JawMSCs. The potential and direction of differentiation varydepending on the source of the MSCs. In our previous study,we found that jawMSCs have modest chondrogenic differen-tiation capacity compared with MSCs from the ilium [5, 16].Accordingly, the GAG contents of the pellet cultures of iliumMSCs (lanes 1–10) were much higher (2.3 to 29.4μg) than
those of the pellet cultures of jaw MSCs (lanes 11–15;<0.3μg) at 28 days after induction of chondrogenesis(Figure 1). However, the GAG contents varied widely evenamong ilium MSC cultures.
3.2. Correlations between Gene Expression Levels inUndifferentiated MSCs and GAG Contents after Induction ofChondrogenesis. The differences in chondrogenic differentia-tion potential between the ilium and jaw MSCs may helpidentify marker genes that can predict the MSC potentialbefore induction. Thus, we assessed the correlations betweengene expression levels in 15 MSC cultures (10 from iliumtissues and 5 from jaw tissues) and their differentiationlevels after chondrogenic induction. We quantified themRNA levels of 95 marker candidate genes using TaqManlow-density arrays [16] and analyzed the correlationbetween these levels and GAG contents. The mRNA expres-sion patterns of eight of the 95 genes were significantly cor-related with the GAG contents after induction (Table S1 inSupplementary Materials and Table 1); therefore, we selectedthese as candidate predictors of differentiation potential.
3.3. Correlation Analysis of Expression Levels of Eight Geneswith Predictive Potential. To further examine the relation-ships between the identified eight genes, we correlatedexpression profiles in 15 MSC cultures (Table 2). These
1 2 3 4 5 6 7 8 9 10 11 12 13 14 15
Ilium MSC Jaw MSC
GAG
(�휇g/�휇
gDN
A)
35
30
25
20
15
10
5
0
Figure 1: Chondrogenic differentiation potential of MSCs from ilium and jaw bone marrow. Chondrogenic differentiation levels wereevaluated according to GAG contents at 28 days after induction. Data are presented as mean GAG contents normalized by genomic DNAamounts± standard errors of the mean from triplicate cultures; 1–10: ilium MSCs; 11–15: jaw MSCs.
Table 2: Correlation coefficients for expression levels of eight candidate predictive marker genes.
Gene AURKB E2F1 CDKN2D LIF ACLY CD74 EFEMP1 TGM2
AURKB 1.000
E2F1 0.940∗∗ 1.000
CDKN2D 0.825∗∗ 0.899∗∗ 1.000
LIF 0.836∗∗ 0.905∗∗ 0.933∗∗ 1.000
ACLY 0.711∗∗ 0.811∗∗ 0.893∗∗ 0.889∗∗ 1.000
CD74 0.244 0.406 0.314 0.401 0.571∗ 1.000
EFEMP1 0.396 0.483 0.366 0.369 0.502 0.827∗∗ 1.000
TGM2 0.343 0.431 0.315 0.419 0.494 0.751∗∗ 0.785∗∗ 1.000
r: Pearson correlation coefficient; ∗P < 0 05, ∗∗P < 0 01. Strong Pearson correlation coefficient: >0.75.
3Stem Cells International
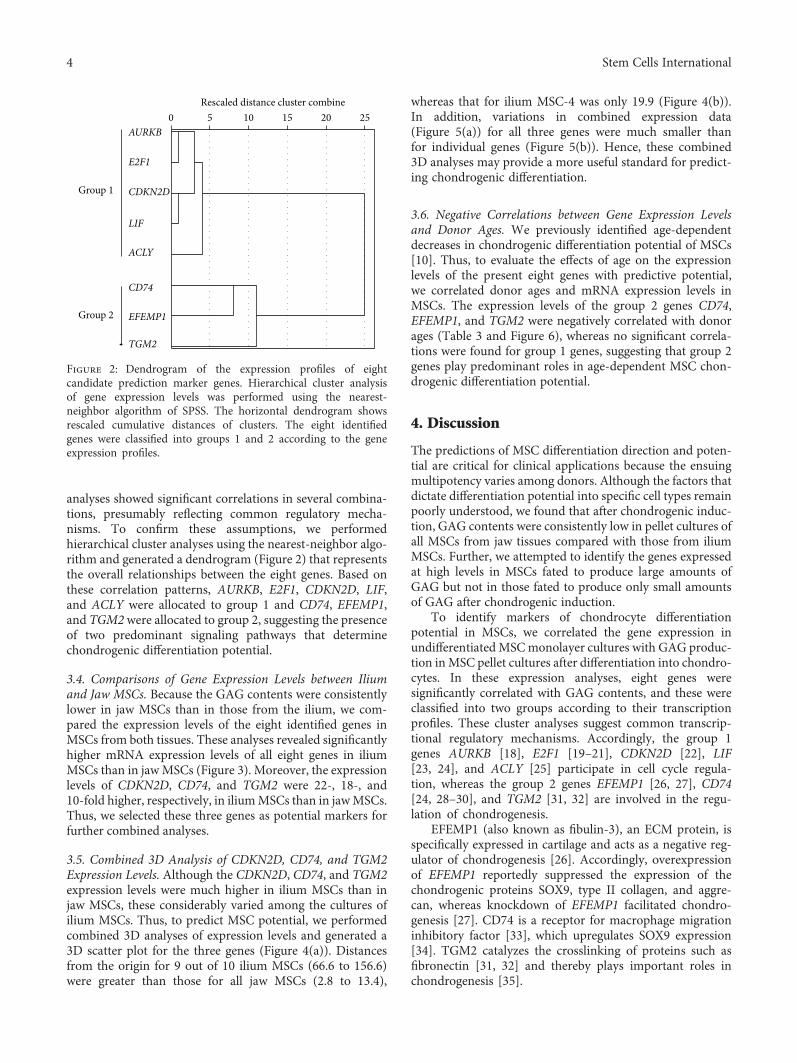
analyses showed significant correlations in several combina-tions, presumably reflecting common regulatory mecha-nisms. To confirm these assumptions, we performedhierarchical cluster analyses using the nearest-neighbor algo-rithm and generated a dendrogram (Figure 2) that representsthe overall relationships between the eight genes. Based onthese correlation patterns, AURKB, E2F1, CDKN2D, LIF,and ACLY were allocated to group 1 and CD74, EFEMP1,and TGM2 were allocated to group 2, suggesting the presenceof two predominant signaling pathways that determinechondrogenic differentiation potential.
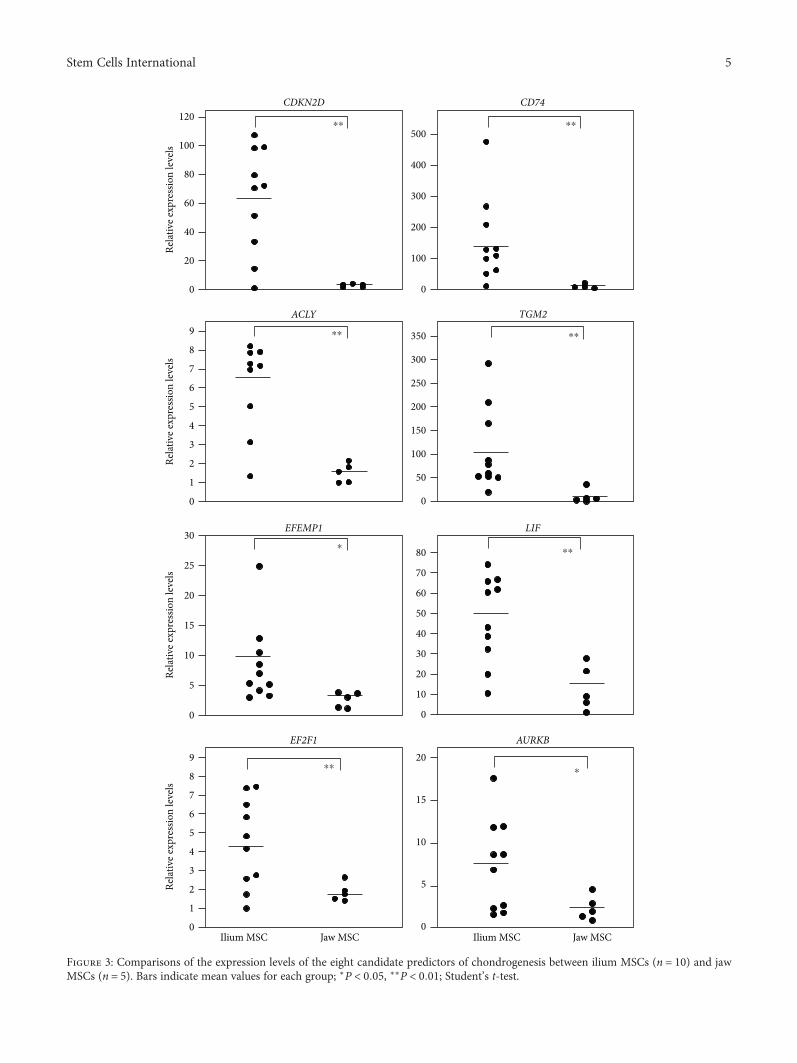
3.4. Comparisons of Gene Expression Levels between Iliumand Jaw MSCs. Because the GAG contents were consistentlylower in jaw MSCs than in those from the ilium, we com-pared the expression levels of the eight identified genes inMSCs from both tissues. These analyses revealed significantlyhigher mRNA expression levels of all eight genes in iliumMSCs than in jawMSCs (Figure 3). Moreover, the expressionlevels of CDKN2D, CD74, and TGM2 were 22-, 18-, and10-fold higher, respectively, in iliumMSCs than in jawMSCs.Thus, we selected these three genes as potential markers forfurther combined analyses.
3.5. Combined 3D Analysis of CDKN2D, CD74, and TGM2Expression Levels. Although the CDKN2D, CD74, and TGM2expression levels were much higher in ilium MSCs than injaw MSCs, these considerably varied among the cultures ofilium MSCs. Thus, to predict MSC potential, we performedcombined 3D analyses of expression levels and generated a3D scatter plot for the three genes (Figure 4(a)). Distancesfrom the origin for 9 out of 10 ilium MSCs (66.6 to 156.6)were greater than those for all jaw MSCs (2.8 to 13.4),
whereas that for ilium MSC-4 was only 19.9 (Figure 4(b)).In addition, variations in combined expression data(Figure 5(a)) for all three genes were much smaller thanfor individual genes (Figure 5(b)). Hence, these combined3D analyses may provide a more useful standard for predict-ing chondrogenic differentiation.
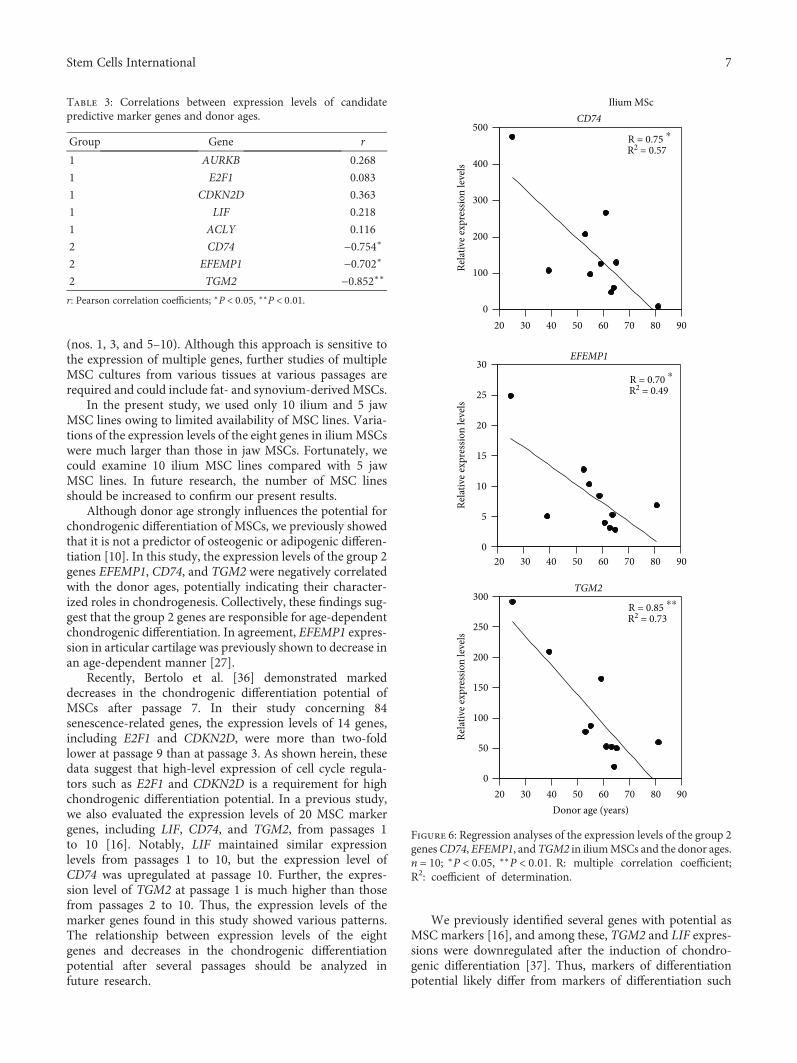
3.6. Negative Correlations between Gene Expression Levelsand Donor Ages. We previously identified age-dependentdecreases in chondrogenic differentiation potential of MSCs[10]. Thus, to evaluate the effects of age on the expressionlevels of the present eight genes with predictive potential,we correlated donor ages and mRNA expression levels inMSCs. The expression levels of the group 2 genes CD74,EFEMP1, and TGM2 were negatively correlated with donorages (Table 3 and Figure 6), whereas no significant correla-tions were found for group 1 genes, suggesting that group 2genes play predominant roles in age-dependent MSC chon-drogenic differentiation potential.
4. Discussion
The predictions of MSC differentiation direction and poten-tial are critical for clinical applications because the ensuingmultipotency varies among donors. Although the factors thatdictate differentiation potential into specific cell types remainpoorly understood, we found that after chondrogenic induc-tion, GAG contents were consistently low in pellet cultures ofall MSCs from jaw tissues compared with those from iliumMSCs. Further, we attempted to identify the genes expressedat high levels in MSCs fated to produce large amounts ofGAG but not in those fated to produce only small amountsof GAG after chondrogenic induction.
To identify markers of chondrocyte differentiationpotential in MSCs, we correlated the gene expression inundifferentiated MSCmonolayer cultures with GAG produc-tion inMSC pellet cultures after differentiation into chondro-cytes. In these expression analyses, eight genes weresignificantly correlated with GAG contents, and these wereclassified into two groups according to their transcriptionprofiles. These cluster analyses suggest common transcrip-tional regulatory mechanisms. Accordingly, the group 1genes AURKB [18], E2F1 [19–21], CDKN2D [22], LIF[23, 24], and ACLY [25] participate in cell cycle regula-tion, whereas the group 2 genes EFEMP1 [26, 27], CD74[24, 28–30], and TGM2 [31, 32] are involved in the regu-lation of chondrogenesis.
EFEMP1 (also known as fibulin-3), an ECM protein, isspecifically expressed in cartilage and acts as a negative reg-ulator of chondrogenesis [26]. Accordingly, overexpressionof EFEMP1 reportedly suppressed the expression of thechondrogenic proteins SOX9, type II collagen, and aggre-can, whereas knockdown of EFEMP1 facilitated chondro-genesis [27]. CD74 is a receptor for macrophage migrationinhibitory factor [33], which upregulates SOX9 expression[34]. TGM2 catalyzes the crosslinking of proteins such asfibronectin [31, 32] and thereby plays important roles inchondrogenesis [35].
Group 1
Group 2
AURKB
E2F1
CDKN2D
LIF
ACLY
CD74
EFEMP1
TGM2
Rescaled distance cluster combine0 5 10 15 20 25
Figure 2: Dendrogram of the expression profiles of eightcandidate prediction marker genes. Hierarchical cluster analysisof gene expression levels was performed using the nearest-neighbor algorithm of SPSS. The horizontal dendrogram showsrescaled cumulative distances of clusters. The eight identifiedgenes were classified into groups 1 and 2 according to the geneexpression profiles.
4 Stem Cells International
Relat
ive e
xpre
ssio
n le
vels
Relat
ive e
xpre
ssio
n le
vels
Relat
ive e
xpre
ssio
n le
vels
Relat
ive e
xpre
ssio
n le
vels
120
100
80
60
40
20
0
9
8
7
6
5
4
3
2
1
0
30
25
20
15
10
5
0
9
8
7
6
5
4
3
2
1
0
500
400
300
200
100
0
350
300
250
200
150
100
50
0
80
70
60
50
40
30
20
10
0
20
15
10
5
0
CDKN2D
ACLY
EFEMP1
EF2F1
CD74
TGM2
LIF
AURKB
Ilium MSC Jaw MSC Ilium MSC Jaw MSC
⁎⁎ ⁎⁎
⁎⁎
⁎⁎
⁎⁎⁎
⁎
⁎⁎
Figure 3: Comparisons of the expression levels of the eight candidate predictors of chondrogenesis between ilium MSCs (n = 10) and jawMSCs (n = 5). Bars indicate mean values for each group; ∗P < 0 05, ∗∗P < 0 01; Student’s t-test.
5Stem Cells International
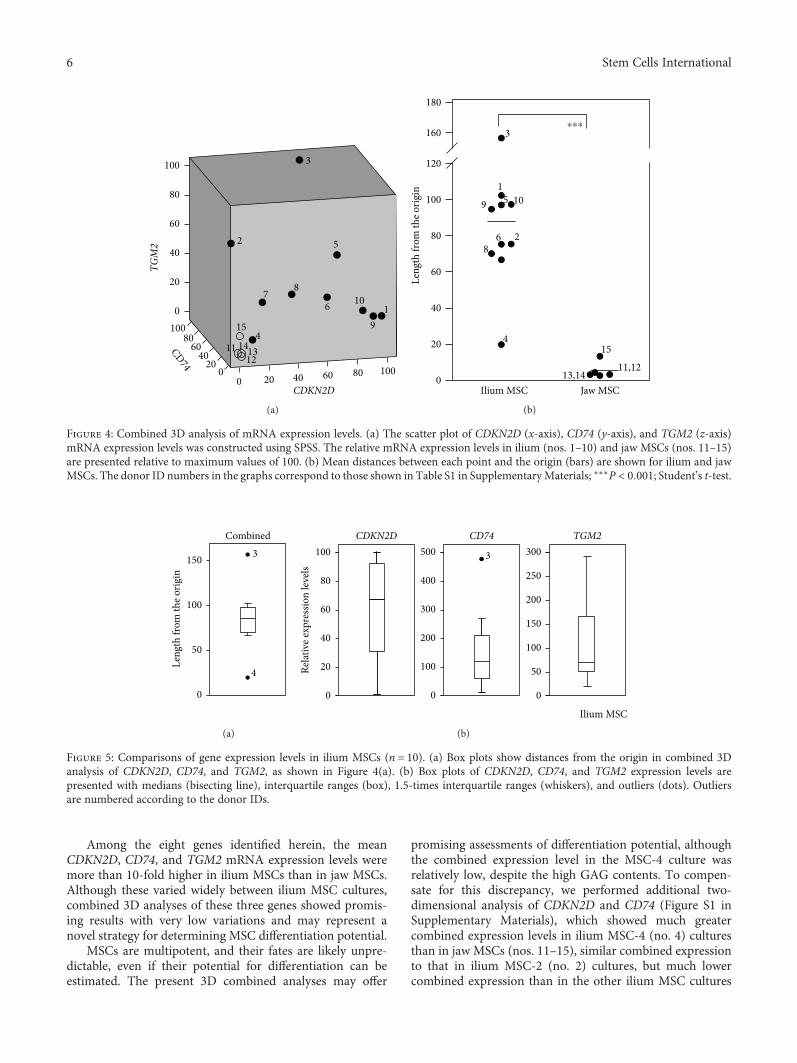
Among the eight genes identified herein, the meanCDKN2D, CD74, and TGM2 mRNA expression levels weremore than 10-fold higher in ilium MSCs than in jaw MSCs.Although these varied widely between ilium MSC cultures,combined 3D analyses of these three genes showed promis-ing results with very low variations and may represent anovel strategy for determining MSC differentiation potential.
MSCs are multipotent, and their fates are likely unpre-dictable, even if their potential for differentiation can beestimated. The present 3D combined analyses may offer
promising assessments of differentiation potential, althoughthe combined expression level in the MSC-4 culture wasrelatively low, despite the high GAG contents. To compen-sate for this discrepancy, we performed additional two-dimensional analysis of CDKN2D and CD74 (Figure S1 inSupplementary Materials), which showed much greatercombined expression levels in ilium MSC-4 (no. 4) culturesthan in jaw MSCs (nos. 11–15), similar combined expressionto that in ilium MSC-2 (no. 2) cultures, but much lowercombined expression than in the other ilium MSC cultures
11 14
15
134
12
7 8
6 101
9
52
3100
80
60
40
20
0100
8060
4020
0
TGM2
CD74
0 20 40 60 80 100
CDKN2D
(a)
15
11,1213,14
4
86 2
9
15 10
3⁎⁎⁎
180
160
120
100
80
60
40
20
0
Leng
th fr
om th
e orig
in
Ilium MSC Jaw MSC
(b)
Figure 4: Combined 3D analysis of mRNA expression levels. (a) The scatter plot of CDKN2D (x-axis), CD74 (y-axis), and TGM2 (z-axis)mRNA expression levels was constructed using SPSS. The relative mRNA expression levels in ilium (nos. 1–10) and jaw MSCs (nos. 11–15)are presented relative to maximum values of 100. (b) Mean distances between each point and the origin (bars) are shown for ilium and jawMSCs. The donor ID numbers in the graphs correspond to those shown in Table S1 in SupplementaryMaterials; ∗∗∗P < 0 001; Student’s t-test.
Leng
th fr
om th
e orig
in
150
100
50
0
3
4
Combined
(a)
Relat
ive e
xpre
ssio
n le
vels
CDKN2D CD74 TGM2
80
60
40
20
500
400
300
200
100
3 300
250
200
150
100
50
0
Ilium MSC
100
0 0
(b)
Figure 5: Comparisons of gene expression levels in ilium MSCs (n = 10). (a) Box plots show distances from the origin in combined 3Danalysis of CDKN2D, CD74, and TGM2, as shown in Figure 4(a). (b) Box plots of CDKN2D, CD74, and TGM2 expression levels arepresented with medians (bisecting line), interquartile ranges (box), 1.5-times interquartile ranges (whiskers), and outliers (dots). Outliersare numbered according to the donor IDs.
6 Stem Cells International
(nos. 1, 3, and 5–10). Although this approach is sensitive tothe expression of multiple genes, further studies of multipleMSC cultures from various tissues at various passages arerequired and could include fat- and synovium-derived MSCs.
In the present study, we used only 10 ilium and 5 jawMSC lines owing to limited availability of MSC lines. Varia-tions of the expression levels of the eight genes in iliumMSCswere much larger than those in jaw MSCs. Fortunately, wecould examine 10 ilium MSC lines compared with 5 jawMSC lines. In future research, the number of MSC linesshould be increased to confirm our present results.
Although donor age strongly influences the potential forchondrogenic differentiation of MSCs, we previously showedthat it is not a predictor of osteogenic or adipogenic differen-tiation [10]. In this study, the expression levels of the group 2genes EFEMP1, CD74, and TGM2 were negatively correlatedwith the donor ages, potentially indicating their character-ized roles in chondrogenesis. Collectively, these findings sug-gest that the group 2 genes are responsible for age-dependentchondrogenic differentiation. In agreement, EFEMP1 expres-sion in articular cartilage was previously shown to decrease inan age-dependent manner [27].
Recently, Bertolo et al. [36] demonstrated markeddecreases in the chondrogenic differentiation potential ofMSCs after passage 7. In their study concerning 84senescence-related genes, the expression levels of 14 genes,including E2F1 and CDKN2D, were more than two-foldlower at passage 9 than at passage 3. As shown herein, thesedata suggest that high-level expression of cell cycle regula-tors such as E2F1 and CDKN2D is a requirement for highchondrogenic differentiation potential. In a previous study,we also evaluated the expression levels of 20 MSC markergenes, including LIF, CD74, and TGM2, from passages 1to 10 [16]. Notably, LIF maintained similar expressionlevels from passages 1 to 10, but the expression level ofCD74 was upregulated at passage 10. Further, the expres-sion level of TGM2 at passage 1 is much higher than thosefrom passages 2 to 10. Thus, the expression levels of themarker genes found in this study showed various patterns.The relationship between expression levels of the eightgenes and decreases in the chondrogenic differentiationpotential after several passages should be analyzed infuture research.
We previously identified several genes with potential asMSC markers [16], and among these, TGM2 and LIF expres-sions were downregulated after the induction of chondro-genic differentiation [37]. Thus, markers of differentiationpotential likely differ from markers of differentiation such
Table 3: Correlations between expression levels of candidatepredictive marker genes and donor ages.
Group Gene r
1 AURKB 0.268
1 E2F1 0.083
1 CDKN2D 0.363
1 LIF 0.218
1 ACLY 0.116
2 CD74 −0.754∗
2 EFEMP1 −0.702∗
2 TGM2 −0.852∗∗
r: Pearson correlation coefficients; ∗P < 0 05, ∗∗P < 0 01.
CD74Ilium MSc
R = 0.75 ⁎
R2 = 0.57
R = 0.70 ⁎
R2 = 0.49
R = 0.85 ⁎⁎
R2 = 0.73
500
400
300
200
100
0
Relat
ive e
xpre
ssio
n le
vels
Relat
ive e
xpre
ssio
n le
vels
Relat
ive e
xpre
ssio
n le
vels
20 30 40 50 60 70 80 90
20 30 40 50 60 70 80 90
20 30 40 50 60 70 80 90
EFEMP130
25
20
15
10
5
0
TGM2300
250
200
150
100
50
0
Donor age (years)
Figure 6: Regression analyses of the expression levels of the group 2genesCD74, EFEMP1, andTGM2 in iliumMSCs and the donor ages.n = 10; ∗P < 0 05, ∗∗P < 0 01. R: multiple correlation coefficient;R2: coefficient of determination.
7Stem Cells International
as type II collagen and aggrecan, which are upregulated onlyafter chondrogenic differentiation [38]. Therefore, while themarkers identified herein indicate MSC potential, theirexpression levels are unlikely to distinguish between thedegrees of differentiation.
Several cell surface markers, including CD105, CD146,CD271, and receptor tyrosine kinase-like orphan receptor2 (ROR2), have been considered as markers of MSCs withhigh potential for chondrocyte differentiation [11–14].However, to evaluate the expression levels of cell surfacemarkers, we need experiments using fluorescence-activated cell sorter (FACS) analysis, which uses suitableantigens for detecting cell surface molecules and singlecells detached from culture dishes. The nature of MSCsdetached from the dishes may differ from that of cellsattached to the dishes. In addition, evaluation using FACSanalysis is not quantitative, although FACS can be used toselect a subpopulation that expresses high levels of a cellsurface marker. Among these cell surface markers, theCD146 (MCAM) gene was included in the 95 genes eval-uated in this study (Table S1 in Supplementary Materials).CD146 showed a similar expression pattern as the eightgenes identified in this study. Its expression level in iliumMSCs was significantly higher than that in jaw MSCs(data not shown), although the correlation of CD146expression with GAG production was not significant, sug-gesting that the eight genes are more reliable markers thancell surface markers such as CD146. Thus, measuring theprediction marker expression levels in cells attached to thedishes could be desirable for estimating the differentiationpotential of MSCs.
5. Conclusions
The present 3D expression analyses of predictive markergenes offer a novel strategy for assessing MSC differentiationpotential and could form the basis for predicting clinical out-comes of MSC therapy.
Data Availability
The data used to support the findings of this study areavailable from the corresponding author upon request.
Conflicts of Interest
The authors declare that there is no conflict of interestregarding the publication of this paper.
Funding
This work was supported by JSPS KAKENHI (JP17K11541).
Supplementary Materials
Figure S1: combined two-dimensional analysis of CD74 andCDKN2D mRNA expression levels. Table S1: correlationcoefficients for 95 gene expression levels in undifferentiatedMSC and GAG contents after chondrogenic induction, alongwith donor IDs and ages. (Supplementary Materials.)
References
[1] M. F. Pittenger, A. M. Mackay, S. C. Beck et al., “Multilineagepotential of adult human mesenchymal stem cells,” Science,vol. 284, no. 5411, pp. 143–147, 1999.
[2] R. M. Samsonraj, M. Raghunath, V. Nurcombe, J. H. Hui, A. J.van Wijnen, and S. M. Cool, “Concise review: multifacetedcharacterization of human mesenchymal stem cells for use inregenerative medicine,” Stem Cells Translational Medicine,vol. 6, no. 12, pp. 2173–2185, 2017.
[3] A. Uccelli, L. Moretta, and V. Pistoia, “Mesenchymal stem cellsin health and disease,” Nature Reviews Immunology, vol. 8,no. 9, pp. 726–736, 2008.
[4] R. J. Deans and A. B. Moseley, “Mesenchymal stem cells: biol-ogy and potential clinical uses,” Experimental Hematology,vol. 28, no. 8, pp. 875–884, 2000.
[5] T. Matsubara, K. Suardita, M. Ishii et al., “Alveolar bone mar-row as a cell source for regenerative medicine: differencesbetween alveolar and iliac bone marrow stromal cells,” Journalof Bone and Mineral Research, vol. 20, no. 3, pp. 399–409,2005.
[6] L. Xu, Y. Liu, Y. Sun et al., “Tissue source determines thedifferentiation potentials of mesenchymal stem cells: a com-parative study of human mesenchymal stem cells from bonemarrow and adipose tissue,” Stem Cell Research & Therapy,vol. 8, no. 1, p. 275, 2017.
[7] R. N. Bearden, S. S. Huggins, K. J. Cummings, R. Smith, C. A.Gregory, and W. B. Saunders, “In-vitro characterization ofcanine multipotent stromal cells isolated from synovium, bonemarrow, and adipose tissue: a donor-matched comparativestudy,” Stem Cell Research & Therapy, vol. 8, no. 1, p. 218,2017.
[8] D. L. Deskins, D. Bastakoty, S. Saraswati, A. Shinar, G. E. Holt,and P. P. Young, “Human mesenchymal stromal cells: identi-fying assays to predict potency for therapeutic selection,” StemCells Translational Medicine, vol. 2, no. 2, pp. 151–158, 2013.
[9] A. Mentink, M. Hulsman, N. Groen et al., “Predicting the ther-apeutic efficacy of MSC in bone tissue engineering using themolecular marker CADM1,” Biomaterials, vol. 34, no. 19,pp. 4592–4601, 2013.
[10] M. Kanawa, A. Igarashi, V. S. Ronald et al., “Age-dependentdecrease in the chondrogenic potential of human bone mar-row mesenchymal stromal cells expanded with fibroblastgrowth factor-2,” Cytotherapy, vol. 15, no. 9, pp. 1062–1072,2013.
[11] W. Fan, J. Li, Y.Wang et al., “CD105 promotes chondrogenesisof synovium-derived mesenchymal stem cells through Smad2signaling,” Biochemical and Biophysical Research Communica-tions, vol. 474, no. 2, pp. 338–344, 2016.
[12] Y. X. Wu, X. Z. Jing, Y. Sun et al., “CD146+ skeletal stem cellsfrom growth plate exhibit specific chondrogenic differentia-tion capacity in vitro,” Molecular Medicine Reports, vol. 16,no. 6, pp. 8019–8028, 2017.
[13] Y. Mifune, T. Matsumoto, S. Murasawa et al., “Therapeuticsuperiority for cartilage repair by CD271-positive marrowstromal cell transplantation,” Cell Transplantation, vol. 22,no. 7, pp. 1201–1211, 2013.
[14] S. C. Dickinson, C. A. Sutton, K. Brady et al., “The Wnt5areceptor, receptor tyrosine kinase-like orphan receptor 2, is apredictive cell surface marker of human mesenchymal stemcells with an enhanced capacity for chondrogenic differentia-tion,” Stem Cells, vol. 35, no. 11, pp. 2280–2291, 2017.
8 Stem Cells International
[15] C. C. Wu, F. L. Liu, H. K. Sytwu, C. Y. Tsai, and D. M. Chang,“CD146+ mesenchymal stem cells display greater therapeuticpotential than CD146− cells for treating collagen-inducedarthritis in mice,” Stem Cell Research & Therapy, vol. 7,no. 1, p. 23, 2016.
[16] A. Igarashi, K. Segoshi, Y. Sakai et al., “Selection of commonmarkers for bone marrow stromal cells from various bonesusing real-time RT-PCR: effects of passage number and donorage,” Tissue Engineering, vol. 13, no. 10, pp. 2405–2417, 2007.
[17] R. W. Farndale, C. A. Sayers, and A. J. Barrett, “A direct spec-trophotometric microassay for sulfated glycosaminoglycans incartilage cultures,” Connective Tissue Research, vol. 9, no. 4,pp. 247-248, 1982.
[18] A. Szedlak, S. Sims, N. Smith, G. Paternostro, andC. Piermarocchi, “Cell cycle time series gene expression dataencoded as cyclic attractors in Hopfield systems,” PLoS Com-putational Biology, vol. 13, no. 11, article e1005849, 2017.
[19] B. Scheijen, M. Bronk, T. van der Meer, and R. Bernards,“Constitutive E2F1 overexpression delays endochondral boneformation by inhibiting chondrocyte differentiation,” Molecu-lar and Cellular Biology, vol. 23, no. 10, pp. 3656–3668, 2003.
[20] M. C. Chen, Y. C. Tsai, J. H. Tseng et al., “Simvastatin inhibitscell proliferation and migration in human anaplastic thyroidcancer,” International Journal of Molecular Sciences, vol. 18,no. 12, 2017.
[21] H. Müller and K. Helin, “The E2F transcription factors: keyregulators of cell proliferation,” Biochimica et Biophysica Acta(BBA) - Reviews on Cancer, vol. 1470, no. 1, pp. M1–M12,2000.
[22] Y. Wang, W. Jin, X. Jia et al., “Transcriptional repression ofCDKN2D by PML/RARα contributes to the altered prolifera-tion and differentiation block of acute promyelocytic leukemiacells,” Cell Death & Disease, vol. 5, no. 10, article e1431, 2014.
[23] S. A. Ali, G. Kaur, J. K. Kaushik, D. Malakar, A. K. Mohanty,and S. Kumar, “Examination of pathways involved in leukemiainhibitory factor (LIF)-induced cell growth arrest using label-free proteomics approach,” Journal of Proteomics, vol. 168,pp. 37–52, 2017.
[24] L. Wu, C. Bluguermann, L. Kyupelyan et al., “Human develop-mental chondrogenesis as a basis for engineering chondrocytesfrom pluripotent stem cells,” Stem Cell Reports, vol. 1, no. 6,pp. 575–589, 2013.
[25] N. Zaidi, I. Royaux, J. V. Swinnen, and K. Smans, “ATP citratelyase knockdown induces growth arrest and apoptosis throughdifferent cell- and environment-dependent mechanisms,”Molecular Cancer Therapeutics, vol. 11, no. 9, pp. 1925–1935,2012.
[26] T. Wakabayashi, A. Matsumine, S. Nakazora et al., “Fibulin-3negatively regulates chondrocyte differentiation,” Biochemicaland Biophysical Research Communications, vol. 391, no. 1,pp. 1116–1121, 2010.
[27] A. Hasegawa, T. Yonezawa, N. Taniguchi et al., “Role of fibulin3 in aging-related joint changes and osteoarthritis pathogene-sis in human and mouse knee cartilage,” Arthritis & Rheuma-tology, vol. 69, no. 3, pp. 576–585, 2017.
[28] C. Xiong, B. Huang, Y. Cun, B. G. Aghdasi, and Y. Zhou,“Migration inhibitory factor enhances inflammation viaCD74 in cartilage end plates with Modic type 1 changes onMRI,” Clinical Orthopaedics and Related Research, vol. 472,no. 6, pp. 1943–1954, 2014.
[29] H. Sternberg, J. T. Murai, I. E. Erickson et al., “A humanembryonic stem cell-derived clonal progenitor cell line withchondrogenic potential and markers of craniofacial mesen-chyme,” Regenerative Medicine, vol. 7, no. 4, pp. 481–501,2012.
[30] M. Ishii, C. Koike, A. Igarashi et al., “Molecular markers distin-guish bone marrow mesenchymal stem cells from fibroblasts,”Biochemical and Biophysical Research Communications,vol. 332, no. 1, pp. 297–303, 2005.
[31] S. S. Akimov and A. M. Belkin, “Cell-surface transglutaminasepromotes fibronectin assembly via interaction with the gelatin-binding domain of fibronectin: a role in TGFβ-dependentmatrix deposition,” Journal of Cell Science, vol. 114, no. 16,pp. 2989–3000, 2001.
[32] A. M. Belkin, “Extracellular TG2: emerging functions and reg-ulation,” The FEBS Journal, vol. 278, no. 24, pp. 4704–4716,2011.
[33] L. Leng, C. N. Metz, Y. Fang et al., “MIF signal transductioninitiated by binding to CD74,” Journal of Experimental Medi-cine, vol. 197, no. 11, pp. 1467–1476, 2003.
[34] Y. Yao, Q. Deng, W. Song et al., “MIF plays a key role in reg-ulating tissue-specific chondro-osteogenic differentiation fateof human cartilage endplate stem cells under hypoxia,” StemCell Reports, vol. 7, no. 2, pp. 249–262, 2016.
[35] P. Singh and J. E. Schwarzbauer, “Fibronectin and stem celldifferentiation—lessons from chondrogenesis,” Journal of CellScience, vol. 125, no. 16, pp. 3703–3712, 2012.
[36] A. Bertolo, M. Mehr, T. Janner-Jametti et al., “An in vitroexpansion score for tissue-engineering applications withhuman bone marrow-derived mesenchymal stem cells,” Jour-nal of Tissue Engineering and Regenerative Medicine, vol. 10,no. 2, pp. 149–161, 2016.
[37] H. Kubo, M. Shimizu, Y. Taya et al., “Identification of mesen-chymal stem cell (MSC)-transcription factors by microarrayand knockdown analyses, and signature molecule-markedMSC in bone marrow by immunohistochemistry,” Genes toCells, vol. 14, no. 3, pp. 407–424, 2009.
[38] K. Pelttari, E. Steck, and W. Richter, “The use of mesenchymalstem cells for chondrogenesis,” Injury, vol. 39, no. 1, pp. 58–65,2008.
9Stem Cells International

Hindawiwww.hindawi.com
International Journal of
Volume 2018
Zoology
Hindawiwww.hindawi.com Volume 2018
Anatomy Research International
PeptidesInternational Journal of
Hindawiwww.hindawi.com Volume 2018
Hindawiwww.hindawi.com Volume 2018
Journal of Parasitology Research
GenomicsInternational Journal of
Hindawiwww.hindawi.com Volume 2018
Hindawi Publishing Corporation http://www.hindawi.com Volume 2013Hindawiwww.hindawi.com
The Scientific World Journal
Volume 2018
Hindawiwww.hindawi.com Volume 2018
BioinformaticsAdvances in
Marine BiologyJournal of
Hindawiwww.hindawi.com Volume 2018
Hindawiwww.hindawi.com Volume 2018
Neuroscience Journal
Hindawiwww.hindawi.com Volume 2018
BioMed Research International
Cell BiologyInternational Journal of
Hindawiwww.hindawi.com Volume 2018
Hindawiwww.hindawi.com Volume 2018
Biochemistry Research International
ArchaeaHindawiwww.hindawi.com Volume 2018
Hindawiwww.hindawi.com Volume 2018
Genetics Research International
Hindawiwww.hindawi.com Volume 2018
Advances in
Virolog y Stem Cells International
Hindawiwww.hindawi.com Volume 2018
Hindawiwww.hindawi.com Volume 2018
Enzyme Research
Hindawiwww.hindawi.com Volume 2018
International Journal of
MicrobiologyHindawiwww.hindawi.com
Nucleic AcidsJournal of
Volume 2018
Submit your manuscripts atwww.hindawi.com