Embed Size (px)
Citation preview
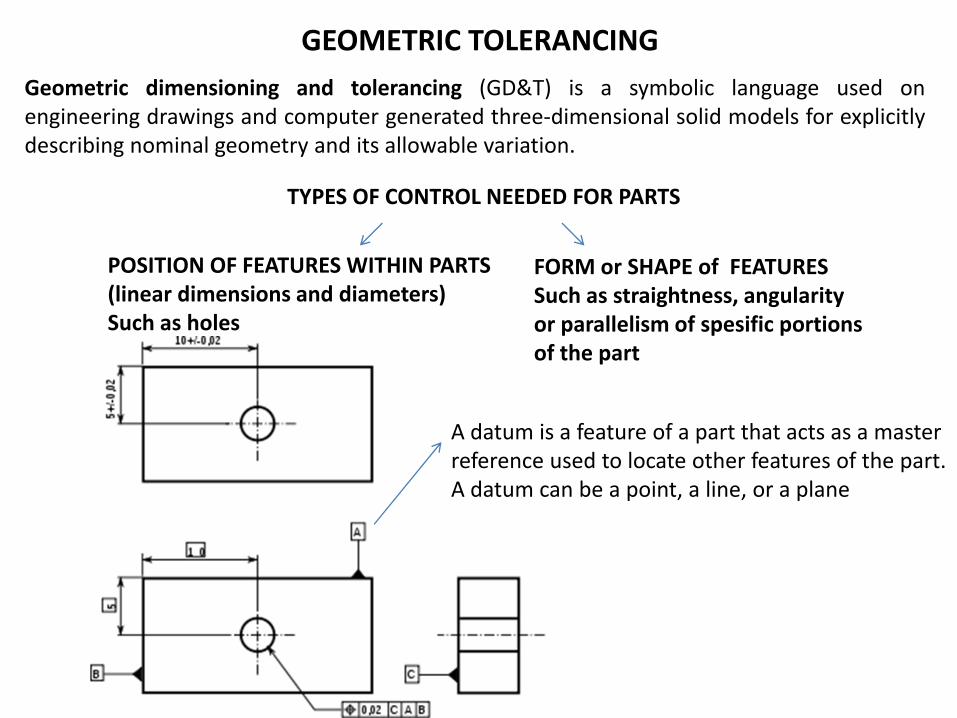
TYPES OF CONTROL NEEDED FOR PARTS
POSITION OF FEATURES WITHIN PARTS(linear dimensions and diameters)Such as holes
FORM or SHAPE of FEATURESSuch as straightness, angularityor parallelism of spesific portionsof the part
GEOMETRIC TOLERANCINGGeometric dimensioning and tolerancing (GD&T) is a symbolic language used onengineering drawings and computer generated three‐dimensional solid models for explicitlydescribing nominal geometry and its allowable variation.
A datum is a feature of a part that acts as a masterreference used to locate other features of the part.A datum can be a point, a line, or a plane
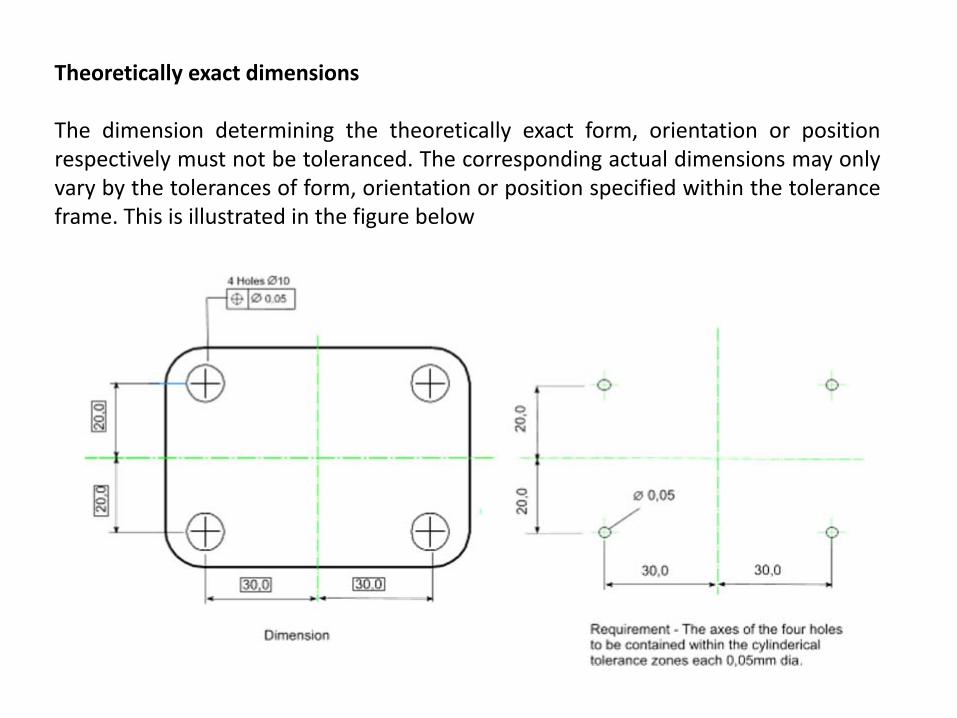
Theoretically exact dimensions
The dimension determining the theoretically exact form, orientation or positionrespectively must not be toleranced. The corresponding actual dimensions may onlyvary by the tolerances of form, orientation or position specified within the toleranceframe. This is illustrated in the figure below
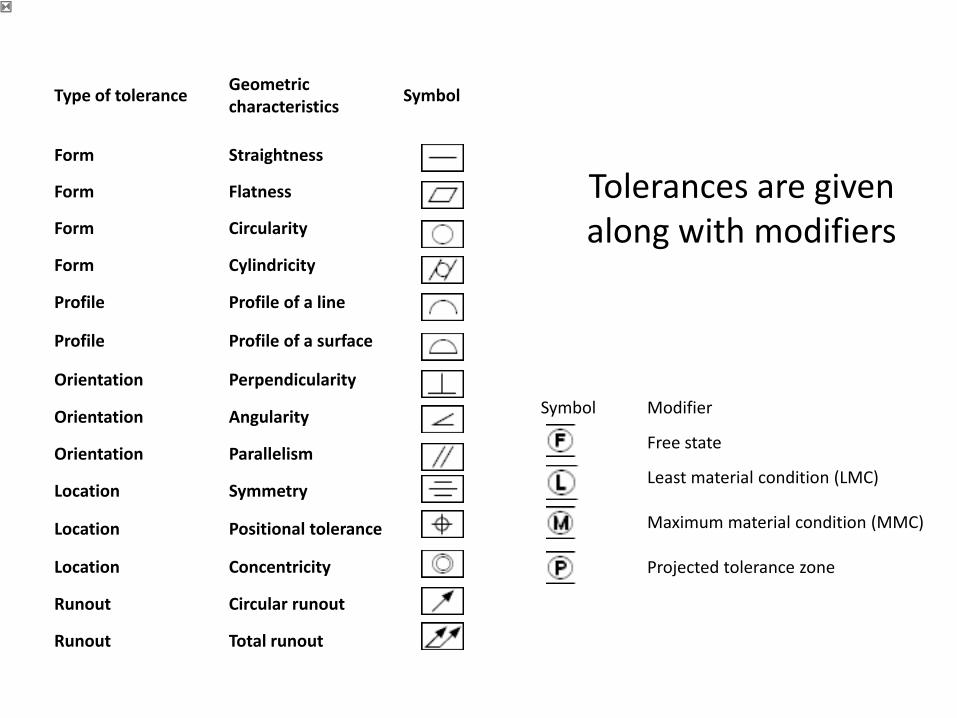
Type of tolerance Geometriccharacteristics Symbol
Form Straightness
Form Flatness
Form Circularity
Form Cylindricity
Profile Profile of a line
Profile Profile of a surface
Orientation Perpendicularity
Orientation Angularity
Orientation Parallelism
Location Symmetry
Location Positional tolerance
Location Concentricity
Runout Circular runout
Runout Total runout
Symbol Modifier
Free state
Least material condition (LMC)
Maximum material condition (MMC)
Projected tolerance zone
Tolerances are given along with modifiers
LMC: Least material condition of a component at that limit of size where the material of the feature is atits minimum everywhere, e.g. maximum hole diameter and minimum shaft diameter.
LMS: The dimension defining the least material condition of a feature.
LMVS :The size generated by the collective effect of the least material size, LMS of a feature and thegeometrical tolerance (form, orientation or location).
LMVC: Least material virtual condition. The condition of a component of least material virtual size.
LMR: Least material requirement, defining a geometrical feature of the same type and of perfect form,with a given dimension equal to LMVS, which limits a feature on the inside of the material e.g wallthickness.
MMS :Maximummaterial size; The size of the maximummaterial condition.
MMVC: Maximummaterial virtual condition, is a perfect form condition of the feature.
MMVS: Maximum material virtual size, is the size generated by the collective effect of the maximummaterial size, MMS, of a feature of size and the geometrical tolerance (form, orientation or location)given for the derived feature of the same feature of size. Maximum material virtual size, MMVS, is aparameter for size used as a numerical value connected to MMVC.
PJ: Projected tolerance zone. A geometric tolerance zone which projects from an actual design featuressuch as a hole
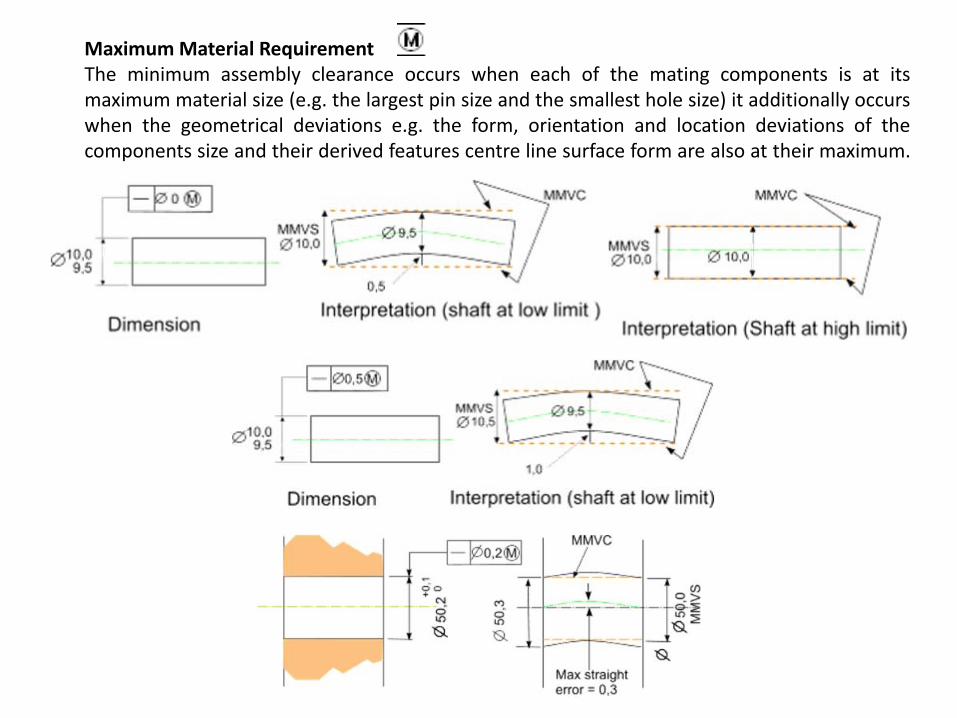
MaximumMaterial RequirementThe minimum assembly clearance occurs when each of the mating components is at itsmaximum material size (e.g. the largest pin size and the smallest hole size) it additionally occurswhen the geometrical deviations e.g. the form, orientation and location deviations of thecomponents size and their derived features centre line surface form are also at their maximum.
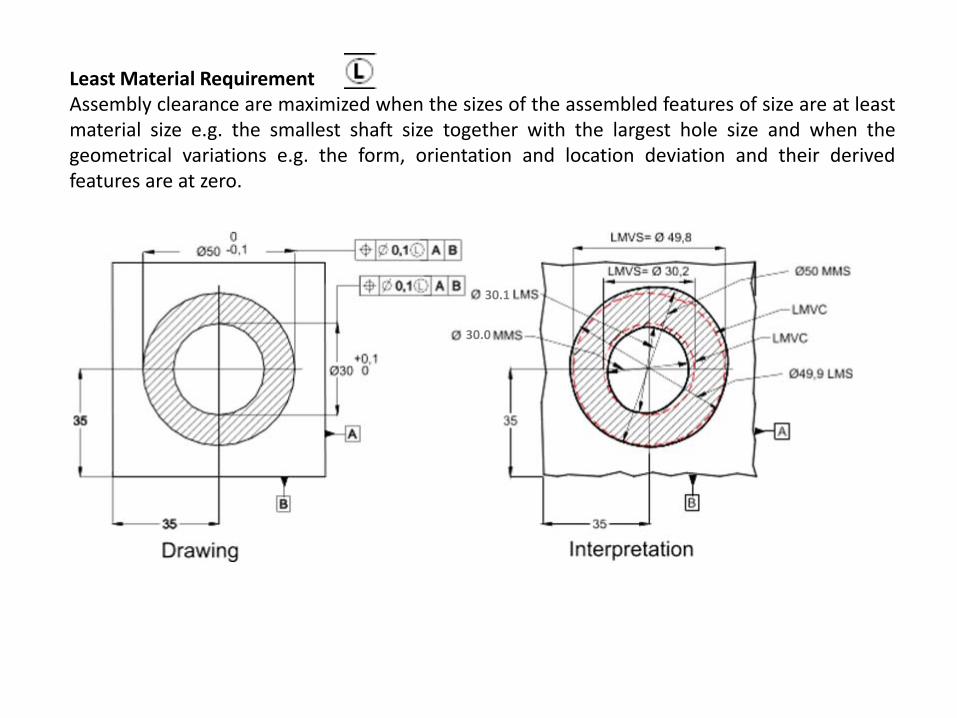
Least Material RequirementAssembly clearance are maximized when the sizes of the assembled features of size are at leastmaterial size e.g. the smallest shaft size together with the largest hole size and when thegeometrical variations e.g. the form, orientation and location deviation and their derivedfeatures are at zero.
30.0
30.1
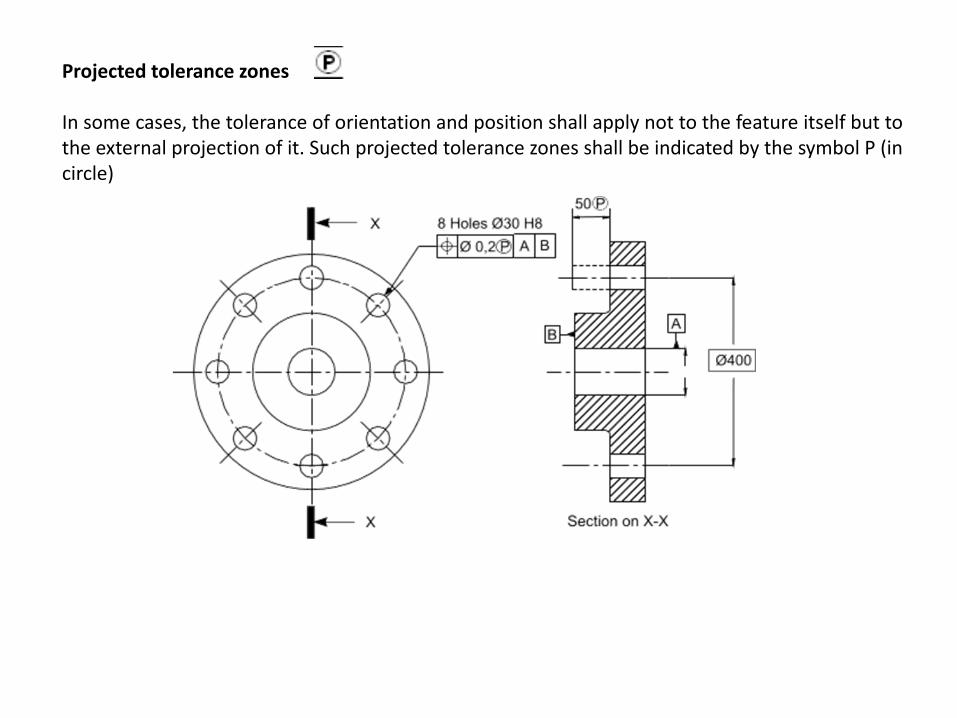
Projected tolerance zones
In some cases, the tolerance of orientation and position shall apply not to the feature itself but tothe external projection of it. Such projected tolerance zones shall be indicated by the symbol P (incircle)
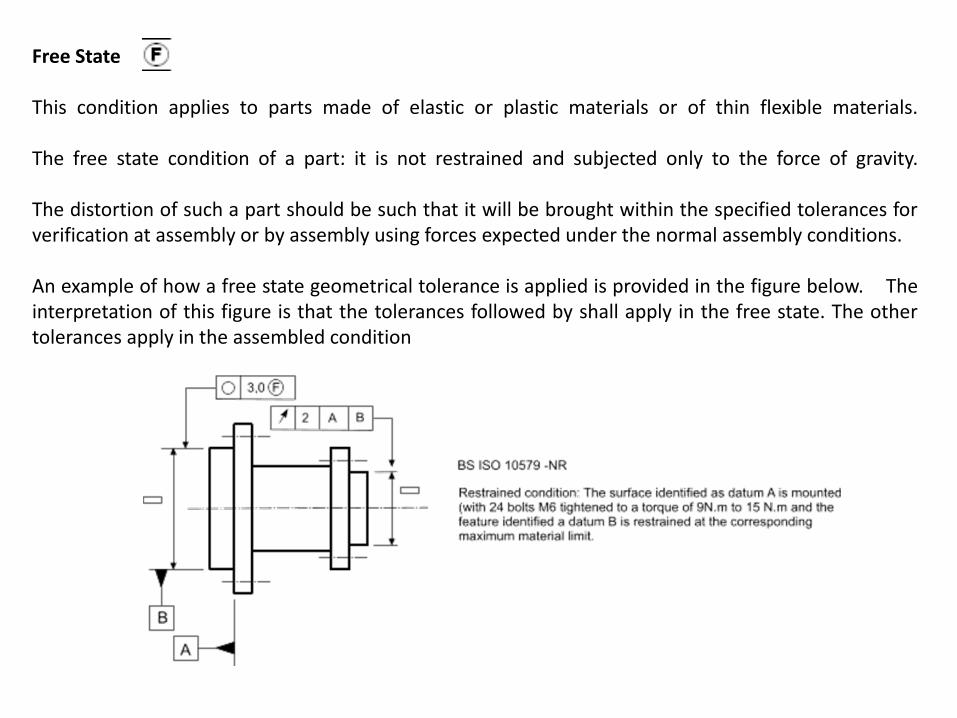
Free State
This condition applies to parts made of elastic or plastic materials or of thin flexible materials.
The free state condition of a part: it is not restrained and subjected only to the force of gravity.
The distortion of such a part should be such that it will be brought within the specified tolerances forverification at assembly or by assembly using forces expected under the normal assembly conditions.
An example of how a free state geometrical tolerance is applied is provided in the figure below. Theinterpretation of this figure is that the tolerances followed by shall apply in the free state. The othertolerances apply in the assembled condition
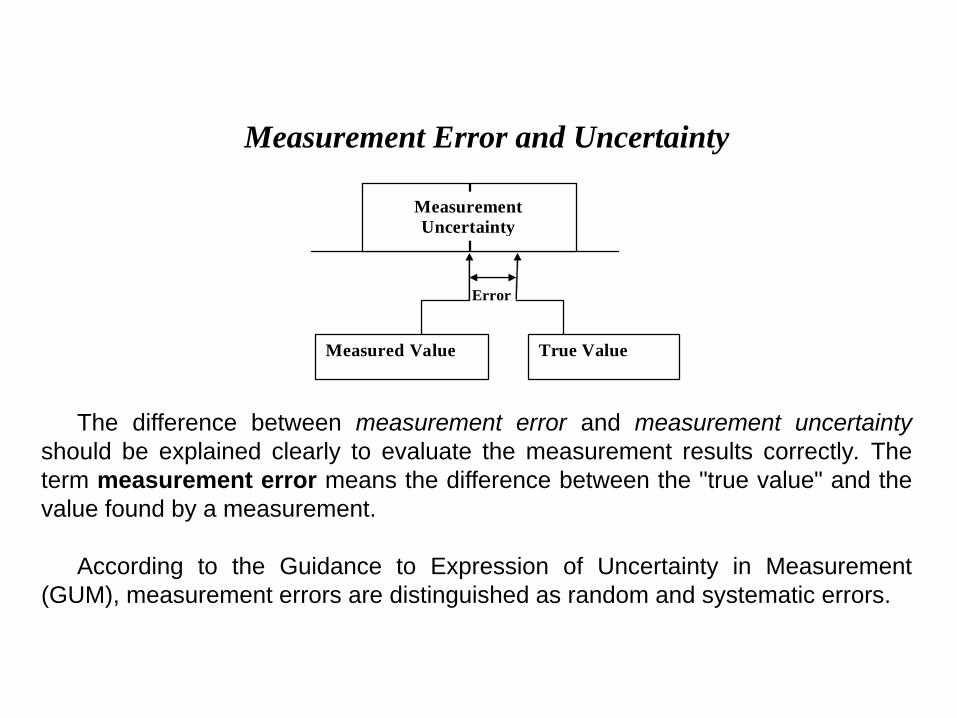
Error
Measured Value True Value
MeasurementUncertainty
The difference between measurement error and measurement uncertaintyshould be explained clearly to evaluate the measurement results correctly. Theterm measurement error means the difference between the "true value" and thevalue found by a measurement.
According to the Guidance to Expression of Uncertainty in Measurement(GUM), measurement errors are distinguished as random and systematic errors.
Measurement Error and Uncertainty
Random ErrorRandom error in measurement typically arises from unpredictable variations of influence
quantities. These random effects under apparently equal condition at a given position giverise to variations in repeated observations of the measurand. Although it is not possible tocompensate for the random error of a measurement result, it can usually be reduced byincreasing the number of observations and only be expressed statistically. Random errorsinclude: positioning and allignment errors, non-determinable fluctiations in ambientconditions, transient fluctiations in the friction in the instrument and operator errors such asreading errors.
Systematic ErrorSystematic error, like random error, can not be eliminated but it can be reduced. If a
systematic error arises from a recognized effect of an influence quantity on a measurementresult, hereafter termed a systematic effect, the effect can be quantified and a correction orcorrection factor can be applied to compensate for the effect. Recognized systematic errorscan generally be correlated with position along an axis and can be corrected for if therelative accompanying random error is small enough. Systematic errors can often becompensated to a certain degree using calibration techniques. Systematic errors includecalibration errors and changes in ambient conditions.
Random errors cannot be compensated for without real time measurement andfeedback into correction servo loop. Thus when evaluating the error budget for a machinetwo distinct sub-budget based on systematic and random errors should be kept.
See ME410 lecture notes for more information about random and systematic errors:http://www.me.metu.edu.tr/courses/me410/notes/Week3/Week3.PPT
0,00
0,05
0,10
0,15
0,20
0,25
0,30
5,9 6,1 6,3 6,5 6,7 6,9 7,1
P
zz
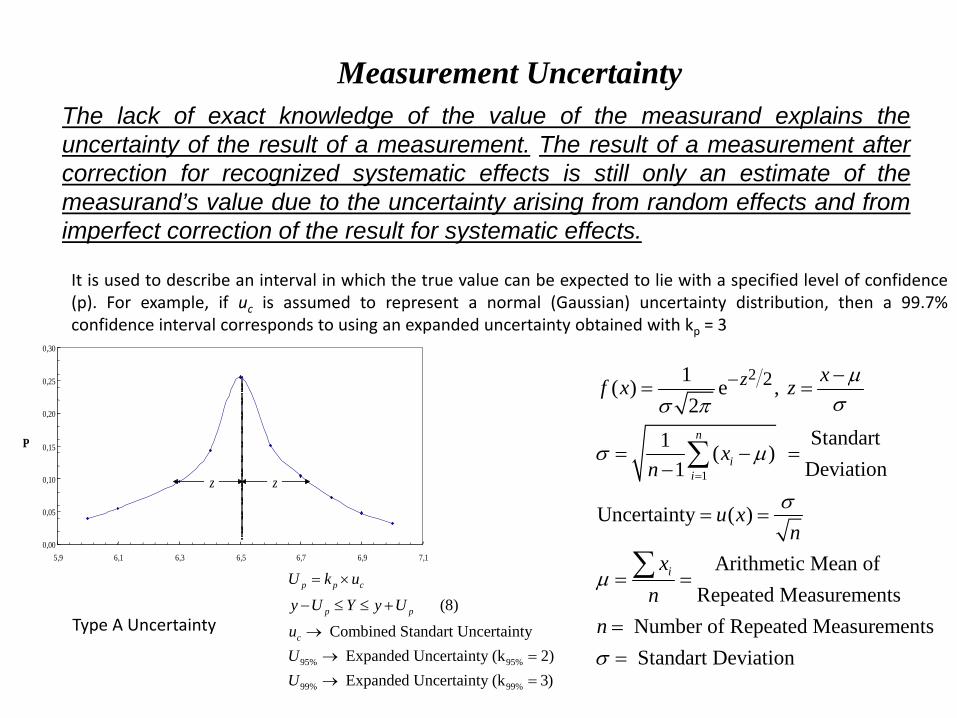
Type A Uncertainty
Measurement UncertaintyThe lack of exact knowledge of the value of the measurand explains theuncertainty of the result of a measurement. The result of a measurement aftercorrection for recognized systematic effects is still only an estimate of themeasurand’s value due to the uncertainty arising from random effects and fromimperfect correction of the result for systematic effects.
It is used to describe an interval in which the true value can be expected to lie with a specified level of confidence(p). For example, if uc is assumed to represent a normal (Gaussian) uncertainty distribution, then a 99.7%confidence interval corresponds to using an expanded uncertainty obtained with kp = 3
95% 95%
99% 99%
(8)
Combined Standart UncertaintyExpanded Uncertainty (k 2)Expanded Uncertainty (k 3)
p p c
p p
c
U k u
y U Y y U
uUU
= ×
− ≤ ≤ +
→→ =
→ =
1
2 21( ) e , 2
Standart1 ( ) Deviation1
Uncertainty ( )
Arithmetic Mean ofRepeated Measurements
Number of Repeated MeasurementsStandart Deviation
=
− −= =
= − =−
= =
= =
==
∑
∑
n
ii
i
z xf x z
xn
u xn
xn
n
μσσ π
σ μ
σ
μ
σ
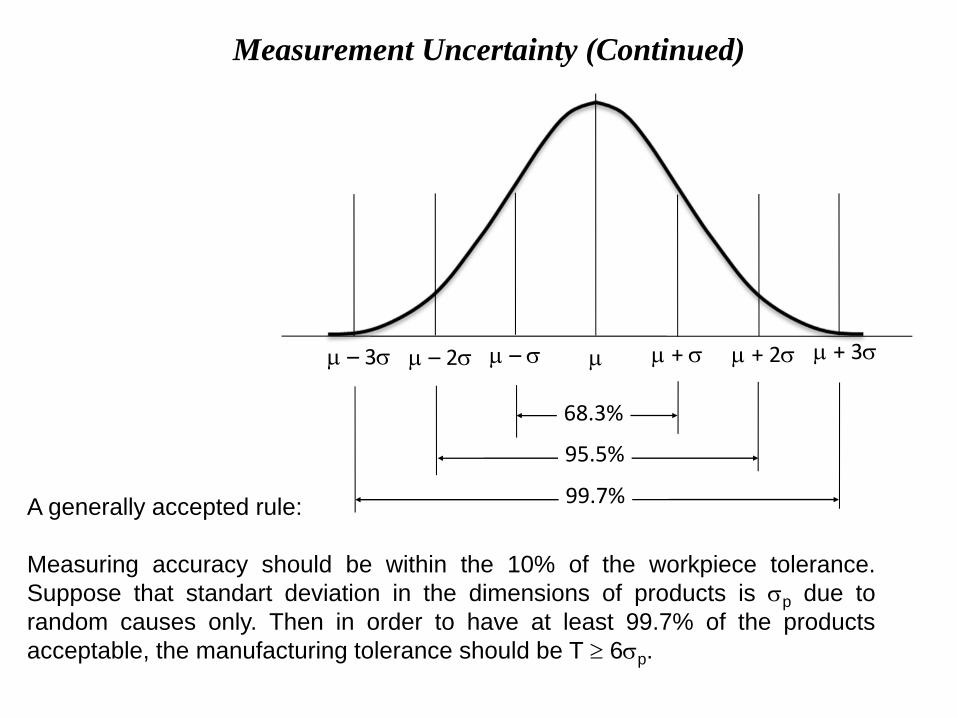
Measurement Uncertainty (Continued)
A generally accepted rule:
Measuring accuracy should be within the 10% of the workpiece tolerance.Suppose that standart deviation in the dimensions of products is σp due torandom causes only. Then in order to have at least 99.7% of the productsacceptable, the manufacturing tolerance should be T ≥ 6σp.
μ – 3σ μ – 2σ μ – σ μ μ + 3σμ + 2σμ + σ
68.3%
95.5%
99.7%
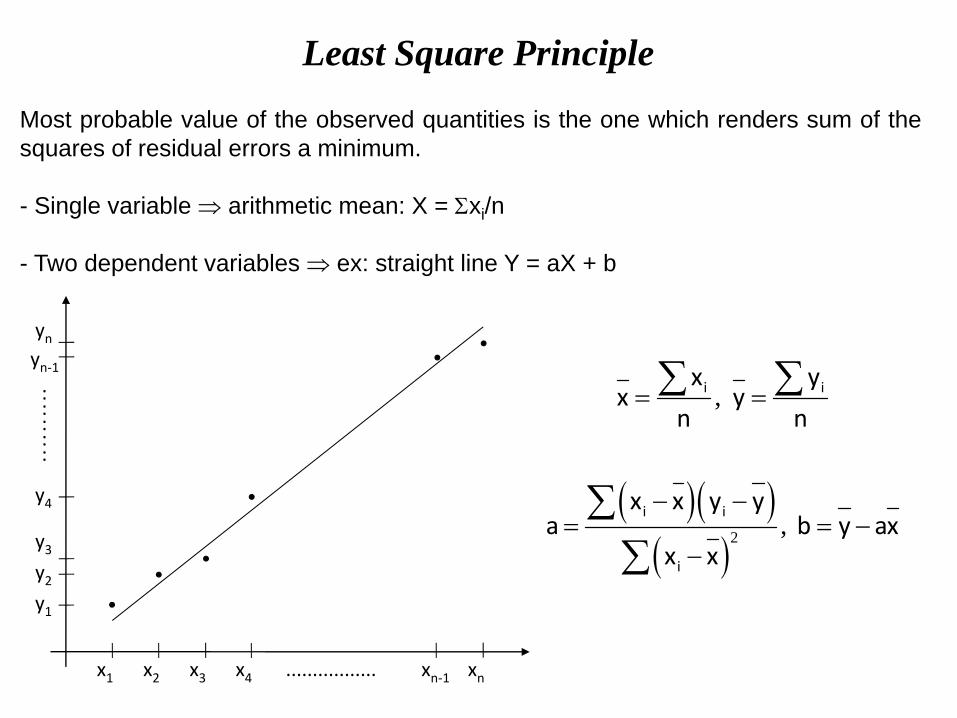
Least Square Principle
Most probable value of the observed quantities is the one which renders sum of thesquares of residual errors a minimum.
- Single variable ⇒ arithmetic mean: X = Σxi/n
- Two dependent variables ⇒ ex: straight line Y = aX + b
( )( )( )2
,
,
= =
− −= = −
−
∑ ∑
∑∑
i i
i i
i
x yx y
n n
x x y ya b y ax
x x
x1 x2 x3 x4 xn‐1 xn
y1
y2
y3
y4
yn‐1
yn
.................
:::::
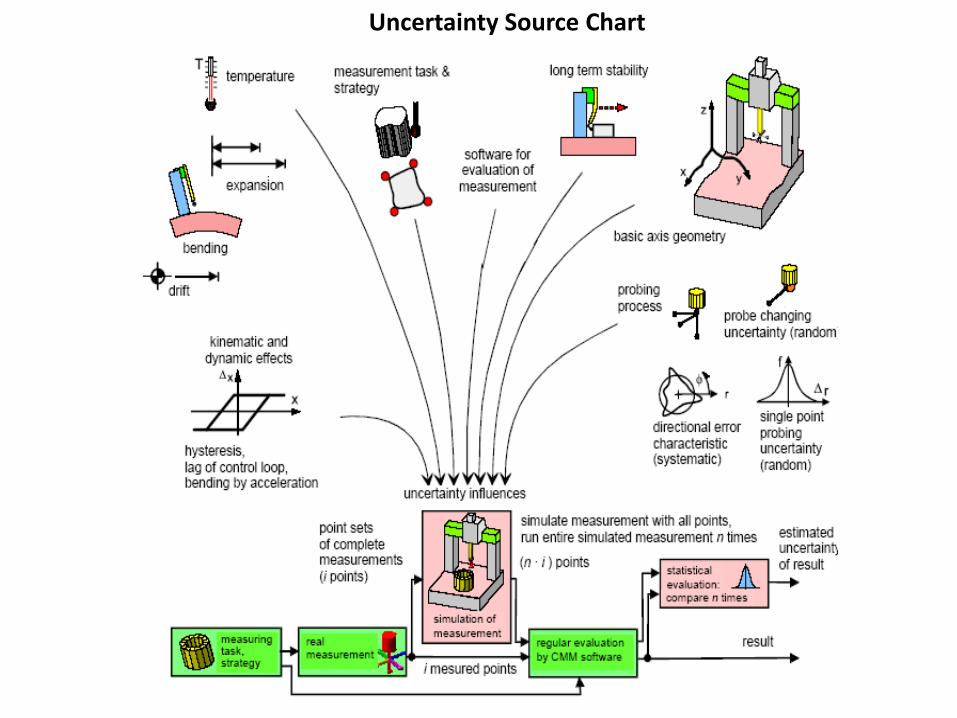
Uncertainty Source Chart