Embed Size (px)
Citation preview
2075 Corte Del Nogal, Suite WCarlsbad, California 92011
SSuubbSSuurrffaaccee SSuurrvveeyyss && AA ss ss oo cc ii aa tt ee ss ,, II nn cc .. AAnn AApppplliieedd GGeeoopphhyyssiiccaall CCoommppaannyy
Office: (760) 476-0492Fax: (760) 476-0493
Subsurface Surveys & Associates, Inc. www.subsurfacesurveys.com [email protected]
GGeeoopphhyyssiiccaall MMeetthhooddss && AApppplliiccaattiioonnss
SubSurface Surveys & Associates, Inc., established in 1988, specializes in near-surface geophysics and utility locating services and is dedicated to establishing strong client relationships. SubSurface Survey’s extensive education and experience in implementing state-of-the-art techniques allows for a more comprehensive approach to solving complex problems through cost-effective means.
Subsurface Surveys & Associates, Inc. www.subsurfacesurveys.com [email protected]
2
Subsurface Surveys, an applied geophysics company, uses a variety of geophysical methods to solve engineering, geological, environmental and forensic problems. The methods and instruments we use are chosen to meet the specific needs of our clients and accommodate the existing field conditions. Geophysical Areas Covered
• Seismic Refraction • Seismic Reflection • Seismic Downhole and Crosshole Surveys • Microearthquakes • Gravity • Magnetics • Ground Penetrating Radar (GPR) • DC Resistivity Depth Sounding & Profiling • Electromagnetic Induction (EM) • Very Low Frequency (VLF) • Spontaneous Potential (SP) • Tellurics, Dipole-Dipole & other Electrical
Methods • Ground Motion Monitoring • Seismic Resonance Profiling
Range of Projects
• Resource Exploration • Water Projects & Well Siting • Landfill Imaging • Tank & Utility Location & Identification • Well Logging • Construction Siting • Fault and Geologic Hazards Investigations • Archeological Field Studies • Forensic Investigations • Legal Applications • Materials Properties & Site Response Spectra • Abandoned Well Locating • Spill and Plume Mapping • Void Detection • Planning and Review • Downhole Surveys • Ground Motion Monitoring
Background: SubSurface Surveys & Associates, Inc., an applied geophysical firm, was established in December of 2004 through the acquisition of SubSurface Surveys. SubSurface Surveys was founded in 1988, by Dr. Gary Crosby, PhD, GP, and RG, who still continues to provide leadership and guidance to the everyday operations of the company. We are a privately owned small business specializing in geophysical data acquisition, processing, and interpretation in terms of real world geology. Experience: Dr. Gary Crosby along with Phil Walen, our principal geophysicist and Leopold Mairesse, our senior geophysicist at SubSurface Surveys and Associates, Inc. has a combined 110 years of experience in geophysical applications. The company has extensive experience in shallow exploratory geophysics, such as fault and geologic hazards investigations, tank and utility detection, water projects and well sightings, blast and vibration monitoring, archeological investigations, spill and plume mapping, forensic investigations, bedrock rippability, ordnance locations, and landfill mapping. The following pages contain a brief description of most of the methods and instruments we use.
Subsurface Surveys & Associates, Inc. www.subsurfacesurveys.com [email protected]
3
EM techniques are particularly useful in: • Locating buried metal objects (drums,
USTs, utilities, etc.) • Delineating contamination plumes • Map soil salinity and salt water intrusion • Defining lateral changes in lithology • Locating cavities (old mine tunnels) • Locating water producing fractures • Investigating Landfills • Detecting UXO • Gathering of forensic evidence
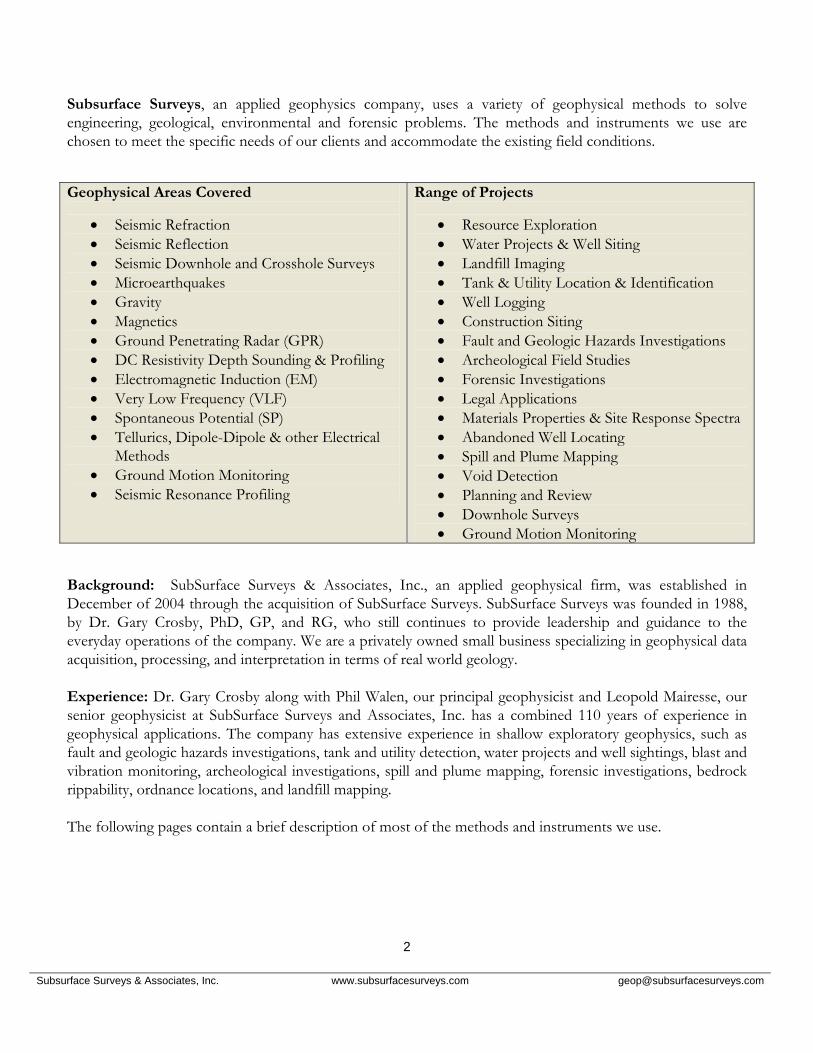
Photograph of EM-31
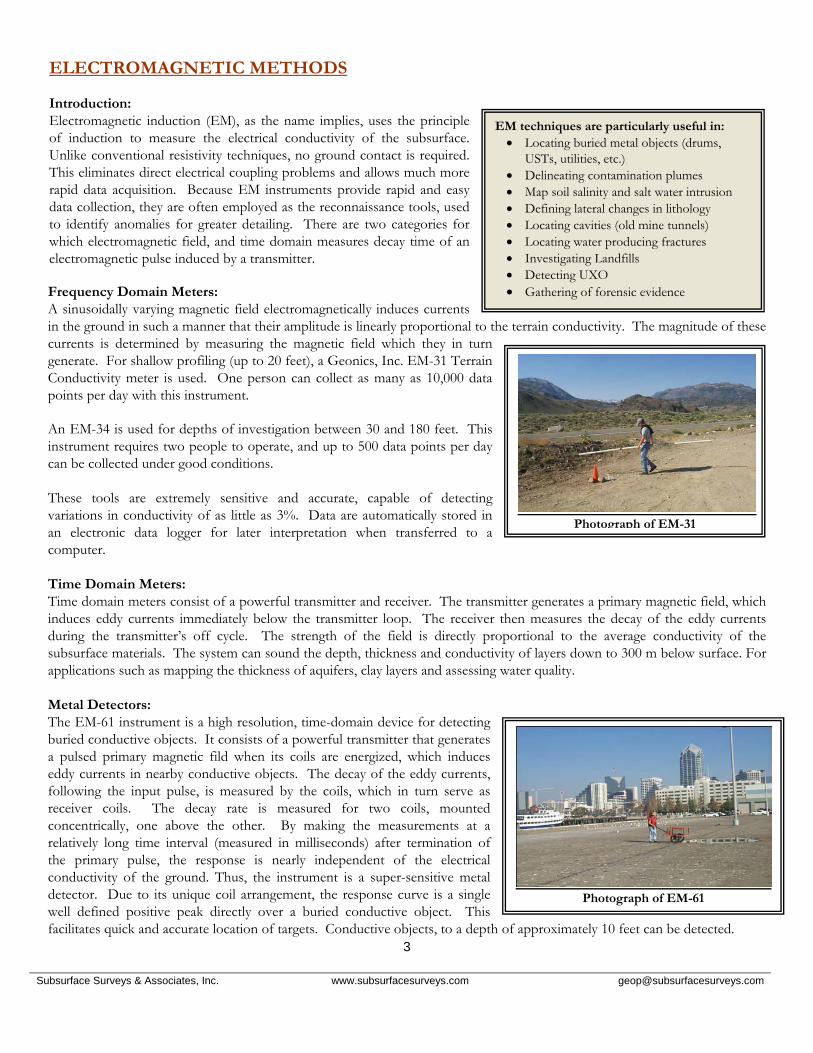
Photograph of EM-61
ELECTROMAGNETIC METHODS Introduction: Electromagnetic induction (EM), as the name implies, uses the principle of induction to measure the electrical conductivity of the subsurface. Unlike conventional resistivity techniques, no ground contact is required. This eliminates direct electrical coupling problems and allows much more rapid data acquisition. Because EM instruments provide rapid and easy data collection, they are often employed as the reconnaissance tools, used to identify anomalies for greater detailing. There are two categories for which electromagnetic field, and time domain measures decay time of an electromagnetic pulse induced by a transmitter. Frequency Domain Meters: A sinusoidally varying magnetic field electromagnetically induces currents in the ground in such a manner that their amplitude is linearly proportional to the terrain conductivity. The magnitude of these currents is determined by measuring the magnetic field which they in turn generate. For shallow profiling (up to 20 feet), a Geonics, Inc. EM-31 Terrain Conductivity meter is used. One person can collect as many as 10,000 data points per day with this instrument. An EM-34 is used for depths of investigation between 30 and 180 feet. This instrument requires two people to operate, and up to 500 data points per day can be collected under good conditions. These tools are extremely sensitive and accurate, capable of detecting variations in conductivity of as little as 3%. Data are automatically stored in an electronic data logger for later interpretation when transferred to a computer. Time Domain Meters: Time domain meters consist of a powerful transmitter and receiver. The transmitter generates a primary magnetic field, which induces eddy currents immediately below the transmitter loop. The receiver then measures the decay of the eddy currents during the transmitter’s off cycle. The strength of the field is directly proportional to the average conductivity of the subsurface materials. The system can sound the depth, thickness and conductivity of layers down to 300 m below surface. For applications such as mapping the thickness of aquifers, clay layers and assessing water quality. Metal Detectors: The EM-61 instrument is a high resolution, time-domain device for detecting buried conductive objects. It consists of a powerful transmitter that generates a pulsed primary magnetic fild when its coils are energized, which induces eddy currents in nearby conductive objects. The decay of the eddy currents, following the input pulse, is measured by the coils, which in turn serve as receiver coils. The decay rate is measured for two coils, mounted concentrically, one above the other. By making the measurements at a relatively long time interval (measured in milliseconds) after termination of the primary pulse, the response is nearly independent of the electrical conductivity of the ground. Thus, the instrument is a super-sensitive metal detector. Due to its unique coil arrangement, the response curve is a single well defined positive peak directly over a buried conductive object. This facilitates quick and accurate location of targets. Conductive objects, to a depth of approximately 10 feet can be detected.
Subsurface Surveys & Associates, Inc. www.subsurfacesurveys.com [email protected]
4
Radar Applications Include: • Locating buried tanks and drums • Locating underground utilities • Map landfill boundaries • Delineate pits and trenches containing
metallic and nonmetallic debris • Delineate previously excavated and
backfilled areas • Mapping voids beneath pavement and/or
behind retaining walls • Measuring pavement thickness • Three dimensional rebar mapping • Locating clandestine grave sites • Archeological investigating • Map shallow groundwater tables • Map shallow soil stratigraphy • Map shallow bedrock topography
Sensors and Software
Noggin GPR w/ 500MHz
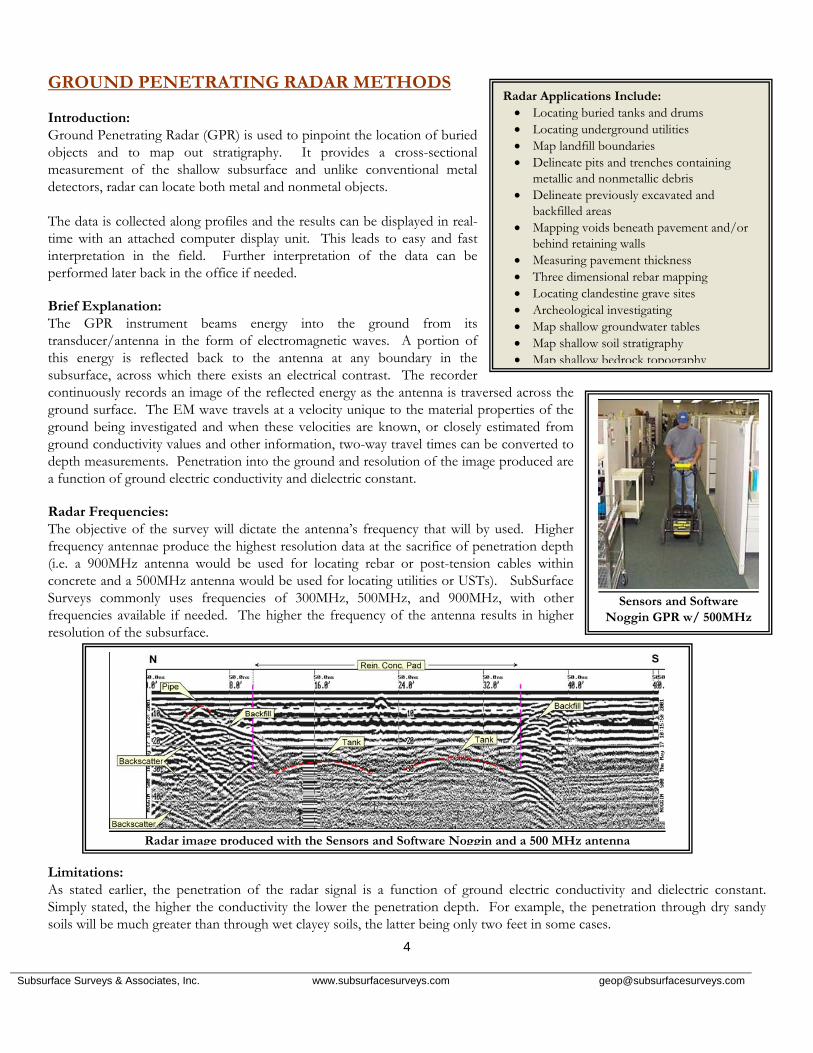
Radar image produced with the Sensors and Software Noggin and a 500 MHz antenna
GROUND PENETRATING RADAR METHODS Introduction: Ground Penetrating Radar (GPR) is used to pinpoint the location of buried objects and to map out stratigraphy. It provides a cross-sectional measurement of the shallow subsurface and unlike conventional metal detectors, radar can locate both metal and nonmetal objects. The data is collected along profiles and the results can be displayed in real-time with an attached computer display unit. This leads to easy and fast interpretation in the field. Further interpretation of the data can be performed later back in the office if needed. Brief Explanation: The GPR instrument beams energy into the ground from its transducer/antenna in the form of electromagnetic waves. A portion of this energy is reflected back to the antenna at any boundary in the subsurface, across which there exists an electrical contrast. The recorder continuously records an image of the reflected energy as the antenna is traversed across the ground surface. The EM wave travels at a velocity unique to the material properties of the ground being investigated and when these velocities are known, or closely estimated from ground conductivity values and other information, two-way travel times can be converted to depth measurements. Penetration into the ground and resolution of the image produced are a function of ground electric conductivity and dielectric constant. Radar Frequencies: The objective of the survey will dictate the antenna’s frequency that will by used. Higher frequency antennae produce the highest resolution data at the sacrifice of penetration depth (i.e. a 900MHz antenna would be used for locating rebar or post-tension cables within concrete and a 500MHz antenna would be used for locating utilities or USTs). SubSurface Surveys commonly uses frequencies of 300MHz, 500MHz, and 900MHz, with other frequencies available if needed. The higher the frequency of the antenna results in higher resolution of the subsurface.
Limitations: As stated earlier, the penetration of the radar signal is a function of ground electric conductivity and dielectric constant. Simply stated, the higher the conductivity the lower the penetration depth. For example, the penetration through dry sandy soils will be much greater than through wet clayey soils, the latter being only two feet in some cases.
Subsurface Surveys & Associates, Inc. www.subsurfacesurveys.com [email protected]
5
Magnetic surveys are useful in: • Locating buried drums, tanks, and other
metal objects • Finding abandoned wells • Mapping geologic structures • Locating utilities • Investigating landfills • Gathering of forensic evidence
Photograph of Geometrics 856 magnetometer
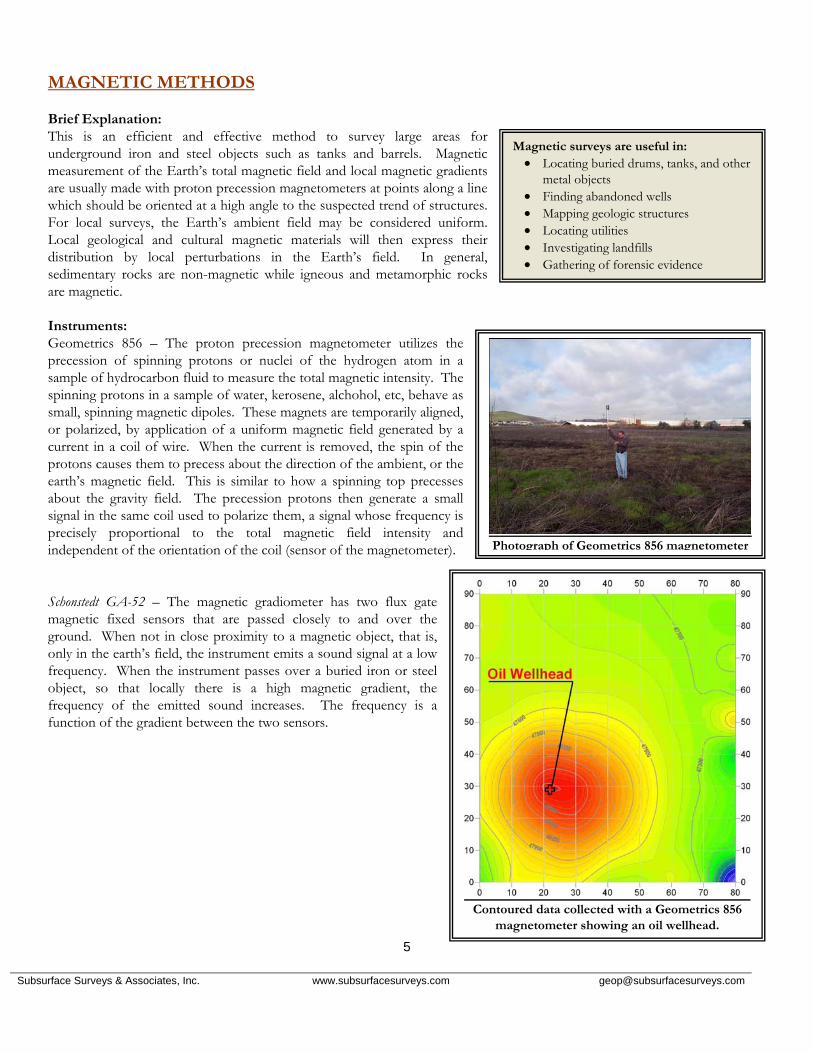
Contoured data collected with a Geometrics 856
magnetometer showing an oil wellhead.
MAGNETIC METHODS Brief Explanation: This is an efficient and effective method to survey large areas for underground iron and steel objects such as tanks and barrels. Magnetic measurement of the Earth’s total magnetic field and local magnetic gradients are usually made with proton precession magnetometers at points along a line which should be oriented at a high angle to the suspected trend of structures. For local surveys, the Earth’s ambient field may be considered uniform. Local geological and cultural magnetic materials will then express their distribution by local perturbations in the Earth’s field. In general, sedimentary rocks are non-magnetic while igneous and metamorphic rocks are magnetic. Instruments: Geometrics 856 – The proton precession magnetometer utilizes the precession of spinning protons or nuclei of the hydrogen atom in a sample of hydrocarbon fluid to measure the total magnetic intensity. The spinning protons in a sample of water, kerosene, alchohol, etc, behave as small, spinning magnetic dipoles. These magnets are temporarily aligned, or polarized, by application of a uniform magnetic field generated by a current in a coil of wire. When the current is removed, the spin of the protons causes them to precess about the direction of the ambient, or the earth’s magnetic field. This is similar to how a spinning top precesses about the gravity field. The precession protons then generate a small signal in the same coil used to polarize them, a signal whose frequency is precisely proportional to the total magnetic field intensity and independent of the orientation of the coil (sensor of the magnetometer). Schonstedt GA-52 – The magnetic gradiometer has two flux gate magnetic fixed sensors that are passed closely to and over the ground. When not in close proximity to a magnetic object, that is, only in the earth’s field, the instrument emits a sound signal at a low frequency. When the instrument passes over a buried iron or steel object, so that locally there is a high magnetic gradient, the frequency of the emitted sound increases. The frequency is a function of the gradient between the two sensors.
Subsurface Surveys & Associates, Inc. www.subsurfacesurveys.com [email protected]
6
Seismic Applications Include: • General geologic structure • Faults and other hazards • Landfill investigations • Overburden thickness • Rock rippability and quality • Water table depth • Bedrock depth • Dynamic rock moduli • Vibration loading response • Rock velocities and quality • Geologic layering
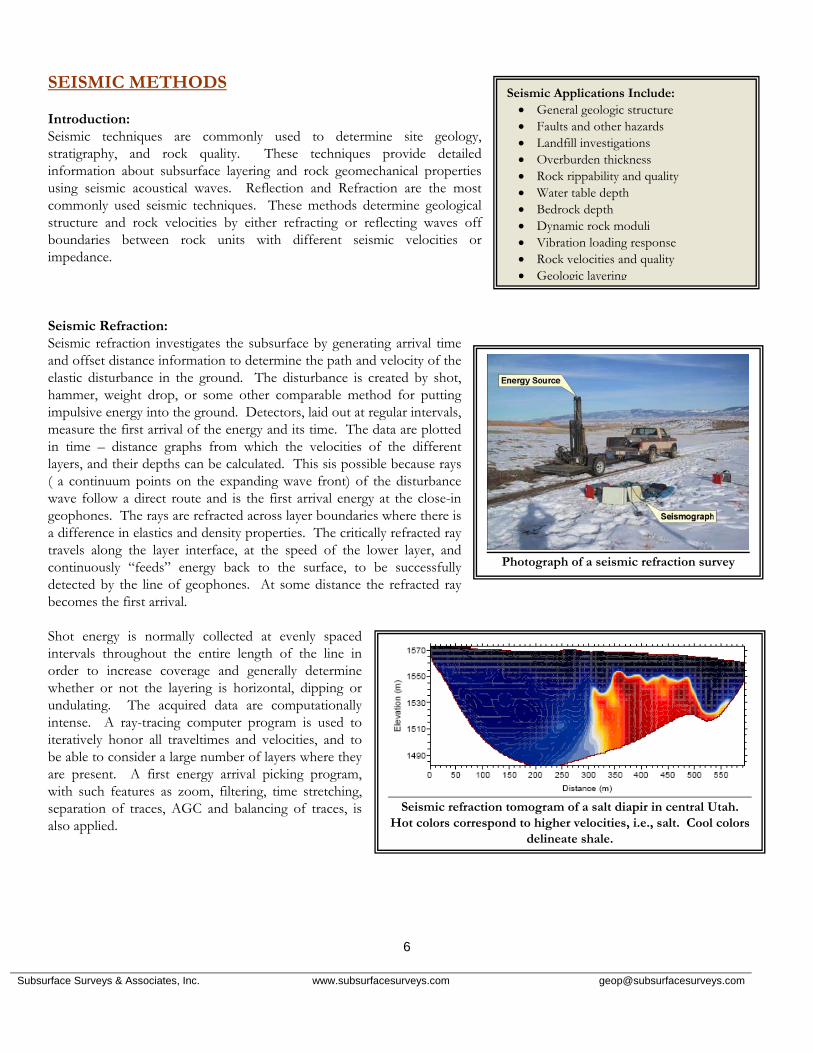
Photograph of a seismic refraction survey
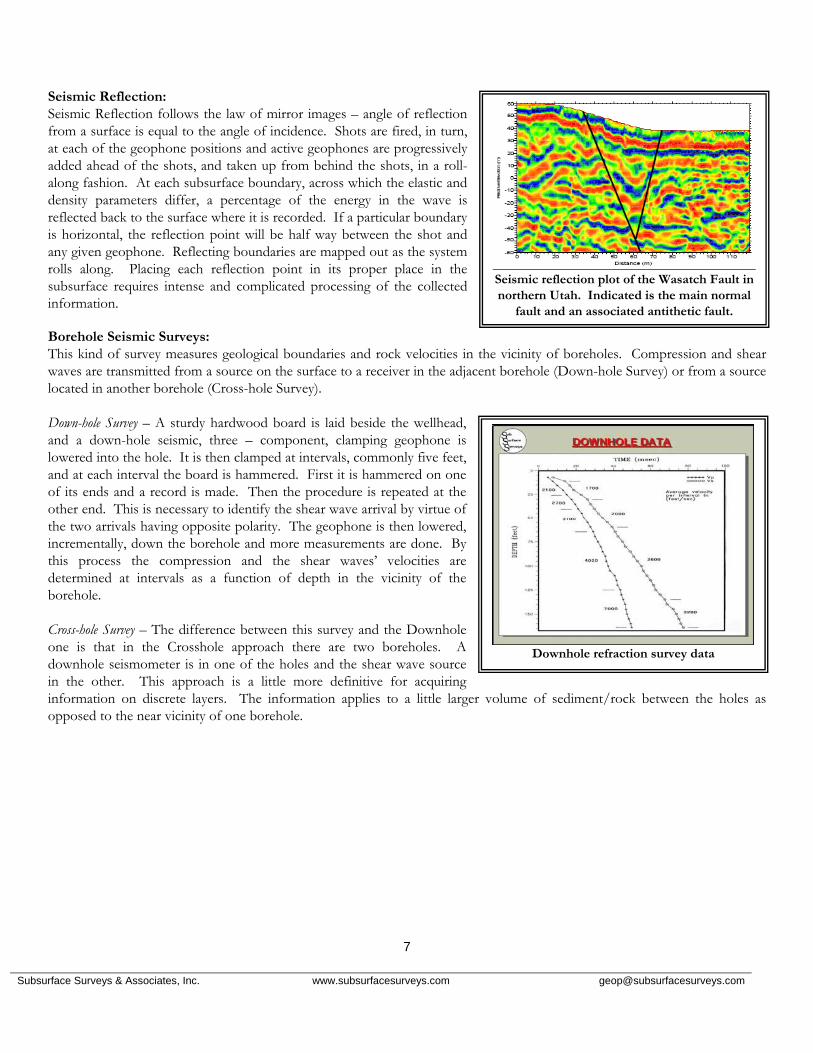
Seismic refraction tomogram of a salt diapir in central Utah.
Hot colors correspond to higher velocities, i.e., salt. Cool colors delineate shale.
SEISMIC METHODS Introduction: Seismic techniques are commonly used to determine site geology, stratigraphy, and rock quality. These techniques provide detailed information about subsurface layering and rock geomechanical properties using seismic acoustical waves. Reflection and Refraction are the most commonly used seismic techniques. These methods determine geological structure and rock velocities by either refracting or reflecting waves off boundaries between rock units with different seismic velocities or impedance. Seismic Refraction: Seismic refraction investigates the subsurface by generating arrival time and offset distance information to determine the path and velocity of the elastic disturbance in the ground. The disturbance is created by shot, hammer, weight drop, or some other comparable method for putting impulsive energy into the ground. Detectors, laid out at regular intervals, measure the first arrival of the energy and its time. The data are plotted in time – distance graphs from which the velocities of the different layers, and their depths can be calculated. This sis possible because rays ( a continuum points on the expanding wave front) of the disturbance wave follow a direct route and is the first arrival energy at the close-in geophones. The rays are refracted across layer boundaries where there is a difference in elastics and density properties. The critically refracted ray travels along the layer interface, at the speed of the lower layer, and continuously “feeds” energy back to the surface, to be successfully detected by the line of geophones. At some distance the refracted ray becomes the first arrival. Shot energy is normally collected at evenly spaced intervals throughout the entire length of the line in order to increase coverage and generally determine whether or not the layering is horizontal, dipping or undulating. The acquired data are computationally intense. A ray-tracing computer program is used to iteratively honor all traveltimes and velocities, and to be able to consider a large number of layers where they are present. A first energy arrival picking program, with such features as zoom, filtering, time stretching, separation of traces, AGC and balancing of traces, is also applied.
Subsurface Surveys & Associates, Inc. www.subsurfacesurveys.com [email protected]
7
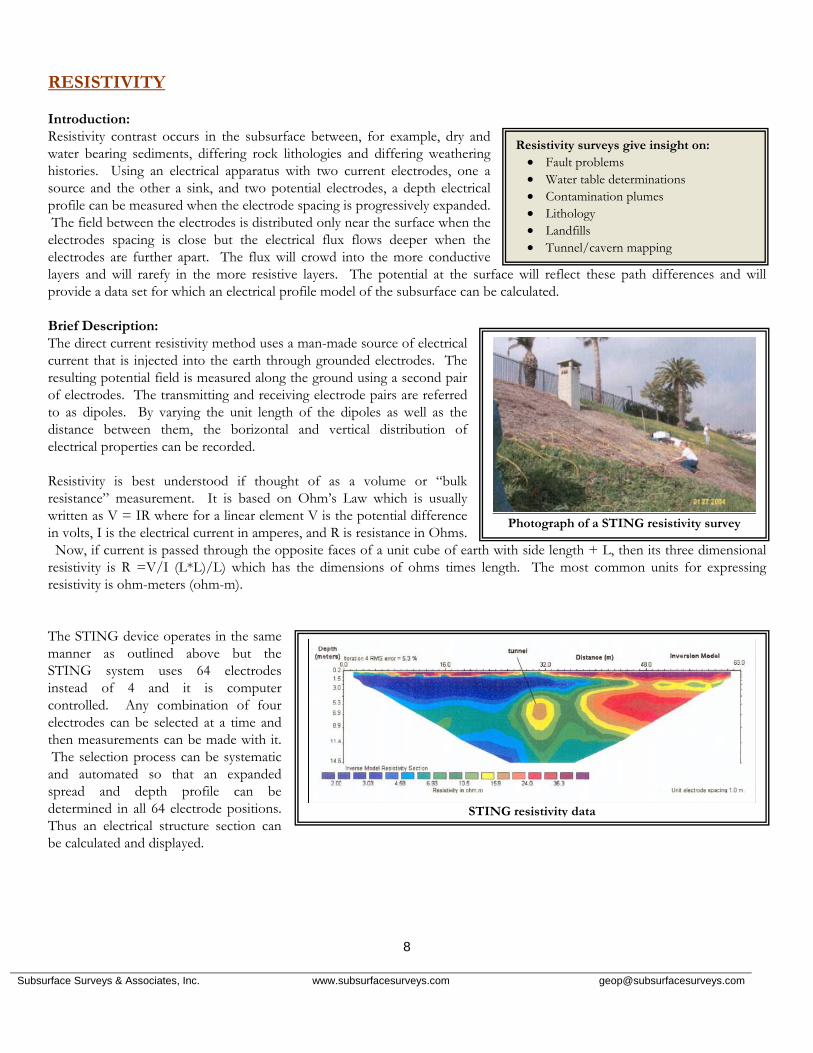
Seismic reflection plot of the Wasatch Fault in northern Utah. Indicated is the main normal
fault and an associated antithetic fault.
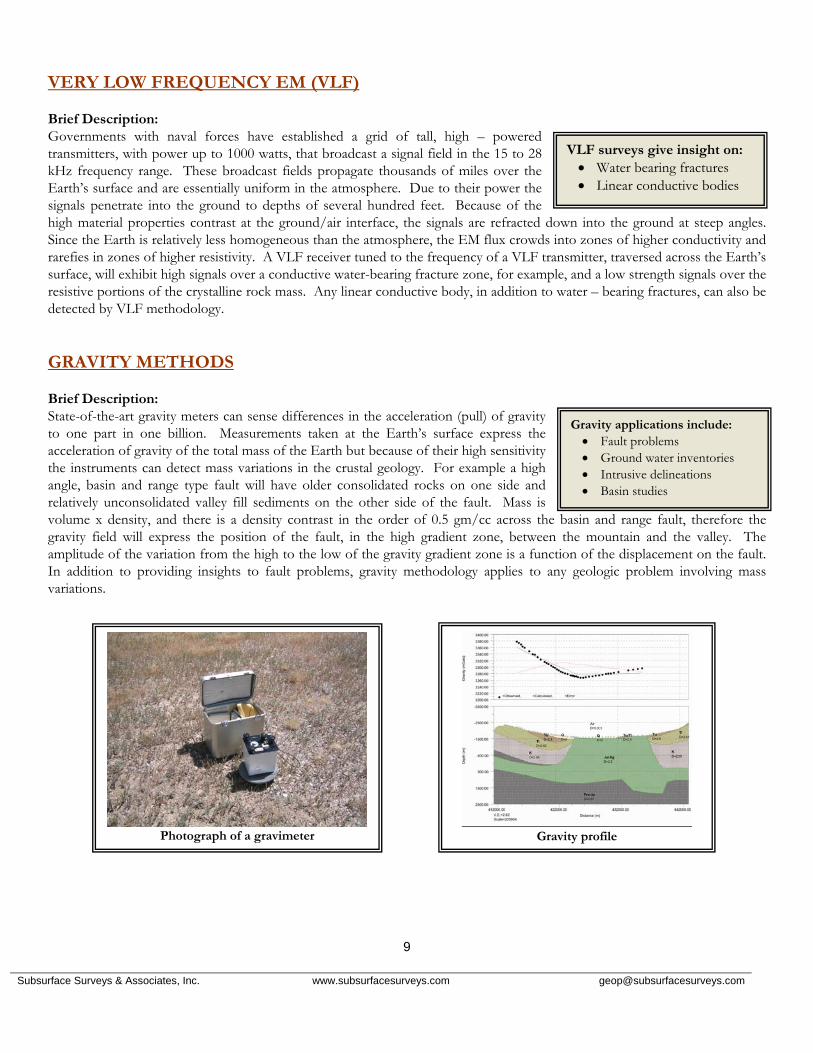
Downhole refraction survey data
Seismic Reflection: Seismic Reflection follows the law of mirror images – angle of reflection from a surface is equal to the angle of incidence. Shots are fired, in turn, at each of the geophone positions and active geophones are progressively added ahead of the shots, and taken up from behind the shots, in a roll-along fashion. At each subsurface boundary, across which the elastic and density parameters differ, a percentage of the energy in the wave is reflected back to the surface where it is recorded. If a particular boundary is horizontal, the reflection point will be half way between the shot and any given geophone. Reflecting boundaries are mapped out as the system rolls along. Placing each reflection point in its proper place in the subsurface requires intense and complicated processing of the collected information. Borehole Seismic Surveys: This kind of survey measures geological boundaries and rock velocities in the vicinity of boreholes. Compression and shear waves are transmitted from a source on the surface to a receiver in the adjacent borehole (Down-hole Survey) or from a source located in another borehole (Cross-hole Survey). Down-hole Survey – A sturdy hardwood board is laid beside the wellhead, and a down-hole seismic, three – component, clamping geophone is lowered into the hole. It is then clamped at intervals, commonly five feet, and at each interval the board is hammered. First it is hammered on one of its ends and a record is made. Then the procedure is repeated at the other end. This is necessary to identify the shear wave arrival by virtue of the two arrivals having opposite polarity. The geophone is then lowered, incrementally, down the borehole and more measurements are done. By this process the compression and the shear waves’ velocities are determined at intervals as a function of depth in the vicinity of the borehole. Cross-hole Survey – The difference between this survey and the Downhole one is that in the Crosshole approach there are two boreholes. A downhole seismometer is in one of the holes and the shear wave source in the other. This approach is a little more definitive for acquiring information on discrete layers. The information applies to a little larger volume of sediment/rock between the holes as opposed to the near vicinity of one borehole.
Subsurface Surveys & Associates, Inc. www.subsurfacesurveys.com [email protected]
8
Resistivity surveys give insight on: • Fault problems • Water table determinations • Contamination plumes • Lithology • Landfills • Tunnel/cavern mapping
Photograph of a STING resistivity survey
STING resistivity data
RESISTIVITY Introduction: Resistivity contrast occurs in the subsurface between, for example, dry and water bearing sediments, differing rock lithologies and differing weathering histories. Using an electrical apparatus with two current electrodes, one a source and the other a sink, and two potential electrodes, a depth electrical profile can be measured when the electrode spacing is progressively expanded. The field between the electrodes is distributed only near the surface when the electrodes spacing is close but the electrical flux flows deeper when the electrodes are further apart. The flux will crowd into the more conductive layers and will rarefy in the more resistive layers. The potential at the surface will reflect these path differences and will provide a data set for which an electrical profile model of the subsurface can be calculated. Brief Description: The direct current resistivity method uses a man-made source of electrical current that is injected into the earth through grounded electrodes. The resulting potential field is measured along the ground using a second pair of electrodes. The transmitting and receiving electrode pairs are referred to as dipoles. By varying the unit length of the dipoles as well as the distance between them, the borizontal and vertical distribution of electrical properties can be recorded. Resistivity is best understood if thought of as a volume or “bulk resistance” measurement. It is based on Ohm’s Law which is usually written as V = IR where for a linear element V is the potential difference in volts, I is the electrical current in amperes, and R is resistance in Ohms. Now, if current is passed through the opposite faces of a unit cube of earth with side length + L, then its three dimensional resistivity is R =V/I (L*L)/L) which has the dimensions of ohms times length. The most common units for expressing resistivity is ohm-meters (ohm-m). The STING device operates in the same manner as outlined above but the STING system uses 64 electrodes instead of 4 and it is computer controlled. Any combination of four electrodes can be selected at a time and then measurements can be made with it. The selection process can be systematic and automated so that an expanded spread and depth profile can be determined in all 64 electrode positions. Thus an electrical structure section can be calculated and displayed.
Subsurface Surveys & Associates, Inc. www.subsurfacesurveys.com [email protected]
9
VLF surveys give insight on: • Water bearing fractures • Linear conductive bodies
Gravity applications include: • Fault problems • Ground water inventories • Intrusive delineations • Basin studies
Photograph of a gravimeter
Gravity profile
VERY LOW FREQUENCY EM (VLF) Brief Description: Governments with naval forces have established a grid of tall, high – powered transmitters, with power up to 1000 watts, that broadcast a signal field in the 15 to 28 kHz frequency range. These broadcast fields propagate thousands of miles over the Earth’s surface and are essentially uniform in the atmosphere. Due to their power the signals penetrate into the ground to depths of several hundred feet. Because of the high material properties contrast at the ground/air interface, the signals are refracted down into the ground at steep angles. Since the Earth is relatively less homogeneous than the atmosphere, the EM flux crowds into zones of higher conductivity and rarefies in zones of higher resistivity. A VLF receiver tuned to the frequency of a VLF transmitter, traversed across the Earth’s surface, will exhibit high signals over a conductive water-bearing fracture zone, for example, and a low strength signals over the resistive portions of the crystalline rock mass. Any linear conductive body, in addition to water – bearing fractures, can also be detected by VLF methodology. GRAVITY METHODS Brief Description: State-of-the-art gravity meters can sense differences in the acceleration (pull) of gravity to one part in one billion. Measurements taken at the Earth’s surface express the acceleration of gravity of the total mass of the Earth but because of their high sensitivity the instruments can detect mass variations in the crustal geology. For example a high angle, basin and range type fault will have older consolidated rocks on one side and relatively unconsolidated valley fill sediments on the other side of the fault. Mass is volume x density, and there is a density contrast in the order of 0.5 gm/cc across the basin and range fault, therefore the gravity field will express the position of the fault, in the high gradient zone, between the mountain and the valley. The amplitude of the variation from the high to the low of the gravity gradient zone is a function of the displacement on the fault. In addition to providing insights to fault problems, gravity methodology applies to any geologic problem involving mass variations.
Subsurface Surveys & Associates, Inc. www.subsurfacesurveys.com [email protected]
10
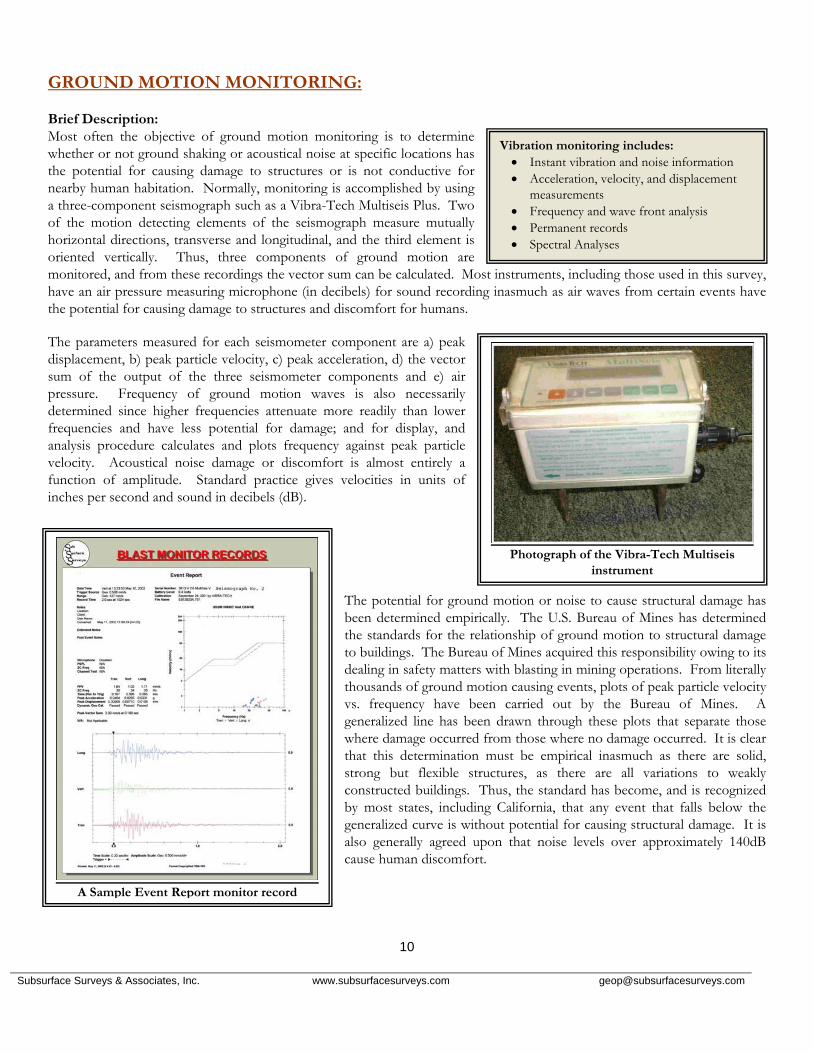
Vibration monitoring includes: • Instant vibration and noise information • Acceleration, velocity, and displacement
measurements • Frequency and wave front analysis • Permanent records • Spectral Analyses
Photograph of the Vibra-Tech Multiseis
instrument
A Sample Event Report monitor record
GROUND MOTION MONITORING: Brief Description: Most often the objective of ground motion monitoring is to determine whether or not ground shaking or acoustical noise at specific locations has the potential for causing damage to structures or is not conductive for nearby human habitation. Normally, monitoring is accomplished by using a three-component seismograph such as a Vibra-Tech Multiseis Plus. Two of the motion detecting elements of the seismograph measure mutually horizontal directions, transverse and longitudinal, and the third element is oriented vertically. Thus, three components of ground motion are monitored, and from these recordings the vector sum can be calculated. Most instruments, including those used in this survey, have an air pressure measuring microphone (in decibels) for sound recording inasmuch as air waves from certain events have the potential for causing damage to structures and discomfort for humans. The parameters measured for each seismometer component are a) peak displacement, b) peak particle velocity, c) peak acceleration, d) the vector sum of the output of the three seismometer components and e) air pressure. Frequency of ground motion waves is also necessarily determined since higher frequencies attenuate more readily than lower frequencies and have less potential for damage; and for display, and analysis procedure calculates and plots frequency against peak particle velocity. Acoustical noise damage or discomfort is almost entirely a function of amplitude. Standard practice gives velocities in units of inches per second and sound in decibels (dB).
The potential for ground motion or noise to cause structural damage has been determined empirically. The U.S. Bureau of Mines has determined the standards for the relationship of ground motion to structural damage to buildings. The Bureau of Mines acquired this responsibility owing to its dealing in safety matters with blasting in mining operations. From literally thousands of ground motion causing events, plots of peak particle velocity vs. frequency have been carried out by the Bureau of Mines. A generalized line has been drawn through these plots that separate those where damage occurred from those where no damage occurred. It is clear that this determination must be empirical inasmuch as there are solid, strong but flexible structures, as there are all variations to weakly constructed buildings. Thus, the standard has become, and is recognized by most states, including California, that any event that falls below the generalized curve is without potential for causing structural damage. It is also generally agreed upon that noise levels over approximately 140dB cause human discomfort.


![Comparison of different probabilistic methods for ... · typical applications finite element method in 2D [19, 22, 24] or 3D [23] is used, but they can be combined with other methods,](https://img.pdfslide.tips/doc/110x75/5f0966827e708231d426a862/comparison-of-diierent-probabilistic-methods-for-typical-applications-inite.jpg)