Embed Size (px)
Citation preview
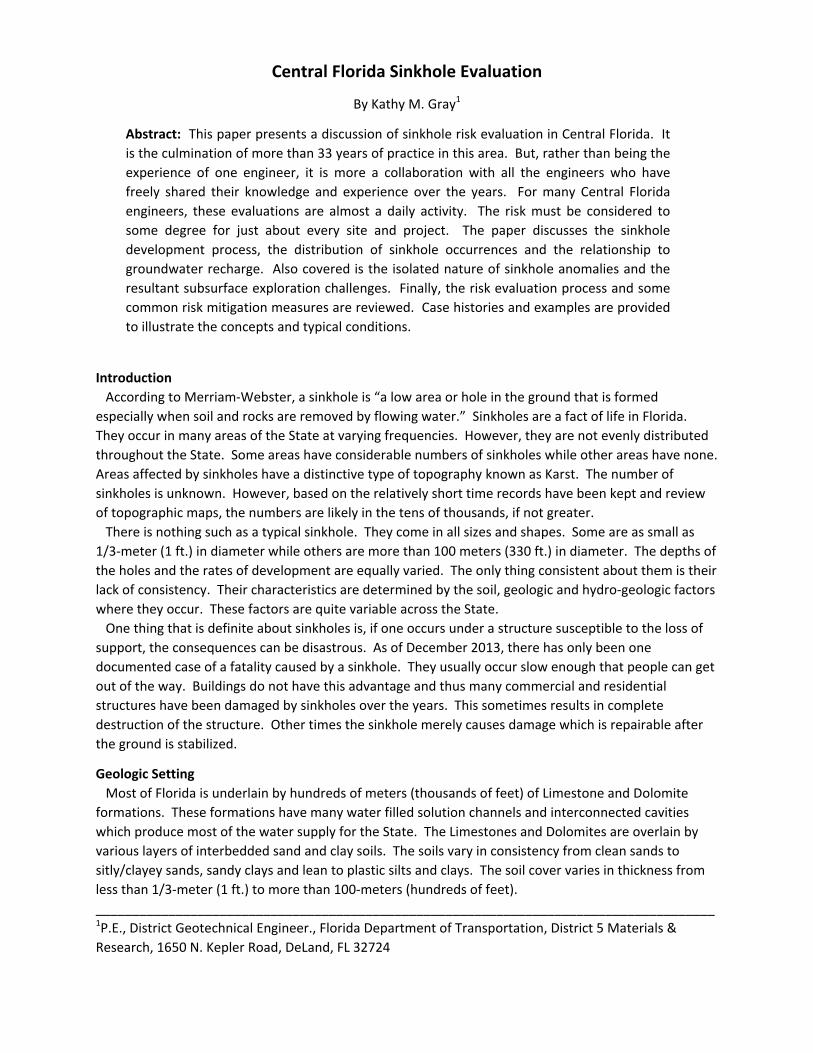
Central Florida Sinkhole Evaluation
By Kathy M. Gray1
Abstract: This paper presents a discussion of sinkhole risk evaluation in Central Florida. It
is the culmination of more than 33 years of practice in this area. But, rather than being the
experience of one engineer, it is more a collaboration with all the engineers who have
freely shared their knowledge and experience over the years. For many Central Florida
engineers, these evaluations are almost a daily activity. The risk must be considered to
some degree for just about every site and project. The paper discusses the sinkhole
development process, the distribution of sinkhole occurrences and the relationship to
groundwater recharge. Also covered is the isolated nature of sinkhole anomalies and the
resultant subsurface exploration challenges. Finally, the risk evaluation process and some
common risk mitigation measures are reviewed. Case histories and examples are provided
to illustrate the concepts and typical conditions.
Introduction
According to Merriam‐Webster, a sinkhole is “a low area or hole in the ground that is formed
especially when soil and rocks are removed by flowing water.” Sinkholes are a fact of life in Florida.
They occur in many areas of the State at varying frequencies. However, they are not evenly distributed
throughout the State. Some areas have considerable numbers of sinkholes while other areas have none.
Areas affected by sinkholes have a distinctive type of topography known as Karst. The number of
sinkholes is unknown. However, based on the relatively short time records have been kept and review
of topographic maps, the numbers are likely in the tens of thousands, if not greater.
There is nothing such as a typical sinkhole. They come in all sizes and shapes. Some are as small as
1/3‐meter (1 ft.) in diameter while others are more than 100 meters (330 ft.) in diameter. The depths of
the holes and the rates of development are equally varied. The only thing consistent about them is their
lack of consistency. Their characteristics are determined by the soil, geologic and hydro‐geologic factors
where they occur. These factors are quite variable across the State.
One thing that is definite about sinkholes is, if one occurs under a structure susceptible to the loss of
support, the consequences can be disastrous. As of December 2013, there has only been one
documented case of a fatality caused by a sinkhole. They usually occur slow enough that people can get
out of the way. Buildings do not have this advantage and thus many commercial and residential
structures have been damaged by sinkholes over the years. This sometimes results in complete
destruction of the structure. Other times the sinkhole merely causes damage which is repairable after
the ground is stabilized.
Geologic Setting
Most of Florida is underlain by hundreds of meters (thousands of feet) of Limestone and Dolomite
formations. These formations have many water filled solution channels and interconnected cavities
which produce most of the water supply for the State. The Limestones and Dolomites are overlain by
various layers of interbedded sand and clay soils. The soils vary in consistency from clean sands to
sitly/clayey sands, sandy clays and lean to plastic silts and clays. The soil cover varies in thickness from
less than 1/3‐meter (1 ft.) to more than 100‐meters (hundreds of feet).
_____________________________________________________________________________________ 1P.E., District Geotechnical Engineer., Florida Department of Transportation, District 5 Materials &
Research, 1650 N. Kepler Road, DeLand, FL 32724
In the sinkhole active areas of the State, the groundwater profile consists of two aquifers separated to
varying degrees by a clayey aquiclude. The upper, unconfined aquifer is primarily contained in the near
surface strata of sandy soils. The lower, confined aquifer is in the underlying cavernous Limestone
formations. The two aquifers are hydraulically connected in localized areas where the aquiclude is
breached or non‐existent. In these areas, there is a downward gradient of flow which feeds the lower
aquifer. This downward flow of groundwater is referred to as Recharge.
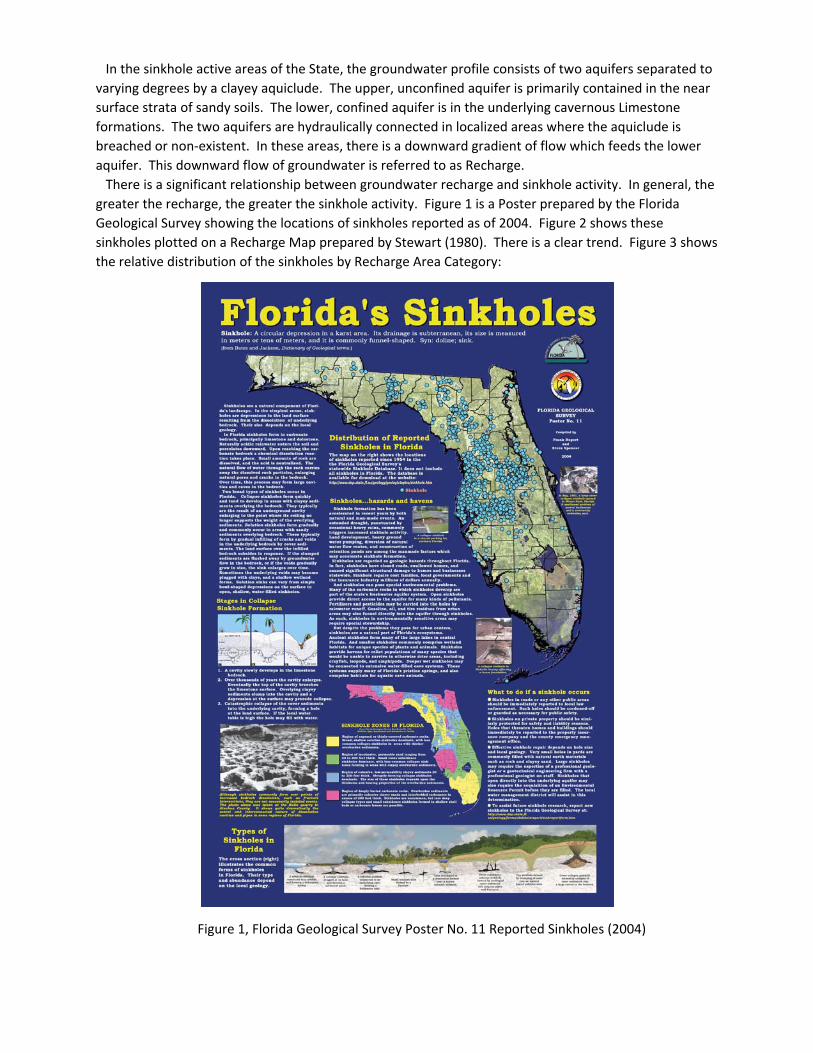
There is a significant relationship between groundwater recharge and sinkhole activity. In general, the
greater the recharge, the greater the sinkhole activity. Figure 1 is a Poster prepared by the Florida
Geological Survey showing the locations of sinkholes reported as of 2004. Figure 2 shows these
sinkholes plotted on a Recharge Map prepared by Stewart (1980). There is a clear trend. Figure 3 shows
the relative distribution of the sinkholes by Recharge Area Category:
Figure 1, Florida Geological Survey Poster No. 11 Reported Sinkholes (2004)
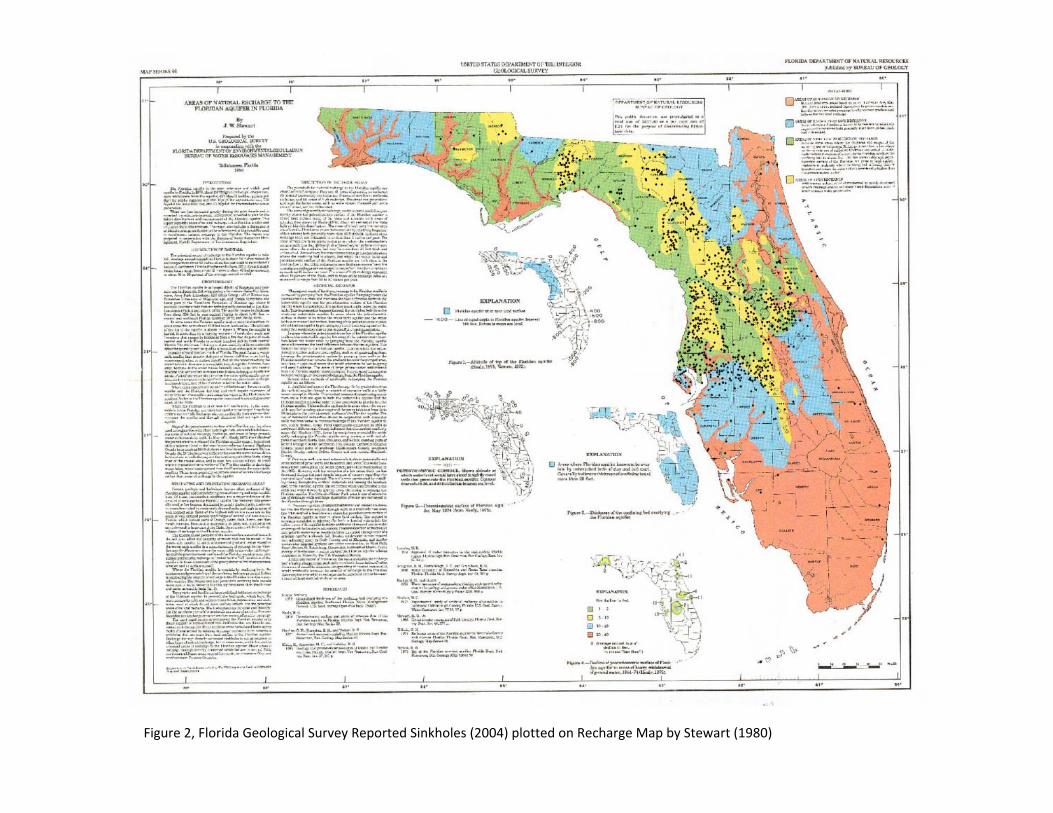
Figure 2, Florida Geological Survey Reported Sinkholes (2004) plotted on Recharge Map by Stewart (1980)
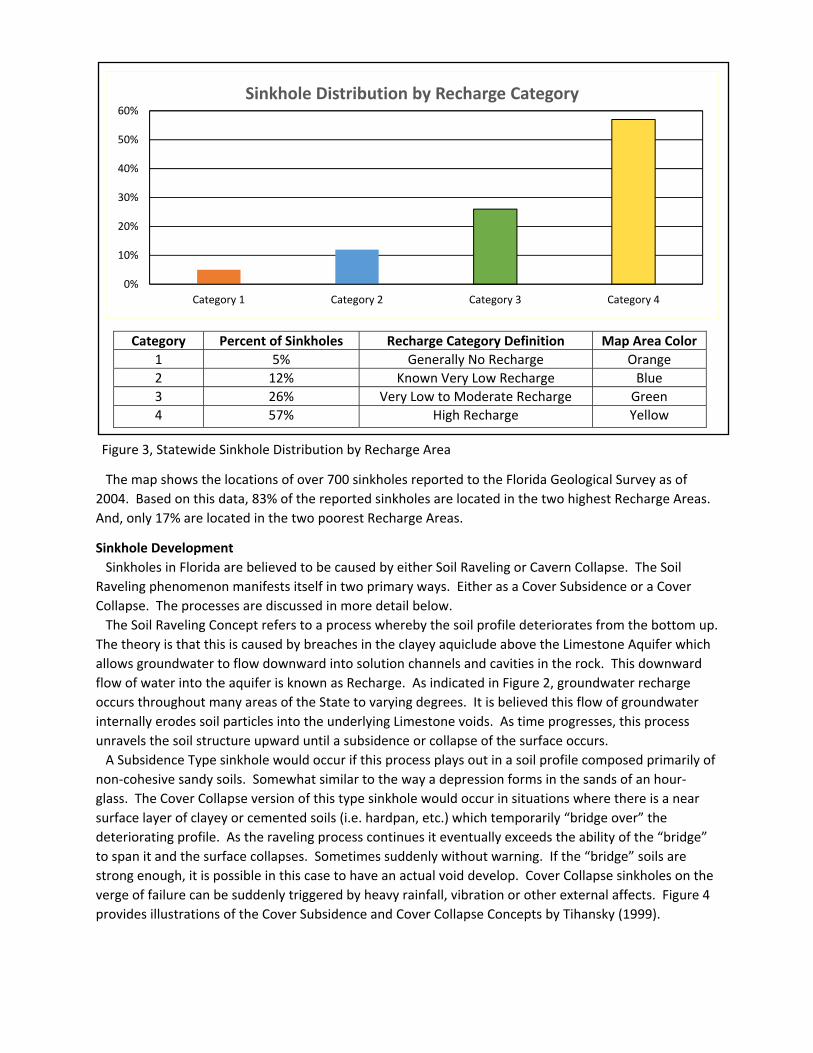
Category Percent of Sinkholes Recharge Category Definition Map Area Color
1 5% Generally No Recharge Orange
2 12% Known Very Low Recharge Blue
3 26% Very Low to Moderate Recharge Green
4 57% High Recharge Yellow
Figure 3, Statewide Sinkhole Distribution by Recharge Area
The map shows the locations of over 700 sinkholes reported to the Florida Geological Survey as of
2004. Based on this data, 83% of the reported sinkholes are located in the two highest Recharge Areas.
And, only 17% are located in the two poorest Recharge Areas.
Sinkhole Development
Sinkholes in Florida are believed to be caused by either Soil Raveling or Cavern Collapse. The Soil
Raveling phenomenon manifests itself in two primary ways. Either as a Cover Subsidence or a Cover
Collapse. The processes are discussed in more detail below.
The Soil Raveling Concept refers to a process whereby the soil profile deteriorates from the bottom up.
The theory is that this is caused by breaches in the clayey aquiclude above the Limestone Aquifer which
allows groundwater to flow downward into solution channels and cavities in the rock. This downward
flow of water into the aquifer is known as Recharge. As indicated in Figure 2, groundwater recharge
occurs throughout many areas of the State to varying degrees. It is believed this flow of groundwater
internally erodes soil particles into the underlying Limestone voids. As time progresses, this process
unravels the soil structure upward until a subsidence or collapse of the surface occurs.
A Subsidence Type sinkhole would occur if this process plays out in a soil profile composed primarily of
non‐cohesive sandy soils. Somewhat similar to the way a depression forms in the sands of an hour‐
glass. The Cover Collapse version of this type sinkhole would occur in situations where there is a near
surface layer of clayey or cemented soils (i.e. hardpan, etc.) which temporarily “bridge over” the
deteriorating profile. As the raveling process continues it eventually exceeds the ability of the “bridge”
to span it and the surface collapses. Sometimes suddenly without warning. If the “bridge” soils are
strong enough, it is possible in this case to have an actual void develop. Cover Collapse sinkholes on the
verge of failure can be suddenly triggered by heavy rainfall, vibration or other external affects. Figure 4
provides illustrations of the Cover Subsidence and Cover Collapse Concepts by Tihansky (1999).
0%
10%
20%
30%
40%
50%
60%
Category 1 Category 2 Category 3 Category 4
Sinkhole Distribution by Recharge Category
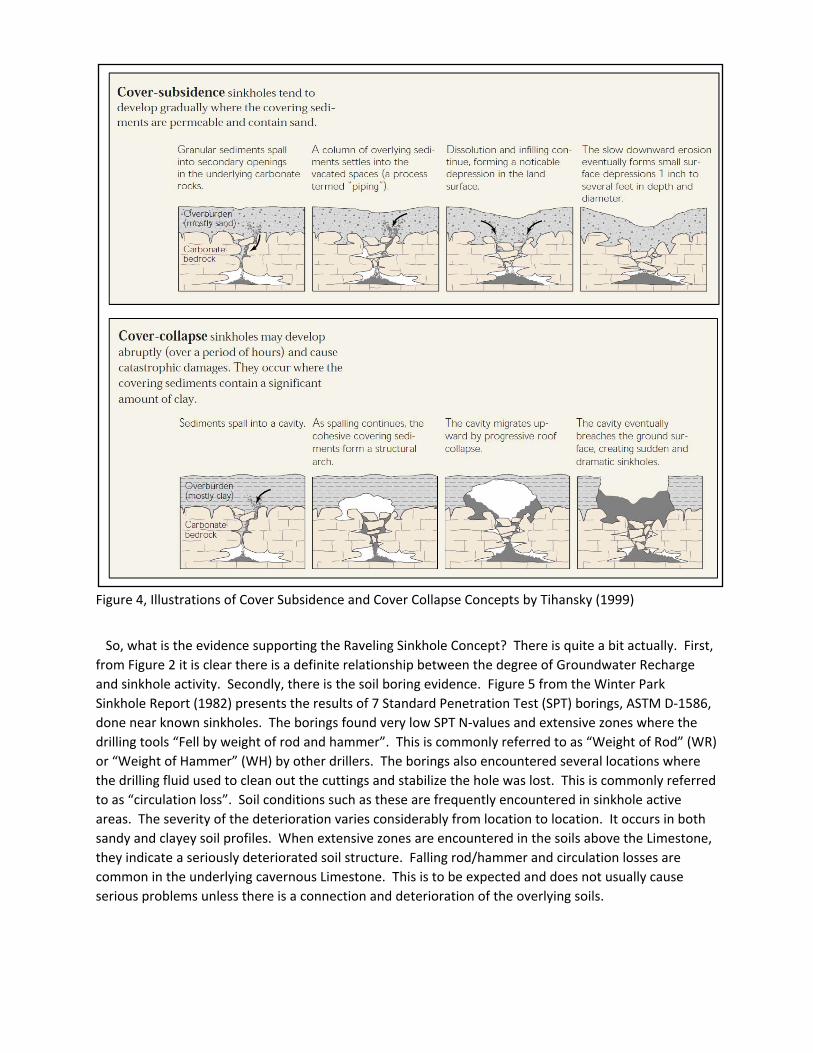
Figure 4, Illustrations of Cover Subsidence and Cover Collapse Concepts by Tihansky (1999)
So, what is the evidence supporting the Raveling Sinkhole Concept? There is quite a bit actually. First,
from Figure 2 it is clear there is a definite relationship between the degree of Groundwater Recharge
and sinkhole activity. Secondly, there is the soil boring evidence. Figure 5 from the Winter Park
Sinkhole Report (1982) presents the results of 7 Standard Penetration Test (SPT) borings, ASTM D‐1586,
done near known sinkholes. The borings found very low SPT N‐values and extensive zones where the
drilling tools “Fell by weight of rod and hammer”. This is commonly referred to as “Weight of Rod” (WR)
or “Weight of Hammer” (WH) by other drillers. The borings also encountered several locations where
the drilling fluid used to clean out the cuttings and stabilize the hole was lost. This is commonly referred
to as “circulation loss”. Soil conditions such as these are frequently encountered in sinkhole active
areas. The severity of the deterioration varies considerably from location to location. It occurs in both
sandy and clayey soil profiles. When extensive zones are encountered in the soils above the Limestone,
they indicate a seriously deteriorated soil structure. Falling rod/hammer and circulation losses are
common in the underlying cavernous Limestone. This is to be expected and does not usually cause
serious problems unless there is a connection and deterioration of the overlying soils.
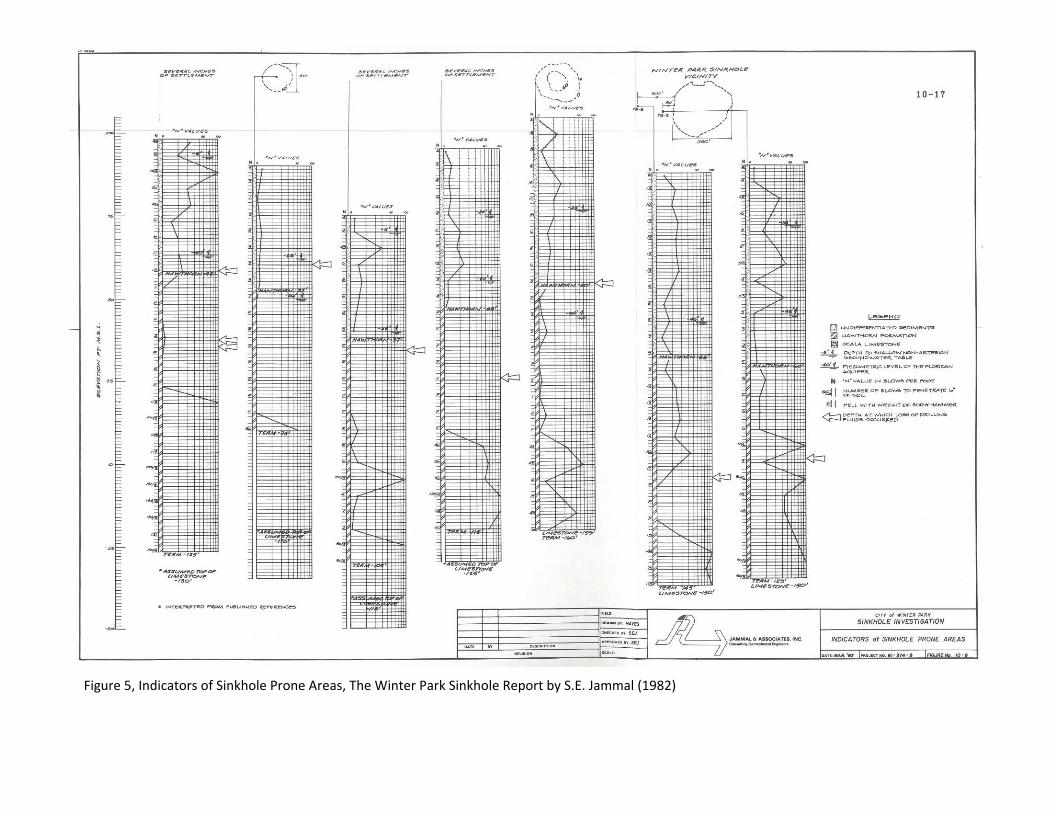
Figure 5, Indicators of Sinkhole Prone Areas, The Winter Park Sinkhole Report by S.E. Jammal (1982)
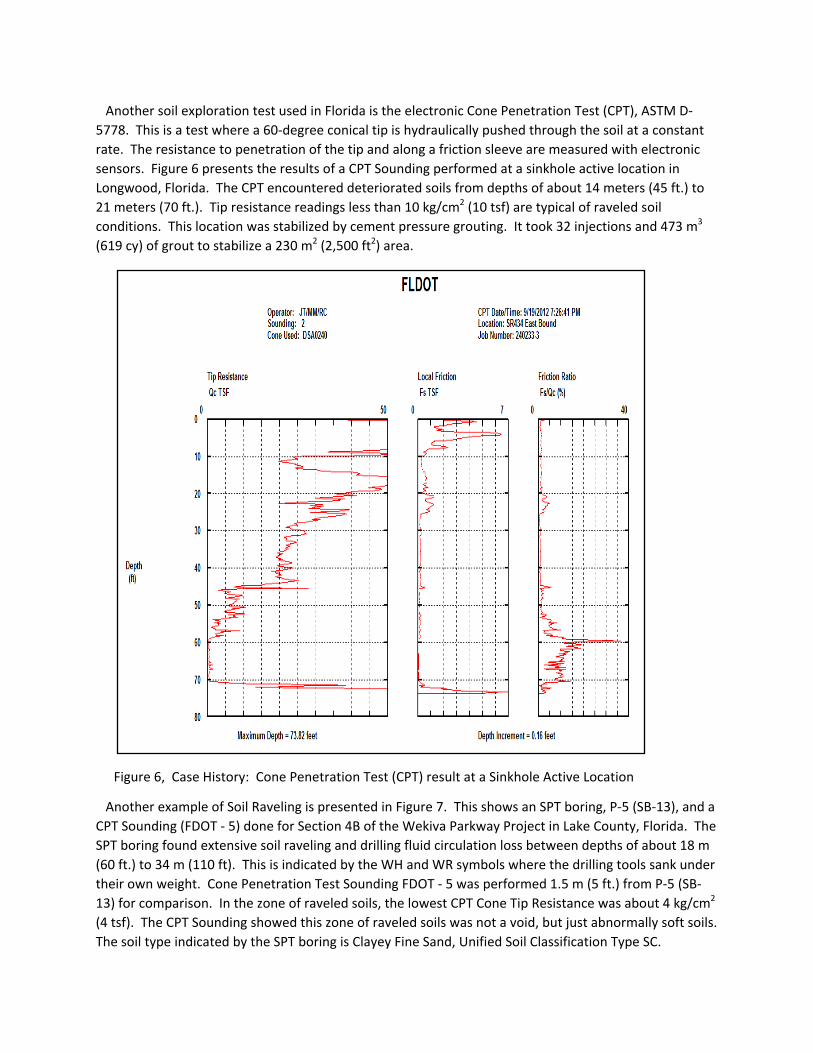
Another soil exploration test used in Florida is the electronic Cone Penetration Test (CPT), ASTM D‐
5778. This is a test where a 60‐degree conical tip is hydraulically pushed through the soil at a constant
rate. The resistance to penetration of the tip and along a friction sleeve are measured with electronic
sensors. Figure 6 presents the results of a CPT Sounding performed at a sinkhole active location in
Longwood, Florida. The CPT encountered deteriorated soils from depths of about 14 meters (45 ft.) to
21 meters (70 ft.). Tip resistance readings less than 10 kg/cm2 (10 tsf) are typical of raveled soil
conditions. This location was stabilized by cement pressure grouting. It took 32 injections and 473 m3
(619 cy) of grout to stabilize a 230 m2 (2,500 ft2) area.
1 Figure 6, Case History: Cone Penetration Test (CPT) result at a Sinkhole Active Location
Another example of Soil Raveling is presented in Figure 7. This shows an SPT boring, P‐5 (SB‐13), and a
CPT Sounding (FDOT ‐ 5) done for Section 4B of the Wekiva Parkway Project in Lake County, Florida. The
SPT boring found extensive soil raveling and drilling fluid circulation loss between depths of about 18 m
(60 ft.) to 34 m (110 ft). This is indicated by the WH and WR symbols where the drilling tools sank under
their own weight. Cone Penetration Test Sounding FDOT ‐ 5 was performed 1.5 m (5 ft.) from P‐5 (SB‐
13) for comparison. In the zone of raveled soils, the lowest CPT Cone Tip Resistance was about 4 kg/cm2
(4 tsf). The CPT Sounding showed this zone of raveled soils was not a void, but just abnormally soft soils.
The soil type indicated by the SPT boring is Clayey Fine Sand, Unified Soil Classification Type SC.
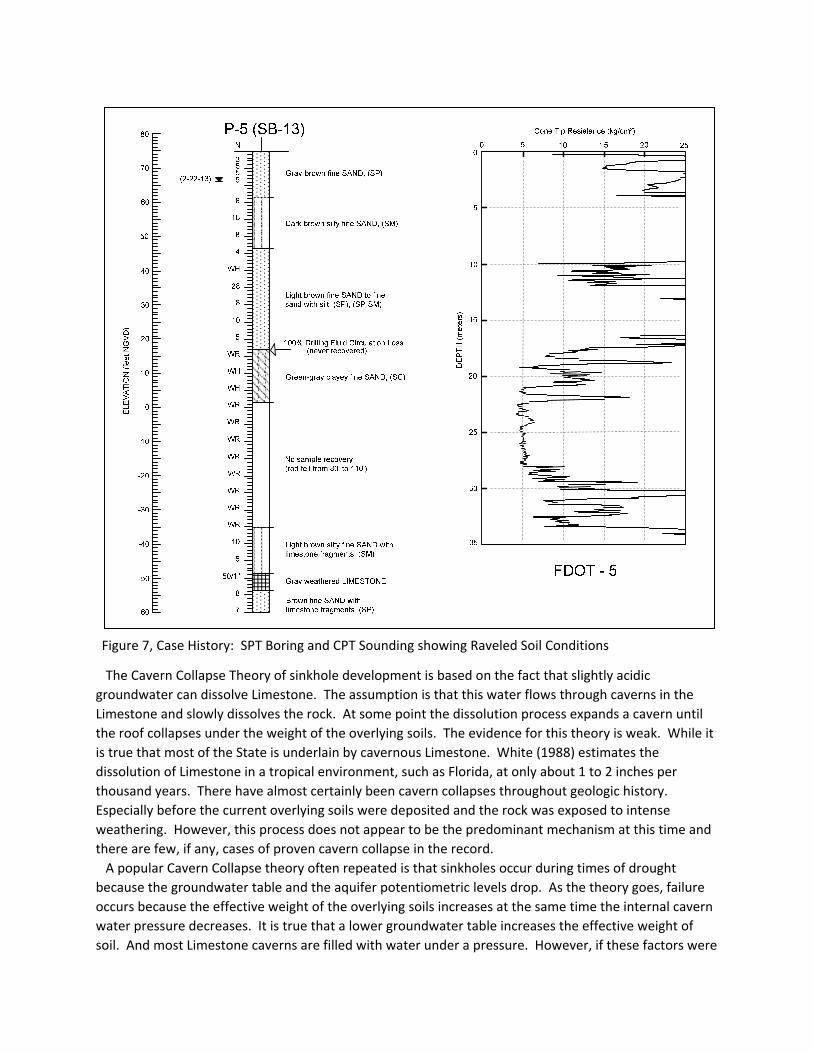
Figure 7, Case History: SPT Boring and CPT Sounding showing Raveled Soil Conditions
The Cavern Collapse Theory of sinkhole development is based on the fact that slightly acidic
groundwater can dissolve Limestone. The assumption is that this water flows through caverns in the
Limestone and slowly dissolves the rock. At some point the dissolution process expands a cavern until
the roof collapses under the weight of the overlying soils. The evidence for this theory is weak. While it
is true that most of the State is underlain by cavernous Limestone. White (1988) estimates the
dissolution of Limestone in a tropical environment, such as Florida, at only about 1 to 2 inches per
thousand years. There have almost certainly been cavern collapses throughout geologic history.
Especially before the current overlying soils were deposited and the rock was exposed to intense
weathering. However, this process does not appear to be the predominant mechanism at this time and
there are few, if any, cases of proven cavern collapse in the record.
A popular Cavern Collapse theory often repeated is that sinkholes occur during times of drought
because the groundwater table and the aquifer potentiometric levels drop. As the theory goes, failure
occurs because the effective weight of the overlying soils increases at the same time the internal cavern
water pressure decreases. It is true that a lower groundwater table increases the effective weight of
soil. And most Limestone caverns are filled with water under a pressure. However, if these factors were
the cause of sinkholes, there should be a relatively even distribution of sinkholes throughout the State
because the entire peninsula is underlain by cavernous limestone. But, as shown in Figure 45, sinkholes
are not evenly distributed throughout the State. The higher Recharge areas have a higher concentration
of sinkholes and the lesser Recharge areas have much fewer. And, sinkholes occur during both wet and
dry seasons, not just during droughts.
Another problem with the Cavern Collapse Theory is what comes first. Dissolution of the Limestone is
believed to be most intense at the point of recharge where the acidic water first enters the system. As
the water reacts with the rock the acidity should be neutralized and less dissolution should occur
downstream. So which material is more susceptible to the deteriorating effects of the water? The
Limestone rock or the soils overlying the entrance to the system. The rock has much more cohesive
strength than the soils. Thus the soils are much more susceptible to erosion than the rock. If there is a
point of recharge, there is almost certainly soil erosion and raveling occurring at a much faster rate than
the slow dissolution of the rock. Therefore, it is more likely for a sinkhole to occur due to raveling than
cavern roof collapse.
Exploration Issues
Traditional field exploration methods for sinkhole evaluations consist of aerial photo review,
topographic map review, Soil Survey review, site visits and the performance of soil borings. Most often
these are Standard Penetration Test (SPT) borings and/or Cone Penetrometer Test soundings (CPT).
Sometimes, Geophysical Surveys such as Ground Penetrating Radar (GPR) and/or Electrical Resistivity
(ER) are used to supplement or guide the SPT and CPT testing. All of these methods prove useful at
times to varying degrees. And, they all suffer from inherent limitations. The biggest limitation of the
boring and sounding methods are the isolated nature of the information they provide. They can only
reveal what they encounter within the diameter of the hole they create. They don’t give much
information about what is between the borings. This can be a significant problem because sinkhole
activity tends to be vertically oriented. Borings are good at finding horizontal layers. They are not good
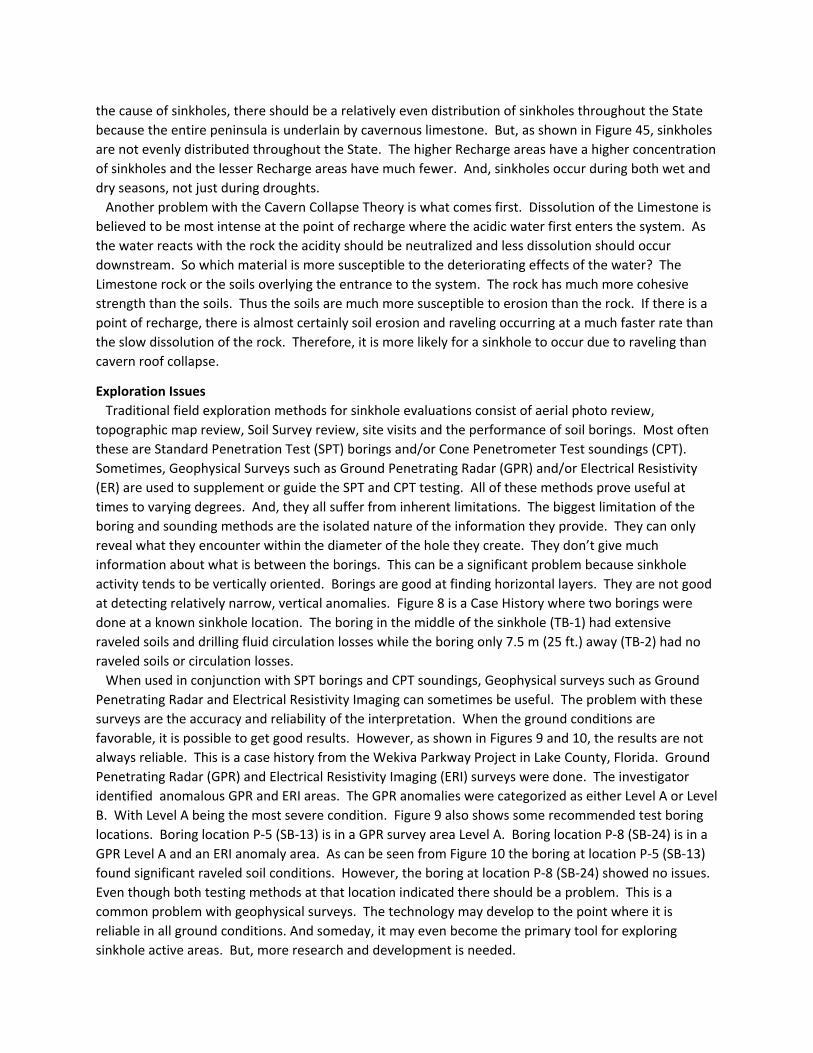
at detecting relatively narrow, vertical anomalies. Figure 8 is a Case History where two borings were
done at a known sinkhole location. The boring in the middle of the sinkhole (TB‐1) had extensive
raveled soils and drilling fluid circulation losses while the boring only 7.5 m (25 ft.) away (TB‐2) had no
raveled soils or circulation losses.
When used in conjunction with SPT borings and CPT soundings, Geophysical surveys such as Ground
Penetrating Radar and Electrical Resistivity Imaging can sometimes be useful. The problem with these
surveys are the accuracy and reliability of the interpretation. When the ground conditions are
favorable, it is possible to get good results. However, as shown in Figures 9 and 10, the results are not
always reliable. This is a case history from the Wekiva Parkway Project in Lake County, Florida. Ground
Penetrating Radar (GPR) and Electrical Resistivity Imaging (ERI) surveys were done. The investigator
identified anomalous GPR and ERI areas. The GPR anomalies were categorized as either Level A or Level
B. With Level A being the most severe condition. Figure 9 also shows some recommended test boring
locations. Boring location P‐5 (SB‐13) is in a GPR survey area Level A. Boring location P‐8 (SB‐24) is in a
GPR Level A and an ERI anomaly area. As can be seen from Figure 10 the boring at location P‐5 (SB‐13)
found significant raveled soil conditions. However, the boring at location P‐8 (SB‐24) showed no issues.
Even though both testing methods at that location indicated there should be a problem. This is a
common problem with geophysical surveys. The technology may develop to the point where it is
reliable in all ground conditions. And someday, it may even become the primary tool for exploring
sinkhole active areas. But, more research and development is needed.
Figure 8, Case History: SPT Boring variability at a known Sinkhole Location
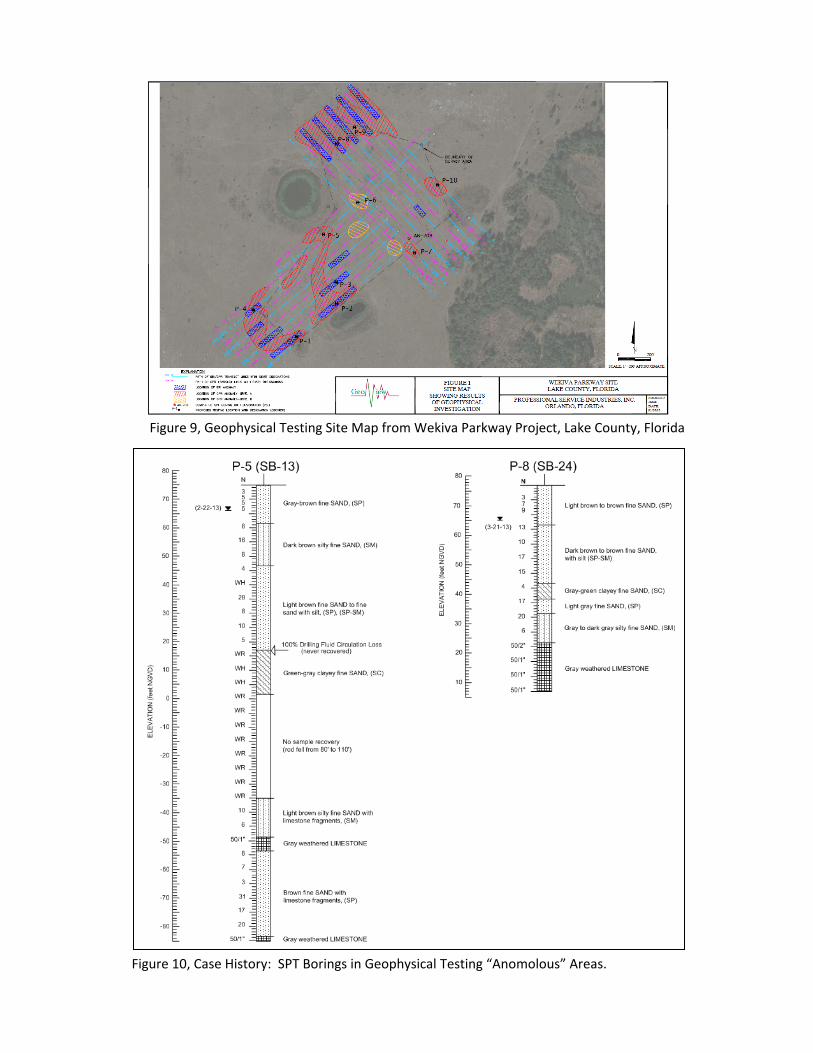
Figure 9, Geophysical Testing Site Map from Wekiva Parkway Project, Lake County, Florida
Figure 10, Case History: SPT Borings in Geophysical Testing “Anomolous” Areas.
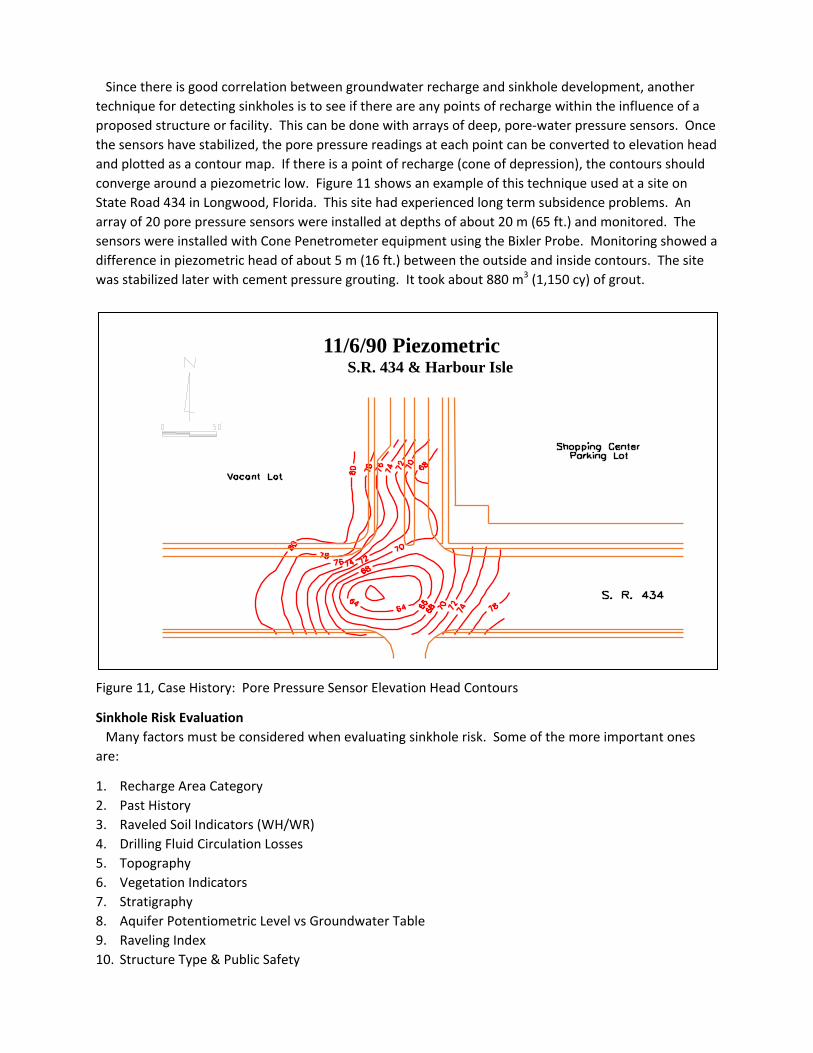
Since there is good correlation between groundwater recharge and sinkhole development, another
technique for detecting sinkholes is to see if there are any points of recharge within the influence of a
proposed structure or facility. This can be done with arrays of deep, pore‐water pressure sensors. Once
the sensors have stabilized, the pore pressure readings at each point can be converted to elevation head
and plotted as a contour map. If there is a point of recharge (cone of depression), the contours should
converge around a piezometric low. Figure 11 shows an example of this technique used at a site on
State Road 434 in Longwood, Florida. This site had experienced long term subsidence problems. An
array of 20 pore pressure sensors were installed at depths of about 20 m (65 ft.) and monitored. The
sensors were installed with Cone Penetrometer equipment using the Bixler Probe. Monitoring showed a
difference in piezometric head of about 5 m (16 ft.) between the outside and inside contours. The site
was stabilized later with cement pressure grouting. It took about 880 m3 (1,150 cy) of grout.
Figure 11, Case History: Pore Pressure Sensor Elevation Head Contours
Sinkhole Risk Evaluation
Many factors must be considered when evaluating sinkhole risk. Some of the more important ones
are:
1. Recharge Area Category
2. Past History
3. Raveled Soil Indicators (WH/WR)
4. Drilling Fluid Circulation Losses
5. Topography
6. Vegetation Indicators
7. Stratigraphy
8. Aquifer Potentiometric Level vs Groundwater Table
9. Raveling Index
10. Structure Type & Public Safety
S.R. 434 & Harbour Isle 11/6/90 Piezometric
The first four items (i.e. Recharge Area Category, Past History, Raveled Soil Indicators and Drilling Fluid
Circulation Losses) have been discussed previously. Other considerations include the site topography,
vegetation indicators, Potentiometric levels vs groundwater table, structure type and public safety.
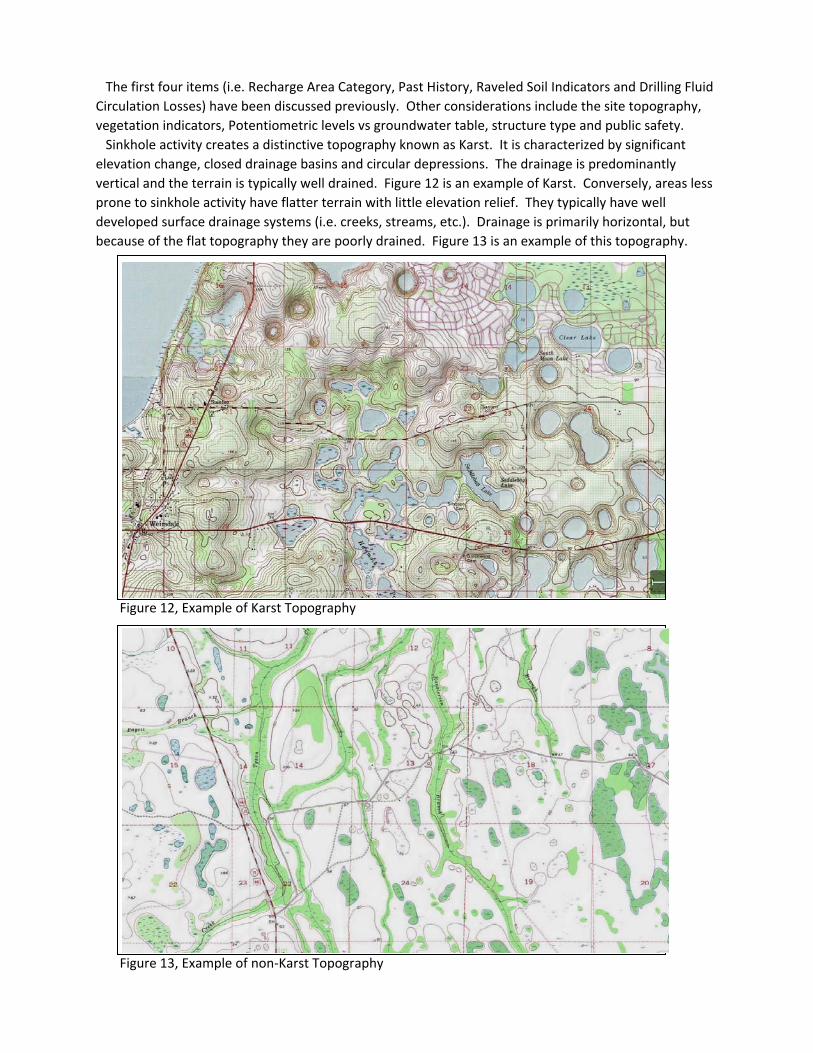
Sinkhole activity creates a distinctive topography known as Karst. It is characterized by significant
elevation change, closed drainage basins and circular depressions. The drainage is predominantly
vertical and the terrain is typically well drained. Figure 12 is an example of Karst. Conversely, areas less
prone to sinkhole activity have flatter terrain with little elevation relief. They typically have well
developed surface drainage systems (i.e. creeks, streams, etc.). Drainage is primarily horizontal, but
because of the flat topography they are poorly drained. Figure 13 is an example of this topography.
Figure 12, Example of Karst Topography
Figure 13, Example of non‐Karst Topography
Another potential indicator of sinkhole activity is vegetation that is stressed. Such an area would have
an isolated patch of brown or dying trees, bushes or grass surrounded by healthy green vegetation. This
could be an indicator of a groundwater table that is being depressed by a point of recharge.
The Soil Profile in sinkhole active areas is typically quite variable. Often, there will be little to no
consistency in layering from boring to boring. Frequently the depth to Limestone or other stable
bearing layers may vary radically in relatively short distances. And, the clayey confining beds typically
overlaying the Limestone are often breached or non‐existent.
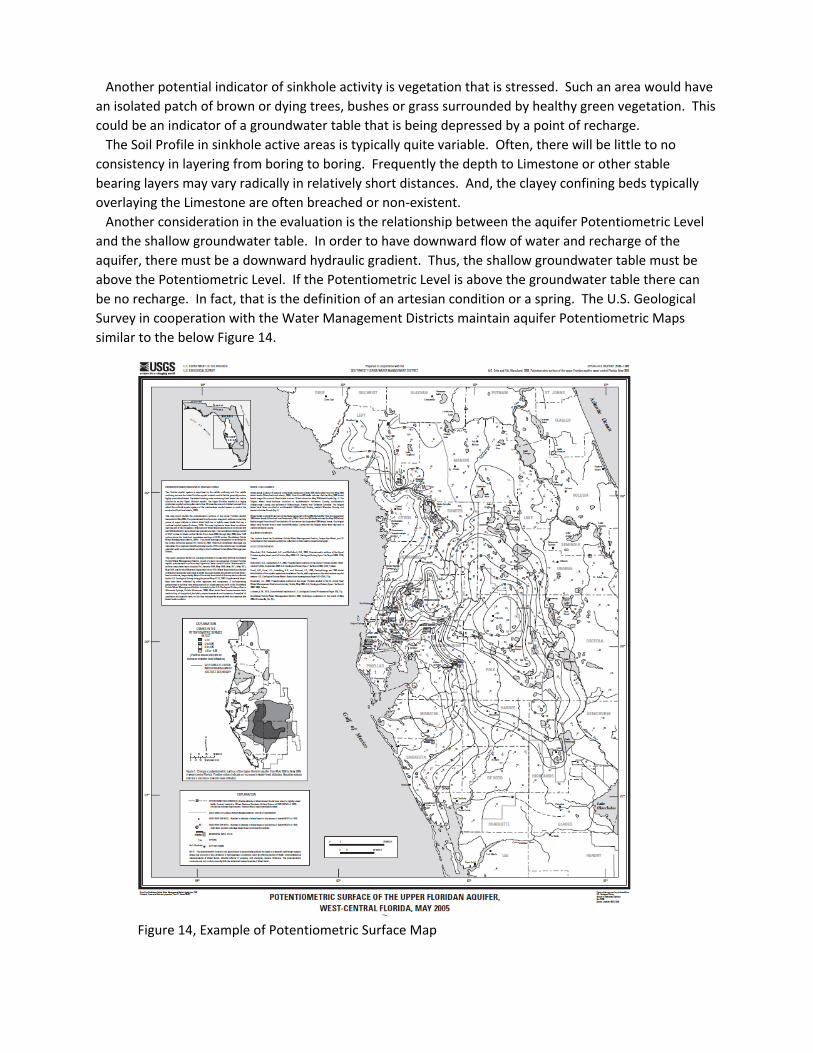
Another consideration in the evaluation is the relationship between the aquifer Potentiometric Level
and the shallow groundwater table. In order to have downward flow of water and recharge of the
aquifer, there must be a downward hydraulic gradient. Thus, the shallow groundwater table must be
above the Potentiometric Level. If the Potentiometric Level is above the groundwater table there can
be no recharge. In fact, that is the definition of an artesian condition or a spring. The U.S. Geological
Survey in cooperation with the Water Management Districts maintain aquifer Potentiometric Maps
similar to the below Figure 14.
Figure 14, Example of Potentiometric Surface Map
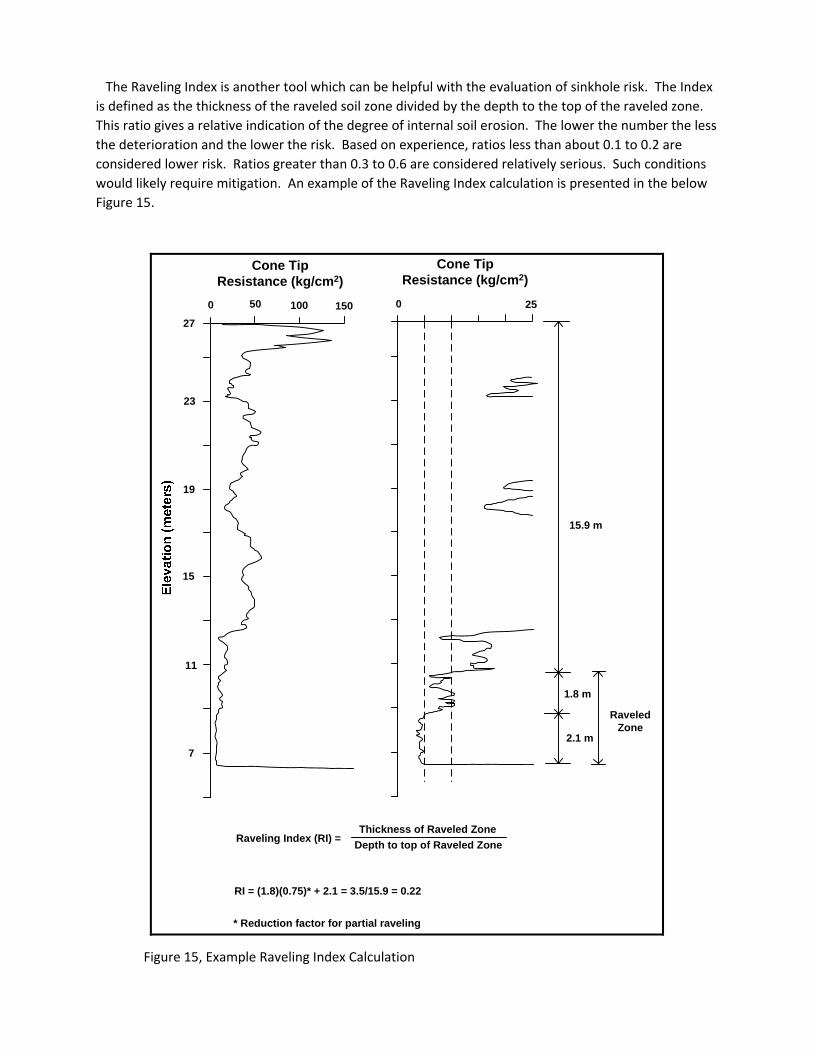
The Raveling Index is another tool which can be helpful with the evaluation of sinkhole risk. The Index
is defined as the thickness of the raveled soil zone divided by the depth to the top of the raveled zone.
This ratio gives a relative indication of the degree of internal soil erosion. The lower the number the less
the deterioration and the lower the risk. Based on experience, ratios less than about 0.1 to 0.2 are
considered lower risk. Ratios greater than 0.3 to 0.6 are considered relatively serious. Such conditions
would likely require mitigation. An example of the Raveling Index calculation is presented in the below
Figure 15.
0 10050 150
27
23
19
15
11
7
Cone TipResistance (kg/cm2)
Cone TipResistance (kg/cm2)
0 25
15.9 m
1.8 m
2.1 m
Raveled Zone
Raveling Index (RI) =Thickness of Raveled Zone
Depth to top of Raveled Zone
RI = (1.8)(0.75)* + 2.1 = 3.5/15.9 = 0.22
* Reduction factor for partial raveling
Figure 15, Example Raveling Index Calculation
Finally, the risk evaluation and degree of conservatism applied should also consider the type of
structure involved and the risk to public safety. Some structures are more susceptible to the effects of
an isolated loss of support than others. Buildings have a relatively large “footprint” and are thus better
able to withstand a small to moderate sized sinkhole without experiencing a sudden collapse. In most
cases, the failure of buildings in this situation is progressive and there is time for people to evacuate.
Conversely, structures such as highway bridges and overpasses are less able to withstand even a
moderate sized sinkhole. Bridges are special types of structures because of their public safety aspect
and their relatively isolated points of foundation support. This makes them more susceptible to sudden
failure. If a bridge pier settled suddenly without warning, people traveling at highway speeds would not
have time to react. Serious accidents and loss of life are probable. Thus, a higher level of conservatism
is justified for bridges.
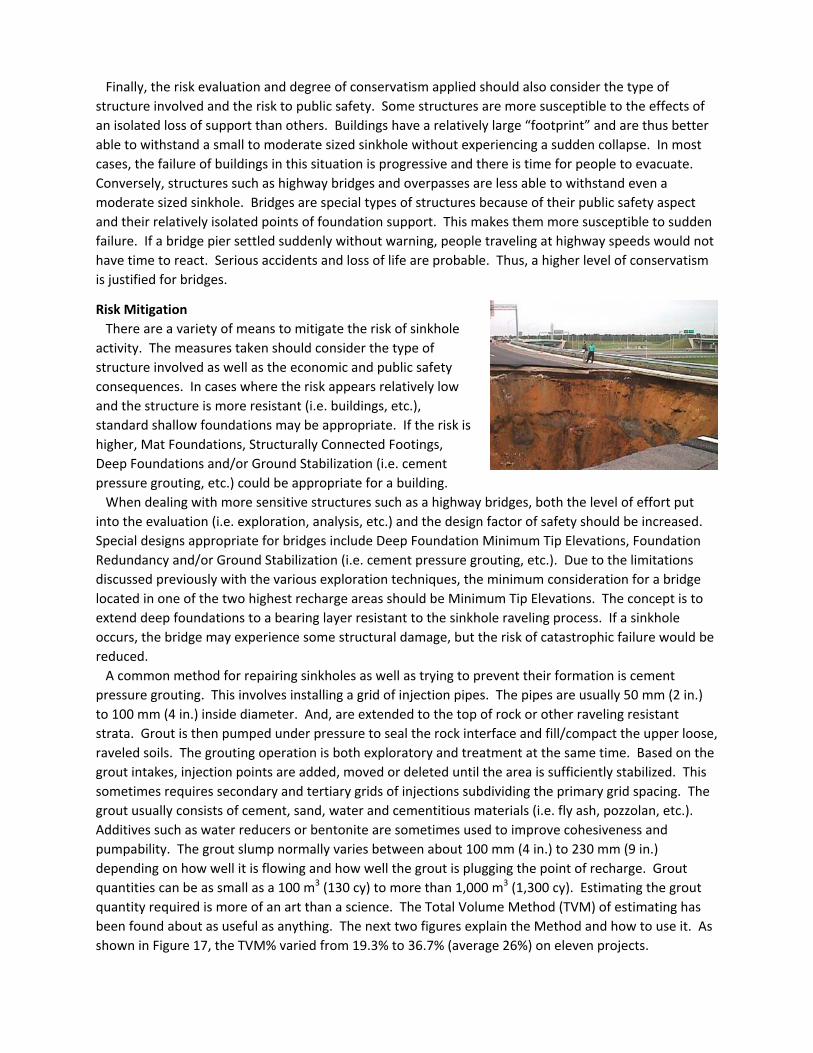
Risk Mitigation
There are a variety of means to mitigate the risk of sinkhole
activity. The measures taken should consider the type of
structure involved as well as the economic and public safety
consequences. In cases where the risk appears relatively low
and the structure is more resistant (i.e. buildings, etc.),
standard shallow foundations may be appropriate. If the risk is
higher, Mat Foundations, Structurally Connected Footings,
Deep Foundations and/or Ground Stabilization (i.e. cement
pressure grouting, etc.) could be appropriate for a building.
When dealing with more sensitive structures such as a highway bridges, both the level of effort put
into the evaluation (i.e. exploration, analysis, etc.) and the design factor of safety should be increased.
Special designs appropriate for bridges include Deep Foundation Minimum Tip Elevations, Foundation
Redundancy and/or Ground Stabilization (i.e. cement pressure grouting, etc.). Due to the limitations
discussed previously with the various exploration techniques, the minimum consideration for a bridge
located in one of the two highest recharge areas should be Minimum Tip Elevations. The concept is to
extend deep foundations to a bearing layer resistant to the sinkhole raveling process. If a sinkhole
occurs, the bridge may experience some structural damage, but the risk of catastrophic failure would be
reduced.
A common method for repairing sinkholes as well as trying to prevent their formation is cement
pressure grouting. This involves installing a grid of injection pipes. The pipes are usually 50 mm (2 in.)
to 100 mm (4 in.) inside diameter. And, are extended to the top of rock or other raveling resistant
strata. Grout is then pumped under pressure to seal the rock interface and fill/compact the upper loose,
raveled soils. The grouting operation is both exploratory and treatment at the same time. Based on the
grout intakes, injection points are added, moved or deleted until the area is sufficiently stabilized. This
sometimes requires secondary and tertiary grids of injections subdividing the primary grid spacing. The
grout usually consists of cement, sand, water and cementitious materials (i.e. fly ash, pozzolan, etc.).
Additives such as water reducers or bentonite are sometimes used to improve cohesiveness and
pumpability. The grout slump normally varies between about 100 mm (4 in.) to 230 mm (9 in.)
depending on how well it is flowing and how well the grout is plugging the point of recharge. Grout
quantities can be as small as a 100 m3 (130 cy) to more than 1,000 m3 (1,300 cy). Estimating the grout
quantity required is more of an art than a science. The Total Volume Method (TVM) of estimating has
been found about as useful as anything. The next two figures explain the Method and how to use it. As
shown in Figure 17, the TVM% varied from 19.3% to 36.7% (average 26%) on eleven projects.
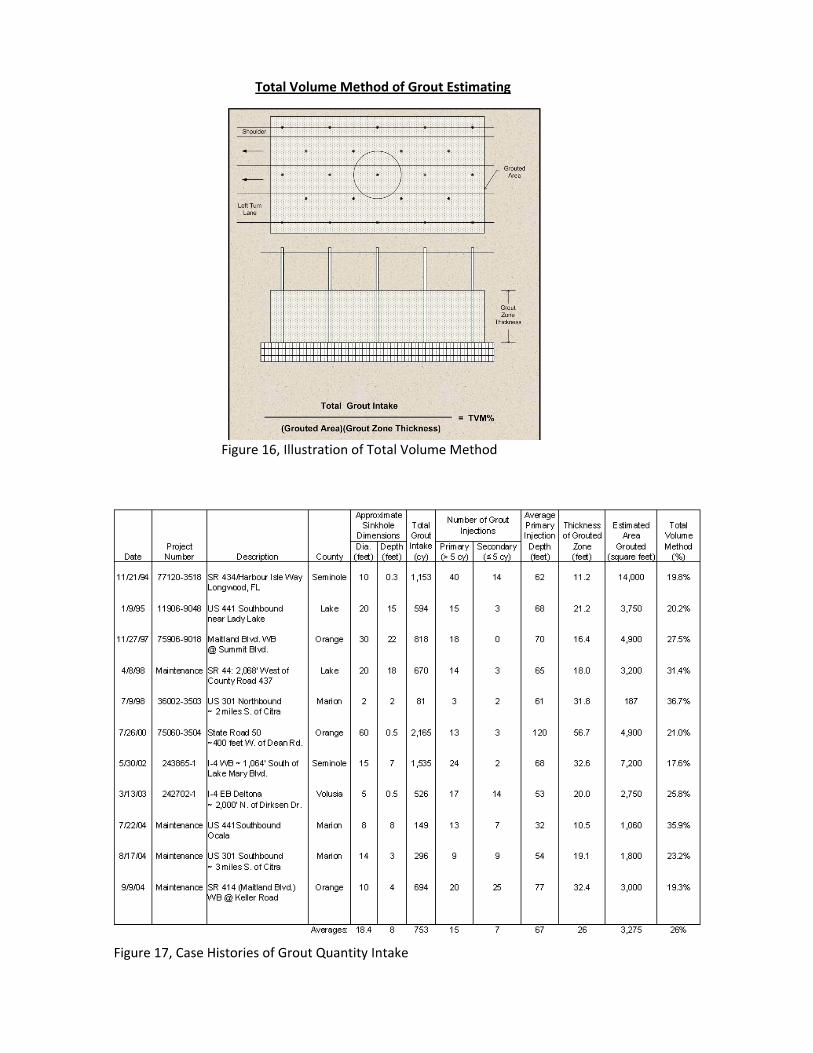
Total Volume Method of Grout Estimating
Figure 16, Illustration of Total Volume Method
Figure 17, Case Histories of Grout Quantity Intake
Conclusions
The following key points can be discerned from the available information on sinkholes:
1. Sinkhole distribution in Florida is not random.
2. There is a good relationship between sinkhole activity and groundwater recharge.
3. Cover‐subsidence and Cover‐collapse seem to be the predominant mechanisms.
4. Many sinkholes seem to develop as relatively narrow, vertically oriented anomalies.
5. Standard borings and soundings are not good at detecting developing sinkholes.
6. Geophysical Testing methods are not reliable enough yet in all ground conditions.
7. Pore‐water pressure sensor arrays may have the ability to locate developing sinkholes.
8. Many factors must be considered to evaluate sinkhole risk.
9. The Raveling Index can indicate the degree of internal soil erosion and degree of risk.
10. Bridge foundations require special consideration and a higher factor of safety.
11. Minimum pile tip elevations are a prudent, cost effective way to mitigate bridge foundation risk.
12. Cement pressure grouting can be used to stabilize and prevent future sinkhole activity.
13. The Total Volume Method is useful for estimating the grout quantity required for stabilization.
Acknowledgments
It is impossible to acknowledge all the engineers who have made this paper possible. Many
generously shared their knowledge and experiences over the years. I hesitate to mention anyone in
particular since I will surely offend someone. However, a few do deserve recognition. First, I want to
thank the late S.E. “Jim” Jammal, P.E. for his guidance and mentoring over the years. He taught me
most of what I know about sinkholes. I also want to thank Michael D. Sims, P.E. for sharing the Raveling
Index concept with me. And finally, Mr. Jay Casper, P.E. for his contributions and insightful review of
this document.
References 1. Rupert, F. & Spencer, S (2004), Florida’s Sinkholes, Poster 11, Florida Geological Survey, Florida
Department of Environmental Protection, Tallahassee, Florida.
2. Stewart, J. W. (1980), Areas of Natural Recharge to the Floridan Aquifer in Florida, Map Series 98,
Bureau of Geology, Florida Department of Natural Resources, Tallahassee, Florida.
3. Tihansky, A. B., (1999), Sinkholes, West‐Central Florida, in Galloway, Devin, Jones, D. R. Ingebritsen,
S.E., eds., Land subsidence in the United States: U.S. Geological Survey Circular 1182, p. 121‐140.
4. Jammal, S. E. (1982), The Winter Park Sinkhole, A Report to the City of Winter Park, Florida, Jammal &
Associates, Inc. Consulting Geotechnical Engineers, Winter Park, Florida.
5. White, W. B. (1988), Geomorphology and Hydrology of Karst Terrains, Oxford University Press, New
York, NY.
6. Foshee, J. R. & Bixler, B. (1994), Cover‐Subsidence Sinkhole Evaluation of State Road 434, Longwood,
Florida, ASCE Journal of Geotechnical Engineering, Vol. 120, No. 11, November, 1994, Paper No.
6291.