Embed Size (px)
Citation preview
Geothermal Energy (Week 9, 28 Oct)- Reservoir Geomechanics
민기복민기복
Ki-Bok Min PhDKi Bok Min, PhD서울대학교에너지자원공학과조교수Assistant Professor, Energy Resources Engineering, gy g g
Question
• Shear sliding• Tangential stress• Tangential stress• How do we measure in situ stress?

Term PaperP i R tProgressive Report
– Submission by 24:00 30 Oct (through email)– Late submission by 24:00 1 Nov (20% penalty)y ( p y)– Please use MS Word for writing report (due to track change
function))– Meeting with me (after class on 28 Oct)
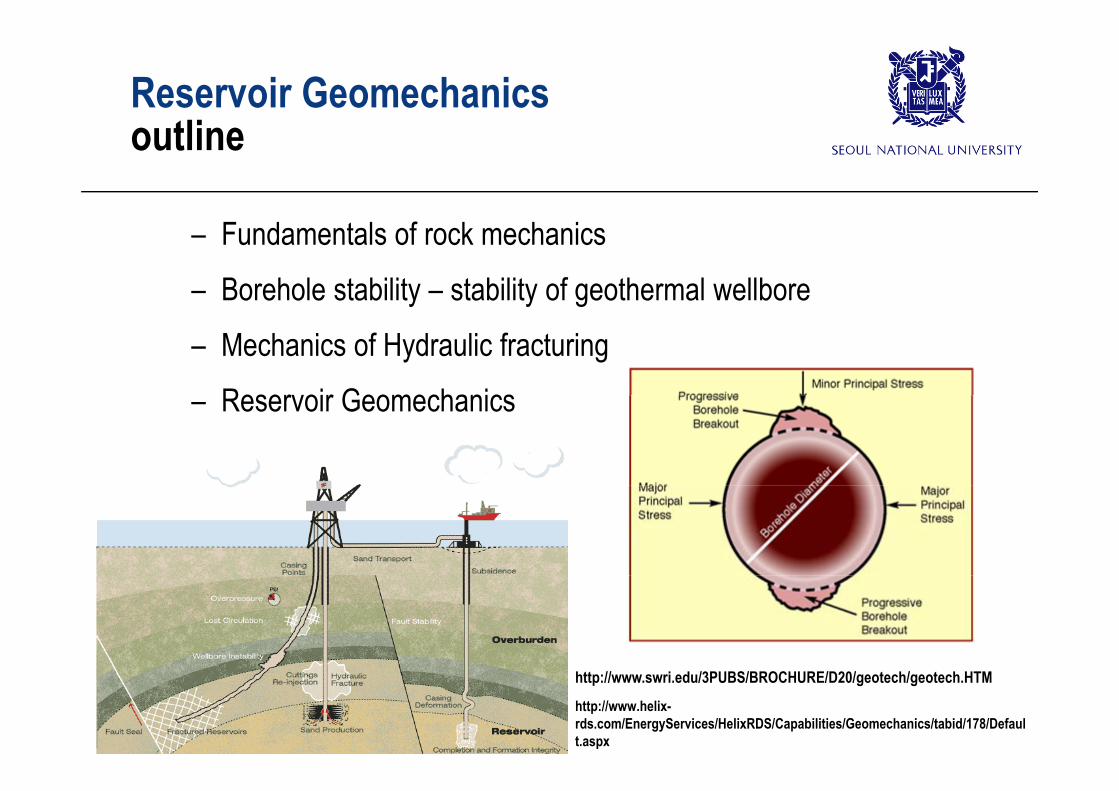
Reservoir Geomechanicstlioutline
– Fundamentals of rock mechanics– Borehole stability – stability of geothermal wellborey y g– Mechanics of Hydraulic fracturing
Reservoir Geomechanics – Reservoir Geomechanics
http://www.helix-rds.com/EnergyServices/HelixRDS/Capabilities/Geomechanics/tabid/178/Default.aspx
http://www.swri.edu/3PUBS/BROCHURE/D20/geotech/geotech.HTM
Monday
• Borehole Stability (continued)– Mohr-Coulomb Failure CriteriaMohr Coulomb Failure Criteria
• Hydraulic Fracturing– Direction of fracturing– Condition for fracture initiation/propagationp p g
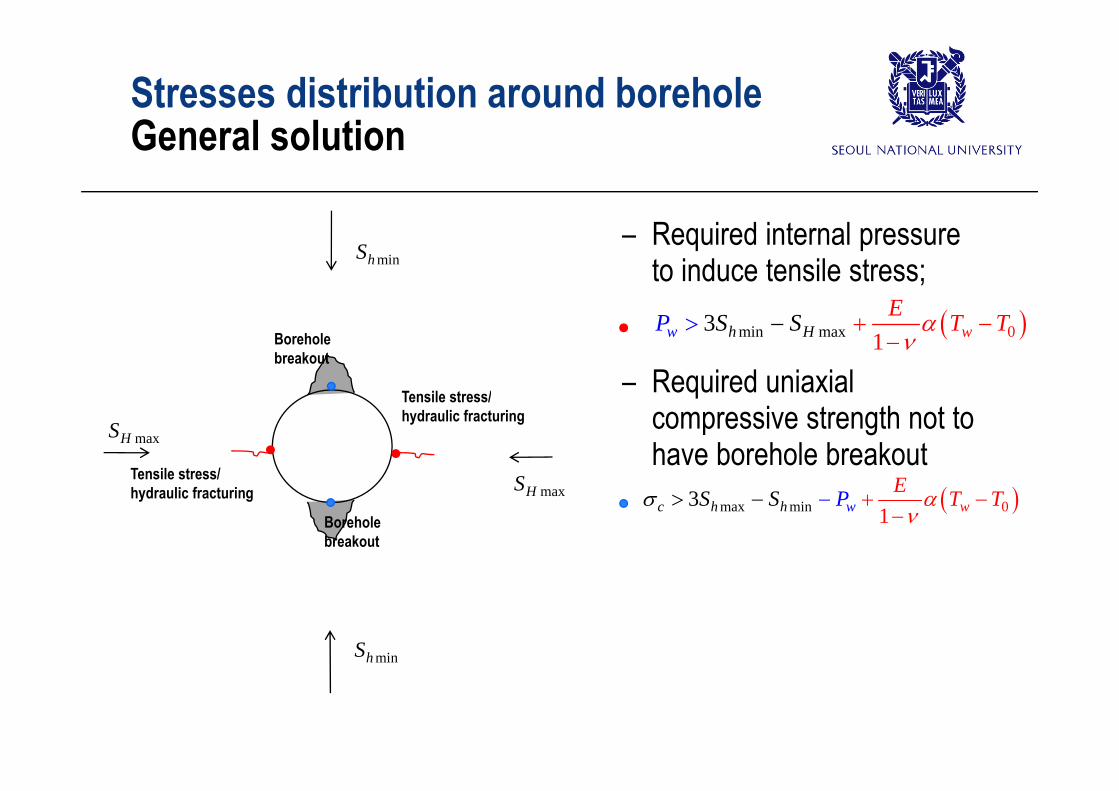
Stresses distribution around boreholeG l l tiGeneral solution
– Required internal pressure to induce tensile stress;
E
minhS
– Required uniaxial
min max 013 wh HwP TS E TS
Tensile stress/
Borehole breakout
qcompressive strength not to have borehole breakout
ES
maxHSTensile stress/hydraulic fracturing
Tensile stress/
max min 013 wh h wc
E TPS TS
maxHS
Borehole breakout
hydraulic fracturing
minhS
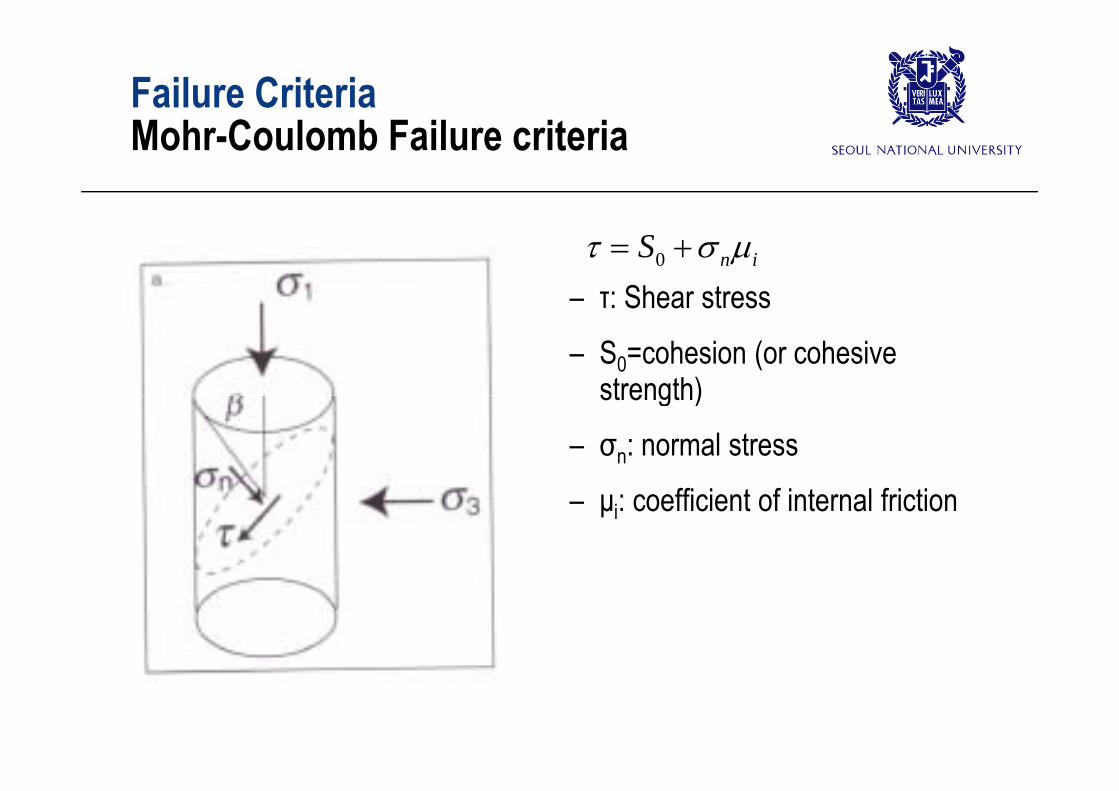
Failure CriteriaM h C l b F il it iMohr-Coulomb Failure criteria
– τ: Shear stress0 n iS
τ: Shear stress– S0=cohesion (or cohesive
strength)strength)– σn: normal stress– μi: coefficient of internal friction
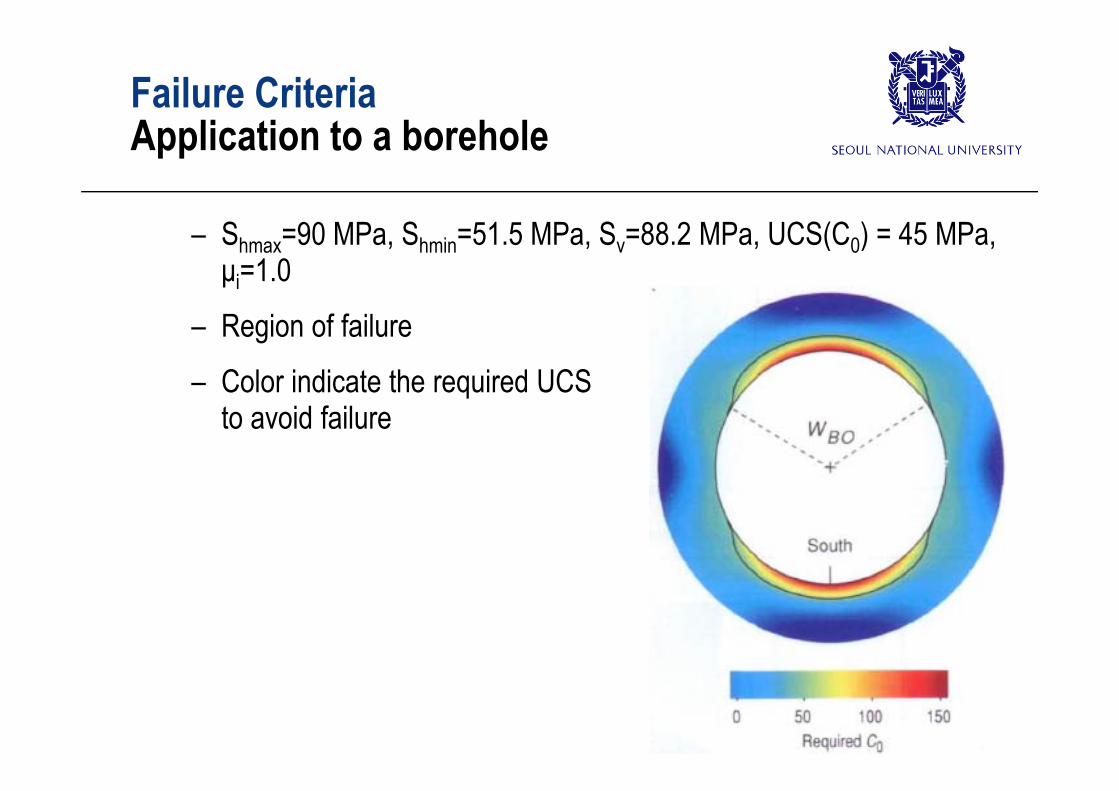
Failure CriteriaA li ti t b h lApplication to a borehole
– Shmax=90 MPa, Shmin=51.5 MPa, Sv=88.2 MPa, UCS(C0) = 45 MPa, μi=1.0
– Region of failure– Color indicate the required UCS q
to avoid failure
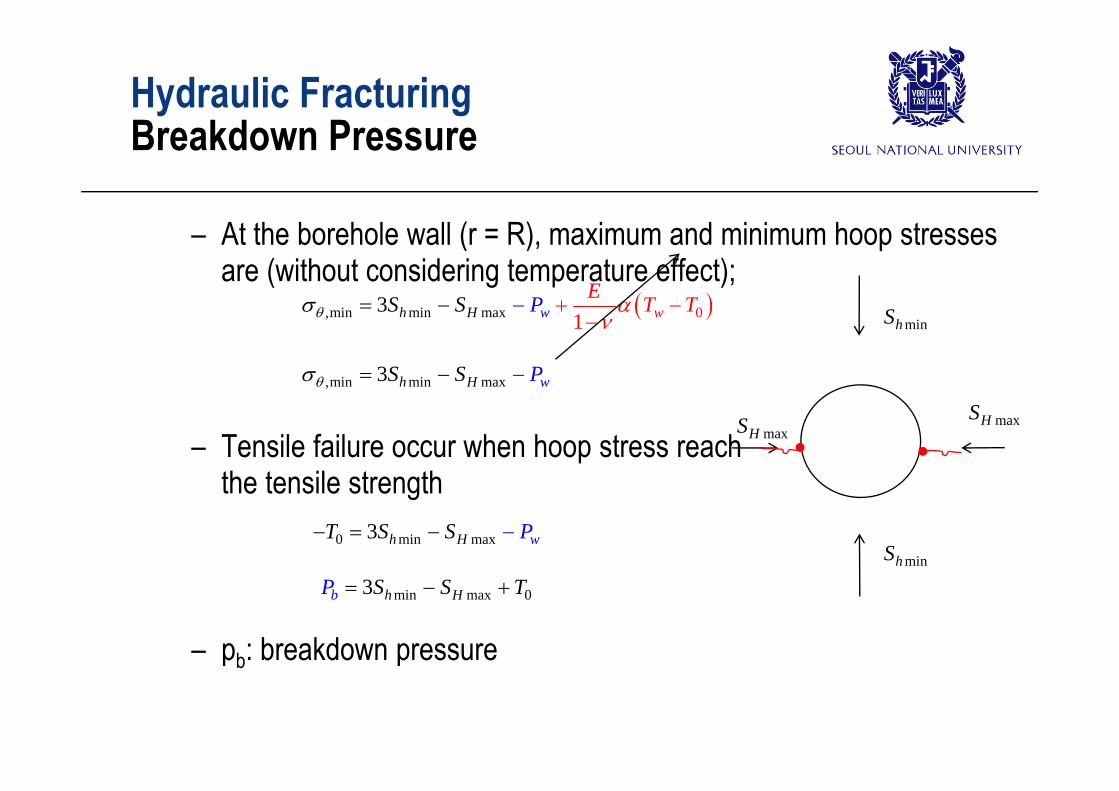
Hydraulic FracturingB kd PBreakdown Pressure
– At the borehole wall (r = R), maximum and minimum hoop stresses are (without considering temperature effect);
3 P E TS S T ,min min m 0ax 13 wwh H P TS S T
,min min max3 wh HS S P
minhS
– Tensile failure occur when hoop stress reachthe tensile strength
maxHSmaxHS
the tensile strength
minhS0 min max3 h H wT S S P
– pb: breakdown pressure
min max 03 h HbP S S T
pb p
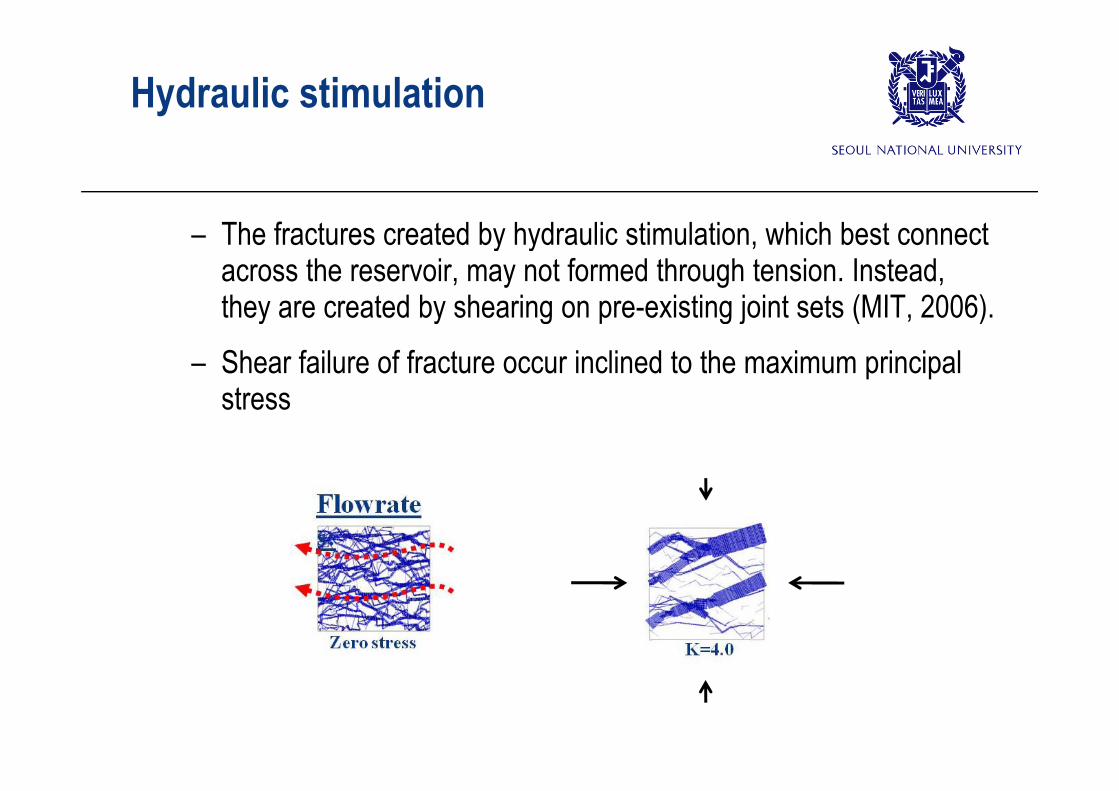
Hydraulic stimulation
– The fractures created by hydraulic stimulation, which best connect across the reservoir, may not formed through tension. Instead, they are created by shearing on pre existing joint sets (MIT 2006)they are created by shearing on pre-existing joint sets (MIT, 2006).
– Shear failure of fracture occur inclined to the maximum principal stressstress
Effective Stress
• Pore Pressure
Effective Stress
• Principal assumptions:– Interconnected pore system uniformly saturated with fluidInterconnected pore system uniformly saturated with fluid– Total volume of pore system is small compared to the volume of
the rock as a wholethe rock as a whole– We consider;
P i th Pressure in the pores
The total stress acting on the rock externaly
Th i i di id l i (i f i i ll d The stresses acting on individual grains (in terms of statistically averaged uniform values)
Effective Stress
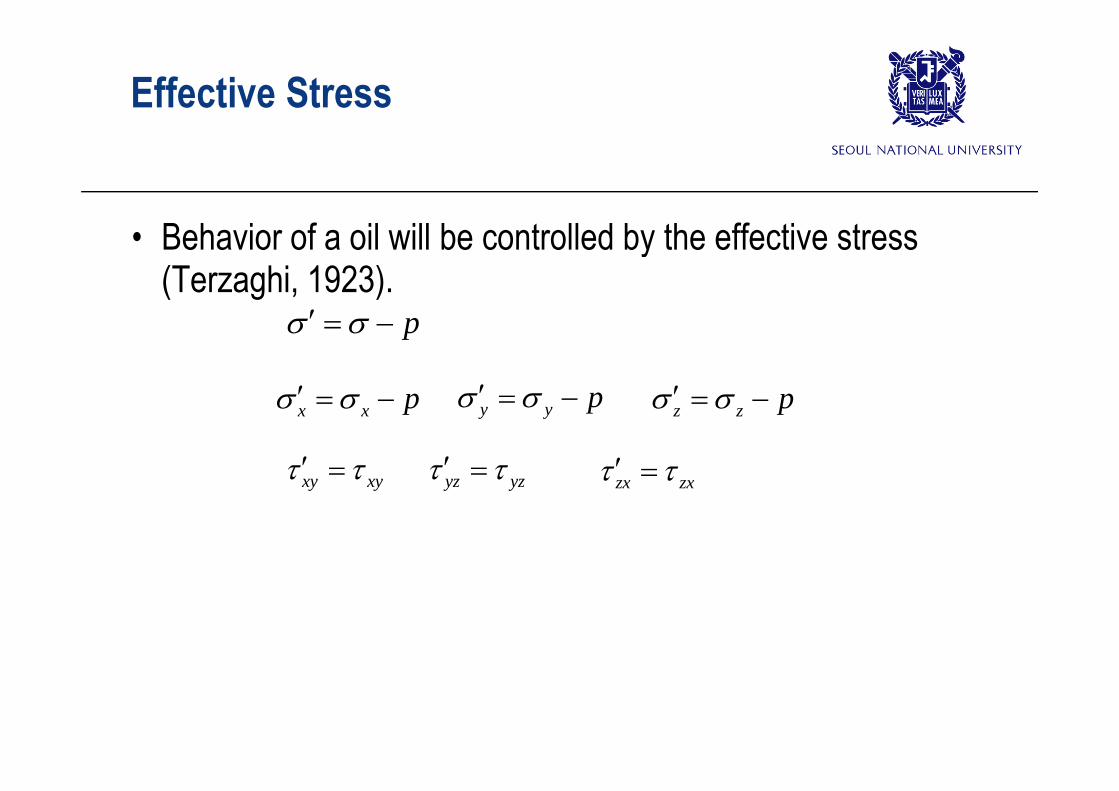
• Behavior of a oil will be controlled by the effective stress (Terzaghi, 1923).
p
p p p x x p y y p z z p
xy xy yz yz zx zx xy xy yz yz zx zx
Effective Stress
TFA
AT
TA
σ
AT
FFσc
AcPp
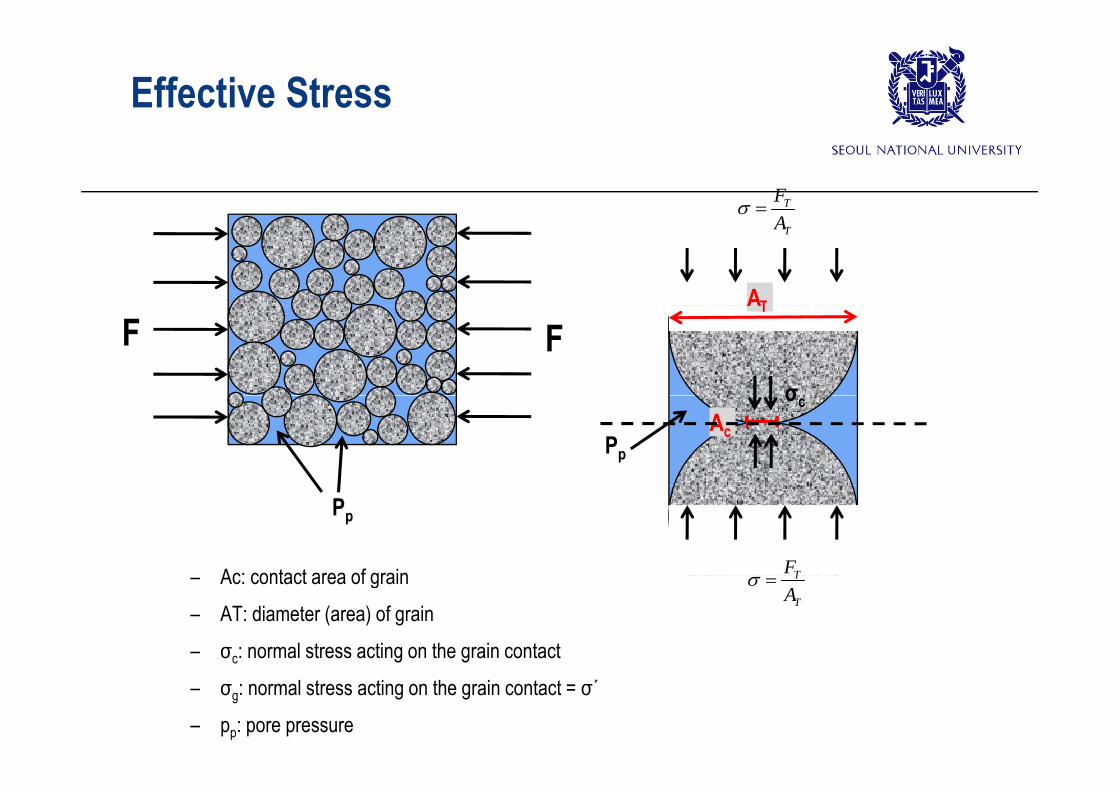
Ac: contact area of grain
Pp
TF– Ac: contact area of grain– AT: diameter (area) of grain– σc: normal stress acting on the grain contact
T
TA
– σg: normal stress acting on the grain contact = σ´– pp: pore pressure
Effective Stress
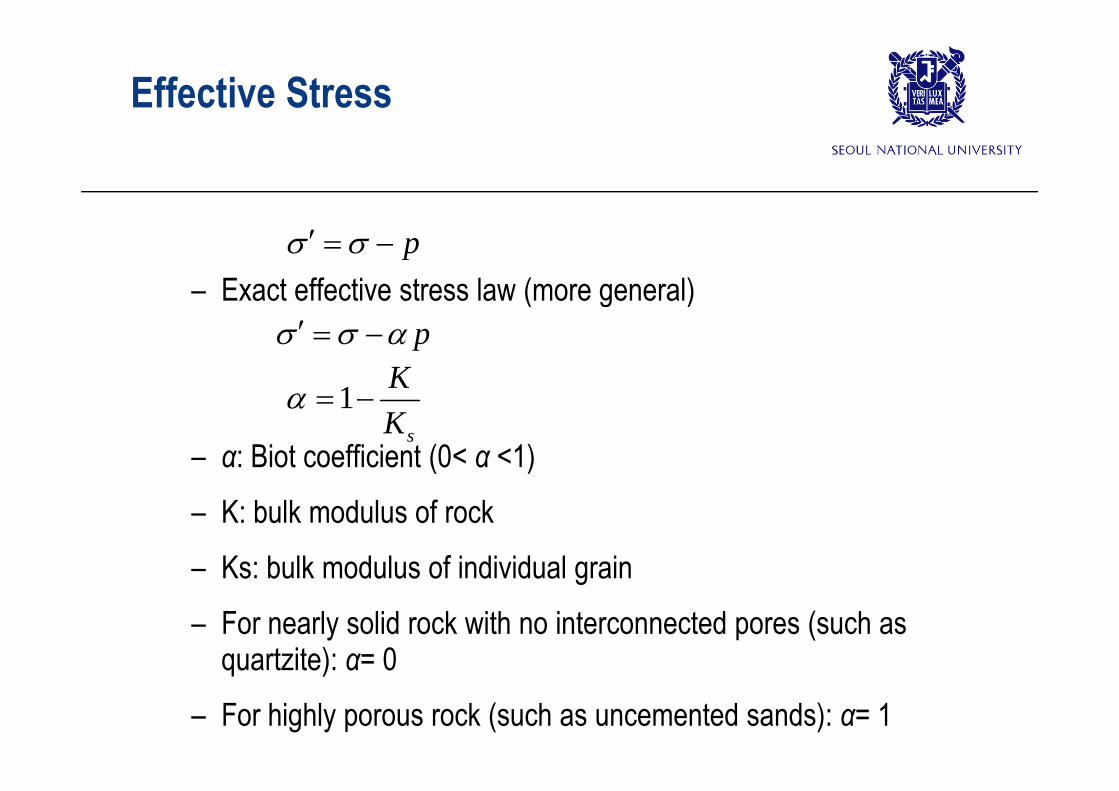
– Exact effective stress law (more general)p
( g )p
1 K
– α: Biot coefficient (0< α <1)
1sK
– K: bulk modulus of rock – Ks: bulk modulus of individual grainKs: bulk modulus of individual grain– For nearly solid rock with no interconnected pores (such as
quartzite): α= 0 quartzite): α 0 – For highly porous rock (such as uncemented sands): α= 1
Effective Stress
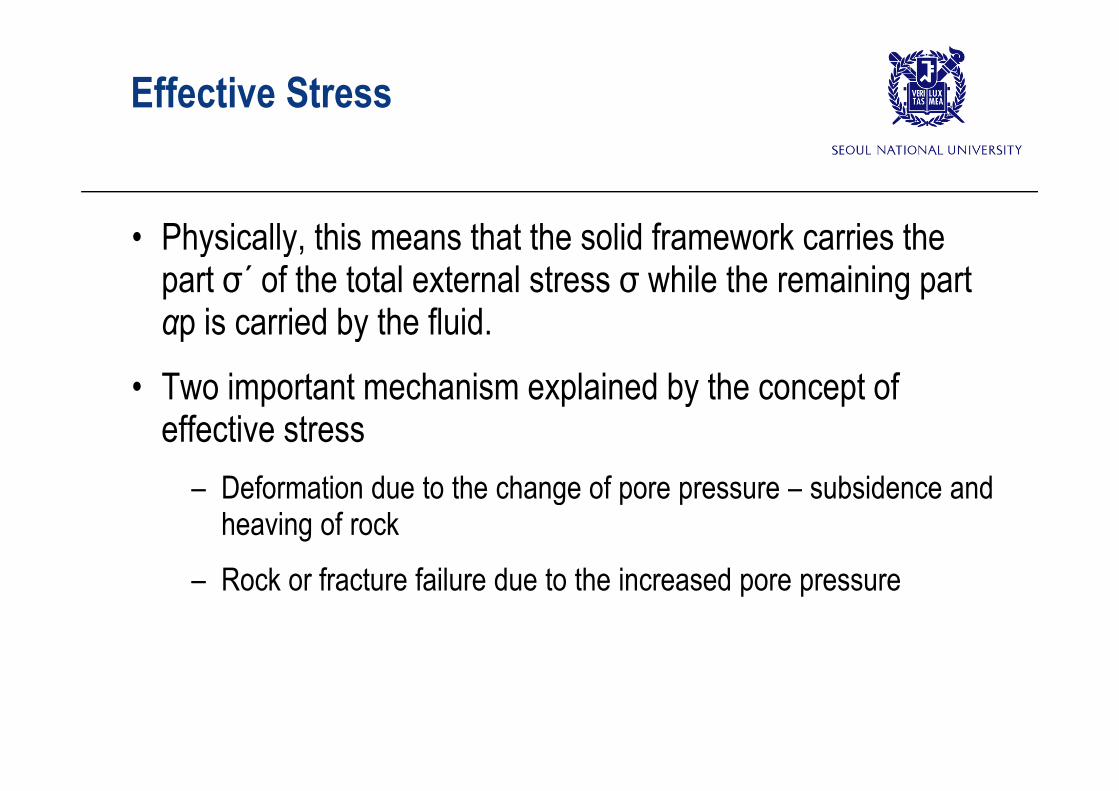
• Physically, this means that the solid framework carries the part σ´ of the total external stress σ while the remaining part αp is carried by the fluid.
• Two important mechanism explained by the concept of Two important mechanism explained by the concept of effective stress
Deformation due to the change of pore pressure subsidence and – Deformation due to the change of pore pressure – subsidence and heaving of rockRock or fracture failure due to the increased pore pressure– Rock or fracture failure due to the increased pore pressure
Effective stressd f ti b ff ti tdeformation by effective stress
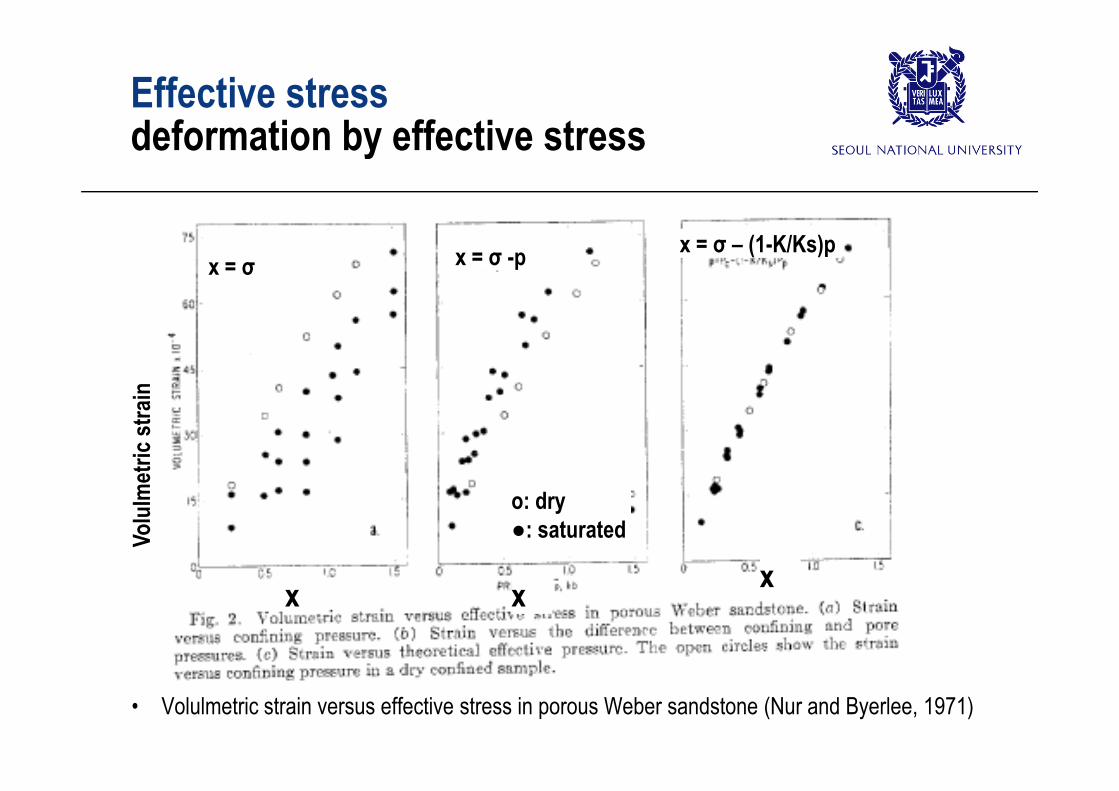
x = σ x = σ -p x = σ – (1-K/Ks)p
nm
etric
stra
i
x
Volu
lm o: dry●: saturated
xx x
• Volulmetric strain versus effective stress in porous Weber sandstone (Nur and Byerlee, 1971)
Effective stressf il i d d b ifailure induced by pore pressure increase
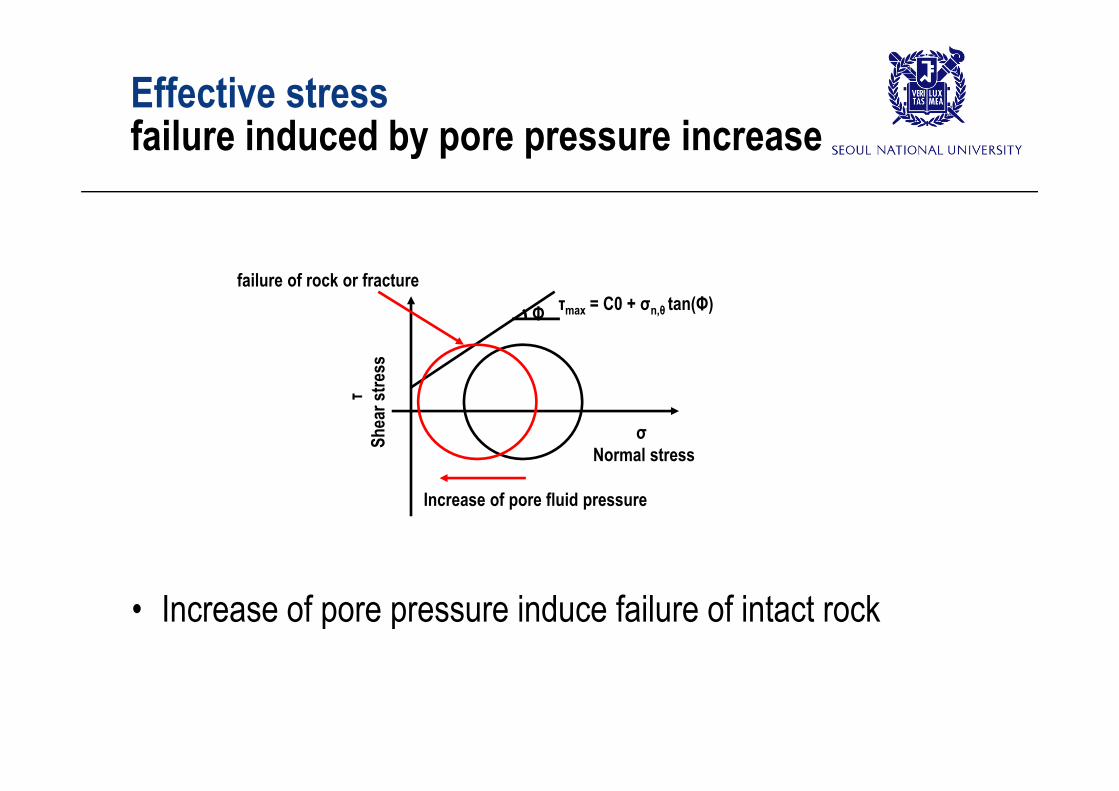
τ = C0 + σ θ tan(Φ)failure of rock or fracture
τmax = C0 + σn,θ tan(Φ)Φ
τ stre
ss
σNormal stress
τSh
ear s
Increase of pore fluid pressure
• Increase of pore pressure induce failure of intact rock
Effective stressfail re ind ced b pore press re increasefailure induced by pore pressure increase
y
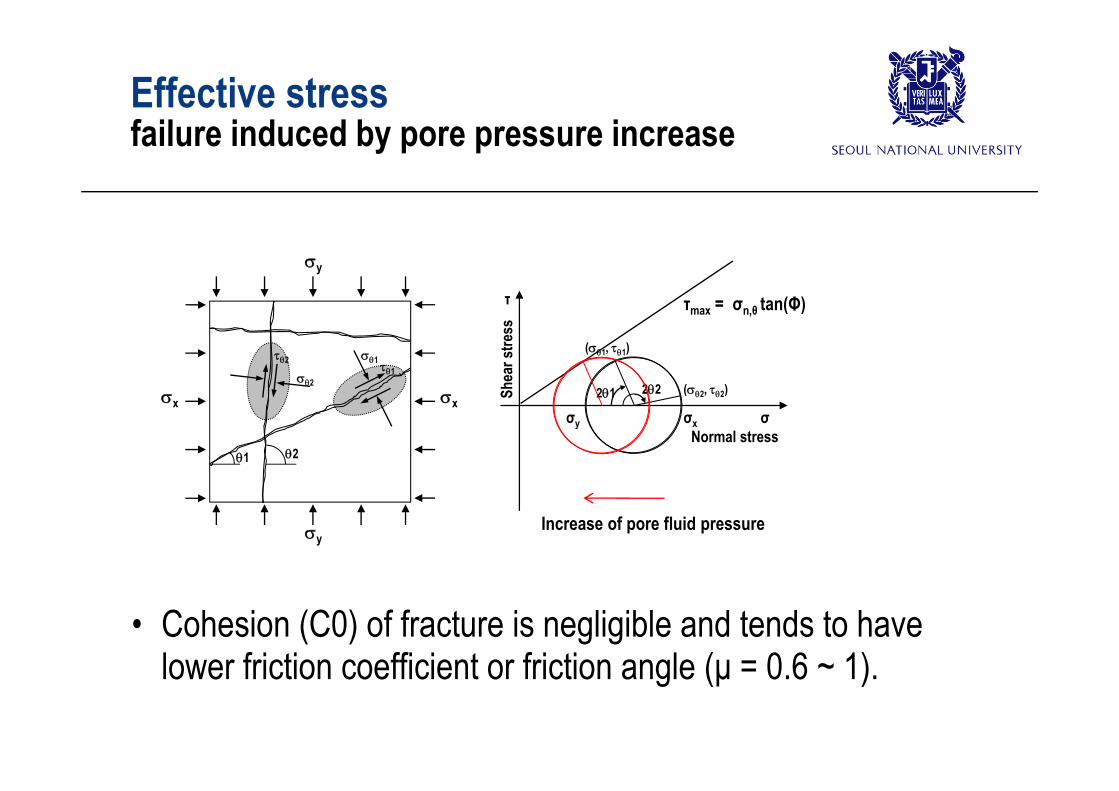
τ τ = σ θ tan(Φ)
1 12
2
(1, 1)
(2, 2)21 22Shea
r stre
ss
τmax = σn,θ tan(Φ)
x xσ
Normal stressσxσy
( 2, 2)
1 2
21Sy
Increase of pore fluid pressure
• Cohesion (C0) of fracture is negligible and tends to have lower friction coefficient or friction angle (μ = 0 6 ~ 1)lower friction coefficient or friction angle (μ = 0.6 ~ 1).
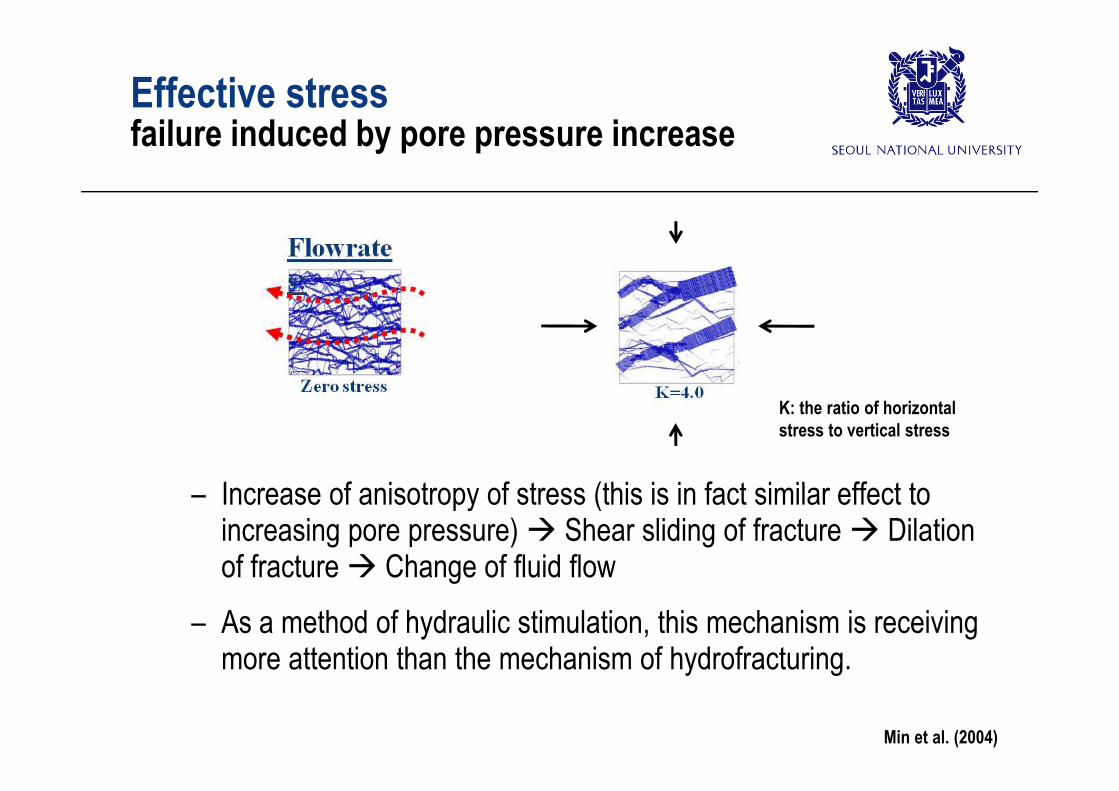
Effective stressfail re ind ced b pore press re increasefailure induced by pore pressure increase
I f i t f t (thi i i f t i il ff t t
K: the ratio of horizontal stress to vertical stress
– Increase of anisotropy of stress (this is in fact similar effect to increasing pore pressure) Shear sliding of fracture Dilation of fracture Change of fluid flowof fracture Change of fluid flow
– As a method of hydraulic stimulation, this mechanism is receiving more attention than the mechanism of hydrofracturingmore attention than the mechanism of hydrofracturing.
Min et al. (2004)
Reservoir Compaction and Subsidence
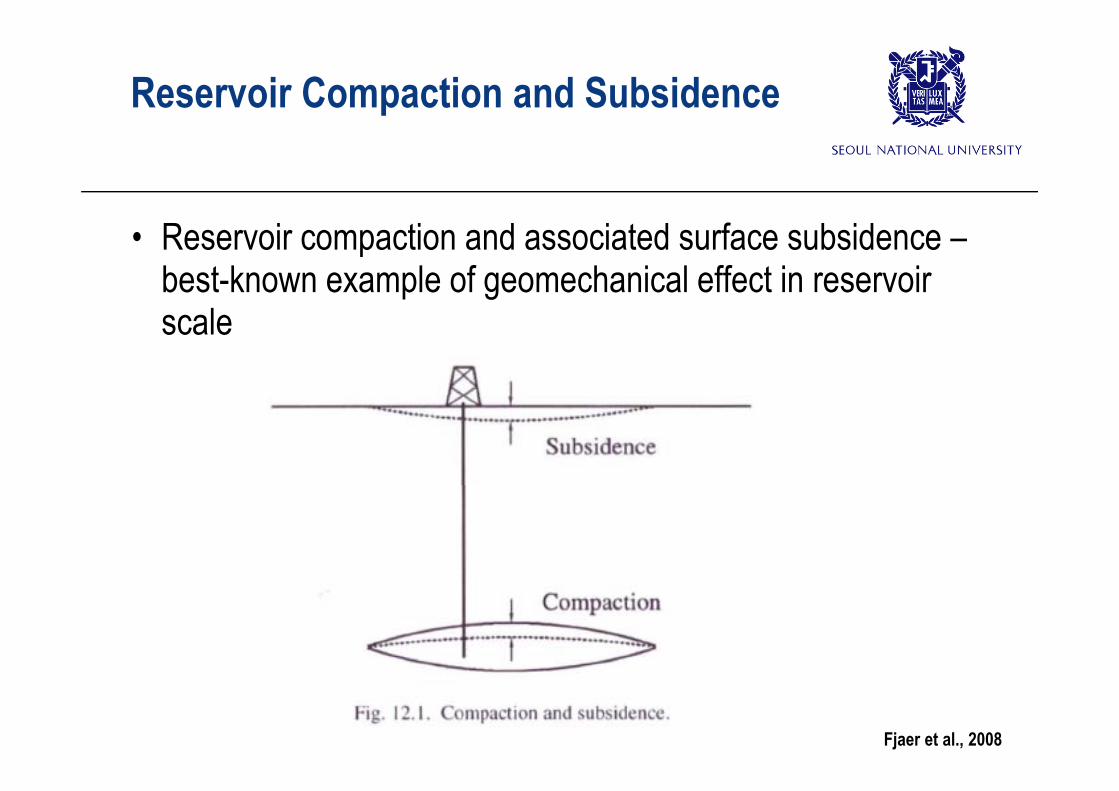
• Reservoir compaction and associated surface subsidence –best-known example of geomechanical effect in reservoir scale
Fjaer et al., 2008
Reservoir Compaction and Subsidence
• Reservoir geomechanics is an important part of (geothermal) reservoir management.
• Geothermal fluid is extraction (or oil/gas is produced) from a reservoir fluid pressure will decline increase the reservoir fluid pressure will decline increase the effective stress the reservoir will compact (shrink) subsidence at the surface.
• Change of effective stress can also affect the fluid flow performance (via change of permeability/ porosity)performance (via change of permeability/ porosity)
• Stress change triggers seismicity during reservoir depletion
Reservoir Compaction and Subsidence
• Most reservoir will experience a small degree of compaction. • For a considerable degree of subsidence;• For a considerable degree of subsidence;
– Reservoir pressure drop must be significant (pressure maintenance such as injection may counteract compaction)maintenance such as injection may counteract compaction)
– The reservoir must be highly compressible More important in soft rocksoft rock.
– The reservoir must have a considerable thickness– No shielding by the overburden rock
• Wilmington field in California: 9 m subsidence (Fjaer 2008)• Wilmington field in California: 9 m subsidence (Fjaer, 2008)
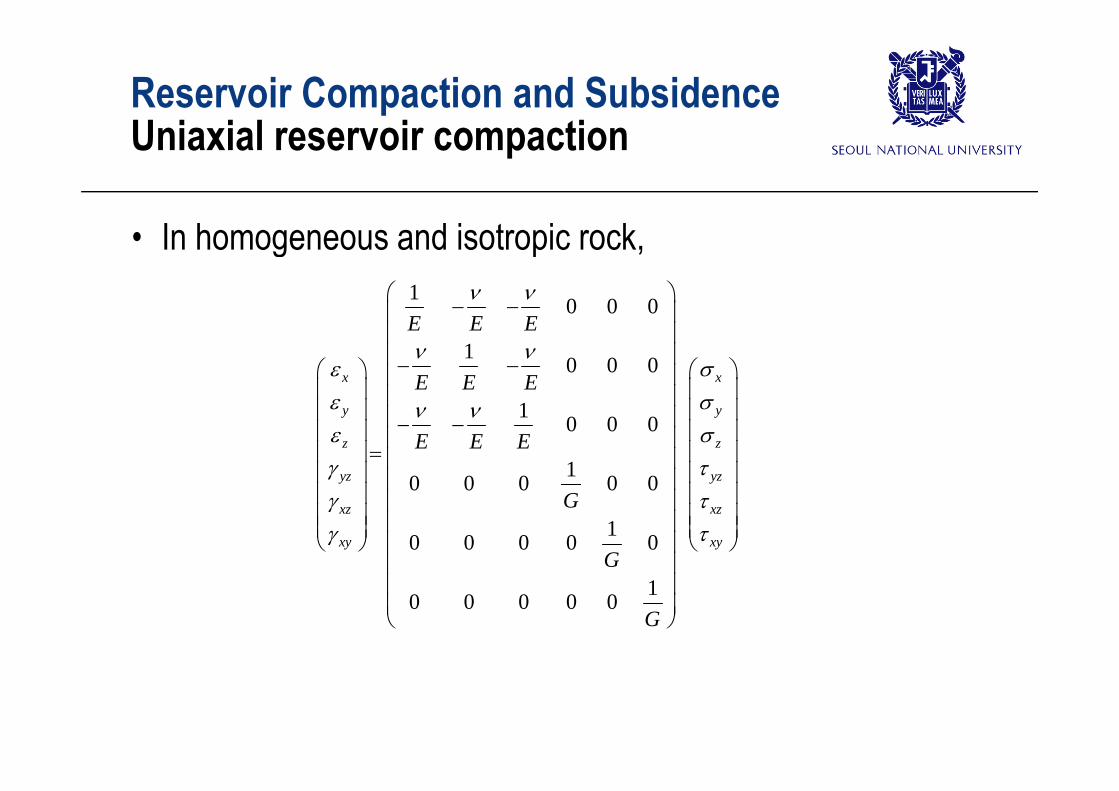
Reservoir Compaction and SubsidenceU i i l i tiUniaxial reservoir compaction
• In homogeneous and isotropic rock,1 0 0 0
0 0 0
1 0 0 0x x
E E E
E E E
1 0 0 0
10 0 0 0 0
y y
z z
yz yz
E E E
0 0 0 0 0
10 0 0 0 0xz xz
xy xy
G
G
10 0 0 0 0
G
Reservoir Compaction and SubsidenceU i i l i tiUniaxial reservoir compaction
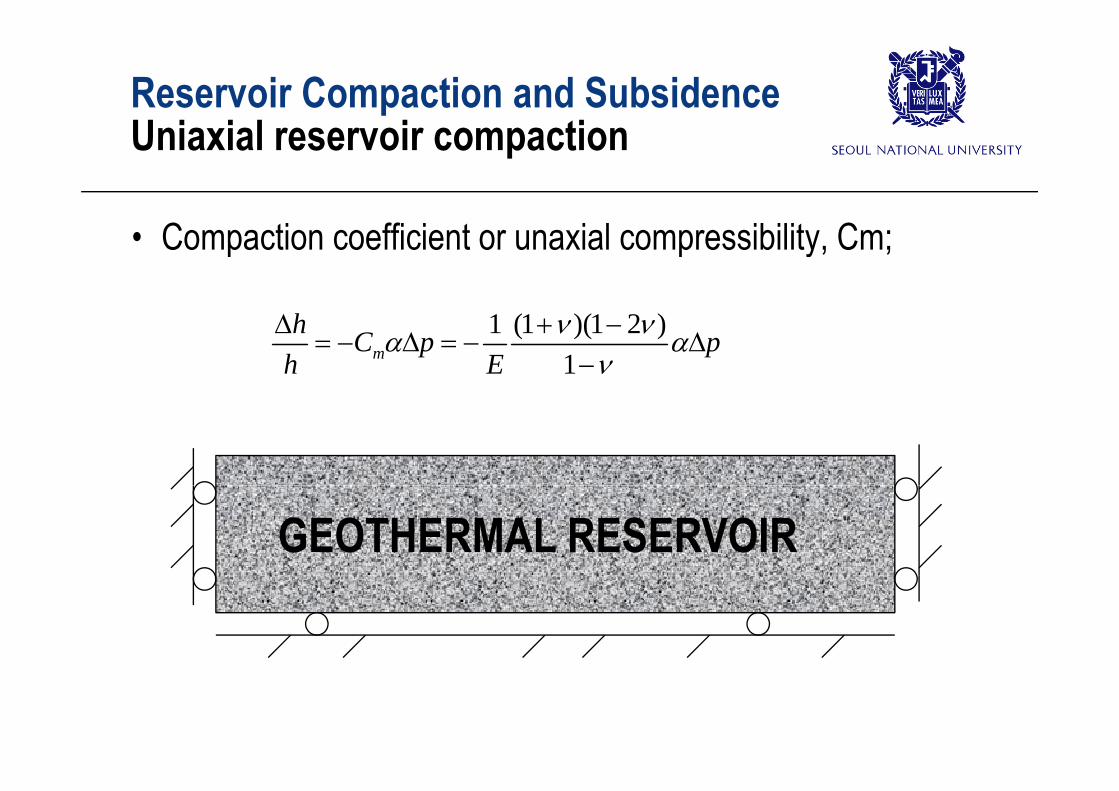
• Compaction coefficient or unaxial compressibility, Cm;
1 (1 )(1 2 )1m
h C p ph E
GEOTHERMAL RESERVOIR
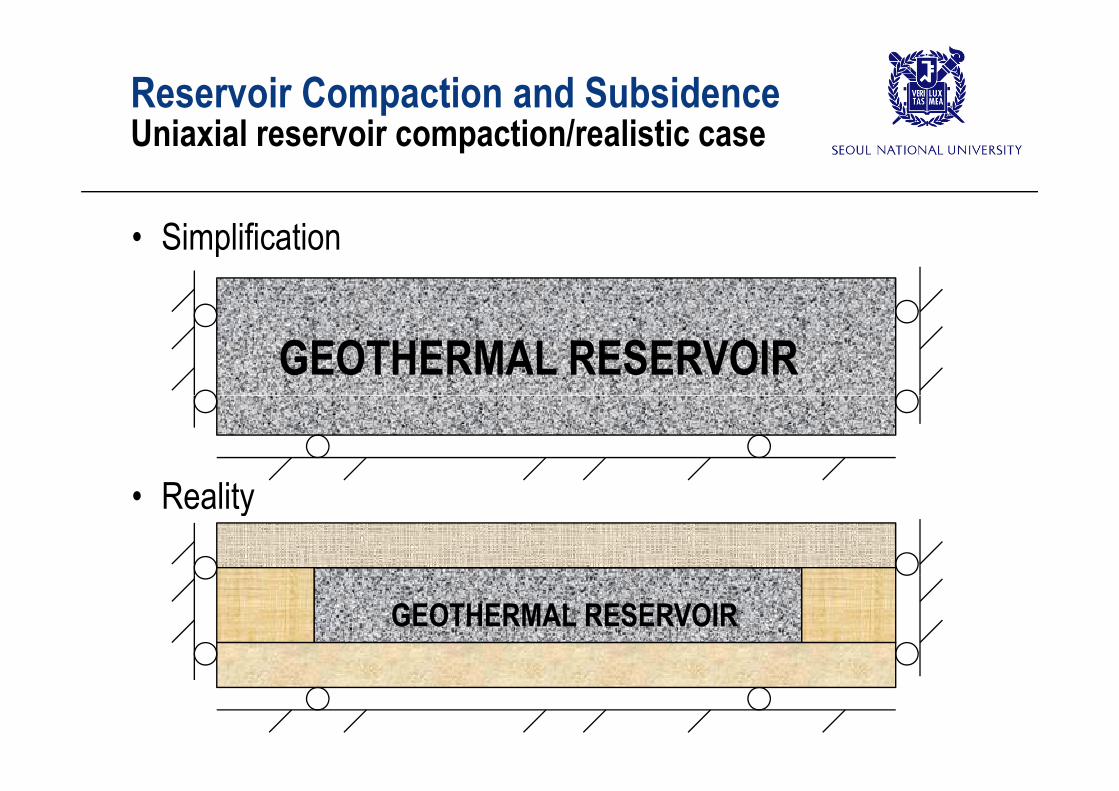
Reservoir Compaction and SubsidenceUnia ial reser oir compaction/realistic caseUniaxial reservoir compaction/realistic case
• Simplification
GEOTHERMAL RESERVOIR
R lit• Reality
GEOTHERMAL RESERVOIR
Reservoir Compaction and SubsidenceU i i l i ti / li ti Uniaxial reservoir compaction/realistic case
• Normally we don’t have uniform distribution of;– Pressure/mechanical propertiesPressure/mechanical properties– And the reservoir geometry is complex
• We would need more sophisticated model, which usually is numerical simulation.
Reservoir GeomechanicsAn e ample from Ge sers Field in CaliforniaAn example from Geysers Field in California
A study on Geysers Geothermal Steam Field, y y ,California, USAWith the courtesy of Dr Jonny Rutqvist,With the courtesy of Dr Jonny Rutqvist, Lawrence Berkeley National Laboratory, USA
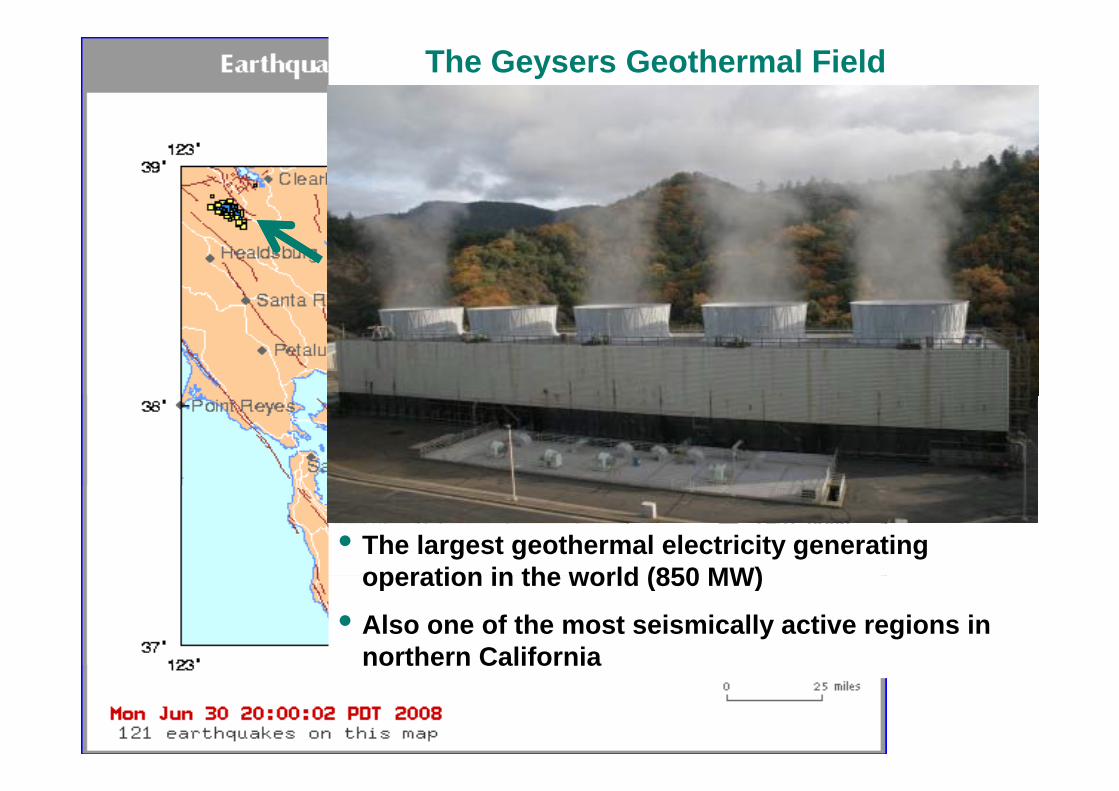
The Geysers Geothermal Field
• The largest geothermal electricity generating operation in the world (850 MW)operation in the world (850 MW)
• Also one of the most seismically active regions in northern Californianorthern California
The Geysers Geothermal Field
• A vapor dominated geothermal reservoir system, which is hydraulically confined by low permeability rock units
• High rate of steam withdrawal resulted in reservoir pressure• High rate of steam withdrawal resulted in reservoir pressure decline until the mid 1990s, when increasing water injection stabilized the steam reservoir pressure
• If The Geysers were produced without simultaneously injecting water, reservoir pressures and flow rates from production wells would decline fairly rapidlyproduction wells would decline fairly rapidly
• However, the water injection has also resulted in an increased level of seismicity at The Geysers, which has y y ,raised concerns in the local communities
• For public acceptance, a good understanding of the causes d h i f i d d i i i i Th G iand mechanisms of induced seisimicity at The Geysers is
important
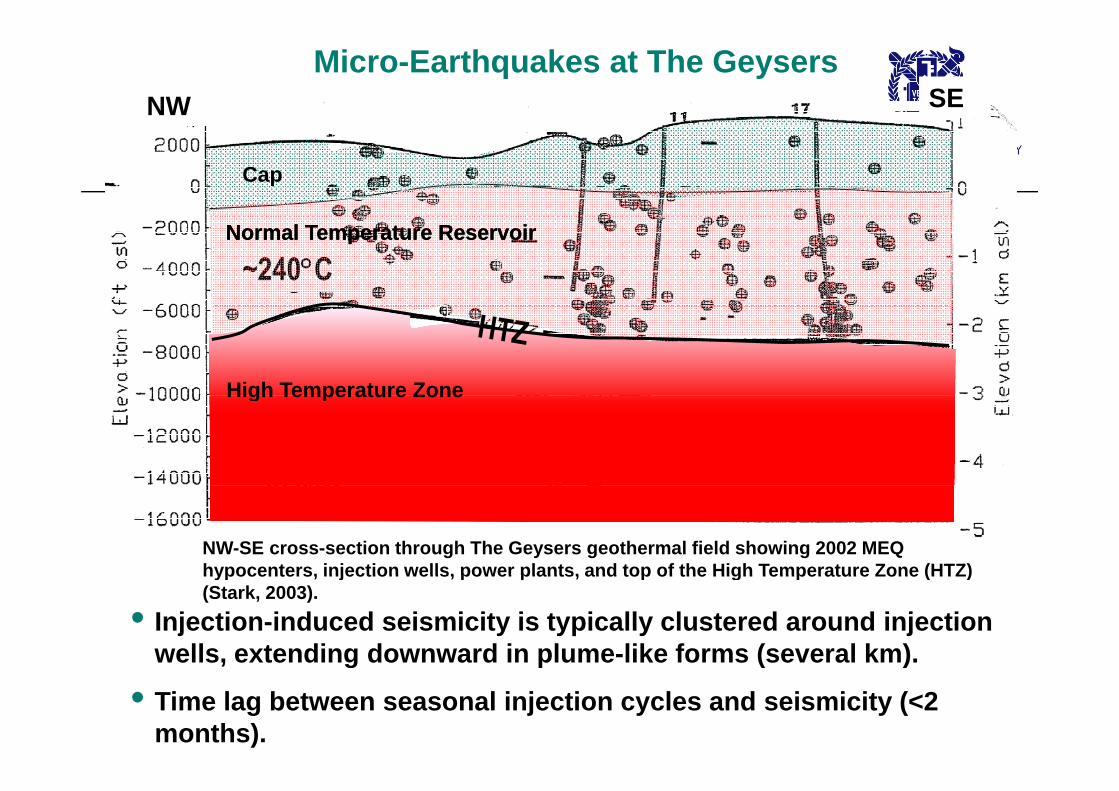
Micro-Earthquakes at The GeysersNW SE
Cap
~240C Normal Temperature ReservoirNormal Temperature Reservoir
High Temperature Zone
350C
High Temperature Zone
~350C NW-SE cross-section through The Geysers geothermal field showing 2002 MEQ hypocenters, injection wells, power plants, and top of the High Temperature Zone (HTZ)
• Injection-induced seismicity is typically clustered around injection wells, extending downward in plume-like forms (several km).
hypocenters, injection wells, power plants, and top of the High Temperature Zone (HTZ) (Stark, 2003).
, g p ( )
• Time lag between seasonal injection cycles and seismicity (<2 months).
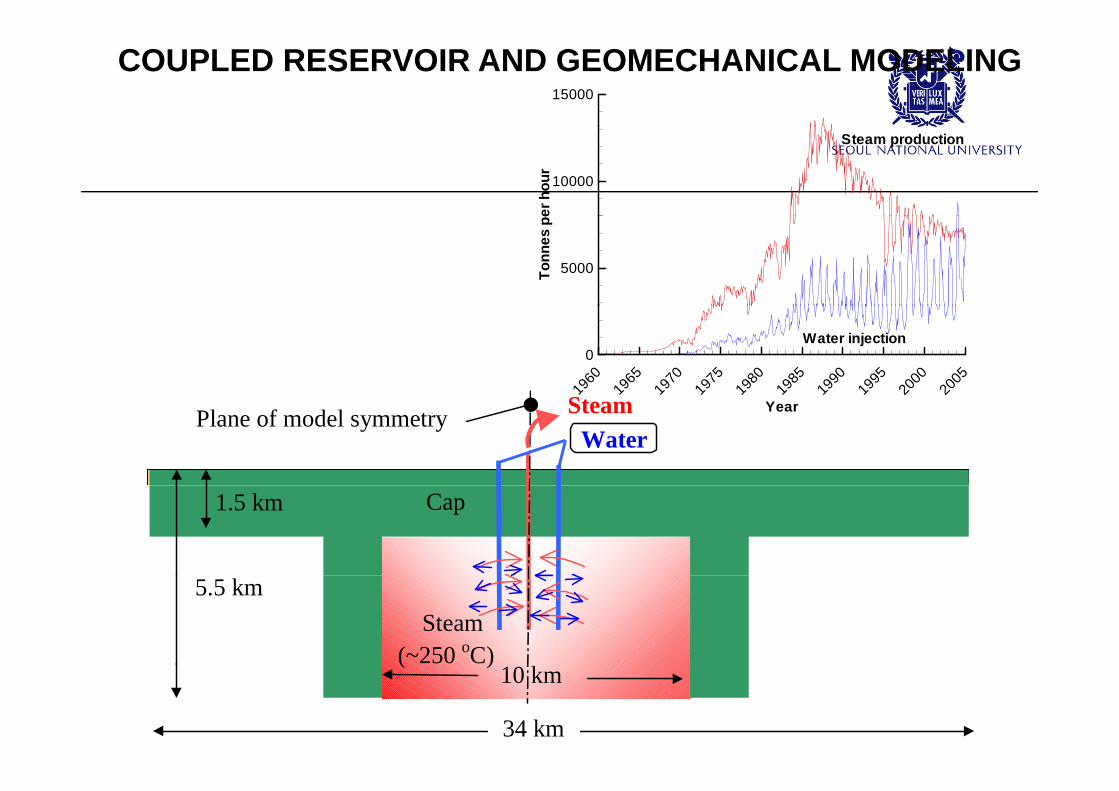
COUPLED RESERVOIR AND GEOMECHANICAL MODELING15000
erho
ur 10000
Steam production
Tonn
espe
5000
1960
1965
1970
1975
1980
1985
1990
1995
2000
2005
0Water injection
SteamPlane of model symmetryWater
Year
1.5 kmCap Rock Cap1.5 km
Steam(~250 oC)
5.5 km
( )
34 km
10 km
ANALYSIS OF 44 YEARS PRODUCTION/INJECTIONThe simulation broadly models the pressure and temperature y p pdecline, and settlement that has been observed at the Geysers (e.g., Williams, 1992, Mossop and Segall, 1997, 1999):
• R i t d t t d li f MP• Reservoir steam pressure and temperature declines a few MPa and a few degrees, respectively
• Settlement of about 0 5 to 1 meter caused by poro-elasticSettlement of about 0.5 to 1 meter caused by poro-elastic contraction, with a small contribution from thermo-elastic contraction
Rock mass bulk modulus = 3 GPa (Consistent with Mossop and Segall, 1997, 1999)
Thermal expansion coefficient = 310-5 C-1 (Corresponds to values determined on core samples of reservoir rock at high temperature (Mossop and Segall 1999)temperature (Mossop and Segall, 1999)
Calculated thermal-elastic and poro-elastic responses bl th d l t l t t ti l fare reasonable use the model to evaluate potential for
induced seismicity using a shear failure analysis
(mm
)
100
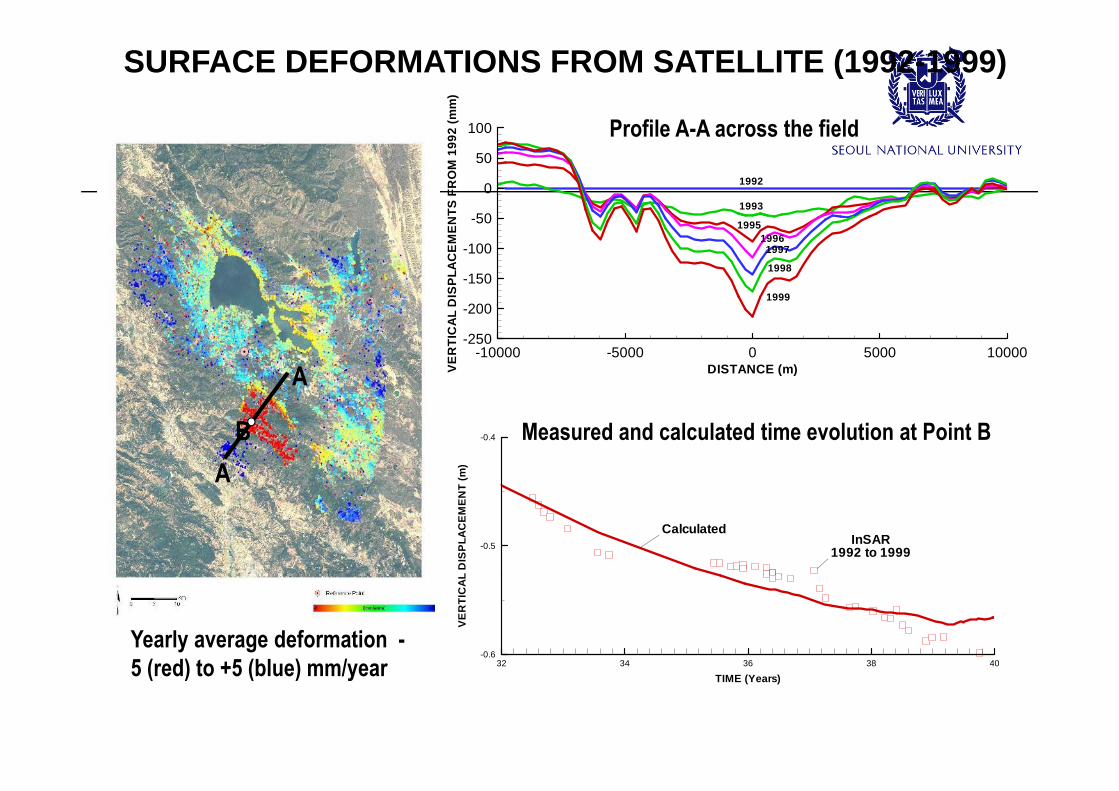
SURFACE DEFORMATIONS FROM SATELLITE (1992-1999)
Profile A A across the field
TSFR
OM
1992
50
0
50
100
1992
1993
Profile A-A across the field
DIS
PLA
CE
ME
N
200
-150
-100
-50 19951996
1999
1997
1998
A DISTANCE (m)VE
RTI
CA
LD
-10000 -5000 0 5000 10000-250
-200
AB
T(m
)
-0.4 Measured and calculated time evolution at Point BL
DIS
PLA
CE
ME
NT
-0.5
CalculatedInSAR
1992 to 1999
VE
RTI
CA
L
32 34 36 38 40-0.6
Yearly average deformation -5 (red) to +5 (blue) mm/year TIME (Years)
32 34 36 38 405 (red) to +5 (blue) mm/year
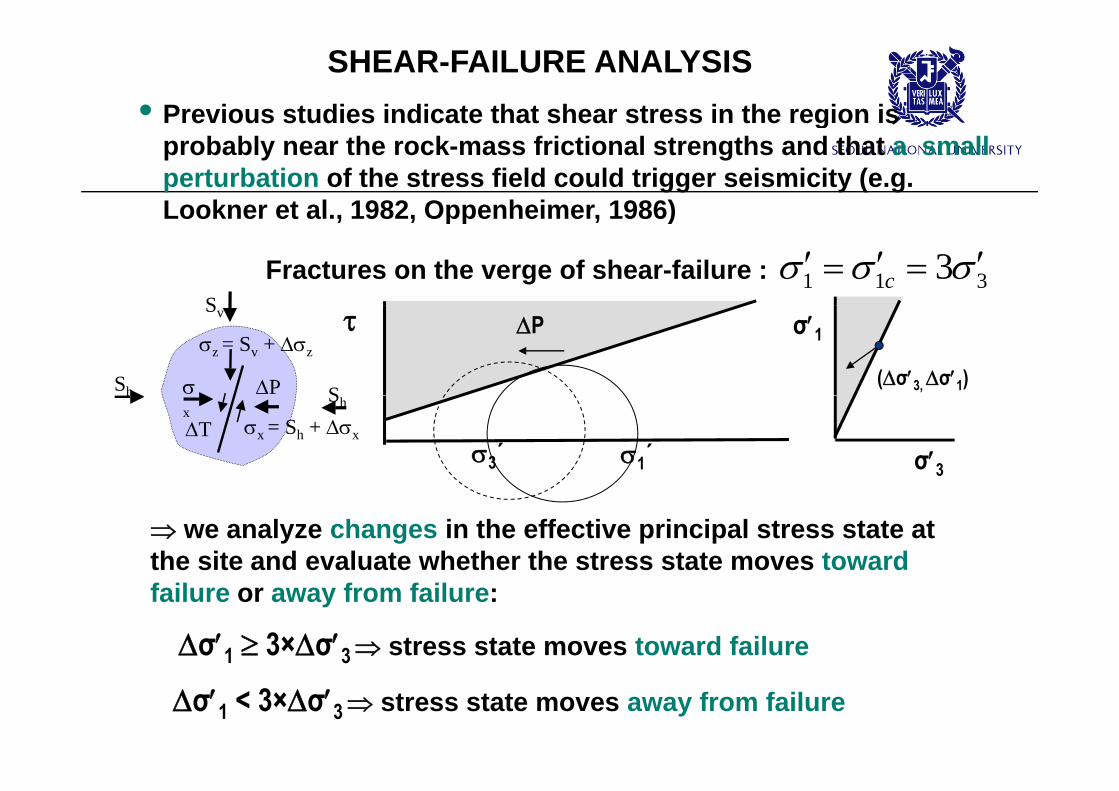
SHEAR-FAILURE ANALYSIS • Previous studies indicate that shear stress in the region is g
probably near the rock-mass frictional strengths and that a small perturbation of the stress field could trigger seismicity (e.g. Lookner et al., 1982, Oppenheimer, 1986)
Fractures on the verge of shear-failure :
Lookner et al., 1982, Oppenheimer, 1986)
311 3 cS
Pz = Sv + z
PSh S
Sv σ1(σ3, σ1)
1´3´x
h Sh
x = Sh + xTσ3
we analyze changes in the effective principal stress state at the site and evaluate whether the stress state moves toward failure or away from failure:
σ1 3×σ3 stress state moves toward failure
σ1 < 3×σ3 stress state moves away from failure
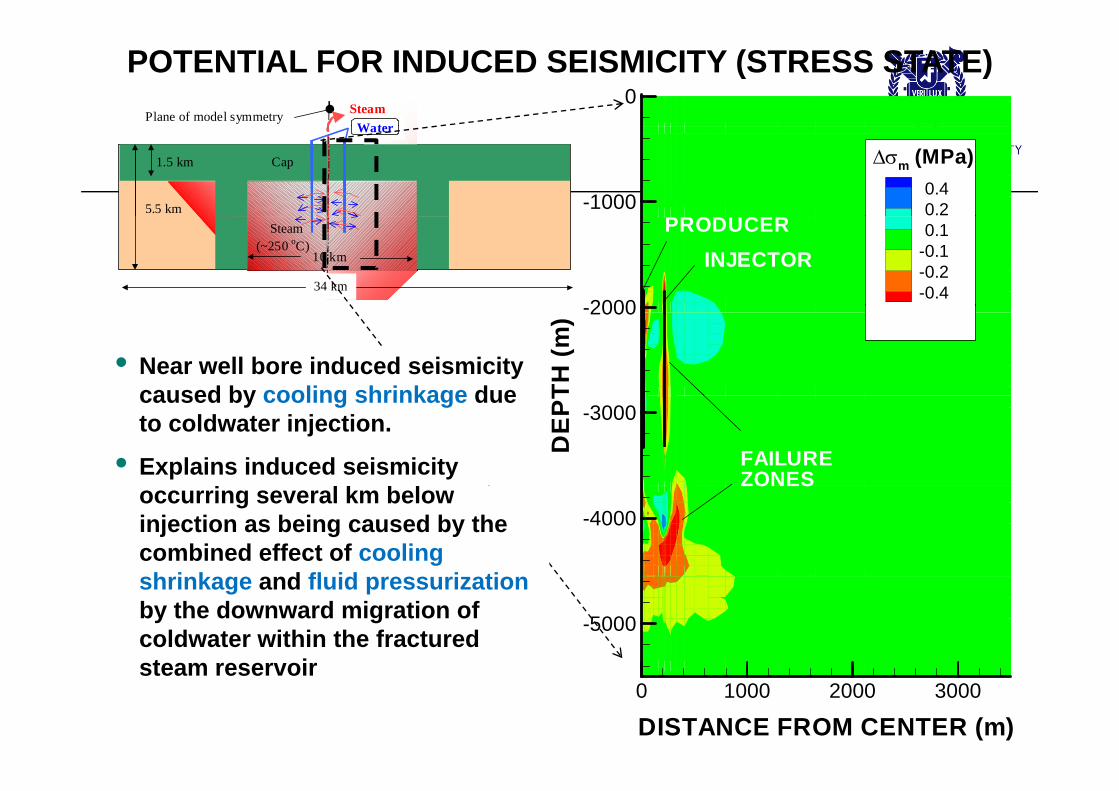
POTENTIAL FOR INDUCED SEISMICITY (STRESS STATE)0
SteamPlane of model symmetryWater
-10000.40.2
m (MPa)1.5 kmCap Rock Cap1.5 km
5.5 km
Water
2000
0.1-0.1-0.2-0.4
PRODUCERINJECTOR
Steam(~250 oC)
34 km
10 km
TH(m
) -2000
• Near well bore induced seismicity caused by cooling shrinkage due
DE
PT
-3000
FAILUREZONES
caused by cooling shrinkage due to coldwater injection.
• Explains induced seismicity
-4000
ZONESoccurring several km below injection as being caused by the combined effect of cooling
h i k d fl id i ti-5000
shrinkage and fluid pressurization by the downward migration of coldwater within the fractured steam reservoir
DISTANCE FROM CENTER (m)0 1000 2000 3000
steam reservoir
Summary of Coupled process
• Thermal process (T)• Hydraulical process (H)• Hydraulical process (H)• Mechanical process (M)• TH
TM• TM• HM
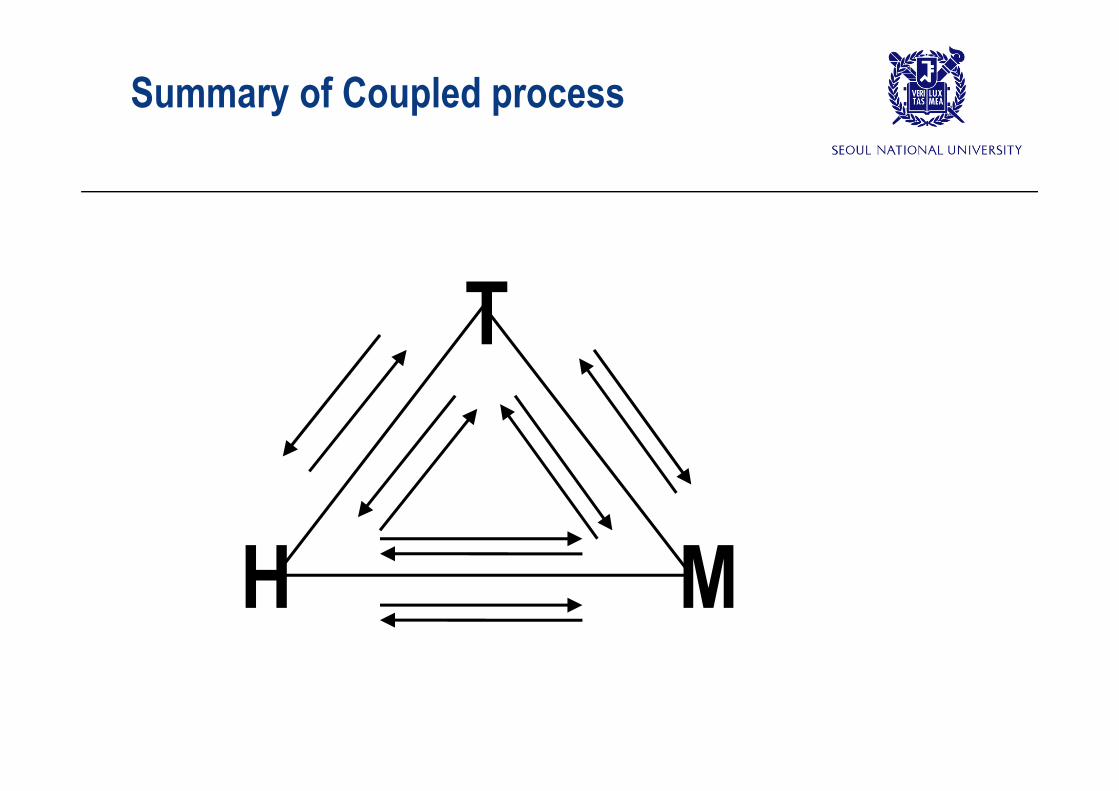
Summary of Coupled process
TT
H MH M
Today
• Reservoir Geomechanics– Effective stressEffective stress
Deformation due to effective stress
Failure induced by effective stressFailure induced by effective stress
– Coupled Process
References
– Zoback MD, 2007, Reservoir Geomechanics, Cambridge University Press
– Fjaer E et al., 2008, Petroleum-related Rock Mechanics, 2nd Ed., Elsevier
– Min KB, Rutqvist J, Tsang CF, Jing L. Jing, 2004, Stress-dependent permeability of fractured rock masses: a numerical study International Journal of Rock Mechanics & Mining Sciences; study, International Journal of Rock Mechanics & Mining Sciences; 41(7):1191-1210