Embed Size (px)
Citation preview
Gergely Daróczi
Unified plots
Contents
Options 3
Default options 3
Histogram . . . . . . . . . . . . . . . . . . . . . . . . . . . . . . . . . . 4
Base R plot . . . . . . . . . . . . . . . . . . . . . . . . . . . . . . 4
lattice . . . . . . . . . . . . . . . . . . . . . . . . . . . . . . . . . 7
ggplot2 . . . . . . . . . . . . . . . . . . . . . . . . . . . . . . . . 7
Barplot . . . . . . . . . . . . . . . . . . . . . . . . . . . . . . . . . . . 7
Base R plot . . . . . . . . . . . . . . . . . . . . . . . . . . . . . . 7
lattice . . . . . . . . . . . . . . . . . . . . . . . . . . . . . . . . . 8
ggplot2 . . . . . . . . . . . . . . . . . . . . . . . . . . . . . . . . 10
Points . . . . . . . . . . . . . . . . . . . . . . . . . . . . . . . . . . . . 10
Base R plot . . . . . . . . . . . . . . . . . . . . . . . . . . . . . . 10
lattice . . . . . . . . . . . . . . . . . . . . . . . . . . . . . . . . . 13
ggplot2 . . . . . . . . . . . . . . . . . . . . . . . . . . . . . . . . 13
Grouped plot . . . . . . . . . . . . . . . . . . . . . . . . . . . . . . . . 13
Base R plot . . . . . . . . . . . . . . . . . . . . . . . . . . . . . . 13
lattice . . . . . . . . . . . . . . . . . . . . . . . . . . . . . . . . . 13
ggplot2 . . . . . . . . . . . . . . . . . . . . . . . . . . . . . . . . 13
Facets . . . . . . . . . . . . . . . . . . . . . . . . . . . . . . . . . . . . 13
Base R plot . . . . . . . . . . . . . . . . . . . . . . . . . . . . . . 13
lattice . . . . . . . . . . . . . . . . . . . . . . . . . . . . . . . . . 18
ggplot2 . . . . . . . . . . . . . . . . . . . . . . . . . . . . . . . . 18
1
Boxplot . . . . . . . . . . . . . . . . . . . . . . . . . . . . . . . . . . . 18
Base R plot . . . . . . . . . . . . . . . . . . . . . . . . . . . . . . 18
lattice . . . . . . . . . . . . . . . . . . . . . . . . . . . . . . . . . 19
ggplot2 . . . . . . . . . . . . . . . . . . . . . . . . . . . . . . . . 19
Lines . . . . . . . . . . . . . . . . . . . . . . . . . . . . . . . . . . . . . 19
Base R plot . . . . . . . . . . . . . . . . . . . . . . . . . . . . . . 19
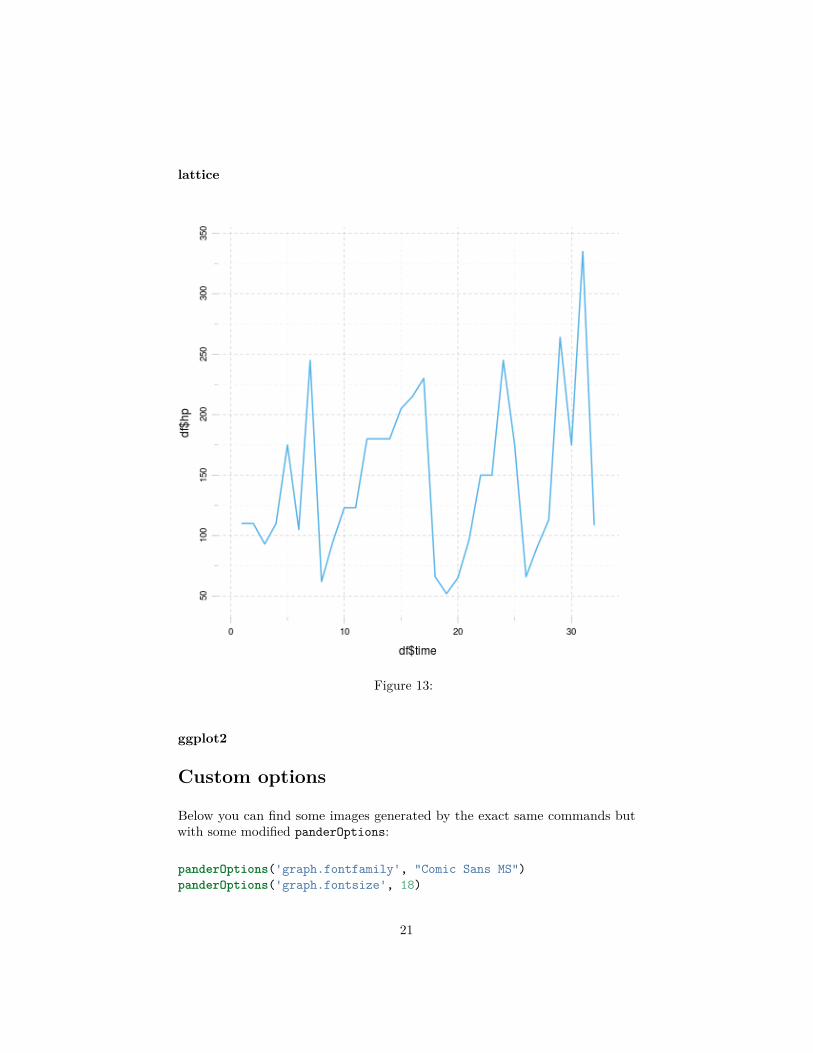
lattice . . . . . . . . . . . . . . . . . . . . . . . . . . . . . . . . . 21
ggplot2 . . . . . . . . . . . . . . . . . . . . . . . . . . . . . . . . 21
Custom options 21
Histogram . . . . . . . . . . . . . . . . . . . . . . . . . . . . . . . . . . 23
Base R plot . . . . . . . . . . . . . . . . . . . . . . . . . . . . . . 23
lattice . . . . . . . . . . . . . . . . . . . . . . . . . . . . . . . . . 24
ggplot2 . . . . . . . . . . . . . . . . . . . . . . . . . . . . . . . . 24
Barplot . . . . . . . . . . . . . . . . . . . . . . . . . . . . . . . . . . . 24
Base R plot . . . . . . . . . . . . . . . . . . . . . . . . . . . . . . 24
lattice . . . . . . . . . . . . . . . . . . . . . . . . . . . . . . . . . 29
ggplot2 . . . . . . . . . . . . . . . . . . . . . . . . . . . . . . . . 29
Points . . . . . . . . . . . . . . . . . . . . . . . . . . . . . . . . . . . . 29
Base R plot . . . . . . . . . . . . . . . . . . . . . . . . . . . . . . 29
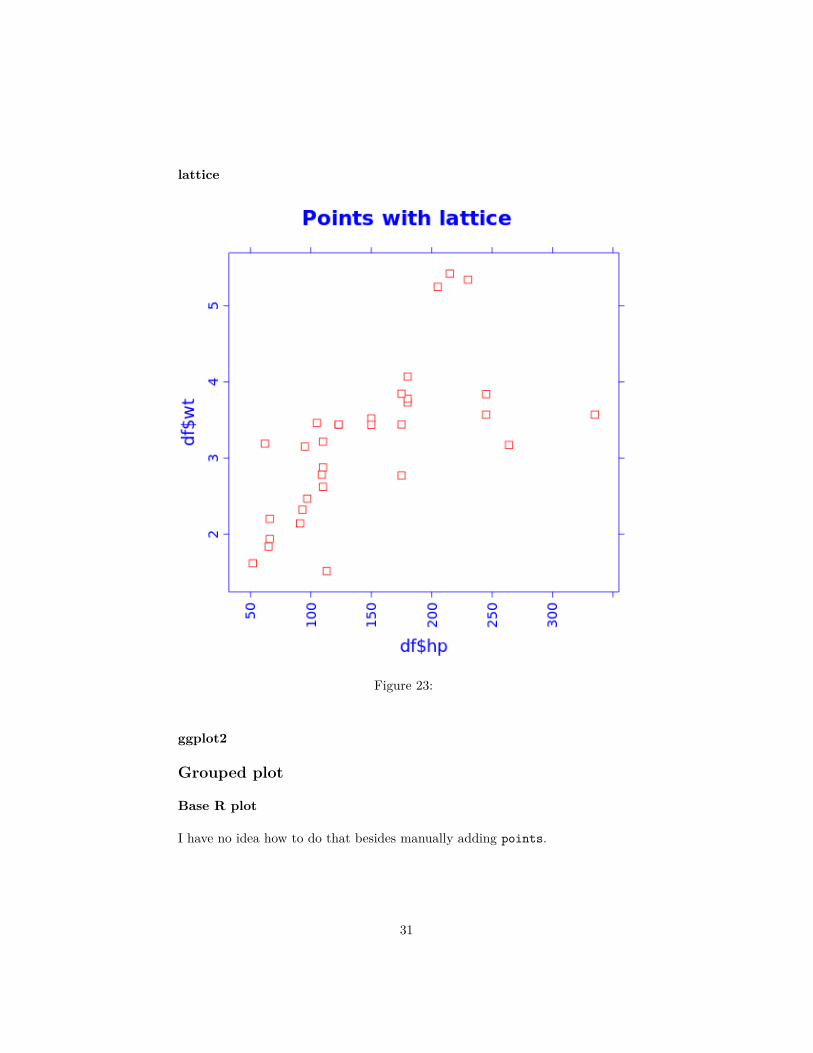
lattice . . . . . . . . . . . . . . . . . . . . . . . . . . . . . . . . . 31
ggplot2 . . . . . . . . . . . . . . . . . . . . . . . . . . . . . . . . 31
Grouped plot . . . . . . . . . . . . . . . . . . . . . . . . . . . . . . . . 31
Base R plot . . . . . . . . . . . . . . . . . . . . . . . . . . . . . . 31
lattice . . . . . . . . . . . . . . . . . . . . . . . . . . . . . . . . . 34
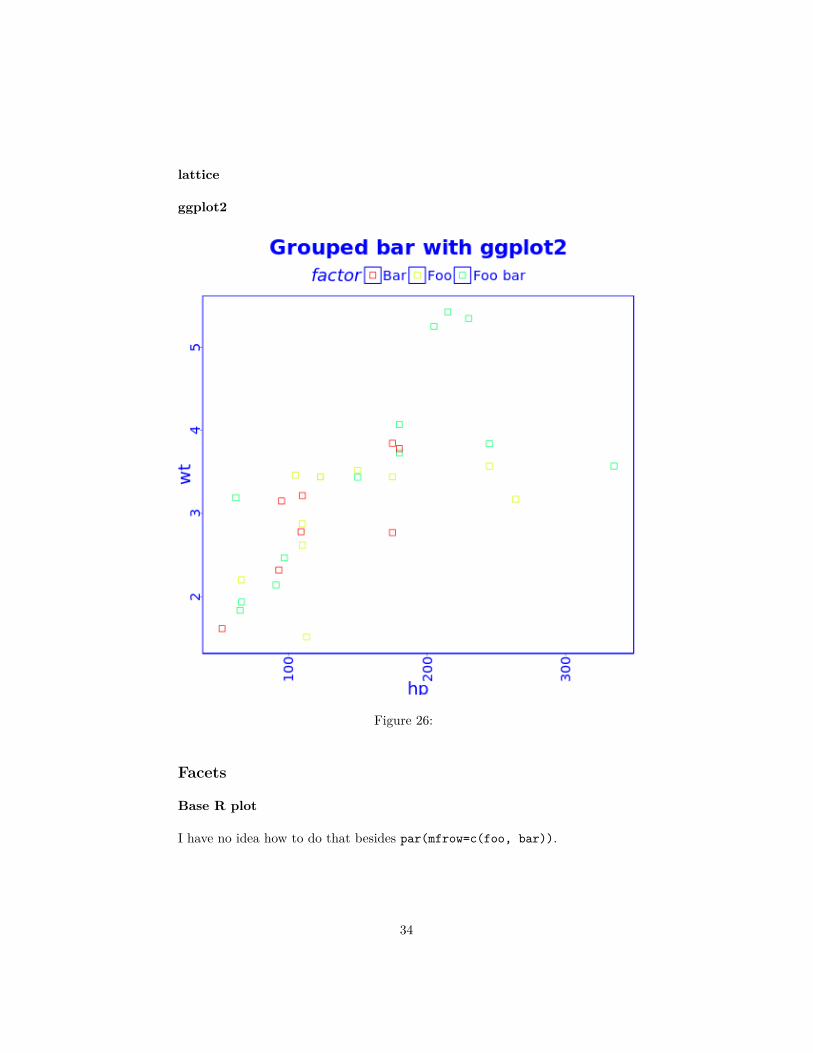
ggplot2 . . . . . . . . . . . . . . . . . . . . . . . . . . . . . . . . 34
Facets . . . . . . . . . . . . . . . . . . . . . . . . . . . . . . . . . . . . 34
Base R plot . . . . . . . . . . . . . . . . . . . . . . . . . . . . . . 34
lattice . . . . . . . . . . . . . . . . . . . . . . . . . . . . . . . . . 36
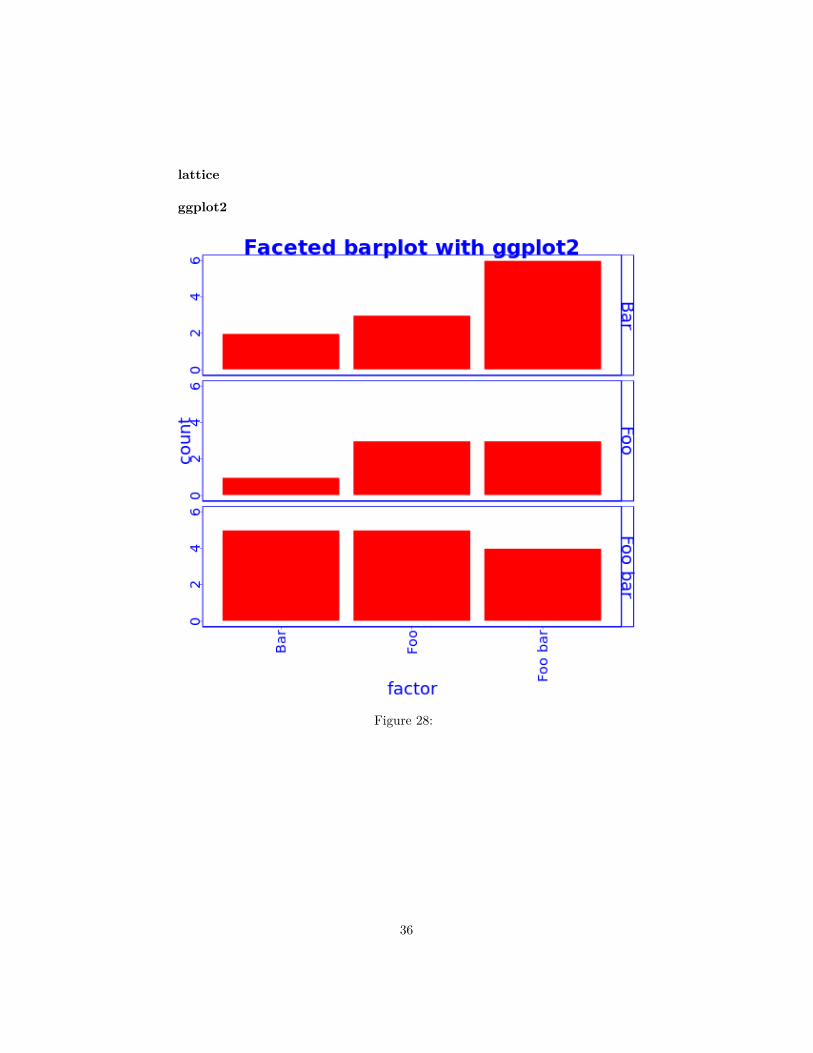
ggplot2 . . . . . . . . . . . . . . . . . . . . . . . . . . . . . . . . 36
Boxplot . . . . . . . . . . . . . . . . . . . . . . . . . . . . . . . . . . . 40
2
Base R plot . . . . . . . . . . . . . . . . . . . . . . . . . . . . . . 40lattice . . . . . . . . . . . . . . . . . . . . . . . . . . . . . . . . . 40ggplot2 . . . . . . . . . . . . . . . . . . . . . . . . . . . . . . . . 40
Lines . . . . . . . . . . . . . . . . . . . . . . . . . . . . . . . . . . . . . 40Base R plot . . . . . . . . . . . . . . . . . . . . . . . . . . . . . . 40lattice . . . . . . . . . . . . . . . . . . . . . . . . . . . . . . . . . 40ggplot2 . . . . . . . . . . . . . . . . . . . . . . . . . . . . . . . . 40
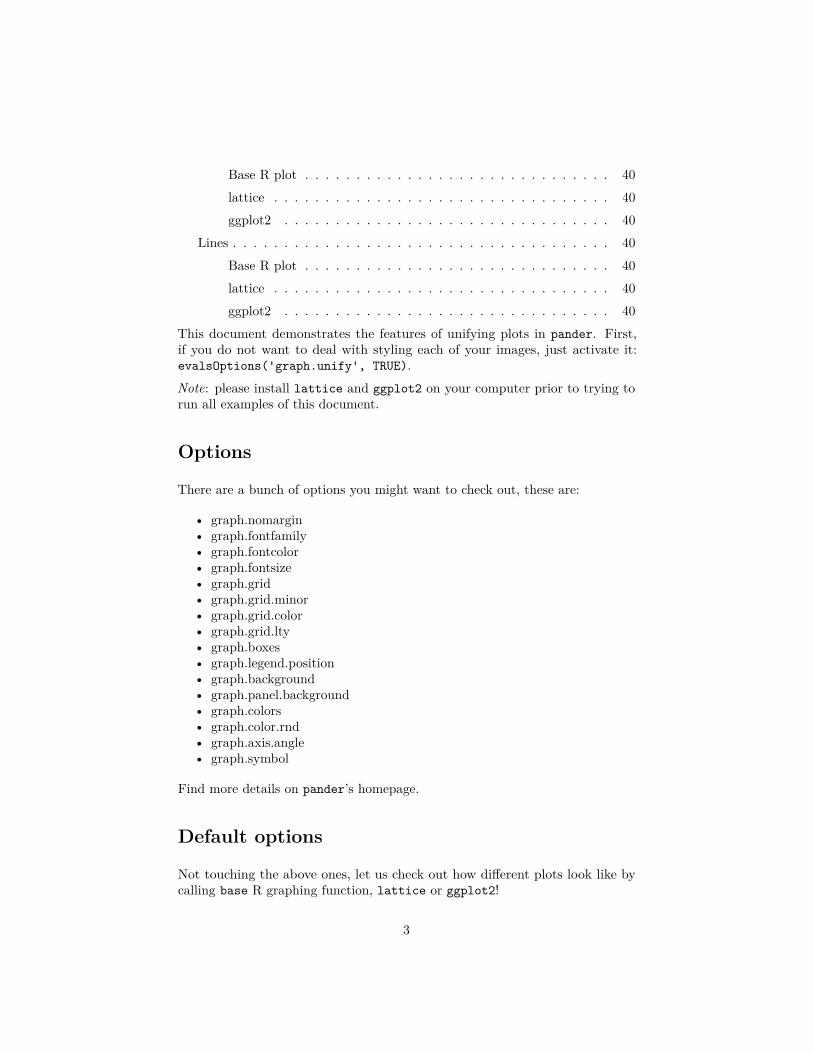
This document demonstrates the features of unifying plots in pander. First,if you do not want to deal with styling each of your images, just activate it:evalsOptions('graph.unify', TRUE).Note: please install lattice and ggplot2 on your computer prior to trying torun all examples of this document.
Options
There are a bunch of options you might want to check out, these are:
• graph.nomargin• graph.fontfamily• graph.fontcolor• graph.fontsize• graph.grid• graph.grid.minor• graph.grid.color• graph.grid.lty• graph.boxes• graph.legend.position• graph.background• graph.panel.background• graph.colors• graph.color.rnd• graph.axis.angle• graph.symbol
Find more details on pander’s homepage.
Default options
Not touching the above ones, let us check out how different plots look like bycalling base R graphing function, lattice or ggplot2!
3
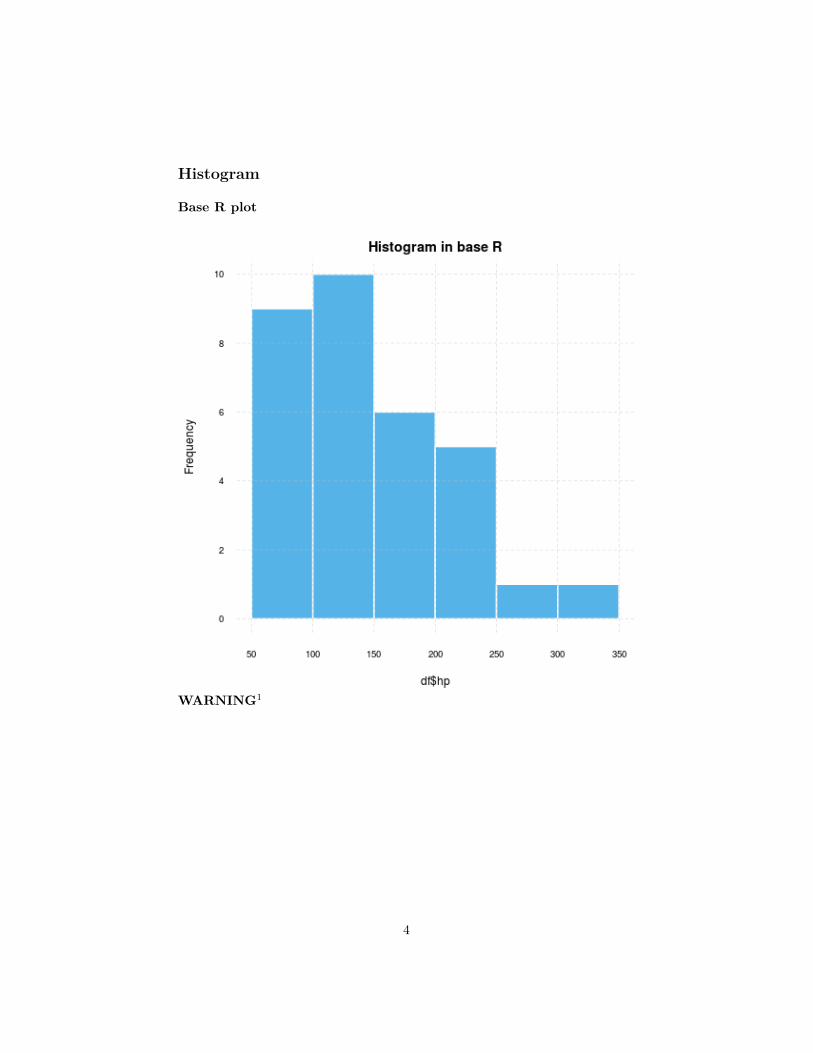
Histogram
Base R plot
WARNING1
4
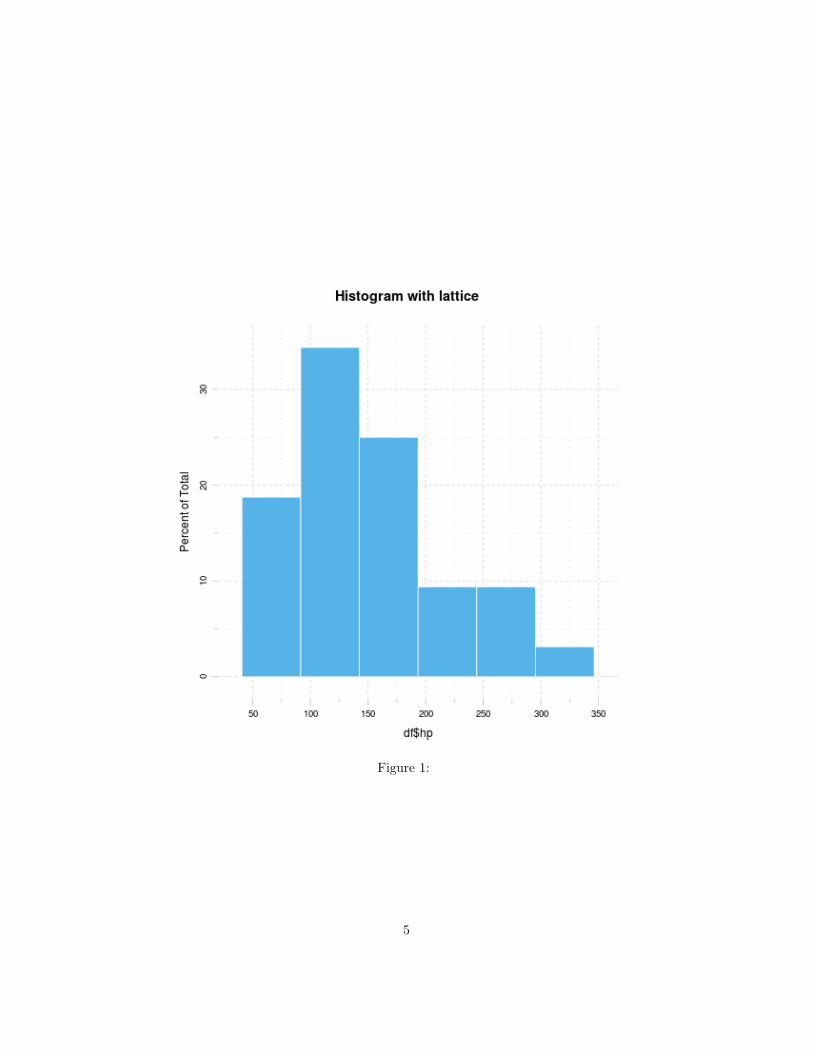
Figure 1:
5
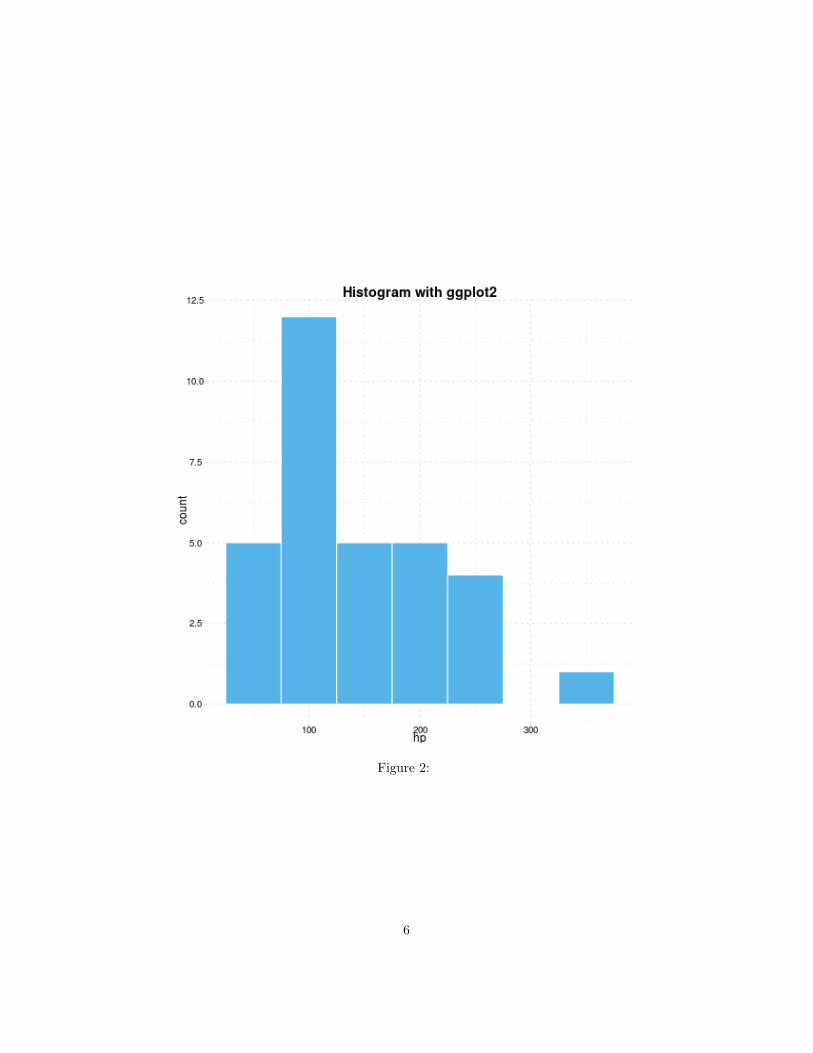
Figure 2:
6
lattice
ggplot2
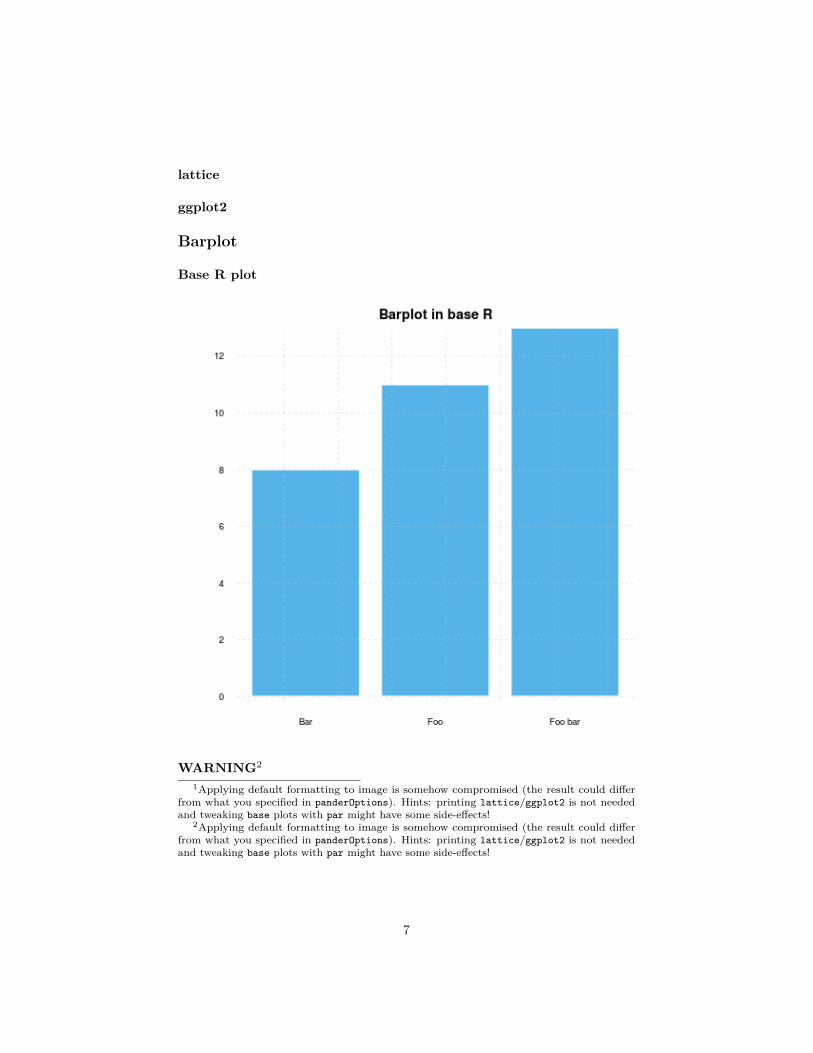
Barplot
Base R plot
WARNING2
1Applying default formatting to image is somehow compromised (the result could differfrom what you specified in panderOptions). Hints: printing lattice/ggplot2 is not neededand tweaking base plots with par might have some side-effects!
2Applying default formatting to image is somehow compromised (the result could differfrom what you specified in panderOptions). Hints: printing lattice/ggplot2 is not neededand tweaking base plots with par might have some side-effects!
7
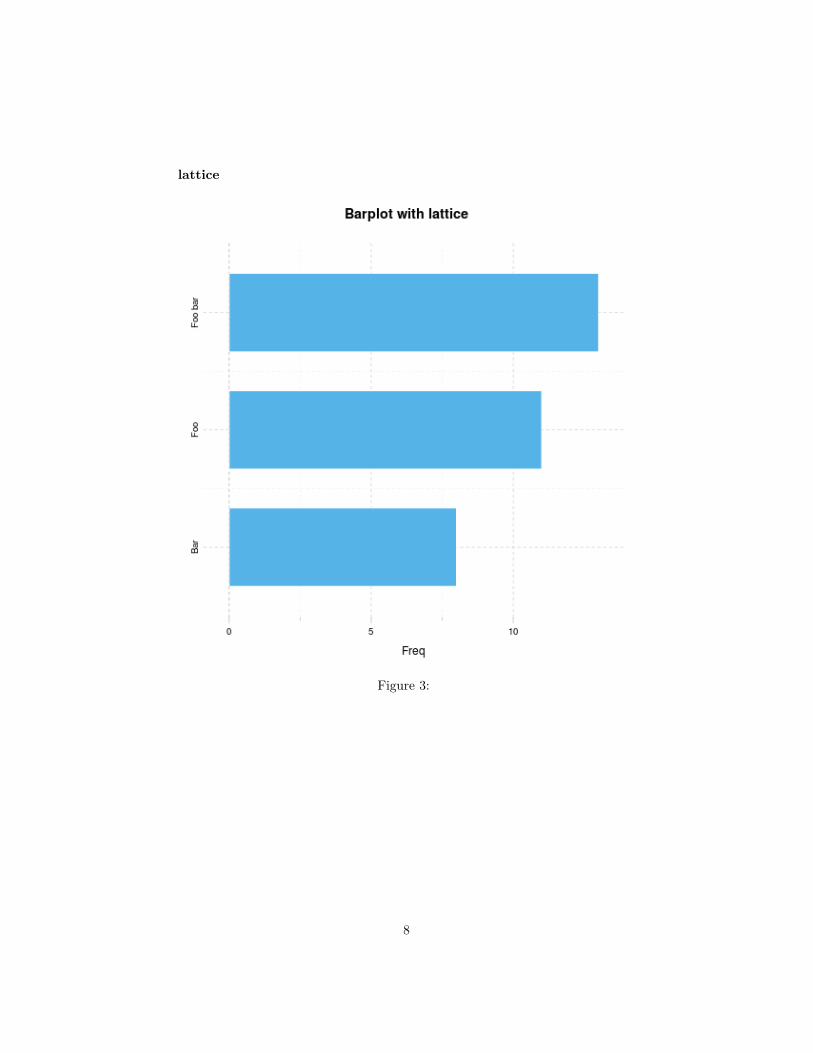
lattice
Figure 3:
8
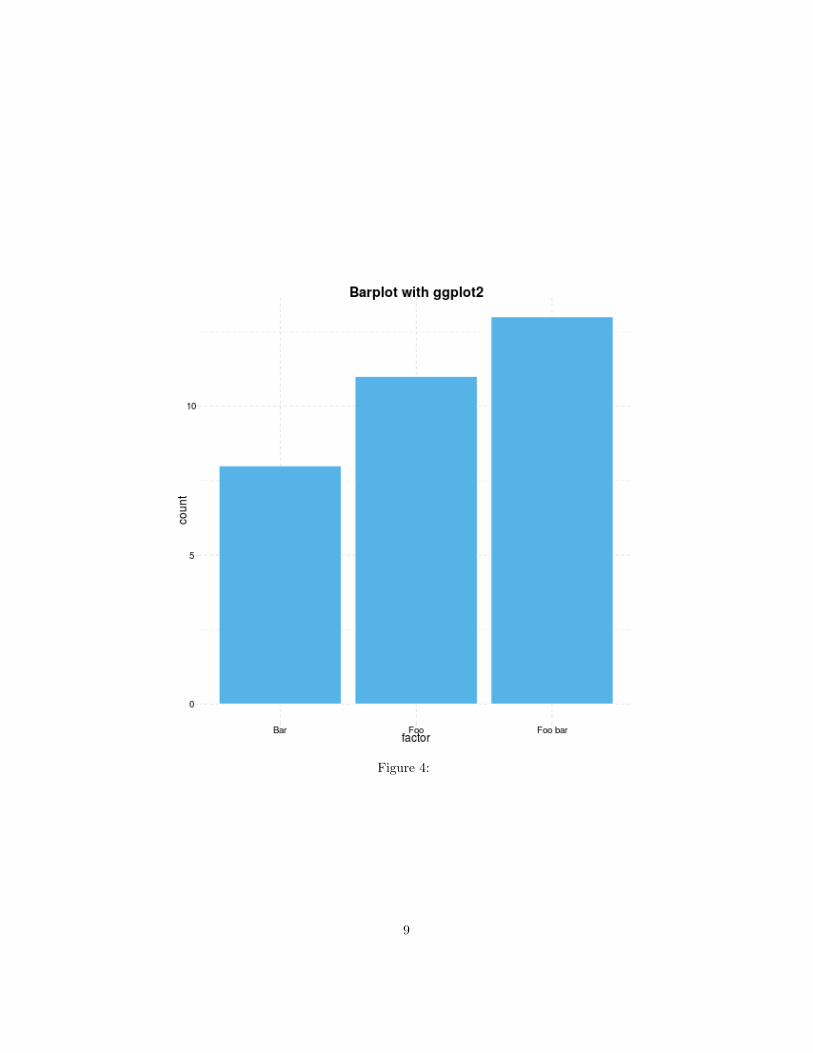
Figure 4:
9
ggplot2
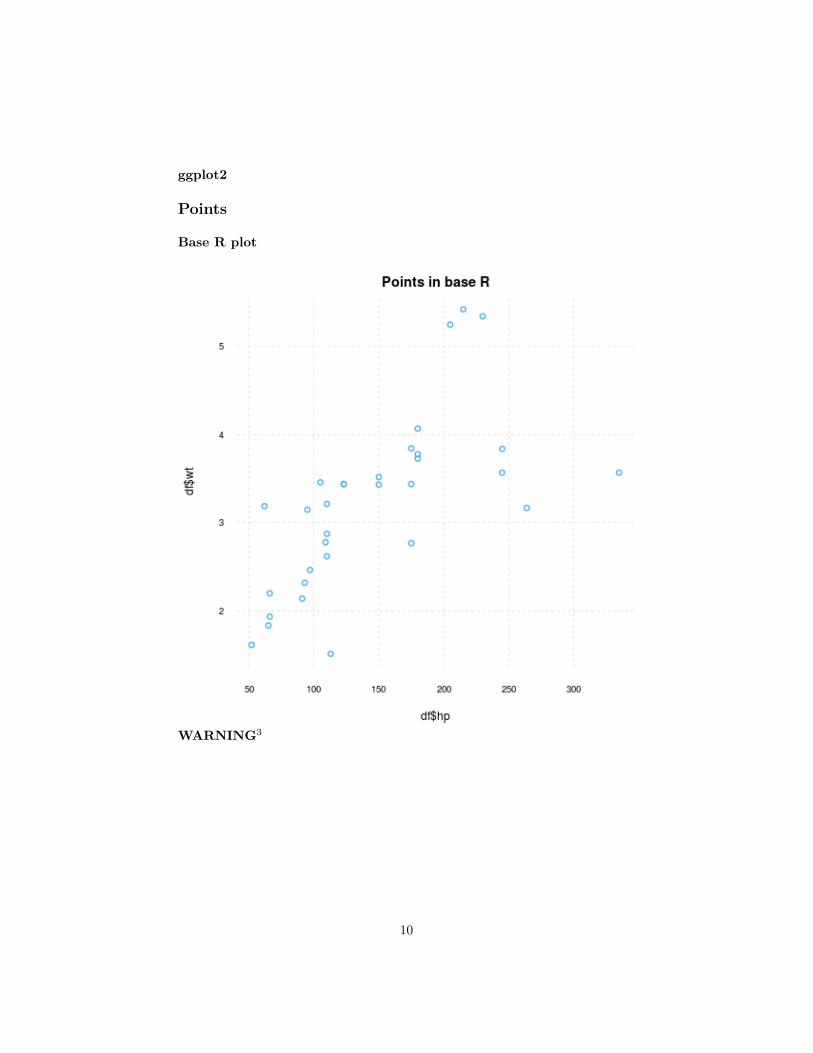
Points
Base R plot
WARNING3
10
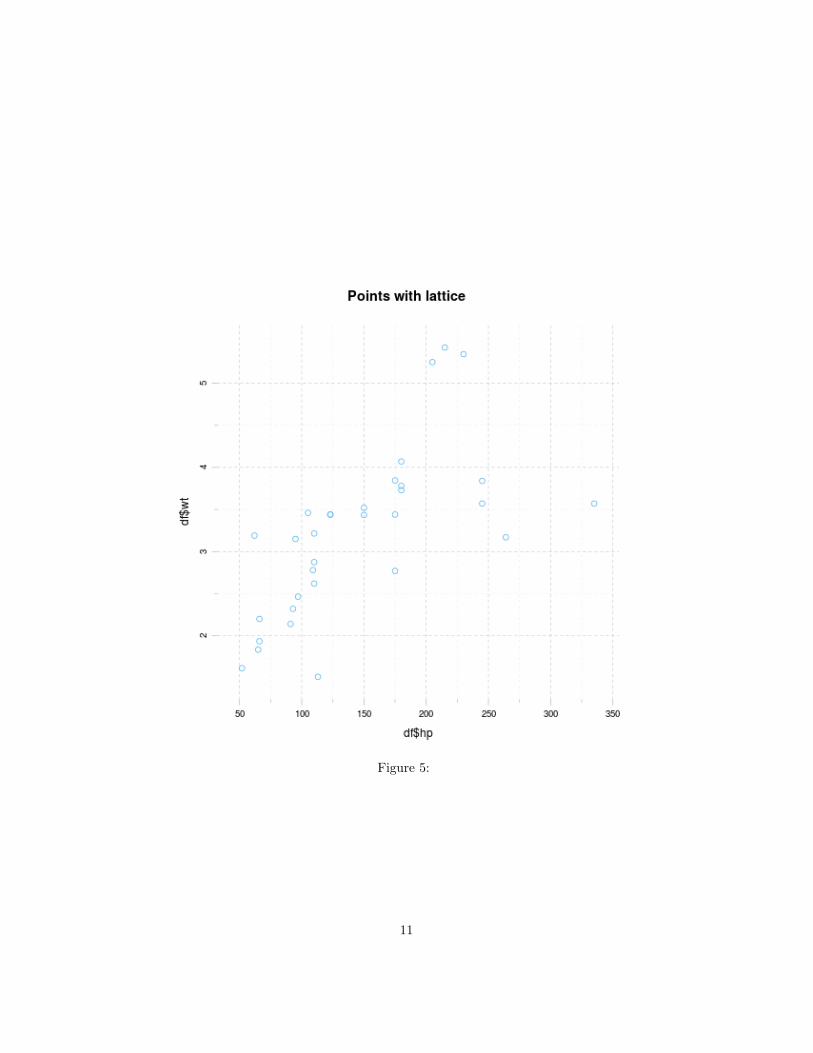
Figure 5:
11
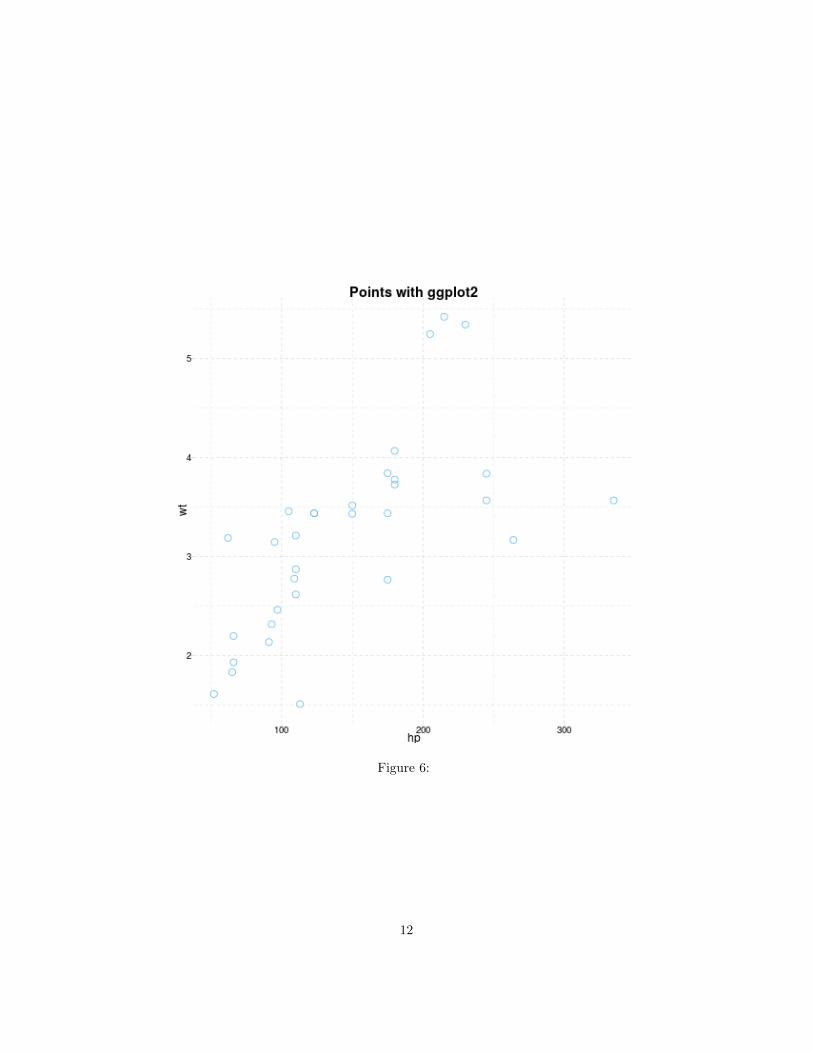
Figure 6:
12
lattice
ggplot2
Grouped plot
Base R plot
I have no idea how to do that besides manually adding points.
lattice
ggplot2
Facets
Base R plot
I have no idea how to do that besides par(mfrow=c(foo, bar)).
13
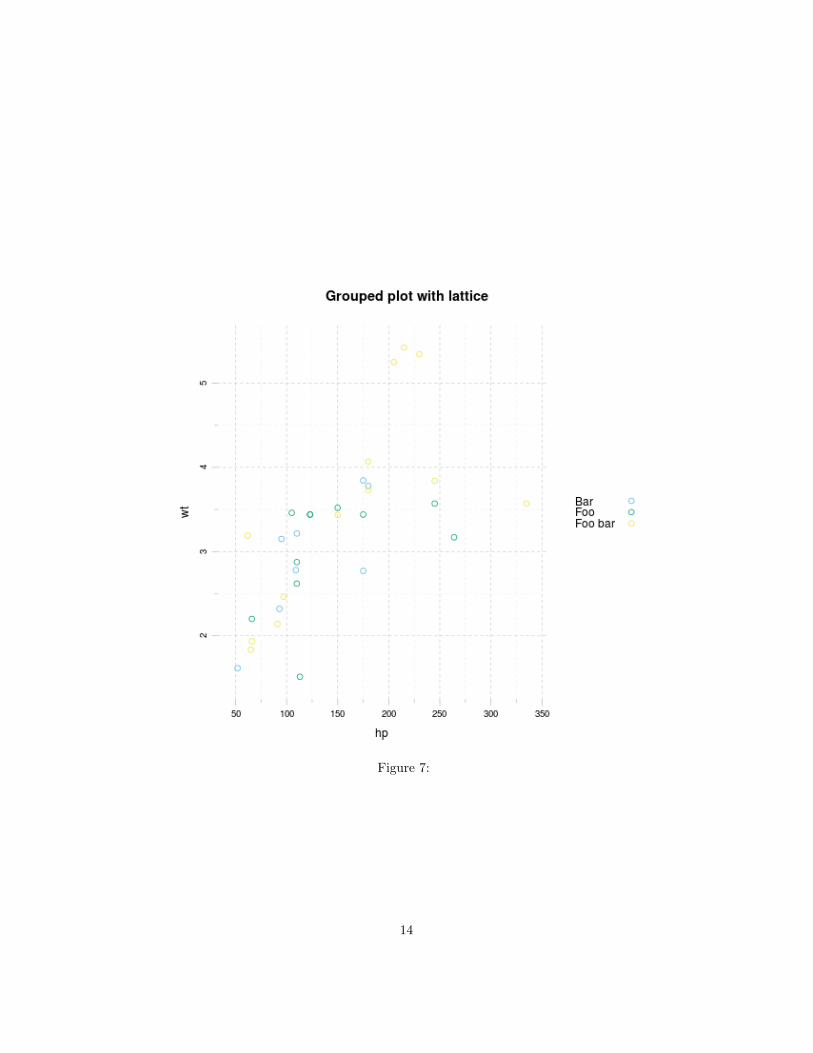
Figure 7:
14
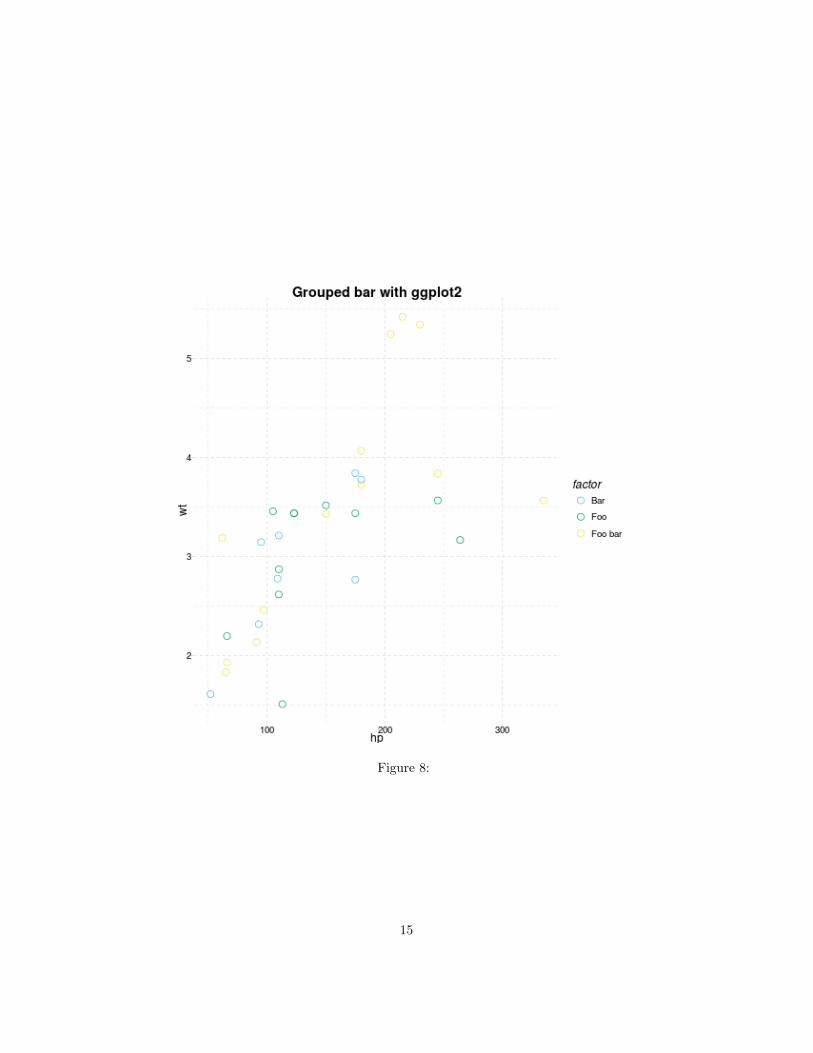
Figure 8:
15
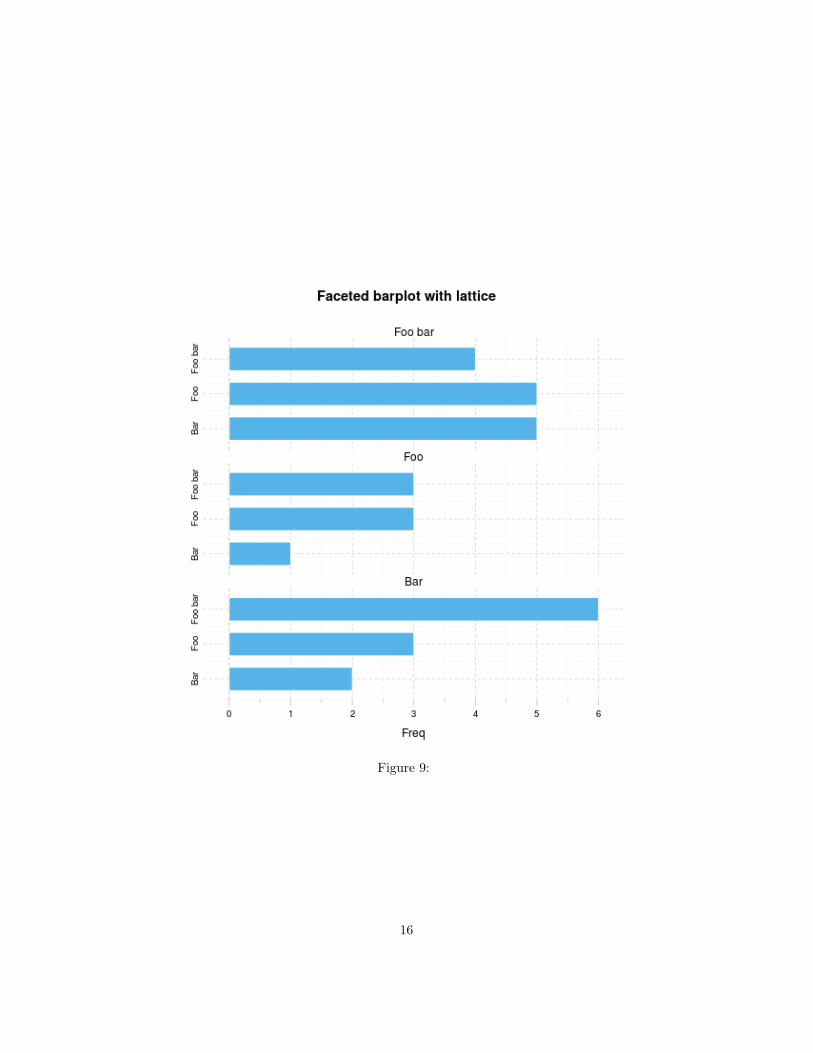
Figure 9:
16
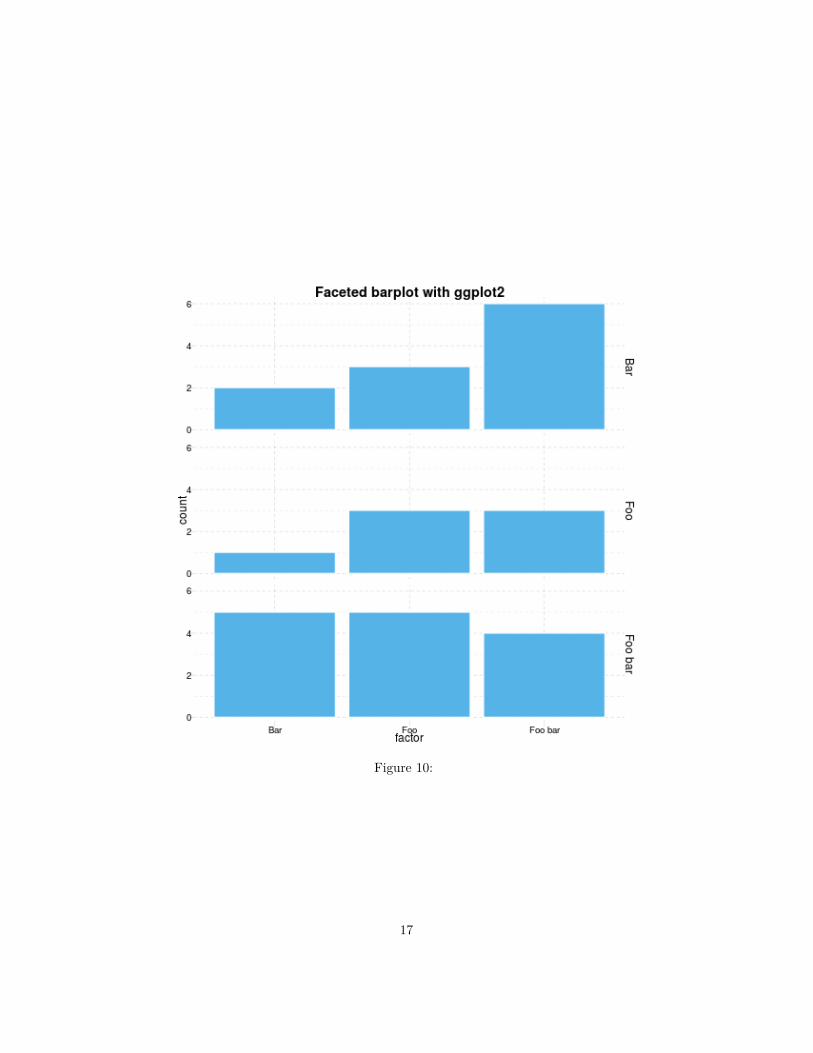
Figure 10:
17
lattice
ggplot2
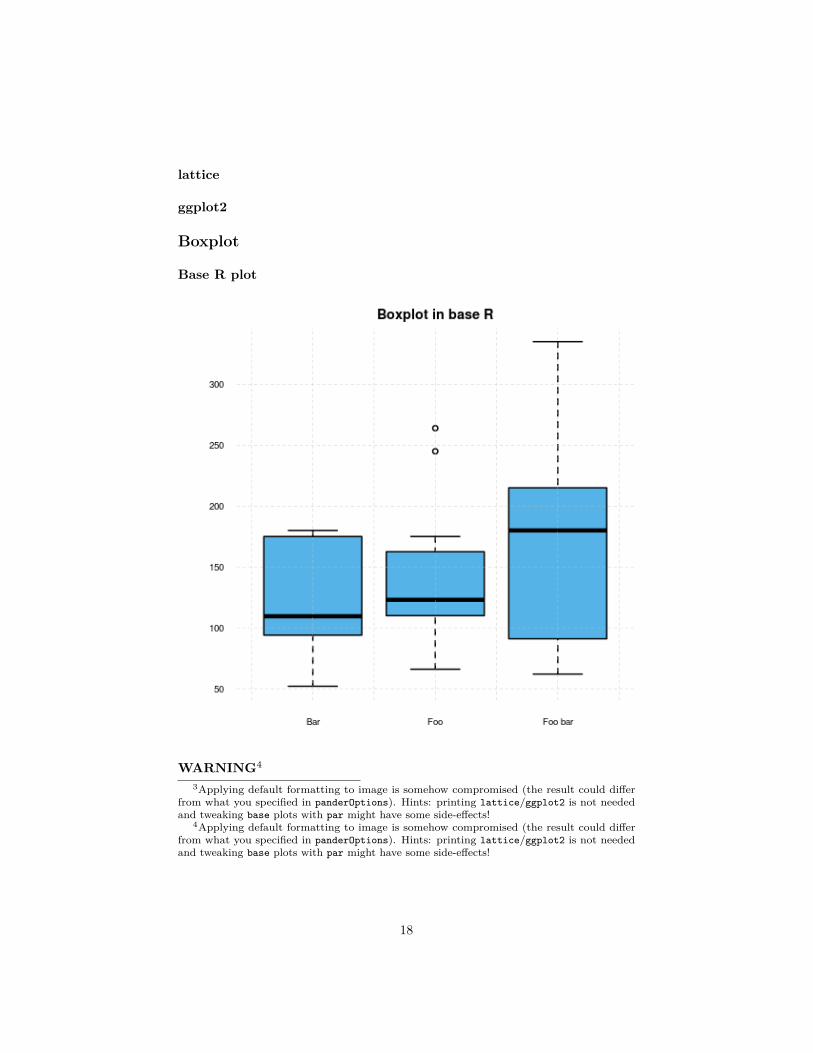
Boxplot
Base R plot
WARNING4
3Applying default formatting to image is somehow compromised (the result could differfrom what you specified in panderOptions). Hints: printing lattice/ggplot2 is not neededand tweaking base plots with par might have some side-effects!
4Applying default formatting to image is somehow compromised (the result could differfrom what you specified in panderOptions). Hints: printing lattice/ggplot2 is not neededand tweaking base plots with par might have some side-effects!
18
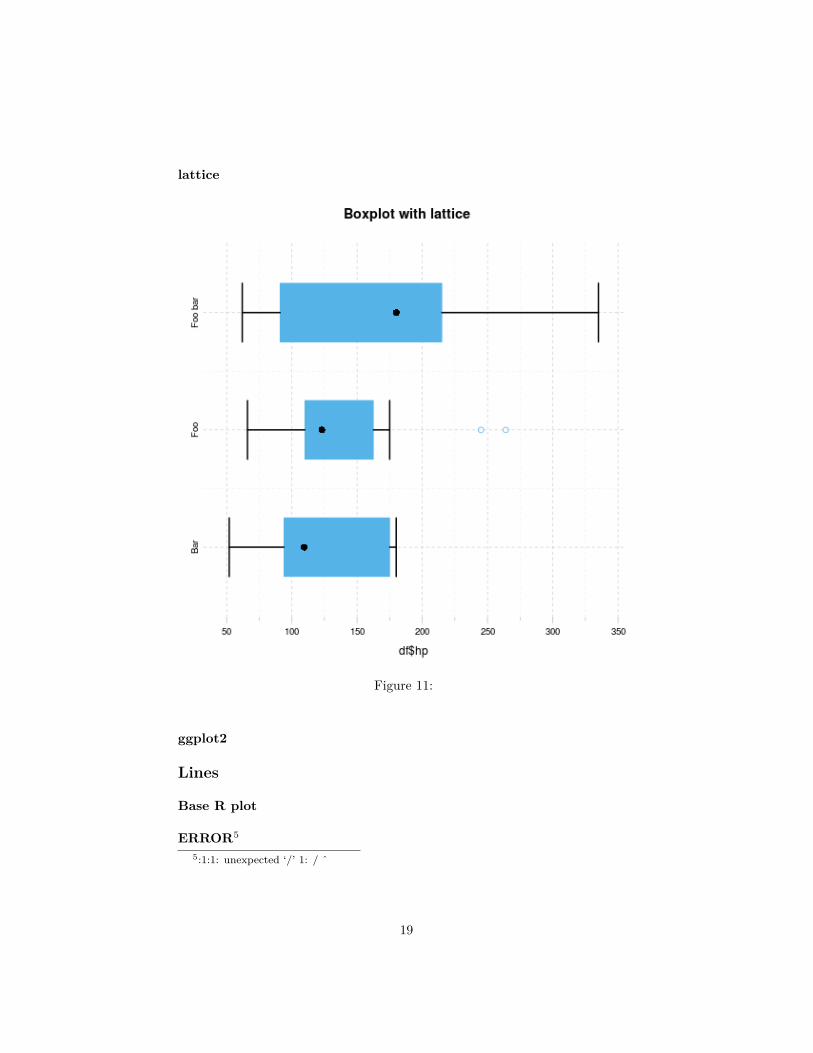
lattice
Figure 11:
ggplot2
Lines
Base R plot
ERROR5
5:1:1: unexpected ‘/’ 1: / ˆ
19
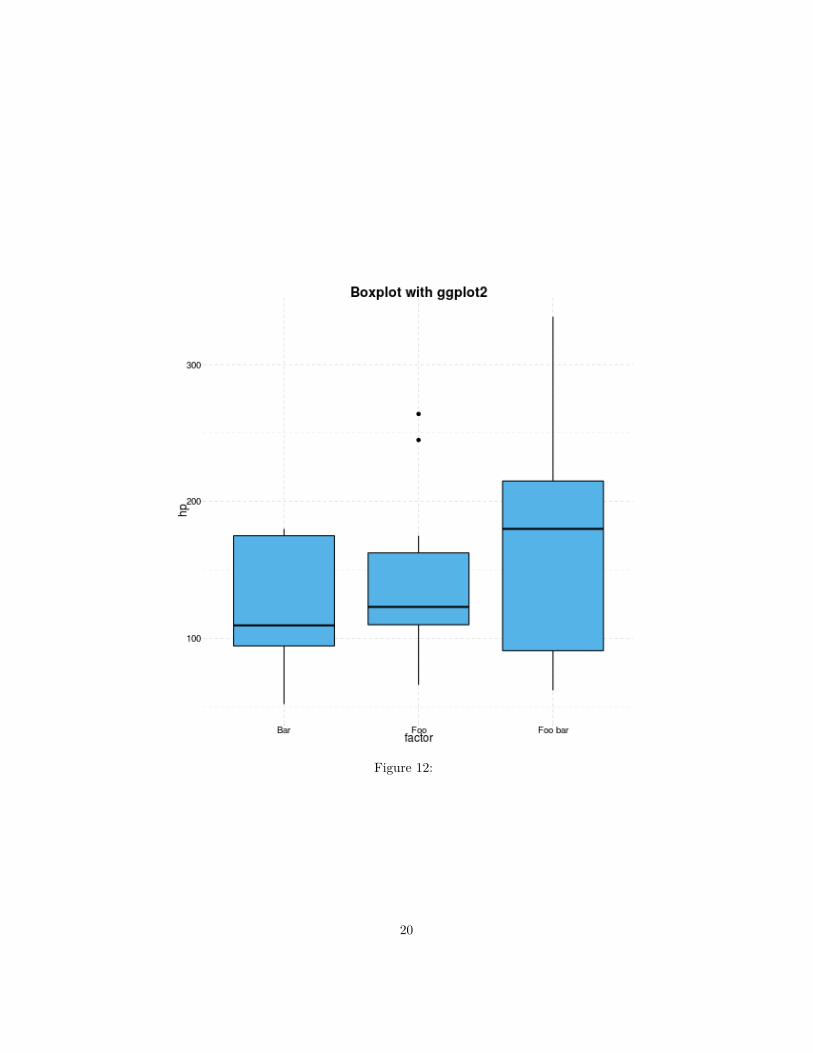
Figure 12:
20
lattice
Figure 13:
ggplot2
Custom options
Below you can find some images generated by the exact same commands butwith some modified panderOptions:
panderOptions('graph.fontfamily', "Comic Sans MS")panderOptions('graph.fontsize', 18)
21
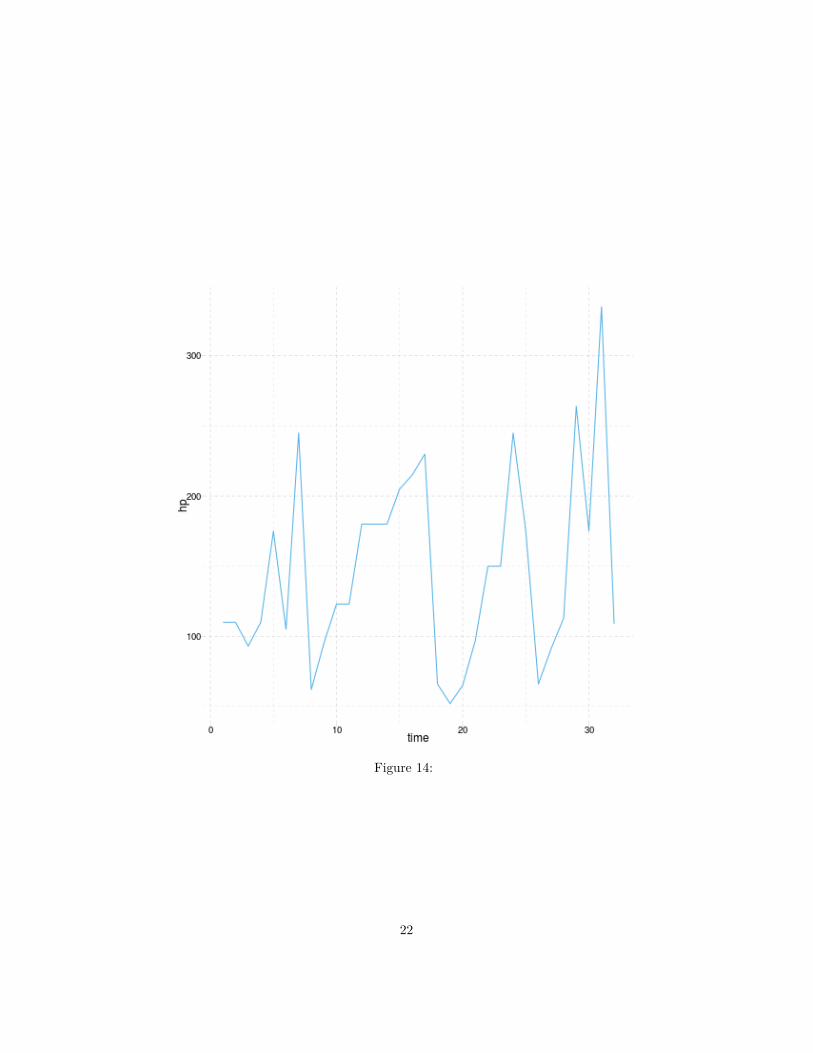
Figure 14:
22
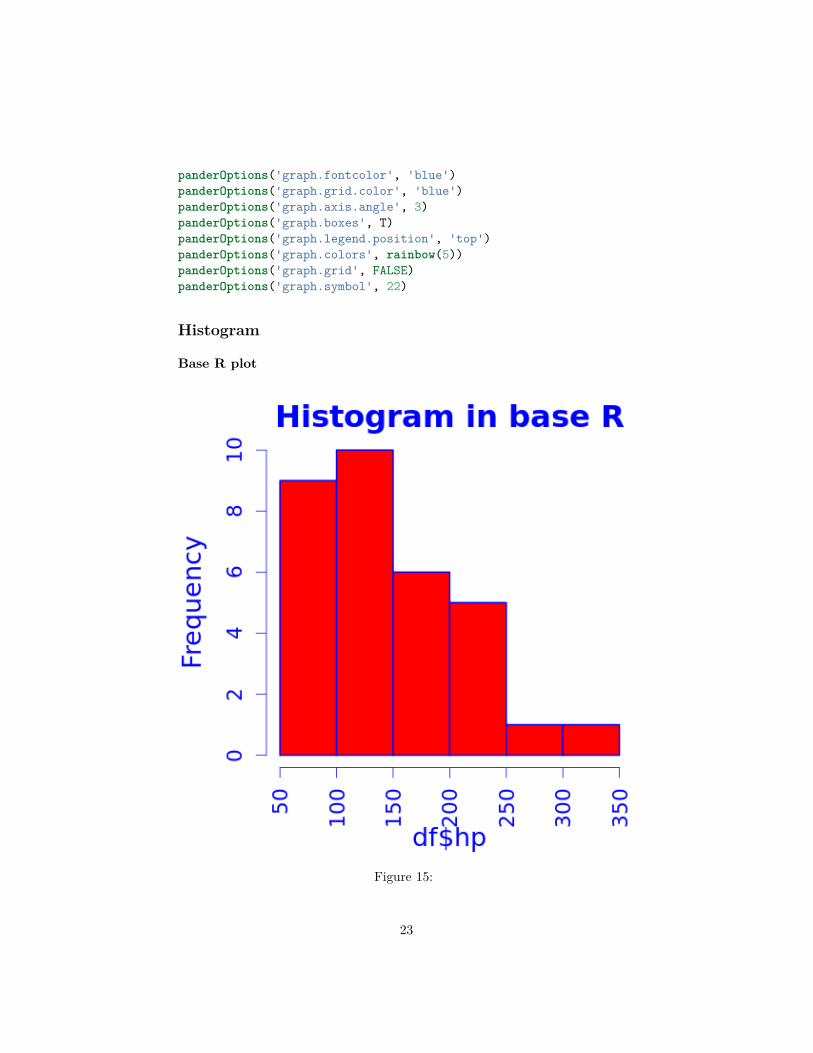
panderOptions('graph.fontcolor', 'blue')panderOptions('graph.grid.color', 'blue')panderOptions('graph.axis.angle', 3)panderOptions('graph.boxes', T)panderOptions('graph.legend.position', 'top')panderOptions('graph.colors', rainbow(5))panderOptions('graph.grid', FALSE)panderOptions('graph.symbol', 22)
Histogram
Base R plot
Figure 15:
23
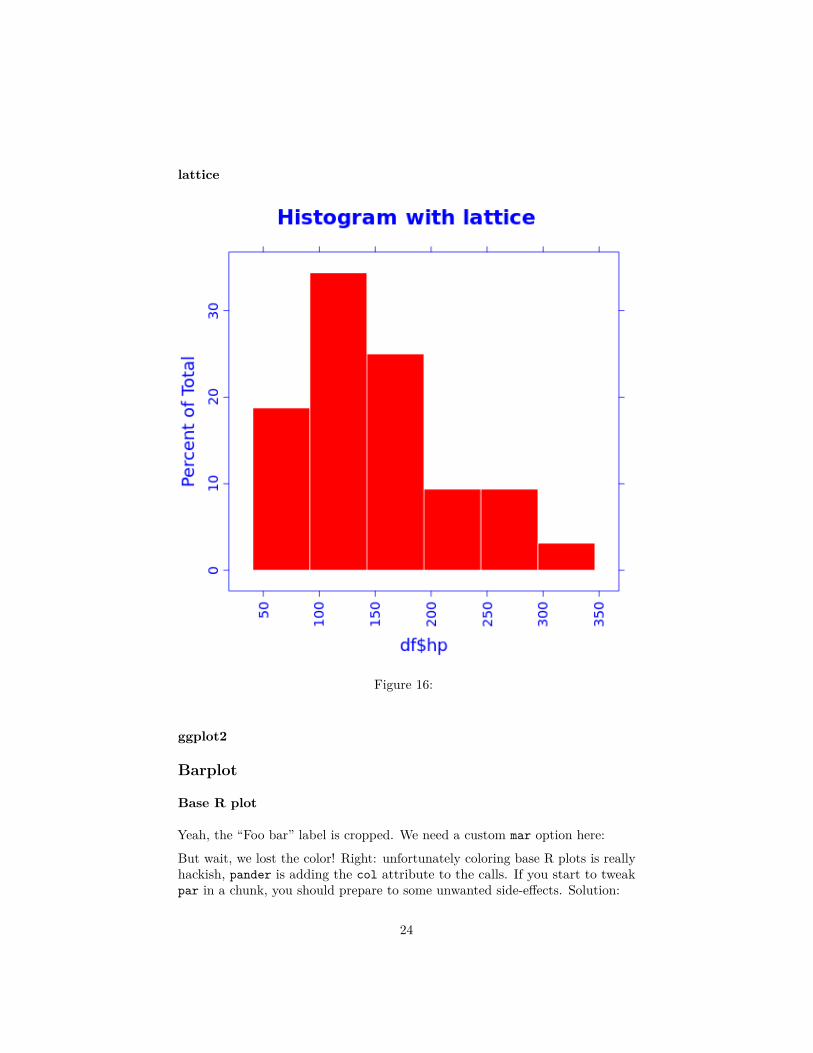
lattice
Figure 16:
ggplot2
Barplot
Base R plot
Yeah, the “Foo bar” label is cropped. We need a custom mar option here:But wait, we lost the color! Right: unfortunately coloring base R plots is reallyhackish, pander is adding the col attribute to the calls. If you start to tweakpar in a chunk, you should prepare to some unwanted side-effects. Solution:
24
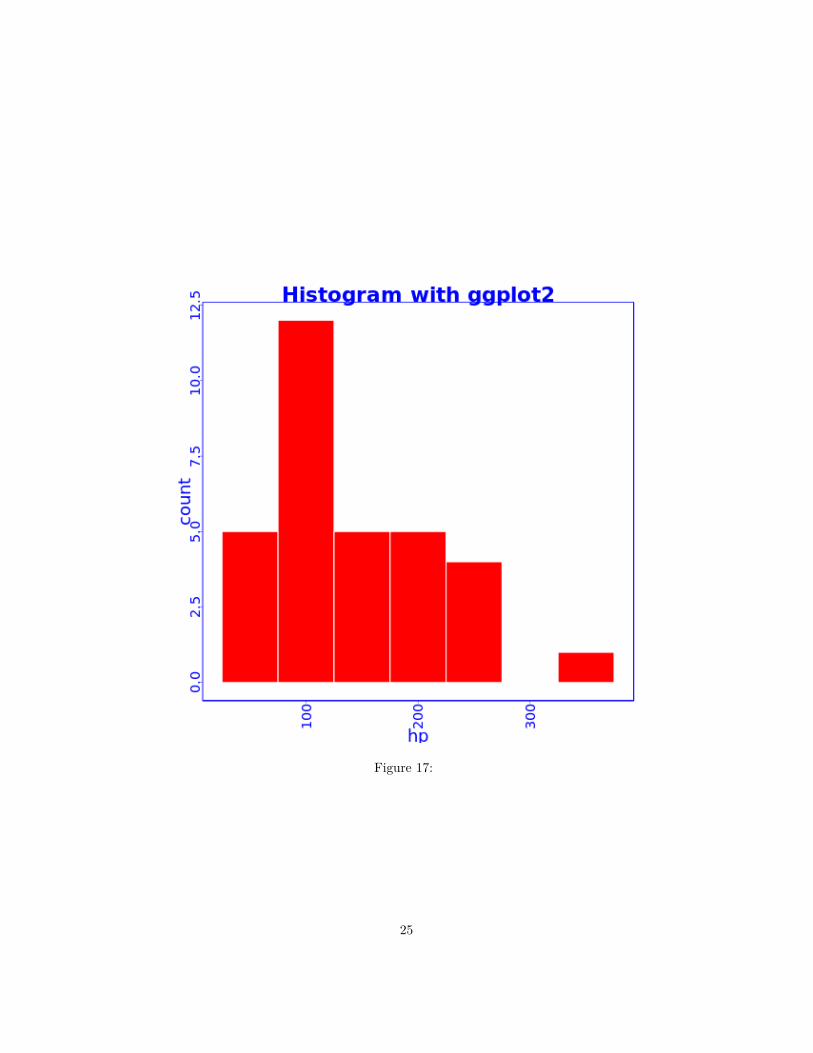
Figure 17:
25

Figure 18:
26

Figure 19:
27
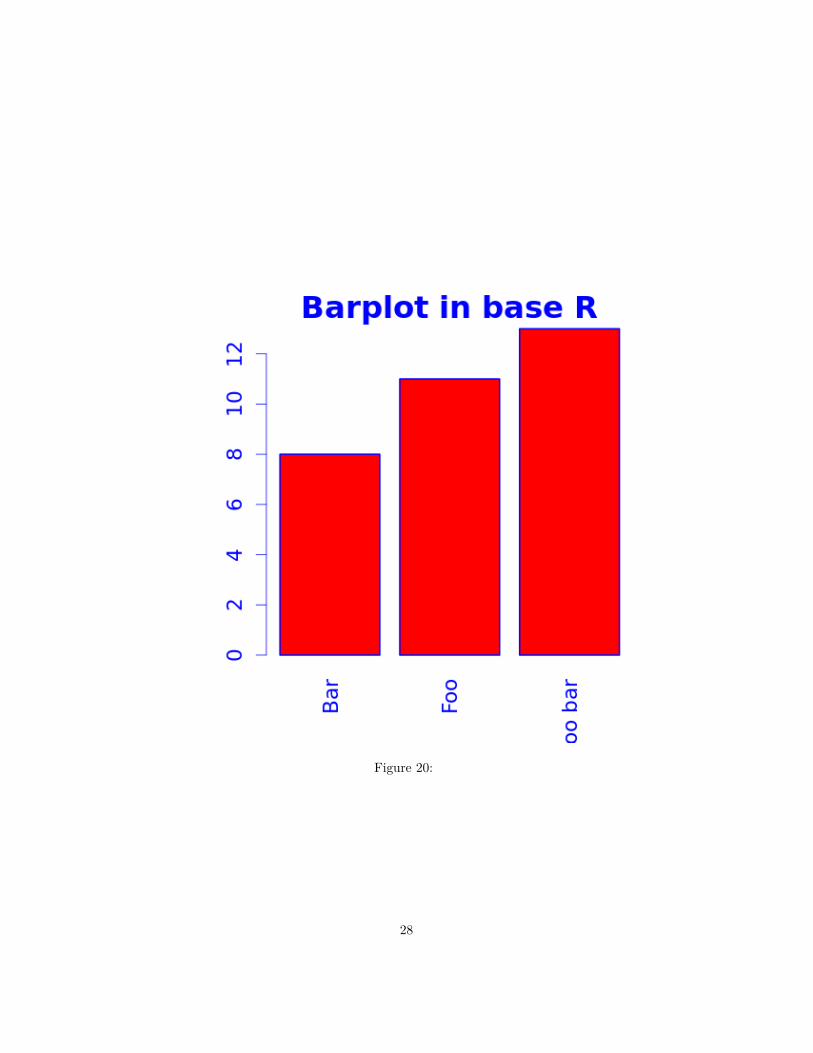
Figure 20:
28
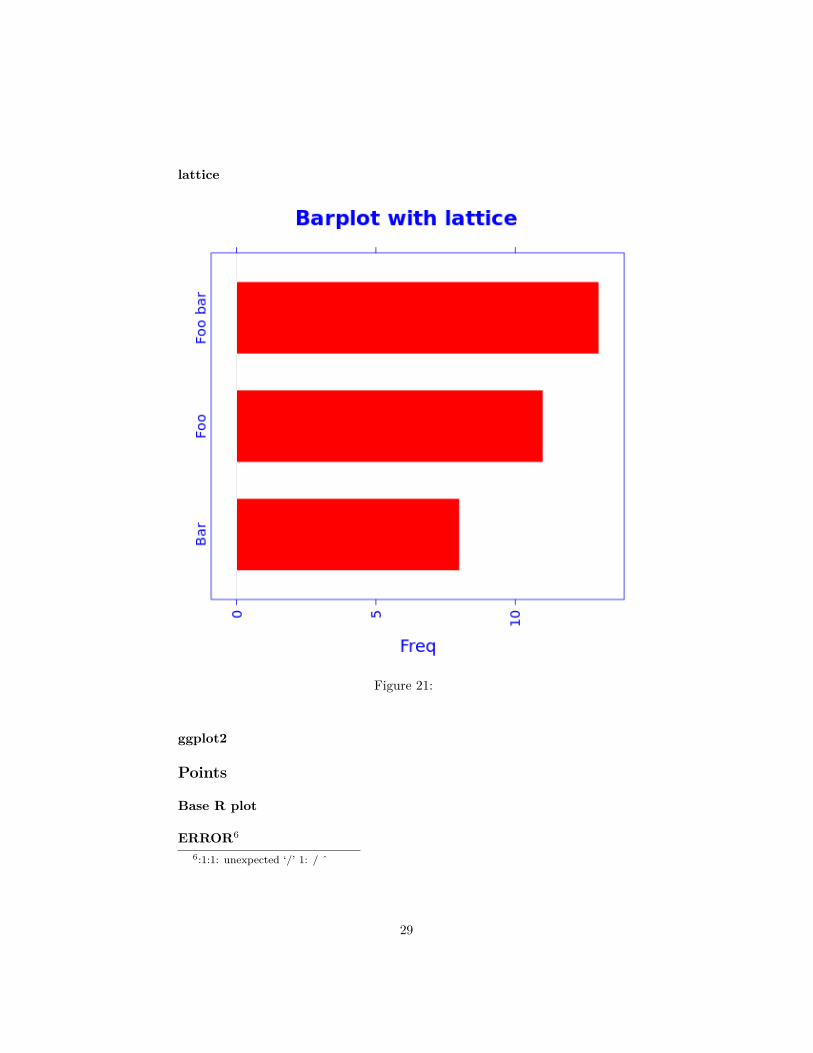
lattice
Figure 21:
ggplot2
Points
Base R plot
ERROR6
6:1:1: unexpected ‘/’ 1: / ˆ
29
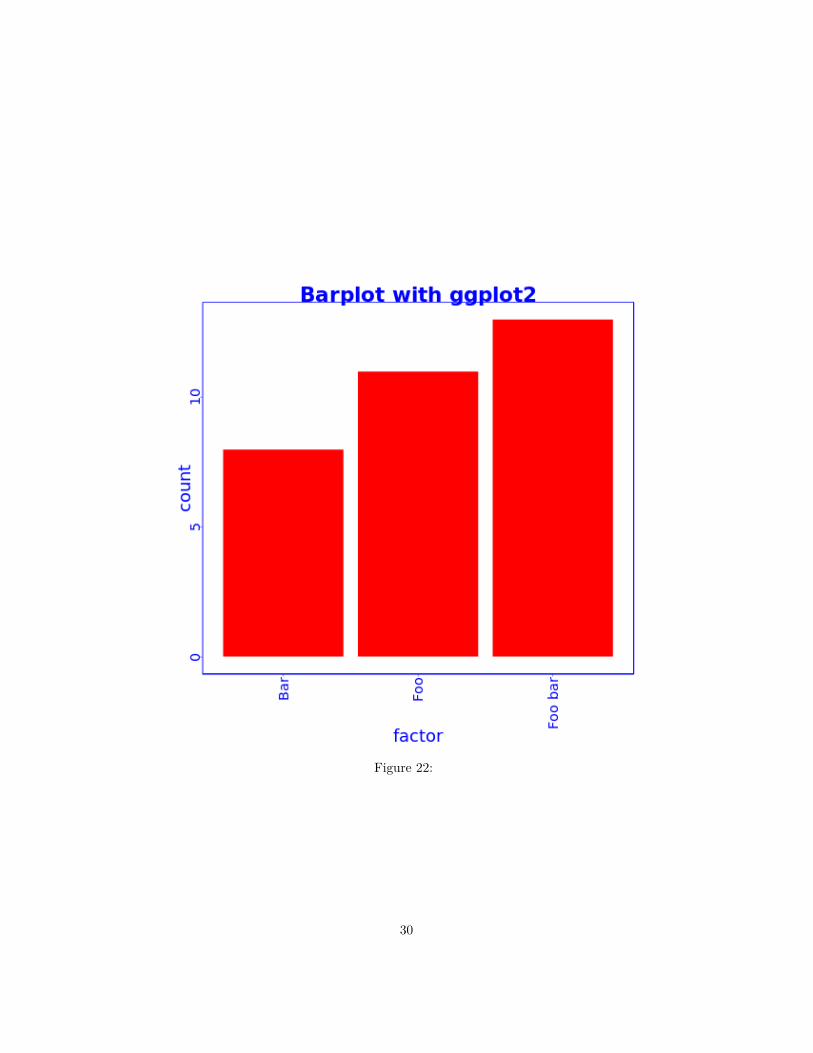
Figure 22:
30
lattice
Figure 23:
ggplot2
Grouped plot
Base R plot
I have no idea how to do that besides manually adding points.
31
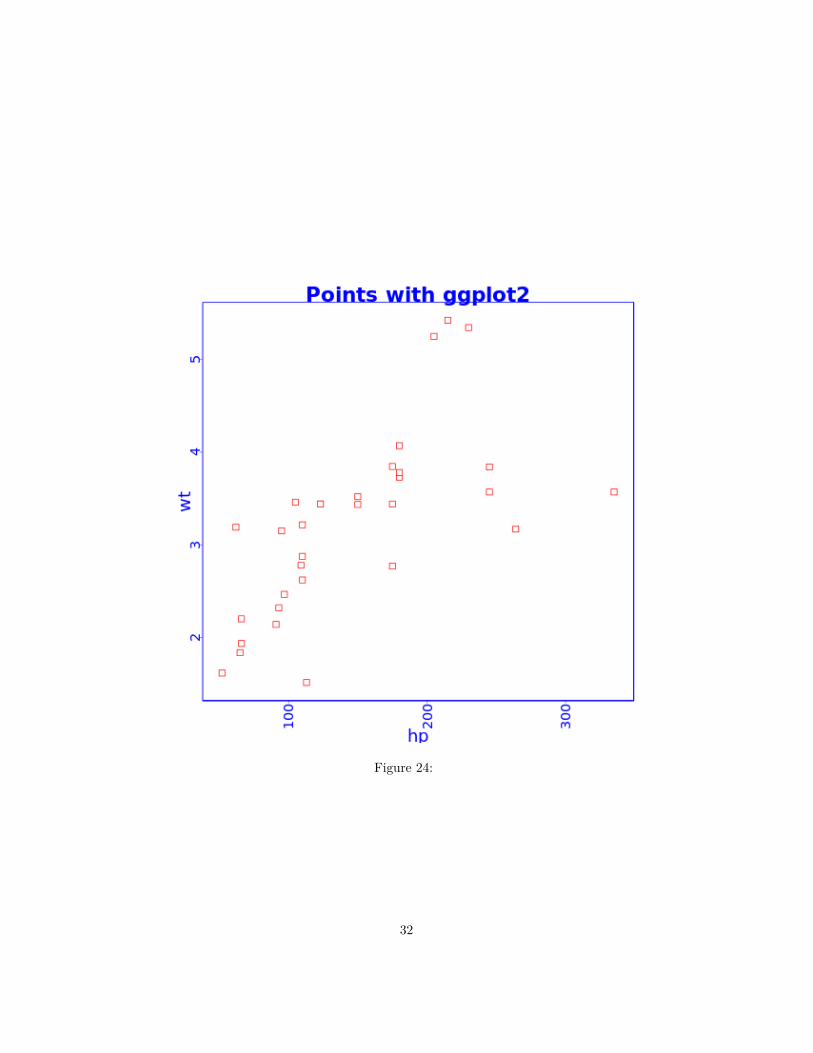
Figure 24:
32
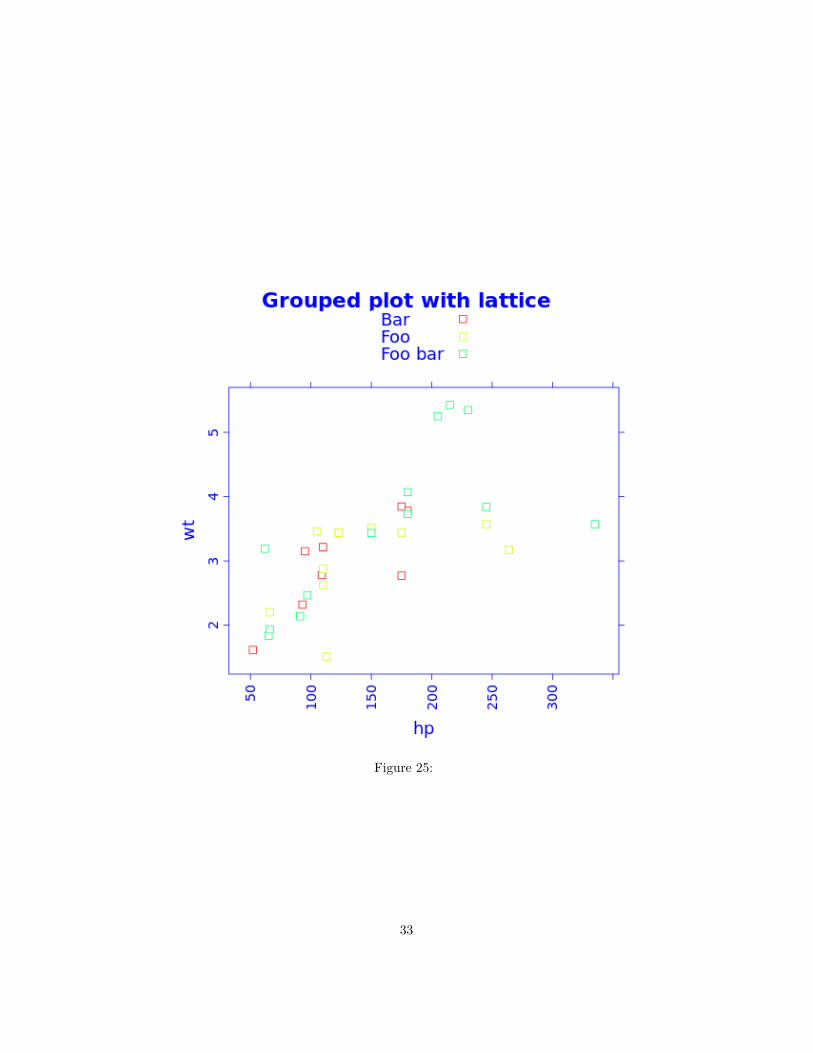
Figure 25:
33
lattice
ggplot2
Figure 26:
Facets
Base R plot
I have no idea how to do that besides par(mfrow=c(foo, bar)).
34
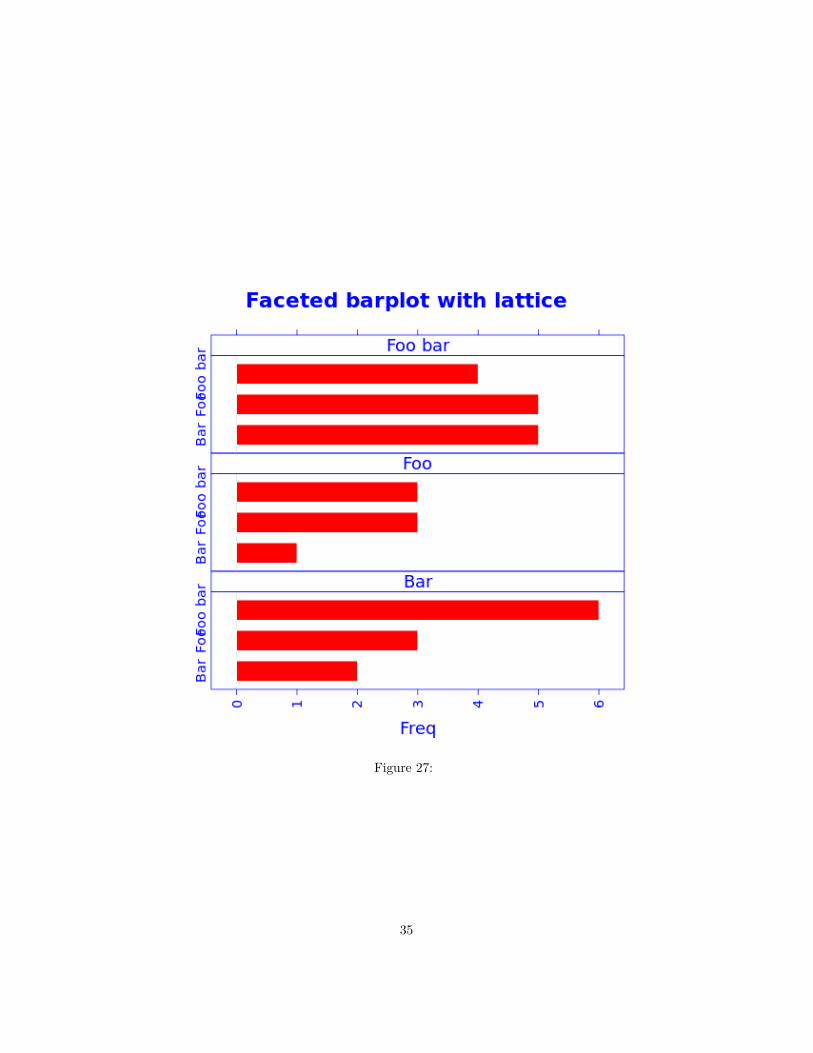
Figure 27:
35
lattice
ggplot2
Figure 28:
36
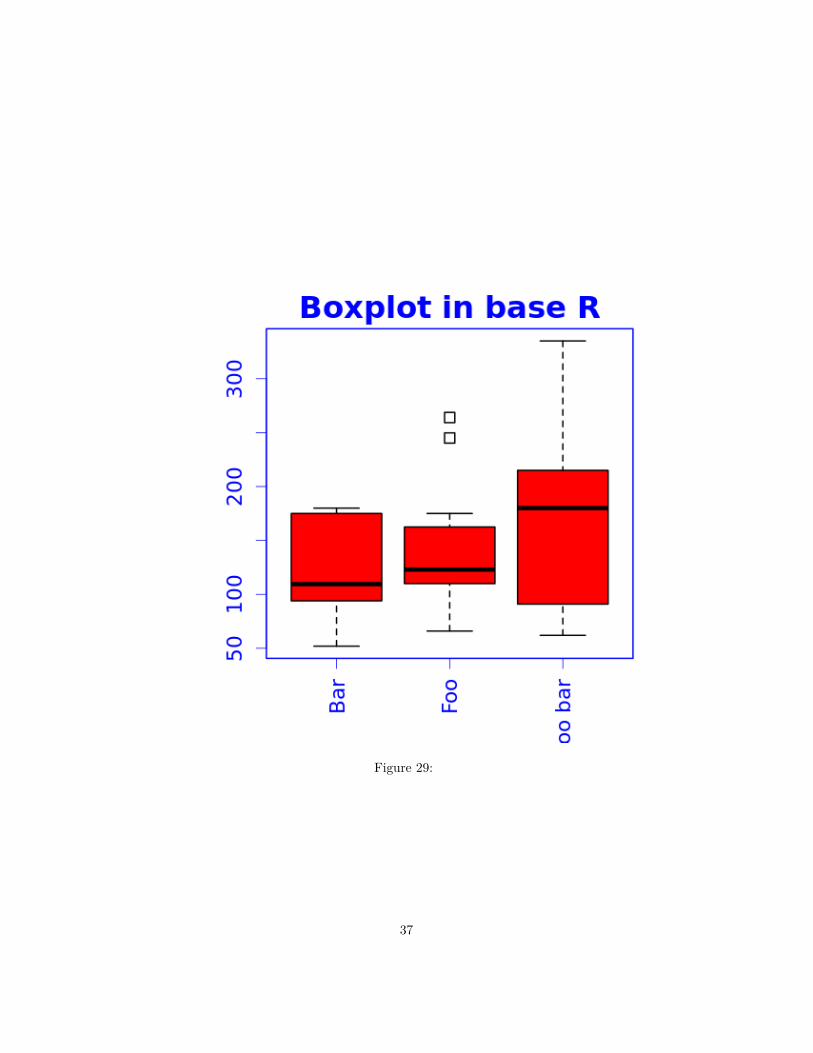
Figure 29:
37
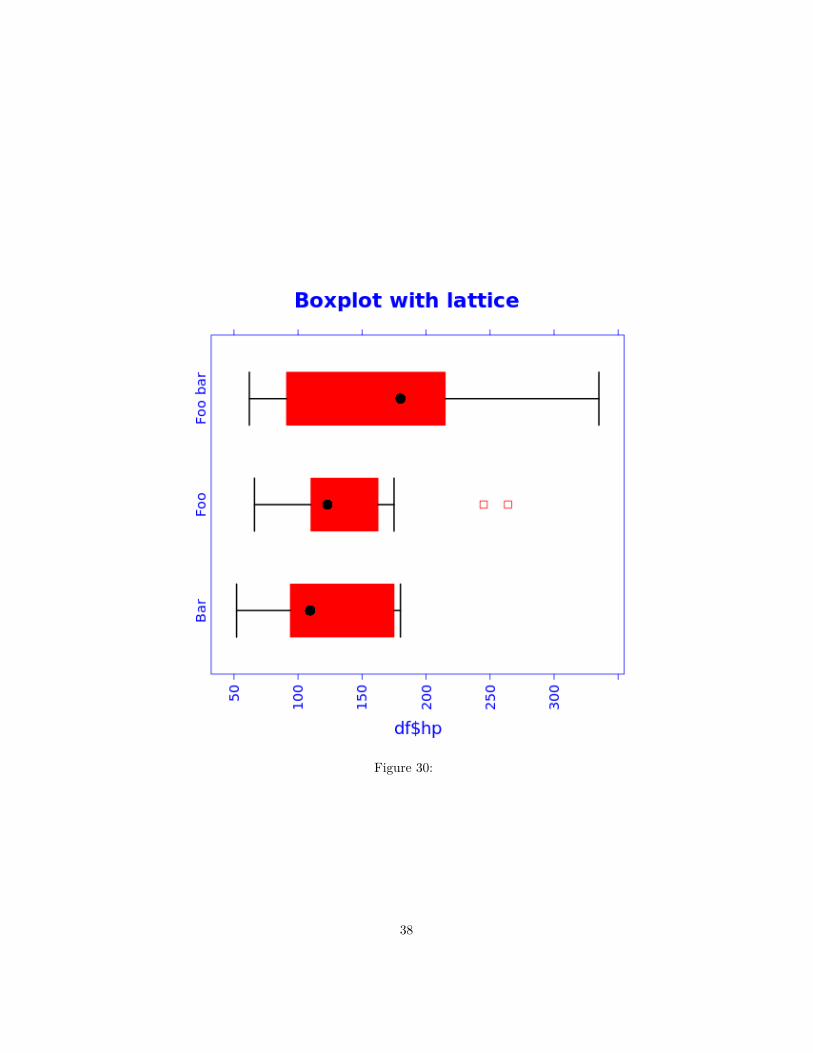
Figure 30:
38
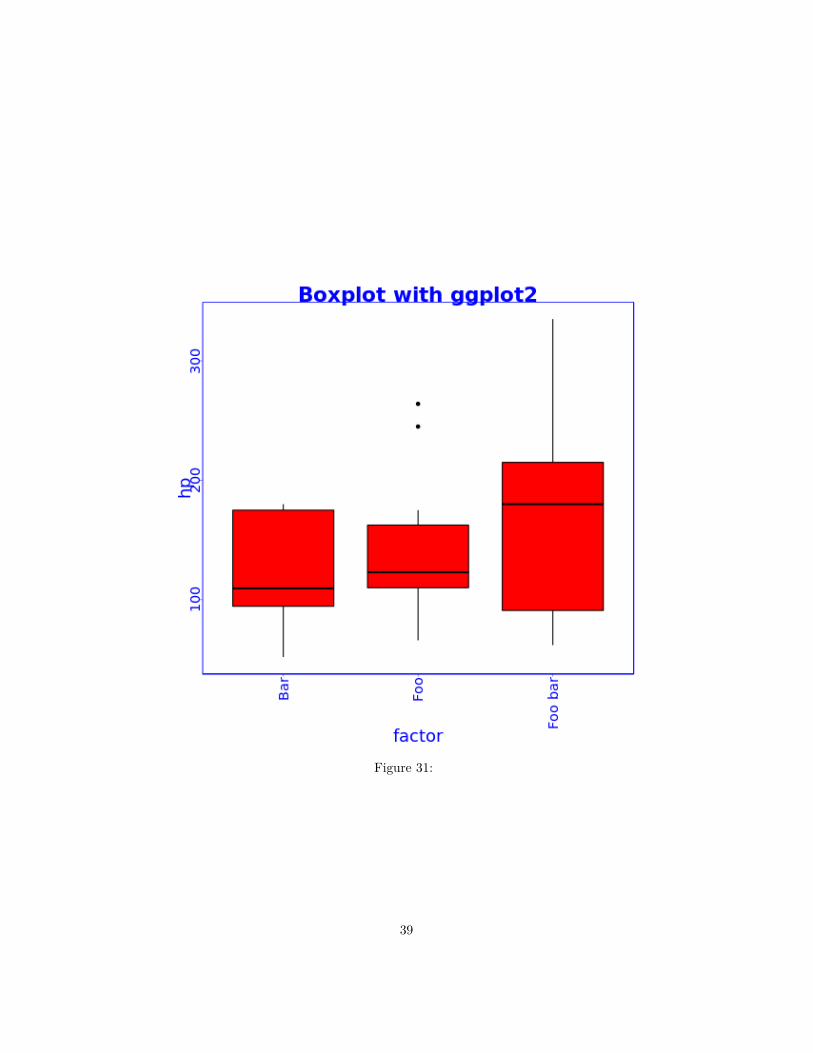
Figure 31:
39
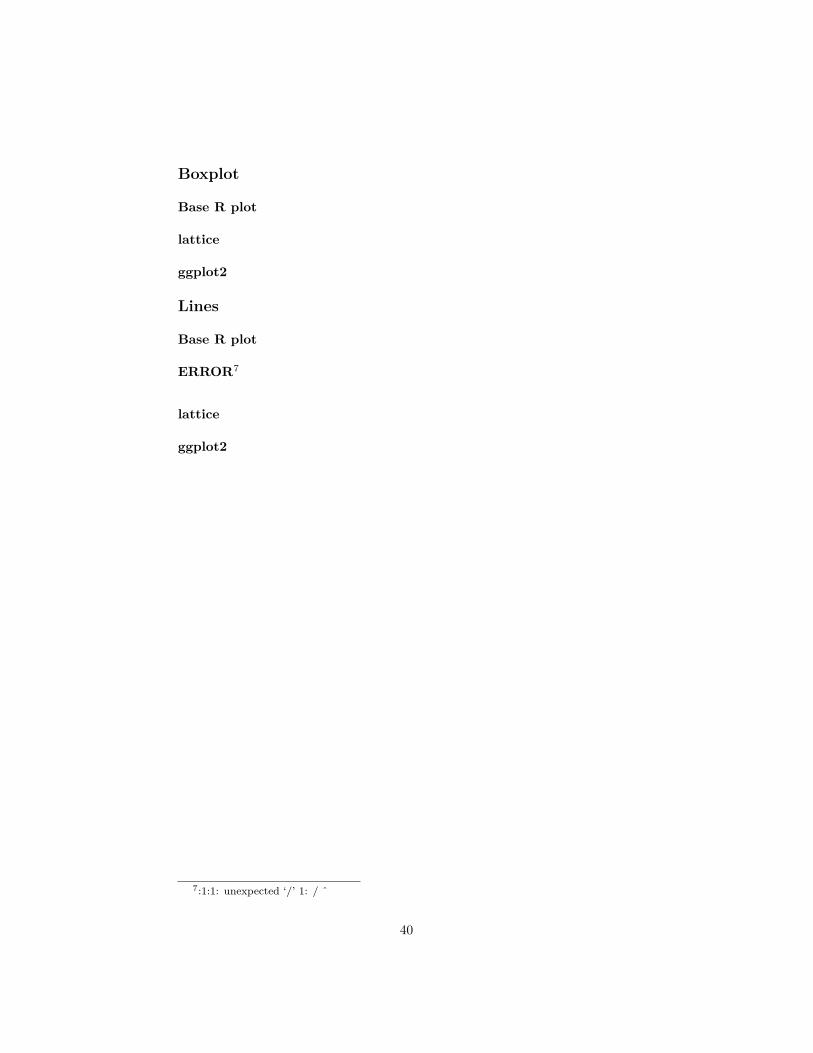
Boxplot
Base R plot
lattice
ggplot2
Lines
Base R plot
ERROR7
lattice
ggplot2
7:1:1: unexpected ‘/’ 1: / ˆ
40
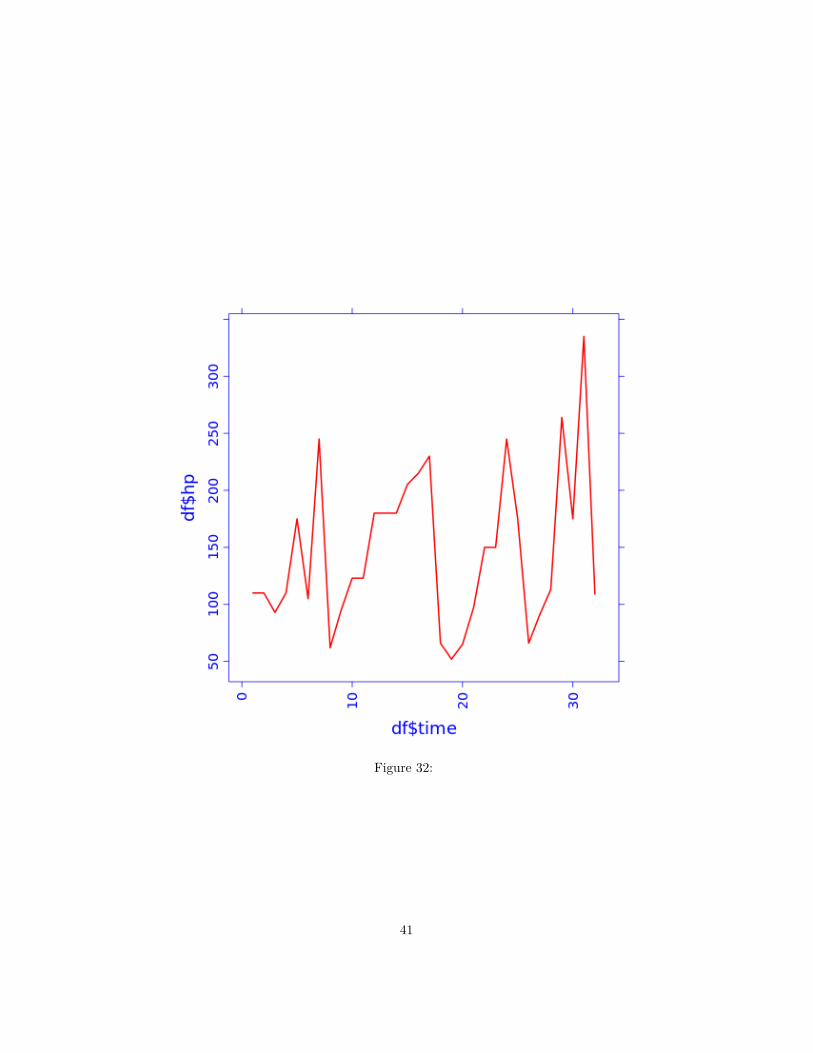
Figure 32:
41
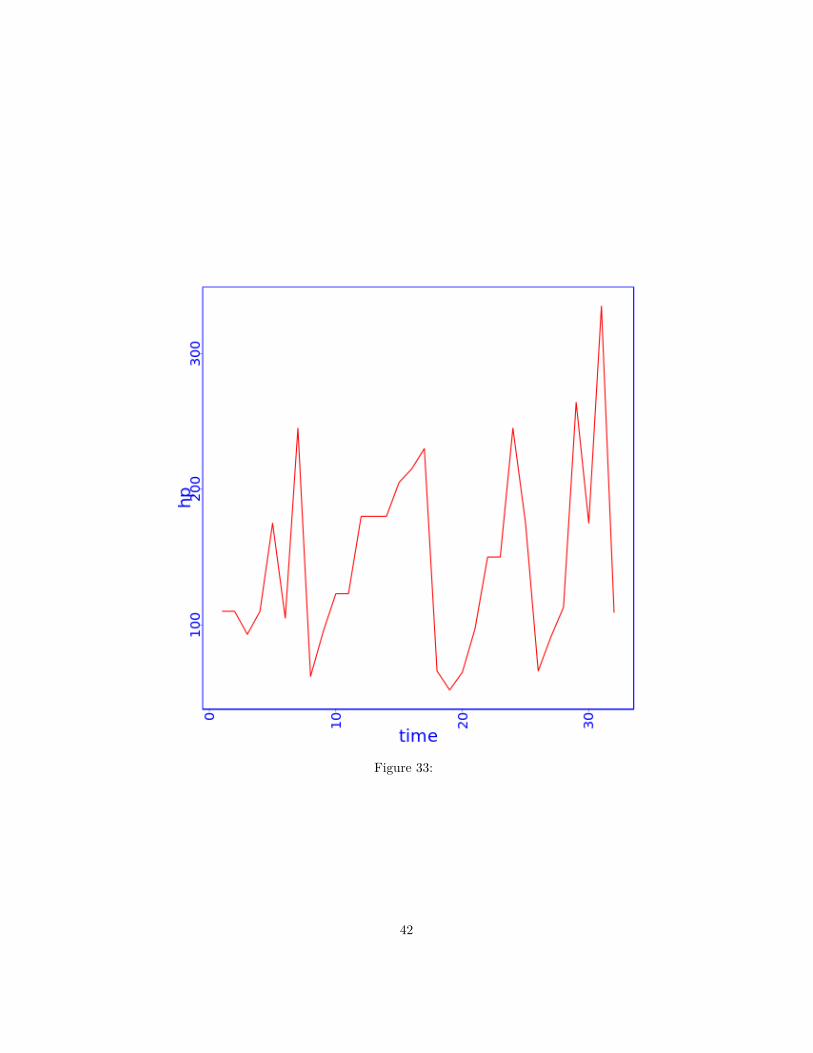
Figure 33:
42